multidimensional microtiming in samba music - inesc porto
TRANSCRIPT
1
Computação MusicalSimpósio Brasileiro de
12th Brazilian Symposium on Computer Music
Multidimensional microtiming in Samba music
Luiz Naveda1, Fabien Gouyon2, Carlos Guedes3, Marc Leman1
1Institute for Psychoacoustics and Electronic Music - Ghent University
Blandijnberg 2, Ghent, Belgium
2Instituto de Engenharia de Sistemas e Computadores do Porto
INESC Porto
3Escola Superior de Música e das Artes do Espectáculo
Instituto Politécnico do Porto
[email protected], [email protected], [email protected],
Abstract. The connection of “groove” with low-level features in the audio
signal has been mostly associated with temporal characteristics of fast
metrical structures. However, the production and perception of rhythm in
Afro-Brazilian contexts is often described as a result of multiple experience
flows, which expands the description of rhythmical events to multiple features
such as loudness, spectrum regions, metrical layers, movement and others. In
this study, we analyzed how the microtiming of samba music interacts with an
expanded set of musical descriptors. More specifically, we analyzed the
interaction between fast timing structures with meter, intensity and spectral
distribution within the auditory domain. The methodology for feature detection
was supported by a psychoacoustically based auditory model, which provided
the low-level descriptors for a database of 106 samba music excerpts. A
cluster analysis technique was used to provide an overview of emergent
microtiming models present in the features. The results confirm findings of
previous studies in the field but introduce new systematic devices that may
characterize microtiming in samba music. Systematic models of interactions
between microtiming, amplitude, metrical structure and spectral distribution
seem to be available in the structure of low-level auditory descriptors used in
the methodology.
1. Introduction
The connection of “groove” with low-level features of the audio signal has always been
associated with the detection of rhythmical events and more specifically with the
temporal characteristics of fast rhythmical structures. It has been suggested that the
sensation of groove may be induced by small idiomatic variations of these rhythms,
defined as a series of event shifts at a constant tempo (Bilmes 1993; Desain and Honing
1993; Gouyon 2007), or simply microtiming. In this study, we concentrate on the
microtiming aspect of samba music, and how timing interacts with meter, intensity and
spectral distribution.
Although the word “groove” may be closely related with music styles originating from
the African-American diaspora, the induction of the groove feeling is also a common
element in other musical contexts. Hennessy (2009) studied the groove in Cape Breton
2
Computação MusicalSimpósio Brasileiro de
12th Brazilian Symposium on Computer Music
fiddle music (Canada) from the perspective of rhythmical formulas. Johansson (2005)
studied microtiming and interactions with melodic patterns in Norwegian traditional
fiddle music. Friberg and Sundstrom (2002) verified that eight-notes patterns are
systematically performed in long-short patterns in jazz performances. The notion of
swing in jazz and its correlations with pitch and phrasing was also studied in detail by
Benadon (2003; 2006; 2009). Other studies tried to understand the notion of groove in
different styles. McGuiness (2006) analyzed microtiming in different styles of music.
Madison (2006) studied the consistence of the subjective grooving experience among
subjects using music styles such as jazz, samba, Indian, Greek and Western African
Music.
Recent studies have been concentrating on the characteristics of microtiming in Afro-
Brazilian musical contexts. Gouyon (2007) analyzed the patterns of deviations of 16th-
notes in samba-de-roda using a computational approach and a dataset of commercial
recordings. Lindsay and Nordquist (2007) measured the microtiming of recordings of
samba instruments using standard spectrograms. Part of the extensive study of Lucas
(2002) about the Congado Mineiro was dedicated to the analysis of microtiming, based
on field recordings in Minas Gerais. Gerischer (2006) connected several descriptions of
the context of samba in Bahia with a systematic analysis of microtiming based on field
recordings. Curiously, all of these studies describe systematic anticipations of the 3rd an
4th 16th-notes, which may configure a strong aspect of the Afro-Brazilian music styles.
1.1. Multidimensionality in Afro-Brazilian contexts
Gerischer claims that the rhythmical experience in samba should be understood as a
multidimensional process based on oral traditions (Gerischer 2006, p.115) and aligned
with the characteristics of African and Afro-Brazilian roots. Indeed, the culture of
samba shares and incorporates the “coordination of multiple experience flows” (Stone
1985) of Afro-Brazilian rituals, which are claimed to be at the root of Afro-Brazilian
music (Sodré 1979; Carvalho 2000; Fryer 2000; Sandroni 2001). A typical description
of Candomblé ceremony demonstrates how these dimensionalities interact with each
other in a certain context, and how the context is influenced by the musical experience:
“The dancers dance with great violence, energy, and concentration.
Getting really involved in the rhythm and movement…The drummers…
can play certain signals in the rhythmic pattern to cause the dancing to
take a violent turn … One method is for one drum to syncopate the rhythm
slightly (another one maintaining it) such that a strong beat falls just
before the main beat…. This gives a impression of increased speed when
this is not really the case, and creates tension and feeling of imbalance in
the listener or dancer” (Walker 1973; quoted by Fryer 2000)
In this ritualistic interaction between dance and music, music seems to be induced or
induces a connection between timing and accents, a system of metrical levels,
polymetric lines, instrumental textures, and a systematic mechanism of tension that
provokes movement and cohesion. The musical elements in the samba culture seem to
have inherited this structure of rituals and same multidimensionality. This aspect may
be essential to describe rhythmic experience in Afro-Brazilian contexts or other cultural
contexts influenced by African diaspora.
3
Computação MusicalSimpósio Brasileiro de
12th Brazilian Symposium on Computer Music
In this paper, we tried to investigate part of this multidimensional description of
rhythmic experience using a systematic method based on computational approaches. We
developed a methodology that describes interactions between timing, metrical levels,
intensity and spectral distributions from musical audio. The methods include a
psychoacoustically inspired feature detection (section 2.2.1) and a heuristic for
microtiming detection (Section 2.2.2). The set of multidimensional descriptors of
microtiming are extracted from a database of 106 music excerpts, and are then clustered
using machine learning methods (section 2.2.3). By using these procedures, we aim at
providing an overview of multidimensional interaction between microtiming and other
mentioned features, which may help to uncover the elements of groove induction and
thus improve the study of music forms within the Afro-Brazilian context.
2. Methodology
2.1. Data set
The dataset analyzed in this study consists of 106 excerpts of music collected from
commercial CD’s (median of durations = 33 seconds). The range of genres covered by
this sample includes music styles influenced by Rio de Janeiro’s samba, such as samba
carioca, samba-enredo, partido-alto and samba-de-roda (Bahia). The excerpts were
stored in mono audio files with a sample rate of 44.100 Hz / 16 bits and normalized by
amplitude. Beat markers and the metrical positions of the first annotated beat (1st or 2nd
beat, 2/4) were manually annotated by 3 specialists using the software Sonic Visualizer
(see Cannam, Landone et al. 2006).
2.2. Analysis
Our analysis was developed in 3 stages: (2.2.1) definition of low level features and
spectral regions, (2.2.2) segmentation of metrical structures and extraction of event
features, and (2.2.3) clustering of multidimensional information.
2.2.1 Definition of low level features and spectral regions
2.2.1.1. Auditory model
In order to provide an robust low-level feature for the representation of musical tessitura
we used an implementation of the auditory model described in Van Immerseel and
Martens (1992), implemented as a .dlib library for Mac OSX. This auditory model
simulates the outer and middle ear filtering and the auditory decomposition in the
periphery of the auditory system. This results in loudness patterns distributed over the
audible spectrum (for more details see Van Immerseel and Martens 1992, p. 3514). The
configuration used in this study provides 44 channels of loudness curves with sample
frequency at 200 Hz, distributed over 22 critical bands (center frequencies from 70 Hz
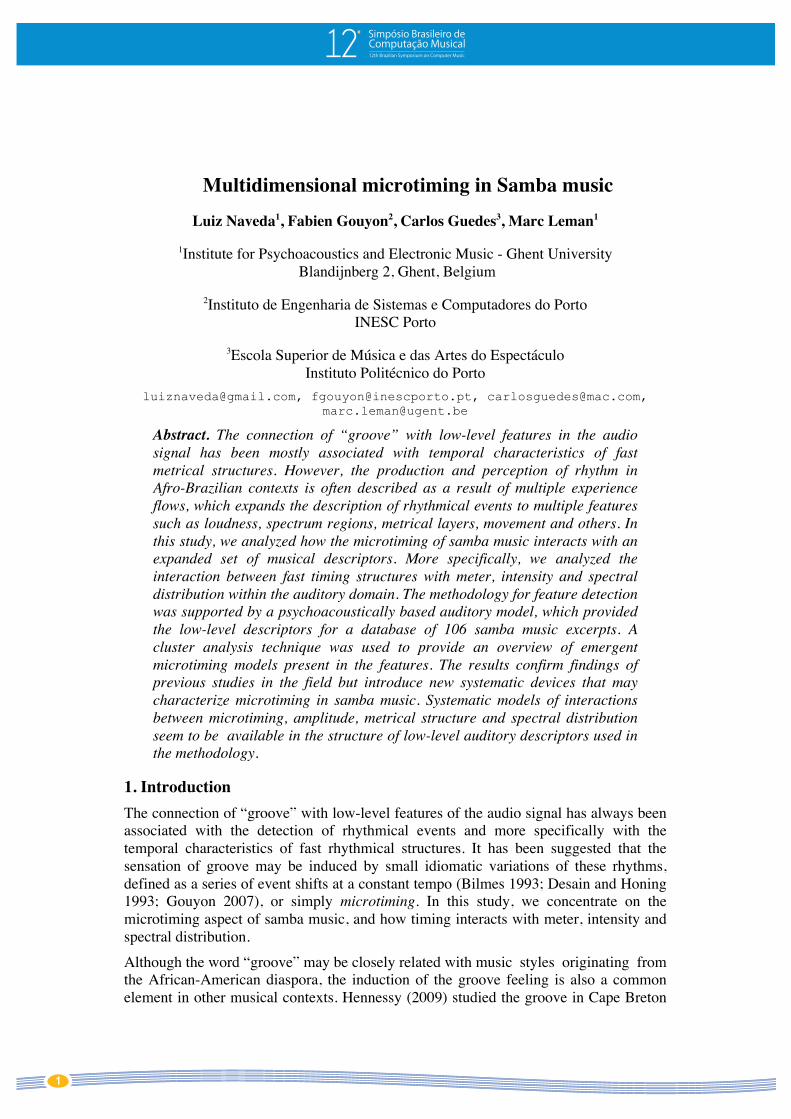
to 10.843 Hz). Figure 1 displays an auditory image (or loudness curves) generated from
the auditory model of the excerpt 22.
4
Computação MusicalSimpósio Brasileiro de
12th Brazilian Symposium on Computer Music
Figure 1. Loudness curves generated from the auditory model. The 44
envelope curves (0:1 x 44 channels) represent a simulation of loudness in each
auditory channel.
2.2.1.2. Segmentation of spectral distributions
The current knowledge about samba forms accounts for relatively stable configurations
of musical instruments (and their musical functions) across the musical tessitura and the
musical function of each instrument is often related with its timbre. Timbre can be
roughly represented by low-level descriptors in the frequency domain or, in our case, by
loudness amplitudes in time distributed in auditory channels. The spectrum of the low
bass samba percussion, Surdo, is mostly concentrated in the lower part of the audible
spectrum. Tamborims, repiniques, vocal parts and other instruments occupy the mid
frequency region of the auditory spectrum. Ganzás and different kinds of shakers will
tend to occupy the higher spectrum regions. Although the frequency components of
these instruments will overlap each other in the time and frequency domain (particularly
during transients at attacks points), the spectrum signature of each timbre is relatively
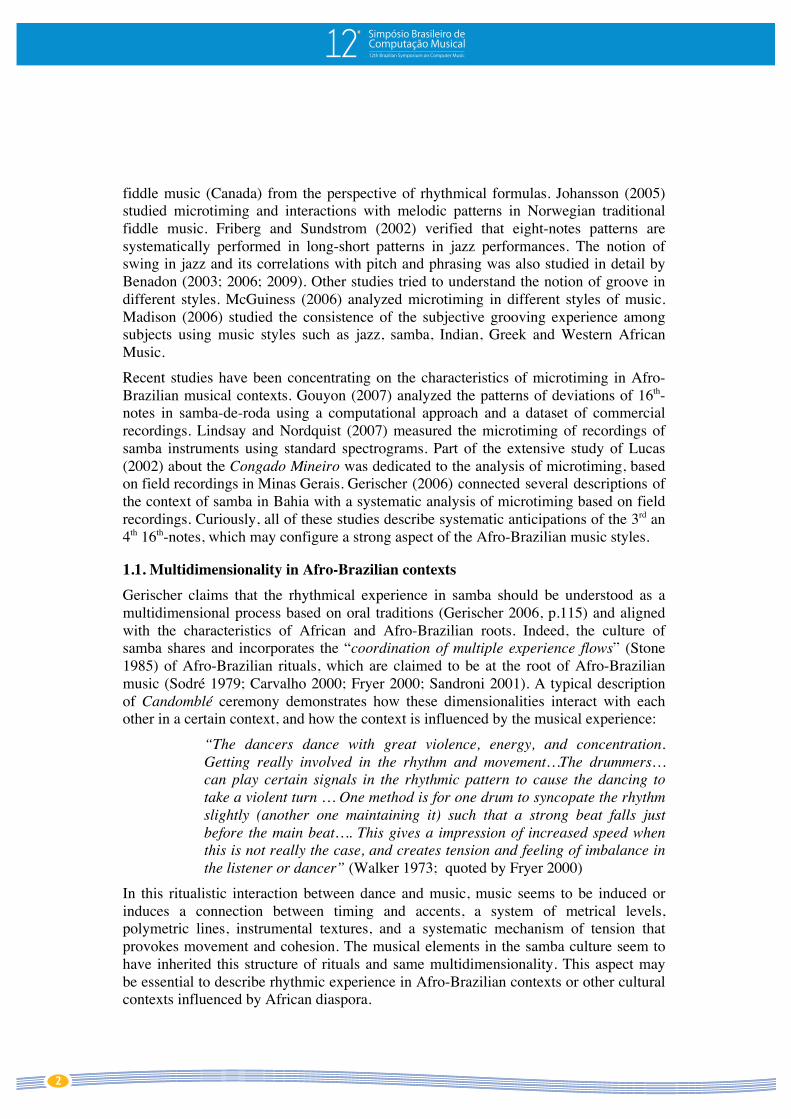
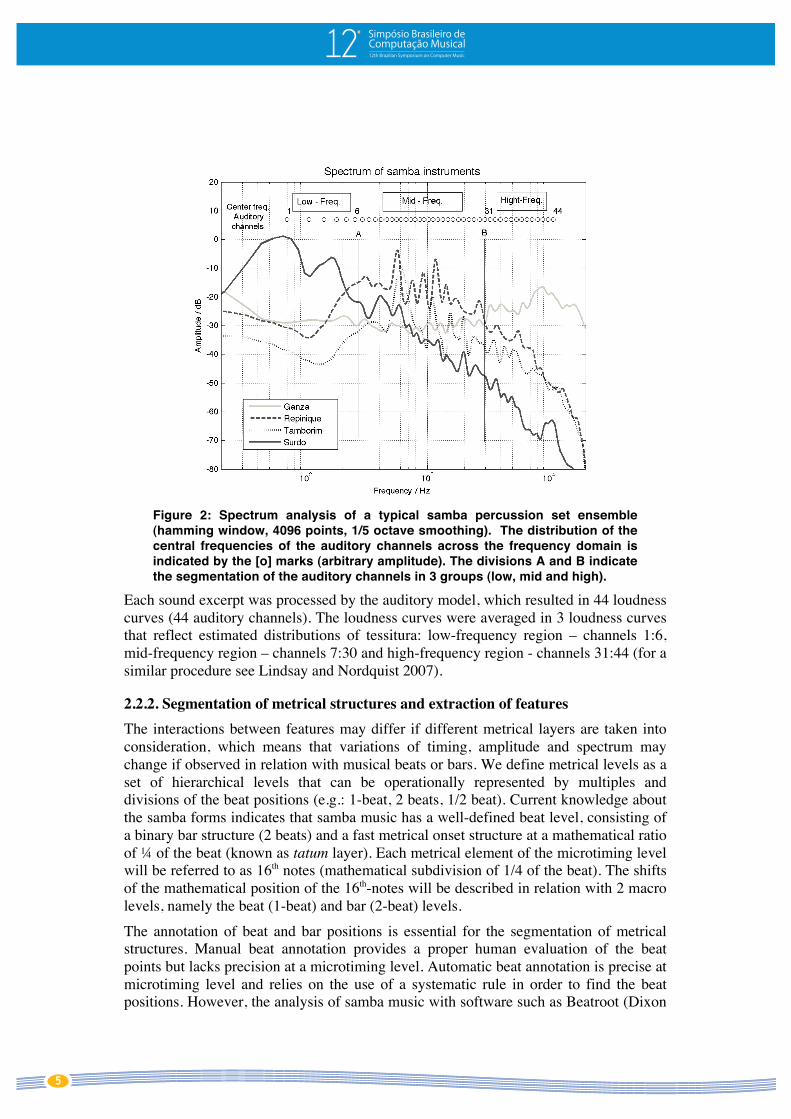
discriminated from each other. Figure 2 displays the analysis of the spectrum of four
kinds of samba instruments and the distribution of central frequencies of the auditory
model within the audible spectrum.
5
Computação MusicalSimpósio Brasileiro de
12th Brazilian Symposium on Computer Music
Figure 2: Spectrum analysis of a typical samba percussion set ensemble
(hamming window, 4096 points, 1/5 octave smoothing). The distribution of the
central frequencies of the auditory channels across the frequency domain is
indicated by the [o] marks (arbitrary amplitude). The divisions A and B indicate
the segmentation of the auditory channels in 3 groups (low, mid and high).
Each sound excerpt was processed by the auditory model, which resulted in 44 loudness
curves (44 auditory channels). The loudness curves were averaged in 3 loudness curves
that reflect estimated distributions of tessitura: low-frequency region – channels 1:6,
mid-frequency region – channels 7:30 and high-frequency region - channels 31:44 (for a
similar procedure see Lindsay and Nordquist 2007).
2.2.2. Segmentation of metrical structures and extraction of features
The interactions between features may differ if different metrical layers are taken into
consideration, which means that variations of timing, amplitude and spectrum may
change if observed in relation with musical beats or bars. We define metrical levels as a
set of hierarchical levels that can be operationally represented by multiples and
divisions of the beat positions (e.g.: 1-beat, 2 beats, 1/2 beat). Current knowledge about
the samba forms indicates that samba music has a well-defined beat level, consisting of
a binary bar structure (2 beats) and a fast metrical onset structure at a mathematical ratio
of ! of the beat (known as tatum layer). Each metrical element of the microtiming level
will be referred to as 16th notes (mathematical subdivision of 1/4 of the beat). The shifts
of the mathematical position of the 16th-notes will be described in relation with 2 macro
levels, namely the beat (1-beat) and bar (2-beat) levels.
The annotation of beat and bar positions is essential for the segmentation of metrical
structures. Manual beat annotation provides a proper human evaluation of the beat
points but lacks precision at a microtiming level. Automatic beat annotation is precise at
microtiming level and relies on the use of a systematic rule in order to find the beat
positions. However, the analysis of samba music with software such as Beatroot (Dixon

6
Computação MusicalSimpósio Brasileiro de
12th Brazilian Symposium on Computer Music
2007) and Sonic Visualizer (Cannam, Landone et al. 2006) resulted in poor beat
tracking results, probably influenced by the characteristic rhythmic complexity of the
samba music. Therefore, we opted to combine manual and automatic approaches in a
heuristics that looks for relevant peak events in the proximity of manual annotation. The
applied method is described below and in the Figure 3.
Limits of the searching window
Threshold
Grid:
Initial Beat annotation
Final Beat annotation
Time
Am
plitu
de
1/4 2/4 3/4Phase 1)Phase 2) Math. subdivisions
Phase 3)
Phase 4)
Phase 5)
Phase 6)
...
...
Segmentation of metrical structures and microtiming
p1
p1
p3
Beat length
Mean
p4
pN
Manual anotation
Figure 3: Description of the heuristic used for segmentation. See text below for
the explanation of each step.
Description of the algorithm:
For each excerpt, for each spectral region, for each metrical level,
Phase 1. Retrieve beat points and time interval of the actual metrical segment from the manually
annotated beats (e.g.: inter beat interval, inter-bar interval).
Phase 2. Project the mathematical divisions of the microtiming points, here defined as ! of the beat
length (e.g. inter-beat interval/4)
Phase 3. Look for the peaks in the proximity of/ within the range of manual annotation (length of the
window = microtiming period)
Phase 4. Select a higher peak situated above a determined threshold (if there are no peaks above
threshold, retrieve NaN).
Phase 5. Extract the mean peak position of the first peaks of the 3 spectral regions. Therefore, all
positions (including positions in different spectral regions) have the same beat reference.
Phase 6. Retrieve position and amplitude of the highest peak in close proximity of the mathematical
subdivisions.
Phase 7. Retrieve features: (A) the normalized length in relation with the length of metrical layer, (B)
peak amplitudes, metrical levels (C) and spectral regions (D)
7
Computação MusicalSimpósio Brasileiro de
12th Brazilian Symposium on Computer Music
The result of this process is a multidimensional feature description of microtiming,
represented by four kinds of indicators: (A) the position of the peak in relation with the
metrical layer, (B) the intensity of the peaks, (C) the region in the spectra and (D) the
metrical level.
The definition of the length of the metrical level is crucial for the projection of
microtiming ratios. However, the definition of precise beat length information is not
trivial. Apart from the problems with automatic and manual beat annotation, first peak
positions are often different for each region of the spectra. In order to provide a
referential point, the beat position is considered as the mean between the first peak
positions of the three spectral regions (Phase 5).
2.2.3 Clustering of multidimensional information
The information resulting from the feature detection is composed of (1) the ratios
between all peak positions and the metrical level length, (2) amplitude of the peak
(loudness curves), (3) metrical level and (4) spectral region (low, mid, high). In order to
find trends and interactions between these feature components, we carried out a k-means
clustering based on an improved extension of the basic k-means algorithm (Pelleg and
Moore 2000). We configured the algorithm to retrieve a minimum of 3 and a maximum
of 5 clusters and it was implemented in Weka platform (Witten and Frank).
3. Results
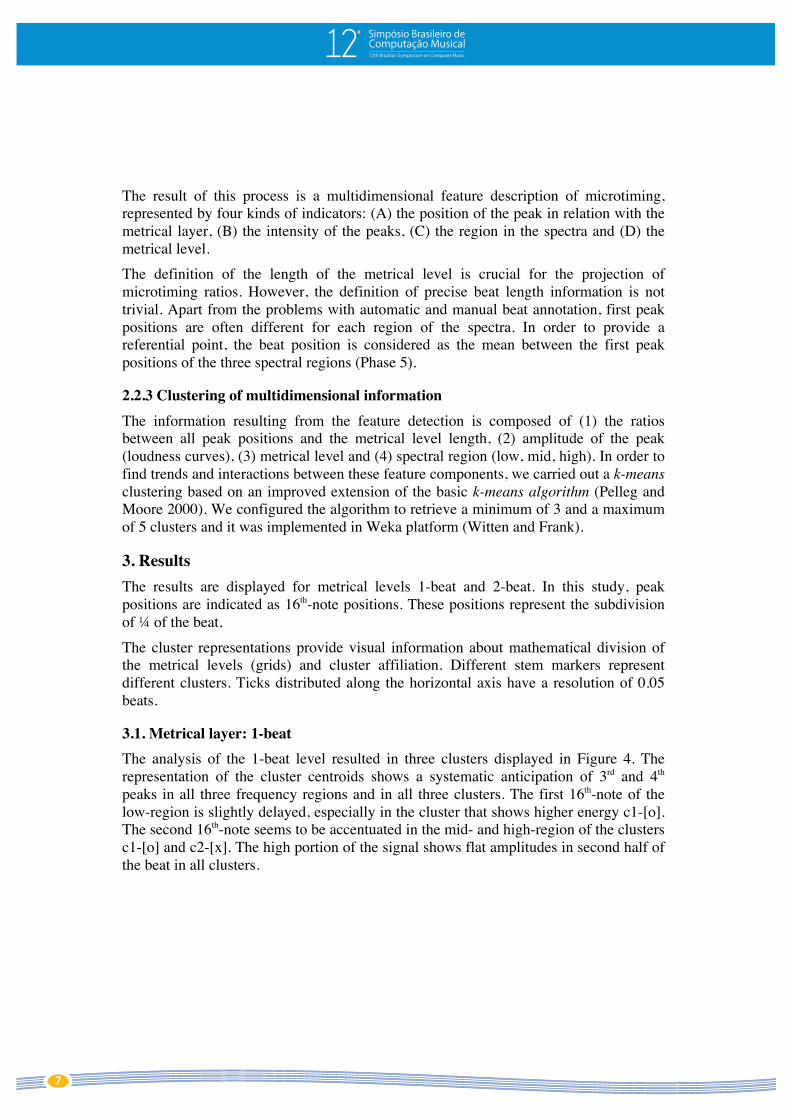
The results are displayed for metrical levels 1-beat and 2-beat. In this study, peak
positions are indicated as 16th-note positions. These positions represent the subdivision
of ! of the beat.
The cluster representations provide visual information about mathematical division of
the metrical levels (grids) and cluster affiliation. Different stem markers represent
different clusters. Ticks distributed along the horizontal axis have a resolution of 0.05
beats.
3.1. Metrical layer: 1-beat
The analysis of the 1-beat level resulted in three clusters displayed in Figure 4. The
representation of the cluster centroids shows a systematic anticipation of 3rd and 4th
peaks in all three frequency regions and in all three clusters. The first 16th-note of the
low-region is slightly delayed, especially in the cluster that shows higher energy c1-[o].
The second 16th-note seems to be accentuated in the mid- and high-region of the clusters
c1-[o] and c2-[x]. The high portion of the signal shows flat amplitudes in second half of
the beat in all clusters.
8
Computação MusicalSimpósio Brasileiro de
12th Brazilian Symposium on Computer Music
!!"#$%&'()*&+#,-%./'(0!123'4'567''(6!183'4'597''(5!1:3'4'5;7''
<-"#'=>#$+',$+-2?
@-.A!B,#C
B,#C46DEFG/0;D9G5'H@I
; ;D6J ;DJ ;DFJ 0;
;D0
;D6
<-"#'=>#$+',$+-2?
K-L!B,#C
B,#C4;D6J6/6DEFG'H@I
; ;D6J ;DJ ;DFJ 0;
;D0
;D6
<-"#'=>#$+',$+-2?
M2N!B,#C
B,#C4;D;F/;D60J'H@I
; ;D6J ;DJ ;DFJ 0;
;D0
;D6
Figure 4: Representation of centroids for 3 clusters and 5064 instances (beats).
Ranges of tick periods (0.05 beats) for each cluster: c1= 22:45 ms, c2= 20:52
ms, c3= 22:52 ms.
The database comprises a wide range of tempi, which implies that temporal information
represented in beat ratios denotes different temporal ranges in seconds. As for the 3rd
and 4th peaks, variations in Figure 4 seem to be greater than 0.025 beats but smaller than
0.05 beats, which indicates a range of anticipations between 10 and 52 ms. In the case
of the 1st 16th-note (low-region), the delay seem to correspond to a period smaller than
0.025 beats, or 21 ms (at the slower tempi).
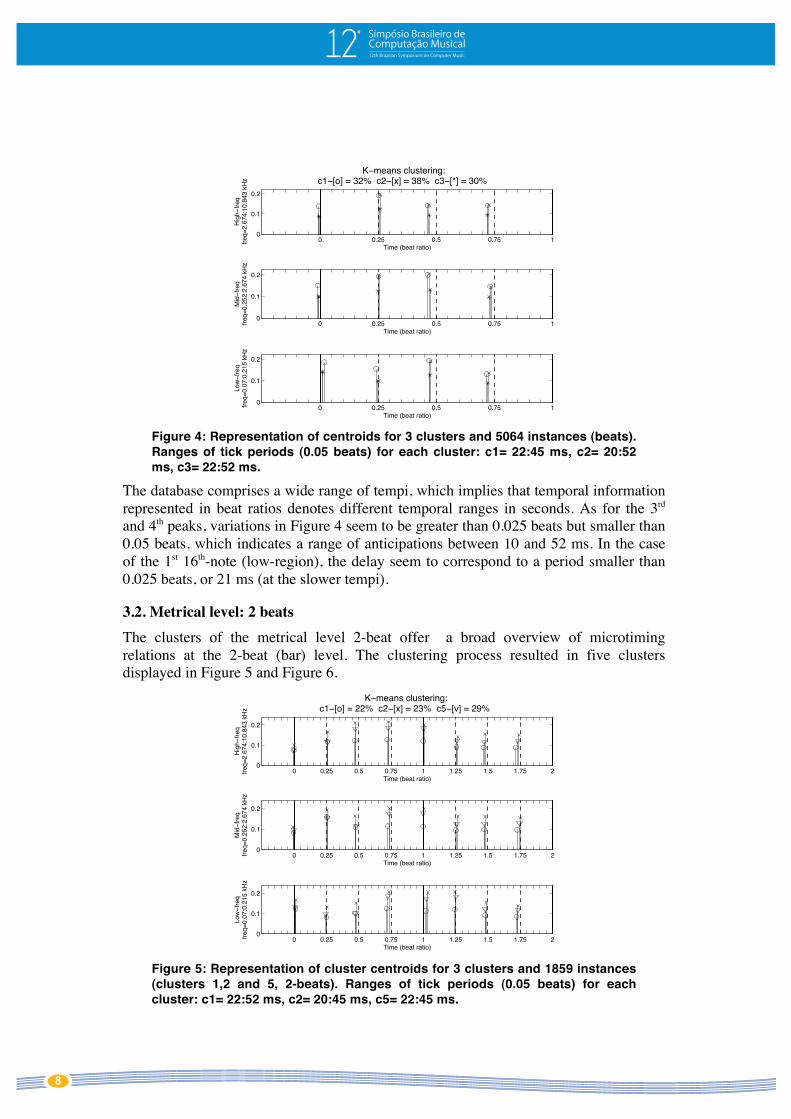
3.2. Metrical level: 2 beats
The clusters of the metrical level 2-beat offer a broad overview of microtiming
relations at the 2-beat (bar) level. The clustering process resulted in five clusters
displayed in Figure 5 and Figure 6.
!!"#$%&'()*&+#,-%./'(0!123'4'556''(5!173'4'586''(9!1:3'4'5;6''
<-"#'=>#$+',$+-2?
@-.A!B,#C
B,#C45DEFG/0HDIG8'J@K
H HD59 HD9 HDF9 0 0D59 0D9 0DF9 5H
HD0
HD5
<-"#'=>#$+',$+-2?
L-M!B,#C
B,#C4HD595/5DEFG'J@K
H HD59 HD9 HDF9 0 0D59 0D9 0DF9 5H
HD0
HD5
<-"#'=>#$+',$+-2?
N2O!B,#C
B,#C4HDHF/HD509'J@K
H HD59 HD9 HDF9 0 0D59 0D9 0DF9 5H
HD0
HD5
Figure 5: Representation of cluster centroids for 3 clusters and 1859 instances
(clusters 1,2 and 5, 2-beats). Ranges of tick periods (0.05 beats) for each
cluster: c1= 22:52 ms, c2= 20:45 ms, c5= 22:45 ms.
9
Computação MusicalSimpósio Brasileiro de
12th Brazilian Symposium on Computer Music
Figure 5 shows clusters 1, 2 and 5. The results show the same systematic anticipations
of 3rd and 4th 16th-notes and a delay of the 1st 16th-note in the low-frequency region.
These microtiming deviations seem to affect the two beats at the bar level and show the
same temporal range at the metrical level 1-beat. In addition, the delay of the first 16th-
note (low-frequency) seems to be more significant in the second beat. However, this
delay has a broader range, situated between 11 ms (for the fastest tempi in c1) and 45
ms (for the slower tempi of c2).
Peak amplitudes reveal more variability at this metrical level. While the peak of second
16th-note seems to be accentuated only in the mid-frequency region (1st beat), the fourth
16th-note is accentuated in the clusters 2–[x] and 5-[v]. However, in the 2nd beat, peak
amplitudes of the 2nd to the 4th 16th-notes are flattened.
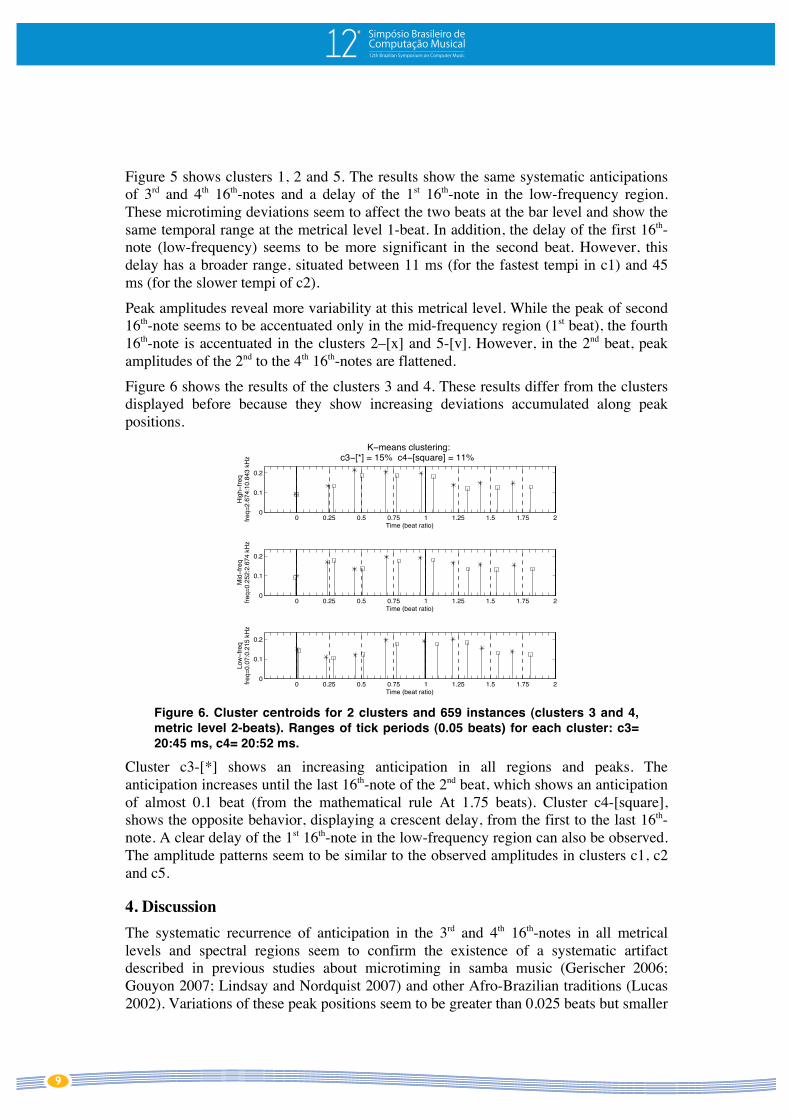
Figure 6 shows the results of the clusters 3 and 4. These results differ from the clusters
displayed before because they show increasing deviations accumulated along peak
positions.
!!"#$%&'()*&+#,-%./'(0!123'4'567''(8!1&9*$,#3'4'557''
:-"#';<#$+',$+-=>
?-.@!A,#9
A,#94BCDE8/5FCG80'H?I
F FCB6 FC6 FCE6 5 5CB6 5C6 5CE6 BF
FC5
FCB
:-"#';<#$+',$+-=>
J-K!A,#9
A,#94FCB6B/BCDE8'H?I
F FCB6 FC6 FCE6 5 5CB6 5C6 5CE6 BF
FC5
FCB
:-"#';<#$+',$+-=>
L=M!A,#9
A,#94FCFE/FCB56'H?I
F FCB6 FC6 FCE6 5 5CB6 5C6 5CE6 BF
FC5
FCB
Figure 6. Cluster centroids for 2 clusters and 659 instances (clusters 3 and 4,
metric level 2-beats). Ranges of tick periods (0.05 beats) for each cluster: c3=
20:45 ms, c4= 20:52 ms.
Cluster c3-[*] shows an increasing anticipation in all regions and peaks. The
anticipation increases until the last 16th-note of the 2nd beat, which shows an anticipation
of almost 0.1 beat (from the mathematical rule At 1.75 beats). Cluster c4-[square],
shows the opposite behavior, displaying a crescent delay, from the first to the last 16th-
note. A clear delay of the 1st 16th-note in the low-frequency region can also be observed.
The amplitude patterns seem to be similar to the observed amplitudes in clusters c1, c2
and c5.
4. Discussion
The systematic recurrence of anticipation in the 3rd and 4th 16th-notes in all metrical
levels and spectral regions seem to confirm the existence of a systematic artifact
described in previous studies about microtiming in samba music (Gerischer 2006;
Gouyon 2007; Lindsay and Nordquist 2007) and other Afro-Brazilian traditions (Lucas
2002). Variations of these peak positions seem to be greater than 0.025 beats but smaller

10
Computação MusicalSimpósio Brasileiro de
12th Brazilian Symposium on Computer Music
than 0.05 beats. All this is situated within a range of anticipations between 10 and 52 ms
of the mathematical division of the beat (0.5 and 0.75 beats).
The systematic delay of 1st 16th-note positions in the specific low frequency region of
the spectrum for all metrical layers shows an observation not mentioned in previous
studies. It is well know that low-frequency spectrum is often dominated by commetric
beat patterns, performed by percussion instruments such as surdo or tantan, and that
these bass lines are often accentuated in the 2nd beat (Chasteen 1996; Sandroni 2001;
Moura 2004), which also seem to be reflected in our results. However, we were unable
to find references to any systematic delay of bass percussion instruments.
The delay of 1st 16th-note positions must be interpreted attentively. The temporal range
of delays in the low frequency region is very close to the sample period of the auditory
model (5 ms), which means that minimum significant delays found in the Figure 4, for
example, account for only 2-samples (10 ms) between the mathematical rule and peak
position. More research is needed to support this observation.
The occurrence of linear and crescent deviations, demonstrated in Figure 5, must be also
interpreted with care. The computation of clusters may have merged two recurrent
tendencies of outliers in the data set. However, the magnitude of instances represented
by these clusters (c3-15% and c4-11%) and similar cluster structures found in other
metrical levels above 2-beats (4-beats level, not shown in this study), indicate that they
reflect real microtiming structures represented in our data-set. If this hypothesis is
confirmed, the presence of these clusters may be attributed to rhythmic devices similar
to accelerando and ritardando forms. Although these rhythmical artifacts are widely
used to delimit phrases, endings and formal articulations in classical music, it is
surprising that such devices appear in our dataset. The range of these deviations indicate
that they are less clearly defined than the ones used in classical music, which may
configure a new microtiming device.
The variation of amplitudes demonstrate that microtiming in samba is subjected to
interactions with accents and meter. The flatness of 16th-note amplitudes observed in
clusters in all metrical levels, especially the 2-beat level, indicate the existence of
metrical cues encoded in the amplitude of microtiming structures. While the first beat
starts with a low-energy 16th-note in the low-frequency region and accents in the 2nd
(Figure 4) and 4th peaks (Figure 5), the 2nd beat starts with a characteristic strong bass
accent, followed by flat and low intensity 16-th notes. This oscillation of
multidimensional characteristics between beat positions may play an important role in
the induction of grooving and reinforce metrical properties.
5. Conclusion
In this study we analyzed the interaction between microtiming, meter, intensity and
spectrum. The results strongly confirm the systematic tendency of anticipations of the
3rd and 4th 16th-notes at the metrical level of 1 beat. It also shows the presence of two
new rhythmic devices that may characterize samba forms: (1) a small delay of the bass
lines and (2) systematic forms of acelerando and ritardando at a microtiming level.
Peak amplitudes seem to work according to two functions: (1) the induction of
systematic accents in the 3rd and 4th 16th-notes of the first beat (metrical level 2-beats)
and (2) an artful mechanism that interacts with energy between metrical structures and
spectral regions. The use of a psychoacoustically based feature as a low-level descriptor
11
Computação MusicalSimpósio Brasileiro de
12th Brazilian Symposium on Computer Music
suggests that these observations are available as proximal cues in the periphery of the
auditory system. Moreover, the results show that microtiming can be understood as a
multidimensional device of musical engagement.
The present study does not intend to show an exhaustive overview of
multidimensionality of microtiming structures in Afro-Brazilian music. Other important
interactions inside and outside the auditory domain may influence the process. In
addition, more work is needed to elucidate the role and the magnitude of these findings
within the perception of groove induction.
5. Acknowledgements
This study was supported by a Short Term Scientific Mission, COST – STSM IC0601-
3753, by a grant from Ghent University (Belgium) and partly CAPES (Brazil). The
authors wish to thank Inaê Benchaya Duarte for the annotation files.
References
Benadon, F (2003). The expressive role of beat subdivision in jazz. Conference
Proceedings of the Society of Music Perception and Cognition, Las Vegas.
Benadon, F (2009). "Time Warps in Early Jazz." Music Theory Spectrum 31(1): 1-25.
Benadon, F. (2006). "Slicing the beat: Jazz eighth-notes as expressive microrhythm."
Ethnomusicology 50(1): 73-98.
Bilmes, Ja (1993). Timing is of the Essence: Perceptual and Computational Techniques
for Representing, Learning, and Reproducing Expressive Timing in Percussive
Rhythm, Massachusetts Institute of Technology.
Cannam, C, C Landone, M Sandler and Jp Bello (2006). The sonic visualiser: A
visualisation platform for semantic descriptors from musical signals.
Carvalho, J. J. De (2000). Afro-Brazilian Music and Ritual [s], Duke-University of
North Carolina Program in Latin American Studies.
Chasteen, Johncharles (1996). "The prehistory of Samba: Carnival Dancing in Rio de
Janeiro, 1840-1917." Journal of Latin American Studies 28(1): 29-47.
Desain, P and H Honing (1993). "Tempo curves considered harmful." Contemporary
Music Review 7(2): 123-138.
Dixon, S. (2007). BeatRoot 0.5.6.
Friberg, A and A Sundstrom (2002). "Swing ratios and ensemble timing in jazz
performance: Evidence for a common rhythmic pattern." Music Perception
19(3): 333-349.
Fryer, P. (2000). Rhythms of Resistance: African Musical Heritage in Brazil, Pluto.
Gerischer, C. (2006). "O suingue baiano: Rhythmic feeling and microrhythmic
phenomena in Brazilian percussion." Ethnomusicology 50(1): 99-119.
Gouyon, F. (2007). Microtiming in “Samba de Roda”—Preliminary experiments with
polyphonic audio. XII Simpósio da Sociedade Brasileira de Computação
Musical. São Paulo.
12
Computação MusicalSimpósio Brasileiro de
12th Brazilian Symposium on Computer Music
Hennessy, J (2009). Fiddle Grooves: Identity, Representation, and the Sound of Cape
Breton Fiddle Music in Popular Culture. Department of Music. Toronto,
University of Toronto. Doctor of Philosophy.
Johansson, M (2005). Interpreting micro-rhythmic structures in Norwegian traditional
fiddle music. Rhythm and Micro-rhythm: Investigating musical and cultural
aspects of groove-oriented music. Oslo.
Lindsay, K. and P. Nordquist (2007). "Pulse and swing: Quantitative analysis of
hierarchical structure in swing rhythm." The Journal of the Acoustical Society of
America 122: 2945.
Lucas, G. (2002). "Os sons do Rosário: o congado mineiro dos Arturos e Jatobá." Belo
Horizonte: Editora UFMG.
Madison, Guy (2006). "Experiencing Groove Induced by Music: Consistency and
Phenomenology." Music Perception 24(2): 201-208.
Mcguiness, A (2006). Microtiming deviations in groove. Centre for New Media Arts.
Canberra, Australian National University.
Moura, R. M. (2004). No princípio, era a roda: um estudo sobre samba, partido-alto e
outros pagodes, Rocco.
Pelleg, D and Aw Moore (2000). X-means: Extending K-means with efficient
estimation of the number of clusters, Morgan Kaufmann Publishers Inc. San
Francisco, CA, USA.
Sandroni, C. (2001). Feitiço decente: transformações do samba no Rio de Janeiro, 1917-
1933, Jorge Zahar Editor: Editora UFRJ.
Sodré, Muniz (1979). "Samba, O Dono do Corpo." Rio de Janeiro: Codecri.
Stone, Rm (1985). "In Search of Time in African Music." Music Theory Spectrum: 139-
148.
Van Immerseel, Lm and Jp Martens (1992). "Pitch and voiced/unvoiced determination
with an auditory model." The Journal of the Acoustical Society of America 91:
3511.
Walker, Ss (1973). Ceremonial spirit possession in Africa and Afro-America: Forms,
meanings, and functional significance for individuals and social groups, Brill
Archive.
Witten, Ih and E Frank "WEKA Software, v3. 5.2." University of Waikato.