multicriteria decision-making method for sustainable site location
TRANSCRIPT
Multicriteria Decision-Making Method for SustainableSite Location of Post-Disaster Temporary Housing
in Urban AreasS. M. Amin Hosseini1; Albert de la Fuente, Ph.D.2; and Oriol Pons, Ph.D.3
Abstract: Many people lose their homes around the world every year because of natural disasters, such as earthquakes, tsunamis, andhurricanes. In the aftermath of a natural disaster, the displaced people (DP) have to move to temporary housing (TH) and do not havethe ability to choose the settlement dimensions, distributions, neighborhood, or other characteristics of their TH. Additionally, post-disastersettlement construction causes neighborhood changes, environmental degradation, and large-scale public expenditures. This paper presents anew model to support decision makers in choosing site locations for TH. The model is capable of determining the optimal site location basedon the integration of economic, social, and environmental aspects into the whole life cycle of these houses. The integrated value model forsustainable assessment (MIVES), a multicriteria decision making (MCDM) model, is used to assess the sustainability of the aforementionedaspects, and MIVES includes the value function concept, which permits indicator homogenization by taking into account the satisfaction ofthe involved stakeholders. DOI: 10.1061/(ASCE)CO.1943-7862.0001137. © 2016 American Society of Civil Engineers.
Author keywords: Post-disaster temporary housing; Sustainability; Site selection; Model for sustainable assessment (MIVES);Multicriteria decision making (MCDM); Analytical hierarchy process (AHP); Quantitative methods.
Introduction
Over the last decade, 200 million people have been affected bynatural disasters and hazards; 98% of these people lived in devel-oping countries where climate change causes extreme tempera-tures, increased flooding, intense heat waves, and droughts(Aquilino 2011). Those who lost their homes to natural disastersneeded somewhere to live while their houses were rebuilt or neededto find alternative accommodations (Collins et al. 2010; Davis1982). The years between living in emergency accommodationsand permanent houses present a time gap that needs to be bridgedby temporary housing (TH) (Johnson et al. 2006). However, thesetemporary houses have, to date, been criticized for their inability tomeet the expectations of displaced people (DP) (Chen 2012).
In general, according to most relevant studies (Arslan 2007;Chandler 2007; El-Anwar et al. 2009a, b; Félix et al. 2013; Johnson2007a), TH programs have been criticized on several issues: (1) THdelivery time; (2) social and welfare quality; (3) TH locations;(4) cost of the TH implementation process; and (5) impact onthe environment.
Improper site selection is a major problem that has caused dis-satisfaction with regard to the DP of previous natural disasters, suchas Istanbul, Turkey, in 1999 (Johnson 2007b, c); Bam, Iran, in 2003(Ghafory-Ashtiany and Hosseini 2008; Khazai and Hausler 2005);L’Aquila, Italy, in 2009 (Rossetto et al. 2014); and the GreatEastern Japan Earthquake in 2011 (Shiozaki et al. 2013). In gen-eral, according to most relevant studies, the site location factors thatcause DP to be dissatisfied are: (1) losing previous social commun-ities; (2) not fitting in new communities; (3) inadequate access tourban facilities, such as shopping centers, recreation centers, and soon; (4) large distance from the new location to previous activities(job, university, and previous private property); and (5) concernabout private property. For instance, Khazai and Hausler (2005)declared that some of the Bam TH units remained vacant becauseof their site location.
Additionally, according to El-Anwar et al. (2009a) and Johnson(2002), finding a suitable TH location is the main reason for delay-ing the provision of TH. Furthermore, according to Johnson(2007a), the site location for TH can have a substantial impact onpublic expenditures. Johnson (2007a) stated that TH sites locatedon the outskirts of cities needed further development because oftheir distance to basic necessities, such as schools, clinics, andso on. Therefore, the site location of TH has considerable effectson the provision of TH as well as public expenditure, in addition tothe aforementioned social impacts.
Numerous TH studies have considered the importance of select-ing an appropriate location for a DP temporary settlement. Somehave assessed site selection exclusively, covering topics such asguidelines for shelter location (UNHCR 2000), site selectionindicators (Corsellis and Vitale 2005; Davis and Lambert 2002;Soltani et al. 2014), strategies of site selection (Kelly 2010), selec-tion of fixed seismic shelters by the technique for order preferenceby similarity to ideal solution (TOPSIS) (Chua and Su 2012), urbanshelter locations based on covering models (Wei et al. 2012),hierarchical location models for earthquake-shelter planning(Chen et al. 2013), site selection and decision-making methods
1Ph.D. Candidate, School of Civil and Environmental Engineering,Polytechnic Univ. of Catalonia (UPC), BarcelonaTech, Jordi GironaSalgado 1-3, C1-202c, 08034 Barcelona, Spain (corresponding author).E-mail: [email protected]
2Civil Engineer, Lecturer and Professor of the Civil and Environ-mental Engineering School, Polytechnic Univ. of Catalonia (UPC),BarcelonaTech, Jordi Girona Salgado 1-3, C1-202c, 08034 Barcelona,Spain. E-mail: [email protected]
3Architect, Assistant Professor of School of Architecture, PolytechnicUniv. of Catalonia (UPC), BarcelonaTech, Av. Diagonal 649, 08022Barcelona, Spain. E-mail: [email protected]
Note. This manuscript was submitted on June 19, 2015; approved onDecember 4, 2015; published online on March 7, 2016. Discussion periodopen until August 7, 2016; separate discussions must be submitted for in-dividual papers. This paper is part of the Journal of Construction Engi-neering and Management, © ASCE, ISSN 0733-9364.
© ASCE 04016036-1 J. Constr. Eng. Manage.
J. Constr. Eng. Manage., 04016036
Dow
nloa
ded
from
asc
elib
rary
.org
by
Uni
v Po
litec
Cat
on
03/2
4/16
. Cop
yrig
ht A
SCE
. For
per
sona
l use
onl
y; a
ll ri
ghts
res
erve
d.

(Omidvar et al. 2013), and optimizing TH assignments to minimizedisplacement distance (El-Anwar and Chen 2012).
All of these research studies have contributed to the develop-ment of TH, but only a few have considered TH optimization(El-Anwar et al. 2009b) and sustainable construction (El-Anwaret al. 2009c). The number of studies in which urban areas have beenconsidered is also small compared to those dealing with rural areas.
However, it is necessary to assess urban areas and to do so indi-vidually because of their own characteristics, such as concentrationof population, homes and other buildings, transportation infrastruc-ture, and industries (IFRC 2010).
Additionally, as different cities have various local living stan-dards and characteristics, the weight of these model indicators,criteria, and requirements are different from one metropolitan areato another (Davis 1982; Johnson 2007a). Therefore, because siteselection for TH is a process that involves various criteria (Kelly2010; Omidvar et al. 2013) and different stakeholders, decisionmakers need help dealing with the selection of the most suitableoptions by considering multiple criteria with respect to the require-ments and characteristics of all of the involved stakeholders.
The objective of this paper is to present a new model that iscapable of selecting an optimized location for TH by assessing eco-nomic, social, cultural, and environmental aspects. To obtain theoptimal satisfaction of the involved stakeholders, this model wasdesigned to (1) maximize the well-being of DP, (2) minimizethe negative impact on neighborhood life, (3) minimize TH publicexpenses, (4) minimize the negative impact on the environment,and (5) maximize the well-being of people involved in the TH con-struction process (e.g., engineers, workers). The site chosen inthe present model specifically embraces the TH phase based onQuarantelli’s definition of phases (Quarantelli 1995), even thoughthe site can be used for the emergency shelter and temporary shelter
phases as well. Additionally, the paper provides a method meant tochoose and prepare TH locations during the normal situation(predisaster).
To this end, the integrated value model for sustainable assess-ment (MIVES), which consists of a multicriteria decision-makingmethod that incorporates the concept of the value function (Alarconet al. 2011), has been used. The MIVES model defined in thisresearch project relies on seminars given by international multidis-ciplinary experts. MIVES has already been used to assess sustain-ability and to make decisions in the fields of (1) the SpanishStructural Concrete Code (Aguado et al. 2012); (2) sewerageconcrete pipes (Vinolas et al. 2011); (3) school edifices (Pons andAguado 2012); (4) probabilistic method (MIVES–EHEm–MonteCarlo) development for large and complex edifices (del Cano andGomez 2012); (5) structural concrete columns (Pons and de laFuente 2013); (6) wind-turbine supports (de la Fuente et al. 2015);and (7) TH (Hosseini et al. 2016).
This new model has been applied to find the best site locationfor TH in the case of a probabilistic earthquake of Mosha’s faultin Tehran, Iran. This case is based on reports from the JapanInternational Cooperation Agency (JICA), which has assistedthe Iranian government in providing a disaster management masterplan for Tehran since 1999 (JICA 2000).
Methodology
A holistic approach was used in this paper to present a TH processthat used site selection as one of the significant components ofTH implementation. This methodology has four phases: (1) datacollection; (2) data analysis; (3) model design; and (4) modelapplication, as shown in Fig. 1. In the data collection phase, the
Fig. 1. Methodology for considering the whole TH process and the sustainability assessment method based on MIVES
© ASCE 04016036-2 J. Constr. Eng. Manage.
J. Constr. Eng. Manage., 04016036
Dow
nloa
ded
from
asc
elib
rary
.org
by
Uni
v Po
litec
Cat
on
03/2
4/16
. Cop
yrig
ht A
SCE
. For
per
sona
l use
onl
y; a
ll ri
ghts
res
erve
d.

necessary information on TH is obtained through comprehensiveliterature reviews, recovery reports, surveys, and TH guidelines.In the data analysis phase, the stakeholders and characteristicsof TH are defined. Then, the defined characteristics are assessedto distinguish the negative and positive points according to theirstrengths, weaknesses, opportunities, and threats mode (SWOT).In the model design phase, the requirements tree is based on thelocal characteristics of the case study and its demands.
As the objective of this paper includes site selection exclusively,the estimation of DP is considered to determine the demand area ofthe TH site, as shown in Fig. 2, before defining the requirementstree. The designed tree must contain minimum indicators, whichare independent from each other and calculable in formula.
In the model application phase, the weights of the indices areevaluated by a group of multidisciplinary experts who use the ana-lytical hierarchy process (AHP) (Saaty 1990) based on previousstudies and local characteristics. Decision makers also define alter-native sites that have the ability to be used as locations of post-disaster TH with regard to the determined requirements and the
relative weights of these requirements. The decision maker can de-cide to have some small distributed sites in the city or a unique largesite, which is usually located on the outskirts.
Because the data collection and analysis phases of site selectionfor TH have already been considered in the introduction of thepaper, the following section defines the model design for siteselection.
Sustainability Assessment of Post-Disaster TemporaryHousing
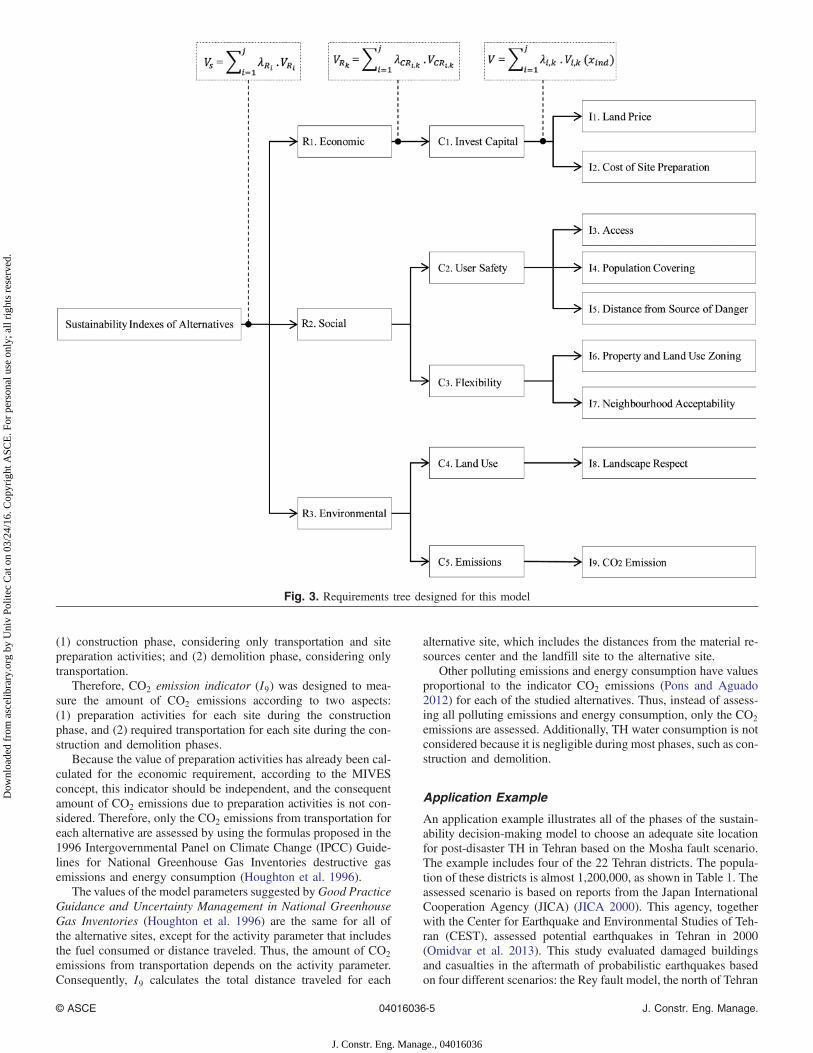
According to MIVES, a specific tree, which is shown in Fig. 3, wasdeveloped to assess the sustainability of site selection for post-disaster TH based on data collected from extensive technicalliterature and seminars that have been given by multidisciplinaryengineers who are expert in this subject.
The first level of the tree includes the economic, environmental,and social requirements; the second hierarchical level includes thefive criteria; and the last level includes the nine indicators. Unlike
Fig. 2. Model implementation for site selection
© ASCE 04016036-3 J. Constr. Eng. Manage.
J. Constr. Eng. Manage., 04016036
Dow
nloa
ded
from
asc
elib
rary
.org
by
Uni
v Po
litec
Cat
on
03/2
4/16
. Cop
yrig
ht A
SCE
. For
per
sona
l use
onl
y; a
ll ri
ghts
res
erve
d.

the requirements and criteria, the indicators are measurable varia-bles to quantify each alternative site.
The economic requirement (R1) assesses the investment of eachproposed site that could be a location for TH. The social require-ment (R2) takes the impact of each alternative site, in terms of thesocial aspects on DP as users of temporary houses and third partieswho are involved in TH, into account. The environmental require-ment (R3) assesses the environmental effects of all of the processesrelated to the site location throughout all of the phases of thelife cycle.
Definitions of Indicators
Land price indicator (I1) evaluates the cost of land per squaremeter (cost=m2). As already mentioned, it is possible to have setsof several sites whose total area is equal to or close to the re-quired area.
Cost of site preparation (I2) assesses the amount of expenditureduring the site preparation process; I2 locates the site that requiresthe minimum investment for preparation activities. Cost of sitepreparation is related to the following site characteristics: (1) slope,(2) topography, (3) type of soil, (4) type of plants, (5) level ofgroundwater, (6) access, (7) mobilization, and (8) utilities and util-ity vulnerability after a disaster. The experts have estimated the costof site preparation for each alternative in cost=m2.
Because the selected site may be located in a district where theurban facilities (water pipes, power cables, etc.) would be damagedby natural disasters, the δ factor prevents choosing a site in a districtwhere the urban facilities will need to be repaired in the aftermathof a natural disaster. The δ factor presents the quality of the utilitiesafter the disaster based on professional prediction. The systemassigning points has been employed for this factor.
The efficient use of investment indicator ensures that the chosenalternative site(s) has an area equal to or close to the required area.This indicator has been eliminated because most alternative sitesare owned by the government, one of the main investors; it is pos-sible to use a portion of each site to avoid extra expenses.
The dimensions of the site are defined by the prediction of DPmultiplied by the required area per person. Handbook for Emergen-cies (2000) suggests a figure of 30 m2 per person, which includesthe necessary area for roads, foot paths, educational facilities, andso on. Davis and Lambert (2002) stated that 45 m2 per person isnecessary for temporary settlements according to the sphereproject. Aside from the number of DP, other factors, such as build-ing design varying from flat houses to multilevel houses, averagenumber of people in households, and local characteristics, impactthe area of site location.
Access (I3) considers the quality and time of access for DP, thirdparties, and emergency services from the beginning of the TH pro-cess to its end; I3 takes into account the access for a period of timethat contains the (1) construction phase, (2) operation phase innormal situations (predisaster), and (3) operation phase as a THlocation (post-disaster).
During the construction phase, the access for people involved inconstruction (employees, workers, engineers, etc.) is assessed.During the operation phase in post-disaster periods, two issuesare assessed: (1) the quality of DP access to other parts of the city,and (2) the quality and time of access for emergency services(medical, fire fighter, police, etc.) to the site. Because the accessin the predisaster construction and operation phases is the sameas the access for DP, only the accessibility for the operation phaseduring the post-disaster period is considered. Thus, I3 takes intoaccount the accessibility of DP and emergency services.
Therefore, the quality of access for DP is determined by usingthe following point assigning system for the access coefficient (α).
The access of emergency services takes into account two fac-tors: (1) access time for emergency services in minutes; and(2) quality of emergency services, which embraces (a) the quantityand quality of equipment, and (b) the number of emergency serv-ices that cover the location of the TH with the same function that isconsidered by the coefficient β. This coefficient is measured byassigning points. Additionally, this paper assumes that the weightsof emergency services are equal.
As the accessibility for emergency services is vitally more im-portant than access for DP, the coefficient for the accessibility ofemergency services is 70%, and the coefficient for the accessibilityof DP is 30%. These coefficients can change according to each sit-uation.
Population covering indicator (I4) analyses alternatives to(1) maximize the coverage of DP, (2) distribute chosen sitesthroughout the city (decentralization of temporary sites), and(3) distribute facilities based on the distribution of the displacedpopulation.
In other words, I4 helps decision makers obtain two goals:(1) there is no region where the DP have problems because of areadeficiency; and (2) no selected site remains empty or forces DP tomove to another site that is far from the previous local zone of theDP. Thus, the population coverage is evaluated by Eq. (1)
PCi ¼Xm1
�Dai→Rm
PRm
�ð1Þ
The distance from the sources of danger indicator (I5) has beendesigned because the chosen site should be located far from thesources of dangers, such as secondary hazards that could riskthe integrity of the DP.
In addition to the previous distance from the hazardous zone, thedanger level of the source should be considered. Therefore, a sys-tem assigning points has been used to assess the danger level of thesource that is defined with the γ-coefficient.
The user safety criterion (C2) could also include an additionalindicator, preparation activities time, which is vital for DP. How-ever, this model does not consider the time of site preparation be-cause the assumption of this paper is to choose and preparelocations of TH during the normal situation (predisaster).
Property and land use zoning indicator (I6) considers site con-ditions in terms of land use, land property, and legal restrictionsbased on a comprehensive master plan. A system assigning pointshas also been used.
Neighborhood accessibility indicator (I7) takes into account theimpact of TH on the neighborhood environment. This paper hasassessed the following items as subindicators: (1) density, (2) qual-ity of medical care services, (3) green area, and (4) school capacity.Additionally, the weights of the previously mentioned subindica-tors are assumed to be equal.
Landscape respect indicator (I8) takes into account the impactof TH on ecosystem changes, such as isolated district or accesslimitation, damage from sewage, excavation, acidification, andother negative influences. The system assigning points has alsobeen employed for this indicator.
Building construction causes high energy consumption and CO2
emissions during the life cycle stages of construction, usage, anddemolition (Pons and Wadel 2011). Thus, indicators should be de-signed to assess the impact of the TH site on the environment interms of CO2 emissions and energy consumption based on the lifecycle assessment (LCA). The environmental impacts of the sitelocation embrace only the construction and demolition phases:
© ASCE 04016036-4 J. Constr. Eng. Manage.
J. Constr. Eng. Manage., 04016036
Dow
nloa
ded
from
asc
elib
rary
.org
by
Uni
v Po
litec
Cat
on
03/2
4/16
. Cop
yrig
ht A
SCE
. For
per
sona
l use
onl
y; a
ll ri
ghts
res
erve
d.
(1) construction phase, considering only transportation and sitepreparation activities; and (2) demolition phase, considering onlytransportation.
Therefore, CO2 emission indicator (I9) was designed to mea-sure the amount of CO2 emissions according to two aspects:(1) preparation activities for each site during the constructionphase, and (2) required transportation for each site during the con-struction and demolition phases.
Because the value of preparation activities has already been cal-culated for the economic requirement, according to the MIVESconcept, this indicator should be independent, and the consequentamount of CO2 emissions due to preparation activities is not con-sidered. Therefore, only the CO2 emissions from transportation foreach alternative are assessed by using the formulas proposed in the1996 Intergovernmental Panel on Climate Change (IPCC) Guide-lines for National Greenhouse Gas Inventories destructive gasemissions and energy consumption (Houghton et al. 1996).
The values of the model parameters suggested byGood PracticeGuidance and Uncertainty Management in National GreenhouseGas Inventories (Houghton et al. 1996) are the same for all ofthe alternative sites, except for the activity parameter that includesthe fuel consumed or distance traveled. Thus, the amount of CO2
emissions from transportation depends on the activity parameter.Consequently, I9 calculates the total distance traveled for each
alternative site, which includes the distances from the material re-sources center and the landfill site to the alternative site.
Other polluting emissions and energy consumption have valuesproportional to the indicator CO2 emissions (Pons and Aguado2012) for each of the studied alternatives. Thus, instead of assess-ing all polluting emissions and energy consumption, only the CO2
emissions are assessed. Additionally, TH water consumption is notconsidered because it is negligible during most phases, such as con-struction and demolition.
Application Example
An application example illustrates all of the phases of the sustain-ability decision-making model to choose an adequate site locationfor post-disaster TH in Tehran based on the Mosha fault scenario.The example includes four of the 22 Tehran districts. The popula-tion of these districts is almost 1,200,000, as shown in Table 1. Theassessed scenario is based on reports from the Japan InternationalCooperation Agency (JICA) (JICA 2000). This agency, togetherwith the Center for Earthquake and Environmental Studies of Teh-ran (CEST), assessed potential earthquakes in Tehran in 2000(Omidvar et al. 2013). This study evaluated damaged buildingsand casualties in the aftermath of probabilistic earthquakes basedon four different scenarios: the Rey fault model, the north of Tehran
Fig. 3. Requirements tree designed for this model
© ASCE 04016036-5 J. Constr. Eng. Manage.
J. Constr. Eng. Manage., 04016036
Dow
nloa
ded
from
asc
elib
rary
.org
by
Uni
v Po
litec
Cat
on
03/2
4/16
. Cop
yrig
ht A
SCE
. For
per
sona
l use
onl
y; a
ll ri
ghts
res
erve
d.

Tab
le1.
RelevantInform
ationof
theCaseStudyDistricts
Properties
Casestudydistricts
Other
districts(w
here
thealternativesiteshave
been
located)
References
District2
District3
District6
District7
District1
District4
District5
District22
Area(km
2)
48.2
29.4
21.5
15.4
6461.4
54.5
61.1
Implem
entatio
nof
the2011
IranianPo
pulatio
nandHousing
Census(2011);
Iran:Tehran
City
(2014),JICA
(2000),
andZayyariet
al.(2012)
Census1996
populatio
n458,089
259,019
220,331
300,212
249,676
663,166
427,995
56,020
Implem
entatio
nof
the2011
IranianPo
pulatio
nandHousing
Census(2011)
andJICA
(2000)
Census2011
populatio
n632,917
314,112
229,980
309,745
439,467
861,280
793,750
128,985
Green
area
(km
2)
6.8
3.9
2.8
0.8
3.8
7.7
7.6
1.8
Atlasof
TeheranMetropolis
(2014),
Implem
entatio
nof
the2011
IranianPo
pulatio
nandHousing
Census(2011),JICA
(2000),
Moham
madzade
Asl
etal.(2010),
andZayyariet
al.(2012)
Medical
service
418
368
577
254
232
277
328
36Im
plem
entatio
nof
the2011
IranianPo
pulatio
nandHousing
Census(2011)
andJICA
(2000)
Policestation
3539
7852
7567
541
JICA
(2000)
andMoham
madzade
Asl
etal.(2010)
Fire
station
44
22
25
52
Alavi
etal.(2013),JICA
(2000),and
Moham
madzade
Asl
etal.(2010)
Edu
catio
nalcentre
735
586
795
431
572
627
586
63Moham
madzade
Asl
etal.(2010),
Atlasof
TeheranMetropolis
(2014),and
Moham
madzade
Asl
etal.(2010)
Urban
developm
entlevel(%
)77.94
89.96
9.91
72.48
100
59.79
51.49
52.56
Dam
aged
build
ingproportio
n(%
)11.1
16.4
12.7
12.8
17.9
13.8
8.6
6.8
JICA
(2000)
Causalitiesproportio
n(%
)0.1
0.2
0.2
0.2
0.3
0.2
0.00
0.00
JICA
(2000)
© ASCE 04016036-6 J. Constr. Eng. Manage.
J. Constr. Eng. Manage., 04016036
Dow
nloa
ded
from
asc
elib
rary
.org
by
Uni
v Po
litec
Cat
on
03/2
4/16
. Cop
yrig
ht A
SCE
. For
per
sona
l use
onl
y; a
ll ri
ghts
res
erve
d.
fault model, the Mosha fault model, and the floating model(Omidvar et al. 2013). This paper considers a model for choosingan adequate site location for post-disaster TH in Tehran based onthe JICA and CEST results for the Mosha fault model.
According to the JICA and CEST study (JICA 2000), if a prob-abilistic earthquake occurs during the day, it will cause almost18,000 casualties, more than 610,000 DP, and 90,000 damaged res-idential buildings in total. The statistics for damaged buildingsevaluated only residential buildings as blocks without consideringthe number of total residential units in one block. The estimateddisplaced populations of the four districts considered add up to ap-proximately 160,000 people. Because it is assumed that one-thirdof the DP will be settled in multilevel houses in the camp, thetotal area demanded is nearly 1 km2 (100 ha), corresponding to20 square meters per person. According to UNHCR (2000) andthe sphere project, the area demanded in the camp ranges between30 and 45 m2=person. However, based on the assumptions of thispaper and the land scarcity in Tehran, two-story and three-story THunits have been designed. Thus, a demanded area of almost20 m2=person has generally been obtained.
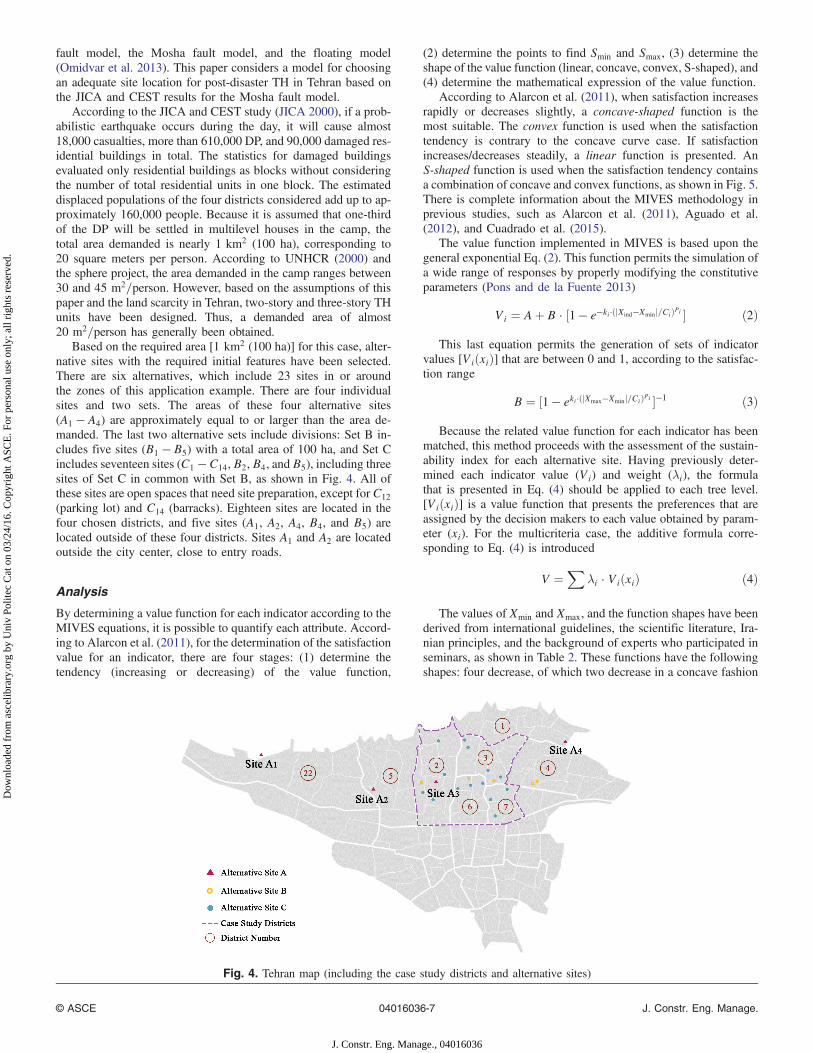
Based on the required area [1 km2 (100 ha)] for this case, alter-native sites with the required initial features have been selected.There are six alternatives, which include 23 sites in or aroundthe zones of this application example. There are four individualsites and two sets. The areas of these four alternative sites(A1 − A4) are approximately equal to or larger than the area de-manded. The last two alternative sets include divisions: Set B in-cludes five sites (B1 − B5) with a total area of 100 ha, and Set Cincludes seventeen sites (C1 − C14, B2, B4, and B5), including threesites of Set C in common with Set B, as shown in Fig. 4. All ofthese sites are open spaces that need site preparation, except for C12
(parking lot) and C14 (barracks). Eighteen sites are located in thefour chosen districts, and five sites (A1, A2, A4, B4, and B5) arelocated outside of these four districts. Sites A1 and A2 are locatedoutside the city center, close to entry roads.
Analysis
By determining a value function for each indicator according to theMIVES equations, it is possible to quantify each attribute. Accord-ing to Alarcon et al. (2011), for the determination of the satisfactionvalue for an indicator, there are four stages: (1) determine thetendency (increasing or decreasing) of the value function,
(2) determine the points to find Smin and Smax, (3) determine theshape of the value function (linear, concave, convex, S-shaped), and(4) determine the mathematical expression of the value function.
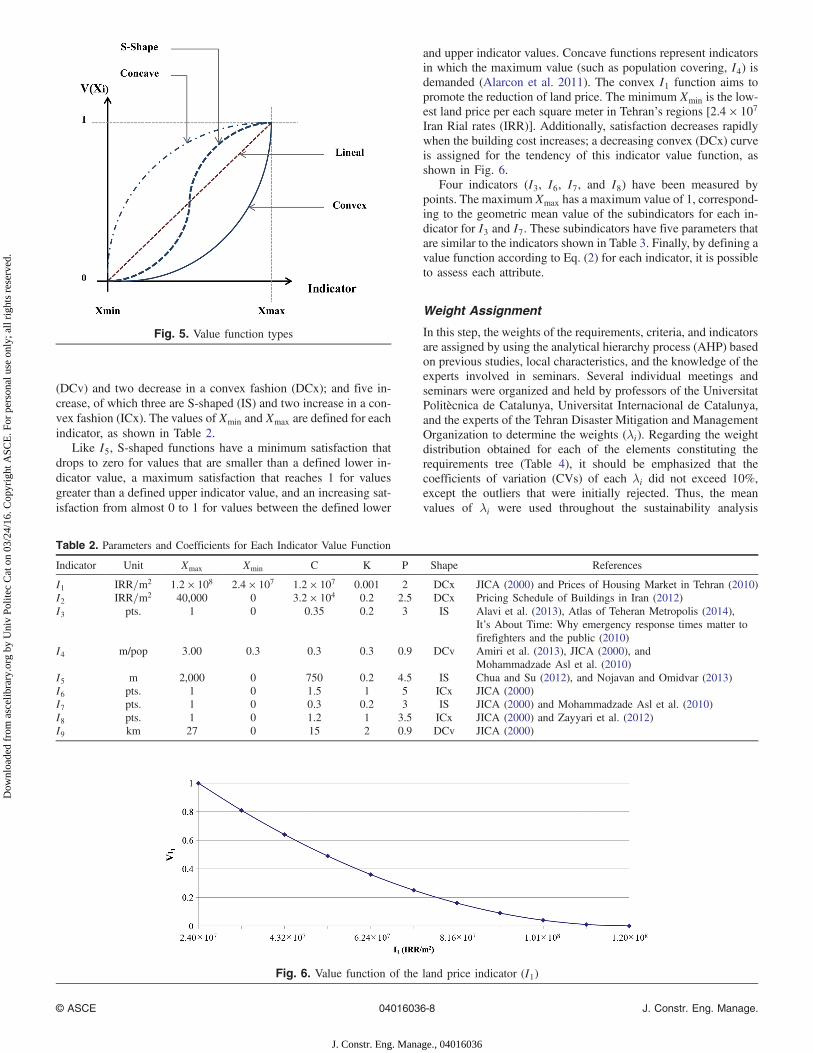
According to Alarcon et al. (2011), when satisfaction increasesrapidly or decreases slightly, a concave-shaped function is themost suitable. The convex function is used when the satisfactiontendency is contrary to the concave curve case. If satisfactionincreases/decreases steadily, a linear function is presented. AnS-shaped function is used when the satisfaction tendency containsa combination of concave and convex functions, as shown in Fig. 5.There is complete information about the MIVES methodology inprevious studies, such as Alarcon et al. (2011), Aguado et al.(2012), and Cuadrado et al. (2015).
The value function implemented in MIVES is based upon thegeneral exponential Eq. (2). This function permits the simulation ofa wide range of responses by properly modifying the constitutiveparameters (Pons and de la Fuente 2013)
Vi ¼ Aþ B · ½1 − e−ki ·ðjXind−Xminj=CiÞPi � ð2Þ
This last equation permits the generation of sets of indicatorvalues [ViðxiÞ] that are between 0 and 1, according to the satisfac-tion range
B ¼ ½1 − eki ·ðjXmax−Xmin j=CiÞPi �−1 ð3Þ
Because the related value function for each indicator has beenmatched, this method proceeds with the assessment of the sustain-ability index for each alternative site. Having previously deter-mined each indicator value (Vi) and weight (λi), the formulathat is presented in Eq. (4) should be applied to each tree level.[ViðxiÞ] is a value function that presents the preferences that areassigned by the decision makers to each value obtained by param-eter (xi). For the multicriteria case, the additive formula corre-sponding to Eq. (4) is introduced
V ¼X
λi · ViðxiÞ ð4Þ
The values of Xmin and Xmax, and the function shapes have beenderived from international guidelines, the scientific literature, Ira-nian principles, and the background of experts who participated inseminars, as shown in Table 2. These functions have the followingshapes: four decrease, of which two decrease in a concave fashion
Fig. 4. Tehran map (including the case study districts and alternative sites)
© ASCE 04016036-7 J. Constr. Eng. Manage.
J. Constr. Eng. Manage., 04016036
Dow
nloa
ded
from
asc
elib
rary
.org
by
Uni
v Po
litec
Cat
on
03/2
4/16
. Cop
yrig
ht A
SCE
. For
per
sona
l use
onl
y; a
ll ri
ghts
res
erve
d.
(DCv) and two decrease in a convex fashion (DCx); and five in-crease, of which three are S-shaped (IS) and two increase in a con-vex fashion (ICx). The values of Xmin and Xmax are defined for eachindicator, as shown in Table 2.
Like I5, S-shaped functions have a minimum satisfaction thatdrops to zero for values that are smaller than a defined lower in-dicator value, a maximum satisfaction that reaches 1 for valuesgreater than a defined upper indicator value, and an increasing sat-isfaction from almost 0 to 1 for values between the defined lower
and upper indicator values. Concave functions represent indicatorsin which the maximum value (such as population covering, I4) isdemanded (Alarcon et al. 2011). The convex I1 function aims topromote the reduction of land price. The minimum Xmin is the low-est land price per each square meter in Tehran’s regions [2.4 × 10⁷
Iran Rial rates (IRR)]. Additionally, satisfaction decreases rapidlywhen the building cost increases; a decreasing convex (DCx) curveis assigned for the tendency of this indicator value function, asshown in Fig. 6.
Four indicators (I3, I6, I7, and I8) have been measured bypoints. The maximum Xmax has a maximum value of 1, correspond-ing to the geometric mean value of the subindicators for each in-dicator for I3 and I7. These subindicators have five parameters thatare similar to the indicators shown in Table 3. Finally, by defining avalue function according to Eq. (2) for each indicator, it is possibleto assess each attribute.
Weight Assignment
In this step, the weights of the requirements, criteria, and indicatorsare assigned by using the analytical hierarchy process (AHP) basedon previous studies, local characteristics, and the knowledge of theexperts involved in seminars. Several individual meetings andseminars were organized and held by professors of the UniversitatPolitècnica de Catalunya, Universitat Internacional de Catalunya,and the experts of the Tehran Disaster Mitigation and ManagementOrganization to determine the weights (λi). Regarding the weightdistribution obtained for each of the elements constituting therequirements tree (Table 4), it should be emphasized that thecoefficients of variation (CVs) of each λi did not exceed 10%,except the outliers that were initially rejected. Thus, the meanvalues of λi were used throughout the sustainability analysis
Fig. 5. Value function types
Table 2. Parameters and Coefficients for Each Indicator Value Function
Indicator Unit Xmax Xmin C K P Shape References
I1 IRR=m2 1.2 × 10⁸ 2.4 × 10⁷ 1.2 × 10⁷ 0.001 2 DCx JICA (2000) and Prices of Housing Market in Tehran (2010)I2 IRR=m2 40,000 0 3.2 × 10⁴ 0.2 2.5 DCx Pricing Schedule of Buildings in Iran (2012)I3 pts. 1 0 0.35 0.2 3 IS Alavi et al. (2013), Atlas of Teheran Metropolis (2014),
It’s About Time: Why emergency response times matter tofirefighters and the public (2010)
I4 m/pop 3.00 0.3 0.3 0.3 0.9 DCv Amiri et al. (2013), JICA (2000), andMohammadzade Asl et al. (2010)
I5 m 2,000 0 750 0.2 4.5 IS Chua and Su (2012), and Nojavan and Omidvar (2013)I6 pts. 1 0 1.5 1 5 ICx JICA (2000)I7 pts. 1 0 0.3 0.2 3 IS JICA (2000) and Mohammadzade Asl et al. (2010)I8 pts. 1 0 1.2 1 3.5 ICx JICA (2000) and Zayyari et al. (2012)I9 km 27 0 15 2 0.9 DCv JICA (2000)
Fig. 6. Value function of the land price indicator (I1)
© ASCE 04016036-8 J. Constr. Eng. Manage.
J. Constr. Eng. Manage., 04016036
Dow
nloa
ded
from
asc
elib
rary
.org
by
Uni
v Po
litec
Cat
on
03/2
4/16
. Cop
yrig
ht A
SCE
. For
per
sona
l use
onl
y; a
ll ri
ghts
res
erve
d.

[del Cano and Gomez (2012) for an uncertainty treatment ap-proach]. Additionally, the alternative approach used herein to ad-dress the assessment of the weights is presented in the results anddiscussion section. This approach does not depend on the prioritiesof the experts. The assigned weights are based on choosing a siteduring a predisaster normal situation. These weights should be con-sidered when this model is applied after the disaster.
Finally, by having each index value function ðVxkÞ and itsweight ðλkÞ, which have previously been explained, Eq. (4) can
be applied for each level of the tree. Fig. 3 shows the mentionedprocess to obtain the sustainability index.
Results and Discussion
The results from this evaluation are the sustainability index (I), re-quirement values (VRk
), criteria values (VCk), and indicator values
(VIk ) for each alternative, as shown in Table 5. The maximumsustainability index score I of the site location for TH is 0.61.Additionally, there are indicators and criteria that only change be-cause of the site characteristics, irrespective of the site location,such as I5, I6, and I8. For instance, I6 is only related to landuse and ownership.
Some indicators are influenced by the site location, such as I2,I3, I4, I7, and I9. The sites that are located near the city center ob-tain high satisfaction values in accessibility (I3) and populationcover (I4). The sites that are located on the outskirts of the cityhave an adequate density and green area, are usually close to re-sources and main roads, and usually have lower land prices. Thus,these sites have higher satisfaction values for the following indica-tors: land price (I1), neighborhood acceptability (I7), and emissions(I9). Additionally, alternatives that consist of some sets, such as Band C, obtain maximum satisfaction according to access (I3) andpopulation cover (I4) and minimum satisfaction from the cost ofsite preparation (I2).
In general, Sets B and C have minimum values for economicrequirements, and these sets and A2 have high values for socialrequirements. Alternatives A1 and A4, which are located out oftown, have maximum values for the environmental requirement.
Table 3. Parameters and Coefficients for Each Sub-Indicator Value Function
Ix Sub-indicator Unit Xmax Xmin C K P Shape References
I3 Access of DP Pts 1 0 0.3 0.2 3 IS Atlas of Teheran Metropolis (2014)Access to emergency
servicesmin 20 4 9.2 0.8 3.4 DS Alavi et al. (2013), It’s About Time:
Why Emergency Response Times Matter toFirefighters and the Public (2010), and Lee (2012)
I7 Density pers./Ha 349 9 360 0.05 2.5 DCx Atlas of Teheran Metropolis (2014), JICA (2000),and Mohammadzade Asl et al. (2010)
Hospital pop./N Hosp. 180,000 50,000 220,000 0.5 4 DCx Atlas of Teheran Metropolis (2014), JICA (2000),and Mohammadzade Asl et al. (2010)
School pop./N Sch. 2,100 200 2,150 0.05 3 DCx Atlas of Teheran Metropolis (2014), JICA (2000),and Mohammadzade Asl et al. (2010)
Green area m2=pop 20 2 13 0.15 6 ICx Atlas of Teheran Metropolis (2014), JICA (2000),Mohammadzade Asl et al. (2010), andzayyari et al. (2012)
Police pop./N P.S. 14,000 1,300 15,000 1 3 DCx Atlas of Teheran Metropolis (2014), JICA (2000),and Mohammadzade Asl et al. (2010)
Fire station pop./N F.S. 300,000 10,000 400,000 1 3 DCx Atlas of Teheran Metropolis (2014), It’s About Time:Why Emergency Response Times Matter toFirefighters and the Public (2010),Alavi et al. (2013), and Structure FireResponse Times (2006)
Table 4. Requirements Tree with Weight Assignments
Requirements Criteria Indicators
R1. Economic (45%) C1. Invest capital(100%)
I1. Land price (75%)I2. Cost of site
preparation (25%)R2. Social (25%) C2. User safety
(80%)I3. Access (30%)I4. Populationcovering (20%)
I5. Distance from source ofdanger (50%)
C3. Flexibility(20%)
I6. Property and landuse zoning (60%)I7. Neighbourhoodacceptability (40%)
R3. Environmental(30%)
C4. Land use(25%)
I8. Landscaperespect (100%)
C5. Emissions(75%)
I9. CO2 emission (100%)
Table 5. Sustainability Index (I), Requirements (VRk), Criteria (VCk
), and Indicators (VIk ) Values for the Six Alternative Sites
Alternative I VR1 VR2 VR3 VC1 VC2 VC3 VC4 VC5 VI1 VI2 VI3 VI4 VI5 VI6 VI7 VI8 VI9
A1 0.61 0.59 0.50 0.73 0.59 0.37 1.00 0.50 0.80 0.56 0.68 0.78 0.60 0.03 1.00 1.00 0.50 0.80A2 0.55 0.47 0.92 0.35 0.47 0.92 0.91 0.50 0.30 0.46 0.52 0.82 0.88 1.00 1.00 0.79 0.50 0.30A3 0.37 0.18 0.46 0.58 0.18 0.41 0.68 0.50 0.61 0.02 0.67 0.59 0.98 0.07 1.00 0.19 0.50 0.61A4 0.52 0.28 0.49 0.91 0.28 0.41 0.82 0.75 0.96 0.13 0.72 0.72 0.88 0.03 1.00 0.54 0.75 0.96B 0.43 0.13 0.78 0.60 0.13 0.79 0.75 0.58 0.61 0.05 0.36 0.99 0.98 0.59 1.00 0.36 0.58 0.61C 0.47 0.09 0.93 0.65 0.09 0.99 0.72 0.73 0.62 0.11 0.02 0.98 0.98 0.99 1.00 0.31 0.73 0.62
© ASCE 04016036-9 J. Constr. Eng. Manage.
J. Constr. Eng. Manage., 04016036
Dow
nloa
ded
from
asc
elib
rary
.org
by
Uni
v Po
litec
Cat
on
03/2
4/16
. Cop
yrig
ht A
SCE
. For
per
sona
l use
onl
y; a
ll ri
ghts
res
erve
d.

Alternative A1 has the maximum value for economic requirements.A1 is the most sustainable alternative site for post-disaster THamong the alternatives assessed, as shown in Table 5 and Fig. 7.
Moreover, the sites that have been provided for other functionsand have facilities, such as C12 (parking lot) and C14 (barracks),obtain high sustainability values. Moreover, the sites that arelocated on the outskirts of the city obtained high environmentalindex values because they are close to resources and main roads;there are no landscape vulnerabilities greater than the otheralternatives.
Sixteen different scenarios have been considered to determinethe sustainability index trends for the alternatives when the require-ment ratios were different, as shown in Fig. 8. The highlightedpoint on the horizontal axis (economic 45%, social 25%, and envi-ronmental 30%) shows the sustainability indexes of technologiesbased on suitable weights chosen by the experts. If the environmen-tal weight increases compared to the social weight, such as the firstpoint on the horizontal axis in Fig. 8 (economic 47%, social 18%,and environmental 35%), A1 becomes a more sustainable alterna-tive. If the economic weight increases, such as the fifth point on the
horizontal axis in Fig. 8 (economic 50%, social 25%, and environ-mental 25%), A1 becomes a more sustainable alternative again.If the social requirement weight increases, A2, C, and A1 will besuitable alternatives, although the economic and environmental re-quirement weights can qualify A1 as a final result. Therefore, if thequality of life of DP was the first priority for decision makers, A2
and C could be suitable alternatives. However, A1 has a high sus-tainability value that is based on suitable weights chosen in theseminars and the economic requirement to a greater degree thanthe other alternatives. Additionally, the trend of the A1 sustainabil-ity index did not change drastically when considering different re-quirement weights. A3, A4, and B obtain lower sustainability valuescompared to the other alternatives under all of the conditionsassessed.
In the end, the results obtained by the MIVES method have beencompared with several techniques to consider the validation of themodel results. To this end, the technique for order preference bysimilarity to ideal solution (TOPSIS) (Hwang and Yoon 1981),elimination et choix traduisant la realité/elimination and choiceexpressing reality (ELECTRE) (Roy 1968), and simple additive
Fig. 7. Sustainability index (I) and requirement values ðViÞ for the six alternatives
Fig. 8. Sustainability indexes of the six alternatives with different requirement weights [economic (Ec), social (S), and environmental (En)]
© ASCE 04016036-10 J. Constr. Eng. Manage.
J. Constr. Eng. Manage., 04016036
Dow
nloa
ded
from
asc
elib
rary
.org
by
Uni
v Po
litec
Cat
on
03/2
4/16
. Cop
yrig
ht A
SCE
. For
per
sona
l use
onl
y; a
ll ri
ghts
res
erve
d.

weighting (SAW) have been used. Additionally, Shannon’s entropy(SE) has been applied to evaluate the weights of the indicators. Theweights of the indicators have been obtained by Shannon’s entropybased on two approaches: (1) with regard to the weights assigned tothe indicators based on expert judgment (SE/W) and (2) withoutregard to the weights assigned to the indicators (SE/NW). There-fore, six models, including three techniques (TOPSIS, ELECTRE,and SAW) with two weight assignment techniques (SE/NW andSE/W), have been considered. Additionally, the MIVES methodhas been considered according to the weights of the indicators,which were obtained by Shannon’s entropy without considerationof the indicator priorities (SE/NW), except the suitable weightschosen by the experts.
Table 6 presents the ranking of the alternatives obtained fromthe various methods. Obviously, different methods provide diverseresults, although the results are almost the same for the ranking offour alternatives. Sites A1, A3, B, and C are ranked as the first, sixth,fifth, and fourth alternatives, respectively, based on the results of atleast six techniques among eight. Although the four alternativeshave been presented in the second rank by the methods, A2 hasbeen selected more than the other alternatives. Additionally, A4
has been chosen more than A2 for the third rank by the methods.Therefore, the results provided by the proposed techniques qualifythe model presented by this paper. However, the differences be-tween MIVES and the results of the other methods are understand-able because this model incorporates the concept of the valuefunction, which is necessary for TH consideration.
Conclusions
In this research paper, a new sustainability assessment model,which has been specifically configured to analyze alternative sitesfor temporary post-disaster settlements in urban areas, has beenpresented. For the application example, a total of six different al-ternatives for temporary housing have been assessed, which include23 different sites in Tehran. This model takes into account the fol-lowing aspects: maximizing the well-being of the DP, minimizingthe negative impacts on neighborhood life, minimizing the publicexpenditures on TH, minimizing the negative environmental im-pacts, and maximizing the well-being of the people involved inthe TH process. The following conclusions can be derived fromthis research:• This study defines an assessment model based on the MIVES
methodology, which has been demonstrated to be a suitablestrategy to conduct multicriteria decision processes for an inte-gral sustainability analysis of each alternative.
• This model is capable of comparing alternatives without beinglimited by present conjuncture. As a consequence, this tool iscapable of adapting its parameters (cost, methods, access, etc.),which change from one period of time to another. Additionally,
this model has the ability to be used for distinct cities by recon-sidering the requirement tree weights.
• During the site selection process, this model assists decision ma-kers in observing and comparing the index values of all alter-natives. Sometimes, decision makers choose alternatives thathave weaknesses caused by limitations; based on the aforemen-tioned feature of this model, decision makers can detect theweak parts of a specific site and then overcome these weak-nesses with proper actions.
• Diffuse sites located in different districts have the best socialindex value. Indeed, these sites can give higher satisfactionto DP, involving labor and neighbors. However, these sites havelower economic and environmental index values. Moreover,these disperse sets can cause increased transportation and indi-vidual mobilization, and they are usually located at greater dis-tances from resources. Consequently, they cause increases inexpenses and environmental damages.
• Sites that had other functions prior to selection and already hadfacilities have higher sustainability indices.The model and the requirements tree proposed in this study are
generic for any site location of post-disaster TH. However, someindicators and weights should be adjusted according to the specificanalysis of site selection for other public functions, such as publicfacilities, educational services, health services, and so on.
Acknowledgments
The first author of this paper wants to acknowledge the kindly sup-port offered by both the professors Antonio Aguado and SergioCavalaro from the Construction Engineering Department of theUniversitat Politècnica de Catalunya. In addition, the first authorwould like to thank the experts from the International Instituteof Earthquake Engineering and Seismology (IIEES), TehranDisaster Mitigation and Management Organization (TDMMO),and Universitat Internacional de Catalunya (UIC), who supportedthis paper for collecting and improving data.
Notation
The following symbols are used in this paper:A = response value of Xmin (indicator abscissa), generally
A ¼ 0;B = factor that prevents the function from leaving the range
(0.00, 1.00);Ck = criterion k;
Dai→Rm= distance from the gravity center of the alternative site ito the gravity center of the region m;
DCv = decrease concavely;DCx = decrease convexly;DS = decrease S-shape;
Table 6. Ranking of Alternatives Based on the Methods
Ranking
Method
MIVES(AHP)
MIVES(SE/NW)
TOPSIS(SE/NW)
TOPSIS(SE/W)
ELECTRE(SE/NW)
ELECTRE(SE/W)
SAW(SE/NW)
SAW(SE/W)
Totalresult
1 A1 A2 A2 A1 A1 A1 A1 A1 A1
2 A2 A1 A1 C A2 A2 A4 A4 A2
3 A4 A4 A4 A2 A4 A4 A2 A2 A4
4 C C A3 A4 C C C C C5 B B B A3 B B B B B6 A3 A3 C B A3 A3 A3 A3 A3
© ASCE 04016036-11 J. Constr. Eng. Manage.
J. Constr. Eng. Manage., 04016036
Dow
nloa
ded
from
asc
elib
rary
.org
by
Uni
v Po
litec
Cat
on
03/2
4/16
. Cop
yrig
ht A
SCE
. For
per
sona
l use
onl
y; a
ll ri
ghts
res
erve
d.

Ec = economic;En = environmental;I = sustainability index;
ICx = increase convexly;Ik = indicator k;IS = increase S-shape;Ki = factor that defines the response value to Ci;m = number of assessed regions;
min = minute(s);N F.S. = number of fire station(s);
N Hosp. = number of hospital(s);N P.S. = number of police station(s);N Sch. = number of school(s);
NW = without considering the weights assigned to theindicators;
PCi = population covering parameter for alternative site i;Pi = shape factor that determines whether the curve is
concave or convex or whether is linear or S-shaped;PRm
= predicted displaced population in the region m;pts. = points;Rk = requirement k;S = social;
SE = Shannon’s entropy;Smax = maximum satisfaction;Smin = minimum satisfaction;V = value;
Xind = considered indicator abscissa that generates avalue Vi;
Xmax = maximum value indicator;Xmin = minimum value indicator;W = considering the weights assigned to the indicators; andλi = weight of the indicator or criterion considered.
References
Aguado, A., Cano, A. D., Cruz, M. P., Gomez, D., and Josa, A. (2012).“Sustainability assessment of concrete structures within the Spanishstructural concrete code.” Constr. Eng. Manage., 138(2), 268–276.
Alarcon, B., Aguado, A., Manga, R., and Josa, A. (2011). “Avalue functionfor assessing sustainability: Application to industrial buildings.” Sus-tainability, 3(1), 35–50.
Alavi, A., Salarvand, E., Ahmadabadi, A., Sis, S. F., and Bosshaq, M. R.(2013). “Spatial analysis of fire stations based on crisis management bythe combination of MCDM and network analysis case study: Tehran,district 6.” Disaster Manage., 1(2), 57–65.
Amiri, G. G., Khoshnevis, N., and Amrei, S. R. (2013). “Probabilisticassessment of earthquake damage and loss for the city of Tehran, Iran.”J. Rehabil. Civ. Eng., 1(2), 12–25.
Aquilino, M. J. (2011). Beyond shelter architecture for crisis, Thames andHudson, London.
Arslan, H. (2007). “Re-design, re-use and recycle of temporary houses.”Build. Environ., 42(1), 400–406.
Atlas of Teheran Metropolis. (2014). ⟨http://atlas.tehran.ir/⟩ (May 12,2014).
Chandler, P. J. (2007). “Environmental factors influencing the siting oftemporary housing.” Master thesis, Dept. of Environmental Studies,Louisiana State Univ., Baton Rouge, LA.
Chen, L. (2012). “Aweb-based system for optimizing post disaster tempo-rary housing allocation.”Master thesis, Dept. of Industrial Engineering,Univ. of Washington, Seattle.
Chen, Z., Chen, X., Li, Q., and Chen, J. (2013). “The temporal hierarchy ofshelters: A hierarchical location model for earthquake-shelter plan-ning.” Int. J. Geog. Inf. Sci., 27(8), 1612–1630.
Chua, J., and Su, Y. (2012). “The application of TOPSIS method in select-ing fixed seismic shelter for evacuation in cities.” Syst. Eng. Procedia,3, 391–397.
Collins, S., Corsellis, T., and Vitale, A. (2010). “Transitional shelter:Understanding shelter from the emergency through reconstructionand beyond.” ALNAP, ⟨http://www.alnap.org⟩ (Jan. 24, 2016).
Corsellis, T., and Vitale, A. (2005). Transitional settlement displacedpopulations, Univ. of Cambridge, Cambridge, U.K.
Cuadrado, J., Zubizarreta, M., Pelaz, B., and Marcos, I. (2015). “Method-ology to assess the environmental sustainability of timber structures.”Constr. Build. Mater., 86(1), 149–158.
Davis, I. (1982). Shelter after disaster, Oxford Polytechnic Press, Oxford,U.K.
Davis, J., and Lambert, R. (2002). Engineering in emergencies—A prac-tical guide for relief workers, 2nd Ed., ITDG, London.
de la Fuente, A., Armengou, J., Pons, O., and Aguado, A. (2015). “Multi-criteria decision-making model for assessing the sustainability index ofwind-turbine support systems: Application to a new precast concretealternative.” Civ. Eng. Manage., 1–10.
del Cano, A., and Gomez, D. (2012). “Uncertainty analysis in the sustain-able design of concrete structures: A probabilistic method.” Constr.Build. Mater., 37, 865–873.
El-Anwar, O., and Chen, L. (2012). “Computing a displacement distanceequivalent to optimize plans for postdisaster temporary housingprojects.” J. Constr. Eng. Manage., 139(2), 174–184.
El-Anwar, O., El-Rayes, K., and Elnashai, A. (2009a). “An automated sys-tem for optimizing post-disaster temporary housing allocation.” Autom.Constr., 18(7), 983–993.
El-Anwar, O., El-Rayes, K., and Elnashai, A. (2009b). “Optimizing large-scale temporary housing arrangements after natural disasters.” Comput.Civ. Eng., 23(2), 110–118.
El-Anwar, O., El-Rayes, K., and Elnashai, A. S. (2009c). “Maximizing thesustainability of integrated housing recovery efforts.” Constr. Eng.Manage., 136(7), 794–802.
Félix, D., Branco, J. M., and Feio, A. (2013). “Temporary housing afterdisasters: A state of the art survey.” Habitat Int., 40, 136–141.
FEMA (Federal Emergency Management Agency). (2006). Structure fireresponse times. U.S. Dept. of Homeland Security, Emmitsburg, MD,⟨http://nfa.usfa.dhs.gov/downloads/pdf/statistics/v5i7.pdf⟩ (Jan. 24,2016).
Ghafory-Ashtiany, M., and Hosseini, M. (2008). “Post-Bam earthquake:recovery and reconstruction.” Nat. Hazards, 44(2), 229–241.
Hosseini, S. M. A., de la Fuente, A., and Pons, O. (2016). “Multi-criteriadecision-making method for assessing the sustainability of post-disastertemporary housing units technologies: A case study in Bam, 2003.”Sustainable Cities Soc., 20, 38–51.
Houghton, J. T., and et al. (1996). “Revised 1996 IPCC guidelines fornational greenhouse gas inventories.” IPCC/OECD/IEA, Paris.
Hwang, C. L., and Yoon, K. P. (1981). Multiple attribute decision-making:Methods and applications, Springer, New York.
IFRC (International Federation of Red Cross and Red Crescent Societies).(2010). “World disasters report 2010 focus on urban risk.” InternationalFederation of Red Cross and Red Crescent Societies, Geneva.
Implementation of the 2011 Iranian Population and Housing Census.(2011). “Statistical center of Iran.” Tehran (in Persian).
Iran: Tehran City. (2014). “City population.” ⟨http://www.citypopulation.de/php/iran-tehrancity.php⟩ (May 5, 2014) (in Persian).
It’s about time: Why emergency response times matter to firefighters andthe public. (2010). Fire Brigades Union, ⟨http://www.epsu.org/IMG/pdf/6367-Its-about-time-LOW-RES2.pdf⟩ (Jan. 24, 2016).
JICA (Japan International Cooperation Agency). (2000). “The study onseismic microzoning of the greater Tehran area in the Islamic Republicof Iran.” Rep., Center for Earthquake an Environmental Studies ofTehran (CEST) and Japan International Cooperation Agency (JICA),Tehran (in Persian).
Johnson, C. (2002). “What’s the big deal about temporary housing? Typesof temporary accommodation after disasters: An example of the 1999Turkish earthquake.” Proc., TIEMS 2002 Int. Disaster ManagementConf., Univ. of Waterloo, Canada, 14–17.
Johnson, C. (2007a). “Impacts of prefabricated temporary housing afterdisasters: 1999 earthquakes in Turkey.” Habitat Int., 31(1), 36–52.
Johnson, C. (2007b). “Strategic planning for post-disaster temporaryhousing.” Disasters, 31(4), 435–458.
© ASCE 04016036-12 J. Constr. Eng. Manage.
J. Constr. Eng. Manage., 04016036
Dow
nloa
ded
from
asc
elib
rary
.org
by
Uni
v Po
litec
Cat
on
03/2
4/16
. Cop
yrig
ht A
SCE
. For
per
sona
l use
onl
y; a
ll ri
ghts
res
erve
d.

Johnson, C. (2007c). “Strategies for the reuse of temporary housing.”UrbanTransFormation Conf., Holcim Forum for Sustainable Construc-tion, Shanghai, China.
Johnson, C., Lizarralde, G., and Davidson, C. H. (2006). “A systems viewof temporary housing projects in post-disaster reconstruction.” Constr.Manage. Econ., 24(4), 367–378.
Kelly, C. (2010). Strategic site selection and management, World WildlifeFund, American National Red Cross, San Francisco.
Khazai, B., and Hausler, E. (2005). “Intermediate shelters in Bam andpermanent shelter reconstruction in villages following the 2003 Bam,Iran, earthquake.” Earthquake Spectra, 21(S1), 487–511.
Lee, S. (2012). “The role of centrality in ambulance dispatching.” Decis.Support Syst., 54(1), 282–291.
Mohammadzade Asl, N., Emamverdi, Q., and Afraz, M. S. (2010). “Rank-ing urban prosperity index of Tehran’s districts.” Res. Urban Plann.,1(1), 85–106 (in Persian).
Nojavan, M., Omidvar, B., and Salehi, E. (2013). “The selection of sitefor temporary sheltering using fuzzy algorithms: Case study: Tehranmetropolitan after earthquake.” Urban Manage., 11(31), 205–221.
Omidvar, B., Baradaran-Shoraka, M., and Nojavan, M. (2013). “Temporarysite selection and decision-making methods: A case study of Tehran,Iran.” Disasters, 37(3), 536–553.
Pons, O., and Aguado, A. (2012). “Integrated value model for sustainableassessment applied to technologies used to build schools in Catalonia,Spain.” Build. Environ., 53, 49–58.
Pons, O., and Fuente, A. D. (2013). “Integrated sustainability assessmentmethod applied to structural concrete columns.” Constr. Build. Mater.,49, 882–893.
Pons, O., and Wadel, G. (2011). “Environmental impacts of prefabricatedschool buildings in Catalonia.” Habitat Int., 35(4), 553–563.
Prices of HousingMarket in Tehran. (2010). “The management informationsystem of real estate.” Statistical Center of Iran, Tehran, ⟨http://www.amar.org.ir⟩ (Mar. 10, 2014) (in Persian).
Pricing Schedule of Buildings in Iran. (2012). “Vice-president for strategicplanning and supervision of Iran.” Dept. of Technical, Tehran, ⟨http://www.mporg.ir⟩ (Mar. 10, 2014) (in Persian).
Quarantelli, E. L. (1995). “Patterns of shelter and housing in U.S. disas-ters.” Disaster Prev. Manage.: Int. J., 4(3), 43–53.
Rossetto, T., et al. (2014). “The value of multiple earthquake missions: theEEFIT L’Aquila Earthquake experience.” Bull. Earthquake Eng., 12(1),277–305.
Roy, B. (1968). “Classement et choix en présence de points de vue multi-ples. Revue française d’automatique, d’informatique et de rechercheopérationnelle.” Recherche opérationnelle, 2(1), 57–75.
Saaty, T. L. (1990). “How to make a decision: The analytic hierarchy pro-cess.” Eur. J. Oper. Res., 48(1), 9–26.
Shiozaki, Y., Tanaka, Y., Hokugo, A., and Bettencourt, S. (2013). Transi-tional shelter, World Bank, Washington, DC.
Soltani, A., Ardalan, A., Boloorani, A. D., Haghdoost, A., andHosseinzadeh-Attar, M. J. (2014). “Site selection criteria for shelteringafter earthquakes: A systematic review.” PLoS Curr.
UNHCR (United Nations High Commissioner for Refugees). (2000).Handbook for emergencies, 2nd Ed., Geneva.
Vinolas, B. (2011). “Applications and advances of MIVES methodology inmulti-criteria assessments.” Ph.D. thesis, UPC, Barcelona, Spain.
Wei, L., Li, W., Li, K., Liu, H., and Chenguse, A. L. (2012). “Decisionsupport for urban shelter locations based on covering model.” ProcediaEng., 43, 59–64.
Zayyari, K., Beiky, L. V., and Parnoon, Z. (2012). “The study of environ-mental crisis and local distribution of green space in Tehran city.”Urban-Reg. Stud. Res. J., 4(14), 25–28.
© ASCE 04016036-13 J. Constr. Eng. Manage.
J. Constr. Eng. Manage., 04016036
Dow
nloa
ded
from
asc
elib
rary
.org
by
Uni
v Po
litec
Cat
on
03/2
4/16
. Cop
yrig
ht A
SCE
. For
per
sona
l use
onl
y; a
ll ri
ghts
res
erve
d.