a rough hybrid multicriteria decision-making model for
TRANSCRIPT
symmetryS S
Article
A Rough Hybrid Multicriteria Decision-MakingModel for Improving the Quality of a ResearchInformation System
Qi-Gan Shao 1,2, James J. H. Liou 3,* , Sung-Shun Weng 2 and Yen-Ching Chuang 3
1 School of Economics & Management, Xiamen University of Technology, Xiamen 361005, China;[email protected]
2 Department of Information and Finance Management, National Taipei University of Technology,Taipei 10608, Taiwan; [email protected]
3 Department of Industrial Engineering and Management, National Taipei University of Technology,Taipei 10608, Taiwan; [email protected]
* Correspondence: [email protected]; Tel.: +886-2-2771-2171; Fax: +886-2-2731-7168
Received: 31 August 2019; Accepted: 29 September 2019; Published: 7 October 2019
Abstract: Improving the quality of research information systems is an important goal in the processof improving the performance of research management in Chinese universities. Since the evaluationof information system (IS) quality is a multicriteria decision problem, it is critical to identify theinterrelationships among the dimensions and criteria, and decide on the important criteria forproposed improvement strategies. This paper suggests a hybrid multicriteria decision-making(MCDM) model for improving the quality of a research information system. First, a rough methodcombined with the decision-making trial and evaluation laboratory and analytical network process(rough DANP) model is used to improve the objectivity of expert judgements. Additionally, therough DANP can be used to construct an influential network relationship map (INRM) betweenresearch information system components to derive the criterion weights. The complex proportionalassessment of alternatives with rough numbers (COPRAS-R) is applied to evaluate the performanceof the research information system. A Chinese university research information system is chosen toillustrate the usefulness of the proposed model. The results show that efficiency, effectiveness, anduser frequency have the highest priorities for improvement. Selected management implications basedon the actual case study are supplied.
Keywords: information system; rough decision-making trial and evaluation laboratory (RDEMATEL);rough DEMATEL-based analytical network process (RDANP); complex proportional assessment ofalternatives with rough numbers (COPRAS-R)
1. Introduction
Currently, the increasing speed of scientific and technological achievements is crucial toimprovements in innovation ability. The university research platform is a major focus of a country’sinnovation-driven development. As an important component of the national scientific research system,research in colleges and universities plays a highly important role in the development of science andtechnology and economic construction. Enterprises, universities, scientific research institutions, andother departments have established online scientific research information systems to offer a serviceplatform for technology research and development. For example, Slovenia has established a network ofscientific research cooperation since 1960, and scientists are looking for partners through the network [1].Through an analysis of scientists’ output data from information systems in Slovenia over the past 40years, Perc found that researchers’ output is consistent with Zipf’s law and log-normal distributions [2].
Symmetry 2019, 11, 1248; doi:10.3390/sym11101248 www.mdpi.com/journal/symmetry

Symmetry 2019, 11, 1248 2 of 21
Lužar et al. (2014) studied the interdisciplinary nature of the research community in the scientificnetwork, and they found that the number of cooperation between different professional disciplinesis growing slowly and needs further stimulation [3]. A well-designed information system needs toaddress issues such as system stability and user feedback [4]. However, colleges and universitiesare slow to develop their uses of these scientific research systems in China. An excellent researchinformation system could act as an effective method that aids university administrators in managingthe achievements of researchers and teachers. Researchers and teachers can obtain and share importantinformation using the research system, and arrange scientific research activities in an orderly manner.Therefore, the establishment of a high-performance university research information system is essentialfor the overall improvement of university research.
Information on research tasks and projects must be available in less time and with greater reliability,and the content in the system must be accurate and useful. Therefore, the quality of the researchinformation system decides the satisfaction degree of the users. The evaluation of the quality of theinformation system is a multidimensional problem. Many researchers have offered ideas and advicefor assessing the quality of an information system. One of the classic information system models is theinformation systems success model developed by Delone and Mclean [5,6], which is also known as theinformation system (IS) success model or D&M model. This model identified and explained six of themost critical dimensions on which information systems are commonly evaluated, namely, informationquality, system quality, service quality, use intention, user satisfaction, and net system benefit.
Based on the D&M IS success model, certain researchers updated and improved this model indifferent types of information systems. Pitt et al. [7] argued that service quality is a highly importantcomponent in the success of a D&M model, and added service quality as a new variable to reflectthe quality of the IS model. Seddon et al. [8] thought that net benefit could replace the function ofindividual impact and organizational impact. Yeo [9] updated the D&M model by changing “Use” to“Intention to use | Use”. In addition to updating the model, academia also applied the D&M model todifferent industry information systems. Zheng et al. [10] argued that information quality and systemquality have a strong influence on individual benefits and user satisfaction in a virtual community.Azeroual et al. [11] suggested that the success of a research information system is largely related to thequality of the available data, and they improved the quality of the research information system viadata profiling. Dwivedi et al. [12] summarized the factors that determine the success and failures ofthe information systems, and found that the type of information systems, such as enterprise resourceplanning (ERP) e-government, and the degree of implementation by employees and management arethe main factors. Grudzien and Hammrol [13] suggested that the quality of the information is animportant component of information system quality management. These statistical models contributedto exploration of the interrelationships among variables. However, due to the limitations of statisticalmethods, these studies encountered difficulty in helping decision makers understand the gaps betweenthe current performance and the aspirational level.
To solve this problem, certain researchers used multiple criteria decision-making (MCDM) modelsto evaluate the information system. For example, Lin [14] applied fuzzy Analytics Hierarchy Process(AHP) to evaluate course website system quality. Hsu and Lee [15] used the decision-making trial andevaluation laboratory (DEMATEL) method to explore the critical factors that influence the quality ofblog interfaces. Tsai et al. [16] developed an effectiveness evaluation model for web-based marketingusing DEMATEL, analytic network process (ANP), and VlseKriterijumska Optimizacija I KompromisnoResenje (VIKOR). Su et al. [17] developed a hybrid fuzzy MCDM model for improving e-learninginnovation performance in a fuzzy environment. These MCDM models solved the evaluation orimprovement problems for the service quality of an information system, but they did not considerthe group summary of expert opinions, and the D&M model was not considered in their studies.Furthermore, none of the literature discusses the relationship of the factors that influence the success ofan information system, and researchers have seldom proposed methods for exploring the importanceof those factors.

Symmetry 2019, 11, 1248 3 of 21
This paper attempts to fill this gap by proposing a causal relationship framework for thedevelopment of research information system assessment capability. First, based on the D&M IS successmodel, this study proposes a hybrid rough MCDM model that combines rough concepts and theDEMATEL-based ANP model (rough DANP, or RDANP) to construct interdependent connectionsamong the assessment dimensions and criteria, and obtain the weights of each dimension andcriterion. Second, based on the results of the use of the RDANP model, a complex proportionalassessment of alternatives with the rough numbers method (COPRAS-R) is applied to evaluate theperformance of a research information system in China as a case study. The D&M model is easy tounderstand by confirming the relationship on each category and criteria. The derived influentialnetwork relationship map (INRM) can help decision makers understand the complex relationships inthe research information system. The weights of the information system assessment factors can becalculated using the rough DANP method. The strength of this hybrid model can be used to showthe cause-and-effect relationships and obtain the influence weights of factors within the researchinformation system. Consequently, differing from existing studies that focused on finding the influencefactors, this paper contributes to the literature by attempting to construct a cause-and-effect method fora research information system that could help to identify the key factors for the research informationsystem and supply directions for improvement.
2. Literature Review
Based on the previous decision-making research on the service quality of information systems,it is common to apply statistical methods to verify the application of the D&M models in variousfields. Section 2.2 introduces the MCDM method to evaluate the performance of information systems,followed by an explanation of research gaps in Section 2.3.
2.1. Statistical Methods for the D&M Model
DeLone and McLean [5] proposed a famous information system success model known as theD&M model that has the ability to measure system standards, and this model has been theoreticallyand empirically developed and improved in several studies [18,19]. For example, Bernroider [20]applied the D&M model to measure the effectiveness of adopting ERP in different sizes of companiesfrom the perspective of information technology. Correlation analysis and principal component analysiswere used in this paper, and the researchers found that the D&M success model was well suited toassessment of the performance of application of the ERP system in small- and medium-sized companies.Chen et al. [21] evaluated the quality of a web-based learning system for nurses in a hospital andfound that system quality, information quality, and service quality are the three dimensions used tomeasure the quality of a learning system. Two-factor analysis and SEM methods were applied tovalidate the model practicality, and this research developed an instrument used to assess the quality ofa web-based learning system based on the D&M model. By applying the updated D&M model, Bossenet al. [22] satisfactorily evaluated the implementation of comprehensive electronic health records(EHR) in a hospital in Denmark. Bossen found that medical secretaries and physicians encountercertain difficulties in using the patient administration method and establishing professionally relevantdata. Kyoung et al. [23] also evaluated the performance of a public hospital information system usingthe D&M model, and the relationships among IS success factors were assessed using the structuralequation model. The results indicated that the intention to use the system had no influence on the netbenefit. Chiu et al. [24] evaluated mobile e-books in a cloud bookcase using an information systemsuccess model and applied partial least squares structural equation modeling (PLS-SEM) to verifythe model. The result showed that system quality and service quality had a positive influence onintention to use the cloud e-bookcase and user satisfaction. Ayyash [18] developed four dimensions(accuracy, timeliness, completeness, and relevancy) used to reflect information quality, and discussedthe relationship between these four dimensions and customer satisfaction in the e-banking industry.

Symmetry 2019, 11, 1248 4 of 21
Ayyash used multiple regression to analyze the data, and the results indicated that all of the dimensionshad positive effects on customer satisfaction.
Selected researchers applied the D&M model in online learning systems such as Massive OpenOnline Courses (MOOCs), mobile learning systems, and blog-based learning systems [25,26]. Based onthe D&M theory, Wu and Chen [27] applied the structure equation model and multiple group analysismethod to a Facebook system, and the result showed that social influence and information quality arecritical and direct determinants that affect users’ continuous intention to use Facebook in learning.E-commerce and e-government system success could also be measured by the D&M model from astatistical perspective [28–30].
The above-mentioned literature used statistical techniques such as multiple regression or factoranalysis to analyze the application effects of D&M models in various industries. Certain researchersattempted to find causal relationships among the variables. The results showed that the conclusionswere more or less different when the D&M model was applied in different contexts. Most resultsindicated that system quality, service quality, and information quality had a positive influence on usersatisfaction and intention to use the system. However, the most significant factors affecting the usersatisfaction and the interrelationship among all dimensions and criteria are seldom discussed.
2.2. MCDM Models
The information system has become a common practice in various industries and organizations,and has helped to improve operational efficiency through the application of an information system.Many organizations have currently established their own information systems by outsourcing tothird-party companies, purchasing existing systems, or self-development. The question of how toevaluate the effectiveness and quality of an information system is a problem faced by users. In practice,the purchaser of an information system organizes experts to appraise the system quality. However,assessing the quality of the information systems requires multiple perspectives, and is a multicriteriadecision-making management problem. The MCDM method is a practical and academic methodologythat offers a systematic modeling framework and methodology under multiple measurement indicators.This method is used to simultaneously consider multiple criteria to supply a decision-makingoptimization and decision-making model for decision makers [31].
Thus far, a lack of research persists on the goal of integrating the interdependencies to improveinformation system performance. To identify the interrelationships among indicators of informationsystems, the DEMATEL approach is used to construct a network structure map with interdependentrelationships [32–35]. A hybrid MCDM model that combines DEMATEL and the ANP methods canshow the cause-and-effect relationships and also obtain the influence factors in systems. Therefore, thismethod was used to construct interdependent connections among indicators [36–39]. However, thesetwo methods often ignore the subjective defects of decision makers. As a result, updated models wereproposed by certain researchers. Bai and Sarkis [40] introduced a gray-based DEMATEL model thatcan be used to solve uncertainty problems for evaluating critical success factors in business processmanagement. The fuzzy-based DEMATEL method was proposed to evaluate green supply chainmanagement (SCM) [41,42]. Compared with gray and fuzzy technology, rough technology does notneed to assume a semantic scale. Rough DEMATEL establishes scales based on the values filled out byexperts. Therefore, the semantic scale of each question is not fixed. Song and Cao [43] proposed arough DEMATEL-based approach for assessing the internal relationship between requirements of theproduct–service system. This study adopts a flexible rough interval, which better reflects the subjectivejudgment and fuzzy judgment of decision makers and successfully adapts to DEMATEL in an uncertainenvironment. Pamucar et al. [44] defined a hybrid DEMATEL–ANP–Multi-Attributive Ideal-RealComparative Analysis (MAIRCA) model based on interval rough numbers to solve uncertainty in themulticriteria decision-making process, and this model showed high stability with respect to changes inthe nature and characteristics of the criteria.
Symmetry 2019, 11, 1248 5 of 21
2.3. Research Gaps
As a well-known model in the field of information systems, D&M is widely used in both theoreticaland practical fields. Most studies have focused on verifying the relevance and causality of the D&Mmodel dimensions in different domains from a statistical perspective. However, the question of how toimprove the quality of information systems has not been well resolved in theory and practice. As apowerful tool for decision-making in the field of decision management, MCDM can supply a scientificand rational strategy for improving the quality of information systems based on the D&M model. Thispaper offers ideas for studying the scientific nature of D&M from the perspective of managementscience. As discussed in the introduction, although selected researchers evaluated information byapplying the AHP, ANP, and DAMATEL methods, they seldom considered the ambiguity of theopinions from expert groups, and the D&M model was also rarely used in their papers. Based on theabove analysis, this study applies the rough DEEMATEL and the rough DANP methods to explore thenetwork relationship of the criteria and the weights of the criteria in the research information system.Based on the result of rough DANP, the COPRAS-R is used to assess the performance of a researchinformation system in China as a case study.
3. Methodology
In this section, we introduce the RMADM model that combines RDANP with COPRAS-R toestablish the interdependent structure, get the weights of dimensions and criteria, and assess theaspiration gap of alternative criteria. Schools can figure out the complex relationship betweeninformation system and the cause–effect within the service criteria through the derived roughinfluence-network relation map (RINRM). The obtained influential weights of the criteria and theRINRM can help schools and the information system set the improved priorities for bettering theschool information system in schools. The detailed procedures are illustrated as follows.
3.1. The Rough Number
The rough set theory was developed by Pawlak in 1982 [45] for solving a group of subjectiveand imprecise expert perceptions. Zhai et al. [46] used rough numbers, a set of interval values thatare clearly transformed from a crisp group, to show subjectivity and imprecise human thinking in amultiple-attribute decision-making (MADM) environment. Since the application of rough numbertheory to address decision problems does not require any auxiliary information, the theory is betterable to capture the perception of experts [47–49]. The detailed steps are as follows:
Step 1: Conform lower and upper approximations of rough number for each crisp scale.
U is a set of the universe that contains all the respondents with multi-attributes, and Θ is a set of zclass under respondents. R = z1, z2, . . . , zΘ are ordered in the manner of z1 < z2 < . . . < zΘ and Y isan arbitrary respondent of U. The lower approximation and upper approximation of zΘ can be definedas [46]:
Lower approximation:Apr(zΘ) = ∪
Y ∈ U/R(Y) ≤ zΘ
(1)
Upper approximation:Apr(zΘ) = ∪
Y ∈ U/R(Y) ≥ zΘ
(2)
Step 2: Compute the interval value of the rough number.
A group of expert opinions can be expressed by[Lim(zΘ), Lim(zΘ)
], which are derived by:
Lim(zΘ) =
∑ NLi=1xi
NL, Lim(zΘ) =
∑ NUi=1yi
NU(3)
Symmetry 2019, 11, 1248 6 of 21
where xi and yi are denoted the elements in the lower approximation or upper approximation of zΘ,respectively. In addition, NL and NU are represented the total number of respondents involved in thelower and upper approximations of zΘ, respectively.
Step 3: Drive operations for two rough numbers.
Through Equations (1)–(3), all the domain knowledge of experts can be converted into a set ofrough numbers, Υ(zΘ), as shown in Equation (4):
Symmetry 2019, 11, x FOR PEER REVIEW 6 of 21
where xi and yi are denoted the elements in the lower approximation or upper approximation of zΘ, respectively. In addition, NL and NU are represented the total number of respondents involved in the lower and upper approximations of zΘ, respectively.
Step 3: Drive operations for two rough numbers.
Through Equations (1)–(3), all the domain knowledge of experts can be converted into a set of rough numbers, Υ (zΘ), as shown in Equation (4):
( ) ( ) ( ), ,z z z Lim z Lim z∇ ΔΘ Θ Θ Θ Θ ϒ = = (4)
Assuming two rough numbers ( )αϒ and ( )βϒ and μ as a nonzero constant, the arithmetic operations of rough number can be followed by:
( ) ,α μ α μ α μ∇ ΔΘ Θ ϒ × = × × (5)
( ) ( ) ,α β α β α β∇ ∇ Δ ΔΘ Θ Θ Θ ϒ + ϒ = + + (6)
( ) ( ) ,α β α β α β∇ ∇ Δ ΔΘ Θ Θ Θ ϒ × ϒ = × × (7)
Step 4: Transfer into crisp value from rough interval value. When needing to compare analysis for criteria or alternatives ranking, the de-roughness of the rough number into a crisp value can be used by:
/ 2deRouz z z∇ ΔΘ Θ Θ = + (8)
3.2. The RDANP Method
The rough DEMATEL method is used to establish the rough interrelationship between factors and construct an INRM. The rough total influence relationship matrix is taken as the input of the rough DANP method, and the rough influence weights of the criteria are obtained. The DANP approach solves the unreasonable problem of assuming that each cluster has equal weight in the ANP method [38,50,51]. In addition, we also consider the ambiguity of the human domain knowledge in the real environment. The rough degrees of influence of each dimension can be obtained by the rough DEMATEL, and the rough DANP process can be applied to normalize the unweighted super matrix and obtain the rough influential weights of criteria. The detailed steps are as follows [52]:
Step 1: Build a rough original influence relationship matrix M on a measuring scale of 0–4 ranging from “no influence (0)” to “very high influential (4)”.
Using the aforementioned scale, k respondents are asked to judge the extent of the rough direct influence between two pairwise criteria, denoted by mij. We checked the consistency of the raw data, using the formula as follows:
The average gap-ratio in consensus (%) ( )
1
1 1
1 100%1
k km mij ij
siji j
d ddm m
−
= =
−= ∗ −
, where m is the
number of the criteria, k is the number of the expert, kijd is the average direct influence value of
criterion i to j. If the value of the average gap ratio in consensus is less than 0.05, we believe that the expert’s rating is consistent [48]. Then, the rough direct relation average matrix M is acquired through Equations (1)–(8) in the k matrices for the respondents. Finally, we can obtain a rough original influence relationship matrixM = [ ijm ]nxn = ,ij ij n n
m m∇ Δ
× , where is n the number of criteria.
Step 2: Obtain the rough initial influence relationship matrix P = [ ijp ]nxn, which is the multiplication of M and v.
(zΘ) =[z∇Θ, z∆
Θ
]=
[Lim(zΘ), Lim(zΘ)
](4)
Assuming two rough numbers
Symmetry 2019, 11, x FOR PEER REVIEW 6 of 21
where xi and yi are denoted the elements in the lower approximation or upper approximation of zΘ, respectively. In addition, NL and NU are represented the total number of respondents involved in the lower and upper approximations of zΘ, respectively.
Step 3: Drive operations for two rough numbers.
Through Equations (1)–(3), all the domain knowledge of experts can be converted into a set of rough numbers, Υ (zΘ), as shown in Equation (4):
( ) ( ) ( ), ,z z z Lim z Lim z∇ ΔΘ Θ Θ Θ Θ ϒ = = (4)
Assuming two rough numbers ( )αϒ and ( )βϒ and μ as a nonzero constant, the arithmetic operations of rough number can be followed by:
( ) ,α μ α μ α μ∇ ΔΘ Θ ϒ × = × × (5)
( ) ( ) ,α β α β α β∇ ∇ Δ ΔΘ Θ Θ Θ ϒ + ϒ = + + (6)
( ) ( ) ,α β α β α β∇ ∇ Δ ΔΘ Θ Θ Θ ϒ × ϒ = × × (7)
Step 4: Transfer into crisp value from rough interval value. When needing to compare analysis for criteria or alternatives ranking, the de-roughness of the rough number into a crisp value can be used by:
/ 2deRouz z z∇ ΔΘ Θ Θ = + (8)
3.2. The RDANP Method
The rough DEMATEL method is used to establish the rough interrelationship between factors and construct an INRM. The rough total influence relationship matrix is taken as the input of the rough DANP method, and the rough influence weights of the criteria are obtained. The DANP approach solves the unreasonable problem of assuming that each cluster has equal weight in the ANP method [38,50,51]. In addition, we also consider the ambiguity of the human domain knowledge in the real environment. The rough degrees of influence of each dimension can be obtained by the rough DEMATEL, and the rough DANP process can be applied to normalize the unweighted super matrix and obtain the rough influential weights of criteria. The detailed steps are as follows [52]:
Step 1: Build a rough original influence relationship matrix M on a measuring scale of 0–4 ranging from “no influence (0)” to “very high influential (4)”.
Using the aforementioned scale, k respondents are asked to judge the extent of the rough direct influence between two pairwise criteria, denoted by mij. We checked the consistency of the raw data, using the formula as follows:
The average gap-ratio in consensus (%) ( )
1
1 1
1 100%1
k km mij ij
siji j
d ddm m
−
= =
−= ∗ −
, where m is the
number of the criteria, k is the number of the expert, kijd is the average direct influence value of
criterion i to j. If the value of the average gap ratio in consensus is less than 0.05, we believe that the expert’s rating is consistent [48]. Then, the rough direct relation average matrix M is acquired through Equations (1)–(8) in the k matrices for the respondents. Finally, we can obtain a rough original influence relationship matrixM = [ ijm ]nxn = ,ij ij n n
m m∇ Δ
× , where is n the number of criteria.
Step 2: Obtain the rough initial influence relationship matrix P = [ ijp ]nxn, which is the multiplication of M and v.
(α) and
Symmetry 2019, 11, x FOR PEER REVIEW 6 of 21
where xi and yi are denoted the elements in the lower approximation or upper approximation of zΘ, respectively. In addition, NL and NU are represented the total number of respondents involved in the lower and upper approximations of zΘ, respectively.
Step 3: Drive operations for two rough numbers.
Through Equations (1)–(3), all the domain knowledge of experts can be converted into a set of rough numbers, Υ (zΘ), as shown in Equation (4):
( ) ( ) ( ), ,z z z Lim z Lim z∇ ΔΘ Θ Θ Θ Θ ϒ = = (4)
Assuming two rough numbers ( )αϒ and ( )βϒ and μ as a nonzero constant, the arithmetic operations of rough number can be followed by:
( ) ,α μ α μ α μ∇ ΔΘ Θ ϒ × = × × (5)
( ) ( ) ,α β α β α β∇ ∇ Δ ΔΘ Θ Θ Θ ϒ + ϒ = + + (6)
( ) ( ) ,α β α β α β∇ ∇ Δ ΔΘ Θ Θ Θ ϒ × ϒ = × × (7)
Step 4: Transfer into crisp value from rough interval value. When needing to compare analysis for criteria or alternatives ranking, the de-roughness of the rough number into a crisp value can be used by:
/ 2deRouz z z∇ ΔΘ Θ Θ = + (8)
3.2. The RDANP Method
The rough DEMATEL method is used to establish the rough interrelationship between factors and construct an INRM. The rough total influence relationship matrix is taken as the input of the rough DANP method, and the rough influence weights of the criteria are obtained. The DANP approach solves the unreasonable problem of assuming that each cluster has equal weight in the ANP method [38,50,51]. In addition, we also consider the ambiguity of the human domain knowledge in the real environment. The rough degrees of influence of each dimension can be obtained by the rough DEMATEL, and the rough DANP process can be applied to normalize the unweighted super matrix and obtain the rough influential weights of criteria. The detailed steps are as follows [52]:
Step 1: Build a rough original influence relationship matrix M on a measuring scale of 0–4 ranging from “no influence (0)” to “very high influential (4)”.
Using the aforementioned scale, k respondents are asked to judge the extent of the rough direct influence between two pairwise criteria, denoted by mij. We checked the consistency of the raw data, using the formula as follows:
The average gap-ratio in consensus (%) ( )
1
1 1
1 100%1
k km mij ij
siji j
d ddm m
−
= =
−= ∗ −
, where m is the
number of the criteria, k is the number of the expert, kijd is the average direct influence value of
criterion i to j. If the value of the average gap ratio in consensus is less than 0.05, we believe that the expert’s rating is consistent [48]. Then, the rough direct relation average matrix M is acquired through Equations (1)–(8) in the k matrices for the respondents. Finally, we can obtain a rough original influence relationship matrixM = [ ijm ]nxn = ,ij ij n n
m m∇ Δ
× , where is n the number of criteria.
Step 2: Obtain the rough initial influence relationship matrix P = [ ijp ]nxn, which is the multiplication of M and v.
(β) and µ as a nonzero constant, the arithmeticoperations of rough number can be followed by:
Symmetry 2019, 11, x FOR PEER REVIEW 6 of 21
where xi and yi are denoted the elements in the lower approximation or upper approximation of zΘ, respectively. In addition, NL and NU are represented the total number of respondents involved in the lower and upper approximations of zΘ, respectively.
Step 3: Drive operations for two rough numbers.
Through Equations (1)–(3), all the domain knowledge of experts can be converted into a set of rough numbers, Υ (zΘ), as shown in Equation (4):
( ) ( ) ( ), ,z z z Lim z Lim z∇ ΔΘ Θ Θ Θ Θ ϒ = = (4)
Assuming two rough numbers ( )αϒ and ( )βϒ and μ as a nonzero constant, the arithmetic operations of rough number can be followed by:
( ) ,α μ α μ α μ∇ ΔΘ Θ ϒ × = × × (5)
( ) ( ) ,α β α β α β∇ ∇ Δ ΔΘ Θ Θ Θ ϒ + ϒ = + + (6)
( ) ( ) ,α β α β α β∇ ∇ Δ ΔΘ Θ Θ Θ ϒ × ϒ = × × (7)
Step 4: Transfer into crisp value from rough interval value. When needing to compare analysis for criteria or alternatives ranking, the de-roughness of the rough number into a crisp value can be used by:
/ 2deRouz z z∇ ΔΘ Θ Θ = + (8)
3.2. The RDANP Method
The rough DEMATEL method is used to establish the rough interrelationship between factors and construct an INRM. The rough total influence relationship matrix is taken as the input of the rough DANP method, and the rough influence weights of the criteria are obtained. The DANP approach solves the unreasonable problem of assuming that each cluster has equal weight in the ANP method [38,50,51]. In addition, we also consider the ambiguity of the human domain knowledge in the real environment. The rough degrees of influence of each dimension can be obtained by the rough DEMATEL, and the rough DANP process can be applied to normalize the unweighted super matrix and obtain the rough influential weights of criteria. The detailed steps are as follows [52]:
Step 1: Build a rough original influence relationship matrix M on a measuring scale of 0–4 ranging from “no influence (0)” to “very high influential (4)”.
Using the aforementioned scale, k respondents are asked to judge the extent of the rough direct influence between two pairwise criteria, denoted by mij. We checked the consistency of the raw data, using the formula as follows:
The average gap-ratio in consensus (%) ( )
1
1 1
1 100%1
k km mij ij
siji j
d ddm m
−
= =
−= ∗ −
, where m is the
number of the criteria, k is the number of the expert, kijd is the average direct influence value of
criterion i to j. If the value of the average gap ratio in consensus is less than 0.05, we believe that the expert’s rating is consistent [48]. Then, the rough direct relation average matrix M is acquired through Equations (1)–(8) in the k matrices for the respondents. Finally, we can obtain a rough original influence relationship matrixM = [ ijm ]nxn = ,ij ij n n
m m∇ Δ
× , where is n the number of criteria.
Step 2: Obtain the rough initial influence relationship matrix P = [ ijp ]nxn, which is the multiplication of M and v.
(α) × µ =
[α∇Θ × µ,α∆
Θ × µ
](5)
Symmetry 2019, 11, x FOR PEER REVIEW 6 of 21
where xi and yi are denoted the elements in the lower approximation or upper approximation of zΘ, respectively. In addition, NL and NU are represented the total number of respondents involved in the lower and upper approximations of zΘ, respectively.
Step 3: Drive operations for two rough numbers.
Through Equations (1)–(3), all the domain knowledge of experts can be converted into a set of rough numbers, Υ (zΘ), as shown in Equation (4):
( ) ( ) ( ), ,z z z Lim z Lim z∇ ΔΘ Θ Θ Θ Θ ϒ = = (4)
Assuming two rough numbers ( )αϒ and ( )βϒ and μ as a nonzero constant, the arithmetic operations of rough number can be followed by:
( ) ,α μ α μ α μ∇ ΔΘ Θ ϒ × = × × (5)
( ) ( ) ,α β α β α β∇ ∇ Δ ΔΘ Θ Θ Θ ϒ + ϒ = + + (6)
( ) ( ) ,α β α β α β∇ ∇ Δ ΔΘ Θ Θ Θ ϒ × ϒ = × × (7)
Step 4: Transfer into crisp value from rough interval value. When needing to compare analysis for criteria or alternatives ranking, the de-roughness of the rough number into a crisp value can be used by:
/ 2deRouz z z∇ ΔΘ Θ Θ = + (8)
3.2. The RDANP Method
The rough DEMATEL method is used to establish the rough interrelationship between factors and construct an INRM. The rough total influence relationship matrix is taken as the input of the rough DANP method, and the rough influence weights of the criteria are obtained. The DANP approach solves the unreasonable problem of assuming that each cluster has equal weight in the ANP method [38,50,51]. In addition, we also consider the ambiguity of the human domain knowledge in the real environment. The rough degrees of influence of each dimension can be obtained by the rough DEMATEL, and the rough DANP process can be applied to normalize the unweighted super matrix and obtain the rough influential weights of criteria. The detailed steps are as follows [52]:
Step 1: Build a rough original influence relationship matrix M on a measuring scale of 0–4 ranging from “no influence (0)” to “very high influential (4)”.
Using the aforementioned scale, k respondents are asked to judge the extent of the rough direct influence between two pairwise criteria, denoted by mij. We checked the consistency of the raw data, using the formula as follows:
The average gap-ratio in consensus (%) ( )
1
1 1
1 100%1
k km mij ij
siji j
d ddm m
−
= =
−= ∗ −
, where m is the
number of the criteria, k is the number of the expert, kijd is the average direct influence value of
criterion i to j. If the value of the average gap ratio in consensus is less than 0.05, we believe that the expert’s rating is consistent [48]. Then, the rough direct relation average matrix M is acquired through Equations (1)–(8) in the k matrices for the respondents. Finally, we can obtain a rough original influence relationship matrixM = [ ijm ]nxn = ,ij ij n n
m m∇ Δ
× , where is n the number of criteria.
Step 2: Obtain the rough initial influence relationship matrix P = [ ijp ]nxn, which is the multiplication of M and v.
(α) +
Symmetry 2019, 11, x FOR PEER REVIEW 6 of 21
where xi and yi are denoted the elements in the lower approximation or upper approximation of zΘ, respectively. In addition, NL and NU are represented the total number of respondents involved in the lower and upper approximations of zΘ, respectively.
Step 3: Drive operations for two rough numbers.
Through Equations (1)–(3), all the domain knowledge of experts can be converted into a set of rough numbers, Υ (zΘ), as shown in Equation (4):
( ) ( ) ( ), ,z z z Lim z Lim z∇ ΔΘ Θ Θ Θ Θ ϒ = = (4)
Assuming two rough numbers ( )αϒ and ( )βϒ and μ as a nonzero constant, the arithmetic operations of rough number can be followed by:
( ) ,α μ α μ α μ∇ ΔΘ Θ ϒ × = × × (5)
( ) ( ) ,α β α β α β∇ ∇ Δ ΔΘ Θ Θ Θ ϒ + ϒ = + + (6)
( ) ( ) ,α β α β α β∇ ∇ Δ ΔΘ Θ Θ Θ ϒ × ϒ = × × (7)
Step 4: Transfer into crisp value from rough interval value. When needing to compare analysis for criteria or alternatives ranking, the de-roughness of the rough number into a crisp value can be used by:
/ 2deRouz z z∇ ΔΘ Θ Θ = + (8)
3.2. The RDANP Method
The rough DEMATEL method is used to establish the rough interrelationship between factors and construct an INRM. The rough total influence relationship matrix is taken as the input of the rough DANP method, and the rough influence weights of the criteria are obtained. The DANP approach solves the unreasonable problem of assuming that each cluster has equal weight in the ANP method [38,50,51]. In addition, we also consider the ambiguity of the human domain knowledge in the real environment. The rough degrees of influence of each dimension can be obtained by the rough DEMATEL, and the rough DANP process can be applied to normalize the unweighted super matrix and obtain the rough influential weights of criteria. The detailed steps are as follows [52]:
Step 1: Build a rough original influence relationship matrix M on a measuring scale of 0–4 ranging from “no influence (0)” to “very high influential (4)”.
Using the aforementioned scale, k respondents are asked to judge the extent of the rough direct influence between two pairwise criteria, denoted by mij. We checked the consistency of the raw data, using the formula as follows:
The average gap-ratio in consensus (%) ( )
1
1 1
1 100%1
k km mij ij
siji j
d ddm m
−
= =
−= ∗ −
, where m is the
number of the criteria, k is the number of the expert, kijd is the average direct influence value of
criterion i to j. If the value of the average gap ratio in consensus is less than 0.05, we believe that the expert’s rating is consistent [48]. Then, the rough direct relation average matrix M is acquired through Equations (1)–(8) in the k matrices for the respondents. Finally, we can obtain a rough original influence relationship matrixM = [ ijm ]nxn = ,ij ij n n
m m∇ Δ
× , where is n the number of criteria.
Step 2: Obtain the rough initial influence relationship matrix P = [ ijp ]nxn, which is the multiplication of M and v.
(β) =[α∇Θ + β∇Θ,α∆
Θ + β∆Θ
](6)
Symmetry 2019, 11, x FOR PEER REVIEW 6 of 21
where xi and yi are denoted the elements in the lower approximation or upper approximation of zΘ, respectively. In addition, NL and NU are represented the total number of respondents involved in the lower and upper approximations of zΘ, respectively.
Step 3: Drive operations for two rough numbers.
Through Equations (1)–(3), all the domain knowledge of experts can be converted into a set of rough numbers, Υ (zΘ), as shown in Equation (4):
( ) ( ) ( ), ,z z z Lim z Lim z∇ ΔΘ Θ Θ Θ Θ ϒ = = (4)
Assuming two rough numbers ( )αϒ and ( )βϒ and μ as a nonzero constant, the arithmetic operations of rough number can be followed by:
( ) ,α μ α μ α μ∇ ΔΘ Θ ϒ × = × × (5)
( ) ( ) ,α β α β α β∇ ∇ Δ ΔΘ Θ Θ Θ ϒ + ϒ = + + (6)
( ) ( ) ,α β α β α β∇ ∇ Δ ΔΘ Θ Θ Θ ϒ × ϒ = × × (7)
Step 4: Transfer into crisp value from rough interval value. When needing to compare analysis for criteria or alternatives ranking, the de-roughness of the rough number into a crisp value can be used by:
/ 2deRouz z z∇ ΔΘ Θ Θ = + (8)
3.2. The RDANP Method
The rough DEMATEL method is used to establish the rough interrelationship between factors and construct an INRM. The rough total influence relationship matrix is taken as the input of the rough DANP method, and the rough influence weights of the criteria are obtained. The DANP approach solves the unreasonable problem of assuming that each cluster has equal weight in the ANP method [38,50,51]. In addition, we also consider the ambiguity of the human domain knowledge in the real environment. The rough degrees of influence of each dimension can be obtained by the rough DEMATEL, and the rough DANP process can be applied to normalize the unweighted super matrix and obtain the rough influential weights of criteria. The detailed steps are as follows [52]:
Step 1: Build a rough original influence relationship matrix M on a measuring scale of 0–4 ranging from “no influence (0)” to “very high influential (4)”.
Using the aforementioned scale, k respondents are asked to judge the extent of the rough direct influence between two pairwise criteria, denoted by mij. We checked the consistency of the raw data, using the formula as follows:
The average gap-ratio in consensus (%) ( )
1
1 1
1 100%1
k km mij ij
siji j
d ddm m
−
= =
−= ∗ −
, where m is the
number of the criteria, k is the number of the expert, kijd is the average direct influence value of
criterion i to j. If the value of the average gap ratio in consensus is less than 0.05, we believe that the expert’s rating is consistent [48]. Then, the rough direct relation average matrix M is acquired through Equations (1)–(8) in the k matrices for the respondents. Finally, we can obtain a rough original influence relationship matrixM = [ ijm ]nxn = ,ij ij n n
m m∇ Δ
× , where is n the number of criteria.
Step 2: Obtain the rough initial influence relationship matrix P = [ ijp ]nxn, which is the multiplication of M and v.
(α) ×
Symmetry 2019, 11, x FOR PEER REVIEW 6 of 21
where xi and yi are denoted the elements in the lower approximation or upper approximation of zΘ, respectively. In addition, NL and NU are represented the total number of respondents involved in the lower and upper approximations of zΘ, respectively.
Step 3: Drive operations for two rough numbers.
Through Equations (1)–(3), all the domain knowledge of experts can be converted into a set of rough numbers, Υ (zΘ), as shown in Equation (4):
( ) ( ) ( ), ,z z z Lim z Lim z∇ ΔΘ Θ Θ Θ Θ ϒ = = (4)
Assuming two rough numbers ( )αϒ and ( )βϒ and μ as a nonzero constant, the arithmetic operations of rough number can be followed by:
( ) ,α μ α μ α μ∇ ΔΘ Θ ϒ × = × × (5)
( ) ( ) ,α β α β α β∇ ∇ Δ ΔΘ Θ Θ Θ ϒ + ϒ = + + (6)
( ) ( ) ,α β α β α β∇ ∇ Δ ΔΘ Θ Θ Θ ϒ × ϒ = × × (7)
Step 4: Transfer into crisp value from rough interval value. When needing to compare analysis for criteria or alternatives ranking, the de-roughness of the rough number into a crisp value can be used by:
/ 2deRouz z z∇ ΔΘ Θ Θ = + (8)
3.2. The RDANP Method
The rough DEMATEL method is used to establish the rough interrelationship between factors and construct an INRM. The rough total influence relationship matrix is taken as the input of the rough DANP method, and the rough influence weights of the criteria are obtained. The DANP approach solves the unreasonable problem of assuming that each cluster has equal weight in the ANP method [38,50,51]. In addition, we also consider the ambiguity of the human domain knowledge in the real environment. The rough degrees of influence of each dimension can be obtained by the rough DEMATEL, and the rough DANP process can be applied to normalize the unweighted super matrix and obtain the rough influential weights of criteria. The detailed steps are as follows [52]:
Step 1: Build a rough original influence relationship matrix M on a measuring scale of 0–4 ranging from “no influence (0)” to “very high influential (4)”.
Using the aforementioned scale, k respondents are asked to judge the extent of the rough direct influence between two pairwise criteria, denoted by mij. We checked the consistency of the raw data, using the formula as follows:
The average gap-ratio in consensus (%) ( )
1
1 1
1 100%1
k km mij ij
siji j
d ddm m
−
= =
−= ∗ −
, where m is the
number of the criteria, k is the number of the expert, kijd is the average direct influence value of
criterion i to j. If the value of the average gap ratio in consensus is less than 0.05, we believe that the expert’s rating is consistent [48]. Then, the rough direct relation average matrix M is acquired through Equations (1)–(8) in the k matrices for the respondents. Finally, we can obtain a rough original influence relationship matrixM = [ ijm ]nxn = ,ij ij n n
m m∇ Δ
× , where is n the number of criteria.
Step 2: Obtain the rough initial influence relationship matrix P = [ ijp ]nxn, which is the multiplication of M and v.
(β) =[α∇Θ × β
∇
Θ,α∆Θ × β
∆Θ
](7)
Step 4: Transfer into crisp value from rough interval value. When needing to compare analysis for criteria oralternatives ranking, the de-roughness of the rough number into a crisp value can be used by:
zdeRouΘ =
[z∇Θ + z∆
Θ
]/2 (8)
3.2. The RDANP Method
The rough DEMATEL method is used to establish the rough interrelationship between factorsand construct an INRM. The rough total influence relationship matrix is taken as the input of therough DANP method, and the rough influence weights of the criteria are obtained. The DANPapproach solves the unreasonable problem of assuming that each cluster has equal weight in the ANPmethod [38,50,51]. In addition, we also consider the ambiguity of the human domain knowledge inthe real environment. The rough degrees of influence of each dimension can be obtained by the roughDEMATEL, and the rough DANP process can be applied to normalize the unweighted super matrixand obtain the rough influential weights of criteria. The detailed steps are as follows [52]:
Step 1: Build a rough original influence relationship matrix M on a measuring scale of 0–4 ranging from “noinfluence (0)” to “very high influential (4)”.
Using the aforementioned scale, k respondents are asked to judge the extent of the rough directinfluence between two pairwise criteria, denoted by mij. We checked the consistency of the raw data,using the formula as follows:
The average gap-ratio in consensus (%) = 1m(m−1)
m∑i=1
m∑j=1
∣∣∣∣dk
i j−dk−1i j
∣∣∣∣ds
i j
∗ 100%, where m is the number
of the criteria, k is the number of the expert, dki j is the average direct influence value of criterion i to j. If
the value of the average gap ratio in consensus is less than 0.05, we believe that the expert’s rating isconsistent [48]. Then, the rough direct relation average matrix M is acquired through Equations (1)–(8)in the k matrices for the respondents. Finally, we can obtain a rough original influence relationship
matrix M = [mi j]nxn =[m∇i j, m∆
i j
]n×n
, where is n the number of criteria.
Step 2: Obtain the rough initial influence relationship matrix P = [pi j]nxn, which is the multiplication of M andv.
P = v×M (9)

Symmetry 2019, 11, 1248 7 of 21
v = min[
1max
i
∑nj
∣∣∣∣muij
∣∣∣∣ , 1max
j
∑ni
∣∣∣∣muij
∣∣∣∣]
(10)
Step 3: Calculate the rough total influence relationship matrix T with Equation (11). The element ti j indicatesthe rough interdependent effects that criteria i has on criteria j, where I is an identity matrix.
T = P + P2+ · · ·+ P
Ω= P(I−P)
−1when Ω→∞ (11)
Step 4: Derive each column sum (ci) and row sum (ri) from the rough total influence relationship matrix T asfollows:
c j =(c j)1×n
=(c j)′n×1
=
n∑i=1
ti j
′ (12)
ri = (ri)n×1 =
n∑j=1
ti j
(13)
The element c j denotes the rough total effects by criterion j, from the other criteria. Similarly, rirepresents the rough direct and indirect effects of criterion i on the other criteria.
Step 5: Get the RINRM for whole evaluation model.
Thus, ri + c j reflects the strength of the influences given and received on criterion i, while ri − c jshows the net effect of criterion i on the other criteria. Clearly, if ri − c j is positive, criterion i is a causalcomponent, and if ri − c j is negative, then criterion i is an affected component. As a result, the roughinfluence network relationship map (RINRM) can be finished by mapping the data set (ri + c j,ri − c j).
Step 6: Derive rough total influence relationship matrix TC based on the criteria and TD based on the dimensions.
The rough matrix T could be differentiated into TC based on the criterion and TD based on thedimensions. The matrix TC modularizes the matrix T according to the dimensions, which are essentiallythe same matrix. The rough matrix TD is found by averaging the rough degree of criterion influence ineach dimension. As shown in Equation (14), Di denotes the ith dimension; cij denotes the jth criteria in
the ith dimension. For example, we get a crisp value by averaging Tmnc , where T
mnc means the extent to
which the criteria in the mth dimension affect the criteria in the nth dimension. Then, we get the TD byaveraging the T
mnc in the TC.
Symmetry 2019, 11, x FOR PEER REVIEW 7 of 21
v= ×P M (9)
1 1min ,max maxn nu u
ij ijj ii j
vm m
=
(10)
Step 3: Calculate the rough total influence relationship matrix T with Equation (11). The element ijt indicates the rough interdependent effects that criteria i has on criteria j, where I is an identity matrix.
2 1( )Ω −= + + + = −T P P P P Ι P when Ω→∞ (11)
Step 4: Derive each column sum ( ic ) and row sum ( ir ) from the rough total influence relationship matrix T as follows:
( ) ( )'
'
1 1 1
n
j j j ijn n i
c c c t× × =
= = = (12)
( )1 1
n
i i ijn j
r r t× =
= =
(13)
The element jc denotes the rough total effects by criterion j, from the other criteria. Similarly, ir represents the rough direct and indirect effects of criterion i on the other criteria.
Step 5: Get the RINRM for whole evaluation model.
Thus, i jr c+ reflects the strength of the influences given and received on criterion i, while i jr c− shows the net effect of criterion i on the other criteria. Clearly, if i jr c− is positive, criterion
i is a causal component, and if i jr c− is negative, then criterion i is an affected component. As a result, the rough influence network relationship map (RINRM) can be finished by mapping the data set ( i jr c+ , i jr c− ).
Step 6: Derive rough total influence relationship matrix CT based on the criteria and DT based on the dimensions.
The rough matrix T could be differentiated into CT based on the criterion and DT based on the dimensions. The matrix CT modularizes the matrix T according to the dimensions, which are essentially the same matrix. The rough matrix DT is found by averaging the rough degree of criterion influence in each dimension. As shown in Equation (14), Di denotes the ith dimension; cij denotes the jth criteria in the ith dimension. For example, we get a crisp value by averaging mn
cT , where mn
cT means the extent to which the criteria in the mth dimension affect the criteria in the nth dimension. Then, we get the DT by averaging the mn
cT in the CT .
1 211 1 21 2 11 2
1112
11 12122
22 2
12
11 12 1
21 22 2
1 2c
,
C C C C C CD D Dnm m n nmn
CC
DC mCC
DC m
CnDn Cn
Cnmn
nc c c
nc c c
C C C
n n nnc c
∇ Δ
= =
T T T
T T TT T T
T T T
(14)
Step 7: Obtain the rough unweighted supermatrix.
We get a rough matrix CδT by normalizing CT .
(14)
Step 7: Obtain the rough unweighted supermatrix.

Symmetry 2019, 11, 1248 8 of 21
We get a rough matrix TδC by normalizing TC.
Symmetry 2019, 11, x FOR PEER REVIEW 8 of 21
1 211 1 21 2 11 2
1112
1 1 12122
22 2
12
11 12 1
21 22 2
1 2
,
C C C C C CD D Dnm m n nmn
CC
DC mCC
DC m
CnDn Cn
Cnmn
nc c c
nc c c
C C C
n n nnc c c
δ δ δ
δ δ δδ δ δ
δ δ δ
∇ Δ
= =
T T T
T T TT T T
T T T
(15)
For example, CδΔT , which is a rough submatrix of C
δT , can be normalized to pq
CδΔT , as follows:
1
11 1 11
11
1
q
q
q
q
pp p p q
q qj qmpq pq pq
j mp
mpq pq pq pq pq pq
pic i ij im i ijj
pq pq pqpmm m j m m
c c ct t tc
c t t t t t
c t t t
Δ Δ Δ
Δ Δ Δ Δ Δ Δ
=
Δ Δ Δ
= =
→
T (16)
1
1111
1 1 111 1 11
1
1
q
q
q
q
p
p p p q
p p p
q qj qmpqpqpqmj
pq pq pqpq pq
j mp
pqpqpqimpq iji
pi pq pq pqCi i i
pm pq pq pqm m j m m
pq pq pqm m m
c c cttt
t t t t t tc
tttct t t
ct t t
t t t
δ δ δ
δ
ΔΔΔ
Δ Δ ΔΔ Δ Δ
ΔΔΔΔ
Δ Δ Δ
Δ Δ Δ
Δ Δ Δ
= =
T 1
1
q
p p p q
pq
pq pq pqi ij im
pq pq pqm m j m m
t t t
t t t
δ δ δ
δ δ δ
Δ Δ Δ
Δ Δ Δ
(17)
The rough unweighted supermatrix W is transposed from rough matrix CδT , as shown in
Equation (18).
( )
1 211 1 21 2 11 2
1112
11 12122
22 2
12
11 12 1
'21 22 2
1 2
C C C C C CD D Dnm m n nmn
CC
DC mCC
DC m
CnDn Cn
Cnmn
n
nCC
n n nn
δ
= =
W W W
W W WW T
W W W
(18)
Step 8: Derive the rough weighted supermatrix.
Referring to step 5, we can get rough matrix ,D D∇ Δ = DT T T by averaging the degree of the
criterion influence in each dimension, such as [ ]nmD DtΔ Δ=T , which is derived by Equations (19)–(21).
1 1
n mi jnmD dij
i j
n m
t t
i j
Δ Δ
= =
=
×
(19)
where in is the number of criteria in dimension n; and jm is the number of criteria in the dimension m.
(15)
For example, Tδ∆C , which is a rough submatrix of T
δC, can be normalized to Tδ∆pq
C , as follows:
cq1 · · · cqj · · · cqmq
T∆pqc =
cp1...
cpi...
cpmp
t∆pq11 · · · t
∆pq1 j · · · t
∆pq1mq
.........
t∆pqi1 · · · t
∆pqi j · · · t
∆pqimq
.........
t∆pqmp1 · · · t
∆pqmp j · · · t
∆pqmpmq
→ t∆pq
i =mq∑j=1
t∆pqi j
(16)
cq1 · · · cqj · · · cqmq
Tδ∆pqC =
cp1...
cpi...
cpmp
t∆pq11
t∆pq1
· · ·t∆pq1 j
t∆pq1
· · ·
t∆pq1mq
t∆pq1
...... ...
t∆pqi1
t∆pqi
· · ·t∆pqi j
t∆pqi
· · ·
t∆pqimq
t∆pqi
...t∆pqmp1
t∆pqmp
· · ·
...t∆pqmp j
t∆pqmp
· · ·
...t∆pqmpmq
t∆pqmp
=
tδ∆pq11 · · · tδ∆pq
1 j· · · tδ∆pq
1mq...
... ...
tδ∆pqi1 · · · tδ∆pq
i j· · · tδ∆pq
imq...
tδ∆pqmp1
· · ·
...tδ∆pqmp j
· · ·
...tδ∆pqmpmq
(17)
The rough unweighted supermatrix W is transposed from rough matrix TδC, as shown in Equation
(18).
Symmetry 2019, 11, x FOR PEER REVIEW 8 of 21
1 211 1 21 2 11 2
1112
1 1 12122
22 2
12
11 12 1
21 22 2
1 2
,
C C C C C CD D Dnm m n nmn
CC
DC mCC
DC m
CnDn Cn
Cnmn
nc c c
nc c c
C C C
n n nnc c c
δ δ δ
δ δ δδ δ δ
δ δ δ
∇ Δ
= =
T T T
T T TT T T
T T T
(15)
For example, CδΔT , which is a rough submatrix of C
δT , can be normalized to pq
CδΔT , as follows:
1
11 1 11
11
1
q
q
q
q
pp p p q
q qj qmpq pq pq
j mp
mpq pq pq pq pq pq
pic i ij im i ijj
pq pq pqpmm m j m m
c c ct t tc
c t t t t t
c t t t
Δ Δ Δ
Δ Δ Δ Δ Δ Δ
=
Δ Δ Δ
= =
→
T (16)
1
1111
1 1 111 1 11
1
1
q
q
q
q
p
p p p q
p p p
q qj qmpqpqpqmj
pq pq pqpq pq
j mp
pqpqpqimpq iji
pi pq pq pqCi i i
pm pq pq pqm m j m m
pq pq pqm m m
c c cttt
t t t t t tc
tttct t t
ct t t
t t t
δ δ δ
δ
ΔΔΔ
Δ Δ ΔΔ Δ Δ
ΔΔΔΔ
Δ Δ Δ
Δ Δ Δ
Δ Δ Δ
= =
T 1
1
q
p p p q
pq
pq pq pqi ij im
pq pq pqm m j m m
t t t
t t t
δ δ δ
δ δ δ
Δ Δ Δ
Δ Δ Δ
(17)
The rough unweighted supermatrix W is transposed from rough matrix CδT , as shown in
Equation (18).
( )
1 211 1 21 2 11 2
1112
11 12122
22 2
12
11 12 1
'21 22 2
1 2
C C C C C CD D Dnm m n nmn
CC
DC mCC
DC m
CnDn Cn
Cnmn
n
nCC
n n nn
δ
= =
W W W
W W WW T
W W W
(18)
Step 8: Derive the rough weighted supermatrix.
Referring to step 5, we can get rough matrix ,D D∇ Δ = DT T T by averaging the degree of the
criterion influence in each dimension, such as [ ]nmD DtΔ Δ=T , which is derived by Equations (19)–(21).
1 1
n mi jnmD dij
i j
n m
t t
i j
Δ Δ
= =
=
×
(19)
where in is the number of criteria in dimension n; and jm is the number of criteria in the dimension m.
(18)
Step 8: Derive the rough weighted supermatrix.
Referring to step 5, we can get rough matrix TD =[T∇D, T∆
D
]by averaging the degree of the criterion
influence in each dimension, such as T∆D = [t∆nm
D ], which is derived by Equations (19)–(21).
t∆nmD =
in∑i=1
jm∑j=1
t∆dij
in × jm(19)

Symmetry 2019, 11, 1248 9 of 21
where in is the number of criteria in dimension n; and jm is the number of criteria in the dimension m.
T∆D =
t∆11D t∆12
D · · · t∆1nD
t∆21D t∆22
D · · · t∆2nD
......
...t∆n1D t∆n2
D · · · t∆nnD
→ δ∆
2 =n∑
j=1t∆2 jD (20)
W∆D =
(Tδ∆
D
)′=
t∆11Dδ∆
1
t∆12Dδ∆
1· · ·
t∆1nDδ∆
1t∆21Dδ∆
2
t∆22Dδ∆
2· · ·
t∆2nDδ∆
2...
......
...t∆n1Dδ∆
n
t∆n2Dδ∆
n· · ·
t∆nnDδ∆
n
=
tδ∆11D tδ∆12
D · · · tδ∆1nD
tδ∆21D tδ∆22
D · · · tδ∆2nD
......
......
tδ∆n1D tδ∆n2
D · · · tδ∆nnD
(21)
Then, we can obtain the rough weighted supermatrix Wδ =[W∇δ , W∆
δ
]by multiplying the
unweighted supermatrix WC =[W∇C, W∆
C
]with WD =
[W∇D, W∆
D
], such as W∆
δ , which is shown inEquation (22).
W∆δ = W∆
D ×W∆C =
w∆11
D ×W∆11C w∆12
D ×W∆12C · · · w∆1n
D ×W∆1nC
w∆21D ×W∆21
C w∆22D ×W∆22
C · · · w∆2nD ×W∆2n
C...
......
w∆n1D ×W∆n1
C w∆n2D ×W∆n2
C w∆n3D ×W∆n3
C w∆nnD ×W∆nn
C
(22)
Step 9: Obtain the rough influential weights.
Limit the rough weighted super matrix Wδ by Equation (23) until the super matrix has converged andbecome stable.
W∗ = limλ→∞
(Wδ)λ
(23)
3.3. The COPRAS-R Method with Aspiration Level
Zavadskas et al. [53] proposed the COPRAS model in 1994, and this approach was used to solvethe most appropriate alternative evaluation and selection problems [54,55]. To solve the uncertainty ofinformation and characteristics in the performance data, a hybrid model combined the COPRAS withthe gray system, and the model known as COPRAS-G was applied to evaluate the performance ofalternatives [54,56]. However, the COPRAS-G adopted the “max–min” concept to set the “best–worst”for each attribute. That approach cannot replay the evaluation situation of the attributes in thealternatives, especially the best solution among all alternatives. Thus, Liou et al. [57] combined theconcept of aspiration level to address this defect in the original method. However, the uncertaintydegree of the gray number is defined based on the assumption [58]. To avoid this assumption, thisstudy integrates the rough set theory and COPRAS method to construct the COPRAS-R model, whichis used to establish the rough relative gap between the current levels and aspirational levels. Thedetailed steps of are as follows:
Step 1: Build a rough decision matrix.
Experts give a score on each criterion of alternatives, ranging from 0 (very dissatisfied) to 100
(very satisfied) by the questionnaire. The rough decision matrix Q =[qsj
]o×n
=[q∇sj, q∆
sj
]o×n
is obtained
from the scores of alternatives by using Equations (1)–(8), in which q∇sj and q∆sj respectively are the
lower and upper limits for the sth alternative respective to the jth criterion.

Symmetry 2019, 11, 1248 10 of 21
Step 2: Obtain an aspirated rough decision matrix.
Over the whole evaluation process, we clearly understand the limits of a scale i.e., “very dissatisfied(0)” to “very satisfied (100)”. For helping each alternative to catch the real gaps on each criterion, in thisstep, we combined an aspiration-level concept into the COPRAS-R method. That is, the positive andnegative points are setting the 100 and 0, respectively. The normalized level is shown in Equation (24):
B =[bsj
]=
[b∇sj, b∆
sj
], s = 1, 2, . . . , o; j = 1, 2, . . . , n
b∇sj =q∇sj
q∆aspirej −q∆worst
j
, b∆sj =
q∆sj
q∆aspirej −q∆worst
j
, q∆aspirej = 100; q∆worst
j = 0(24)
Step 3: Calculate the rough proximity degree of gray relation.
In the step, we can use Equations (25) and (26) to compute the rough proximity degree between thecurrent level and aspiration level for alternatives.
γ(b∆aspirej , b∇sj) =
mins
minj
∣∣∣∣∣∣b∆aspirej − b∇sj
∣∣∣∣∣∣+ζmaxs
maxj
∣∣∣∣∣∣b∆aspirej − b∇sj
∣∣∣∣∣∣∣∣∣∣∣∣b∆aspirej − b∇sj
∣∣∣∣∣∣+ζmaxs
maxj
∣∣∣∣∣∣b∆aspirej − b∇sj
∣∣∣∣∣∣(25)
γ(b∆aspirej , b∆
sj) =
mins
minj
∣∣∣∣∣∣b∆aspirej − b∆
sj
∣∣∣∣∣∣+ζmaxs
maxj
∣∣∣∣∣∣b∆aspirej − b∆
sj
∣∣∣∣∣∣∣∣∣∣∣∣b∆aspirej − b∆
sj
∣∣∣∣∣∣+ζmaxs
maxj
∣∣∣∣∣∣b∆aspirej − b∆
sj
∣∣∣∣∣∣(26)
where ζ is the adjusted coefficient (generally, the setting is 0.5) and the rough proximity degree
of gray relation γ((b∆aspirej , b∇sj); (b
∆aspirej , b∆
sj)) =n∑
j=1w j(γ(b
∆aspirej , b∇sj);γ(b
∆aspirej , b∆
sj)) can be divided
γ(b∆aspire, b∆s ) =
n∑j=1
w jγ(b∆aspirej , b∆
sj) and γ(b∆aspire, b∆s ) =
n∑j=1
w jγ(b∆aspirej , b∆
sj), and aspiration levels of
b∆aspire and b∆aspirej are all equal to 1 [59]. Also, the wj is obtained from Equation (23).
Step 4: Integrate the aspirated proximity index.
The aspirated proximity index Hs represents the de-roughness degree of satisfaction on each criterionfor alternative s. The relative proximity Hs of the criteria are calculated as shown in Equation (27):
Hs =12(γ(b∆aspire, b∇s ) + γ(b∆aspire, b∆
s )) (27)
Step 5: Calculate the utility ratio for each alternative.
For each alternative, we can use Equation (28) to obtain the utility degree between Aaspireds relative
significance and aspiration level, where B∆aspire is the aspired alternative. The computation is shown inEquation (28):
Aaspireds =
Hs
B∆aspire × 100% (28)
4. Case Study
In this section, we apply the proposed hybrid model that combines RDANP with COPRAS-R toassess the performance of a research information system in a university in China, namely, Xiamen

Symmetry 2019, 11, 1248 11 of 21
University of Technology (XMUT). We take XMUT as a case study, because this school represents amedium level among approximately 2600 universities in China, and can reflect the status and problemsof scientific research management in most universities in China.
4.1. Identification Dimensions and Criteria for Evaluation of a Research Information System
As in prior discussions, we use the dimensions and indicators in the D&M model as elements toevaluate the scientific information system in this paper. We construct a scientific information evaluationsystem with four dimensions and 15 criteria that are extracted based on the D&M model. The resultsare displayed in Table 1. The system quality includes ease of use, integration, reliability, and responsetime, while information quality contains accuracy, completeness, timeliness, and usefulness. Userfrequency, navigation patterns, effectiveness, and efficiency are the four criteria in the dimension ofintention to user. Table 1 also describes in detail the specific meaning of these 15 criteria.
Table 1. Evaluation indicators for the scientific research information system. IS: information system.
Dimension Criteria Description
System quality (C1)
Ease of use (C11) Does not require excessive professional guidanceIntegration (C12) System function integration levelReliability (C13) System robustness, few system crashes
Response time (C14) The reaction time after users make a request tothe system
Information quality (C2)
Accuracy (C21) Accuracy of the information delivered by the systemCompleteness (C22) Integrity of the information supplied by the system
Timelines (C23) System information update speedUsefulness (C24) Value of the information produced by the system
Service quality (C3)Assurance (C31) Frequency and effect of enterprise maintenance systemIS training (C32) Effect of training scientific research personnel
Organization design (C33) Service awareness and management improvement forsystem design
Intention to user (C4)
User frequency (C41) Number of times the user uses the systemNavigation patterns (C42) How users access the system (computer or mobile phone)
Effectiveness (C43) Does accessing the system help to improve jobperformance?
Efficiency (C44) Does productivity increase after accessing the system?
4.2. Measuring the Relationship between Dimensions and Criteria by RDANP Method
To measure the initial direct influence matrix, we designed a questionnaire with the aim ofobtaining the influential degrees between any two criteria according to Table 1. Ten staff memberswith abundant experience in this university were invited to judge the influential degrees betweendifferent criteria in terms of crisp scores 4, 3, 2, 1 and 0 (Extremely high impact = 4, High impact = 3,Medium impact = 2, Low impact = 1, and No impact = 0). The group was comprised of five professorsfrom colleges, three managers from research departments, and two members from the informationtechnology center.
During the survey, experts were asked to respond to a question by making pairwise comparisonsof the degrees of influence between the criteria (the results are shown in Table A1). After integratingthe questionnaire responses of the 10 experts, a 15 × 15 rough initial direct influence matrix wasobtained according to step 1 of DANP. For example, an influential degree set of C11 on C12 is denotedby C11 −C12 = 3, 3, 3, 3, 3, 3, 4, 3, 3, 3, which can be converted into a rough number through Equations(1)–(8) as follows:
Lim(3) = 3+3+3+3+3+3+3+3+39 = 3, Lim(3) = 3+3+3+3+3+3+3+3+3+4
10 = 3.1
Lim(4) =3 + 3 + 3 + 3 + 3 + 3 + 3 + 3 + 3 + 4
10= 3.1, Lim(4) =
41= 4

Symmetry 2019, 11, 1248 12 of 21
Then, C11 −C12 = 3, 3, 3, 3, 3, 3, 4, 3, 3, 3 can be transferred into a rough influential set as C12–C11
= [3, 3.1], [3, 3.1], [3, 3.1], [3, 3.1], [3, 3.1], [3, 3.1], [3.1, 4], [3, 3.1], [3, 3.1], [3, 3.1].The rough value of C12–C11 (i.e., m12) is as follows:
Symmetry 2019, 11, x FOR PEER REVIEW 6 of 21
where xi and yi are denoted the elements in the lower approximation or upper approximation of zΘ, respectively. In addition, NL and NU are represented the total number of respondents involved in the lower and upper approximations of zΘ, respectively.
Step 3: Drive operations for two rough numbers.
Through Equations (1)–(3), all the domain knowledge of experts can be converted into a set of rough numbers, Υ (zΘ), as shown in Equation (4):
( ) ( ) ( ), ,z z z Lim z Lim z∇ ΔΘ Θ Θ Θ Θ ϒ = = (4)
Assuming two rough numbers ( )αϒ and ( )βϒ and μ as a nonzero constant, the arithmetic operations of rough number can be followed by:
( ) ,α μ α μ α μ∇ ΔΘ Θ ϒ × = × × (5)
( ) ( ) ,α β α β α β∇ ∇ Δ ΔΘ Θ Θ Θ ϒ + ϒ = + + (6)
( ) ( ) ,α β α β α β∇ ∇ Δ ΔΘ Θ Θ Θ ϒ × ϒ = × × (7)
Step 4: Transfer into crisp value from rough interval value. When needing to compare analysis for criteria or alternatives ranking, the de-roughness of the rough number into a crisp value can be used by:
/ 2deRouz z z∇ ΔΘ Θ Θ = + (8)
3.2. The RDANP Method
The rough DEMATEL method is used to establish the rough interrelationship between factors and construct an INRM. The rough total influence relationship matrix is taken as the input of the rough DANP method, and the rough influence weights of the criteria are obtained. The DANP approach solves the unreasonable problem of assuming that each cluster has equal weight in the ANP method [38,50,51]. In addition, we also consider the ambiguity of the human domain knowledge in the real environment. The rough degrees of influence of each dimension can be obtained by the rough DEMATEL, and the rough DANP process can be applied to normalize the unweighted super matrix and obtain the rough influential weights of criteria. The detailed steps are as follows [52]:
Step 1: Build a rough original influence relationship matrix M on a measuring scale of 0–4 ranging from “no influence (0)” to “very high influential (4)”.
Using the aforementioned scale, k respondents are asked to judge the extent of the rough direct influence between two pairwise criteria, denoted by mij. We checked the consistency of the raw data, using the formula as follows:
The average gap-ratio in consensus (%) ( )
1
1 1
1 100%1
k km mij ij
siji j
d ddm m
−
= =
−= ∗ −
, where m is the
number of the criteria, k is the number of the expert, kijd is the average direct influence value of
criterion i to j. If the value of the average gap ratio in consensus is less than 0.05, we believe that the expert’s rating is consistent [48]. Then, the rough direct relation average matrix M is acquired through Equations (1)–(8) in the k matrices for the respondents. Finally, we can obtain a rough original influence relationship matrixM = [ ijm ]nxn = ,ij ij n n
m m∇ Δ
× , where is n the number of criteria.
Step 2: Obtain the rough initial influence relationship matrix P = [ ijp ]nxn, which is the multiplication of M and v.
(m12) = [3.01, 3.19]
=
[ 3+3+3+3+3+3+3.1+3+3+310 ,
3.1+3.1+3.1+3.1+3.1+3.1+4+3.1+3.1+3.110
]The other rough values of elements in the rough original influential relationship matrix M =
[mi j
]are obtained in a similar way. The average rough initial direct influence matrix is shown in Table 2.In addition, the consensus rate of significant confidence was 96.10%, which is greater than 95% (i.e.,gap error rate = 3.90%; less than 5%), as shown in the footnote in Table 2. The result shows a goodconsistency with acceptable reliability.
Table 2. Rough original influence relationship matrix.
C11 C12 C13 C14 C21 . . . C44
C11 [0.00, 0.00] [2.40, 3.17] [2.71, 3.64] [2.94, 3.65] [2.12, 3.27] [2.81, 3.78]C12 [3.01, 3.19] [0.00, 0.00] [2.35, 3.06] [2.48, 3.13] [2.12, 3.27] [3.25, 3.75]C13 [2.13, 2.85] [2.33, 3.62] [0.00, 0.00] [2.83, 3.37] [0.74, 2.13] [3.25, 3.75]C14 [3.36, 3.84] [2.47, 3.52] [2.28, 3.48] [0.00, 0.00] [0.24, 0.98] [2.75, 3.64]C21 [0.86, 2.34] [1.07, 2.71] [1.33, 2.60] [0.57, 1.62] [0.00, 0.00] [3.02, 3.76]C22 [1.35, 2.68] [1.59, 2.60] [1.09, 2.46] [0.38, 1.67] [1.68, 3.42] [2.87, 3.52]C23 [1.52, 2.73] [1.35, 2.06] [1.65, 2.60] [1.41, 2.35] [1.95, 3.42] [3.13, 3.85]C24 [0.80, 2.23] [2.12, 3.27] [1.69, 2.51] [0.78, 2.20] [2.83, 3.75] [3.16, 3.64]C31 [2.71, 3.64] [1.31, 2.87] [2.61, 3.18] [1.81, 2.99] [1.54, 3.23] [1.66, 3.14]C32 [2.28, 3.48] [1.12, 2.27] [1.49, 2.31] [0.52, 1.73] [1.24, 2.32] [2.36, 3.25]C33 [1.68, 3.42] [1.75, 3.55] [1.90, 3.42] [1.68, 3.42] [2.63, 3.36] [2.00, 3.00]C41 [1.42, 2.72] [1.49, 2.64] [0.38, 1.67] [0.75, 2.08] [0.45, 2.25] [2.24, 2.98]C42 [0.30, 1.32] [0.25, 1.43] [0.16, 1.11] [0.58, 2.21] [0.16, 1.32] [1.28, 2.48]C43 [1.02, 2.19] [1.40, 2.17] [0.38, 1.67] [0.54, 1.86] [0.65, 1.94] [2.75, 3.64]C44 [1.24, 1.98] [1.49, 2.31] [0.66, 2.14] [0.86, 2.34] [0.75, 2.08] [0.00, 0.00]
Note: The average gap ratio in consensus (%) = 1m(m−1)
m∑i=1
m∑j=1
∣∣∣∣ds
i j−ds−1i j
∣∣∣∣ds
i j
∗ 100% = 3.90% <5%, where m is the number
of criteria (m = 15), and s is the sample of 10 experts (s = 10) whose practical experience and significant confidencereach 96.10% (more than 95%).
The total rough influence relationship matrix (Table 3) is calculated using Equation (11), andthe values in the matrix indicate the total extent to which a criterion affects other criteria and othercriteria affect it. Table 4 shows the sum of the influences received and given among the dimensionsand criteria, and the results are derived by implementing Equations (12) and (13) of steps 4 and 5 inthe RDANP method. The values in the matrix shown in Table 4 represent the total and net impactvalues of the dimensions and criteria. The de-roughness matrix can be calculated by Equation (8)based on Table 4, which can be found in Table 5. The crisp value in Table 5 can be used to compare theimpact of criteria among dimensions and under each dimension. Both of the largest (ri − ci) and (ri +
ci) values are related to system quality, meaning that system quality not only has the greatest totalimpact of the four dimensions, but also has the most profound impact on the other three dimensions.Therefore, system quality affects information quality, service quality, and intention to use; furthermore,it is also affected by information quality and service quality, and is the key to the quality of the scientificresearch information system. Intention to use (C4) has the smallest (ri + ci) value (1.11), and its (ri− ci) is negative (−0.22), meaning that it is greatly influenced by other factors and is the resultingelement in the evaluation system. The influential network relationship map (INRM) (Figure 1) of thefour dimensions and their respective subsystems can be drawn according to Tables 3–5. As shownin Figure 1, the arrow source represents the cause element, and is pointed to the result destination.

Symmetry 2019, 11, 1248 13 of 21
System quality (C1), information quality (C2), and service quality (C3) are the three main factors thataffect use by users. From Figure 1, we can also see the most important criteria for each dimension. Forexample, organization design (C33) affects IS training (C31) and assurance (C32); this shows that it is themost critical criterion in the dimension of service quality (C3). Therefore, to maintain the enthusiasmof users in using the system, we need to improve the quality of systems, services, and information.Additionally, service quality and system quality have an important impact on information quality, andservice quality and system quality show an interactive relationship.
Table 3. Rough total influence relationship matrix.
C11 C12 C13 C14 C21 . . . C44
C11 [0.04, 0.24] [0.08, 0.30] [0.09, 0.29] [0.09, 0.28] [0.07, 0.29] [0.11, 0.37]C12 [0.10, 0.29] [0.04, 0.23] [0.08, 0.27] [0.08, 0.26] [0.07, 0.28] [0.12, 0.35]C13 [0.07, 0.27] [0.08, 0.28] [0.03, 0.20] [0.08, 0.26] [0.04, 0.24] [0.11, 0.33]C14 [0.10, 0.27] [0.08, 0.26] [0.07, 0.25] [0.03, 0.18] [0.03, 0.21] [0.10, 0.31]C21 [0.04, 0.25] [0.05, 0.26] [0.05, 0.24] [0.03, 0.22] [0.02, 0.20] [0.10, 0.33]C22 [0.05, 0.26] [0.06, 0.25] [0.04, 0.24] [0.03, 0.22] [0.06, 0.26] [0.10, 0.32]C23 [0.06, 0.27] [0.06, 0.25] [0.06, 0.25] [0.05, 0.24] [0.06, 0.27] [0.11, 0.34]C24 [0.04, 0.24] [0.07, 0.26] [0.06, 0.23] [0.04, 0.22] [0.08, 0.26] . . . [0.11, 0.32]C31 [0.08, 0.27] [0.05, 0.26] [0.08, 0.25] [0.06, 0.24] [0.05, 0.26] [0.08, 0.31]C32 [0.07, 0.24] [0.04, 0.22] [0.05, 0.21] [0.03, 0.19] [0.04, 0.22] [0.08, 0.28]C33 [0.06, 0.29] [0.06, 0.29] [0.06, 0.28] [0.06, 0.27] [0.08, 0.28] [0.09, 0.34]C41 [0.05, 0.22] [0.05, 0.22] [0.02, 0.19] [0.03, 0.19] [0.02, 0.21] [0.07, 0.27]C42 [0.01, 0.15] [0.01, 0.15] [0.01, 0.13] [0.02, 0.15] [0.01, 0.14] [0.04, 0.20]C43 [0.04, 0.20] [0.05, 0.20] [0.02, 0.18] [0.03, 0.18] [0.03, 0.19] [0.08, 0.27]C44 [0.04, 0.21] [0.05, 0.22] [0.03, 0.20] [0.03, 0.20] [0.03, 0.21] [0.03, 0.21]
Table 4. The sum of rough influences given and received on dimensions and criteria.
ri ci ri+ci ri−ci ri ci ri+ci ri−ci
C1[0.27,1.07]
[0.21,0.94]
[0.47,2.01]
[−0.67,0.86]
C11 [1.10, 4.36] [0.87, 3.67] [1.97, 8.03] [−2.57, 3.50]C12 [1.15, 4.21] [0.83, 3.65] [1.98, 7.85] [−2.50, 3.38]C13 [0.89, 3.92] [0.74, 3.42] [1.64, 7.33] [−2.52, 3.17]C14 [0.90, 3.59] [0.67, 3.30] [1.57, 6.89] [−2.40, 2.92]
C2[0.22,1.01]
[0.18,0.95]
[0.41,1.96]
[−0.73,0.82]
C21 [0.79, 3.77] [0.69, 3.52] [1.48, 7.29] [−2.73, 3.08]C22 [0.83, 3.79] [0.69, 3.58] [1.52, 7.37] [−2.74, 3.10]C23 [0.95, 3.94] [0.64, 3.41] [1.60, 7.36] [−2.46, 3.30]C24 [0.84, 3.68] [0.70, 3.71] [1.54, 7.40] [−2.87, 2.98]
C3[0.21,0.99]
[0.15,0.88]
[0.36,1.87]
[−0.67,0.83]
C31 [0.82, 3.75] [0.63, 3.39] [1.45, 7.15] [−2.57, 3.12]C32 [0.69, 3.28] [0.58, 3.32] [1.27, 6.61] [−2.63, 2.71]C33 [0.92, 4.15] [0.51, 3.22] [1.43, 7.38] [−2.30, 3.64]
C4[0.13,0.77]
[0.28,1.05]
[0.41,1.82]
[−0.93,0.49]
C41 [0.54, 3.15] [1.22, 4.26] [1.76, 7.41] [−3.72, 1.93]C42 [0.24, 2.24] [0.41, 2.52] [0.66, 4.76] [−2.28, 1.82]C43 [0.56, 2.97] [1.27, 4.46] [1.83, 7.43] [−3.90, 1.70]C44 [0.56, 3.17] [1.34, 4.55] [1.89, 7.72] [−4.00, 1.83]

Symmetry 2019, 11, 1248 14 of 21
Table 5. The de-roughness influences given and received on dimensions and criteria.
ri ci ri+ci ri−ci ri ci ri+ci ri−ci
C1 0.67 0.57 1.24 0.09
C11 2.73 2.27 5.00 0.47C12 2.68 2.24 4.91 0.44C13 2.41 2.08 4.48 0.33C14 2.25 1.98 4.23 0.26
C2 0.62 0.57 1.18 0.05
C21 2.28 2.10 4.38 0.17C22 2.31 2.13 4.44 0.18C23 2.45 2.03 4.48 0.42C24 2.26 2.21 4.47 0.06
C3 0.60 0.52 1.12 0.08C31 2.29 2.01 4.30 0.28C32 1.99 1.95 3.94 0.04C33 2.54 1.87 4.41 0.67
C4 0.45 0.67 1.11 −0.22
C41 1.85 2.74 4.58 −0.89C42 1.24 1.47 2.71 −0.23C43 1.77 2.87 4.63 −1.10C44 1.86 2.94 4.80 −1.08
Symmetry 2019, 11, x FOR PEER REVIEW 14 of 21
C3 [0.21, 0.99] [0.15, 0.88] [0.36, 1.87] [−0.67, 0.83]
C31 [0.82, 3.75] [0.63, 3.39] [1.45, 7.15] [−2.57, 3.12]
C32 [0.69, 3.28] [0.58, 3.32] [1.27, 6.61] [−2.63, 2.71]
C33 [0.92, 4.15] [0.51, 3.22] [1.43, 7.38] [−2.30, 3.64]
C4 [0.13, 0.77] [0.28, 1.05] [0.41, 1.82] [−0.93, 0.49]
C41 [0.54, 3.15] [1.22, 4.26] [1.76, 7.41] [−3.72, 1.93]
C42 [0.24, 2.24] [0.41, 2.52] [0.66, 4.76] [−2.28, 1.82]
C43 [0.56, 2.97] [1.27, 4.46] [1.83, 7.43] [−3.90, 1.70]
C44 [0.56, 3.17] [1.34, 4.55] [1.89, 7.72] [−4.00, 1.83]
Table 5. The de-roughness influences given and received on dimensions and criteria.
ir ic i ir c i ir c ir ic i ir c i ir c
C1 0.67 0.57 1.24 0.09
C11 2.73 2.27 5.00 0.47
C12 2.68 2.24 4.91 0.44
C13 2.41 2.08 4.48 0.33
C14 2.25 1.98 4.23 0.26
C2 0.62 0.57 1.18 0.05
C21 2.28 2.10 4.38 0.17
C22 2.31 2.13 4.44 0.18
C23 2.45 2.03 4.48 0.42
C24 2.26 2.21 4.47 0.06
C3 0.60 0.52 1.12 0.08
C31 2.29 2.01 4.30 0.28
C32 1.99 1.95 3.94 0.04
C33 2.54 1.87 4.41 0.67
C4 0.45 0.67 1.11 −0.22
C41 1.85 2.74 4.58 −0.89
C42 1.24 1.47 2.71 −0.23
C43 1.77 2.87 4.63 −1.10
C44 1.86 2.94 4.80 −1.08
Figure 1. Influential network relation map (INRM).
4.3. Obtaining the Weights of Each Dimension and Criterion
The weights of the four dimensions and 15 criteria were calculated according to Equations (14)–
(18). Table 6 indicates the unweighted rough supermatrix according to Equation (18), and the
weighted rough supermatrix can be calculated according to Equations (19)–(23), which can be found
Figure 1. Influential network relation map (INRM).
4.3. Obtaining the Weights of Each Dimension and Criterion
The weights of the four dimensions and 15 criteria were calculated according to Equations (14)–(18).Table 6 indicates the unweighted rough supermatrix according to Equation (18), and the weightedrough supermatrix can be calculated according to Equations (19)–(23), which can be found in Table 7.Subsequently, the de-rough influential weights of the dimensions and criteria can be found accordingto Equation (8). After obtaining the rough weight of the values of the dimensions and criteria, weget the crisp value by de-roughing the interval value, which can be found in Table 8. We note that inTable 8, intention to use (C4, 0.174) is the most important dimension, followed by system quality (C1,0.150), information quality (C2, 0.143), and service quality (C3, 0.137). Among the 15 criteria, efficiency(C44, 0.051), effectiveness (C43, 0.050), and frequency of use (C41) are the three most important criteria.

Symmetry 2019, 11, 1248 15 of 21
Table 6. Rough un-weighted supermatrix.
C11 C12 C13 C14 C21 . . . C44
C11 [0.128, 0.213] [0.333, 0.275] [0.289, 0.267] [0.356, 0.281] [0.255, 0.260] [0.286, 0.255]C12 [0.285, 0.268] [0.129, 0.215] [0.298, 0.280] [0.289, 0.274] [0.279, 0.266] [0.314, 0.261]C13 [0.290, 0.262] [0.269, 0.258] [0.099, 0.197] [0.261, 0.260] [0.283, 0.250] [0.192, 0.243]C14 [0.297, 0.256] [0.269, 0.252] [0.314, 0.256] [0.094, 0.184] [0.183, 0.224] [0.208, 0.241]C21 [0.252, 0.248] [0.247, 0.246] [0.249, 0.242] [0.166, 0.229] [0.123, 0.202] [0.234, 0.248]C22 [0.235, 0.243] [0.278, 0.255] [0.247, 0.260] [0.207, 0.256] [0.272, 0.265] [0.229, 0.248]C23 [0.263, 0.247] [0.231, 0.237] [0.240, 0.235] [0.343, 0.249] [0.230, 0.250] [0.260, 0.242]C24 [0.250, 0.262] [0.244, 0.262] [0.265, 0.263] [0.284, 0.266] [0.375, 0.283] . . . [0.278, 0.262]C31 [0.366, 0.340] [0.315, 0.333] [0.399, 0.346] [0.379, 0.344] [0.394, 0.347] [0.361, 0.335]C32 [0.304, 0.329] [0.337, 0.332] [0.292, 0.334] [0.326, 0.335] [0.360, 0.335] [0.351, 0.335]C33 [0.330, 0.331] [0.348, 0.335] [0.309, 0.320] [0.295, 0.320] [0.246, 0.319] [0.288, 0.330]C41 [0.292, 0.269] [0.282, 0.270] [0.276, 0.272] [0.291, 0.266] [0.284, 0.272] [0.329, 0.295]C42 [0.111, 0.168] [0.095, 0.158] [0.098, 0.158] [0.118, 0.165] [0.089, 0.155] [0.094, 0.162]C43 [0.288, 0.277] [0.308, 0.284] [0.312, 0.283] [0.288, 0.278] [0.323, 0.286] [0.417, 0.307]C44 [0.309, 0.286] [0.315, 0.288] [0.313, 0.286] [0.302, 0.291] [0.303, 0.288] [0.161, 0.236]
Table 7. Rough weighted supermatrix.
C11 C12 C13 C14 C21 . . . C44
C11 [0.034, 0.051] [0.088, 0.066] [0.076, 0.064] [0.094, 0.068] [0.056, 0.063] [0.070, 0.063]C12 [0.075, 0.065] [0.034, 0.052] [0.078, 0.067] [0.076, 0.066] [0.061, 0.064] [0.076, 0.064]C13 [0.076, 0.063] [0.071, 0.062] [0.026, 0.047] [0.069, 0.063] [0.062, 0.060] [0.047, 0.060]C14 [0.078, 0.062] [0.071, 0.061] [0.083, 0.062] [0.025, 0.044] [0.040, 0.054] [0.051, 0.059]C21 [0.053, 0.061] [0.052, 0.061] [0.053, 0.060] [0.035, 0.057] [0.027, 0.049] [0.048, 0.061]C22 [0.050, 0.060] [0.059, 0.063] [0.052, 0.064] [0.044, 0.063] [0.061, 0.065] [0.046, 0.061]C23 [0.056, 0.061] [0.049, 0.059] [0.051, 0.058] [0.072, 0.062] [0.051, 0.061] [0.053, 0.060]C24 [0.053, 0.065] [0.051, 0.065] [0.056, 0.065] [0.060, 0.066] [0.083, 0.069] . . . [0.057, 0.065]C31 [0.067, 0.080] [0.058, 0.078] [0.074, 0.081] [0.070, 0.081] [0.070, 0.080] [0.082, 0.080]C32 [0.056, 0.077] [0.062, 0.078] [0.054, 0.078] [0.060, 0.079] [0.064, 0.078] [0.080, 0.080]C33 [0.061, 0.078] [0.064, 0.079] [0.057, 0.075] [0.054, 0.075] [0.044, 0.074] [0.065, 0.079]C41 [0.099, 0.075] [0.096, 0.075] [0.094, 0.076] [0.099, 0.074] [0.108, 0.077] [0.107, 0.079]C42 [0.038, 0.047] [0.032, 0.044] [0.034, 0.044] [0.040, 0.046] [0.034, 0.044] [0.031, 0.043]C43 [0.098, 0.077] [0.105, 0.079] [0.106, 0.079] [0.098, 0.077] [0.123, 0.081] [0.136, 0.082]C44 [0.105, 0.079] [0.107, 0.080] [0.107, 0.080] [0.103, 0.081] [0.115, 0.081] [0.052, 0.063]
Table 8. The rough influential weights on dimensions and criteria.
Local Weight De-Roughness Local Weight De-Roughness GlobalWeight De-Roughness
C1 [0.054, 0.245] 0.150 (2)
C11 [0.283, 0.262] 0.273 (1) [0.015, 0.064] 0.040 (7)C12 [0.275, 0.260] 0.267 (2) [0.015, 0.064] 0.039 (8)C13 [0.228, 0.243] 0.235 (3) [0.012, 0.060] 0.036 (12)C14 [0.214, 0.235] 0.224 (4) [0.012, 0.058] 0.035 (14)
C2 [0.047, 0.249] 0.143 (3)
C21 [0.247, 0.247] 0.247 (3) [0.012, 0.062] 0.037 (11)C22 [0.250, 0.251] 0.250 (2) [0.012, 0.062] 0.037 (10)C23 [0.245, 0.241] 0.243 (4) [0.012,0.060] 0.036 (13)C24 [0.258, 0.261] 0.259 (1) [0.012, 0.065] 0.038 (9)
C3 [0.042, 0.231] 0.137 (4)C31 [0.366, 0.342] 0.354 (1) [0.015, 0.079] 0.047 (4)C32 [0.338, 0.334] 0.336 (2) [0.014, 0.077] 0.046 (5)C33 [0.296, 0.324] 0.310 (3) [0.012, 0.075] 0.044 (6)
C4 [0.073, 0.275] 0.174 (1)
C41 [0.283, 0.270] 0.277 (3) [0.021, 0.074] 0.047 (3)C42 [0.099, 0.160] 0.129 (4) [0.007, 0.044] 0.026 (15)C43 [0.300, 0.282] 0.291 (2) [0.022, 0.078] 0.050 (2)C44 [0.318, 0.288] 0.303 (1) [0.023,0.079] 0.051 (1)
Note: ( ) is ranking.
4.4. Evaluating and Improving School Information System Using the COPRAS-R Method
We assessed the quality of a university scientific research information system using the COPRAS-Rmethod, which is outlined in Section 3.3. Xiamen University of Technology’s research informationsystem is chosen as a case study in this paper. Ten experienced university staff, who are referred to inSection 4.2, filled out the questionnaire. Satisfaction values ranged from 0 to 100, and experts scoredthe research information system based on the 15 criteria. The original evaluation scores of the research
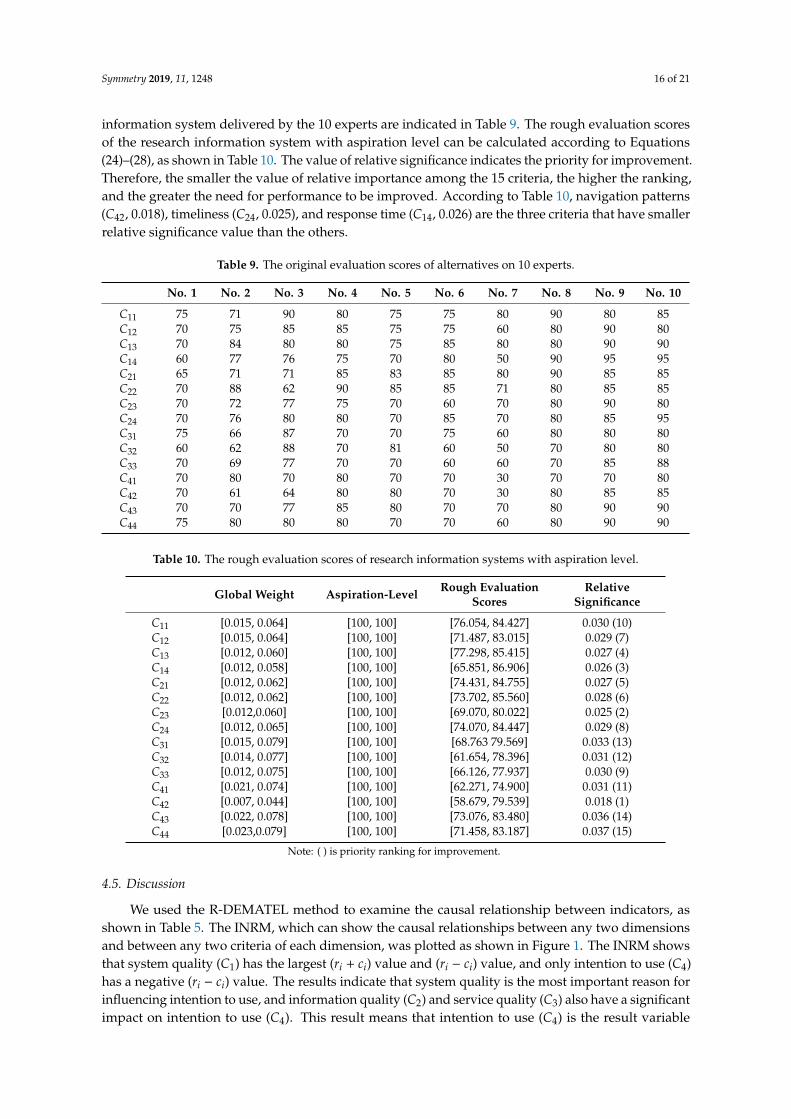
Symmetry 2019, 11, 1248 16 of 21
information system delivered by the 10 experts are indicated in Table 9. The rough evaluation scoresof the research information system with aspiration level can be calculated according to Equations(24)–(28), as shown in Table 10. The value of relative significance indicates the priority for improvement.Therefore, the smaller the value of relative importance among the 15 criteria, the higher the ranking,and the greater the need for performance to be improved. According to Table 10, navigation patterns(C42, 0.018), timeliness (C24, 0.025), and response time (C14, 0.026) are the three criteria that have smallerrelative significance value than the others.
Table 9. The original evaluation scores of alternatives on 10 experts.
No. 1 No. 2 No. 3 No. 4 No. 5 No. 6 No. 7 No. 8 No. 9 No. 10
C11 75 71 90 80 75 75 80 90 80 85C12 70 75 85 85 75 75 60 80 90 80C13 70 84 80 80 75 85 80 80 90 90C14 60 77 76 75 70 80 50 90 95 95C21 65 71 71 85 83 85 80 90 85 85C22 70 88 62 90 85 85 71 80 85 85C23 70 72 77 75 70 60 70 80 90 80C24 70 76 80 80 70 85 70 80 85 95C31 75 66 87 70 70 75 60 80 80 80C32 60 62 88 70 81 60 50 70 80 80C33 70 69 77 70 70 60 60 70 85 88C41 70 80 70 80 70 70 30 70 70 80C42 70 61 64 80 80 70 30 80 85 85C43 70 70 77 85 80 70 70 80 90 90C44 75 80 80 80 70 70 60 80 90 90
Table 10. The rough evaluation scores of research information systems with aspiration level.
Global Weight Aspiration-Level Rough EvaluationScores
RelativeSignificance
C11 [0.015, 0.064] [100, 100] [76.054, 84.427] 0.030 (10)C12 [0.015, 0.064] [100, 100] [71.487, 83.015] 0.029 (7)C13 [0.012, 0.060] [100, 100] [77.298, 85.415] 0.027 (4)C14 [0.012, 0.058] [100, 100] [65.851, 86.906] 0.026 (3)C21 [0.012, 0.062] [100, 100] [74.431, 84.755] 0.027 (5)C22 [0.012, 0.062] [100, 100] [73.702, 85.560] 0.028 (6)C23 [0.012,0.060] [100, 100] [69.070, 80.022] 0.025 (2)C24 [0.012, 0.065] [100, 100] [74.070, 84.447] 0.029 (8)C31 [0.015, 0.079] [100, 100] [68.763 79.569] 0.033 (13)C32 [0.014, 0.077] [100, 100] [61.654, 78.396] 0.031 (12)C33 [0.012, 0.075] [100, 100] [66.126, 77.937] 0.030 (9)C41 [0.021, 0.074] [100, 100] [62.271, 74.900] 0.031 (11)C42 [0.007, 0.044] [100, 100] [58.679, 79.539] 0.018 (1)C43 [0.022, 0.078] [100, 100] [73.076, 83.480] 0.036 (14)C44 [0.023,0.079] [100, 100] [71.458, 83.187] 0.037 (15)
Note: ( ) is priority ranking for improvement.
4.5. Discussion
We used the R-DEMATEL method to examine the causal relationship between indicators, asshown in Table 5. The INRM, which can show the causal relationships between any two dimensionsand between any two criteria of each dimension, was plotted as shown in Figure 1. The INRM showsthat system quality (C1) has the largest (ri + ci) value and (ri − ci) value, and only intention to use (C4)has a negative (ri − ci) value. The results indicate that system quality is the most important reason forinfluencing intention to use, and information quality (C2) and service quality (C3) also have a significantimpact on intention to use (C4). This result means that intention to use (C4) is the result variable

Symmetry 2019, 11, 1248 17 of 21
for the entire model, which reflects the usage of the information system, and it is the value of usersatisfaction with system performance. The ease of use (C11), timeliness (C23), and organization design(C33) are the three main elements of the respective subsystems, according to Figure 1. Therefore, if wewant to improve the frequency of use (C41), effectiveness (C43), and efficiency (C44) of the informationsystem, improving system usability, reducing system response time, and optimizing system design areobjectives worth considering.
The R-DEMATEL-based ANP approach was applied to find the weights of the dimensions andcriteria. From Table 8, intention to use (C4) has the greatest weight, followed by system quality (C1),information quality (C2), and service quality (C3). These results are consistent with the results ofRDEMATEL analysis, and system quality (C1) and intention to use (C4) are the two priorities in theevaluation information system. Considering the criteria, efficiency (C44, 0.051), effectiveness (C43,0.050), and frequency of use (C41, 0.047) are the three most important criteria, followed by assurance(C31, 0.047), IS training (C32, 0.046), and organization design (C33, 0.044). From their point of view,users are highly concerned with the effectiveness and efficiency of the system, which play a major rolein user satisfaction with the system. In addition, service quality is becoming increasingly important forinformation system products. Users care whether the system design can fully meet their needs andpay attention to the developer’s service commitment and careful training.
As shown in Table 10, efficiency (C44) and effectiveness (C43) ranked in the top two in termsof relative significance value. This result reflects that the research information system of XMUTcan improve the efficiency of teachers and researchers. Most teachers are quite satisfied with theeffectiveness and efficiency of the system. As the informatization of Chinese universities deepens, theuse of information systems has become a trend. University staff must change the way they work usingthe internet to improve work efficiency and effectiveness. The navigation pattern (C42) is the rankingwith a relative significance value. As with the development of mobile internet technology, users wantto access the system through mobile terminals. However, the speed of development of mobile APPsin Chinese universities is slow, and cannot meet the needs of teachers and researchers. Timelines(C23) and response time (C14) are ranked lower in the performance evaluation of this system. As weknow, users are quite disgusted with the slow response of the system and slow updating of content. Ifusers find that the system is not responding, they are likely to give up on using the system. Therefore,improving the response speed of the system itself and speeding up the content updating process areimportant prerequisites for satisfying users. Assurance (C31), IS training (C32), and organization design(C33) are urgently needed to improve performance, according to Table 10. The service quality of thesystem has long been a problem in the construction of information technology in Chinese universities.Many system developers focus on improving system performance while ignoring user guidance andtraining. Therefore, the poor quality of service is also an important reason for user dissatisfaction withthe system.
5. Conclusions
Different from previous papers that used statistical perspectives to verify the D&M model, thispaper applied a hybrid MCDM approach that combined RDANP with the COPRAS-R method toevaluate the performance of specific information systems based on the D&M model. We selected fourdimensions and 15 criteria. These dimensions include system quality, information quality, servicequality, and intension to use. We designed two surveys, one to measure the influential degrees betweendimensions and the criteria for each dimension, and the other to calculate the user satisfaction for eachcriterion on a specific system. We chose a research information system in a Chinese university as acase. Ten experienced university teachers or research managers were invited to interview and fill outtwo questionnaires.
The results demonstrate that intention to use (C4) and system quality (C1) are the two mostsignificant indicators for the evaluation of the quality of research information systems for universitiesin China, making up 60% of the total weight, and system quality (C1) is the main factor affecting the

Symmetry 2019, 11, 1248 18 of 21
intension to use (C4). Therefore, ease of use (C11), integration (C12), reliability (C13), and response time(C14) have an important influence on the frequency of use (C41), effectiveness (C42), and efficiency(C43) of the system. This study offers several contributions to the literature. First, this paper attemptsto apply the D&M model to the university research platform using the hybrid MCDM method, andfills the gaps in the current research using confirmatory statistical analysis without analysis fromexpert decision management. Second, we applied the R-DANP approach, which analyzes the causalrelationship between indicators and obscures the subjective limitations of experts to obtain the weightsof the dimensions and criteria. Taking the scientific research system of Chinese universities as a case,we proposed corresponding strategies to improve the performance of scientific research systems.
Certain limitations exist in using the R-DANP and COPRAS-R models. First, we interviewed 10experienced university employees from three different sections in depth. We cannot claim that theopinions of these 10 experts are absolutely authoritative, although the average gap ratio in consistencyis smaller than 5% (3.9%). Second, experts are more or less biased when they analyze problems. Weused rough numbers to remedy this issue, and we cannot infer that this approach is better than fuzzy orgray relational technologies. Finally, the empirical data are limited to the research information systemof a university in China, and these research findings might vary for other areas and countries. In futureresearch, the proposed model could also be used in similar decision-making problems in other fields.
Author Contributions: Q.-G.S. collected the data, literature review, and article writing. J.J.H.L. and S.-S.W. dealtwith the research design and article writing. Y.-C.C. analyzed the data, article writing, and formatting. Finally,J.J.H.L. and S.-S.W. revised the paper.
Funding: This research was founded by the Education and Scientific Research Project’s Fund for Young andMiddle-aged Teachers of the Fujian Province Education Department under grant JAS170343.
Conflicts of Interest: The authors declare no conflict of interest.
Appendix A
A part of raw influence relationship data of the rough decision-making trial and evaluationlaboratory (DEMATEL) technique.
Table A1. The criteria (C11) to other criteria of raw influence relation data from ten experts.
Criterion No. 1 No. 2 No. 3 No. 4 No. 5 No. 6 No. 7 No. 8 No. 9 No. 10
C11–C11 0 0 0 0 0 0 0 0 0 0C11–C12 3 3 3 3 3 3 4 3 3 3C11–C13 2 3 3 3 2 3 3 2 3 1C11–C14 3 3 4 4 4 3 4 4 4 3C11–C21 1 2 0 0 3 3 2 1 3 1C11–C22 4 1 1 1 2 3 3 1 3 1C11–C23 2 1 4 1 3 3 1 2 2 2C11–C24 3 0 1 1 0 3 3 1 2 1C11–C31 4 3 4 4 3 3 4 3 3 1C11–C32 4 3 4 3 3 3 4 2 2 1C11–C33 4 3 2 3 4 3 4 2 1 0C11–C41 0 1 2 3 3 3 1 3 3 2C11–C42 2 2 0 0 1 2 1 0 0 0C11–C43 0 2 3 1 3 1 1 2 2 1C11–C44 1 1 2 2 3 1 1 2 2 1
References
1. Perc, M. Growth and structure of Slovenia’s scientific collaboration network. J. Informetr. 2010, 4, 475–482.[CrossRef]
2. Perc, M. Zip’s law and log-normal distribution in measures of sicentific output across fields and institutions:40 years of years of Slovenia’s research as an example. J. Informetr. 2010, 4, 358–364. [CrossRef]
3. Lužar, B.; Levnajic, Z.; Povh, J.; Perc, M. Community structure and the evolution of interdisciplinarity inSlovenia’s scientific collaboration network. PLoS ONE 2014, 4, e94429. [CrossRef] [PubMed]
Symmetry 2019, 11, 1248 19 of 21
4. Helbing, D.; Brockmann, D.; Chadefaux, T.; Donnay, K.; Blanke, U.; Woolley-Meza, O.; Moussaid, M.;Johansson, A.; Krause, J.; Schutte, S.; et al. Saving Human Lives: What Complexity Science and InformationSystems can Contribute. J. Stat. Phys. 2015, 158, 735–781. [CrossRef] [PubMed]
5. DeLone, W.H.; McLean, E.R. Information systems success: The quest for the dependent variable. Inf. Syst.Res. 1992, 3, 60–95. [CrossRef]
6. DeLone, W.H.; McLean, E.R. The DeLone and McLean Model of Information Systems Success: A Ten-YearUpdate. J. Manag. Inf. Syst. 2003, 19, 9–30.
7. Pitt, L.F.; Watson, R.T.; Kavan, C.B. Service quality: A measure of information systems effectiveness. MIS Q.1995, 19, 173–187. [CrossRef]
8. Seddon, P.B.; Staples, S.; Patnayakuni, R.; Bowtell, M. Dimensions of information systems success. Commun.Assoc. Inf. Syst. 1999, 2, 2966–2976. [CrossRef]
9. Yeo, H.J. Information System Success Disparity between Developer and Users. Indian J. Sci. Technol. 2016, 9,1–6.
10. Zheng, Y.M.; Zhao, K.X.; Stylianou, A. The impacts of information quality and system quality on users’continuance intention in information-exchange virtual communities: An empirical investigation. Decis.Support Syst. 2013, 56, 513–524. [CrossRef]
11. Azeroual, O.; Saake, G.; Schallehn, E. Analyzing data quality issues in research information systems via dataprofiling. Int. J. Inf. Manag. 2018, 41, 50–56. [CrossRef]
12. Dwivedi, Y.K.; Wastell, D.; Laumer, S.; Henriksen, H.Z.D.; Myers, M.; Bunker, D. Research on informationsystems failures and successes: Status update and future directions. Inf. Syst. Front. 2014, 17, 143–157.[CrossRef]
13. Grudzien, Ł.; Hamrol, A. Information quality in design process docunment of quality management systems.Int. J. Inf. Manag. 2016, 36, 599–606. [CrossRef]
14. Lin, H.F. An application of fuzzy AHP for evaluating course website quality. Comput. Educ. 2010, 54, 877–888.[CrossRef]
15. Hsu, C.C.; Lee, Y.S. Exploring the Critical Factors Influencing the Quality of Blog Interfaces Using theDecision-Making Trial and Evaluation Laboratory DEMATEL Method. Behav. Inf. Technol. 2014, 33, 84–194.[CrossRef]
16. Tsai, W.H.; Chou, W.C.; Leu, J.D. An effectiveness evaluation model for the web-based marketing of airlineindustry. Expert Syst. Appl. 2011, 38, 15499–15516. [CrossRef]
17. Su, H.S.; Tzeng, G.H.; Hu, S.K. Cloud e-learning service strategies for improving e-learning innovationperformance in a fuzzy environment by using a new hybrid fuzzy multiple attribute decision-making model.Interact. Learn. Environ. 2015, 24, 812–1835. [CrossRef]
18. Ayyash, M.M. Scrutiny of Relationship between E-Banking Information Quality Dimensions and CustomerSatisfaction. J. Comput. Sci. 2017, 13, 78–90. [CrossRef]
19. Molla, A.; Licker, P.S. E-commerce systems success: An attempt to extend and respecify the Delone andMcLean model of IS Success. J. Electron. Commer. Res. 2001, 2, 131–141.
20. Bernroider, E.W.N. IT governance for enterprise resource planning supported by the DeLone-McLean modelof information systems success. Inf. Manag. 2008, 45, 257–269. [CrossRef]
21. Chen, C.Y.; Chang, R.E.; Hung, M.C.; Lin, M.H. Assessing the quality of a Web-based Learning System forNurses. J. Med. Syst. 2009, 33, 317–325. [CrossRef] [PubMed]
22. Bossen, C.; Jensen, L.G.; Udsen, F.W. Evaluation of a comprehensive EHR based on the DeLone and McLeanmodel for IS success: Approach, results, and success factors. J. Med. Syst. 2013, 82, 940–953. [CrossRef][PubMed]
23. Kyoung, W.C.; Sung, K.B.; Ji, H.R.; Kyeong, N.K.; Chang, H.A.; Yong, M.C. Performance Evaluation of PublicHospital Information Systems by the Information System Success Model. Health Inf. Res. 2015, 21, 43–48.
24. Chiu, P.S.; Chao, I.; Kao, C.C.; Pu, Y.H.; Huang, Y.M. Implementation and evaluation of mobile e-books in acloud bookcase using the information system sucess model. Libr. Hi Tech 2016, 34, 207–223. [CrossRef]
25. Yang, M.; Shao, Z.; Liu, Q.; Liu, C.Y. Understanding the quality factors that influence the continuanceintention of students toward articipation in MOOCs. Educ. Technol. Res. Dev. 2017, 65, 1195–1214. [CrossRef]
26. Lin, H.H.; Wang, Y.S.; Li, C.R.; Shih, S.J.; Lin, S.J. The Measurement and Dimensionality of Mobile LearningSystems Success: Two-Stage Development and Validation. J. Educ. Comput. Res. 2017, 55, 1–22. [CrossRef]
Symmetry 2019, 11, 1248 20 of 21
27. Wu, C.H.; Chen, S.C. Understanding the relationships of critical factors to Facebook educational usageintention. Internet Res. 2015, 25, 262–278. [CrossRef]
28. Wang, Y.S. Assessing e-commerce systems success: A respecification and validation of the DeLone andMcLean model of IS success. Inf. Syst. J. 2008, 18, 529–557. [CrossRef]
29. Sebetci, Ö.; Aksu, G. Evaluating e-government systems in Turkey: The case of the ‘e-movable system’. Inf.Polity 2014, 19, 225–243. [CrossRef]
30. Hu, X.L. Effectiveness of information technology in reducing corruption in China: A validation of the DeLoneand McLean information systems success model. Electron. Libr. 2015, 33, 52–64.
31. Tzeng, G.H.; Chiang, C.H.; Li, C.W. Evaluating intertwined effects in e-learning programs: A novel hybridMCDM model based on factor analysis and DEMATEL. Expert Syst. Appl. 2007, 32, 1028–1044. [CrossRef]
32. Tsai, W.H.; Chou, W.C. Selecting management systems for sustainable development in SMEs: A novel hybridmodel based on DEMATEL, ANP, and ZOGP. Expert Syst. Appl. 2009, 36, 1444–1458. [CrossRef]
33. Liou, J.J.H.; Yen, L.; Tzeng, G.H. Building an effective safety management system for airlines. J. Air Transp.Manag. 2008, 14, 20–26. [CrossRef]
34. Chen, J.K.; Chen, I.S. Using a novel conjunctive MCDM approach based on DEMATEL, fuzzy ANP, andTOPSIS as an innovation support system for Taiwanese higher education. Expert Syst. Appl. 2010, 37,1981–1990. [CrossRef]
35. Sun, C.C. Identifying critical success factors in EDA industry using DEMATEL method. Int. J. Comput. Intell.Syst. 2015, 8, 208–218. [CrossRef]
36. Hsu, C.C.; Liou, J.J.H.; Chuang, Y.C. Integrating DANP and modified grey relation theory for the selection ofan outsourcing provider. Expert Syst. Appl. 2013, 40, 2297–2304. [CrossRef]
37. Huang, C.N.; Liou, J.J.H.; Chuang, Y.C. A method for exploring the interdependencies and importance ofcritical infrastructures. Knowl. Based. Syst. 2014, 55, 66–74. [CrossRef]
38. Liou, J.J.H. Building an effective system for carbon reduction management. J. Clean. Prod. 2015, 103, 353–361.[CrossRef]
39. Shao, Q.G.; Liou, J.J.H.; Weng, S.S.; Chuang, Y.C. Improving the Green Building Evaluation System in ChinaBased on the DANP Method. Sustainability 2018, 10, 1173. [CrossRef]
40. Bai, C.G.; Sarkis, J. A grey-based DEMATEL model for evaluating business process management criticalsuccess factors. Int. J. Prod. Econ. 2013, 146, 281–292. [CrossRef]
41. Lin, R.J. Using fuzzy DEMATEL to evaluate the green supply chain management practices. J. Clean. Prod.2013, 40, 32–39. [CrossRef]
42. Govindan, K.; Khodaverdi, R.; Vafadarnikjoo, A. Intuitionistic fuzzy based DEMATEL method for developinggreen practices and performances in a green supply chain. Expert Syst. Appl. 2015, 42, 7202–7220. [CrossRef]
43. Song, W.Y.; Cao, J.T. A rough DEMATEL-based approach for evaluating interaction between requirements ofproduct-service system. Comput. Ind. Eng. 2017, 110, 353–363. [CrossRef]
44. Pamucar, D.; Mihajlovic, M.; Obradovic, R.; Atanaskovic, P. Novel approach to group multi-criteria decisionmaking based on interval rough numbers: Hybrid DEMATEL-ANP-MAIRCA model. Expert Syst. Appl.2017, 88, 58–80. [CrossRef]
45. Pawlak, Z. Rough sets. Int. J. Comput. Inf. Sci. 1982, 11, 341–356. [CrossRef]46. Zhai, L.Y.; Khoo, L.P.; Zhong, Z.W. A rough set enhanced fuzzy approach to quality function deployment.
Int. J. Adv. Manuf. Technol. 2008, 37, 613–624. [CrossRef]47. Shyng, J.Y.; Shieh, H.M.; Tzeng, G.H.; Hsieh, S.H. Using FSBT technique with Rough Set Theory for personal
investment portfolio analysis. Eur. J. Oper. Res. 2010, 201, 601–607. [CrossRef]48. Han, S.; Jin, X.N.; Li, J.X. An assessment method for the impact of missing data in the rough set-based
decision fusion. Intell. Data Anal. 2016, 20, 1267–1284. [CrossRef]49. Liou, J.J.H.; Chuang, Y.C.; Hsu, C.C. Improving airline service quality based on rough set theory and flow
graphs. J. Ind. Prod. Eng. 2016, 33, 1231–1233. [CrossRef]50. Chiu, W.Y.; Tzeng, G.H.; Li, H.L. A new hybrid MCDM model combining DANP with VIKOR to improve
e-store business. Knowl. Based. Syst. 2013, 37, 48–61. [CrossRef]51. Song, W.; Ming, X.; Liu, H.C. Identifying critical risk factors of sustainable supply chain management: A
rough strength-relation analysis method. J. Clean. Prod. 2017, 143, 100–115. [CrossRef]52. Shen, K.Y.; Yan, M.R.; Tzeng, G.H. Combining VIKOR-DANP model for glamor stock selection and stock
performance improvement. Knowl. Based. Syst. 2014, 58, 86–97. [CrossRef]
Symmetry 2019, 11, 1248 21 of 21
53. Zavadskas, E.K.; Kaklauskas, A.; Šarka, V. The new method of multicriteria complex proportional assesmentprojects. Technol. Econ. Dev. Econ. 1994, 1, 131–139.
54. Zavadskas, E.K.; Turskis, Z.; Tamosaitiene, J.; Marina, V. Multicriteria Selection of Project Managers byApplying Grey Criteria. Technol. Econ. Dev. Econ. 2008, 14, 462–477. [CrossRef]
55. Podvezko, V. The comparative analysis of MCDA methods SAW and COPRAS. Eng. Econ. 2011, 22, 134–146.[CrossRef]
56. Zolfani, S.H.; Rezaeiniya, N.; Zavadskas, E.K.; Turskis, Z. Froset roads location based on AHP and COPRAS-Gmethod: An emprical study based on Iran. E M Ekon. Manag. 2011, 14, 6–21.
57. Liou, J.J.H.; Tamosaitiene, J.; Zavadskas, E.K.; Tzeng, G.H. New hybrid COPRAS-G MADM Model forimproving and selecting suppliers in green supply chain management. Int. J. Prod. Res. 2016, 54, 114–134.[CrossRef]
58. Chatterjee, K.; Pamucar, D.; Zavadskas, E.K. Evaluating the performance of suppliers based on using theR’AMATEL-MAIRCA method for green supply chain implementation in electronics industry. J. Clean. Prod.2018, 184, 101–129. [CrossRef]
59. Xie, M.; Wu, L.F.; Li, B.; Li, Z.C. A novel hybrid multivariate nonlinear grey model for forecasting thetraffic-related emissions. Appl. Math. Model. 2019. [CrossRef]
© 2019 by the authors. Licensee MDPI, Basel, Switzerland. This article is an open accessarticle distributed under the terms and conditions of the Creative Commons Attribution(CC BY) license (http://creativecommons.org/licenses/by/4.0/).