multi-regional environmental io tables: progress of the creea project prof. arnold tukker, tno,...
TRANSCRIPT

Multi-Regional Environmental IO Tables: Progress of the CREEA projectProf. Arnold Tukker, TNO, Delft, Netherlands and NTNU, Trondheim, NorwayProject Manager EXIOPOL and CREEAEconomic conference Higher School of Economics, Moscow, 2-4 April [email protected]
This work and other key projects on Global MR EE IO have been just published in a Special Issue of Economic Systems Research, 2013 (25) 1, edited by Erik Dietzenbacher and Arnold Tukker.

Presentation Elements
Multi-regional EE SUT and IOT
What is it?
What is the policy relevance ?
What are the main characteristics of ongoing projects?
How can research help NSIs and UNCEEA and in reverse?
My own background
Manager at TNO, a large not for profit research institute in NL
Professor of Sustainable Innovation, Industrial Ecology Program, NTNU,
Trondheim, Norway
Leader of EU funded MR EE IO projects of EXIOPOL and CREEA (total 6 Mio
Euro, 10-15 partners)
This and other key projects on MR EE IO just published in a Special Issue of
Economic Systems Research, 2013 (25) 1

Backgrounds on SUT/IOT
EE SUT for a single country
Economic Supply and Use
By industry: emissions and primary
resource use
Can provide you
Per final use category: value added
by industry
With impact per Euro per industry
known: life cycle impacts per final
use category
Advantages
Inherently complete
Inherently consistent

What you can calculate with EE SUT and IOT
EU EIPRO (480 sector EE IOT)
Priority setting of products
Proved that food, mobility and
housing were prio’s
EU Diet change
Change to healthy diets by changing
demand vector
Showed rebounds by linking EE IOT
to the CAPRI model
Limitations of official data in EU
Sector detail (60+)
Emissions (few or absent)
Imports estimated by ‘domestic
technology ass’
Tukker et al., 2011, Ecological Economics (in press)
Tukker (ed., 2006), Journal Industrial Ecology 10: 3

So what you need: detailed Multi-Regional EE SUT SUT/IOT
Ideal solution: a database that
links country SUT/IOT via trade
Country SUT/IOT including value
added and final demand (red)
Import and export trade matrices
for intermediate and final
demand (green)
Exensions: emissions, energy,
materials (grey)
Preferably with detail in
environmentally relevant sectors..
..and many emissions/extensions
Y*,A Y*,B Y*,C Y*,D q
ZA,A ZA,B ZA,C ZA,D YA,A YA,B YA,C YA,D qA
ZB,A ZB,B ZB,C ZB,D YB,A YB,B YB,C YB,D qD
ZC,A ZC,B ZC,C ZC,D YC,A YC,B YC,C YC,D qC
ZD,A ZD,B ZD,C ZD,D YD,A YD,B YD,C YD,D qD
W WA WB WC WD
g gA gB gC gD
CapitalA CB CC CDLaborA LB LC LDNAMEAA NAMEAB NAMEAC NAMEAD
AgricA AgricB AgricC AgricDEnergyA EnergyB EnergyC EnergyDMetalA MetalB MetalC MetalDMineralA MineralB MineralC MineralDLandA LandB LandC LandD
Industries
Prod
ucts
C &
LEn
viro
n Ex
t

Major (research) initiatives in creating (Global) MR EE SUT/IOT

The contribution of EXIOPOL & CREEAThe EXIOBASE database has 3 main blocks:
1: Make harmonized EE SUT (EU27+16 others > 95% global GDP)130 sectors & products 30 emissions, 80 resources, 60 IEA energy carriers, land, waterHandles indicators like EF, MFA, external costs, LCIA
2: Split Use imp and Use dom, link via trade to global MR EE SUTSplit up Use import via UN COMTRADE trade sharesYields implicit exports // exports in S -> rebalancing needed.....affects tables & GDP but alternative is ‘trade with aliens’
3: Make global pxp and ixi MR EE IOT by collapsing MR EE SUT
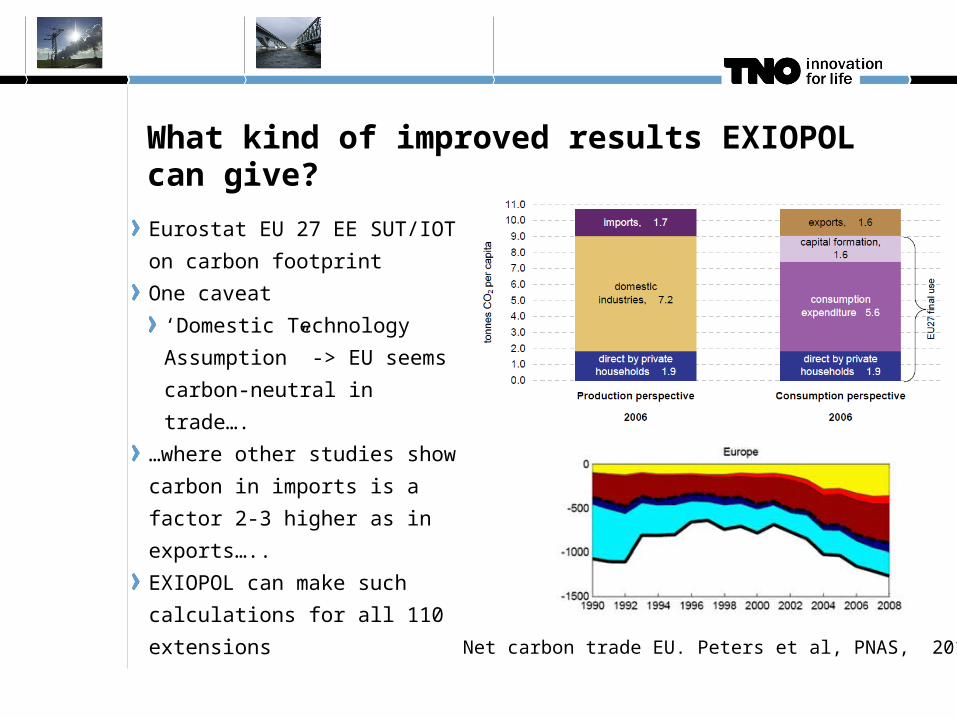
What kind of improved results EXIOPOL can give?
Eurostat EU 27 EE SUT/IOT
on carbon footprint
One caveat
‘Domestic Technology
Assumption” -> EU seems
carbon-neutral in trade….
…where other studies show
carbon in imports is a factor
2-3 higher as in exports…..
EXIOPOL can make such
calculations for all 110
extensions Net carbon trade EU. Peters et al, PNAS, 2010

What kind of results EXIOPOL can give: embodied pollution
Pollution embodied in EU27 imports and exports relative to pollution driven by final
demand, 2000
Europe relies heavily on land, water, and material use abroad where product policy
focuses mainly on energy issues
0%
10%
20%
30%
40%
50%
60%
70%
Trade
Extern
al co
sts
Land
foot
Net E
nerg
y Use
Wat
er C
onsu
mpt
ion B
lue
Wat
er C
onsu
mpt
ion G
reen
Domes
tic E
xtrac
tion
Used
Unuse
d Dom
estic
Extr
actio
n
Acidific
ation
Eutro
phica
tion
GWP
Category
% R
elat
ive
to f
inal
dem
and
Import by EU
Export by EU

The contribution of EXIOPOL and CREEA
EXIOPOL
Unique detail and large number of extensions
Focused on environmentally relevant sectors (agri, energy, mining, etc.)
FP7 CREEA (Compiling and Refining Economic Environmental Accounts)
WP1/2 = Management and scoping
WP 3 Will improve water and land use accounts
WP 4 Will expand EXIOPOL/EXIOBASE with physical accounts
Will further test SEEA 2012 forest (WP5) and carbon (WP6) accounts
Used to update EXIOBASE to 2007 (WP7) and do case studies (WP8)
We have funds reserved for intensive collaboration with formal circles (WP9: e.g.
OECD, UNCEEA, UNEP ????)
Partners TNO, CML, WI, SERI, EU DG JRC IPTS, NTNU, 2-0 LCA, ETH, TU Twente
(Water Footprint), CBS, SCB, EFI
Have obviously NSIs in Advisory Boards

What we do by WP: WP3, water accounts
• D3.1) Report containing a discussion of methodological improvement
of physical SUT for water and spatial and temporal aspects as well
as a test for the Netherlands
• D3.2) Report report describing the selection and discussion of
valuation metrics for both use and non-use valuation of water
resources
• D3.3) Report describing quality accounts dealing with physical,
• chemical and thermal pollution (task 3.3)
• D3.4) Dataset for EXIOBASE: Updated and improved data on water
consumption / use imported into the EXIOBASE in the required
sectoral (dis)aggregation……hence culminating in a set of water
extensions for 160 sectors by country

What we do by WP: WP4, MFA/Waste accounts
• For each ‘cell’ in the SUT, we create a
physical input-output balance
• U = material inputs, next to primary resource
• S, emissions = material outputs
• Remainder is “waste”..with properties related to
U!
• We then add all wastes by type to +/-20
categories….and distribute them over
re-use, landfill, incineration and compare
to waste statistics
• Problematic issue is waste from
stocks/durable goods; no stock data
• We estimate phyisical flow using
physical data where available and prices
What we do by WP: WP5, Forest accounts
• TASK 5.1: Revising the proposed SEEA 2012 methodology for
forests
• TASK 5.2: Developing procedures for integrating national forest data
into the proposed SEEA 2012 framework
• TASK 5.3: testing the methodology by data gathering for selected
countries
• Each task corresponds to a deliverable in the project
• Rather stand alone deliverable
What we do by WP: WP6, Kyoto accounts
• Mapping IEA energy database on MR SUT and emission calculation
• IEA format -> SUT
• Territorial to residence
• IEA product classification now harmonized with EXIOBASE 2.0; IEA industries need
correspondence with more detailed EXIOBASE
• Allocation: mix of physical and economic coefficients (latter assuming price
homogeneity of Use)
• UNFCCC emission factors give emissions
• Other emissions similar approach
• Land use cover change: tested for Annex 1, not certain for others
• Experimental inclusion of Emission trading schemes
• Experimental analysis of response measures (e.g. taxation)

What we do by WP: WP7, Integration in EXIOBASE • Detailing country SUT
• Use more detailed sector and product statistics to detail row and column totals
• Use additional information to estimate per sector supply and use co-efficiency (e.g. similar country, LCI, IEA, Agrisams)
• Use detailed trade data to split trade
• …then harmonize with a RAS alike procedure…or iron out incompatibilities (e.g. there is sure Use, but no domestic
Supply nor imports -> imports may be wrong)
• Add extentions, ‘peg’ energy & physical accounts (part integrated in detailing using price
assumptions and using physical supply/use totals)
• Link via trade
• Distribute imports via trade shares to countries of origin
• Then usually the implicit exports do not match exports in SUT (mismatch at differen levels: total global export // global
import; export // import by product globally; exports in country SUT not equal to implicit exports -> there are differences
that must be removed!
• Give slack to trade shares and optimize differences
• Store inevitable differences in inventories or ‘difference’ column

What CREEA will create: EXIOBASE 2.0
• A global MR SUT with extensions for 2007
• 160 sector and 180 products by country
• Trade linked
• Not only monetary MR SUT, but also energy MR SUT (probably
good, IEA base) and material MR SUT (somewhat problematic)
• 43 countries and 5 ‘rest of continents’
• 80 resources, 40 emissions
• The ultimate tool to analyse resource-efficiency at sector, country
and global scale including geographical trade offs

What is needed for more formal MR EE IO tables?
Linking country tables to a global MR SUT/IOT is not the problem
EXIOBASE creates this in 20 minutes from country tables and trade data
Has a flexible set up with regard to sector classifications
The problem is (harmonized) data:
SUT & IOT (NSIs)
Make valuation layers available – particularly EU must have them….
Use harmonized sector classifications where possible – really!
Trade (UN, WB, OECD, NSIs)
Put effort in harmonization (‘mirror statistics puzzle’ in UN COMTRADE)
Start work on service trade sets…..
Physical data (energy – IEA; agro-food: FAO)
It helps to use CPC as product classification in FAOSTAT and IEA
IEA: ideally, try to move to an industry classification based on ISIC
…and move from territorial to resident principle

Potential collaboration with the statistical world1. There seems interest from UN SD, WB, others to work on MR IO
Project partners from EXIOPOL, EORA, WIOD could help
Sharing e.g. EXIOBASE trade linking routine
Sharing experiences with data harmonization
Cf Eurostat’s official EU27 EE SUT build by EXIOPOL&WIOD staff
2. Countries build own EE SUT/IOT but face pollution embodied in trade
A joint WG of NSIs and researchers could link and harmonize such initiatives,
compare OECD WG on Material Flow Analysis
CREEA can offer some funds to support this,,,,
,,,would there be interest? What would be a good host ? (e.g. UNCEAA, London
Group, UNEP SETAC LCI, OECD….)
3. Support to countries with less data seems feasible too
EXIOPOL, EORA had to develop many gap filling routines
Crude but usable EE SUT probably can be estimated with FAOSTAT, IEA and macro-
economic data

THANKS FOR YOUR ATTENTION!

Relations between SUT and IOT
Figure courtesy of Jose Rueda Cantuche, EU DG JRC IPTS, Sevilla, Spain