mudgeeraba area property watch q4 2012
DESCRIPTION
Mudgeeraba Area Property Watch Q4 2012TRANSCRIPT

www.prdresearch.com.au Your home of property knowledge
Fourth Quarter │2012
MUDGEERABA AREA Property Watch®
MARKET INDICATORS
Change from Last Year Half Year
HOUSE SALES
HOUSE MEDIAN
HOUSE RENTS
UNIT SALES
UNIT MEDIAN
UNIT RENTS
Indicators are based on the year ending 31 August 2012,
except for rental indicators which are based on quarterly data
ending 30 September 2012.
KEY HIGHLIGHTS
The market has responded well to
price corrections in the six months to
August, with 8.6 per cent growth in
sales from the previous February 2012
period.
The sub $400,000 price range
accounted for 25 per cent of market
activity during the August 2012 period
compared to 8 per cent in the August
2012 period.
MUDGEERABA AREA MARKET OVERVIEW
The following Property Watch report is the result of an investigation into the
historic and current residential real estate market trends of the Mudgeeraba Area.
For the purpose of this report, the Mudgeeraba Area encompasses the suburbs
of Worongary, Tallai, Bonogin and Mudgeeraba.
Positive signs for the Mudgeeraba Area house market are beginning to emerge
as the market regained traction in the six months to 31 August 2012 to record a
total of 176 settlements. Whilst sales volumes remain relatively subdued, the
prospects of sustained improvements in the local market look promising, so long
as vendors continue to meet the market with their pricing. Confidence in the Gold
Coast region property market and a decreased appetite for debt continue to
restrict any considerable improvements to sales activity in the area, with the
expected recovery to be far less aggressive than in previous upturns.
Competitive mortgage products available to lenders on the back of successive
interest rate cuts since November 2011 (interest rate currently at 3.25 as at
November 2012) has without doubt contributed to an increase in buyer enquiry
for properties in the area, though has failed to translate accordingly to notably
stronger conversion rates. Pricing continues to be the overarching factor for
active buyers, with houses considered even slightly over priced receiving little to
no interest.
A price point analysis undertaken for the house market has highlighted a
considerable shift in buyer preference towards more affordable housing options,
with the sub $400,000 price range accounting for 25 per cent of total purchases
in the August 2012 period compared to 8 per cent in the August 2010 period.
MUDGEERABA AREA HOUSE SALES CYCLE
Prepared by PRDnationwide Research. Source: PDS
$460,500
$0
$100,000
$200,000
$300,000
$400,000
$500,000
$600,000
0
100
200
300
400
500
600
200
2 A
UG
200
3 F
EB
200
3 A
UG
200
4 F
EB
200
4 A
UG
200
5 F
EB
200
5 A
UG
200
6 F
EB
200
6 A
UG
200
7 F
EB
2007
AU
G
200
8 F
EB
200
8 A
UG
200
9 F
EB
200
9 A
UG
201
0 F
EB
201
0 A
UG
201
1 F
EB
201
1 A
UG
201
2 F
EB
201
2 A
UG
Med
ian
sale
pri
ce
Nu
mb
er
of
sale
s
Half year period
Number of sales
Median
Prepared by PRDnationwide Research. Sources: PDS, Residential Tenancy Authority. PRDnationwide does not give any warranty in relation to the accuracy of the information contained in this report. If you intend to rely upon the information contained herein, you must take note that the information, figures and projections have been provided by various sources and have not been verified by us. We have no belief one way or the other in relation to the accuracy of such information, figures and projections. PRDnationwide will not be liable for any loss or damage resulting from any statement, figure, calculation or any other information that you rely upon that is contained in the material. Prepared by PRDnationwide Research © All medians and volumes are calculated by PRDnationwide Research. Use with written permission only. All other responsibilities disclaimed. © 2012
Research Analyst │Robert Matta P (07) 3026 3357 F (07) 3166 0457 E [email protected] PRDnationwide Mudgeeraba │ P (07) 5525 1355 F (07) 5525 1366 E [email protected]
Your home of property knowledge www.prdresearch.com.au
Sliding capital values over recent years has led to increased stock on the market
in the sub $400,000 price range which combined with increased activity in the
lower price points has resulted in a marked correction to the median house price.
The median house price has experienced a softening of 17.8 per cent from the
median price peak of $560,000 recorded in the August 2008 period, to record
$460,500 in the August 2012 period. The prevailing median price is in fact 5.1 per
cent less than the price recorded in the February 2009 period as the market
responded to global economic turmoil which continues to hamper renewed
confidence in the Gold Coast region’s property market.
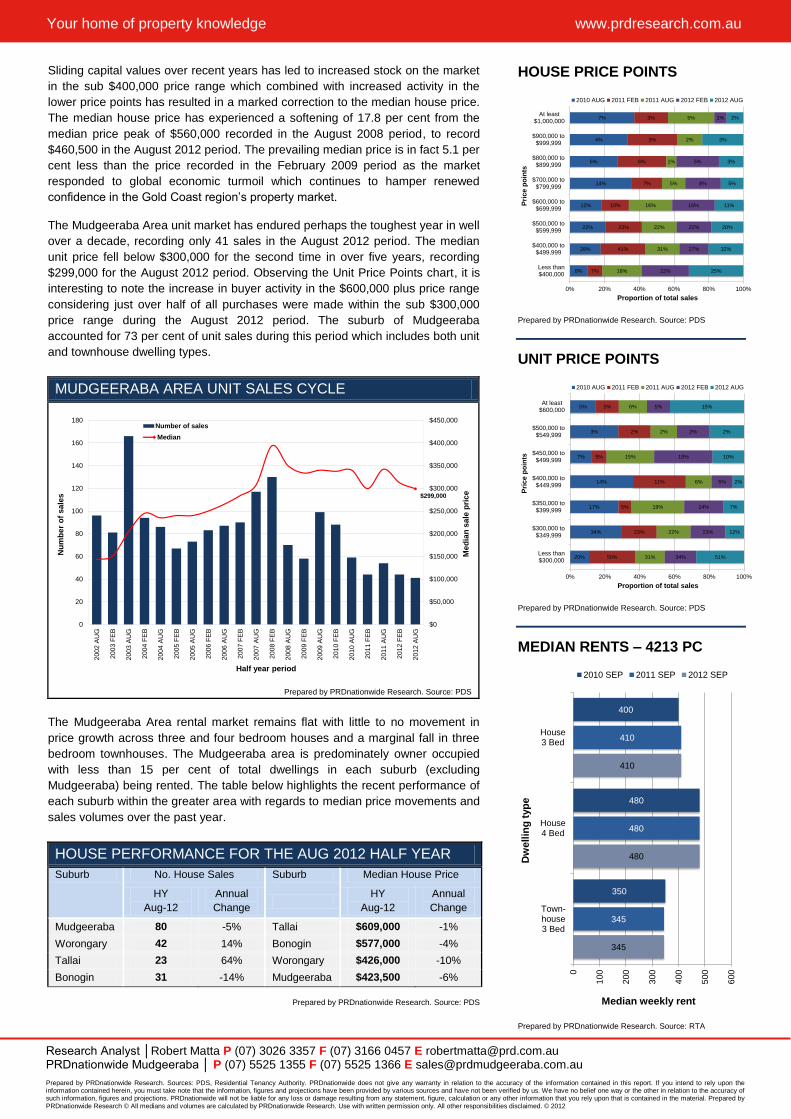
The Mudgeeraba Area unit market has endured perhaps the toughest year in well
over a decade, recording only 41 sales in the August 2012 period. The median
unit price fell below $300,000 for the second time in over five years, recording
$299,000 for the August 2012 period. Observing the Unit Price Points chart, it is
interesting to note the increase in buyer activity in the $600,000 plus price range
considering just over half of all purchases were made within the sub $300,000
price range during the August 2012 period. The suburb of Mudgeeraba
accounted for 73 per cent of unit sales during this period which includes both unit
and townhouse dwelling types.
MUDGEERABA AREA UNIT SALES CYCLE
Prepared by PRDnationwide Research. Source: PDS
The Mudgeeraba Area rental market remains flat with little to no movement in
price growth across three and four bedroom houses and a marginal fall in three
bedroom townhouses. The Mudgeeraba area is predominately owner occupied
with less than 15 per cent of total dwellings in each suburb (excluding
Mudgeeraba) being rented. The table below highlights the recent performance of
each suburb within the greater area with regards to median price movements and
sales volumes over the past year.
HOUSE PERFORMANCE FOR THE AUG 2012 HALF YEAR
Suburb No. House Sales Suburb Median House Price
HY
Aug-12
Annual
Change
HY
Aug-12
Annual
Change
Mudgeeraba 80 -5% Tallai $609,000 -1%
Worongary 42 14% Bonogin $577,000 -4%
Tallai 23 64% Worongary $426,000 -10%
Bonogin 31 -14% Mudgeeraba $423,500 -6%
Prepared by PRDnationwide Research. Source: PDS
HOUSE PRICE POINTS
Prepared by PRDnationwide Research. Source: PDS
UNIT PRICE POINTS
Prepared by PRDnationwide Research. Source: PDS
MEDIAN RENTS – 4213 PC
Prepared by PRDnationwide Research. Source: RTA
$299,000
$0
$50,000
$100,000
$150,000
$200,000
$250,000
$300,000
$350,000
$400,000
$450,000
0
20
40
60
80
100
120
140
160
180
200
2 A
UG
200
3 F
EB
200
3 A
UG
200
4 F
EB
200
4 A
UG
200
5 F
EB
200
5 A
UG
200
6 F
EB
200
6 A
UG
200
7 F
EB
200
7 A
UG
200
8 F
EB
200
8 A
UG
200
9 F
EB
200
9 A
UG
201
0 F
EB
2010
AU
G
201
1 F
EB
201
1 A
UG
201
2 F
EB
201
2 A
UG
Med
ian
sale
pri
ce
Nu
mb
er
of
sale
s
Half year period
Number of sales
Median
8%
28%
22%
12%
14%
6%
4%
7%
7%
41%
23%
10%
7%
6%
3%
3%
18%
31%
22%
16%
5%
1%
2%
5%
22%
27%
22%
16%
8%
5%
1%
25%
32%
20%
11%
5%
3%
3%
2%
0% 20% 40% 60% 80% 100%
Less than$400,000
$400,000 to$499,999
$500,000 to$599,999
$600,000 to$699,999
$700,000 to$799,999
$800,000 to$899,999
$900,000 to$999,999
At least$1,000,000
Proportion of total sales
Pri
ce
po
ints
2010 AUG 2011 FEB 2011 AUG 2012 FEB 2012 AUG
20%
34%
17%
14%
7%
3%
5%
50%
23%
5%
11%
5%
2%
5%
31%
22%
19%
6%
15%
2%
6%
34%
23%
14%
5%
18%
2%
5%
51%
12%
7%
2%
10%
2%
15%
0% 20% 40% 60% 80% 100%
Less than$300,000
$300,000 to$349,999
$350,000 to$399,999
$400,000 to$449,999
$450,000 to$499,999
$500,000 to$549,999
At least$600,000
Proportion of total sales
Pri
ce p
oin
ts
2010 AUG 2011 FEB 2011 AUG 2012 FEB 2012 AUG
400
480
350
410
480
345
410
480
345
0
100
200
300
400
500
600
House3 Bed
House4 Bed
Town-house3 Bed
Median weekly rent
Dw
ellin
g t
yp
e
2010 SEP 2011 SEP 2012 SEP