ms workstation version 6 software reference manual · ms workstation version 6 software reference...
TRANSCRIPT


Varian, Inc. 2700 Mitchell Drive Walnut Creek, CA 94598-1675/USA
©Varian, Inc. 2001-2010 Printed in U.S.A. Part Number 391496300:11
MS Workstation Version 6
Software Reference Manual
Trademark Acknowledgments
Microsoft, Windows, Windows XP, Windows 2000, and Windows NT are registered trademarks of Microsoft Corporation.
DemoShield and InstallShield are registered trademarks of InstallShield Corporation.
Acrobat® Reader® Copyright © 1984-2010 Adobe Systems Incorporated. All rights reserved. Adobe and Acrobat are trademarks of Adobe Systems Incorporated, which may be registered in certain jurisdictions.
Other brand and product names are trademarks or registered trademarks of their respective holders.

1
Contents
Introduction ............................................................................................................................... 7 The MS Workstation Toolbar ...................................................................................................................................... 7 The Software Reference Manual ................................................................................................................................ 8
MS Data Review ........................................................................................................................ 9 Overview ..................................................................................................................................................................... 9
MS Data Review Views ........................................................................................................................................ 9 Varian MS Workstation Terms ........................................................................................................................... 10
Viewing Chromatograms and Spectra ...................................................................................................................... 10 Overview of MS Data Review ............................................................................................................................ 10 Preferences ........................................................................................................................................................ 11 Choosing Data Files ........................................................................................................................................... 15 Plotting Multiple Files ......................................................................................................................................... 15 Plotting Specific Ion Chromatograms ................................................................................................................. 19 Reference Files .................................................................................................................................................. 21 Selecting Acquisition Segments to Display ........................................................................................................ 22 Viewing Data File Information in MS Data Review ............................................................................................ 23 The Chromatogram Display ............................................................................................................................... 25 Manually Integrating Chromatographic Peaks in the Plots View ....................................................................... 33 Calculating S/N .................................................................................................................................................. 37 Selecting and Viewing Mass Spectra ................................................................................................................. 38 The Spectrum Display ........................................................................................................................................ 44 Editing a Mass Spectrum ................................................................................................................................... 47 Printing Spectra and Chromatograms ................................................................................................................ 48 Background Correcting Mass Spectra ............................................................................................................... 48 Scales ................................................................................................................................................................. 51 Profile Plots ........................................................................................................................................................ 52 Using the Mass Ruler ......................................................................................................................................... 52 Labeling in Chromatogram and Spectrum Displays .......................................................................................... 57 Saving Spectrum and Chromatogram Reports in a Spooler File ....................................................................... 58
Library Searches ....................................................................................................................................................... 59 Initializing the NIST Library ................................................................................................................................ 59 Library Searches ................................................................................................................................................ 60 NIST Target Search ........................................................................................................................................... 63 The NIST Search Menu ..................................................................................................................................... 64
Creating and Using Spectrum Lists .......................................................................................................................... 71 Creating a Spectrum List .................................................................................................................................... 71 Using the Auto Add Feature to Add Entries ....................................................................................................... 72 Adding Entries to Spectrum Lists from a Library................................................................................................ 73 Adding Entries Automatically to Spectrum Lists from a Chromatogram ............................................................ 73 Editing a Spectrum List ...................................................................................................................................... 76 Performing List Searches ................................................................................................................................... 76 Performing Chromatogram Searches ................................................................................................................ 78 Performing MS Windows NIST Library Searches .............................................................................................. 80 Performing Chromatogram Searches with AMDIS ............................................................................................ 82
Printing and Spooling Features in MS Data Review ................................................................................................ 84 Printing Chromatogram and Spectrum Reports ................................................................................................. 84 Viewing and Printing Log Information ................................................................................................................ 87
2
Printing and Viewing Reports ............................................................................................................................. 91 Overview of Reports ........................................................................................................................................... 91 Reports Toolbar ................................................................................................................................................. 94 Enabling/Disabling the Print Preview Option ..................................................................................................... 96 Spooler Files ...................................................................................................................................................... 96
Plot View Preferences .............................................................................................................................................. 98 Setting Chromatogram Preference Menus ........................................................................................................ 98
Quantitation .......................................................................................................................... 101 About MS Workstation Quantitation ....................................................................................................................... 101 Organization of Quantitation Topics ....................................................................................................................... 102 Quantitation Types .................................................................................................................................................. 102
Area Percent (%) .............................................................................................................................................. 103 External Standard Quantitation ........................................................................................................................ 103 Internal Standard Quantitation ......................................................................................................................... 104 Normalization of Results .................................................................................................................................. 105
Automation of Quantitation Using Varian MS Workstation ..................................................................................... 105 Steps in Automated Quantitation ..................................................................................................................... 105
Software Applications to Learn for Quantitation ..................................................................................................... 107
Quantitation Setup................................................................................................................ 108 Sample Preparation ................................................................................................................................................ 108
Safety Considerations ...................................................................................................................................... 108 Preparing Reference Standards ...................................................................................................................... 109 Sample and Reference Standard Storage ....................................................................................................... 109
Qualitative Identification of Target Analytes ........................................................................................................... 109 Check Spectral Integrity ................................................................................................................................... 110
Acquire Calibration Data Files ................................................................................................................................ 111 Automated Method Optimization ...................................................................................................................... 111 Build a SampleList to Acquire Calibration Files ............................................................................................... 111
Build a Compound Table ........................................................................................................................................ 113 Prepare a Data Handling Method for Calibration ................................................................................................... 114 Prepare a Recalculation List for Calibration ........................................................................................................... 114
Automated Generation of Recalculation Lists .................................................................................................. 115 Building a Recalculation List in the Plots View ................................................................................................ 115 Building a Recalculation List for Calibration ..................................................................................................... 116 Add File Names and Levels to the RecalcList File Table ................................................................................ 116
Process the Calibration Files .................................................................................................................................. 117 Review and Print Calibration Results ..................................................................................................................... 117
The Process View Window .............................................................................................................................. 118 Examine Results for Each Compound ............................................................................................................. 119 View and Edit Calibration Results .................................................................................................................... 122 Creating and Printing Custom Reports ............................................................................................................ 123
Edit the Calibration Method .................................................................................................................................... 123 Process the Sample Files ....................................................................................................................................... 126 Review and Print Quantitation Results ................................................................................................................... 127
Results List Pane File Summary ...................................................................................................................... 127 Reviewing Individual Compound Results ......................................................................................................... 127 Manual Integration of Target Compounds ....................................................................................................... 127
Improving Integration .............................................................................................................................................. 130 Choosing and Editing Standard Reports ................................................................................................................ 130
Compound Tables ................................................................................................................ 131 Build Compound/Spectra List ................................................................................................................................. 131

3
Import Compound/Spectrum List ............................................................................................................................ 133 Modify Compound Table Entries ............................................................................................................................ 133 Manually Adding Compounds to a Compound Table ............................................................................................. 133
Quantitation Method ............................................................................................................. 136 Overview ................................................................................................................................................................. 136 Preparing Data Handling Method ........................................................................................................................... 136 Calculations Setup Dialog ...................................................................................................................................... 136
Structure of the Data Handling Method ............................................................................................................ 136 Set the General Parameters in the Calculations Setup Dialog ........................................................................ 137 Setting Chromatogram Processing Parameters .............................................................................................. 141
Setting Parameters in the Compound Table .......................................................................................................... 148 Compound Table Dialogs ................................................................................................................................. 149 Save the Edited Data Handling Method ........................................................................................................... 168 Guidelines for Optimizing Integration Parameters ........................................................................................... 168 Changing Integration Parameters .................................................................................................................... 171 Integrating Unknown Peaks ............................................................................................................................. 173
Setting Parameters in the Results Treatment Dialog ............................................................................................. 174
TurboDDS(TM) Data Review ................................................................................................ 175 Overview ................................................................................................................................................................. 175 Opening MS Data Review ...................................................................................................................................... 175 MSDR Toolbar Icons for TurboDDS Data .............................................................................................................. 175 Navigating TurboDDS Data Review ....................................................................................................................... 176
Generating the example TurboDDS data file ................................................................................................... 176 Opening a TurboDDS data file ......................................................................................................................... 176 Using Plot Descriptors to Navigate .................................................................................................................. 177 Using Arrows in the Spectrum Pane to Navigate ............................................................................................. 179 Navigation of the MS3, MS4, and MS5 levels .................................................................................................. 180 High Resolution TurboDDS Data ..................................................................................................................... 180
TurboDDS Options ................................................................................................................................................. 181 Plot Descriptor Options .................................................................................................................................... 181 Sorting .............................................................................................................................................................. 181 Right-Click Options .......................................................................................................................................... 182 Chromatogram and Spectrum Pane Options ................................................................................................... 187 TurboDDS Time Range .................................................................................................................................... 187 Using the Mass Ruler with TurboDDS data ..................................................................................................... 189 TurboDDS Preferences Dialog Box ................................................................................................................. 189
Generation of Standard MS Reports ................................................................................... 193 Overview ................................................................................................................................................................. 193 The Standard MS Reports Method Section ............................................................................................................ 194 Print Options ........................................................................................................................................................... 195
Sample Reports Title/Header Dialog ............................................................................................................... 197 Compound Reports Title/Header Dialog .......................................................................................................... 198
Results Format ....................................................................................................................................................... 199 Sample Report User-Defined Format Fields .................................................................................................... 200
Chromatogram Format ........................................................................................................................................... 201 Compound Reports ................................................................................................................................................. 204
Compound Report User-Defined Format Fields .............................................................................................. 205 Calibration Block Report Format ............................................................................................................................ 206
Calibration Block Report Content Descriptions ................................................................................................ 206 Summary Report Format ........................................................................................................................................ 208
Summary Report Content Descriptions ........................................................................................................... 209

4
Standard MS Reports Application ....................................................................................... 212 Overview ................................................................................................................................................................. 212 Menu and Toolbar ................................................................................................................................................... 213
Menu Items ...................................................................................................................................................... 213 Standard MS Reports Toolbar ......................................................................................................................... 215
Standard MS Reports Format Descriptions ....................................................................... 217 Overview ................................................................................................................................................................. 217 Sample Report ........................................................................................................................................................ 217
Standard Sample Report .................................................................................................................................. 217 Report Header Fields ....................................................................................................................................... 219 Report Results Fields ....................................................................................................................................... 220
Compound Reports ................................................................................................................................................. 225 Standard Compound Report ............................................................................................................................ 225 Report Header Fields ....................................................................................................................................... 227 Report Results Fields ....................................................................................................................................... 227
Custom MS Reports ............................................................................................................. 228 Introduction ............................................................................................................................................................. 228 Using Custom MS Reports ..................................................................................................................................... 229
Generating Results on Which to Report .......................................................................................................... 229 Custom report file name limitations .................................................................................................................. 229 Setting Up the Custom MS Reports Printer ..................................................................................................... 229 Creating a Custom MS Working Template ...................................................................................................... 229 Printing Custom MS Reports............................................................................................................................ 231 Generating Custom Reports in MS Data Review ............................................................................................. 232
Custrept .................................................................................................................................................................. 232 Creating Reports with Custrept ........................................................................................................................ 232 Customizing CustRept Report Lists ................................................................................................................. 233 Types of CustRept Report Templates .............................................................................................................. 233 Currently Defined Report Templates ............................................................................................................... 235 Adding a New Report to the Report List .......................................................................................................... 235 Editing an Existing Report ................................................................................................................................ 237 Report Header .................................................................................................................................................. 238 Report Header Fields ....................................................................................................................................... 239 Graphics ........................................................................................................................................................... 240 Configuring a Graphic ...................................................................................................................................... 240 Graphic Controls .............................................................................................................................................. 241 Graph Type ...................................................................................................................................................... 242 Time Range Type ............................................................................................................................................. 242 Peak ................................................................................................................................................................. 243 Fixed Time: Start, End ..................................................................................................................................... 243 Peak Annotation ............................................................................................................................................... 244 Spectral Display: Low Mass, High Mass .......................................................................................................... 244 #1, #2 Scan Type ............................................................................................................................................. 245 Configuring Tune Verification Report Graphics ............................................................................................... 246 Report Record .................................................................................................................................................. 246 Field Definitions: Calibration Reports ............................................................................................................... 248 Field Definitions: Compound, Sample, Unknowns, & Library Search Reports ................................................ 249 Field Definitions: Tune Reports ........................................................................................................................ 255 Tune Criteria .................................................................................................................................................... 256 Configure Report Footer (Instrument Log) ....................................................................................................... 258 View a Compound Report ................................................................................................................................ 258 View a Library Search Report .......................................................................................................................... 260

5
Deleting a Report ............................................................................................................................................. 262 FC-43 Tune Report .......................................................................................................................................... 262 Examples of Reports Created from the Custrept Template ............................................................................. 263
MultiCpdBasic Report ............................................................................................................................................. 265 SummaryBasic Report ............................................................................................................................................ 265
Using the SummaryBasic Report ..................................................................................................................... 265 When Custom Reports Are Not Enough................................................................................................................. 267
Batch MS Report Printing without Recalculating .............................................................. 269 Overview ................................................................................................................................................................. 269 Batch Printing in System Control ............................................................................................................................ 269
Data File Conversion ............................................................................................................ 270 Conversion of Old Saturn MS Files to SMS format ................................................................................................ 270 Conversion of Old 1200 dat Files to XMS Format .................................................................................................. 272 Conversion of MS Workstation XMS Files to MGF ................................................................................................ 272
Appendix: Summary of MS Data Review Main Menu and Toolbars ................................. 273 MS Data Review Main Toolbar ............................................................................................................................... 273 MS Data Review Main Menu .................................................................................................................................. 274 Chromatogram Toolbar .......................................................................................................................................... 277 Spectrum Toolbar ................................................................................................................................................... 278 Shortcuts ................................................................................................................................................................. 279
Hot Keys ........................................................................................................................................................... 279 Results Codes .................................................................................................................................................. 280 Results List Columns ....................................................................................................................................... 282

6

7
Introduction
The MS Workstation Toolbar The MS Workstation Toolbar launches when the computer boots up. However, if the user chose not to have this option when the Varian MS Workstation was installed, the toolbar can be launched from an icon on the desktop or from the Windows taskbar by selecting Start >Programs > MS Workstation >Workstation >Toolbar.
The Toolbar contains icons that will launch the applications in the MS Workstation. In order to view the function of each icon, move the mouse slowly over the icon. Clicking icons in the toolbar will launch applications to control the mass spectrometers manufactured by Varian Inc. Icons on the toolbar will launch applications for processing data from GC and LC detectors, security administration, etc.
NOTE: The appearance of the Toolbar on your computer may be slightly different from the above illustration. During the installation of the software, the user is given the option of installing various applications such as GC detector data handling. Icons for options not selected will not appear on the toolbar.
For instructions for using the various instruments, the user is referred to the specific hardware manuals on those instruments. The user is also advised to refer to the MS Workstation Tutorial manual (part number 391498800).

8
The Software Reference Manual This manual has the Data Handling Aspects of the Varian MS Workstation software, version 6 and includes:
1. Examining MS data files in MS Data Review, including manual integration of peaks.
2. Identifying MS peaks qualitatively with NIST and user library searches.
3. Processing of data files for quantitation.
4. Building the data handling and reporting sections of the Method Builder.
5. Personalizing and using the Standard Reports that are included in this software.
6. Building a wide variety of Custom Reports.
7. Printing the above reports.
8. Converting old MS and DAT files from Varian mass spectrometers to SMS and XMS formats that are compatible with the current software.
The Varian Workstation Toolbar icons for the applications in this manual are:
Opens MS Data Review
Opens Method Builder (The data handling and reports sections are discussed )
Automations Editor for building and editing sample, recalculation and sequence lists.
Launches MS Standard Reports for viewing, editing and printing sample and compound reports.
Launches MS Custom Reports where templates may be designed for several different types of reports including sample, compound, tuning, verification and library-searched compounds.
An application for changing the format of old MS files to SMS.
An application for changing the format of old dat files to XMS
Batch Report application for quickly generating and printing reports.
The two icons on the right are the Data File and Method operations. When you click either the Data File or Method icon you can display the last data file or method that was open. Clicking Data File operations opens the MS Data Review application. Clicking Method opens the Method Builder application.

9
MS Data Review
Overview Review, quantitate, and report your data using MS Data Review. Qualitative data analysis includes a fast qualitative manual integration feature, library searching, and chromatogram search features.
Open MS Data review from the MS Workstation Toolbar .
NOTE: This manual goes through using MS Data Review using step by step procedures for loading data files, examining chromatograms and spectra, doing library searches, processing data, and examining results.
A summary of the toolbar and menu function is in “Appendix: Summary of MS Data Review Main Menu and Toolbars”.
MS Data Review Views
MS Data Review has three areas to review, quantitate, and report data. Each area is a View:
Plots View: Quickly review data files for qualitative purposes.
Process View: Process data files and recalc lists using a specified method to quantitate results
Results View: Examine results in detail and change individual peak integration or method parameters.
The default view when you open MS Data Review is the Plots View. You can may change it using the Preferences >Application Startup menu.
To change the active view, select the View icon from the application toolbar. All views are linked and will contain the selected data set.
10
Varian MS Workstation Terms
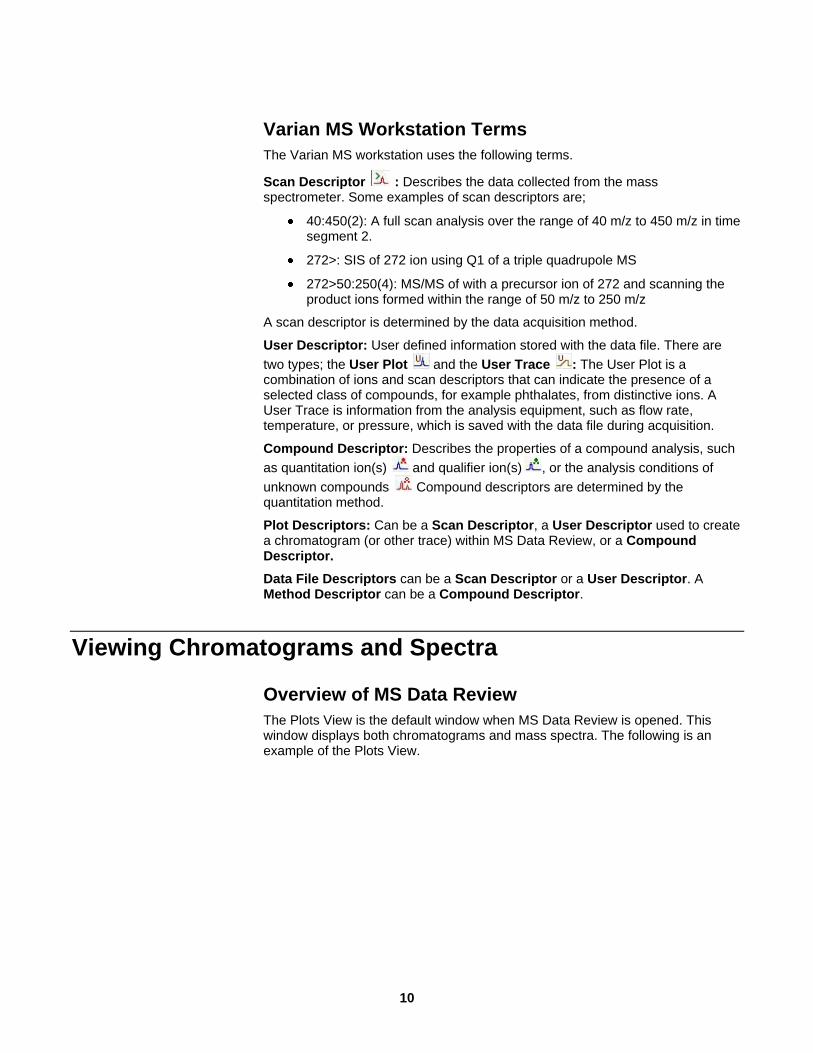
The Varian MS workstation uses the following terms.
Scan Descriptor : Describes the data collected from the mass spectrometer. Some examples of scan descriptors are;
40:450(2): A full scan analysis over the range of 40 m/z to 450 m/z in time segment 2.
272>: SIS of 272 ion using Q1 of a triple quadrupole MS
272>50:250(4): MS/MS of with a precursor ion of 272 and scanning the product ions formed within the range of 50 m/z to 250 m/z
A scan descriptor is determined by the data acquisition method.
User Descriptor: User defined information stored with the data file. There are
two types; the User Plot and the User Trace : The User Plot is a combination of ions and scan descriptors that can indicate the presence of a selected class of compounds, for example phthalates, from distinctive ions. A User Trace is information from the analysis equipment, such as flow rate, temperature, or pressure, which is saved with the data file during acquisition.
Compound Descriptor: Describes the properties of a compound analysis, such
as quantitation ion(s) and qualifier ion(s) , or the analysis conditions of
unknown compounds Compound descriptors are determined by the quantitation method.
Plot Descriptors: Can be a Scan Descriptor, a User Descriptor used to create a chromatogram (or other trace) within MS Data Review, or a Compound Descriptor.
Data File Descriptors can be a Scan Descriptor or a User Descriptor. A Method Descriptor can be a Compound Descriptor.
Viewing Chromatograms and Spectra
Overview of MS Data Review
The Plots View is the default window when MS Data Review is opened. This window displays both chromatograms and mass spectra. The following is an example of the Plots View.

11
Update Files
File Selection
Chrmoatogram and Spectra Display
Descriptors
The menu bar and MS Data Review Toolbar, also known as the Application Toolbar follows.
Preferences
Click Preferences to open a menu that lists different sets of preferences. Select the preferences you wish to modify
12
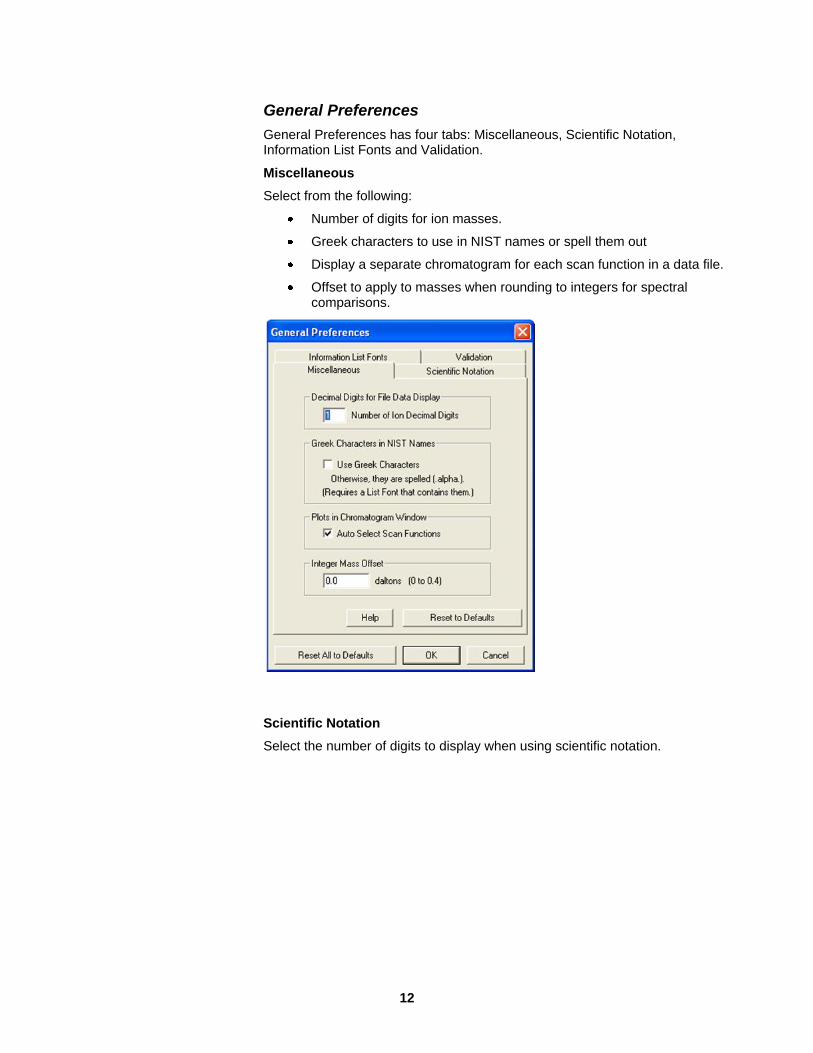
General Preferences
General Preferences has four tabs: Miscellaneous, Scientific Notation, Information List Fonts and Validation.
Miscellaneous
Select from the following:
Number of digits for ion masses.
Greek characters to use in NIST names or spell them out
Display a separate chromatogram for each scan function in a data file.
Offset to apply to masses when rounding to integers for spectral comparisons.
Scientific Notation
Select the number of digits to display when using scientific notation.

13
Information List Fonts
Select the font style to use with or without decimal alignment.

14
Validation
Validate Scan Functions is on by default, if necessary it can be turned off.
Enable Validate Scan Functions: in Method Builder, changes made to the limits of the acquisition time segments or to the list of transitions in the Acquisition Method are updated in the Compound table. This keeps the transitions in sync.
Scan Channel Validation ensures that the scan channel specifications for all compounds are correct after transitions are added or deleted in the acquisition method.
If you change segment acquisition times, scan channel validation automatically updates the compound retention times.
If you select a compound that specifies a deleted transition, a warning message opens. The missing transition is referred to as “255” in the compound table.
If you process a compound table that specifies a missing transition, the following message is logged, “Invalid scan function Cannot Quantitate”.
While Scan Channel Validation works for both deleting/adding transitions to the Acquisition Method and when segment times are changed, the user cannot change both the number of transitions and segment times at the same time. For example, the user can add/delete transitions to the Acquisition Method, but must open the Compound table BEFORE changing the segment times in the Acquisition Method. Similarly, the segment times can be changed in the Acquisition Method, but the compound table must be opened BEFORE the user can add/delete transitions in the Acquisition Method.
Disable Validate Scan Functions: A few specialty applications may not benefit from this feature.

15
Choosing Data Files
MS Data Review can display several different types of data files. Files acquired with the 4000 GC/MS and Saturn 2000 GC/MS Workstation are in *.sms format. GC/MS files acquired with earlier versions of Saturn software are in *.ms format. Files collected with the Varian 1200, 1200L, 500-MS or 300 Series are in *.xms format. Files collected with GC detectors (FID, ECD, PFPD, etc.) are in *.run format. Files of these types may be selected and displayed in any combination.
Initially, the File Selection pane will display the collapsed directory tree for the drives on the computer. In order to view data files, the directory tree must be expanded by clicking on the drive and finally on the directory where the files of interest are located. A data file can be viewed by clicking on it in the directory tree in the left pane. The chromatogram and spectra pane can be expanded to
cover the whole screen by clicking on the Show/Hide Selection pane icon . The selection pane can be restored to its original size by clicking on the icon again.
Plotting Multiple Files
File Selection Pane
There are several ways to add additional files to view simultaneously in the plot pane. Hold down the Ctrl key and click the desired files.
To select all files in a directory or add all files in a directory to the files that are on display right click the directory and select Replace with Files in Directory.
To add or replace the files in a RecalcList, right click a recalc list file and select Replace with Files in Recalc. This selects all files in the recalc list for display.
NOTE: When multiple chromatograms are displayed, one is designated the “active” chromatogram. The active chromatogram is the one that has the background of the plot number is filled in with the color of the chromatogram. Click another plot to make it the active chromatogram.
To view all files in a recalc list, select the recalc list from the file selection pane. The Descriptors pane displays all information about the recalc list instead of the plot descriptors:

16
Recalc list information in the Descriptors pane
You can select an unlimited number of files in the File Selection pane. The maximum number of chromatograms that can be displayed is determined in Preferences >Plots View.

17
The number of plots displayed is set in Max Plots. The maximum number is 20. If the number of chromatograms exceeds the maximum number then you can scroll through the chromatograms using Navigation Control at the bottom of the plot display.
Use the Automatic Updates tab to disable the Automatic Updating of the Data Files pane display or enable it and select the number of seconds between updates. For most situations, it is best to disable Automatic Updating.
The Select File/Chromatogram Dialog
You can select files to display using:
File >Select File/Chromatogram menu
File Select in the MS Data Review Toolbar.
In the Select File/Chromatogram dialog, the maximum number of files you can select is 20, and the selections in the File Selection Pane are removed.

18
Navigation Control
The Navigation Control is an easy way to move rapidly through the chromatograms selected in the Selection panes.
Select the plot sort order by clicking either the “f” or “p”. The current sort order is capitalized. The two ways to sort are by file (f) or by plot descriptor (p). In the following, File sorting was selected.
Plot Navigation Plot Sort Order
First Plot Last Plot
Current Plot #
Decrease Increase
If sorting is by File, all of the plot descriptors of a file are displayed before the plot
descriptors of another file. If the display is sorted by Plot Descriptor, then one plot
descriptor in all of the selected files is displayed first, followed by the next plot
descriptor.
Sort by File is useful to look at the results in a single file. Sort by Plot is useful to look at the results of a single compound across many data files.
Navigate through the plots using the “<” or ”>” buttons. The” >” increments the plots by the amount specified in the Preferences >Plots View dialog. To jump to the first or last plot in the list click the number beside the “<” or ”>” buttons. To display a specific plot, type the plot number in the Current Plot #.
NOTE: If the Chromatogram and Spectrum display window is made too narrow by dragging on the border separating it from the other panes, the Navigation Control will disappear.

19
Plotting Specific Ion Chromatograms
Using Plot Descriptors
The Descriptors pane displays all Plot descriptors in the selected data file(s). See “Varian MS Workstation Terms” for more information on the different types of plot descriptors.
The example of a Descriptors pane includes:
1. Plot Descriptor -The Total Ion chromatogram (TIC).
2. Scan Descriptor - Filament Off segment
3. Scan Descriptor - Full scan analysis range of m/z 200-450 done in segments 2 and 4.
4-5. Scan Descriptors - MS/MS experiments done in segment 3.
4: The parent ion was m/z 399 and the product ions between m/z 315 and 404 m/z were analyzed.
5: The parent ion was m/z 402 and the product ions between m/z 315 and 404 m/z were analyzed.
6-23. Compound Descriptors - The 6 analytes quantitated in the method. Both Quantitation Ion and Qualifier Ions are shown for both the analytes and the internal standard compounds.
24. Compound Descriptor indicating that the Unknown Compounds were integrated using the TIC.

20
Select a Plot Descriptor to display in the Chromatogram Display.
Select Multiple Plot Descriptors by holding down the Control Key to select individual Plot Descriptors, or by holding down the Shift Key and selecting all Plot Descriptors between the two selections.
Combine Scan Descriptors into a single chromatogram by holding down the Alt key and selecting the Scan Descriptors to be combined.
Determine which Plot Descriptors appear in the descriptors pane by right-clicking and selecting from the menu.
Extracting Ion Chromatograms
When a data file is opened, the default chromatogram displayed is the TIC. Each point in the total ion chromatogram is the sum of all of the masses in all scans in a single cycle of the scan functions of the acquisition segment.
Chromatogram Ions Box
To display a particular mass, a range of masses, or the sum of several masses, type them into the Ions box below the chromatogram. An additional plot is added for each entry.
Maximize or Close
Ions box with m/z 371

21
Entries for Ions Box
Entry Description Example What is Shown?
RIC (case sensitive) RIC All ions
IBP (abbreviation of Intensity of Base Peak)
IBP Plot of the Intensity of the Base Peak
BPI (abbreviation of Base Peak Intensity)
BPI Plot of the mass of the Base Peak Ion
Any ion (m/z) 131 Ion 131
Any ion range 100:200 Ions 100 through 200
Ion addition 100 + 200 Ions 100 and 200
Ion subtraction RIC – 264 All ions except 264
Any combination of entries 100:200 + 300:400 – 350
Ions 100 through 200 and ions 300 through 400 except ion 350
NOTE: If you specify the same ion more than once, the intensity for that ion is added as many times as it was specified.
To remove a plot, click Close in the upper right hand corner of the chromatogram.
To maximize a plot to the full display, click Maximize .
Reference Files
A reference file is displayed as other files are added or deleted. Use reference files when screening for known compounds or when comparing all files in a list to known plots. Only one file can be selected as a reference file.
Designate a Reference File by right-clicking the plot area or the file name and selecting Select as Reference File, or selecting from the menu, Chromatogram >Select Active File as Reference File. When a file becomes a reference file, a second file may be added to the display by clicking it without pressing Control first. If a third file is selected and clicked, that file replaces the second file and the reference file remains. Multiple files can be compared to the Reference File using the same techniques to display more than one file, for example holding the Control key, or using right-click options.

22
Deselect a reference file by right-clicking in its plot area or file name and selecting Unselect as Reference File or selecting the Chromatogram >Unselect File as Reference File menu. You can select another file as a reference by right-clicking in its plot area or file name and selecting Replace as Reference File.
Selecting Acquisition Segments to Display
Viewing data in Segment Mode
Segment Mode displays single segments in the chromatogram display. To enter
Segment mode, check the “ ”in the Navigation Control. This adds a third sort option, Sort by Segment (S). When entering the Segment mode, Sort by Segment is selected by default.
When multiple files are selected in Segment mode the data from only one segment is displayed up to the maximum number set in the Plots View
preferences. Click the decrement ( ) and increment ( ) symbols to change the display by one segment.
If Sort by File or Sort by Plot Descriptor is selected when in Segment mode, the normal sorting rules apply but only one segment is displayed. If the selection covers more than one segment, then the segment of the first plot displayed is shown.
23
A portion of the chromatogram within a segment can be selected using the mouse. However, if the chromatogram is displayed in the segment mode, clicking
the icon restores the chromatogram to full scale only on the “y” axis.
The “x” axis is the width of the acquisition segment.
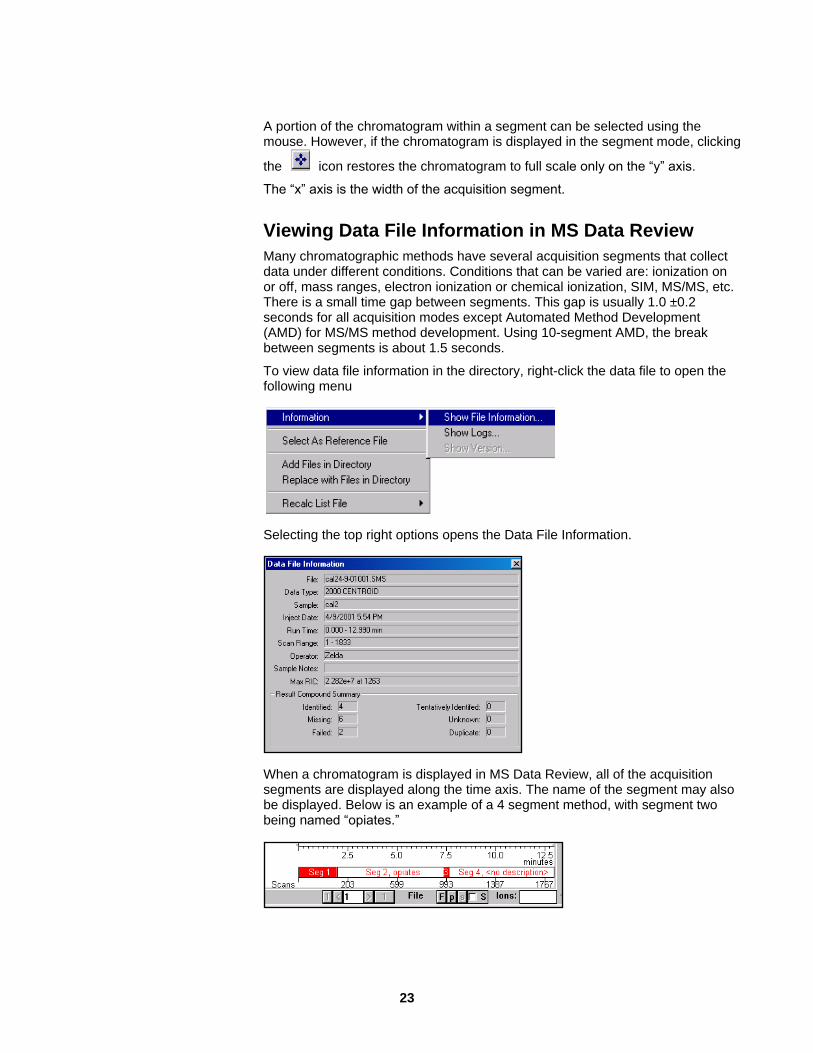
Viewing Data File Information in MS Data Review
Many chromatographic methods have several acquisition segments that collect data under different conditions. Conditions that can be varied are: ionization on or off, mass ranges, electron ionization or chemical ionization, SIM, MS/MS, etc. There is a small time gap between segments. This gap is usually 1.0 ±0.2 seconds for all acquisition modes except Automated Method Development (AMD) for MS/MS method development. Using 10-segment AMD, the break between segments is about 1.5 seconds.
To view data file information in the directory, right-click the data file to open the following menu
Selecting the top right options opens the Data File Information.
When a chromatogram is displayed in MS Data Review, all of the acquisition segments are displayed along the time axis. The name of the segment may also be displayed. Below is an example of a 4 segment method, with segment two being named “opiates.”

24
Display more information about a segment by moving the mouse over the segment bar. An example of the segment information displayed is as follows.
Click a segment to open a segment information widow, which can be printed.

25
View more information by selecting “Show Logs”. See “Viewing and Printing Log
Information” for more details.
The Chromatogram Display
Chromatogram Toolbar
This toolbar opens if you click the upper left of the Chromatogram display. It is hidden if you click the No Toolbar button, which is the first one.
The Chromatogram Toolbar has options for the behavior of the left mouse buttons. The left mouse button single click actions may be set to allow display of the mass spectrum corresponding to that point on the chromatogram (S), perform a library search (L), target list search the selected spectrum (J), export the selected spectrum to the active spectrum list (E) or to perform no action. The letter associated with each selection is a modifier for the action. For example, if you have selected No Action as the single click left button action, clicking on the chromatogram will not result in any change in the display or other actions to occur. However, if you were to hold down the „S‟ key on the keyboard and then click on the chromatogram you would see the spectrum corresponding to that point on the chromatogram displayed. Releasing the „S‟ key would cause the single click action to return to its set action (in this case, No Action).
In the menu on the right, the click and drag actions of the left mouse button are modified similarly to those of the left mouse button single click actions. Two

26
features of particular note are the ability to generate areas based on manually defined integration baseline (I) and the ability to calculate noise for a manually selected section of baseline (N).
The following examples illustrate modifying a two-chromatogram display.
Within the chromatogram and spectrum display windows there are additional toolbars. The analyst uses the menu and toolbar items to select the many options for displaying and manipulating data in MS Data Review. These options will be discussed in detail in the following sections.
The functions in the MS Data Review menu and toolbar and the chromatogram and spectrum toolbars are summarized in the “Appendix: Summary of MS Data Review Main Menu and Toolbars”.
Normalize the Chromatogram Display
Normalize the x-axis and the y-axis to full scale by clicking the Full Scale button
or by moving the mouse cursor to the bottom left of both axes until the full-
scale symbol is displayed, and double-click.
Normalize the x-axis alone by moving the mouse cursor under the axis (so that a horizontal arrow is displayed for the mouse cursor) and double-clicking.
Normalize the y-axis to full scale by moving the mouse cursor to the left of the axis (so that a vertical arrow is displayed for the mouse cursor) and double-clicking.
27
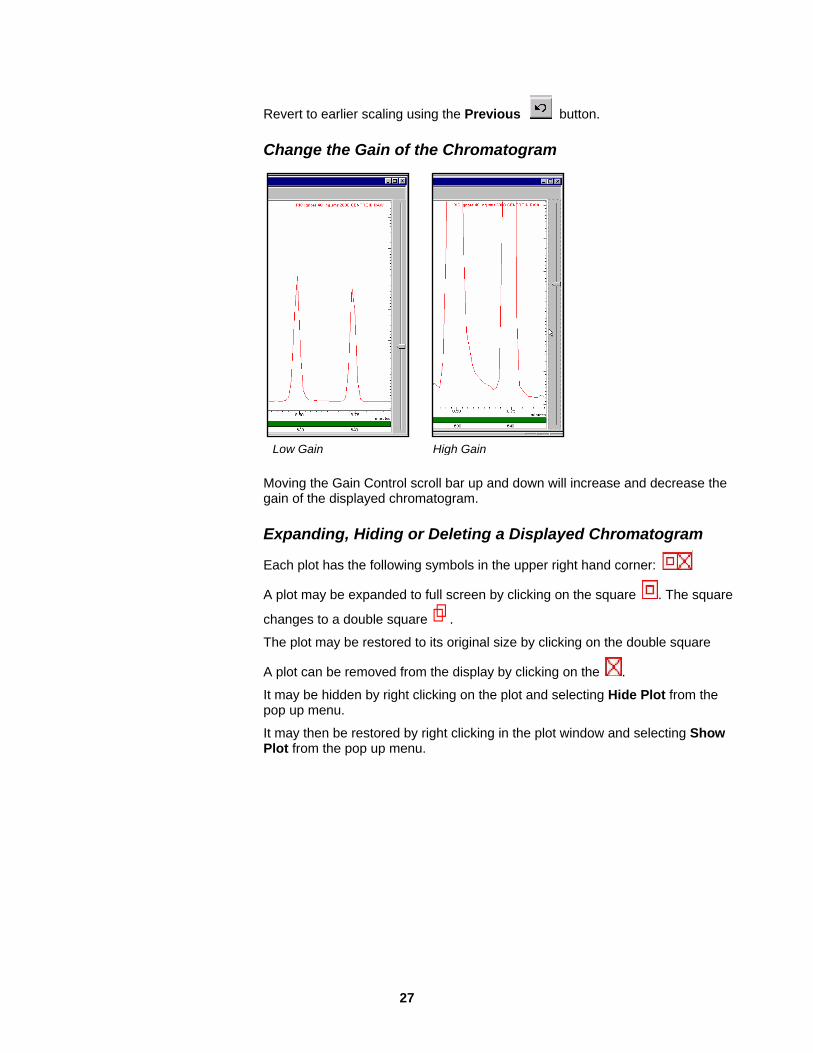
Revert to earlier scaling using the Previous button.
Change the Gain of the Chromatogram
Low Gain High Gain
Moving the Gain Control scroll bar up and down will increase and decrease the gain of the displayed chromatogram.
Expanding, Hiding or Deleting a Displayed Chromatogram
Each plot has the following symbols in the upper right hand corner:
A plot may be expanded to full screen by clicking on the square . The square
changes to a double square .
The plot may be restored to its original size by clicking on the double square
A plot can be removed from the display by clicking on the .
It may be hidden by right clicking on the plot and selecting Hide Plot from the pop up menu.
It may then be restored by right clicking in the plot window and selecting Show Plot from the pop up menu.

28
Note other actions, including printing, library searches, and S/N calculations may also be done from this right-click menu.
Plot Position
There are three display options for presenting multiple chromatograms; Overlaid Plot, Stacked Plots and Normalized Plot. These options may be chosen in the display section of the Chromatograms Toolbar:
The Select Chromatogram Display Format button displays a context sensitive menu when clicked:
Stacked Plots allows multiple chromatograms to be displayed independently of
each other. The active chromatogram for spectrum selection is indicated by the
solid color box on the y-axis.

29
Overlaid Plots allows multiple chromatograms to be displayed on the scale of the largest peak in all of the chromatograms.
Normalized Plot is similar to the Overlay Plots mode except that the intensities of all chromatograms are normalized to the most intense peak in each chromatogram. When the Chromatogram Display Format is Normalized, the control scrollbar on the right side of the window disappears. Each of these options may also be chosen using the menu command Chromatogram>Set Chromatogram Display.
Zoom the Displayed Area of the Chromatogram
Select the Click and Drag Action button on the Chromatogram toolbar and select Zoom Chromatogram or hold down the “z” key then click and drag the mouse within the Chromatogram display to expand the display around a window in the chromatogram.
The new time range is applied to all chromatograms in the Chromatograms Window, while the specified intensity range is applied to the selected plot.
You may also click and drag under the time axis to zoom the time range without affecting the intensity axis of the display.

30
Determining Noise Values Interactively
Calculate noise for any chromatogram section by clicking and dragging. Select this behavior by either clicking on the Set Click and Drag Action icon in the chromatogram toolbar or by holding the letter „N‟ key down on the keyboard and then click and drag through the selected section of the baseline. After releasing the left mouse button, a window opens and displays both Simple and Drift corrected Noise Values. The Noise Values are either Root Mean Square (RMS) or Peak-to-Peak depending on what is selected in the Chromatogram Plot Preferences. The window also displays the file name, time range, and Data Type (in this example RIC Merged RAW).
RMS Noise (Simple) is the computed RMS noise as the standard deviation of the amplitudes in the selected data set. The „Simple‟ algorithm is sensitive to baseline drift.
RMS Noise (Drift Corrected) uses the same initial computation but after first correcting the data set with a line obtained by at least squares fit. This eliminates the contribution of the baseline drift to the estimated noise. If the drift is not significant, both algorithms should provide similar estimates of the noise.
The interactively determined noise will not be reported in either the standard or the custom reports.
Offset Chromatograms
To change the position of a displayed chromatogram, select the Click and Drag
Action button on the Chromatograms Toolbar and select Move
Chromatogram. The mouse cursor will now be a Hand symbol when it is within
the Chromatogram display area. Click on any chromatogram or the active
chromatogram if they are overlaid, and move it to the position desired. In this
example, three data files with the same components at different concentration
levels are displayed in Overlaid mode. Two of the chromatograms have been
displaced upward. The time offset is shown in the file information in the upper
right of the Chromatogram display.

31
In addition to options in the View pull-down menu, there are toolbars in the
Chromatogram and Spectrum displays.
View Signal-to-Noise (S/N) for a Chromatographic Peak
Display a chromatogram and zoom it to display a segment no more than two minutes wide. Use the mouse to right-click on the apex of a peak and choose Calculate S/N.
The type of noise calculated (RMS or peak to peak) is determined in the noise tab window of the Chromatogram Plot Preferences menu. See “Setting Chromatogram Preference Menus”.

32
See “Select Noise Type” for a discussion of the differences between RMS and peak to peak noise.
NOTE: The S/N, Signal (S), and Noise (N) levels are annotated above the peak. The vertical line indicates the signal that has been calculated. The S/N value will be influenced by the selected smoothing parameters, if any. To delete the label, right-click on the S/N annotation to display the Delete Labels command.
View Effect of Chromatogram Filtering
Chromatogram filtering can be used to smooth the baseline and chromatographic peaks and improve integration. Filtering will be discussed in detail in the quantitation section, see “Filter Chromatogram”. To view the effect of filtering select overlay Filtered/Raw Data in the Chromatogram Plot tab of Chromatogram Plot Preferences. The solid line represents the filtered plot; the dotted line, the raw data.

33
Manually Integrating Chromatographic Peaks in the Plots View
Integrate Single Peak
Manually integrating a peak requires that the chromatogram and peak of interest is displayed big enough to accurately place the integration baseline. Zoom in on the peak of interest to get the most accurate integration. Manually integrating a peak is simple and straightforward; click the start and end points of integration. Use the Click and Drag action setting of the chromatogram toolbar) or press the letter „I‟ to temporarily modify the click and drag action of the mouse (press the letter „I‟ on the keyboard, click where you want to start the integration, drag the baseline to the desired endpoint, release the left mouse button, and then release the letter „I‟). In the following figures, a peak is integrated by drawing the baseline forward from the peak start to the peak end.

34
Click and drag the mouse holding the letter „I‟ down
Area and apex determined after releasing the left mouse button but still holding the letter ‟I‟ key. The „I‟ key was subsequently released.
In the figures that follow a baseline was drawn from the end of a pair of overlapping peaks to the valley point that divides them:
Baseline drawn by holding down the letter „I‟ key on the keyboard and click and drag from peak end to valley point.

35
Area and peak apex determined after releasing left mouse button but while still holding the letter „I‟ key down. The „I‟ key was subsequently released.
It is possible to integrate multiple peaks on the chromatogram using manually placed baselines. It is important to keep in mind that manually determined areas are not reported in either standard or custom reports nor are they used in quantitative calculations of results.
Individual areas are deleted by right-clicking on the label that reports the area and then clicking on delete label.
Clicking the Delete Label flag to remove the reported area, apex and shaded integrated area of the peak.

36
Individual label deleted.
All areas may be deleted simultaneously by right clicking on the chromatogram workspace and then choosing Delete Labels >Plot 1 >Integration.
Integrating chromatogram(s)
Integrate chromatograms displayed in the Plots view using the MS Data Review menu command Integrate.
All peaks in the active chromatogram can be integrated with the command Integrate >Plot 1. If multiple chromatograms are displayed in the Plots view, all peaks from all chromatograms can be integrated with the command Integrate >All Plots. Peaks from a selected time range can be integrated with the command Integrate >All Plots in Time Range. These commands open the integration Results dialog.
Click Edit Parameters >> to view/edit the integration parameters. The table has row headers.

37
When you open this dialog for the first time, integration is done using the method parameters in the data file, if the Unknown Peaks have been quantitated. Local parameters can be edited and the chromatogram reintegrated. The dialog Local parameters are used if the file has not been quantitated.
NOTE: If a chromatogram has been quantitated and the Data File button is checked, then the integration parameters saved in the data file are used and not the ones displayed in the dialog (Local parameters). You can view the integration report by clicking the Print Results button. When multiple chromatograms are displayed and the Data File button is checked, each chromatogram uses its parameters, which could be different if their methods are different. If Local integration parameters are edited in this dialog and saved, all chromatograms are integrated with these parameters if Local is selected before integration.
Calculating S/N
To calculate S/N in MS Data Review, right-click on the desired chromatogram point and then click Calculate S/N. Noise Calculations use either RMS or Peak to Peak Noise, depending on which you specify in the Chromatogram Preferences dialog on the Noise tab.
RMS S/N Calculation
When you select a point for S/N calculation, two 50-point windows are searched, one before the point you selected and one after, looking for the 10 consecutive points within those respective windows that yield the lowest RMS Noise values. These two Noise values are "RMSNoiseLeft" and "RMSNoiseRight." These RMS Noise values are determined using a calculation that is also known as the "RMS Deviation from the Mean" or the "Standard Deviation." This calculation does not incorporate baseline or "drift" correction. As such, it is simply the following equation:
RMS Noise Standard Deviation = ((1/N)*(sumi=1->N((xi- arithmetic meanX)2)))1/2

38
The Signal is the intensity of the chromatogram at the point that you selected. The Offset is the "interpolated" average intensity of the two 10-point regions at the point you selected.
Finally, the Signal-to-Noise is calculated as the following algorithm:
AverageRMSNoise = (RMSNoiseLeft + RMSNoiseRight) / 2
RMSSignalToNoise = (Signal - Offset) / AverageRMSNoise
That is the "usual case" algorithm. Pathological or boundary conditions in the data cause the algorithm to be deviated from. For example, if you select a point close to the beginning/end of an acquisition segment, there may not be 50 points to search or only the Noise from one side of your selected point will be used.
Peak-to-Peak S/N Calculation
Peak-to-Peak S/N calculation searches a region +/- 50 points before and after the point that you right-clicked, to find the average Peak-To-Peak Noise for 5 consecutive points in the region. The Noise for each 5-point window is as follows:
Noise = intensity of highest point – intensity of lowest point
The Peak-To-Peak Noise is determined as follows:
1. Sort the 5-point windows by the Offset of the middle point in the window.
2. Discard the half of the windows that have the highest offset. This eliminates peaks from consideration.
3. Re-sort the remaining windows by Noise.
The Peak-To-Peak Noise and Offset are those of the Median of the re-sorted windows.
Selecting and Viewing Mass Spectra
Selecting and Viewing a Single Mass Spectrum
Click the chromatogram in the Chromatogram Window to display the spectrum.
Set the Single Click Action button to Display Spectrum.
If the peak flag button is pressed down, as it is in the screen capture on the left, the spectrum of the clicked point is displayed.
If the peak flag button is not pressed down, as it is in the screen capture on the right, the spectrum of the peak apex is displayed.

39
Up to four spectrum windows may be displayed in the Spectrum area of the Plots View. The Spectrum Toolbar has command buttons similar the Chromatogram
Toolbar. It is hidden if the No Toolbar button is activated

40
Add Spectra by right-clicking the apex of a peak and selecting New Spectrum Window. You can also hold down the Ctrl Key and left-click.
In the top of the Spectrum display, information is displayed if space permits. The information includes: retention time, scan number, mass range of ions collected, ion time, and RIC.
Change the spectra by clicking n another scan in the Chromatogram display or by using the left and right arrows on the keyboard. Use the Increment Spectrum
and Decrement Spectrum on the Chromatograms Toolbar to change the chosen Scan.

41
Selecting and Viewing Two Mass Spectra for Comparison
If Spectrum 1A is selected, right click a different scan, select Update Spectrum Plot, and select 1B from the submenu.
A secondary flag marks the comparison scan.
The Difference Spectrum can be displayed when both Spectrum 1A and Spectrum 1B are selected. Click on Spectra Plot Preferences in the right-click menu in the Spectrum window.
Click the Labeling and Comparisons tab and select show Difference Spectrum.

42
The Difference Spectrum is essentially a Library Search of Spectrum 1A against Spectrum 1B. The Reverse Match and Forward Match values are based on a full-scale value of 1000 for identical mass spectra.
This feature is useful in comparing spectral purity across a single chromatographic peak. It is also useful in comparing the spectra of the same compound in two different data files.

43
Spectrum Averaging
When a scan is selected, the spectrum is displayed. You can view an averaged spectrum around a selected scan in a chromatographic peak. Select Preferences >Plots View Chromatogram Pane, or right-click in the chromatogram and select Chromatogram Plot Preference.

44
Click the toolbar button .
Select 3 scan, 5 scan, or 7 scan averaging. The average includes the selected scan and 1, 2, or 3 scans on either side of the peak.
Average spectra over a specified time range of the chromatogram plot by selecting the Click and Drag Action > Average Selected Spectra from the Features tab.
With the cursor labeled “Avg”, Click and Drag a time range of the plot and all scans will be averaged. The average spectrum is displayed in the current spectrum window.
As this function gets its specification from a click and drag option on a chromatogram plot defined by a specific Scan Function Channel, only the scans that make up that channel are included for averaging purposes. For example, if an MS Method Segment defines two Scan Function Channels and the current plot is displaying Scan Function Channel 1, a click and drag will only average the scans from Scan Function Channel 1. Channel 2 scans will not be included.
The Spectrum Display
The following examples illustrate modifying a multiple-spectrum display.
Modes for Display of m/z Range
Fixed Mass Range Mode - this display mode is activated with the Select Mass Range Mode button on the Spectrum Toolbar. The mass range of the display is then selected by zooming. After the display range is selected, it will remain fixed until a different display mode or range is selected.
Maximum Mass Range Mode - activated with the Select Mass Range Mode button on the Spectrum Toolbar. In this model, the full mass range of the first scan selected in the Chromatogram is displayed as the Spectrum Range. The display range will be expanded automatically the next time a spectrum is selected with a wider mass range.
Acquired Mass Range Mode - this display mode is selected with the Select Mass Range Mode button on the Spectrum Toolbar. The mass range specified in the MS Acquisition Method will be displayed.
The chosen display mode is indicated in the lower right of the Spectrum Display.

45
Zoom the Displayed Area of the Spectrum
Click and drag the mouse within the Spectrum display to expand the display around a certain window in the spectrum. The “Set Click and Drag” action of the
mouse must be set for this to work. Click the icon in the Spectrum tool
bar and verify that “Zoom Spectrum” is checked. The zoom function will also work if you press the Z key, while clicking and dragging the mouse.
The new m/z and intensity ranges are applied to all comparison spectra in the display. (It is possible to click and drag under the m/z axis to zoom the spectral range without affecting the gain of the display.)
Normalize the Spectrum Display
Normalize the x-axis (m/z) to full scale by moving the cursor under the axis (so that a horizontal double-arrow is displayed for the mouse cursor) and double-clicking.
Normalize the y-axis (intensity) to full scale by moving the cursor to the left of the axis (so that a vertical double-arrow is displayed for the mouse cursor) and double-clicking.
Normalize both axes to full scale by clicking the Full Scale button or by moving the cursor under the axis (so that the full-scale symbol is displayed for the mouse cursor) and double-clicking.

46
Hide or Delete a Displayed Spectrum
Delete a spectrum by clicking on the X in the upper right hand corner. Hide a spectrum by right-click in the display. If multiple spectra are displayed, use the menu command Hide Spectrum A or Spectrum B.
The Difference Spectrum can be hidden by right-clicking in its window. Choosing to Hide Spectrum A will remove its trace, but the trace can be displayed again by right clicking in the spectrum field and selecting Show All. Choosing to Delete Spectrum A or B will also remove the Difference Spectrum.
NOTE: Spectra can also be printed from this right-click menu.

47
Editing a Mass Spectrum
Right-click a spectrum window and select Edit Spectrum to open the Edit Spectrum Dialog.
The selected spectrum is displayed in the upper field and an ion/intensity list is shown below. To edit an attribute (name, comment, formula, molecular weight, CAS number, Base Peak), enter the information in the desired field
NOTE: The functions Keep Top, Keep Above, and Scale To make automatic filtering of small peaks and scaling easier. To apply one of these options, click the appropriate button after entering the value in the entry box to the right of the button. To keep the 30 most intense ions in the spectrum, enter 30 in the box to the right of the Keep Top button, and then click the button.
Click to list the Ion/Intensity List from low to high m/z. Click
to list from highest intensity to lowest intensity. Edit mass-intensity pairs using the Add/Replace and Delete buttons. Select intensity for the base
peak and click . Press Save to accept the changes or Cancel to reject them.
After editing is completed, the resulting spectrum is displayed. The edited spectrum can be exported to NIST user libraries, to Spectrum Lists, or to a text file.
48
Printing Spectra and Chromatograms
Spectrum and Chromatogram Reports can be printed by selecting File> Print. The Make Reports dialog opens. This dialog can also be displayed by right-clicking in the Spectrum or Chromatogram, panes, or click the Print icon in the Toolbar. For more details on printing features, go to “Printing and Spooling Features in MS Data Review”.
Background Correcting Mass Spectra
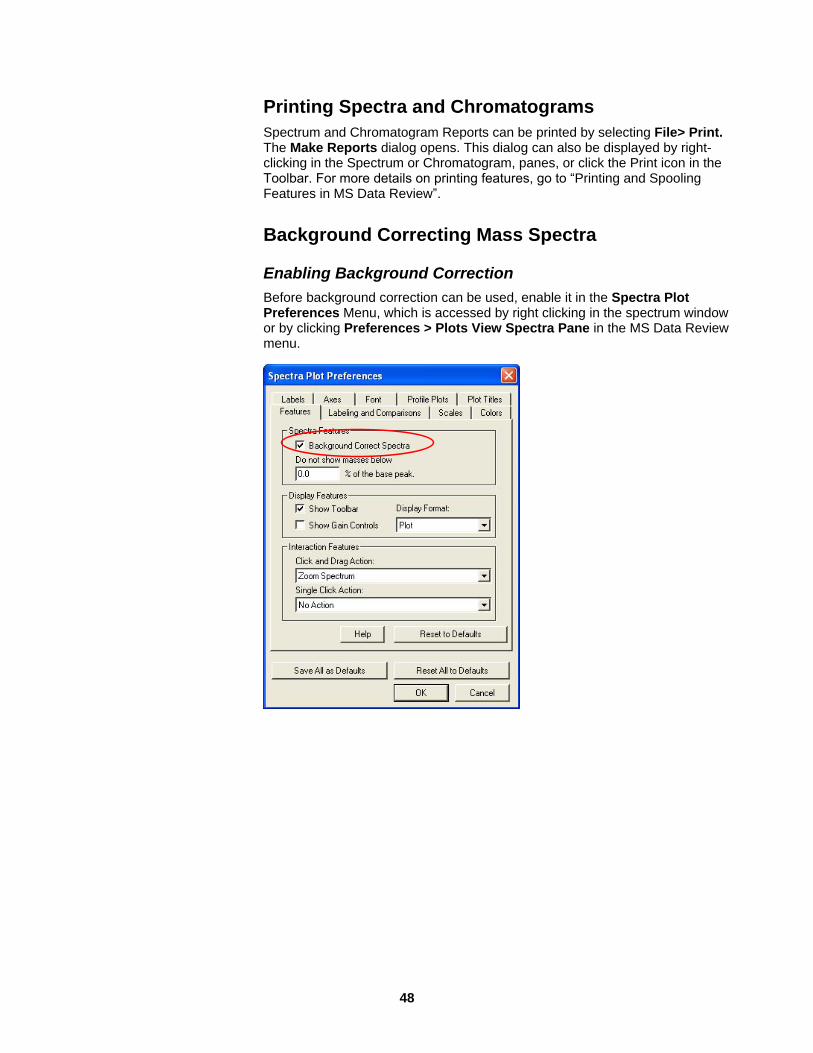
Enabling Background Correction
Before background correction can be used, enable it in the Spectra Plot Preferences Menu, which is accessed by right clicking in the spectrum window or by clicking Preferences > Plots View Spectra Pane in the MS Data Review menu.

49
Selecting Background Spectra
Click the Background Correction button on the Chromatograms Toolbar or
use the menu command Chromatogram >Select/Edit Background Correction for Active Plot to display the Background Correction Dialog. Or do Auto Add 3 point averaged background points to the chromatogram by clicking the
button.
Choose 1, 3, 5, or 7-point Averaging and manually add or move background points in the chromatogram display at any scan.
Choose the option desired. Leaving the Background Correction Dialog open, click at points in the chromatogram to add or delete background points. Currently-selected background points will be shown in the Chromatogram Display. Hold the mouse cursor over a currently selected point to change its position. When the cursor symbol changes to a Hand symbol, you can click and move the background point to a new position. The Scan selected will be indicated by a long tick mark. The additional background points used in averaging are indicated by short tick marks below the axis. In this case, 3-point averaging was performed. When finished selecting background points press the
button to close the Background Correction Dialog.

50
Saving Background Spectra
Background points are automatically saved in the data file until they are deleted.
Deleting Background Points
All background points may be deleted using the button in the Background Correction Dialog.
Background Corrected Spectrum Display
The Spectrum Display will indicate that mass spectra are automatically background corrected. The designation BC is added at the upper right in the spectrum information field.
If you have manually edited a spectrum, the designation EBC is added at the upper right in the spectrum information field.

51
How Background Correction Works
The intensities for each ion in the background spectra on the left and right sides of a chosen Sample Spectrum scan in the chromatogram are interpolated to obtain a background spectrum at the chosen sample scan. The background is then subtracted from the sample spectrum to create the background-corrected sample spectrum.
Scales
Use the Scales tab to change the spectrum scale. Use the Vertical Scale Factor section to add addition upper margin space to allow all information to be displayed.

52
Profile Plots
Use the Profile Plots tab to smooth profile spectra, select the number of data smoothing points, and to display both the raw and smoothed profile spectra.
Using the Mass Ruler
Use the Mass Ruler in the spectra view to display the m/z difference between two ions or an ion and the basepeak.
To setup the mass ruler, click Plots View on the Preferences menu.
The Plots View Preferences dialog box has a Mass Ruler Point Selection section. Select either the Nearest m/z or the Highest m/z as the default setting.

53
Click the Spectrum Icon to toggle between Nearest m/z and Highest m/z.
Nearest m/z
Nearest m/z calculates the difference between two points you select, regardless if there is a peak. The following example shows the mass associated with a loss of 15 from the 127 m/z peak.

54
Highest m/z
Enter a value of between 0.1 to 10.0 % of the displayed mass range in the Search Window when you use Highest m/z.
In the following example, the displayed mass range is 50-150 m/z or 100 m/z, and 5% was entered in the Search Window. Therefore, the Mass Ruler selects the most intense peak in a 5 m/z unit range around the spot where you stop dragging the cursor. This makes it easier to select the most intense peak among lower intensity isotopes and noise.
There are two Mass Ruler actions:
Set Single Click Action icon
Set Click and Drag Action icon
Using the Mass Ruler with Set Single Click Action
The Set Single Click Action determines the mass difference between the selected point and the base peak ion.
There are two ways you can use the Mass Ruler with Set Single Click Action
No Action and pressing R.
1. From the Spectrum pane tool bar, click the Set Single Click Action icon.
2. Select No Action.
3. Position the cursor on the spectrum, click, and press R.
Enable Mass Ruler
4. From the Spectrum pane tool bar, click the Set Single Click Action icon.
5. To enable the Mass Ruler, select Enable Mass Ruler.
6. To disable the Mass Ruler, select No Action, or select a different option.

55
The following spectrum displays several double-headed arrows. One arrow head points down to the x/z value on the x axis of the selected ion. The other arrow head points right to base peak. The mass difference is displayed above the arrow.
Using the Mass Ruler with Set Click and Drag Action
The Set Single Click Action determines the mass difference between two selected points.
From the Spectrum pane tool bar, click the Set Click and Drag Action icon.
To enable the Mass Ruler, select Enable Mass Ruler.
To disable the Mass Ruler, select a different option.
The Mass Ruler displays the mass difference between the two points you select
If the Enable Mass Ruler is not the selected Set Click and Drag Action, press R while you click and drag to enable it.
To display the mass difference between two ions:

56
Point to one of the ions, click and press R, and drag to the other ion.
The following spectrum displays several double-headed arrows. Both arrow heads point down to the x/z value on the x axis of the selected ions, even if one if the ion happens to be the base peak. The mass difference is displayed above the arrow.
To remove a label; right-click the ruler, and click Delete Label.
You can also use the spectrum menu options. To display the menu, right-click the background of the spectrum. The options are:
New Label for Spectrum A: Add additional information to the arrow
Delete Labels has two options
Spectrum A: Delete a labels from spectrum A
All Spectra: Delete labels on all spectra

57
Labeling in Chromatogram and Spectrum Displays
Creating a Label
Click on New Label for Plot/Spectrum… in the right-click menu in the Spectrum or Chromatogram window. This will create a label with the default name “New Label” and will also open the Edit Label Dialog.
Enter the text of the new label. Press the Enter key to start a new line in the label. When finished entering the text of the label click OK to close the dialog and display the label. For example, if the label text “This is a Test Label” is entered and OK is clicked, this will be the appearance on the Chromatogram screen:

58
Adjusting Label Display Parameters
Once a label has been created, its display parameters may be adjusted as desired.
Move the mouse cursor over the label so that the cursor becomes a hand-
shaped symbol. Click on the label and drag it to the desired position in the
display. The pointer may be moved by clicking and dragging in the same way.
Colors and Fonts may be selected in the Edit Label Dialog.
To select a background color, first make sure the menu item Transparent
Background is NOT checked, and then click on to select a color
for the background. In this example, the Font Size for the label is changed to 14
and the background color green is selected.
Editing an Existing Label
To edit an existing label, double-click on the label with the mouse to open the Edit Label Dialog, or select Properties from the right-click menu.
Removing a Label
Double-click on the label to open the Edit Text Label Dialog, then click Delete, or select Delete Label from the right-click menu.
Labels During Printing/Spooling Operations
Any labels created will be shown on printed documents and will be saved in Reports (*.msr) files if printed while the Chromatograms menu feature Send Reports to Spooler File is active.
Saving Spectrum and Chromatogram Reports in a Spooler File
If the Spooler File feature is activated with the menu command File… Send Reports to Spooler File, any Report is automatically sent to the master spooler file when Print… Spectra or Print… Chromatogram is clicked. It is possible to later review and print all or parts of the spooler file. For details on the use of this feature, see “Spooler Files”.
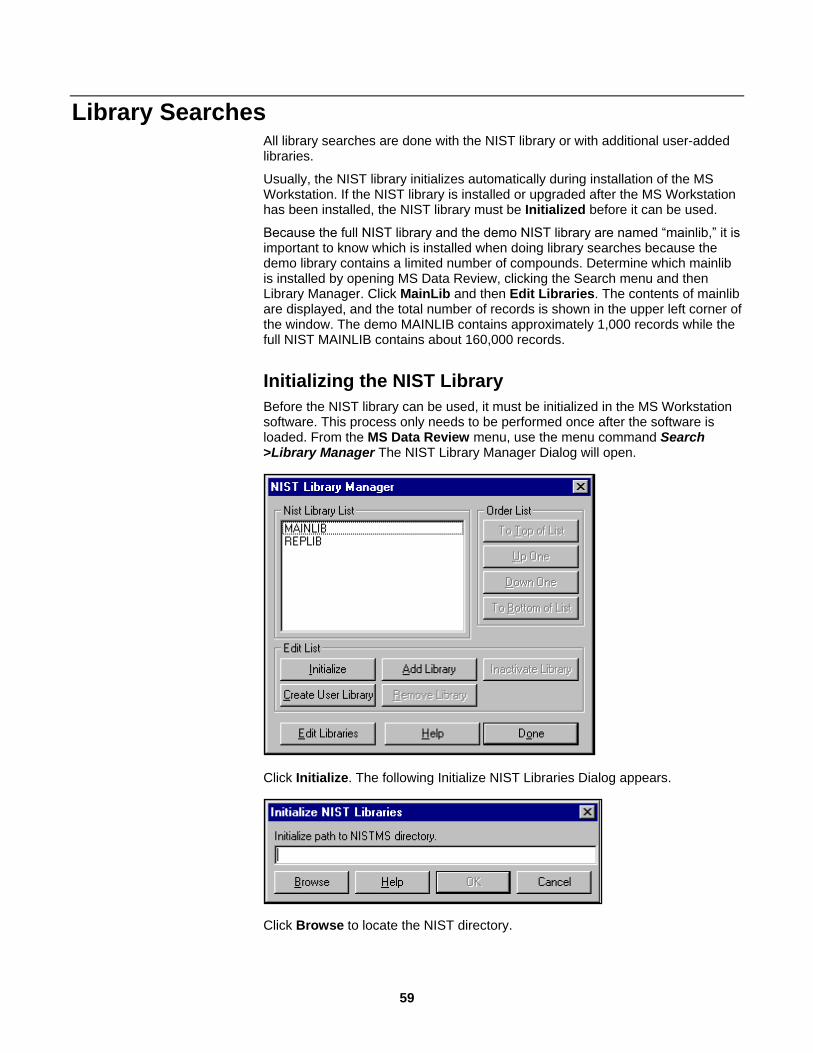
59
Library Searches All library searches are done with the NIST library or with additional user-added libraries.
Usually, the NIST library initializes automatically during installation of the MS Workstation. If the NIST library is installed or upgraded after the MS Workstation has been installed, the NIST library must be Initialized before it can be used.
Because the full NIST library and the demo NIST library are named “mainlib,” it is important to know which is installed when doing library searches because the demo library contains a limited number of compounds. Determine which mainlib is installed by opening MS Data Review, clicking the Search menu and then Library Manager. Click MainLib and then Edit Libraries. The contents of mainlib are displayed, and the total number of records is shown in the upper left corner of the window. The demo MAINLIB contains approximately 1,000 records while the full NIST MAINLIB contains about 160,000 records.
Initializing the NIST Library
Before the NIST library can be used, it must be initialized in the MS Workstation software. This process only needs to be performed once after the software is loaded. From the MS Data Review menu, use the menu command Search >Library Manager The NIST Library Manager Dialog will open.
Click Initialize. The following Initialize NIST Libraries Dialog appears.
Click Browse to locate the NIST directory.
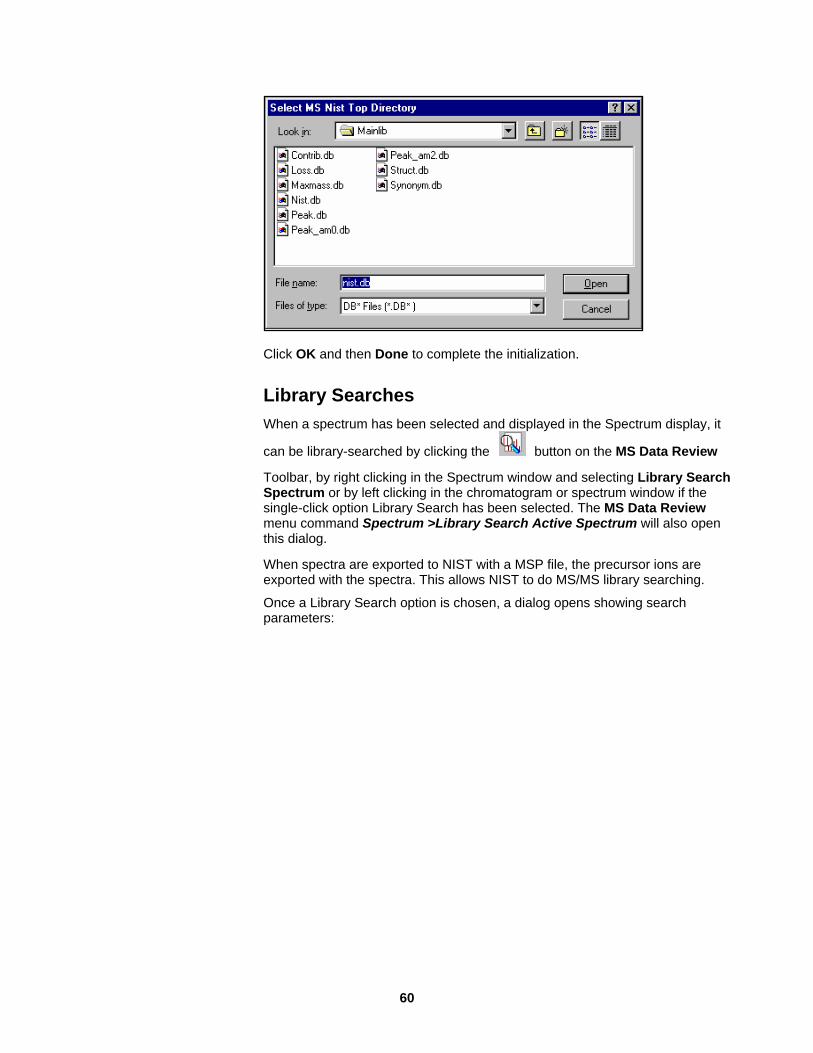
60
Click OK and then Done to complete the initialization.
Library Searches
When a spectrum has been selected and displayed in the Spectrum display, it
can be library-searched by clicking the button on the MS Data Review
Toolbar, by right clicking in the Spectrum window and selecting Library Search Spectrum or by left clicking in the chromatogram or spectrum window if the single-click option Library Search has been selected. The MS Data Review menu command Spectrum >Library Search Active Spectrum will also open this dialog.
When spectra are exported to NIST with a MSP file, the precursor ions are exported with the spectra. This allows NIST to do MS/MS library searching.
Once a Library Search option is chosen, a dialog opens showing search parameters:

61
The results are then displayed in the Library Search Dialog:
If Show Spectra Comparison and Show Difference Spectrum are selected in the Spectra Plot Preferences Dialog Menu, the search window appears as above.

62
Library matches (Hits) will be shown in the left window, while the spectrum, the match spectrum, and the difference spectrum will be shown in the right window.
The relative positions of the windows may be changed using the Rotate button.
Results for different matches may be examined by using the Up or Down arrow or by highlighting different entries in the Hits list. Several options for printing results are available when File >Print… is selected:

63
NIST Target Search
Target searches are the most commonly used search type. In this type of search, a search spectrum selected from the Chromatogram display is compared to each of the mass spectra in the NIST Main Library and/or the NIST Replicate Library or a user library. The parameters in the spectral comparison are set in the NIST Search for Target Spectrum Dialog, which is accessed from the MS Data
Review menu Search…Library Search a Spectrum 1A. Then click on the Do
NIST Search button in the Toolbar of the Library Search a Spectrum window.
Target Searches
For standard target searches (matching library spectra to an unknown search spectrum), it is recommended to select a Normal Identity Search.
Quick identity searches are faster than Normal searches but use a less thorough algorithm for the search process than Normal searches. The performance of Identity searches may be enhanced by using the “Edit Constraints” button. For example, if you know that the compound whose spectrum you are looking for must include one chlorine and one sulfur atom, you can specify this restriction under Edit Constraints. To examine further the available constraints, go to the Edit Constraints Dialog.

64
Similarity Searches
Similarity searches are used to find compounds similar to the search spectrum. For example, the Identity Search might identify the target molecule but the Similarity Search will further identify spectra for molecules with a similar structure.
Simple Similarity Search - provides results which approximate a Normal Identity Search but the high mass peak index is not used and wider abundance windows are used for comparison.
Hybrid Similarity Search - uses parameters for both Neutral Loss (set in the Edit Constraints dialogs under Peak constraints) and Molecular Weight (set in this dialog page). Enter the known or suspected Molecular Weight for the compound. This search is a combination of the Simple and Neutral Loss Similarity Searches.
Neutral Loss Similarity Search - enter neutral losses to be checked for by the search in the Edit Constraints dialog under the Peaks tab dialog. A neutral loss of 0 requires that the molecular ion be present in the match spectrum. The search is useful to identify mass spectra with similar fragmentation patterns to the search spectrum, even if the compounds have different molecular weights from the search spectrum.
Additional parameters used in Similarity Searches are:
Molecular Weight - the known or suspected molecular weight for the target mass spectrum. This feature is active only for Neutral Loss and Hybrid Similarity searches. To use a Molecular Weight constraint for Identity searches, set the required MW under Edit Constraints.
Reverse Search - matches are calculated by ignoring any ions in the Search mass spectrum, which are not present in the library spectra. This has the effect of treating the extra ions in the target spectrum as impurities.
The NIST Search Menu
NIST searches can be refined under the Library Search a Spectrum Window
that appears after a NIST target search. Click on the icon and access the menu choices listed below:

65
NIST Peaks Search
If something is known about the ions and intensities to be expected in a mass spectral match, use the NIST Peaks Search to progressively narrow the field for the search.
As each peak is entered, an automatic update is obtained of how many spectra in the library match all of the peak requirements in the Peaks/Hits field in the lower right of the dialog.
Four different types of ion peaks may be specified for the search:
Normal - The ion chosen must be present in the Match spectrum in the abundance range selected.
Loss - Select a loss from 0 to 64u. An ion must be present at the chosen m/z loss from the molecular ion m/z. For example, you might choose 35 if you expect a fragment ion from the loss of a chlorine atom from the molecular ion. Selecting 0 requires that the molecular ion be present in the Match spectrum.
Rank - Specify by mass (m/z) and give a range for the order of the peak from Base Peak (Rank 1) to 16th largest peak (Rank 16).
MaxIon - Specify the highest significant mass peak in the spectrum and enter an abundance range (1 to 100% allowed). Matches will contain the specified peak within the chosen abundance range and no large peaks at higher masses.
Choose a peak type, enter the information in the fields to the right, and press
to enter the peak to the Peak List below. Enter the peak to the Ion field depending upon the peak type. (Enter the m/z for the required ion if a Normal peak. Enter the m/z for the loss if a Loss Peak, the Rank from 1 to 16 in relative intensity if a Rank Peak. Enter the highest m/z expected if a MaxIon peak.)

66
The number of Matching spectra in the library will be updated in the Peaks/Hits Table below. The Hits field shows how many spectra in the libraries searched meet the requirements for each individual peak. This table is automatically updated with the number of library entries passing the criteria in the Peaks List above.
To display the results in the Library Search window, press .
NIST Name Search
To search for the presence of a name fragment type in the fragment and a
Starting Search index number. The library search will list all entries containing
the name fragment within the primary name field or in the synonym field. Specify
a maximum number of final search hits between 1 and 100.
Check a-z only to display the name found even if there are prefixes in front. For example, entering pentane for the name fragment and checking a-z only will return results for pentane, 1-pentanol, etc.
NIST Sequential Library Search
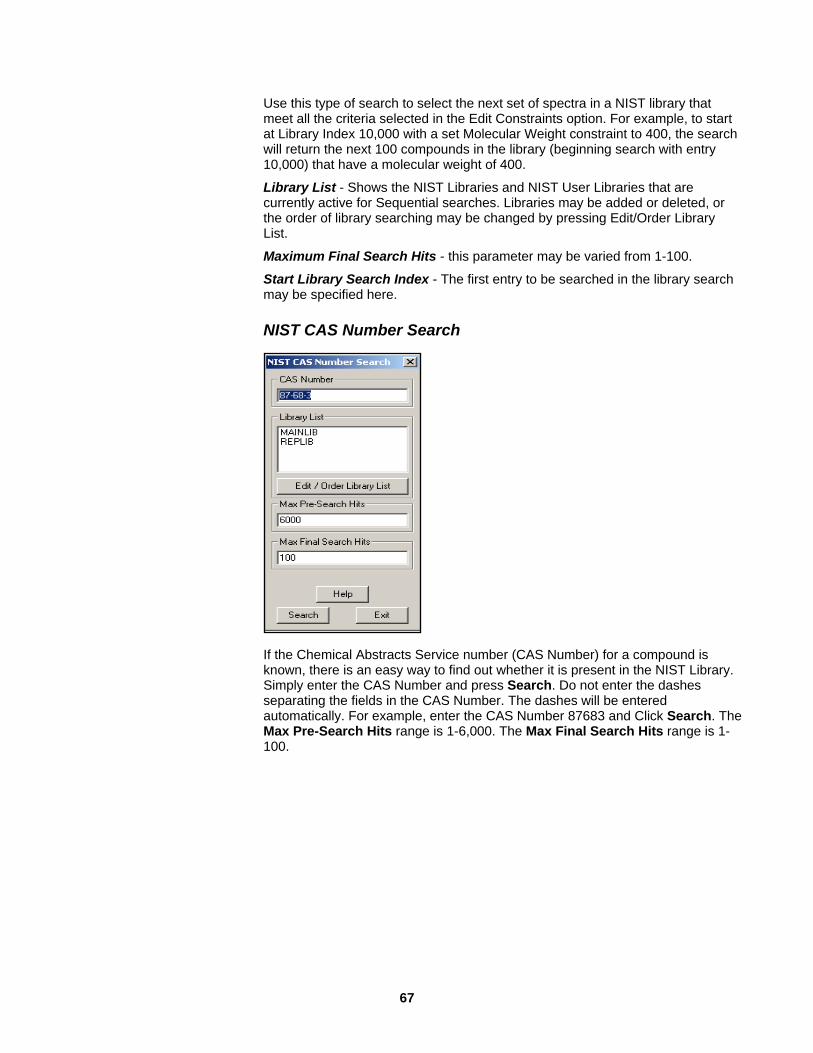
67
Use this type of search to select the next set of spectra in a NIST library that meet all the criteria selected in the Edit Constraints option. For example, to start at Library Index 10,000 with a set Molecular Weight constraint to 400, the search will return the next 100 compounds in the library (beginning search with entry 10,000) that have a molecular weight of 400.
Library List - Shows the NIST Libraries and NIST User Libraries that are currently active for Sequential searches. Libraries may be added or deleted, or the order of library searching may be changed by pressing Edit/Order Library List.
Maximum Final Search Hits - this parameter may be varied from 1-100.
Start Library Search Index - The first entry to be searched in the library search may be specified here.
NIST CAS Number Search
If the Chemical Abstracts Service number (CAS Number) for a compound is known, there is an easy way to find out whether it is present in the NIST Library. Simply enter the CAS Number and press Search. Do not enter the dashes separating the fields in the CAS Number. The dashes will be entered automatically. For example, enter the CAS Number 87683 and Click Search. The Max Pre-Search Hits range is 1-6,000. The Max Final Search Hits range is 1-100.

68
Hexachlorobutadiene (CAS Number 87-68-3) is the Match identified by the CAS Number Search.
NIST Formula Search
Enter the complete chemical formula in the formula field. Respect upper/lower case requirements. (Chlorine is designated Cl, not CL). Then click Search.

69
NIST Molecular Weight Search
If the molecular weight of the compound is known, use this search to find all of the compounds with same molecular weight in the NIST library. The Max Pre-Search Hits field may be varied from 1 to 6,000. The Maximum Final Search Hits field may be varied from 1 to 100.
When Use Constraints is selected, the search uses the designated MW and the constraints selected in Edit Constraints. For example, all the entries with a MW of 400 but containing some of the elements C, H, and Cl, and no others can be searched. The Overall Edit Constraints dialog then looks like this:
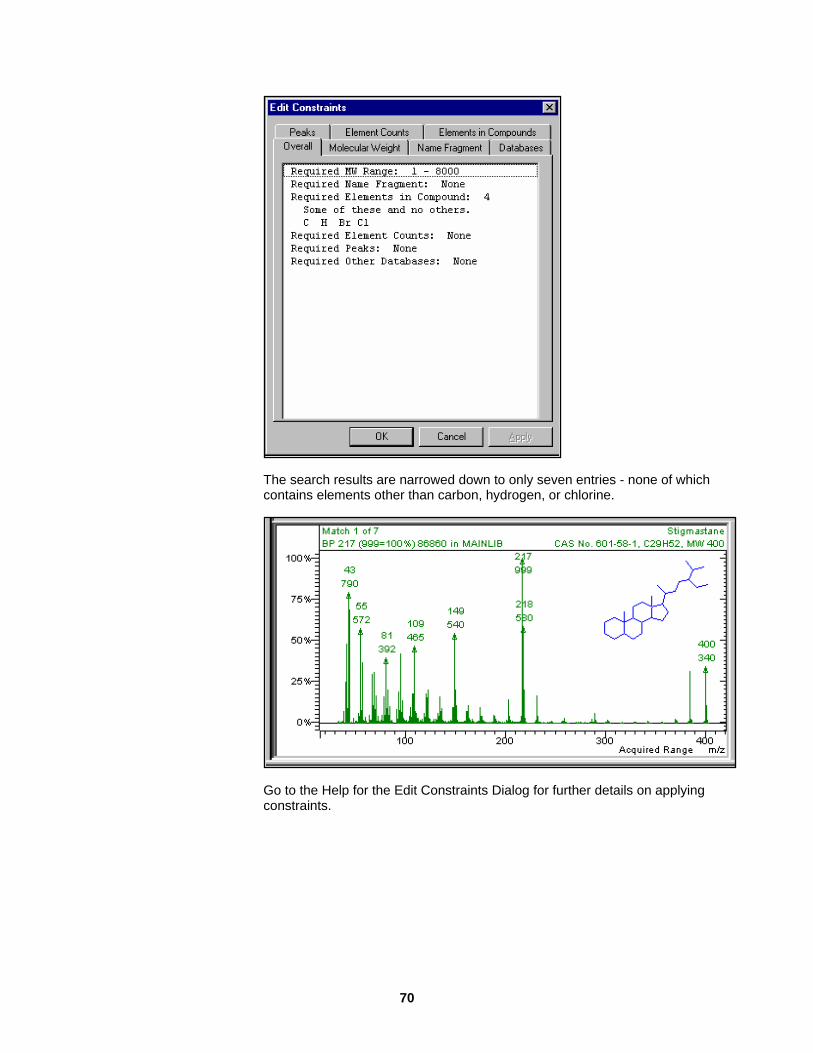
70
The search results are narrowed down to only seven entries - none of which contains elements other than carbon, hydrogen, or chlorine.
Go to the Help for the Edit Constraints Dialog for further details on applying constraints.

71
Creating and Using Spectrum Lists Spectrum Lists are sets of mass spectra that can be added to from various sources such as chromatograms, mass spectral libraries, and other spectrum lists. Entries in a Spectrum List can be edited to add or change Ion/Intensity information, Names, Comments, MW, CAS Number, Formula, etc., in the same way that standard NIST libraries can be edited. The entire Spectrum List can also be library searched by NIST-type searches. The Library Search results can be attached to the information for each entry in the library.
You can use a Spectrum List five ways:
1. When the NIST Mass Spectral Search Program is run as a separate application, you can Import a Spectrum List and search the mass spectra in the list. (File…open)
2. You can perform an automated List Search on all of the mass spectra in the Spectrum List and view information on the best library match for each list entry.
3. It is possible to open a chromatogram and perform a Chromatogram Search to find out whether any of the compounds in the Spectrum List are present in the chromatogram (and without the need to have an estimate of the retention times for the list entries).
4. The Spectrum List can be converted to a Target List.
5. The Spectrum List can be imported into a data handling method compound table.
Creating a Spectrum List
If trying to Auto Add to a Spectrum List or do a Spectrum List search when no Spectrum List is attached, a dialog allowing the selection of a spectrum list file will appear. For example, if in MS Data Review, use the Chromatogram menu command Target List Search Active Chromatogram… when it doesn‟t have a Spectrum List identified. The Spectrum List Manager will appear.
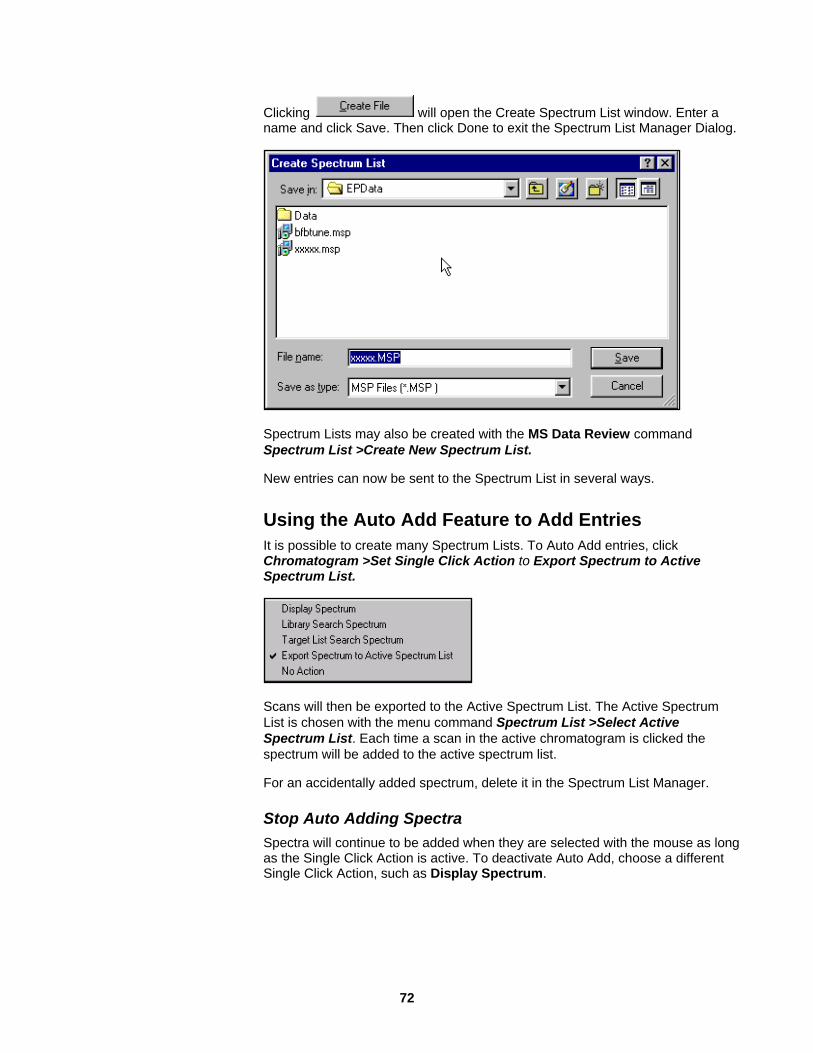
72
Clicking will open the Create Spectrum List window. Enter a name and click Save. Then click Done to exit the Spectrum List Manager Dialog.
Spectrum Lists may also be created with the MS Data Review command
Spectrum List >Create New Spectrum List.
New entries can now be sent to the Spectrum List in several ways.
Using the Auto Add Feature to Add Entries
It is possible to create many Spectrum Lists. To Auto Add entries, click Chromatogram >Set Single Click Action to Export Spectrum to Active Spectrum List.
Scans will then be exported to the Active Spectrum List. The Active Spectrum
List is chosen with the menu command Spectrum List >Select Active
Spectrum List. Each time a scan in the active chromatogram is clicked the
spectrum will be added to the active spectrum list.
For an accidentally added spectrum, delete it in the Spectrum List Manager.
Stop Auto Adding Spectra
Spectra will continue to be added when they are selected with the mouse as long as the Single Click Action is active. To deactivate Auto Add, choose a different Single Click Action, such as Display Spectrum.

73
Adding Entries to Spectrum Lists from a Library
By opening a user library or standard commercial library file in the NIST Library Editor, it is possible to Export entries to a Spectrum List.
This is a way to create spectrum lists manually. Usually, it will be more convenient to add entries automatically, as described in the next section.
Procedure to add entries manually after the first injection:
1. Use the features of the NIST non-target library searches to identify the CAS number for each compound of interest. For example, do Searches with the known name fragment or molecular weight as constraints.
2. Open the NIST program NIST MS Search and search for the listing using the CAS number. When the Window with the listing comes up, note the ID # for that compound.
3. Open the NIST Library Editor from the MS Data Review toolbar: Search >Library Manager >MAINLIB and then Edit Libraries. Using the ID#, highlight the compound in the library list and use the Export >To Spectrum List command to add the entry to the Spectrum List.
4. After adding all of the entries and a collected data file for the solution containing the target compounds, run a Chromatogram search to find the components. See “Performing Chromatogram Searches”.
Adding Entries Automatically to Spectrum Lists from a Chromatogram
Spectrum List >Build Spectrum List From Active Chromatogram displays an Integration Parameters dialog, integrates the chromatogram with the specified parameters and adds the apex spectra of the integrated peaks to the spectrum list.
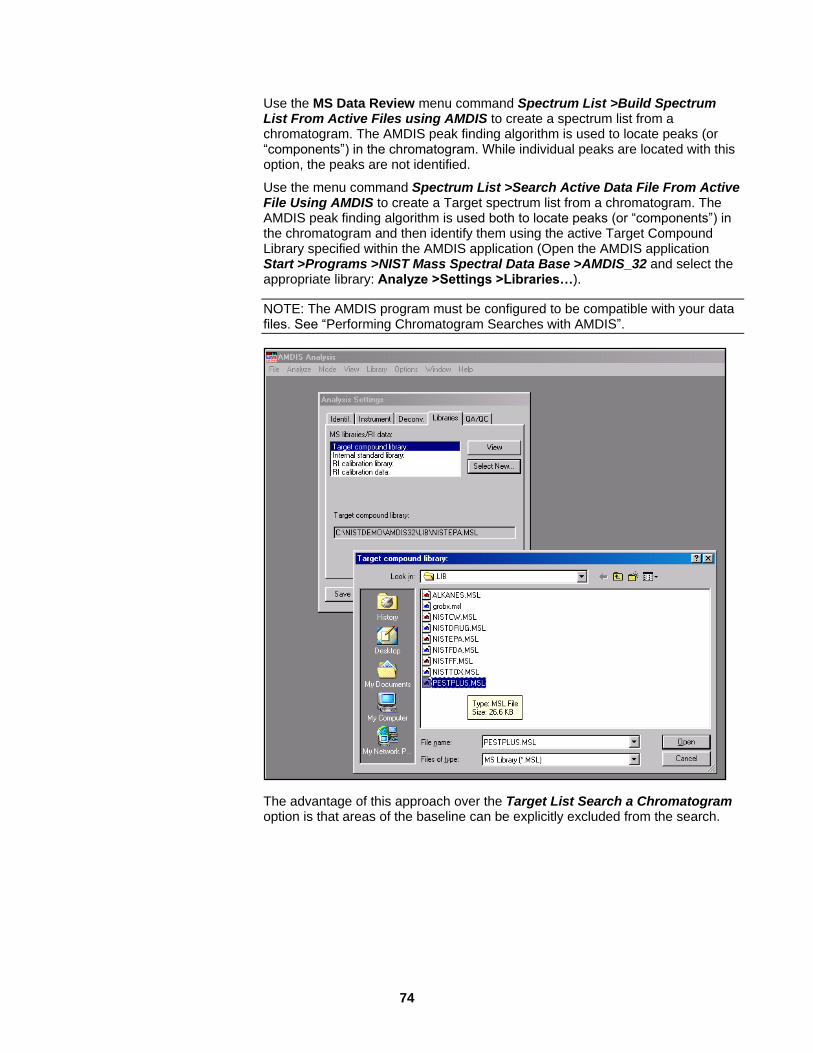
74
Use the MS Data Review menu command Spectrum List >Build Spectrum List From Active Files using AMDIS to create a spectrum list from a chromatogram. The AMDIS peak finding algorithm is used to locate peaks (or “components”) in the chromatogram. While individual peaks are located with this option, the peaks are not identified.
Use the menu command Spectrum List >Search Active Data File From Active File Using AMDIS to create a Target spectrum list from a chromatogram. The AMDIS peak finding algorithm is used both to locate peaks (or “components”) in the chromatogram and then identify them using the active Target Compound Library specified within the AMDIS application (Open the AMDIS application Start >Programs >NIST Mass Spectral Data Base >AMDIS_32 and select the appropriate library: Analyze >Settings >Libraries…).
NOTE: The AMDIS program must be configured to be compatible with your data files. See “Performing Chromatogram Searches with AMDIS”.
The advantage of this approach over the Target List Search a Chromatogram option is that areas of the baseline can be explicitly excluded from the search.

75
The Spectrum list thus generated can then be searched using the Search
Spectra button and choosing Library Search Active Spectrum List from
the pop up menu, or the menu command Search >Library Search a Spectrum List, which will search all of the entries in the spectrum list:

76
Editing a Spectrum List
Editing a Spectrum List is done from the Spectrum List window. If a Spectrum List window is not open, use the menu command Spectrum List >Edit Spectrum List to choose the spectrum list to be edited. It is possible to View, Add/Delete, Export/Import, and Print entries in the list. Clicking the Edit Spectrum
button while an individual entry is highlighted allows editing of its spectrum.
The displayed entry may be edited to adjust Ion/Intensity or to add additional information such as Name, CAS Number, Molecular Weight, Formula, etc.
NOTE: An important difference between editing a list entry and editing a library entry is that edited Spectrum List entries can be saved back to the same list entry in their edited form.
A List Search can be started by clicking the Search button, as above. This feature is discussed in the following section.
Performing List Searches
Open an existing Spectrum List in the Spectrum List Window and click Search
or use the MS Data Review menu command Search > Library Search a Spectrum List to open the List Search Dialog.

77
Running the List Search
Click to do a NIST type of Target search. The search will begin and a Progress Indicator will show how far the search has proceeded. When the search is completed, the best library match meeting the search will be entered for each entry in the list.
Examining the Search Results
The search results appear in the Spectrum List window. The relative sizes of the display fields may be adjusted by clicking on the Splitter Bars separating the field names. When the entire field is not displayed, use the scroll bars in the displays to view the remainder of the display field.
Match Name - the name for the best library match is shown in this field.
Spectrum - The spectrum of the List entry (search) is shown in the top field, the match spectrum in the middle field, and the difference at the bottom. Use the right-click commands to hide any of the displayed spectra. If a pound sign (also called a hash mark) appears in the right of the match spectrum, the structure of the match is also available and can be displayed by expanding the size of the spectrum display with the splitter bar or by hiding the Match and/or Difference spectra.
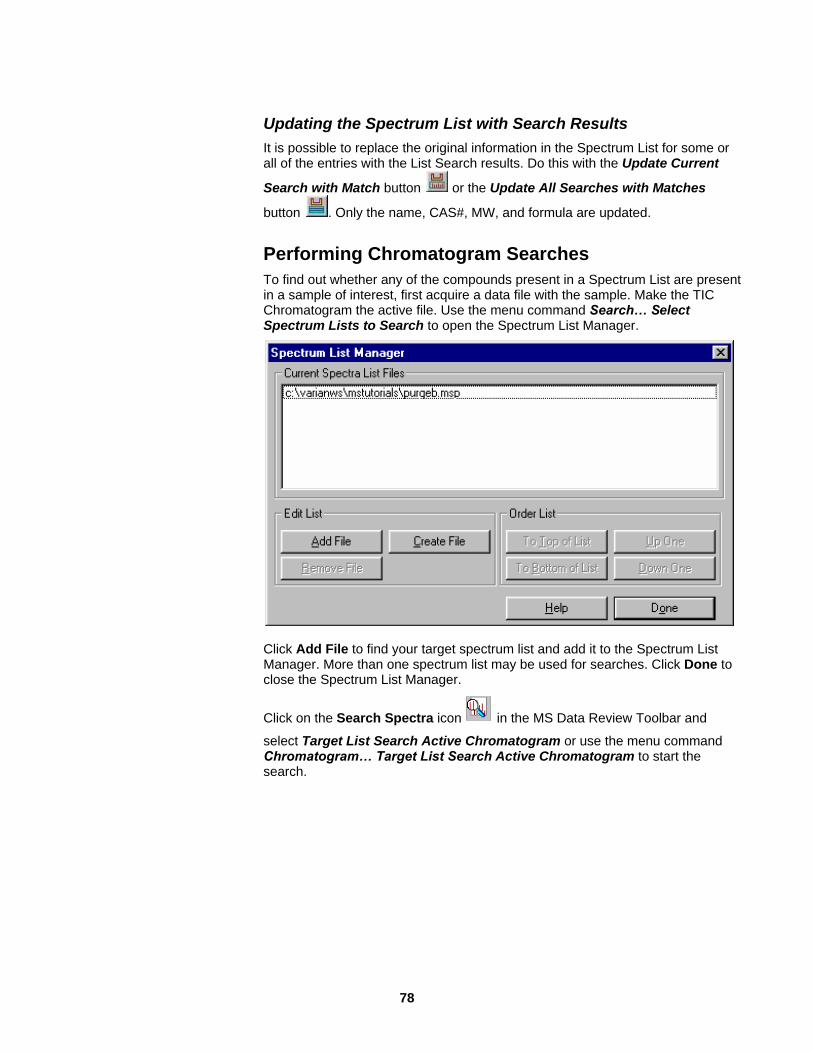
78
Updating the Spectrum List with Search Results
It is possible to replace the original information in the Spectrum List for some or all of the entries with the List Search results. Do this with the Update Current
Search with Match button or the Update All Searches with Matches
button . Only the name, CAS#, MW, and formula are updated.
Performing Chromatogram Searches
To find out whether any of the compounds present in a Spectrum List are present in a sample of interest, first acquire a data file with the sample. Make the TIC Chromatogram the active file. Use the menu command Search… Select Spectrum Lists to Search to open the Spectrum List Manager.
Click Add File to find your target spectrum list and add it to the Spectrum List Manager. More than one spectrum list may be used for searches. Click Done to close the Spectrum List Manager.
Click on the Search Spectra icon in the MS Data Review Toolbar and
select Target List Search Active Chromatogram or use the menu command Chromatogram… Target List Search Active Chromatogram to start the search.

79
Another way is to select Search>Target List Search a Chromatogram>Active Chromatogram.
After confirming the search parameters, click on the Search button to finish the target search.
There are several powerful adjustments you can make in the parameters besides choosing the search type and the library fit threshold. For example, use the xx.xx % RIC field to select a minimum RIC value for the search. Scans with an intensity below this % RIC will not be searched. More information on these adjustments is found in the Help screens for the Chromatogram Search Parameters Dialog.
When parameters have been selected click . The Search Status indicator will display the progress of the search.

80
Examining the Chromatogram Search Results
The Search Results field is a text summary of the search results, showing the Spectrum List Target Entry Name, the Scan Number and Retention Time of the best Match to the Target and the Reverse Fit, and Fit results. If no spectra in the chromatogram meet the requirements specified in the Chromatogram Search Parameters dialog, NO MATCH is displayed as the result.
The Spectrum Display shows the best match spectrum in the Target Chromatogram for the highlighted Spectrum List entry. To go to another entry use the keyboard up- and down-arrows to move the highlight or select an entry in the List field with the mouse. If Show All Spectra is active, the List Spectrum is shown in the top field, the Match spectrum from the Chromatogram is shown in the middle field, and the Difference Spectrum is displayed in the bottom field.
The Chromatogram Display shows the name labels at the retention time of the best Match spectrum from the Chromatogram Search. The display may be expanded by dragging the mouse below the X-axis. Use the Previous and Next buttons to scan through the results. The name labels persist on the chromatogram when the MS Data Review is displayed.
Performing MS Windows NIST Library Searches
Spectrum List files have the extension .msp. This makes them compatible with requirements for importing to the MS Windows NIST Library Search application, which may be run independently of the MS Workstation software. If you are planning to import MS Workstation Spectrum Lists to this program, note the location where you have been saving your list files.
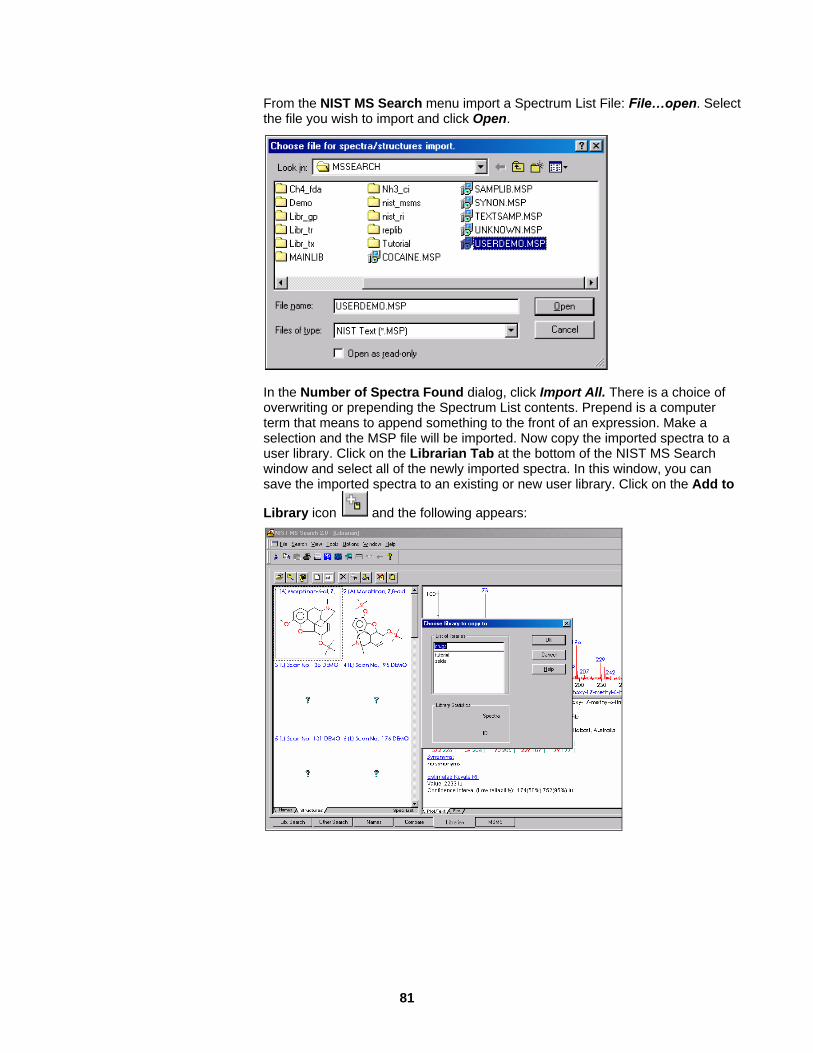
81
From the NIST MS Search menu import a Spectrum List File: File…open. Select the file you wish to import and click Open.
In the Number of Spectra Found dialog, click Import All. There is a choice of overwriting or prepending the Spectrum List contents. Prepend is a computer term that means to append something to the front of an expression. Make a selection and the MSP file will be imported. Now copy the imported spectra to a user library. Click on the Librarian Tab at the bottom of the NIST MS Search window and select all of the newly imported spectra. In this window, you can save the imported spectra to an existing or new user library. Click on the Add to
Library icon and the following appears:
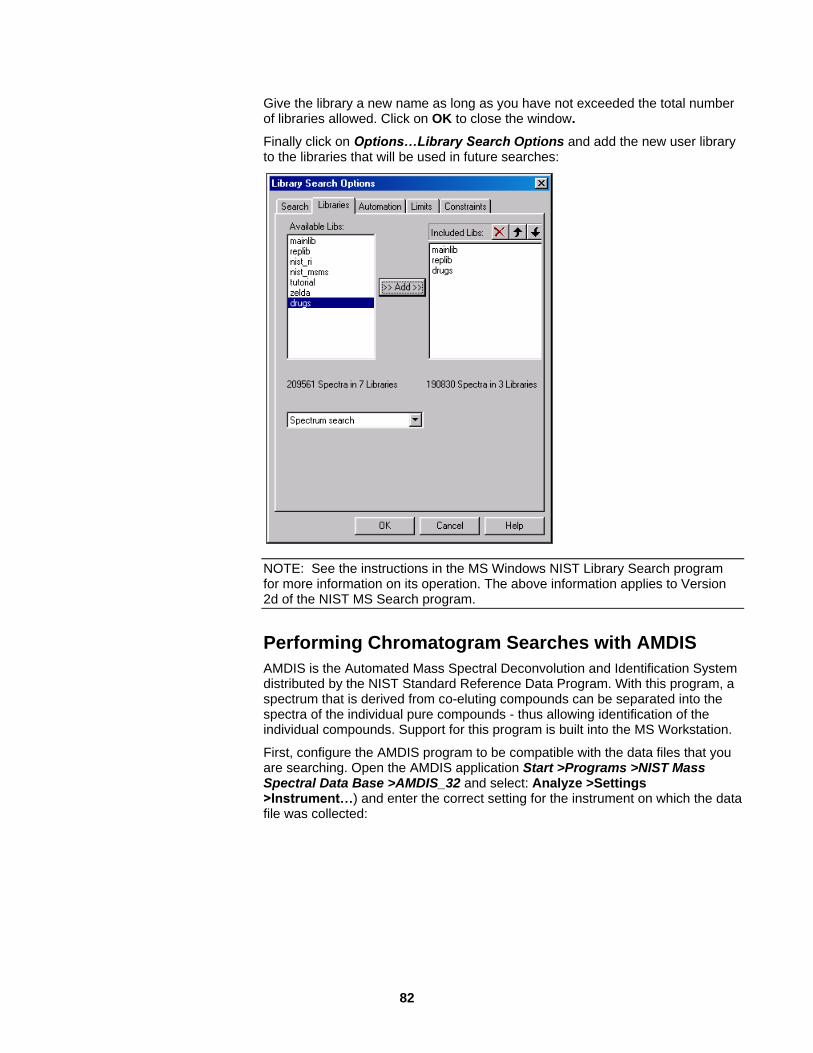
82
Give the library a new name as long as you have not exceeded the total number of libraries allowed. Click on OK to close the window.
Finally click on Options…Library Search Options and add the new user library to the libraries that will be used in future searches:
NOTE: See the instructions in the MS Windows NIST Library Search program for more information on its operation. The above information applies to Version 2d of the NIST MS Search program.
Performing Chromatogram Searches with AMDIS
AMDIS is the Automated Mass Spectral Deconvolution and Identification System distributed by the NIST Standard Reference Data Program. With this program, a spectrum that is derived from co-eluting compounds can be separated into the spectra of the individual pure compounds - thus allowing identification of the individual compounds. Support for this program is built into the MS Workstation.
First, configure the AMDIS program to be compatible with the data files that you are searching. Open the AMDIS application Start >Programs >NIST Mass Spectral Data Base >AMDIS_32 and select: Analyze >Settings >Instrument…) and enter the correct setting for the instrument on which the data file was collected:

83
Then make the chromatogram active and click on the Export Chromatogram to
AMDIS icon .
After the progress bars finish displaying, the AMDIS Results window will appear:
In this case, the NISTEPA target library was used to identify the compounds in the chromatogram. There are other libraries available, depending upon the application. For complete documentation of AMDIS, see the user‟s guide and other manuals available on the MS Workstation distribution disk.

84
Printing and Spooling Features in MS Data Review
Printing Chromatogram and Spectrum Reports
Make Reports Dialog
Open the Make Reports dialog by doing one of the following:
Click the Print icon
Use the menu command File >Print
Right-click in the chromatogram or spectra fields and select Print.
For chromatogram reports, select the Chromatogram Window Reports Tab and choose an option; then press Print.

85
To print spectra reports, choose the Spectra Window Reports tab:
Report Preferences Dialog
Change the appearance of reports by clicking on the Report Preferences Box in
Make Reports. This opens the Report Preferences Dialog. For example, you
can print the ion/intensity list when you print spectra. Click the Spectra Reports
tab in the Report Preferences Window and select Show Spectrum Ion
Intensity Pairs.

86
Use the Misc. tab to suppress the Print Date on printed reports.

87
Calibration Curve Preferences
You can change the thickness of the calibration line in your reports.
Show/Hide Processing Annotations
If you have done processing to quantitate a file and/or to identify unknown peaks, there is an option to attach result labels to the peaks in the active chromatogram. The selection of options is accessed with by right clicking in the chromatogram field and selecting Chromatogram Plot Preferences or by selecting Preferences…Plots View Chromatogram pane from the MS Data Review Main Menu. Select the DH Annotations Tab and uncheck Show Data Handling Annotations to hide labels.
Viewing and Printing Log Information
Extensive information about how a data file was acquired is saved along with the mass spectral data whenever a data file is acquired. It is always possible to access this information to review the AutoSampler, GC, and MS methods used to acquire the data.
Accessing and Viewing the Log Information
Open the data file. If the acquisition segments are not shown (the default setting), then check Show Acquisition Segments in the Features tab of Chromatogram Plot Preferences, see Setting Chromatogram Preference Menus to display the individual acquisition segments underneath the horizontal axis. In this file there were two segments: a Filament/Multiplier Delay segment and an EI/MS segment.
When displaying more than one file in a Chromatograms window, the acquisition segments and scan number scale of the active file will be displayed.

88
When the curser is held over the Segment Bar area, the word Log appears as part of the cursor. Clicking in a Segment Bar opens the Data File Information Dialog with information on the Segment selected.

89
Click the categories listed in the left to select information for view. Some display modes will contain more information than can be displayed in the field. When this occurs, a scroll bar will appear on the right of the display. Move the bar up and down to view the entire field. It is also possible to highlight a line in the display area and use the up and down arrows on the keyboard to scroll through the information displayed.
Information Fields in the Log
The information fields displayed are instrument dependent. For example, the log shown above was generated by a Saturn 2000 GC/MS system. The fields shown for this system are as follows:
Module Attributes - shows the Module Attributes information at the time the data file was acquired. The date and time that each test was performed is included. Documentation of the following Auto Tune and Adjustment procedures is displayed:
Setpoints - Trap, Manifold, and Transfer Line Temperatures, Filament Number, and Axial Modulation Voltage.
Air/Water Check
Integrator Zero Set
Electron Multiplier Set
RF Full Scale Adjust
Mass Calibration
Trap Function Calibration
Calibration Gas Adjust
SIS Calibration
CI Gas Adjust
RF Tuning Adjust
Mass Calibration Table
Events Log - shows the Acquisition Event Log, which includes the following information:
Pre-Acquisition Verification Tests
Pump Test
Gate Off Voltage Test
Gate On Voltage Test
RF Voltage Test
Axial Modulation Test
Manifold Temperature Test
Transfer Line Temperature Test
Multiplier Voltage Test
Filament Bias Test
Selected Trap Filament Test
Ion Gauge Filament Number
Ion Gauge Reading

90
Air Flow Sampling - if applicable
Acquisition - Actual End Time
Acquisition Method - for each Segment, documents Set Points information from the MS Acquisition Method.
Emission Current
Mass Defect
Mass Threshold
Multiplier Offset
Cal Gas (on or off)
Scan Time
Segment Start Time
Segment End Time
Segment Low Mass
Segment High Mass
Ionization Mode
Ion Preparation Technique
Each Segment documents the Ion Preparation information from the MS Acquisition Method. These parameters are specific to the type of ion preparation. For example, a Selected Ion Storage method to collect only the m/z range 100-425u would have these parameters documented:
Mass Range 1: 100 to 425
Ionization Storage Level: 48.0 m/z
Waveform Amplitude: AUTOSCALE
Amplitude Adjust Factor: 100%
Ion Mode - For each Segment, the Ionization Mode parameters in the MS Method are documented. These parameters are specific to the particular ion mode selected: EI-Auto, EI-Fixed, CI-Auto, or CI-Fixed.
Revision Log - the Revision Log shows a summary of all post-run processing that has been performed on the data file.
Printing Log Information
If in the View Log Dialog, click or to print to the printer or the spooler file. Clicking Print will select only the highlighted section for printing. Print All will print the complete log.
Log Information for Files Originally in *.MS Format
View GC/MS data files acquired with earlier versions of Saturn software in *.MS format, first convert the .ms file to .sms format.

91
Printing and Viewing Reports
Whenever is clicked or a menu command such as File >Print Active Chromatogram and Spectrum Plots is selected, a temporary Report file (*.msr) is created. If the File >Preview Reports option is selected, a Reports Dialog is opened so that this report may be previewed. If the option File >Preview Reports is not selected, the temporary report is sent to the printer immediately. If the File >Send Reports to Spooler File option is selected, this temporary reports file is immediately added to the Spooler File. The next section shows what can be done in the Reports Dialog that is opened in Print Preview mode.
Overview of Reports
The header field in the Reports dialog will have a different header name depending upon what type of report is requested. For example, the command File >Print >Print All Chromatograms would bring up a screen in the Report Window that looks like this:
One may also open a Reports Window with the Chromatograms menu command File >View Spooler File.
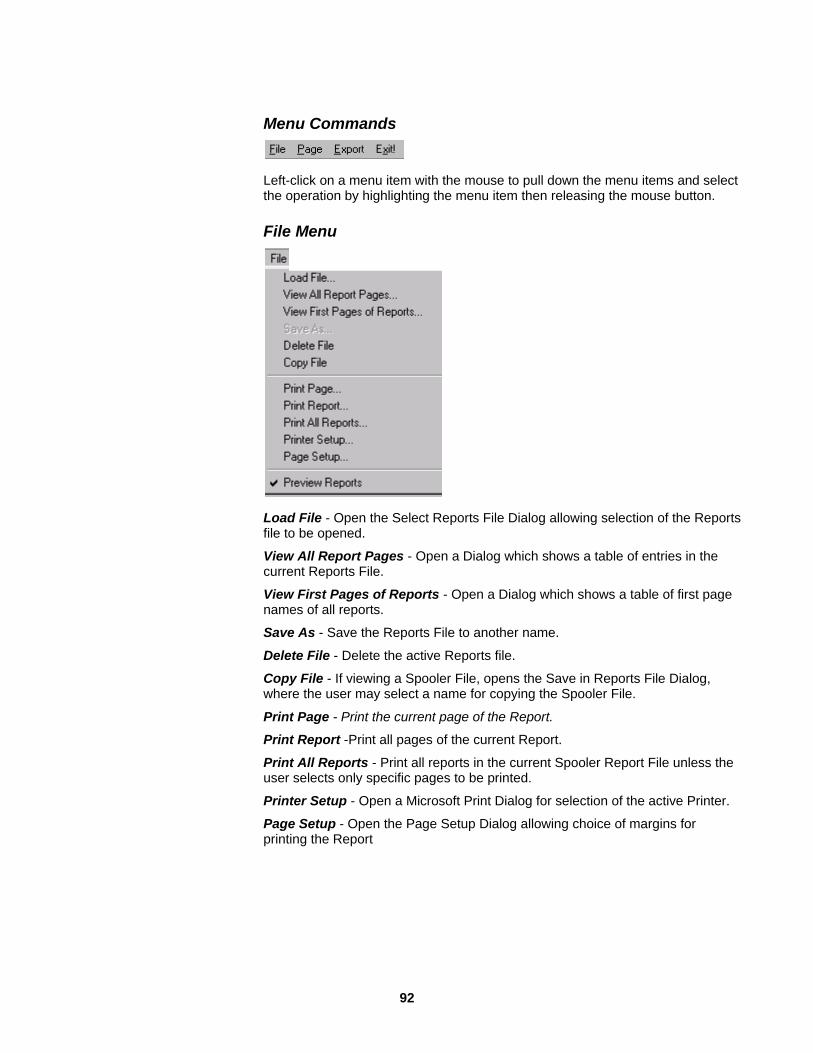
92
Menu Commands
Left-click on a menu item with the mouse to pull down the menu items and select the operation by highlighting the menu item then releasing the mouse button.
File Menu
Load File - Open the Select Reports File Dialog allowing selection of the Reports file to be opened.
View All Report Pages - Open a Dialog which shows a table of entries in the current Reports File.
View First Pages of Reports - Open a Dialog which shows a table of first page names of all reports.
Save As - Save the Reports File to another name.
Delete File - Delete the active Reports file.
Copy File - If viewing a Spooler File, opens the Save in Reports File Dialog, where the user may select a name for copying the Spooler File.
Print Page - Print the current page of the Report.
Print Report -Print all pages of the current Report.
Print All Reports - Print all reports in the current Spooler Report File unless the user selects only specific pages to be printed.
Printer Setup - Open a Microsoft Print Dialog for selection of the active Printer.
Page Setup - Open the Page Setup Dialog allowing choice of margins for printing the Report

93
Page Menu
Next Page - show the Next Page of the Report.
Previous Page - show the Previous Page of the Report.
Color - display the report in color.
Monochrome - display the report in monochrome mode.
Best - display and print Portrait or Landscape mode, as appropriate.
Portrait - display and print in Portrait mode.
Landscape - display and print in Landscape mode.
Delete Page - deletes the currently-displayed Page of the Report.
Delete Report - deletes the current Report.
Copy Page - copy the current page of the report to another report. This opens the Select Reports File Dialog and you can select the target report where the page is copied
Copy Report - copy the entire report to another existing report. Opens the Select Reports File Dialog allowing selection of a target report to which this report is to be copied.
NOTE: Changing the Report orientation does not take effect until the Print Preview dialog is closed and then opened again.
Export Menu

94
Export to ASCII- Create and save a text file.
Export Extracted Method- Extract and save the method used to generate the data file with all control and post run applications.
Exit - Closes the Reports Window and returns to the Chromatograms Window.
Reports Toolbar
Beneath the menus is the Reports Toolbar with associated options.
Help for the Reports Window.
Delete the current Page of the Report.
Show the Previous Page of the Report.
Show the Next Page of the Report.
Print the current Page of the Report (chromatograms and spectra).
Print all pages of the current Report
Print all reports in the current Spooler Report File unless the user selects only specific pages to be printed, see “Spooler Files”.
Display
When the Reports Window is opened, the current report is displayed in full-page Print Preview mode. Use the Previous and Next Page buttons on the toolbar to examine other pages in the Report. Use the “Print Page” or “Print Report” buttons to print.
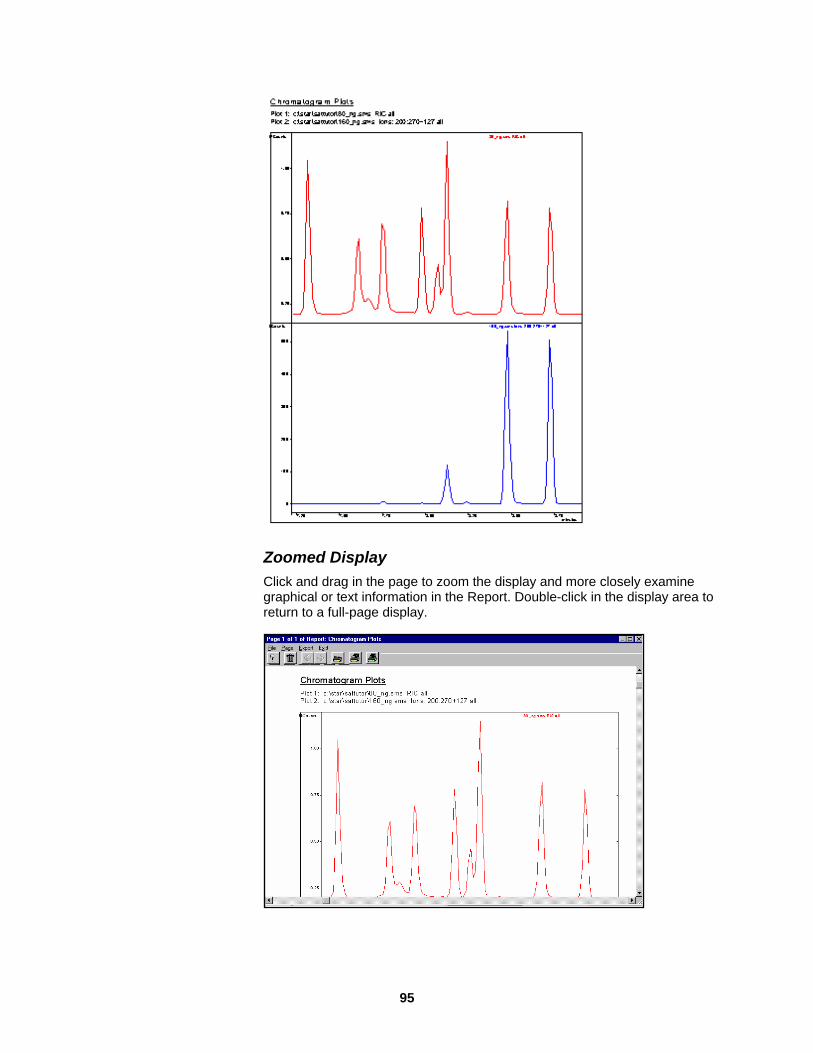
95
Zoomed Display
Click and drag in the page to zoom the display and more closely examine graphical or text information in the Report. Double-click in the display area to return to a full-page display.

96
Enabling/Disabling the Print Preview Option
Choose to preview a report before printing by using the menu command File >Preview Reports. For repetitive reports, remove the Print Preview by deselecting the option with the command in the MS Data Review menu File >Preview Printed Reports.
Spooler Files
A spooler file is a collection of individual reports, which has the same *.msr file extension as an individual report. The user can create any number of Spooler Files and select which spooler file to add to or view with the MS Data Review menu command File >Select Spooler File. The spooling feature becomes active when File >Send Reports to Spooler File option is checked. When the option is active, the Spooler automatically adds any report created when the user presses a Print button or uses a menu Print command.
Activating/Inactivating the Spooler File
Use the menu command File >Send Reports to Spooler File to turn the option on and off.
Selecting a Spooler File
Use the menu command File >Select Spooler File to choose the file you want to add entries to or to view.
Maximum Size of the Spooler File
User can add up to 15900 total pages to a Spooler File.
Viewing the Spooler File
When a Spooler File is opened for viewing File >View Spooler File, the first page of the latest report entered is displayed by default. The name of the Spooler File is displayed in the Header of the dialog. The Spooler File can be reviewed and printed in the same way as any individual report. These options are discussed in the section Overview of Reports Dialog.
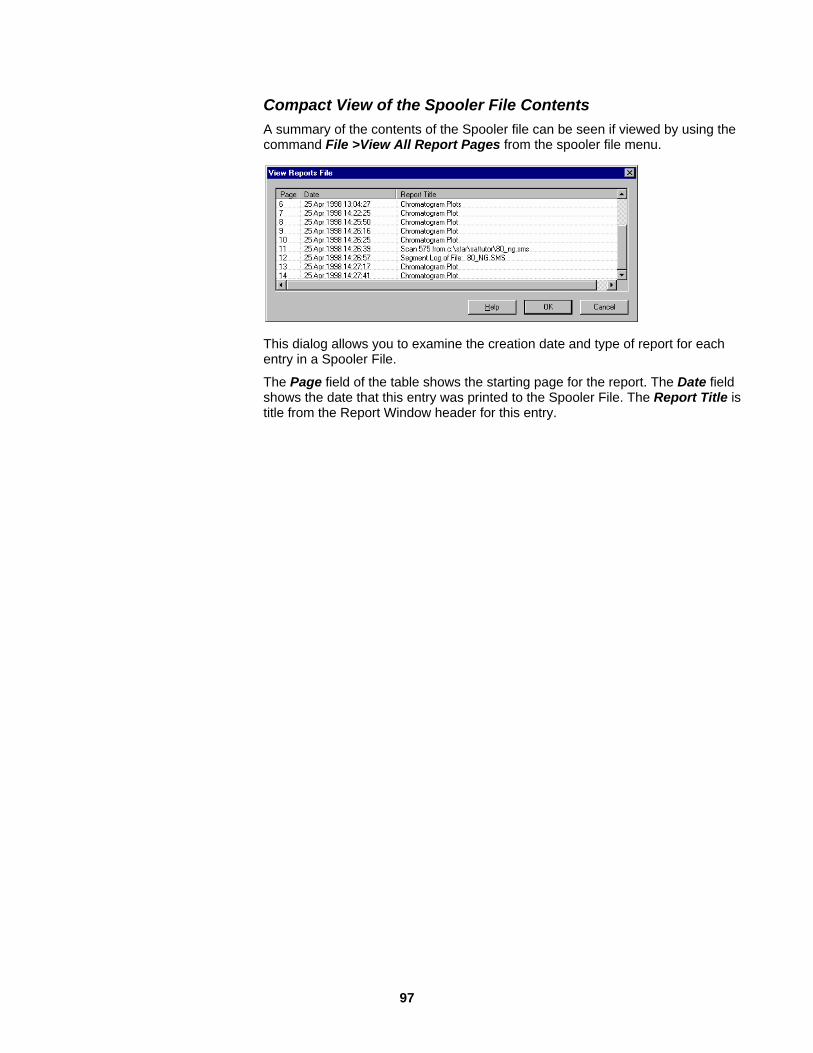
97
Compact View of the Spooler File Contents
A summary of the contents of the Spooler file can be seen if viewed by using the command File >View All Report Pages from the spooler file menu.
This dialog allows you to examine the creation date and type of report for each entry in a Spooler File.
The Page field of the table shows the starting page for the report. The Date field shows the date that this entry was printed to the Spooler File. The Report Title is title from the Report Window header for this entry.

98
Plot View Preferences
Setting Chromatogram Preference Menus
There are two ways to set Chromatogram Plot Preferences:
1. Right-click anywhere in the chromatogram. In the pop up menu, select “Chromatogram Plot Preferences”. A tabbed Chromatogram Plot Preferences window will appear.
2. Use the menu command Preferences… Plots View Chromatogram Pane and the same window will appear. Clicking the Colors menu tab will display the following:
Clicking on any of the colored boxes brings up a window to assign a new color to the plot, background, or segment designators.

99
The Labels menu tab allows assignment of a number of label attributes.
Change the attributes of plot axis from the Axes menu tab.

100
The chromatogram display font is chosen by clicking the Font tab.
Other tabs in the Chromatographic Plot Preferences window, such as noise, AMDIS annotations, Chromatogram Plot are related to subjects that will be discussed in later sections.

101
Quantitation
About MS Workstation Quantitation The process of determining the amount of an analyte present in a sample is defined as quantitation. The accuracy of the result is a measure of how close the determination is to the true value. The precision of a set of results is a measure of the reproducibility. Both the accuracy and the precision of quantitation results in LC/MS and GC/MS are critically dependent upon the quality of sample preparation, data acquisition, and data treatment. To obtain the best results in quantitative determinations, the user must be thoroughly familiar with procedures to optimize the performance of the instrument. Because quantitation is a challenging process, we have provided three approaches to explain the material.
Text Description: In this section, quantitation operations are explained in the order that they are performed in a normal analysis. You will learn about the different ways that data can be quantified with the Varian MS Workstation and about how to perform the required quantitation steps in the MS Data Review, System Control, Automation File Editor, and Method Builder applications.
NOTE: The overall process of quantitation requires operation in different applications within Varian MS Workstation. This Manual is intended to be the central point of reference for learning the process of quantitation in an orderly sequence. The individual manuals, or On-Line Help, for System Control, Automation File Editor, MS Data Review, and Method Builder applications should be consulted for additional information not covered in this section.
Quantitation Tutorials: If you are a new user of the Varian MS Workstation, you can get up to speed most easily by viewing the Quantitative Analysis of MS Data Tutorial.
On-Line Help: The various quantitation features available in the MS Data Review, System Control, Automation File Editor, and Method Builder applications of the software are also defined and discussed in the On-Line Help for the Varian MS Workstation.
102
Organization of Quantitation Topics If you are unfamiliar with quantitation on the Varian MS Workstation, read this introductory section to get an overview of the approaches to quantitation with Varian MS software and to become familiar with the definitions of terms frequently used in the quantitation process. If you are already familiar with the quantitation process and need more detail on a particular feature, refer to the appropriate section:
Sample Preparation
Qualitative Identification of Target Analytes
Acquire Calibration Data Files
Build a Compound Table
Prepare a Data Handling Method for Calibration
Prepare a Recalculation List for Calibration
Process the Calibration Files
Review and Print Calibration Results
Edit the Calibration
Process the Sample Files
Improving Integration
Quantitation Types Quantitation is a process used to determine how much of a given chemical compound (an analyte) is present in a particular sample. To perform quantitation with any analytical instrument, the user must first identify the analyte and measure its response at one or more known concentration levels. Target analytes are those compounds that the method is specifically designed to find. They are identified in samples by matching the retention time and spectrum to pure reference standards. These compounds are listed in the compound table and calibration curves are prepared for these analytes. Other compounds may be found and tentatively identified by a library search and other compounds may be found and not identified by the library search. Accurate quantitation cannot be performed with these unknown compounds nor with the tentatively identified compounds - only the Target compounds can be accurately quantified.
The amount of analyte present in an analysis sample can then be determined by measuring the peak area of analyte and scaling this area to the instrument response. The peak area may be integrated for the total ion current signal, individual ion(s), or range(s) of ions. The Varian MS Workstation can process data files automatically to accomplish this task in the following ways:
Area Percent
External Standard Quantitation
Internal Standard Quantitation
Normalized Percent
103
Area Percent (%)
Area percent is the default method used when there is no calibration data. It is the relative area of each compound, with respect to the total area of all integrated compounds. Both target and unknown compounds are included in the total area if the Include Unknown Peaks selection is checked in the method builder. For any compound x:
External Standard Quantitation
External standard quantitation is the comparison of the peak area of the target compound in the unknown to the peak area of the same compound in the reference standard.
Before examining the software features in detail, consider this simple example of quantitation. First, a reference standard is prepared which contains a known amount of target analyte. After a data file is acquired for the standard, the target analyte peak is qualitatively identified. Qualitative Identification in Varian LC/MS and GC/MS data analysis is based upon the retention time of the analyte in the chromatogram and mass spectral identification. Once the analyte has been qualitatively identified, the peak area may be determined by integration in the Chromatogram Window. The response of the instrument to the analyte is then calculated:
The Varian LC/MS and GC/MS systems usually respond linearly with injected amount (that is, if you inject two times as much of compound X into the system, the resulting peak area will be twice as great), an estimate can be made of the concentration of the unknown sample. If the area of the known sample is 10000 counts, and the unknown sample gives 30000 counts, you can estimate that the unknown is three times as concentrated as the known.
To determine the amount of the target analyte in an unknown, acquire a data file for the unknown sample, qualitatively identify the target analyte peak, and integrate the peak. The amount of analyte is then calculated using the response of the analyte from the reference standard (known) injection.
This process is defined as an external standard quantitation because the peak area of the target in the unknown sample is quantified against an area for a known amount of the same compound in a separate, or external, reference standard data file. More confidence in calibrating the instrument at a single concentration level will be achieved if several injections are performed and the average value for the response is used in determining the amount of unknown present.
100xarea
area%area
total
xx
standard
standard
Amount
AreaResponse factor =
factor Response
Area Amount
Target Target

104
Multipoint Calibration
Use a multipoint calibration to check the response linearity of the instrument by injecting several different concentration levels of reference standards, as shown below. A reliable estimate of the concentration of analyte in an unknown can be made by relating the peak area of analyte (Y-axis) in the analysis sample to a calculated amount (X-axis) based upon the chosen fit to the calibration response curve (in this case, a linear fit).
Internal Standard Quantitation
Internal standard quantitation compares the peak area of the target compound to the peak area of an internal standard (IS) compound which is always added at the same concentration level to the reference standards and to the unknown samples. As in the external standard approach, the response may be based upon either peak areas or peak height, but the default choice in the software is based upon peak area. The area-based relative response factor (RRF) of a target compound is calculated by this equation:
NOTE: RRF is a unit less ratio. The amount of a target compound present in an unknown sample is calculated by the following equation, where the internal standard amount is a known amount added to the unknown sample, and the response factor is determined from the calibration curve.
) (Area ) (Amount
) )(Amount (AreaRRF
ISTarget
ISTarget
) (Area (RRF)
) )(Amount (AreaAmount
IS
ISTargetTarget

105
The internal standard approach reduces analytical errors due to variation in the injected sample volume. Internal standards should be chemically similar to target compounds; often reiterated analogs of the target compounds are chosen as the internal standards. A reiterated compound is one in which one or more hydrogen atoms have been replaced by deuterium. Reiterated compounds are chemically similar to their unadulterated analogs, but have a higher mass so that the mass spectra of reiterated and unadulterated compounds are distinguishable.
NOTE: External and Internal standards can be used to identify compounds without quantization them. Do not calibrate the reference standards or specify “Ignore calibration data” in the method. The integrated peak areas are reported as Amounts.
Normalization of Results
The amounts of the target compounds are first calculated with internal or external standard quantitation. Then the quantity of each target is expressed as the percent of the total amount of all target compounds:
Automation of Quantitation Using Varian MS Workstation The qualitative identification procedures that can be performed manually using the integration approach in Qualitative Identification of Target Analytes - checking the retention time and identifying the mass spectrum - can be automated. The integration of the analyte peaks with a single or multipoint calibration file can also be automated. The linearity of response can be checked by plotting the dependent variable (peak area) on the Y-axis and the independent variable (injected amount) on the X-axis. You can then inject an unknown sample and integrate the peak areas automatically. You can check the peak area counts for the unknown against the plot of known peak area counts for known amounts and automatically determine with accuracy the amount of the unknown.
Steps in Automated Quantitation
To perform automated quantitation with the Varian MS, the analyst follows these steps:
100xamountTotal
AmountAmount%
etargTetargT

106
1. Prepare Samples: Prepare reference standards with known amounts of target analytes and internal standards.
2. Identify Target Analytes: use Varian MS Data Review to create a Spectrum list of the target compounds.
3. Acquire calibration data files for the analytes (target compounds) over a selected range of concentration. Either centroid or profile data files can be quatitated.
4. Build a compound table (in Method Builder) by addition of peaks in a spectrum list to the compound table. Save the compound table to a data handling method, which can later be edited.
5. Prepare the data handling method for calibration processing (in Method Builder) by identifying internal standards, entering concentration levels for the calibration files, and checking the quality of target compound integration on the calibration files.
6. Prepare a recalculation list for calibration processing (in the Automation File Editor). Add each calibration file to the RecalcList and identify the Calibration Level it is associated with in the data handling method. You can automatically create a Recalculation List from Automation in System Control.
7. Process the recalculation list using the data handling method (in System Control or MS Data Review). This adds the calibration data from the data files to the data handling method.
8. Review and print calibration results (using the Results View in MS Data Review and/or the View Curves dialog in the Method Builder).
9. Edit the Calibration Method (in MS Data Review, or Method Builder) to improve integration and the fit of calibration data. Reprocess the data (as in Step 7) with the improved data handling method
10. Acquire data files for the analysis samples (in System Control).
11. Process the samples (in System Control or MS Data Review) as Analysis or Verification entries in a recalculation list in Process/Review RecalcList or with the Process Active File feature in MS Data Review.
12. Review and print out quantitation results (In System Control, Method Builder or MS Data Review) Review results in the Results and Compound Results dialogs in MS Data Review and/or in the Compound Table in Method Builder.
Each of these stages of quantitation will be covered in detail later in the manual.

107
Software Applications to Learn for Quantitation To perform the operations used in Varian MS Quantitation, the user must learn the following:
How to acquire data in the System Control application
How to build and edit Data Handling Methods in the Method Builder application
How to process data in the MS Data Review application
How to prepare Sample Lists and Recalculation Lists in the Automation File Editor application
108
Quantitation Setup
Sample Preparation To produce the best quantitative data you must start by doing the best possible preparation of reference standards and unknown samples. Remember that the first source of error in any analytical procedure is sample preparation. Efforts to improve accuracy and precision during preparation of reference standards and analytical unknowns will pay great benefits in the quality of the results.
Many chemical suppliers sell reference standards of single components and mixtures of analytes that are present at concentration levels suitable for preparation of a dilution series for Varian LC/MS and GC/MS analysis. Alternatively, standards may be prepared by diluting accurately weighed pure samples into a suitable high-purity solvent. Whichever approach is used, prepare reference standards using clean glassware, syringes, pipettes, spatulas, etc. Use the appropriate syringes and glassware when performing dilutions.
Safety Considerations
During sample preparation and sample analysis, always consider your own safety. The total toxicity of unknown samples can vary over a wide range, depending on the toxicity of component analytes and upon their concentrations. It is always better to err on the side of caution in sample handling procedures. By preparing reference standards and unknown samples in a hood, you avoid exposure to organic solvent vapor. Wearing safety glasses (and a face shield when handling corrosives) is a common rule in most laboratories; this is particularly advisable during sample preparation and handling operations.
Also, consider that upon injection of samples into the Varian LC/MS and GC/MS, there are several different pathways by which solvent and analyte eventually exit the instrument. When you are using an autosampler, the wash solvent disposal bottle will be contaminated by your analytes. The septum purge and split vent lines from your injectors can be vented along with vacuum pump exhaust to a hood. Finally, the vacuum pump oil will retain low-volatility analytes; wear gloves when changing pump oil and dispose in a proper manner.
Detailed advice on the toxicity and handling requirements for particular analytes is usually supplied with the chemical order from the supplier. For example, in the USA, Materials Safety Data Sheets are sent in the same shipping container with all chemical orders.

109
Preparing Reference Standards
Make a reference standard containing all of the analytes you want to determine. The concentration of each compound in the reference standard is known. For example, you might create a reference standard that contains four compounds.
All of the compounds in reference standard 1 could contain 2 ng/ L of each compound. You might have two other reference standards: reference standard 2
could contain 5 ng/ L of each compound; reference standard 3 could contain
10 ng/ L of each compound. If you have three reference standards and that all contain the same compounds (in different concentrations), you can create a three-point multipoint calibration block in your method.
NOTE: If you are planning to perform internal standard calibration, at least one of the compounds (the internal standard) in your reference standard will always be present at the same concentration. In this example, one of the compounds in
the reference standard would always be present at a concentration of 5 ng/ L.
Prepare reference standards that bracket the range of concentrations expected in the analysis samples. Calibration curves can be prepared with the Varian MS, which exhibits excellent linearity over a factor of 10
3 concentration range. We
recommend that three reference standard concentration levels be prepared for each factor of 10 in the chosen concentration range. For example, if you are
preparing standards from 1-10 ng/ L prepare three standards at 1, 4, and
10 ng/ L. For a range from 1-100 ng/ L, use at least five standard levels, etc.
Sample and Reference Standard Storage
Store all standards and samples in labeled containers that are inert and tightly sealed. If any analytes are highly volatile, store with minimal headspace above the sample and refrigerate. Many analytes are prone to photochemical degradation. Use amber bottles and/or cover containers with aluminum foil for protection from light if necessary. If you are storing standards in autosampler vials, replace used vial septa before storage to avoid sample contamination and solvent loss. Finally, determine how long standards can be stored by analyzing against freshly prepared standards, so that losses with aging can be determined.
Qualitative Identification of Target Analytes When building a compound table in order to perform automated quantitation of data files, it is necessary to know the names, retention times, and quantitation ions of all analytes. If the target analytes are present in a user library or a commercial library such as NIST98, determine their identity and add them to the compound table with a library search. It is also possible to add reference spectra and/or qualifications (for example specific ion ratios in the spectra) to confirm their identity and purity during quantitation.
Acquire a Data File for Calibration Setup
Before beginning a multipoint calibration and quantitative analysis, acquire data by introducing a standard sample at a known concentration level and identifying the compounds of interest.

110
Positive identification of analytes with similar mass spectra may require injection of individual components. For example, individual injections might be required to identify ortho-, meta-, and para-dichlorobenzene components since the mass spectra of these three compounds are almost identical but the retention times should be different if the right column is used. Use information from the column manufacturer or from a published protocol on the retention time order of analytes for the particular analytical column.
Check Spectral Integrity
It is advisable to check the reproducibility of the mass spectrum of each analyte across the peak. An easy way to do this is to display a mid-level calibration file in MS Data Review and export spectra to the Spectrum 1A and Spectrum 1B windows. Get Spectrum 1A from the apex of a peak and the select Spectrum 1B from the leading edge of the peak.
Then use the arrow keys on the keyboard to scan across the peak while observing the Spec1A/Spec1B/Difference Spectrum display. Use the Spectrum… Spectra Preferences… Labeling and Comparison… Spectra Comparison feature to see how well the spectra compare across the peak.
A peak containing only one analyte should have reproducible spectra across its range. Large spectral differences may indicate the presence of a co-eluting impurity. Significant changes in relative ion abundances may indicate that the sample concentration is too high.

111
If such changes occur, reduce the upper concentration level to be analyzed; or increase the split ratio if doing a split injection. For 2000 and 4000 MS products, it may be helpful to reduce the AGC target value to improve spectral quality.
Acquire Calibration Data Files Build a Varian MS method to acquire data. Method development should be performed on standards at a concentration in the middle of the anticipated linear range of the method. Perform library searches to identify the component analytes in the trial chromatogram.
Automated Method Optimization
In subsequent runs, adjust autosampler, chromatographic, and MS sections of the data acquisition method to optimize data quality and sensitivity. This optimization process is important to the ultimate quality of your quantitation results. To vary conditions in automation, enter one or two samples in the Sample List; then add a new line to the sample list. For sample type, select Activate Method. In the AutoLink box, enter the name of the second method. Finally, add lines for additional samples. This process can be repeated several times.
This ability to download additional methods in the sample list is useful in method optimization. The chromatographic conditions can be varied in automation and the method that gave the best results can be selected for future use.
Build a SampleList to Acquire Calibration Files
Once reference standards have been prepared, and instrument conditions have been optimized to give the best chromatographic separation and mass-spectral quality, build a SampleList in the Automation File Editor. Open this application
from the MS Workstation Toolbar by clicking on the sample list button .
When the application opens, use the menu File >New >Sample List.
Select a name and type for the Sample List. The Sample List type depends on the method of sample introduction; for example manual injection (generic) or with a specific autosampler.

112
Add Entries to the SampleList
Select a File name for the first sample and change the sample type to Calibration. To make it easier to keep track of files, the names should indicate the concentration level of the sample. Then select the calibration level and the number of injections to make at this level. Replicate runs can be valuable in assessing data precision.
NOTE: If you click on the combo box menu under Sample Type, you will see that one of the sample types is Print Calib. If you create an entry with Print Calib as the sample type at the end of the list of Calibration runs, this option allows automated printing of the Calibration Block report.
If the method is already calibrated, erase all of the previous calibration data from the method by adding New Calibration Block to the first line of the SampleList. To add this to the Sample or RecalcList, click on the combo box, and choose New Calibration Block. This deletes the previous calibration information from the method when the data files are processed.
Click the injection notes field (optional) and enter any notes. Click AutoLink to add any post-run processing commands to use (optional). If using an autosampler, use the scroll bar at the bottom of the dialog to show the fields for entering the vial positions and autosampler method parameters.
All calibration samples should be acquired with the same Varian LC/MS or GC/MS method so that instrument sensitivity will be the same for all reference standards. Always use the same conditions to acquire analysis samples that were used to acquire reference standards. It is advisable to perform blank runs on the pure solvent used in preparing the standards to identify any chromatographic interference and to check for sample carryover.

113
Specifying RecalcList Options
Use the Sample List to acquire new data files; a Recalc List is necessary for reprocessing data. If you acquire the data files in System Control through Automation menu commands, (Automation >Begin SampleList) a Recalculation List with the same name as the Sample List but with the file extension *.rcl can be created automatically. It contains an entry for each data file created by a sample injection. This RecalcList can be used to reprocess the files after they have been acquired. If you acquire data files for each sample using the menu command Inject >Inject Single Sample, you must create a RecalcList for subsequent data processing because Recalc Lists are not created automatically for them. Processing RecalcLists is described in another section.
Examine these options by clicking the button in the Automation File Editor. Choose to create a new RecalcList, append to an existing RecalcList, or not to create nor update a RecalcList.
Choosing to create a new RecalcList will not overwrite an existing RecalcList. If a RecalcList with the same filename exists, the newly created RecalcList will have a number appended to its filename to make it unique and to prevent the older RecalcList from being overwritten.
You can choose to append to an existing RecalcList when collecting data under the Inject >Inject Single Sample, or Automation >Begin SampleList. This will generate a list of all the data files collected.
Build a Compound Table The Compound Table contains information about the specific, or target, analytes in the method. The Compound Table contains all of the calibration, integration, and identification information for target compounds and is part of the Data Handling method. A Compound Table is created by importing a spectrum list generated in MS Data Review to a MS Data Handling method.
Refer to “Compound Tables” for detailed instructions on how to create and modify the MS Compound Table.

114
Prepare a Data Handling Method for Calibration These editing operations are performed in the Method Builder application. In the
MS Workstation Toolbar you can open Method Builder with its button or
with the Method Quicklink button .
The Method Builder will be opened when a method is selected. A new window will appear with a Method Directory on the left side. Under the Directory item of your MS instrument, is Channel 1 = MS Data. The MS Data Handling Method consists of three sections:
Modify the Calculations Setup, Compound Table, and Results Treatment sections of the method, adding in the global data treatment parameters, compound specific information, and results treatment specifications to the method. Each of these sections is discussed in more detail in “Quantitation Method”. Save the method before closing Method Builder. After processing the calibration runs and analysis runs, you can modify the method sections to optimize the analytical results.
If a data file is processed with an internal standard method, but the method does not contain calibration data, or the method specifies "Ignore Calibration Data", quantitation reports the identified/missing compounds as specified in the method, and reports the integrated areas as the results, after displaying a message to that effect.
Prepare a Recalculation List for Calibration It is easiest to start the Processing operation from MS Data Review. Processing the RecalcList from MS Data Review also has some special advantages over processing it in System Control. For one thing, processing is more directly linked to the Data Handling software so the processing time is less. For another, it is easy to Edit the Method, then return and process the files to quickly see the effects of your changes. So, MS Data Review processing is highly recommended in the method optimization stage.
Open the MS Data Review and go to the Process Data window by clicking on the
Process Data button. From this dialog, you can select and edit either the Data Handling Method or the RecalcList by clicking the associated buttons.
Click the Recent or Browse button to select a Single Data File.

115
Automated Generation of Recalculation Lists
If the calibration samples in automation are acquired using a SampleList (*.smp file), it is possible to configure the SampleList options so that a Recalculation List with a similar name but with the file extension *.rcl is created automatically and used for processing. Refer to “Specifying RecalcList Options”.
If a RecalcList has been automatically created by this approach, select it using Recent or Browse buttons. The next step in Quantitation is to “Process the Calibration Files”.
Building a Recalculation List in the Plots View
Use the Plots View to build a recalculation list. Put all files that are going in the recalculation list in the same directory. Move files that are not to be in the list to a different directory. Right click the directory name and in the pop up menu, select Recalc List File and then Create with files in Directory. If necessary, modify the new recalculation list before processing data.
Click
The Sample Types shown in the Plots Descriptors pane are of the type specified by the RecalcList. The Sample Type shown in the Tree view is the same Sample Type as when the file was previously processed. The Sample Type in the Plots Descriptors pane may be different from the one in the Tree view.

116
Building a Recalculation List for Calibration
Another way to create a new recalculation list is to click the sample/recalc list
button in the MS Workstation Toolbar and select new…RecalcList. An empty Recalculation List is opened in the Automation File Editor. Enter the file names for the data files at each concentration level and associate them with the calibration level for example calibration level 1, 2, 3, etc.
Add File Names and Levels to the RecalcList File Table
Put the cursor in the Data File field of Row 1. Click Add and then click Browse. The Open Data File Dialog opens. You can also use drag and drop to add files from MS Explorer
TM. When a group of files are selected in MS Explorer and
dragged to the Automation File Editor, the cursor should be on the first file. The files are added to the Recalc List in the order displayed in Explorer. NOTE: If you have Windows 2000, the order is not predictable.
Select the directory path and data file for calibration level 1. Select Sample Type and select Calibration. Then click in the Cal. Level field and enter 1. (NOTE in the figure above that Calibration Level 1 is identified as the 10.000 ng/mL concentration.)
Use the same procedure to enter the name and calibration level for the other calibration files. To assure that calibration data are cleared before calculations, highlight the first Row of the list, click Insert and select New Calibration Block in the SampleList field. The following is an example.
Use the menu command File >Save to save the RecalcList. Click File >Exit to close the Automation File Editor. You will return to the Process/Review RecalcList Dialog in MS Data Review.

117
Process the Calibration Files Processing searches, tests, integrates and quantitates samples in a Recalculation List. Method Builder and Automation File Editor should be
closed for best operation. Open Process Data with the icon and load the desired method and recalculation list (use the Recent or Browse buttons).
Click Process. As the Data File list is processed, a message log is displayed at the bottom of the window. The current line in the list is shown followed by the word Processing until completed. The progress bar at the very bottom of the window indicates how much of the processing for the current file is completed.
Review and Print Calibration Results The results of any processing of a RecalcList are available for review after the files are processed and any time the method is specified in the Process View. The dialog gives access to several types of information. Here is a list of access options and the data that can be viewed. To review these options, select a method that has been processed and highlight a data file.

118
The Process View Window
The Print Button has the following menu:
The print options use the report format stored in the selected data file. You can choose to print or convert to ASCII format the Sample Report or the Compound Report of the data file. You can also print the Calibration Curves report and the Calibration Block Report of the Data file and also convert it to ASCII format.
To automatically view Calibration results in the Process View
1. Select the calibration reports in the Print Options Dialog in the Report method.
2. Add a Print Calibration line after the last calibration file in the relcalc list.
3. Enable Make Reports and Preview Reports to the right of the relcalc list in the process view.
4. Process the recalc list.
The reports are displayed after the processing finishes.
Selecting the final choice on the Print menu list opens the Report Preferences window which has options for the report format.
After processing calibration files, the data points are added to the Calibration Block of the data handling method. You can examine or print the calibration

119
curves by selecting the Calibration Curve report. This opens a Print Preview screen for the calibration curves. The number of calibration curves per page is specified in Print Options in the report method. Use the Next/Previous Page
buttons to examine other curves. Click and drag in the display to expand the screen for better viewing, or click the Print Page or Print Report
buttons to send a copy to your printer.
It is possible to print the Calibration Block Report or convert it to an ASCII format file. This is a compact text-only report showing many of the details of the calibration.
Examine Results for Each Compound
After processing a recalculation list, choose to see the detailed results for individual compounds in each data file. Double click on any of the data files listed in the Process View. This brings up the View Results view of MS Data Review.
This window can also be accessed with the MS Data Review toolbar icon . Refer to the Results View online help for more information.

120
..
Results List
This display area lists all of the results for the compounds in each data file in the recalculation list. Each compound can be selected to give detailed information about the results of that compound in the lower four windows:
Compound Information Panes
There are six compound information panes. Select which to display in the Results View Preference dialog.
Compound Report - Upper left: Displays the Compound Report of the selected compound result. Its contents are specified in the method.
Calibration Curves - Upper right: Displays the Calibration curve of the selected compound of the highlighted result in the calibration curve.
Integration - Lower left: Displays the Quantitation Ion Plot and baseline and shows integration information.
Spectrum - Lower right: Compares the actual spectrum to the reference spectrum, and shows the difference spectrum.
Results View Control Buttons
Click the icon to maximize a Compound Information Pane.

121
Edit opens the section of the compound table for the target compound that is currently on display. This is the compound table in the method that was used for processing the recalculation file. The section of the table for that compound can then be edited.
Process opens the process data window.
Next and Previous opens results for other Target Compounds in the file.
Load offers two options:
Load a data file, replot the file using a range of ions, the RIC (Reconstructed Ion Chromatogram), or plot the ionization time.
Load a recalculation list
Save/Discard click to open a window to Process or Discard changes.
Preferences opens a tabbed dialog for viewing results:
The three tabbed dialogs are
Compound and Peak Results select the file and result types to display and sort.
Display Configuration select the panes to display and their location
Results List Columns select the columns to display in the Results List Pane.

122
The following screen shot displays some of the fields that can be displayed.
View and Edit Calibration Results
View Calibration Curve data in the Results view of MS Data Review or click the View Curves button in the Compound Table dialog in Method Builder.
The calibration curve for the first compound in the Compound Table is displayed. Notice that the fitting options chosen when the Compound Table was built are defaults for the display (for example, Linear Fit, Ignore Origin Point). In this example, the linear fit equation for codeine is shown above the plot field. The effect of other choices for Origin and Curve Fit options may be tested in this dialog and changes will be shown in the fit equation and the Correlation Coefficient.

123
NOTE that for most well behaved species analyzed by LC/MS and GC/MS, the default values provide the simplest route to good quantitation results.
Clicking on the up/down arrows in the Peak Name field will display the curves for the other compounds in the Compound Table. If you have changed the fit options, you will be asked whether you wish to save the new curve equations and parameters to the method.
Double-clicking on one of the data points in the curve will display the Point Info dialog below the Calibration Curve dialog. Clicking on the box Exclude Selected Point from Calculation causes the calibration curve to be recalculated without the excluded point.
Points may also be excluded from the calculations by right clicking on the selected data points in the plot. This is a toggle function. Right clicking on an excluded point will include it again. Calibration data points that have been modified in manual integration are marked with a vertical cross.
Creating and Printing Custom Reports
A wide variety of custom reports may be specified in the Custom MS Report Editor application, which allows selection of both graphical and text fields in Calibration Summary, Sample, Unknown and Individual Compound Reports. Refer to “Custom MS Reports”.
Edit the Calibration Method If data points are missing, failed, or poorly integrated after the initial calibration, the Data Handling Method should be revised until good calibration data are achieved. After doing this the analyst is confident in the results.
The target compound integration, identification, and calibration method sections can be accessed from the Process Data view by clicking on the Edit button on the line where the method file is listed. Open the compound table and double click on the target compound that is to be edited. Select the Integration tab. Or, make changes in the Results View.
NOTE: If method changes are made in Method Builder, the Recalc List must be reprocessed in the Process View with the modified method.

124
Changing Compound Integration Parameters
Change the integration parameters and press the Integrate button to integrate the component with the new parameters. The peak will be integrated and the new baseline and area count will be shown as in the above figure.
If you are satisfied with the results, you can choose to save the adjusted data handling method with the File…Save command from the method builder toolbar or to another method file using the File… Save As command. If you exit the screen without saving, you will be reminded to save the modified parameters.
Interactively Adding/Adjusting Integration Time Events
Time events are integration parameters entered into the method that can be added interactively (as shown here) or entered directly into the time events table. Additionally, you can interact with the peak events by clicking and dragging on peak starts and stops and add peaks if integration failed to detect a minor component.
To add a time event, right click in the Time Events window below the chromatogram plot.

125
Click here
The Time Events menu opens.
I
In the example above, the Add Forced Peak event was selected. The time event can be moved and sized by using the mouse.
NOTE: Use Forced Peak events with caution. Retention times and other peak attributes may vary from file to file.
Right click the time event and you can choose to delete the event or to edit the event directly in the data file method.
Press the Integrate button to integrate the compound with the updated time event. Results will be updated on the screen display.

126
Process the Sample Files After processing the calibration files and editing the method so analytes of several different levels are integrated properly, quantitate the samples. After acquiring the data in System Control, reprocess and examine the data files in MS Data Review. Use the recalculation list you created for the calibration samples and add the analysis samples from the Process Data view in MS Data Review. Click Browse to find the recalculation list file then click Edit to open it. Add the analysis samples to the recalculation list using “Build a SampleList to Acquire Calibration Files”. After selecting the file, select either Analysis or Verification sample type.
From the Process Data view in MS Data Review, click Browse to find the Data Handling Method file and Edit to open it. Click Calculations Setup. To report Missing or Failed target compound peaks, click the option.
After the Data Handling Method and the Recalc List are loaded in the Process Data view and edited if necessary, click Process.
If you have already processed the Calibration files, you could delete the New Calibration Block entry and the Calibration files before Processing the RecalcList but this is not necessary.
When you are ready to run real samples, you should always run some calibration samples that are within the range of the expected levels of the analytes in the samples. If you are satisfied that the method is linear, you may not feel it necessary to run calibration samples at multiple levels every time you run real samples.

127
Review and Print Quantitation Results See “Review and Print Calibration Results”. Select a file in the Process View and double click it to examine the results. If multiple files are listed and you want to look at the results for a single file, click Load on the lower left side of the Results View to load the file.
Results List Pane File Summary
The first level of results reporting is a summary that has the results for the Target Compounds in the upper part of the table and results for Unknowns or Tentatively Identified Compounds are in the lower part.
The results that are displayed here have some target compounds present and several others missing. One compound is listed as Failed. This is due to the criteria set in the method where certain qualifier ions had to have a defined area response relative to the quantitation ion. View Integration parameters and results for each compound by selecting the compound in the Results List Pane.
NOTE: You can change the sorting of the internal standards using the menu command Preferences >Results View and clicking the Compound and Peak Results Tab.
Reviewing Individual Compound Results
Review detailed results of individual target compounds and unknowns by selecting the entry in the Results List Pane. Refer to “Review and Print Calibration Results” for details on the Results Window and “Edit the Calibration Method” for changing the integration parameters.
Manual Integration of Target Compounds
Less than optimal peak event assignments can occur for the following reasons:
data handling parameters not optimized
Co- elution of two or more peaks
Poor peak shape
Individual peak events can be moved and reintegrated or a new integration baseline can be drawn with the cursor while holding down the “I” key. In addition, adjust the Compound Table parameters for each compound and reintegrate using Edit Method.
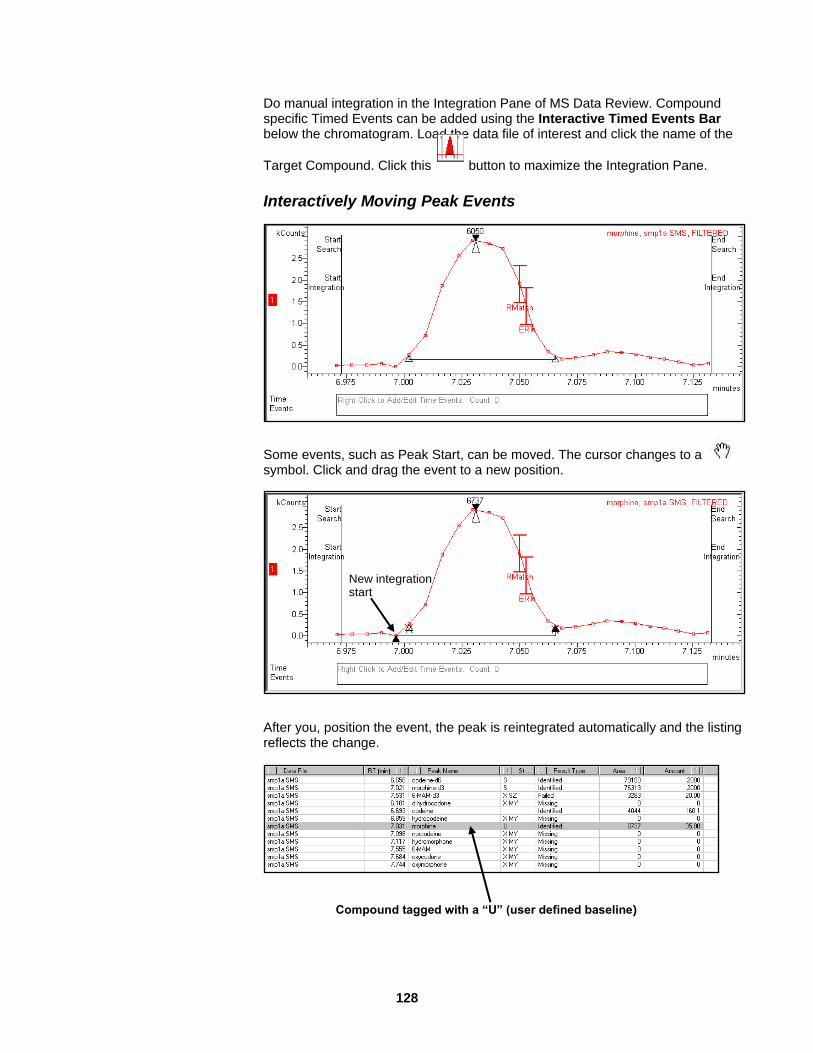
128
Do manual integration in the Integration Pane of MS Data Review. Compound specific Timed Events can be added using the Interactive Timed Events Bar below the chromatogram. Load the data file of interest and click the name of the
Target Compound. Click this button to maximize the Integration Pane.
Interactively Moving Peak Events
Some events, such as Peak Start, can be moved. The cursor changes to a symbol. Click and drag the event to a new position.
New integration start
After you, position the event, the peak is reintegrated automatically and the listing reflects the change.
Compound tagged with a “U” (user defined baseline)

129
Reintegrating after moving an event changes the results. Reintegrating a moved peak event in a Calibration file recalculates the corresponding results of all Analysis and Verification files in a RecalcList. Reprocessing after a method change clears the manual integration events. Changes made in the Results view are temporary unless you save them to the files. When changes that have been made to calibration results are saved, the calibration curve that is stored in the method is updated in addition to the results in the data file. If you reprocess the files in a view other than the Results view, your manual changes are overwritten.
Interactively Adding/Adjusting Method Time Event Parameters
Method Time Events are changed in the Results Window as they were changed in the method. Refer to “Interactively Adding/Adjusting Integration Time Events”.
Changing Method Integration Parameters
Adjust integration parameters for unknowns from the Calculations Setup dialog by clicking Edit in the Results view.
Click Integrate Parameters.

130
After making your changes, click OK. Press Save to close the Calculations Setup dialog and process the file with the new parameters. The displayed results are updated.
Improving Integration If data points are Missing, Failed or poorly integrated, revise the Data Handling Method. Or manually integrate individual data files from MS Data Review. Refer to “Changing Compound Integration Parameters” and “Interactively Adding/Adjusting Integration Time Events”. Also, refer to “Guidelines for Optimizing Integration Parameters”.
Choosing and Editing Standard Reports
Varian MS Workstation several Standard Reports you can add to the MS Data
Handling method. This is discussed in detail in “Generation of Standard MS
Reports”.
131
Compound Tables
The Compound Table is part of the data handling method. Create and edit using Method Builder. In the Compound Table select the files for automatic quantitation, build a compound list, and import an existing compound list. The Compound List is a Spectrum List used to build a new compound table, or add compounds to an existing Compound Table.
To build a Compound Table:
1. Open an existing method or create a new method containing a MS Data Handling Section.
2. Select a data file containing the target compounds. You can build a compound table from different data files and standard sets.
3. Build a Compound List from the selected data file and optionally library search the entries to identify them.
4. Import the Compound List to the Compound Table.
5. Optimize the compound data handling settings for each compound, such as Integration, Identification, and Calibration Levels.
6. If you are doing internal standards calculations, specify which compounds are the internal standards and which compounds will be quantitated.
Build Compound/Spectra List In Method Builder, open a new method or one you want to edit. The method must have a Data Handling Section. To do so click File>Add Post-run processing in the method builder menu. From the Compound Table section in the Data Handling section load a data file that contains the target compounds at a mid-range concentration by clicking Select Data File. Select the required data file from the Select Centroid MS File window.
After selecting the data file, build the Compound Table by clicking the Build Compound List. This launches MS Data Review so that clicking chromatogram exports the spectra to a Spectrum List with the same name as the data file, or to an existing spectrum list.
Click each peak that you wish to add to the compound table. The spectra of the peaks are exported to the active Spectrum List. You can plot specific ions, expand the vertical or horizontal scale, or zoom the chromatogram to highlight specific compounds. If working with multi-channel data files, you can display a chromatogram for each channel and select the peaks of interest for each plot.

132
Library search the added spectra by clicking Search >Library Search a
Spectrum List, clicking the icon or search each entry individually by
clicking the icon. Select the library search parameters and click Search. Each entry in the Spectrum list is searched against the NIST Library Search and the best match is displayed in the Spectrum List. If no library entries exceed the Threshold value there is No Match for that compound.
After the library search is done, the Spectrum List entry can be updated with the Search Result. Update compounds individually using the Update Current
Search with Match icon or as an entire list using the Update all Searches

133
with Matches icon. The Library Search Information is transferred to the Spectrum list entry fields.
Do an individual library search on compounds that do not have a satisfactory match or if the wrong isomer was matched. The spectrum list entry can be updated with the desired match. After adding the target compounds to the spectrum list, close the MS Data Review window to return to Method Builder.
Import Compound/Spectrum List After creating a Compound List (Spectrum List), either from the Build Compound List dialog or from MS Data Review, you can import it to the Compound Table.
To Import a Compound List, click Import Compound List in the Compound Table window. Select the required compound list. You can exclude any compound from the compound table. You can quickly select recently used Spectrum Lists using Recent Files.
The Compounds in the Compound list are added to the Compound Table, below previous entries. Import several Compound Lists to build a larger Compound Table. All Compound Spectral Attributes are imported from the Compound List, but all of the Integration, Identification, and Calculation settings are the default values. The compound attributes must be edited to complete the Compound Table.
Modify Compound Table Entries Double-click the compound you wish to edit in the Compound Table. A tabbed dialog appears. Select each tab and set the integration, identification, and information parameters.
An easy way to modify common settings, such as calibration levels or integration settings is to change the attributes of the first compound, close the tabbed dialog to return to the Compound Table display, click on the desired column headers, and then click Fill Down.
Manually Adding Compounds to a Compound Table Some compounds (such as deuterated internal standards) may not be found in the NIST library or in other libraries. Add a compound to the peak table by acquiring a data file from a pure reference standard of known quantity.
Open the compound table and load the data file. Click Add. A line is added with a retention time just after the retention time of the last peak in the table and RIC (Reconstructed Ion Chromatogram) for the quantitation ion.

134
Double-click the line and go to the attributes tab. Find the peak of the new compound and select it. The retention time and spectrum are entered. Enter the name of the compound and designate it as an internal standard, if appropriate. If the compound is not as internal standard, select the internal standard to use.

135
After you leave the Compound Attribute Tab, a message appears asking to update the retention time to the retention time of your peak. Click Yes.
Then you will be asked to put the reference spectrum and base quan ion in the method for that retention time. Click Yes again.
The information is automatically entered. Add other compounds manually or by importing a spectrum list and entering calibration information. Click Sort at the bottom of the compound table to arrange the peaks in retention time order.

136
Quantitation Method
Overview MS Data Handling Methods contain all parameters needed to process a data file and obtain quantitative results.
All data handling method parameters in Method Builder have context sensitive help.
Preparing Data Handling Method After a Compound Table is built in the data handling method (page 131), the method can be edited for calibration and analysis processing. The following section explains each method section, and has suggestions for the settings to use for different analyses.
Method Builder supports files collected in the *.sms and *.xms data formats. This version supports Data files and data handling methods created by previous software versions. Older format methods are automatically converted to the new format when opened. However, quantitation results in the old format are not compatible with the new software. They are deleted when old format data files are opened. The results can be regenerated in the new format by reprocessing the data file with the updated method.
Using a Calibration File to Review Data
To prepare the method for Calibration Processing, click Select File to open a File Selection dialog. Select the same file that was used for adding peaks to the Compound Table.
Calculations Setup Dialog
Structure of the Data Handling Method
The data handling method has several subsections:
The Calculations Setup dialog contains global parameters, which specify calculations settings all compound table entries. For example, in this dialog you choose internal standard, external standard, or area/height % calculations.

137
Additionally, detailed integration and reporting parameters are set in this section for compounds not listed in the Compound Table (unknown peaks).
The Compound Table dialog is where all compound-specific quantitation parameters are specified, viewed, and edited. Since mass spectrometric data has too many compound-specific parameters to display on a table line or even in a single full screen, related parameters are grouped into individual tabbed dialogs for viewing and editing, along with chromatogram and spectrum displays which provide graphical context. The Compound Table itself consists of non-editable cells, which display the values of the key parameters in each group. This allows users to view the key information for each compound at a glance, and to access quickly the desired parameter groups to optimization for any compounds in the table.
The Results Treatment dialog contains global parameters, which specify how the calculated results are handled for all compound table entries. Separate fields are used to specify treatment of Calibration, Analysis, and Verification samples.
Set the General Parameters in the Calculations Setup Dialog
Select global parameters for processing the data file in General parameters. The Chromatogram Processing area applies only to the non-Target Compound Processing of the data file, in other words, the processing of unknown peaks. If the Report Unknown Peaks checkbox is empty, these parameters are inactive.
Select Noise Type
Select the noise type:
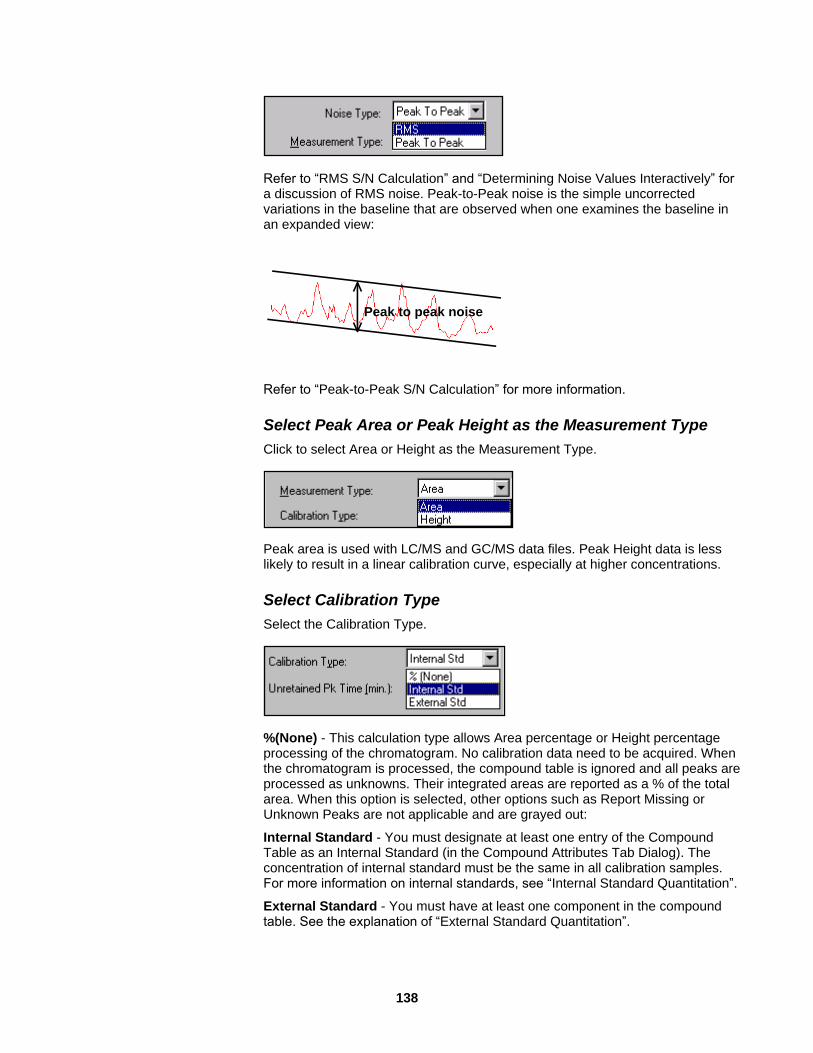
138
Refer to “RMS S/N Calculation” and “Determining Noise Values Interactively” for a discussion of RMS noise. Peak-to-Peak noise is the simple uncorrected variations in the baseline that are observed when one examines the baseline in an expanded view:
Peak to peak noise
Refer to “Peak-to-Peak S/N Calculation” for more information.
Select Peak Area or Peak Height as the Measurement Type
Click to select Area or Height as the Measurement Type.
Peak area is used with LC/MS and GC/MS data files. Peak Height data is less likely to result in a linear calibration curve, especially at higher concentrations.
Select Calibration Type
Select the Calibration Type.
%(None) - This calculation type allows Area percentage or Height percentage processing of the chromatogram. No calibration data need to be acquired. When the chromatogram is processed, the compound table is ignored and all peaks are processed as unknowns. Their integrated areas are reported as a % of the total area. When this option is selected, other options such as Report Missing or Unknown Peaks are not applicable and are grayed out:
Internal Standard - You must designate at least one entry of the Compound Table as an Internal Standard (in the Compound Attributes Tab Dialog). The concentration of internal standard must be the same in all calibration samples. For more information on internal standards, see “Internal Standard Quantitation”.
External Standard - You must have at least one component in the compound table. See the explanation of “External Standard Quantitation”.

139
Unretained Peak Time
The retention time in minutes of a compound not retained by the column. For example, methane is not retained by most WCOT capillary columns. Use this value to correct retention times of compounds that vary in manual runs. The data system is not started at the same instant after injection. It is used for Relative Retention Time calculations for all results when a compound is designated as a Relative Retention Reference.
Report Missing Peaks
This option applies only to Analysis samples. Missing compounds are always reported when Calibration and Verification Samples are processed, even when Report Missing Peaks is not checked.
Report Unknown Peaks
If you do many Analysis samples, you can determine how to treat unknown peaks while preparing for calibration processing. Check Report Unknown Peaks to enable the Chromatogram Processing portion of the dialog.
Normalize Results
Check Normalize Results to report the calculated amounts of each analyte as percent of the total. You must use internal or external calibration. See “Normalization of Results”.
Ignore Calibration Data
Check Ignore Calibration Data to display the results as integrated area counts.
Scale Air Flow Samples
NOTE: This section is for the Saturn 2000 Model only. Use this option only for air analysis when the optional flow-sensing module is installed. It is activated in conjunction with the Special Applications section in MS Method Editor section of Method Builder. In the following example, the total air volume is 200 mL (20 mL/min x 10 min). If the flow sensor detected reductions in the flow during the sampling process, checking Scale Air Flow Samples allows the correct volume of the sample to be calculated.

140
Ion Ratio Type
The choices are Absolute or Relative. Choosing Absolute allows a larger window for the qualifier ion/quant ion ratio than Relative”. For example, for compounds where the qualifier/ion to quant ion ratio was determined to be 30% on a clean calibration standard and the window was 20%, choosing Absolute passes all analytes with a qualifier to quant ion ratio ranging from 10 to 50%
(30% 20%). If Relative was chosen, the acceptable range would be 24 to 36%
(30% 6%) since 6% is 20% of 30%. Regulatory methods sometimes specify whether absolute or relative limits are required to pass the qualifier/quant ion ratio test.
Qualifier Integration
Select Independent or Quan Ion Points. Select Independent and the quant ion peaks and qualifier ion peaks are integrated as separate peaks with start integration and end integration times that are unrelated to one another. This is illustrated in the following figure. The baselines of the quantitation peak and the qualifier ion peaks start at different times.
quantitation ion
qualifier 1 ion
qualifier 2 ion
Select Quan Ion Points to force the qualifier ion peaks to be integrated at the same start and end integration times as the quant ion peak.

141
RRT% Tolerance
Enter the Relative Retention Time tolerance as a percentage. Enable Confirm RRT% to run the test.
RRT% Tolerance - The % deviation of the RRT result for a compound from the RRT result for a compound from the RRT of the corresponding Retention Times in the Compound Table must be less than this tolerance. The same Threshold specification is used for all Target compounds.
Confirm RRT - Do the test.
Confirm S/N Threshold - Do the S/N Reject test. S/N Reject is specified independently for each compound on the Compound Table entry Integration tab. The S/N result for a compound must be greater than or equal to the specified Threshold.
Report Outliers As
Select Failed or Missing To know that the Target compound was present but has failed the qualifier/quant ratios, select Failed. You may need to adjust the qualifier/quant ion specification ratio, there may be a co-eluting compound or the compound may not be the Target compound. In some methods, it may be required to report a compound that failed the qualifier/quant ratio as Missing. Enable Confirm S/N Threshold to do the report.
Setting Chromatogram Processing Parameters
Enter parameters for integrating, library searching, and reporting of unknown peaks in the Chromatogram Processing region in the Calculations Setup Dialog. Unknown results from chromatogram processing are a complementary set of results to the Target Compound results. Each set of results, Target and Unknown, can be reviewed through operations in the Process RecalcList Dialog.
Parameters in the Chromatogram Processing Field
Use the Chromatogram Processing field to set up the integration and chromatogram processing parameters for peaks not specified in the Compound Table. If the Report Unknown Peaks box is checked, these parameters are used for unknown peaks; if the box is not checked, unknown peaks are ignored and the ability to adjust the following parameters will be disabled in the software.
Quan Ion
Select the Reconstructed Ion Chromatogram (RIC) or selected ions or ranges for the chromatogram to be integrated.
Example: Specifying the RIC for Integration

142
When the processing results are examined in MS Data Review, all significant
peaks in the RIC are integrated.
Example: Specifying a Sum of Ions
When the results are examined in MS Data Review, only the peaks with significant intensities for the selected ions are integrated.
Scan Function Channels
This field is Merged for quantitating Unknown Peaks.
Filter Chromatogram
You can apply a filter to the chromatogram to improve baseline definition and to smooth the chromatographic peaks. Filtering is either a smoothing function or spike rejection and there are two options.
The Mean method averages a specified number of scans on each side of the data point. This is suited to reducing random low frequency noise.
The Savitsky Golay method is better suited for high frequency noise such as high flow conditions in LC/MS.
A point is determined to be a spike if the difference between the amplitude of the point and that of the point two points away is greater than the Spike Threshold

143
Factor times the amplitude difference between the first and second points away from the candidate point. The Remove Spikes checkbox (preset = Not selected) removes spikes prior to quantitation. If smoothing is also specified, spike removal is done first. The Spike Factor Threshold setting must be exceeded on both sides to be a spike. (range of 2 - 20; preset = 5). The amplitude of a spike point is replaced by the average amplitude of the four points that surround it.
Examine peaks in MS Data Review to see the effects of each type of filtering before you make your selection in the method.
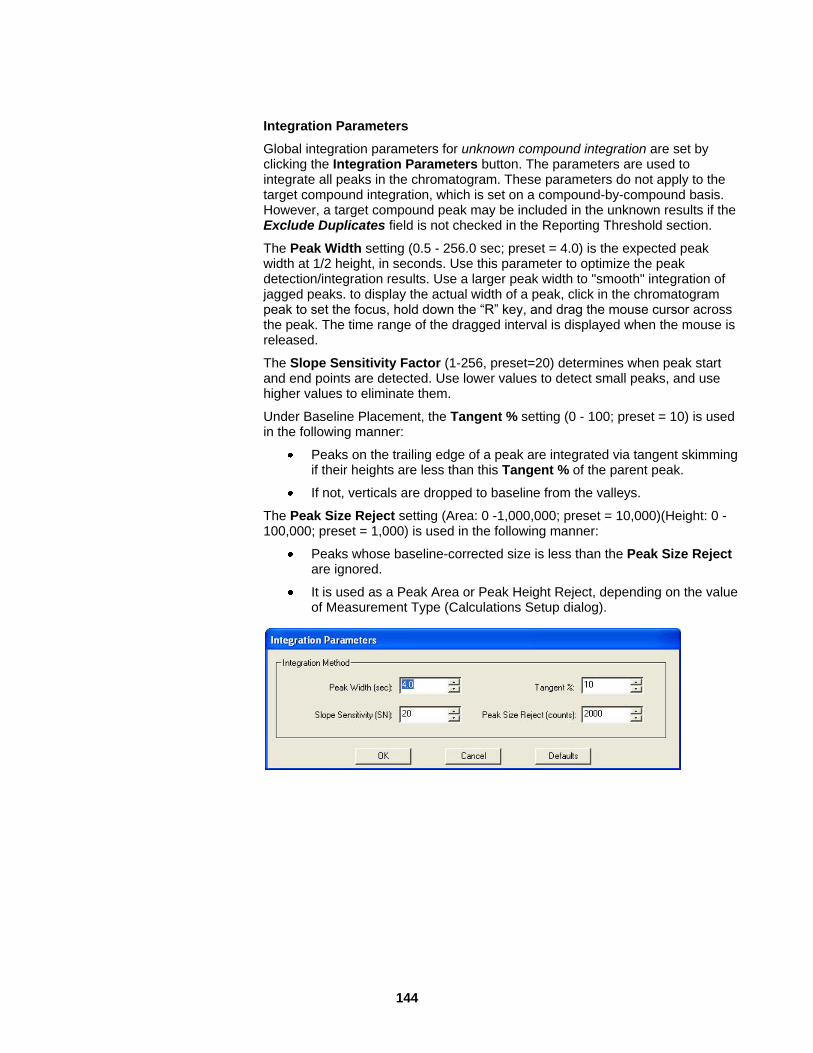
144
Integration Parameters
Global integration parameters for unknown compound integration are set by clicking the Integration Parameters button. The parameters are used to integrate all peaks in the chromatogram. These parameters do not apply to the target compound integration, which is set on a compound-by-compound basis. However, a target compound peak may be included in the unknown results if the Exclude Duplicates field is not checked in the Reporting Threshold section.
The Peak Width setting (0.5 - 256.0 sec; preset = 4.0) is the expected peak width at 1/2 height, in seconds. Use this parameter to optimize the peak detection/integration results. Use a larger peak width to "smooth" integration of jagged peaks. to display the actual width of a peak, click in the chromatogram peak to set the focus, hold down the “R” key, and drag the mouse cursor across the peak. The time range of the dragged interval is displayed when the mouse is released.
The Slope Sensitivity Factor (1-256, preset=20) determines when peak start and end points are detected. Use lower values to detect small peaks, and use higher values to eliminate them.
Under Baseline Placement, the Tangent % setting (0 - 100; preset = 10) is used in the following manner:
Peaks on the trailing edge of a peak are integrated via tangent skimming if their heights are less than this Tangent % of the parent peak.
If not, verticals are dropped to baseline from the valleys.
The Peak Size Reject setting (Area: 0 -1,000,000; preset = 10,000)(Height: 0 - 100,000; preset = 1,000) is used in the following manner:
Peaks whose baseline-corrected size is less than the Peak Size Reject are ignored.
It is used as a Peak Area or Peak Height Reject, depending on the value of Measurement Type (Calculations Setup dialog).

145
Time Events Table
Set the time events for the unknown peaks in this dialog.
Use this dialog to time-program events. Specify how to detect and integrate peaks and draw their baselines when doing chromatogram processing. For each event, specify an event type and either a start and end time, or an event time and a value:

146
ITEM DESCRIPTION
Time The Time the event is to start. (in minutes).
Event Click to see the selections.
FP (Force Peak) start & end times. Start and end integration of the compound at these times.
GR (Group Peaks) start & end times. Start and end integration at these times, and ignore individual peaks.
HB (Horizontal Back) start & end times. Integrate this time interval using a horizontal baseline w/amplitude of the start time.
HF (Horizontal Front) start & end times. Integrate this time interval using a horizontal baseline w/amplitude of the end time.
HM (Horizontal Minimum) start & end times. Integrate this time interval using a horizontal baseline w/minimum amplitude of interval.
II (Inhibit Integrate) start & end times. Don‟t integrate between these times.
PR (Peak Reject) 0 - 1,000,000. Discard integrated peaks < this area or height.
SN (Signal/Noise Ratio, 1 - 256. Do peak detection based on this S/N value.
SP (Split Peak) split time. Split a peak into 2 peaks at this time.
SR (Solvent Reject), start & end times. Do not integrate the precursor peak between these times. Do skim & integrate tangent peaks.
T% (Tangent %), 0 - 100 Tangent skim fused peaks having amplitude < this % of the mother peak.
VB (Valley Baseline) start & end times. Integrate with baselines drawn to valley points.
WI (Peak Width @ ½ height) 0.5 - 256 seconds. Optimize peak detection for peaks with this ½ width.
Value/Endtime Enter the endtime for the event if appropriate (e.g., VB, HM, would need endtime entered). Or, enter the value for the parameters T%, SN, or WI.
Description Displays the allowed entry range for the selected parameter.
Adds a new Row to the end of the table.
Inserts a new Row before the Row currently highlighted in the table.
Deletes a highlighted Row in the table.
If any of the events specified are not currently ordered by increasing time, clicking this to sort the table.
Saves any changes made to the Events Table and closes the dialog.
Closes the dialog without saving any changes.
Setting the RF to Use for Unknowns
This setting determines what response factor (RF) is used to calculate the amount of the unknown reported peak. The nearest internal standard RF, nearest Pure Internal Standard, or a fixed value can be specified.

147
Tentative Identification of unknowns
Select to do a library search of the unknowns during processing. The best match is reported for each unknown peak in the compound results list dialog in MS Data Review. If specified, the sample report lists the best match and the unidentified compound report lists up to the top three matches. The tentatively unidentified compound search is done using the NIST search algorithm.
Setting the Reporting Threshold for Unknowns
The number of unknown compounds reported can be limited by setting a threshold. The reporting threshold can be set as percentage of either the largest peak or the nearest internal standard, or as a certain number of peaks.
The default setting, All peaks, integrated using the specified integration parameters.
The % Of Largest Pk (0 - 100.0; preset = 20.0) reports all unknowns above the set % of the largest peak in the chromatogram.
The % of Nearest Std (0 - 500.0; preset = 30.0) reports all peaks above the set % relative to the nearest internal standard. (This button is activated only if Nearest Internal Standard or Nearest Pure Internal Standard is checked under RF to Use.)
The Largest N Pks (0 - 1000; preset = 20) reports the largest peaks up to the set number. The Exclude Duplicates setting disables the reporting of Duplicate Unknown Peaks. A Duplicate is an Unknown Peak whose retention time matches that of an Identified or Failed compound in the Compound Results.

148
Processing Results may be very slow when large numbers of unknown peaks are processed with library searching. Since only reported peaks are library searched, minimize this by setting reporting threshold parameters that eliminate small peaks that are not of interest.
Setting Parameters in the Compound Table Before processing calibration files, examine and edit the compound table to assure that appropriate information is entered for each compound in the table. Click Compound Table. This appears on the right. Click the toolbar button
Show/Hide Directory to make the method display full screen.
The Compound Table contains the list of compounds added to the method, either by Import Compound List or directly from Method Builder.
NOTE: Compounds may be Added, Inserted, or Deleted from the Main Table using the buttons at the bottom of the display. The Sort button sorts entries by retention time. Compound Lists can also be imported from MS Data Review. For more information on how to Build a Compound List or on Importing a Compound List refer to the “Compound Tables”.
View the calibration curves associated with the target compounds using the View Curves button. You can also select which data file to use when reviewing the compound information in the method builder using Select Data File. Use Any *.xms or *.sms file.

149
Compound Table Dialogs
The top row shows the most important information for each of six tab dialogs: Compound Attributes, Quan Ion, Calculations, Integration, Identification, and Reference Spectrum. To view all information in the tab dialogs, double-click on one of the lines for a given compound.
In a given tab dialog, use the Previous and Next buttons to examine the Compound Settings information for other peaks in the Compound Table.
Compound Attributes
This contains Chromatogram and Spectrum Displays on top and entry fields below. After Quan Ions other than the RIC are chosen (for example, in the Build Compound Table dialog in MS Data Review or in the Quan Ions Tab Dialog) the selected Quan Ions are used for Plot parameters.
NOTE: When the compound table is built by importing a Compound List, the major ion (base peak) in the spectrum is automatically selected as the quantitation ion. The selection of RIC in the Calculation setup section is not used for compounds where a quantitation ion is entered.
Edit Name, CAS Number, Retention Time
Although the Compound Name and CAS Number may be entered automatically during the peak addition process, the fields are editable here. The retention time of the peak may be updated by clicking in the chromatogram display. If this is

150
done, the spectrum from the selected scan is displayed. The user is prompted to update or reject the changes to retention time and reference spectrum when exiting the tab dialog or using the Next or Previous buttons to move to a different entry in the Compound Table. If no Reference Spectrum exists, the user also is asked if one should be added.
NOTE: The retention time is updated when calibration samples are processed if automatic updating is specified in the Results Treatment Dialog.
Identify Internal Standards
By default, compounds will be identified as analytes. Identify all Internal Standards by setting them as such. Use the Previous and Next buttons to check the Compound ID information for the other analytes. If more than one internal standard is identified, you may select the internal standard for a particular target compound by selecting from the IS to Use drop-down menu.
Identify Group Members
Sometimes it is desired to identify target compounds as part of a group of compounds (for example, Trihalomethanes (THM), alkyl aromatics, etc.). To include a compound in a group enter the desired name in the Group Names field. This will create a new group of that name, or prompt for selection of an existing group. If more than one Group has been designated in a method, select from the Group Name drop-down menu.
Active - Whether or not to process the compound when files are processed.
RRT Reference - Specify one compound as the RRT Reference to calculate RRT results. They are calculated relative to the Retention Time of this compound.
Identification Reference Pk - Specify one or more to improve the reliability of Target Compound identification when compound Retention Times vary significantly from run to run.
Quan Ions Tab Dialog
To access the Quan Ion dialog, click the Quan Ion tab in the Compound Table editor. When peaks are added to the Compound Table by importing a Compound List, the Quantitation Ion default is the Base Peak (most intense) ion in the reference mass spectrum for each component.
NOTE: The plot shows the mass chromatogram for the chosen Quan Ion.

151
Edit Quan Ions
Another quantitation ion, a sum of ions, or a range of ions may be chosen for
quantitation by entering the information in the Quan Ions field. Type the
quantitation ions directly in the field, or click the box to display the options.
If you select Ion(s), the Select Ion(s) to Plot Dialog will open. To add two or more ions, separate their m/z values by a “+” sign.
Scan Function Channels
Scan function channels are the mass specifications from the acquisition section of the method (MS Method Editor).

152
Where no ion preparation techniques are used, a segment specifies a single full-scan mass range.
Acquisition techniques such as MS/MS, MSn, MRM and µSIS may generate data
files with multiple scan channels. When compounds are added to the table by importing them from a Compound List, the channel specification is automatically set by the scan or scans in the chromatogram in MS Data Review. The following is an example of an MRM segment that was built in the acquisition section of the method:
A single channel is shown for the first compound, the deuterated drug metabolite 6-MAM which is the internal standard. In the above illustration, the parent ion of m/z 402 is isolated in one channel, and the product ions m/z of 315:402 are monitored. The analyte, the drug metabolite 6-MAM is monitored on a second channel:
When Merged is selected, all of the scan function channels in a segment are combined into a single chromatogram point.
Qualifier Ion Specification
In addition to specifying quantitation ions in this tab dialog, you may also select qualifier ions. Click Load to enter the three most intense qualifier ion candidates.
NOTE: The allowed qualifier ions must be in the Reference Spectrum. Click Add to add the next most intense reference spectrum ion available. To change a selected qualifier, click Ion to see the available choices. The Ratio field shows the intensity of the qualifier ion as a percentage of the chosen Quan ion(s). The % Uncertainty field is the allowed percentage deviation from the Ratio. By default, this entry is 20%, but it can be adjusted. The % Uncertainty allowable range is dependent on whether the Ion Ratio Type setting in the Calculations Setup Dialog is set to use an Absolute % or Relative %. For the top Qualifier Ion shown here, the allowed range for the ratio of the peak area of the Qualifier Ion
m/z 63 would be 84.0 20% (absolute) = 64.0 to 104.0% of the area of the Quantitation Ion m/z 162. If the Ion Ratio Type was set to Relative, then the
allowed range would change to 84.0 20% (relative) = 67.2 to 100.8%. When samples are processed as Calibration, Analysis, or Verification runs, the Qualifier Ion tests are run automatically.

153
NOTE: The Target Ion Ratios are updated when calibration samples are processed if you specify automatic updating in the Results Treatment dialog.
Calculations Tab Dialog
Enter Number of Calibration Levels and Amounts
For the first entry in the Compound Table, enter the number of Calibration levels, and then enter the calibration amounts and measurement units.
When building a new data handling method, click Close. Note that the calculations information for the first compound is updated in the main Compound Editor dialog. You can fill this information automatically for the other compounds in the table. Click the Calculations Tab to highlight all entries.

154
Then click Fill Down. Now the concentrations of all calibrations levels are filled in for all analytes. You need to make one further modification to complete the editing process. The internal standard MUST BE present at the same concentration in all calibration samples. Double-click the Calculations tab for the first internal standard and change the Calibration Amount in Level 1 to the correct concentration for that internal standard.
Then, click Copy Amounts to enter 40 automatically to the other levels. Repeat this process for all internal standards in the Compound Table.
Curve Fit Types
From the menu select the curve fit type.
For most LC/MS and GC/MS processing, Linear or Quadratic options are adequate. Observe the differences in the Calibration Curve reports for the same compound when linear or quadratic fit options are selected.

155
Linear Fit
Quadratic Fit
Select Treatment of Origin Point
The Origin Point may be Ignored (Default), Included, or Forced. This choice affects the calculated Fit Equations.

156
Select Regression Weighting
The regression points can be weighted towards the lower concentrations to reduce the effect a large calibration range can have on these points. For most analyses, use the None option, for trace level use 1/nx or 1/nx
2.
Choose Report Threshold and Results Units
The Analysis Calculations field of the Calculations Tab Dialog allows designation of the Compound Multiplier, Report Threshold and Results Units. The Compound Multiplier may be set on a per-compound basis so that dilutions or other adjustments to the sample relative to the calibration sample may be taken into account during processing. This parameter is distinct from the SampleList and RecalcList which is used to make per-sample adjustments such as dilutions. The Report Threshold allows the analyst to make intelligent decisions about the lowest level for which results are reported. For example, one might decide not to report results below a Practical Quantitation Limit (defined as 5-10 times the Method Detection Limit). Alternatively, one might decide that the Report Threshold is the lowest calibration level divided by five.
NOTE: The compound report threshold specification is ignored when processing calibration samples. Compounds in calibration samples are always reported.
Interpolation of Sample Response
The calibration curve plot displays the sample response and the interpolation of the amount. If the sample has a multiplier or divisor other than 1, the interpolation lines are dashed to indicate the actual reading which needs the appropriate mathematical operation.
Integration Tab Dialog
You may need to adjust the integration parameters for small, wide poorly shaped peaks or if there is high noise. Peak width may need to be increased for LC/MS applications. Increase Peak Reject by a factor of about 1000 when acquiring Quad data without Expanded Dynamic Range. The timed events for setting

157
baseline behavior, peak grouping, and forced peak integration can also be edited using the Interactive Timed Events Bar located below the chromatogram.
Evaluate Peak Integration Performance
Check how the peak is integrated by clicking Integrate. You will see the Baseline, Peak Start and Peak End are drawn in the Chromatogram display and the peak area (or height) and retention time are displayed to the left of Integrate. A compound will not show integration results if it does not pass all of the identification criteria as well as the integration. If the peak fails to integrate, or fails one of the identification tests, a brief description for the failure is displayed.
For the compound shown above, the integration process works well with the default integration parameters. You may use the Previous and Next to move from one compound to another and check that integration is performed properly. If you are not satisfied with the integration, try adjusting the Slope Sensitivity (decrease Slope Sensitivity to as low as 1 for broad, tailing peaks) and/or Peak Width parameters, then click Integrate to see the new results. You may also need to increase the Integration Window. This parameter is used to determine the time window of the Quan Ion integration.
NOTE: A peak will be Missed if the Peak Reject is too high.
158
There are two considerations for the Integration and search windows:
1. The integration window must be large enough to contain the entire integration baseline. Setting it too small will result in erroneously small areas for your peak (especially if it is part of a fused peak group).
2. The Search window must be wide enough to accommodate run-to-run retention time variations but narrow enough to exclude nearby peaks. All integrated peaks with apexes in the search window whose peak sizes are greater than the Peak Size Reject Threshold are considered. Never make the Search window wider than the Integration window.
NOTE: Before processing Calibration files for the first time, use the Integrate feature in this dialog to examine the integration of Quan Ion peaks for each analyte in the Compound Table. For the most thorough evaluation, examine this performance on calibration data files at the highest and lowest concentration levels. Use the Select Data File button to load the different files. When looking at the lowest level sample, assure that the Peak Area (or Height) Reject values are set low enough so that the peak is integrated.
About Peak Width and Slope Sensitivity
Peak Width
Increasing the Peak Width parameter causes the data points processed by the data-handling algorithm to be smoothed (the display always reflects the actual data points). This averages out peak irregularities and tends to lump split peaks together into a single peak. It also tends to move the Peak Start and Peak End points OUT from the Peak Apex. Very small peaks before or after the peak of interest may be lumped into it. If there is any peak tailing, the peak may be skimmed as tangent peaks. Small and/or wide peaks will not be detected with small Peak Width values, and narrow peaks will not be detected with large Peak Width values.
Slope Sensitivity
The Slope Sensitivity parameter sets the peak detection threshold. Increasing the Slope Sensitivity decreases the number of small peaks that are detected. In contrast to Peak Width, increasing the Slope Sensitivity tends to move the Peak Start and Peak End points IN towards the Peak Apex. Alternately, decreasing the Peak Sensitivity may improve integration of tailing peaks.
Adjusting Peak Detection and Baseline Placement with Time Events
Normal peak detection integrates all peaks found within the peak window. In most cases, a single peak can be isolated as the target compound by adjusting integration parameters (selecting a unique Quan Ion or combination of Quan Ions; selecting the proper spectrum match threshold).
Normal baseline placement will draw a baseline from any peak start to a following peak end, skimming tangents if necessary, and dropping a perpendicular from any valley point.
In some cases, you may want to combine a group of peaks within a time window based upon an individual ion chromatogram, a sum of ions, or the RIC. You may also wish to modify how the baseline placement occurs for a given compound. You can edit these settings by right clicking beneath the chromatogram in the
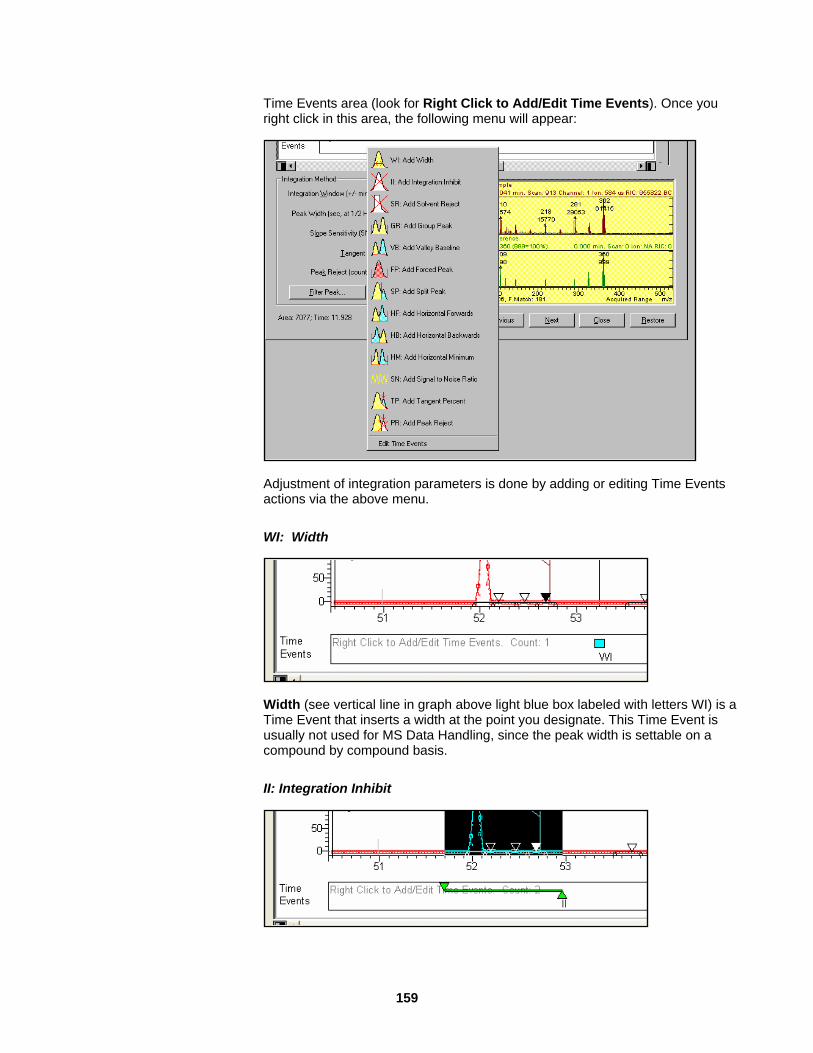
159
Time Events area (look for Right Click to Add/Edit Time Events). Once you right click in this area, the following menu will appear:
Adjustment of integration parameters is done by adding or editing Time Events actions via the above menu.
WI: Width
Width (see vertical line in graph above light blue box labeled with letters WI) is a Time Event that inserts a width at the point you designate. This Time Event is usually not used for MS Data Handling, since the peak width is settable on a compound by compound basis.
II: Integration Inhibit

160
Integration Inhibit (see dark area between green triangles labeled with letters II) is a Time Event used to prevent integration of peak area in a selected time period. In addition, the start and end points of the II event reset any peak state detected by peak processing, so that peaks are forced to start or end at the II event endpoints, and a baseline point exists by definition at those points.
SR: Solvent Reject
Solvent Reject (see dark area between blue triangles labeled with letters SR) is a Time Event used to eliminate the area resulting from solvent peaks from the computation of total area, for instance in Area% calculations, while retaining the peak processing basis for purposes such as computation of tangent peak areas. Since the solvent peak in MS is very often eliminated by turning off the filament while the solvent elutes, this event is little used in MS Data Handling.
GP: Group Peak
Group Peak (see area between yellow triangles labeled with the letters GR) is a Time Event which uses the normal peak detection processing to determine peak events. The function combines the areas of all peaks whose apices occur between the Group Start and End times. Adjust the Peak Window parameter in the Identification dialog to set the peak window wide enough to include all the compounds you wish to group. Group Peak integration reports the combined area of all peaks with a retention time reported at the mid-point of the Group Start/End window. If Peak Height was selected for the Measurement Type, the combined heights of all peaks will be reported. All other integration parameters (Peak Width, Slope Sensitivity, Baseline Type, Tangent %) are enabled for use with Group Peaks. If a Force Peak event occurs within the time range of a Group Peak event, the area/height due to the Force Peak is included in the Group Peak total.

161
VB: Valley Baseline
Valley Baseline (see area between purple triangles labeled with letters VB) is a Time Event used to define every valley point detected by Peak Processing between the event start and end time as a baseline point. This allows the quantitation of discrete peaks superimposed upon an unresolved background lump.
FP: Force Peak
Force Peak (see dark area between red triangles labeled with the letters FP) is a Time Event that ignores normal peak detection processing. Integration starts and ends exactly at the specified times. All area between the peak start and end points is integrated. The combined area of all peaks is reported with a retention time of the highest peak. If Height was selected for the Measurement Type, only the height from the highest peak in the event window will be reported. All other integration parameters (Peak Width, Slope Sensitivity, Baseline Type, Tangent %) are disabled when using Force Peak.
NOTE: Use Force Peak events cautiously. Force Peak events that are appropriate for one data file may not be appropriate for others.

162
SP: Split Peak
Split Peak (see the shaded area above the box labeled SP; the area has been split off from the main peak) is a Time Event used to terminate the integration of a partially resolved peak without forcing a baseline point at the chosen peak end. This event would normally be used on a chromatogram by chromatogram basis to correct the integration of a peak which is sometimes resolved from an adjacent peak with a valley point, sometimes not resolved.
HF: Horizontal Forward
Horizontal Forward (see area between light brown triangles labeled with letters HF) is a Time Event used to project a baseline under a peak or peaks from the first detected baseline point within the time window to the end of the event. The peak start and end points determined by Peak Processing are used to define the peak, but the amplitude of the HF baseline supersedes the amplitude of the detected start and end points for the calculation of peak area.

163
HB: Horizontal Backward
Horizontal Backward (see area between brown triangles labeled with letters HB) is a Time Event used to project a baseline under a peak or peaks from the last detected baseline point within the time window to the beginning of the event. The peak start and end points determined by Peak Processing are used to define the peak, but the amplitude of the HF baseline supersedes the amplitude of the detected start and end points for the calculation of peak area.
HM: Horizontal Minimum
Horizontal Minimum (see area between the black triangles labeled with letters HM) is a Time Event used to define baseline as the amplitude of the lowest peak event detected within the event window. The peak start and end points determined by Peak Processing are used to define the peak, but the amplitude of the HM baseline supersedes the amplitude of the detected start and end points for the calculation of peak area.
SN: Signal to Noise Ratio

164
Signal to Noise Ratio (see green rectangle labeled with letters SN) is a Time Event little used in MS Data Handling, as the Signal to Noise ratio is set on a compound by compound basis in the Integration tab of the Compound Table.
TP: Tangent Percent
Tangent Percent (see vertical line above purple rectangle labeled with letters TP) is a Time Event little used in MS Data Handling, as the Tangent % is set on a compound by compound basis in the Integration tab of the Compound Table.
PR: Peak Reject
Peak Reject (see vertical line in graph above orange rectangle labeled with letters PR) is a Time Event little used in MS Data Handling, as the Peak Reject value is set on a compound by compound basis in the Integration tab of the Compound Table.
Once you have specified or edited a Time Event, make sure you have specified the Integration Start and End times. This mode works best with Retention Time as the chosen Search Type in the Integration dialog. When all parameters are set, click the Integrate button to see the results.
Select a time event and a time-window icon will appear in the Time Events area below the Chromatogram. The icons are colored rectangles or colored triangles, all labeled with a two letter code (e.g., GR for Group Peak). The beginning time will be where you right clicked the window.
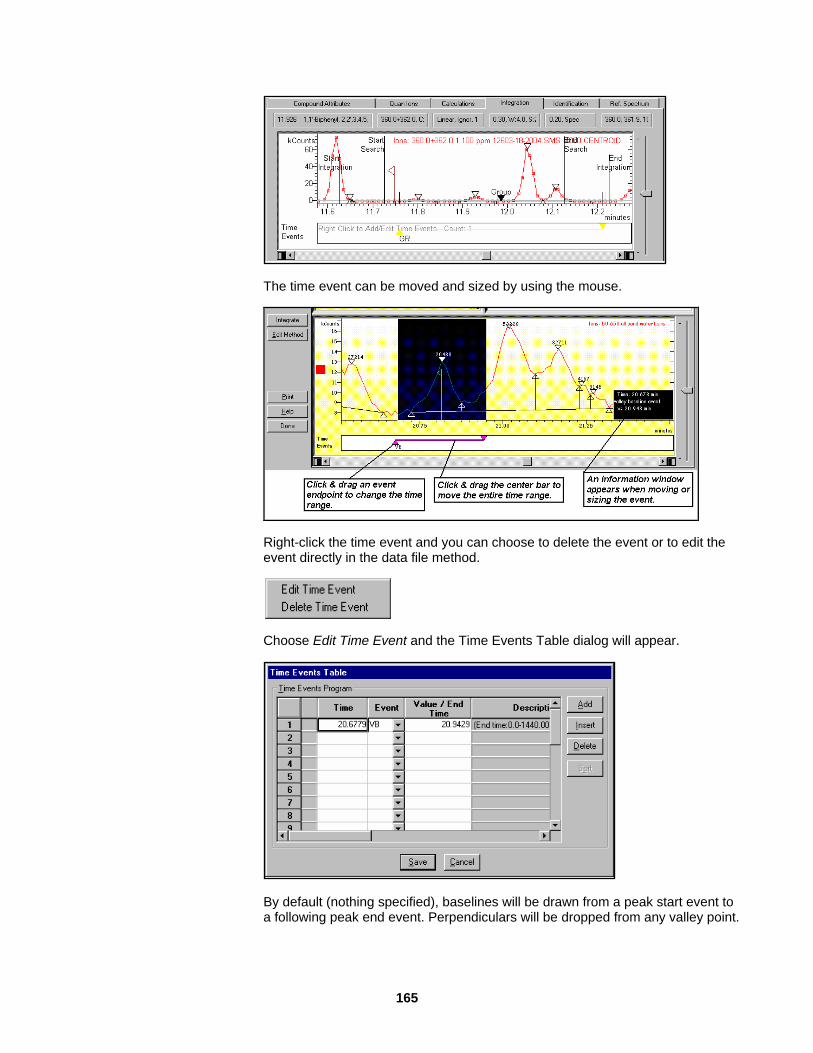
165
The time event can be moved and sized by using the mouse.
Right-click the time event and you can choose to delete the event or to edit the event directly in the data file method.
Choose Edit Time Event and the Time Events Table dialog will appear.
By default (nothing specified), baselines will be drawn from a peak start event to a following peak end event. Perpendiculars will be dropped from any valley point.
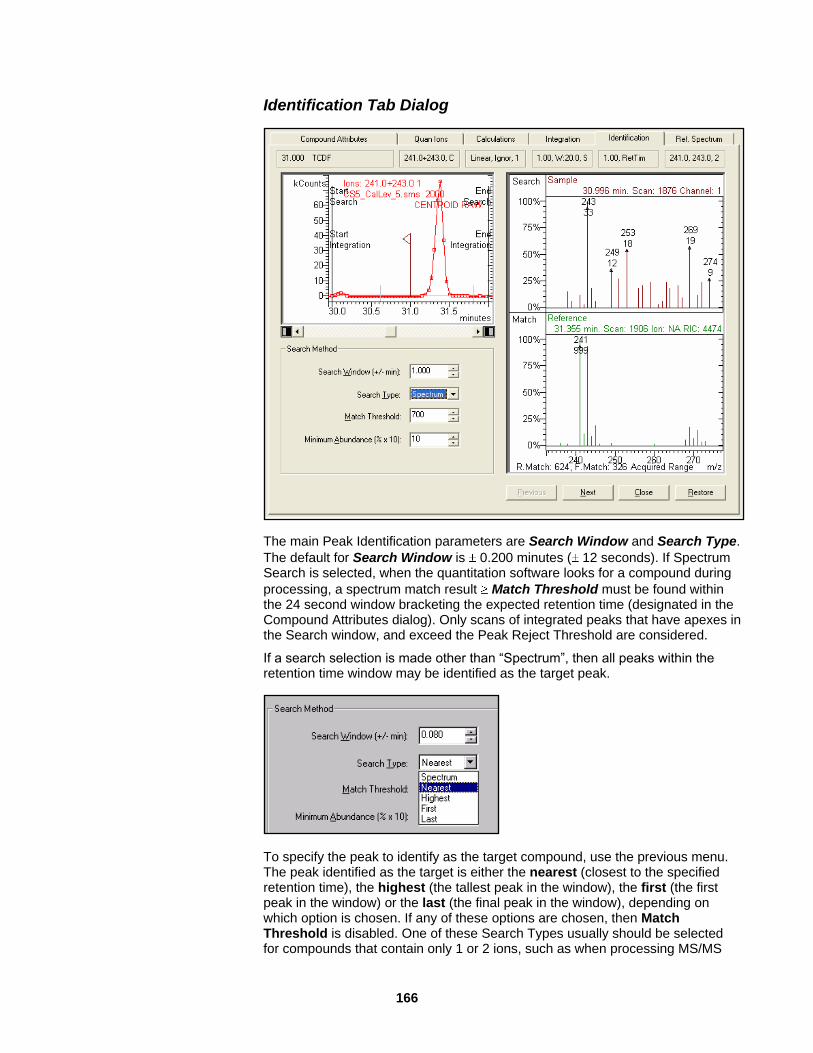
166
Identification Tab Dialog
The main Peak Identification parameters are Search Window and Search Type.
The default for Search Window is 0.200 minutes ( 12 seconds). If Spectrum Search is selected, when the quantitation software looks for a compound during
processing, a spectrum match result Match Threshold must be found within the 24 second window bracketing the expected retention time (designated in the Compound Attributes dialog). Only scans of integrated peaks that have apexes in the Search window, and exceed the Peak Reject Threshold are considered.
If a search selection is made other than “Spectrum”, then all peaks within the retention time window may be identified as the target peak.
To specify the peak to identify as the target compound, use the previous menu. The peak identified as the target is either the nearest (closest to the specified retention time), the highest (the tallest peak in the window), the first (the first peak in the window) or the last (the final peak in the window), depending on which option is chosen. If any of these options are chosen, then Match Threshold is disabled. One of these Search Types usually should be selected for compounds that contain only 1 or 2 ions, such as when processing MS/MS

167
data files. One or more of the Compound Confirmation Criteria that are specified in the Calculations Setup dialog can be sued to confirm identification.
Ions in the Reference and Sample spectra below the designated Minimum Abundance Threshold % value is ignored in calculating the library fit. For samples with significant matrix interferences, using Minimum Abundance values of 5-10% has been found to be useful in improving peak identification performance.
Reference Spectrum Tab Dialog
This dialog shows both the Sample and the Reference spectra in the Spectrum display. This is a convenient display for reviewing mass spectral data quality. Because only the 16 largest peaks are included in the Reference spectrum, low intensity ions in the Sample spectrum may not be included. The source data file for the reference spectrum is indicated in the File: field below the Spectrum Display.
The Ion/Intensity list is normalized so that the Base Peak in the spectrum has an intensity of 999 counts. You may edit the reference spectrum if desired and redraw the spectrum plot. The reference spectrum will then be renormalized. Editing the reference spectrum is advisable if interference ions (from co-elution, background interferences, or column bleed) are observed. If the spectrum is edited by the user, the File: field contents will be changed to Manually Edited.
NOTE: The reference spectrum are updated when calibration samples are processed if automatic updating is specified in the Results Treatment dialog.
Use Previous and Next to scroll through the spectra for the analytes in the Compound Table.

168
Checking Spectral Quality over the Calibration Range
The Reference Spectrum dialog is a convenient place to examine the quality of the mass spectra for the highest and lowest concentration levels of the calibration curve (using the Select Data File button to select the appropriate data files for review).
NOTE: You may take this comparison process one step further by choosing to compare a data file to an analysis sample (e.g., a spiked matrix extract sample).
Save the Edited Data Handling Method
After editing a Data Handling Method save it before processing the data either through System Control or in MS Data Review. Click File>Save to save the edited Data Handling method. Click File> Exit to close the Method Builder. The next step in the quantitation process is to build a SampleList to add calibration points to the Data Handling method.
NOTE: It is a good idea to save an archive copy of the data handling method in case the method should be accidentally deleted.
There always will be situations in which the way that a peak was integrated cannot be adequately specified in the method, either because the method just can‟t do what the user wants, or because the peak characteristics will vary from sample to sample. Dealing with these situations is one of the key roles of the Compound and Unknown Peak Results Integration Windows in MS Data Review. Many of the problems with peak integration, especially for Target Compounds, can be eliminated by properly optimizing the method.
Guidelines for Optimizing Integration Parameters
The following table is a quick reference guide to use when optimizing integration parameters. This is followed by a more detailed explanation of the parameter settings.
NOTE: These guidelines are appropriate for ion trap GC/MS data and Quadrupole GC/MS data collected with Extended Dynamic Range (EDR). LC/MS data typically requires wider peak width and Integration Window specifications even for large well-shaped peaks and peak smoothing for smaller peaks. Quadrupole GC/MS or LC/MS data that was collected without EDR typically requires Peak Size Reject specifications that are 1000 times larger.

169
Peak Description Peak Width (sec)
(should be actual width at ½ height)
Slope Sensitivity
Integration Window minutes (should be > actual span of baseline)
(default method values)
Area > 1,000 counts
Good to fair peak shape
Little or no peak tailing
Baseline spans single peak
RTs are constant
4 20
0.25
Area > 1,000 counts
Good to fair peak shape
Little or no peak tailing
Baseline spans fused peaks
RTs vary
4 20 0.4
Area ~ (500-1000) counts
Good peak shape
Baseline spans single peak
RTs are constant
4 5 0.25
Area ~ (500 - 1000) counts
Good peak shape
Baseline spans fused peaks
RTs vary
4 5 0.4
Area > 1,000 counts
Fair to poor peak shape
Significant peak tailing
5 5 0.4
Area ~ (500 - 1000) counts
Fair to poor peak shape
Some peak tailing
5 5 0.4
Area ~ (150 - 500) counts
Fair peak shape>= 5 data points
5 5 0.4
Area ~ (150 - 500) counts
Poor peak shape
Few data points
5 - 10 5 0.4
Area < ~150 counts
Poor peak shape
Split peaks
Few data points
10 - 20 5 - 10 0.4
Explanation of Parameter Settings
Setting the Integration Window
In order for Target Compound integration to be done correctly, the Baseline Start and End points MUST be contained within the chromatogram segment that is defined by the Target Compound Expected Retention Time and the specified Integration Window. (There is no Integration Window specification for Unknown Peaks.) This means that if the Target Compound is part of a fused-peak group, then the entire group must be contained in the window. Since small, poorly-shaped peaks often are broader than well-defined peaks and often are part of a fused peak group, these peaks usually require a Peak Window specification > the

170
default method value of 0.25 minutes. Also, remember that peak retention times may vary with concentration or run-to-run, so the window must be broad enough to contain the Baseline Start and End points for all cases. Integration and Identification windows and time events are handled relative to the compound retention time. Therefore, they are automatically adjusted when the RT is updated by processing calibration samples. In general, the time spanned by the
actual baseline should be the specified Integration Window value. The trade-off to specifying large Peak Windows is that processing time may increase.
NOTE: If the Compound Retention Times are concentration-dependent and you expect the calculated amounts in your samples to be largely in a particular range, set the retention times in the Compound Table with a calibration standard that best matches the expected amounts. This will keep the Target Compounds near the center of their specified Peak Windows, and may allow narrower windows to be specified. You can do this by running the desired calibration standard last in a calibration block. Alternatively, run it first and then uncheck the Update Compound Table RT parameter in the method.
Setting Peak Width and Slope Sensitivity
The default Peak Width and Slope Sensitivity values work well for almost all peaks having an area > ~ 1,000 counts and a good to fair peak shape. A narrow Peak Width and high Slope Sensitivity tend to eliminate small, unwanted peaks and noise effects that are insignificant relative to the area of the Target Compound. In general, the actual width at ½ height should be approximately 50% less than and 100% more than the specified Peak Width value.
As the peak area decreases, the peak amplitude decreases rapidly relative to its width, and the transition between “baseline” and “peak” becomes more gradual. When the integrated area falls below 500-1,000, the overall quality of the peak decreases, its shape becomes less regular, it may contain false “valleys”, and the number of points across the peak decreases. As these things happen, peak integration becomes more affected by co-elution, noise, and matrix effects, and the interaction of the Peak Width and Slope Sensitivity parameters becomes significant when optimizing integration.
To optimize the integration of small and/or poorly shaped peaks, the best approach is to first set the Slope Sensitivity to 5 and re-integrate. If the peak is still not detected or only a portion of it is integrated, progressively increase the Peak Width until the Peak Start and End points span the region to be integrated. If this results in placing the baseline too low because unwanted peaks before and/or after the peak of interest have been detected, increase the Slope Sensitivity parameter until the baseline is in the desired position. If low Slope Sensitivity values result in small-unwanted tangent peaks, set the Tangent % parameter to, or near, 0.
Recommended Procedure
Try the following procedure to optimize a new method:
1. Use the MS Data Review Build Compound Table window to create the Compound Table from the appropriate calibration data file(s). If you know that a particular calibration standard level is appropriate for the compound retention times that you expect in your analysis runs, you can use a data file generated from it to build the table. Then when you edit the method, set Update Cmpd Table RT = No.

171
2. Go to the Method Builder to optimize the method. Make the appropriate entries on the Compound Attributes, Quan Ion, and Calculations pages.
3. Navigate the compounds via the Identification page to first ensure that the Peak Windows are big enough, e.g., a window always must be wide enough to contain the Baseline Start and End for its Target Compound. If it is part of a fused peak group, that means the entire group.
4. Next, check the peak width and slope sensitivity values to optimize the integration parameters. If it appears that the default Peak Width and/or Slope Sensitivity values (4 and 20, respectively) may not be appropriate for a given compound, adjust them as described previously above. Do a local integration after each modification to see the result. You can use the cursor to zoom the region of interest in the displayed chromatogram.
5. Since method parameter values that are optimal for peak sizes at one concentration may not be at another, it is a good idea to select data files at both extremes of the expected concentration range and repeat steps 3 and 4 to find the best compromise for each compound. It usually works best to first optimize the parameters using a low-concentration standard, and then check them with a high-concentration standard.
Changing Integration Parameters
Deleting Calibration Data
Only invalidated data are deleted when changes are made to the method or data file. If method changes invalidate the calibration curves but the calibration data points are still valid, then the curves are recalculated. If method changes are made to an internal standard compound that cause its calibration data to be deleted or its calibration curve to be recalculated, the calibration data for all analytes that use it are acted on in the same way.

172
Changes Affecting Calibration Data:
1. Changes to the following parameters… Calibration Type (Internal Standard, External Standard, %)
Measurement Type (Area, Height)
Replicates Addition Mode (Append, Average)
Replicates Addition Rule (Always, Never, Within Tolerance %)
…causes the deletion of all calibration data for all Target Compounds.
2. Performing a… Fill-Down action in the Calculations column on the Main Compound
Table Screen
…causes the deletion of all calibration data for selected Target Compounds.
3. Changes to the following parameters… Compound Type (Analyte, Istd)
Istd To Use
Quan Ion
Scan Function Channel
…causes the deletion of all calibration data for the current Compound.
4. Changes to the following parameter… # Calibration Levels (data for eliminated levels are deleted)
…causes the deletion of all calibration data for the current Compound at one or more Calibration Levels .
5. Changes in manual integration … Integrated Peak Size
…causes the current calibration data point to be changed (or added or deleted).
If the integrated peak size changes in Manual Calibration, saving the changes back to the permanent method updates the data point and recalculates the calibration curve. If any change in Manual Calibration causes the status of the current Target Compound to change from Missing to Identified, saving the changes back to the real method adds a new calibration data point and recalculates the calibration curve. These could be changes to the local copy of the method, or dragging the Peak Start/End events. Similarly, saving any change that changes the Compound Status from Identified to Missing will delete the current calibration data point and recalculate the calibration curve.
6. Changes to the following parameters… Calibration Level Amounts
Curve Fit Type (Linear, Quadratic, Cubic)
Origin Point (Ignore, Include, Force)
Regression Weighting (None, 1/n, 1/x, 1/nx, 1/x2, 1/nx2)
- or -
Manual Calibration actions that change, add, or delete individual
calibration data points
…cause the recalculation of the calibration curve for the current Compound.
173
Changes NOT affecting Calibration Data:
Changes to the following method parameters DO NOT delete calibration data or recalculate calibration curves:
1. Description/Reporting Parameters Compound Name
CAS #
Group Name
Results Units
2. Identification Parameters Unretained Peak Time (global parameter)
Ion Ratio Type (global parameter; Absolute, Relative)
Update Cmpd Table RT (global parameter; Yes, No)
Update Cmpd Table Reference Spectrum
Update Cmpd Table Ion Ratios
Retention Time
Relative Retention Peak Designation
Qualifier Ions
Reference Spectrum
Search Window
Search Type
Match Threshold
Min Abundance
3. Integration Parameters
4. All parameters on Compound Integration page
Integrating Unknown Peaks
The situation is much simpler when integrating Unknown Peaks. There is no Integration Window parameter when integrating Unknown Peaks, since the entire chromatogram is processed. In most cases, the default Peak Width (WI) and Slope Sensitivity values do not need to be changed when integrating Unknown Peaks. The Peak Width value is updated dynamically during processing based on the width of the last peak detected. If either the Peak Width or Slope Sensitivity do need to be changed during the run, the desired time and value for each event is specified in the Time Events Table, which is accessed from the Calculations Setup dialog in the method.

174
Setting Parameters in the Results Treatment Dialog During processing of Calibration Samples, the Replicates Addition Mode and Replicates Addition Rules specified in the Calibrations Results field are obeyed.
NOTE: Rules may be set for tolerances and Out-of-Tolerance Actions may be set for Calibration, Analysis, and Verification samples. For example, if there is a hardware problem causing verification samples to fall out of tolerance, automation can be halted. These specifications are ignored when processing is done in MS Data Review.

175
TurboDDS(TM) Data Review
Overview If you are not familiar with the previous MS Data Review section, please review the sections about selecting data files, selecting, and viewing chromatograms, selecting and reviewing spectra in this manual.
NOTE: Because TurboDDS™ is a specialized application not all of the MS Data Review features are available. These unavailable features include background correction, Quick Integration, quantitation (process data, and review results), and averaging selected spectra.
This section describes reviewing TurboDDS data and generating TurboDDS reports.
Opening MS Data Review Click the MS Data Review ion on the Workstation toolbar.
MS Data Review (MSDR) opens.
MSDR Toolbar Icons for TurboDDS Data Not all icons are available for TurboDDS data.
NOTE: This figure is from a profile TurboDDS data file. Library searching is not available for profile data either non-TurboDDS or TurboDDS.
The icons relevant to TurboDDS are:
If a TurboDDS file is open, click to return to the last non-TurboDDS file that was open.
If a non-TurboDDS file is open, click to return to the last TurboDDS file that was open.
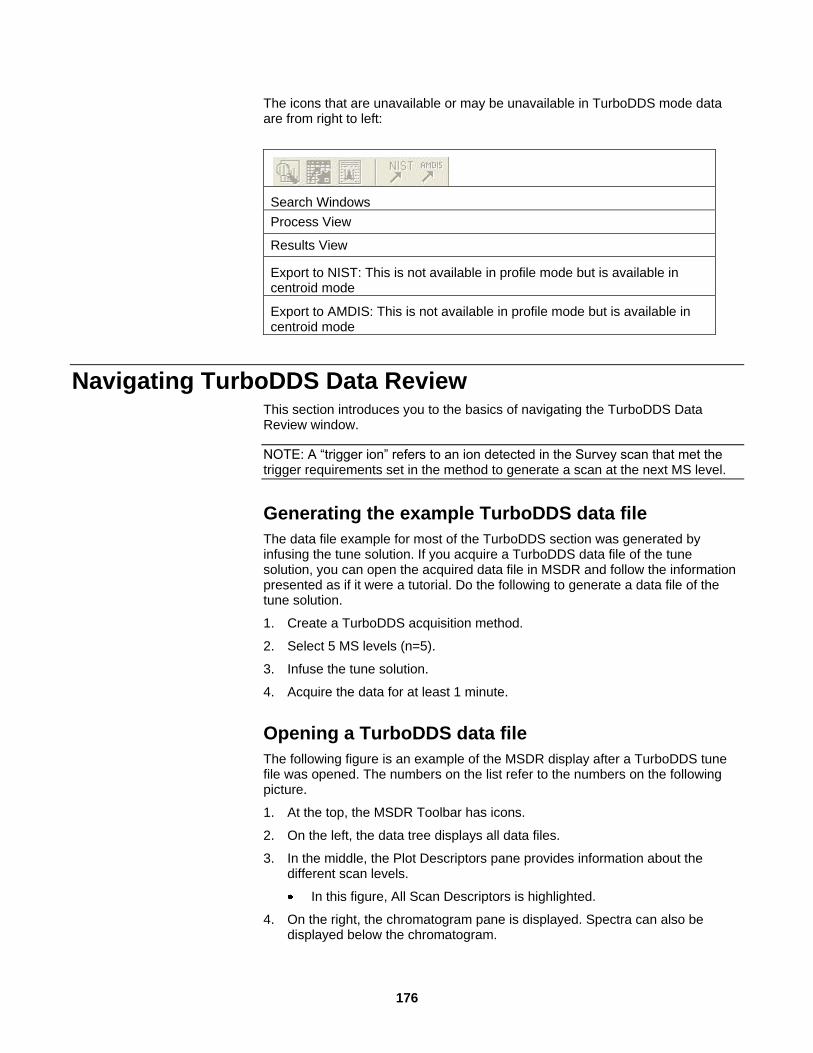
176
The icons that are unavailable or may be unavailable in TurboDDS mode data are from right to left:
Search Windows
Process View
Results View
Export to NIST: This is not available in profile mode but is available in centroid mode
Export to AMDIS: This is not available in profile mode but is available in centroid mode
Navigating TurboDDS Data Review This section introduces you to the basics of navigating the TurboDDS Data Review window.
NOTE: A “trigger ion” refers to an ion detected in the Survey scan that met the trigger requirements set in the method to generate a scan at the next MS level.
Generating the example TurboDDS data file
The data file example for most of the TurboDDS section was generated by infusing the tune solution. If you acquire a TurboDDS data file of the tune solution, you can open the acquired data file in MSDR and follow the information presented as if it were a tutorial. Do the following to generate a data file of the tune solution.
1. Create a TurboDDS acquisition method.
2. Select 5 MS levels (n=5).
3. Infuse the tune solution.
4. Acquire the data for at least 1 minute.
Opening a TurboDDS data file
The following figure is an example of the MSDR display after a TurboDDS tune file was opened. The numbers on the list refer to the numbers on the following picture.
1. At the top, the MSDR Toolbar has icons.
2. On the left, the data tree displays all data files.
3. In the middle, the Plot Descriptors pane provides information about the different scan levels.
In this figure, All Scan Descriptors is highlighted.
4. On the right, the chromatogram pane is displayed. Spectra can also be displayed below the chromatogram.
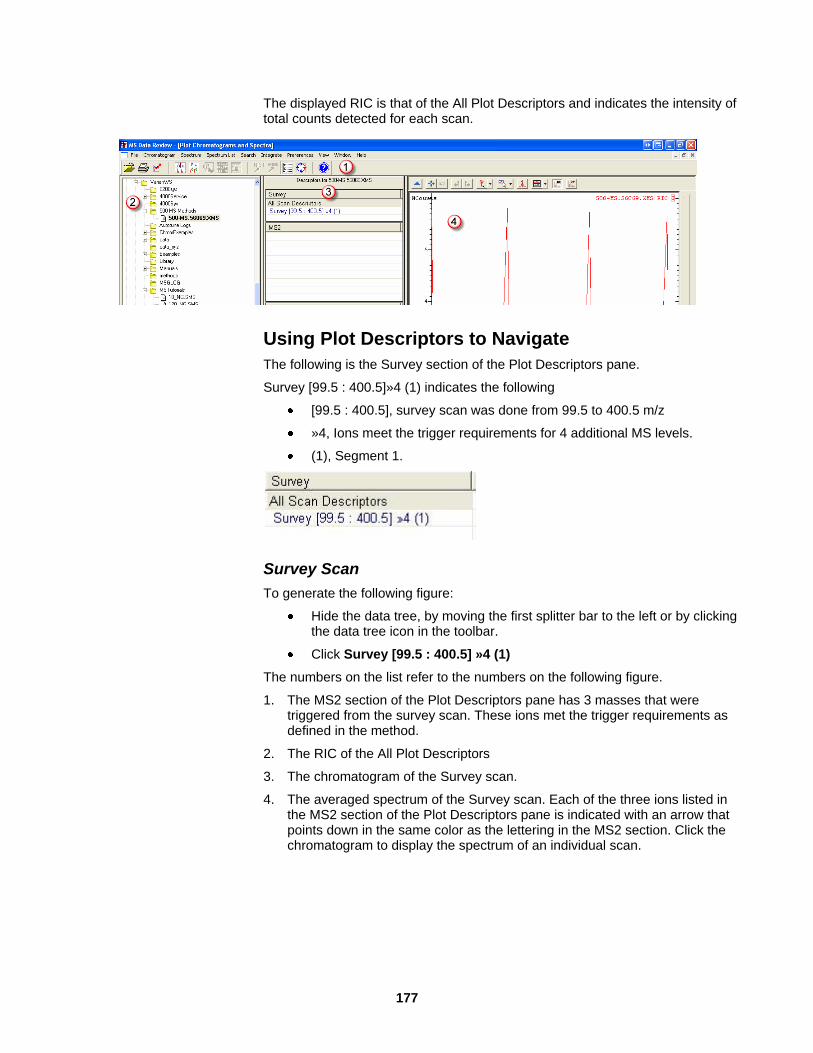
177
The displayed RIC is that of the All Plot Descriptors and indicates the intensity of total counts detected for each scan.
Using Plot Descriptors to Navigate
The following is the Survey section of the Plot Descriptors pane.
Survey [99.5 : 400.5]»4 (1) indicates the following
[99.5 : 400.5], survey scan was done from 99.5 to 400.5 m/z
»4, Ions meet the trigger requirements for 4 additional MS levels.
(1), Segment 1.
Survey Scan
To generate the following figure:
Hide the data tree, by moving the first splitter bar to the left or by clicking the data tree icon in the toolbar.
Click Survey [99.5 : 400.5] »4 (1)
The numbers on the list refer to the numbers on the following figure.
1. The MS2 section of the Plot Descriptors pane has 3 masses that were triggered from the survey scan. These ions met the trigger requirements as defined in the method.
2. The RIC of the All Plot Descriptors
3. The chromatogram of the Survey scan.
4. The averaged spectrum of the Survey scan. Each of the three ions listed in the MS2 section of the Plot Descriptors pane is indicated with an arrow that points down in the same color as the lettering in the MS2 section. Click the chromatogram to display the spectrum of an individual scan.

178
Scan of the 242.3 ion
To generate the following figure in MSDR:
Click 242.3 »3
The numbers on the list refer to the numbers on the following figure.
1. The 242.3 »3 entry is highlighted.
2. The MS3 section displays the product ions that were triggered from the 242.3 scan. These are 142.2 and 186.3 m/z.
3. The All Scan Descriptors Chromatogram.
4. The chromatogram of the scans that were generated from the 242.3 trigger ion. Each scan is indicated by a small box. Click a scan box to display the spectrum of that scan.
5. The averaged spectrum of the scans generated from the 242.3 trigger ion.
6. Each of the two ions listed in the MS3 section of the Plot Descriptors pane is indicated in the spectrum with an arrow pointing down that is the same color as the lettering in the MS3 section of the Plot Descriptors Pane (number 2 in the figure).
7. The arrow pointing upwards shows that the displayed spectrum is the product scan of the 242.3 ion.

179
Using Arrows in the Spectrum Pane to Navigate
The spectrum pane of the following figure had several arrows that you can use to navigate through different MS levels in the spectrum pane.
1. Downward pointing arrows on the 142.2 and 186.3 ions.
Click a downward pointing arrow to display the chromatogram and spectrum of the product scan of that ion.
2. Upward pointing arrow labeled 242.3.
Click an upward pointing arrow to display the chromatogram and spectrum of the precursor ion, which is 242.3 in this example.
Clicking either an up or down arrow in the spectrum results in the same action as clicking the corresponding trigger ion in the Plot Descriptors Pane.

180
Navigation of the MS3, MS4, and MS5 levels
Navigate the MS3, MS4, and MS5 levels the same way as the MS2 levels.
High Resolution TurboDDS Data
The following figure was generated from a TurboDDS Data file acquired with the High Resolution box selected in the method. The 1422.4 ion was selected in the Plot Descriptors Pane. The following numbers refer to the numbers on the figure.
1. MS2 and HiRes Plot Descriptors Pane. High Resolution data is acquired only on ions triggered from the Survey Scan.
2. Both the High Resolution chromatogram of the 1422.4 ion and the MS2 chromatogram of 1422.4 ion are displayed
3. The High Resolution spectrum of the product scan of the 1422.4 ion is displayed to next to the MS2 level spectrum.
4. Click the HiRes icon in the Chromatogram toolbar to hide the HiRes chromatogram and spectrum. By default, HiRes data is displayed.

181
TurboDDS Options The previous section has a general overview of the examining a TurboDDS data file in MSDR. This section explains MSDR TurboDDS options.
Plot Descriptor Options
There are two sets of options available in the Plot Descriptors Pane:
Sort by Masses or Sort By Times
Right-Click Options
Sorting
The two commands at the bottom of the Plot Descriptors pane are Sort by Masses, and Sort by Times.
Sort by Masses – Click Sort by Masses to arrange the ions in each MS level by mass. The following is a before and after example.
Before Sort by Masses After Sort by Masses
Sort by Times – Click Sort by Times to arrange the ions in each MS level by the retention time of the first trigger scan. The following is an example.
Before Sort by Times After Sort by Times

182
Right-Click Options
Right-click an ion in the Plot Descriptors Pane and a menu appears.
If the scan from the next MS level did not have ions that met the requirements, the product related options are not available. Product Ion Stacked Report and Product Ion Tree Report generate reports that are formatted for printing.
For example, the only option for the MS 5 level 57.9 m/z ion is the Precursor Ion Path. There are no product ions because five is the maximum number of MS levels that are scanned in TurboDDS.
Precursor Ion Path
The example for this section was generated by right-clicking the 57.9 ion in the MS5 level and selecting Precursor Ion Path, which is the only menu option. This graphically links how the spectrum of the 57.9 trigger ion was generated from the product scans of the precursor ions from each MS level.
MSWS Data Review software uses colors to help link spectra with information in the Plot Descriptors pane. In the Plot Descriptors pane, the precursor ions of

183
57.9 are highlighted. Starting from MS5 and going to MS2 the path is 57.9, 100.2, 142.2, and 242.3.
Numbers on the previous figure link the Plot Descriptors pane information to the spectrum. They are described as follows:
NOTE: The mass in the MS5 level is 57.9, yet the mass label for the spectrum labeled 1 is 58.0. The value in the Plot Descriptors pane is from the first scan where as the value with the spectrum is the average value of all scans.
1. Spectrum 1D, which has 58.0 m/z as base peak, is the product ion spectrum of the 100.2 m/z ion in the MS4 section.
2. Spectrum 1C, which has 100.2 m/z as base peak, is the product ion spectrum of the 142.2 ion in the MS3 section.
3. Spectrum 1B, which has 142.2 m/z as the base peak, is the product ion spectrum of the 242.3 ion in the MS2 section.
4. Spectrum 1A, which has 242.3 m/z as the base peak is Survey scan.
The previous figure has two chromatograms, labeled by the MSDR software as 1 and 2. These numbers were circled to help identify them.
Chromatogram 1 is the All Scan Descriptors Chromatogram
Chromatogram 2 consists of all scans in the Precursor Ion Pathway.
Product Ion Tree Report
The example for this section was generated by right-clicking the 242.3 ion in the MS2 level and selecting Product Ion Tree Report from the menu. This report clearly shows the relationship of all product spectra for the selected MS2 trigger ion and its precursor Survey spectrum.
The top of the report shows the survey spectrum displaying the ions that met the trigger requirements defined in the method. Each plot is connected by an arrow showing the product spectrum of that particular ion. The top of each plot lists the corresponding MS level, the trigger masses, and the range scanned for that display. The connecting arrows show the precursor ion and the mass loss for each spectrum.
Product Ion Tree Reports are formatted for printing and can be exported.

184

185
Product Ion Overlay
The example for this section was generated by right-clicking the 242.3 ion in the MS2 level and selecting Product Ion Overlay from the menu.
The following figure is the Product Ion Overlay for the MS2 level 242.3 m/z ion. The MSDR software uses colors to help correlate the ions with the appropriate MS level. The spectrum is an overlay of all related product ion spectra of the 242.3 m/z ion. Refer to the Product Ion Tree Report to see spectrum individually and obtained detailed information.
The following figure has two chromatograms, labeled by the MSDR software as 1 and 2. These numbers were circled to help identify them.
The chromatogram pane display:
Chromatogram 1 is the All Plot Descriptors
Chromatogram 2 consists of all of the scans in the product ion pathway
The Select Spectra Display Format icon, which is circled, is not active when the Product Ion Overlay is displayed.

186
Product Ion Stacked Report
The Product Ion Stacked Report displays all of the spectra with the same mass range. This clearly shows the mass relationship of the spectra at each MS level.
The example for this section was generated by right-clicking the 242.3 ion in the MS2 level and selecting Product Ion Stacked Report from the menu.
The following is the first page of the Product Ion Stacked Report for the MS2 level 242.3 m/z ion. It has the Survey scan and the MS2 scan. This report shows all the spectra associated with a particular ion. Although only 2 spectra are shown here the full report has 8 spectra.
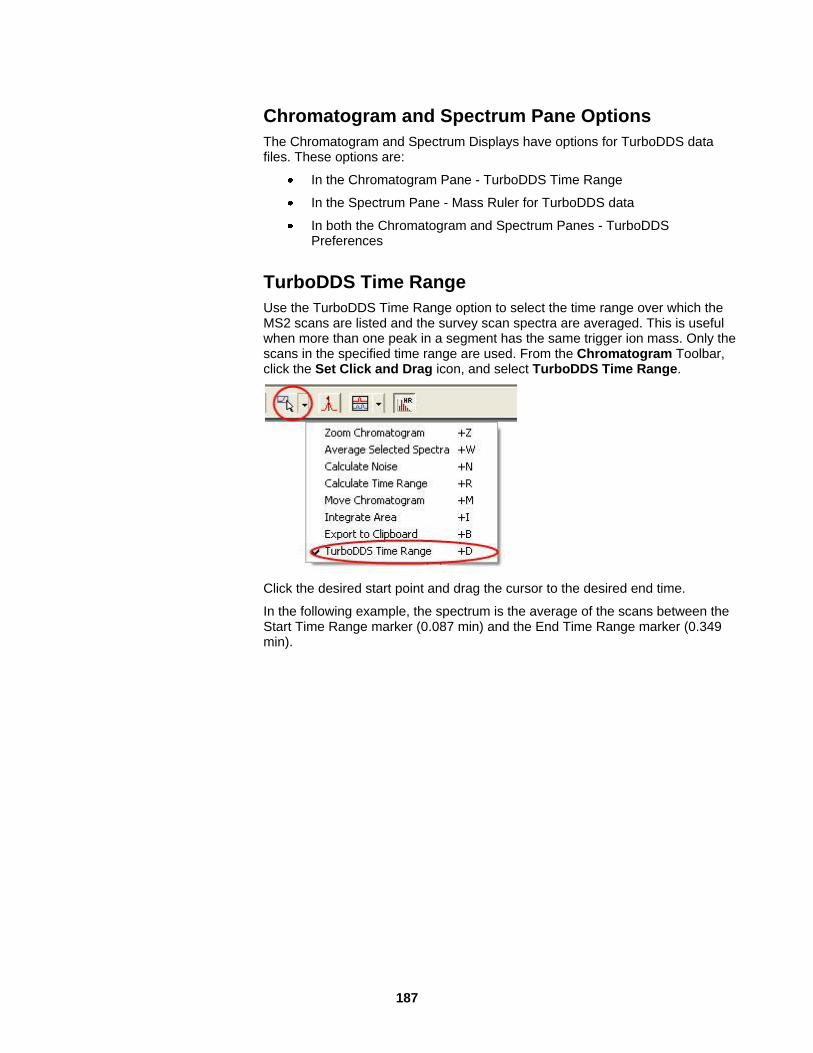
187
Chromatogram and Spectrum Pane Options
The Chromatogram and Spectrum Displays have options for TurboDDS data files. These options are:
In the Chromatogram Pane - TurboDDS Time Range
In the Spectrum Pane - Mass Ruler for TurboDDS data
In both the Chromatogram and Spectrum Panes - TurboDDS Preferences
TurboDDS Time Range
Use the TurboDDS Time Range option to select the time range over which the MS2 scans are listed and the survey scan spectra are averaged. This is useful when more than one peak in a segment has the same trigger ion mass. Only the scans in the specified time range are used. From the Chromatogram Toolbar, click the Set Click and Drag icon, and select TurboDDS Time Range.
Click the desired start point and drag the cursor to the desired end time.
In the following example, the spectrum is the average of the scans between the Start Time Range marker (0.087 min) and the End Time Range marker (0.349 min).

188
To Remove TurboDDS Time Range, right-click the chromatograph background and click Clear start time to end time Turbo DDS Time Range.
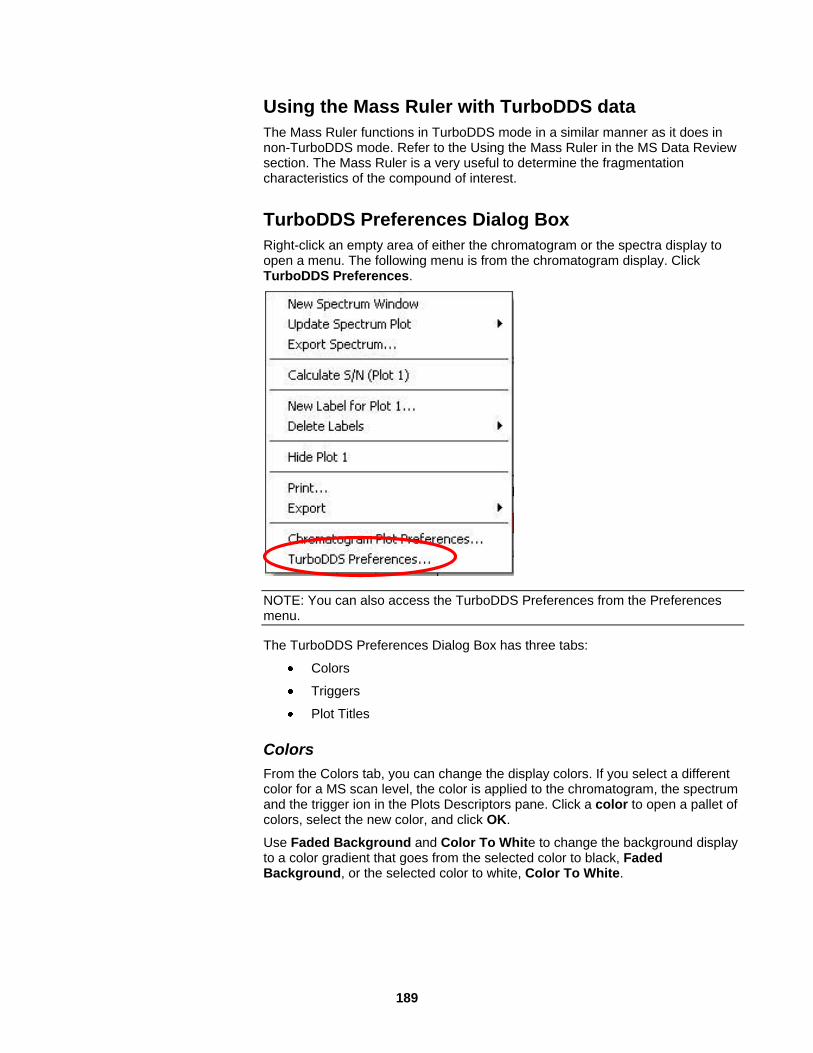
189
Using the Mass Ruler with TurboDDS data
The Mass Ruler functions in TurboDDS mode in a similar manner as it does in non-TurboDDS mode. Refer to the Using the Mass Ruler in the MS Data Review section. The Mass Ruler is a very useful to determine the fragmentation characteristics of the compound of interest.
TurboDDS Preferences Dialog Box
Right-click an empty area of either the chromatogram or the spectra display to open a menu. The following menu is from the chromatogram display. Click TurboDDS Preferences.
NOTE: You can also access the TurboDDS Preferences from the Preferences menu.
The TurboDDS Preferences Dialog Box has three tabs:
Colors
Triggers
Plot Titles
Colors
From the Colors tab, you can change the display colors. If you select a different color for a MS scan level, the color is applied to the chromatogram, the spectrum and the trigger ion in the Plots Descriptors pane. Click a color to open a pallet of colors, select the new color, and click OK.
Use Faded Background and Color To White to change the background display to a color gradient that goes from the selected color to black, Faded Background, or the selected color to white, Color To White.

190

191
Triggers
Click the Show Arrows check box to display the arrows.
Enter the minimum % of the base peak that an ion must have for an arrow to be displayed.
Use the Mass Window to select mass equivalence. For example, if you select 0.50 +/- m/z, then 99.7 and 100.3 are listed as separate ions, if you select 1.0 +/- m/z, then they are reported as a single ion. The range is 0.25 to 1.25 m/z. After you click OK, the Plot Descriptors Display, the Chromatogram and the Spectra are updated.
Click Reset to Defaults to restore the default values, which are: Show Arrows enabled for peaks 10% and above the base peak and a Mass Window of 0.5 +/- m/z.
Click Reset All to Defaults to restore the default values for all three tabs. You do not need to do each individually.

192
Plot Titles
Determine the number of Title Lines to Display on the top right and left of the display and select the fields to be displayed. Plot Titles you select for TurboDDS spectra are independent of the Plot Titles selected for non-TurboDDS spectra.

193
Generation of Standard MS Reports
Overview Standard MS Reports produce reports using the results in data files and the calibration data in methods. As such, data handling results must exist in the specified data file for a report to be generated. Calibration data must exist in the method for a Calibration Block or Curve Report to be generated.
Parameters for standard MS reports are specified in the Data Handling Method under the Standard MS Reports Section. You can specify that these reports are printed after every run is completed. Reports parameters specified in the method are:
Sample reports (results for all compounds found in a sample).
Compound reports (detailed results for each individual Target and non-Target compound for each sample injected).
Calibration Block reports (report for all calibration samples in a run sequence).
Summary reports (summary of results for all samples in a run sequence).
You can look at the reports after the run sequence is completed, using the MS Standard Reports Application, accessed from the Varian Work Station toolbar. In this application, Sample and Compound reports may be customized interactively and then saved as text files, printed or sent to a spooler file.
The calibration block and summary report formats cannot be formatted in the MS Standard Reports Application.
The Calibration block and the Summary reports can be printed, either at the end of an automation sequence or at the end of a recalculation sequence by listing Print Cal and Print Summary Report at the end of a sample list or recalculation list. “Printed Block Report” and “Printed Summary Report” must be checked in the

194
Print Options section of the method.

195
Another way to access the Calibration block and the Summary reports is to convert them to ASCII block reports. The report can then be opened in MS Excel and formatted as desired.
The Standard MS Reports Method Section
NOTE that information about using other reporting applications such as the Custom MS Report Writer is documented in the manuals specific to those applications.
Parameters for Report formatting are specified in the Standard MS Reports section of the data handling method. The Standard MS Reports method section is a post-run processing application and applies to a specific module number. You can create a report method section for each module you generate reports with.
The method defines reports that run under Automation and interactively with the MS Reports application.
The Standard MS Report section contains six editing windows. Each one is described below in the following sections.

196
Print Options Specify desired MS reports to be generated, including some general formatting parameters.
Single Run Reports
Item Description
Printed Sample Report When checked, the Workstation prints the Sample Report during processing in System Control or MS Data Review.
ASCII Sample Report When checked, the Workstation produces an ASCII file of the Sample Report during processing in System Control or MS Data Review.
Title/Header… Buttons When pressed, the Workstation presents a dialog allowing the specification of report title and header information.
Preview Sample/Compound Report
Previews the sample/compound reports for the data file selected on the same page and allows printing and export options.
Printed Compound Reports When checked, the Workstation prints any Compound Reports during processing in System Control or MS Data Review.
Analysis Samples When checked, the Workstation prints Compound Reports for Analysis samples during processing in System Control or MS Data Review.
Verification Samples When checked, the Workstation prints Compound Reports for Verification samples during processing in System Control or MS Data Review.
Calibration Samples When checked, the Workstation prints Compound Reports for Calibration samples during processing in System Control or MS Data Review.
Suppress Printout on Injections
When checked, only prints automated reports for Recalc Print, Print Calib and Print Summary actions. Used to insure that printer error do not interrupt an automated sequence of injections. Refer to Batch Printing for details.

197
Multiple Run (Block) Reports
Item Description
Printed Block Report
Selects whether or not a Calibration Block Report is printed when a Print Calib sample type is used in a SampleList or RecalcList (from System Control or MS Data Review).
ASCII Block Report
When checked, produces a Calibration Block Report in ASCII-file format when a Print Calib sample type is used in a SampleList or RecalcList (from System Control or MS Data Review).
Printed Curve Report
Selects whether or not a Calibration Curve Report is printed when a Print Calib sample type is used in a SampleList or RecalcList (from System Control or MS Data Review).
Print Summary Report
Selects whether or not a Summary Report is printed when a Print Summary sample type is used in a SampleList or RecalcList (from System Control or MS Data Review).
ASCII Summary Report
When checked, produces a Summary Report in ASCII-file format when a Print Summary sample type is used in a SampleList or RecalcList (from System Control or MS Data Review).
Print Control Charts
Selects whether or not Control Charts are printed when a Print Summary sample type is used in a SampleList or RecalcList (from System Control or MS Data Review).
ASCII Control Charts
When checked, produces Control Chart data in ASCII-file format when a Print Summary sample type is used in a SampleList or RecalcList from System Control or MS Data Review).
Other Commands
ITEM DESCRIPTION
ASCII Reports Column Separator
Specifies the ASCII character (or possible sequence) to be used as the field separator for any ASCII report produced.
# Copies to Print
1 to 10
Sets the number of copies of any report to be printed.
# Decimal Digits for Amount
0 to 6
Sets the number of decimal digits for all calculated amount fields in any report printing results.
Defaults Press this button to load all dialog fields with their factory presets (values used when creating a brand new Default.mth).
Restore Press this button to load all dialog fields with their previously saved values, i.e., those that were present the last time the method was saved.
When ASCII options are enabled, the Workstation creates an ASCII file containing the data for each corresponding report. In the case of Sample or Calibration Reports, the files are named based on the Data File name, appended by “-MS”. For Summary Reports, the files are named based on the RecalcList filename. For all reports, the following filename extension assignments are made:
ASCII Field Delimiter Default Filename Extension
Regional settings list separator .csv

198
<TAB> character .txt
<SPACE> character .prn
These files can then be imported into applications such as Excel for additional processing. (For importing into Excel, the *.csv or *.txt formats are recommended)
Sample Reports Title/Header Dialog
The following dialog is available by pressing the Title/Header in the Sample Report group on the Print Options screen. This dialog is also available by clicking on the Sample Report icon in the toolbar.
Item Description
Report Title Title for the report (up to 60 characters).
Header Area Shows how the specified header will look approximately on a printed page.
Element List of fields available to put into the header.
Format Selected list of fields for the header.
Add-> Adds the highlighted items in the Element list to the end of the current Format list.
Insert-> Inserts the highlighted items in the Element list before the first highlighted item of the current Format list.
<-Remove Moves the highlighted items in the Format list back to the current Element list.
Move Up-> Moves the highlighted items in the Format list up one position.
Move Down-> Moves the highlighted items in the Format list down one position.
Clear All Moves all of the items in the Format list back to the current Element list, effectively erasing all the fields from the header.

199
Compound Reports Title/Header Dialog
The following dialog is available by pressing the “Title/Header…” button in the Compound Report group on the Print Options screen:
ITEM DESCRIPTION
Report Title Title for the report (up to 60 characters).
Header Area Shows how the specified header will look approximately on a printed page.
Element List of fields available to put into the header.
Format Selected list of fields for the header.
Add-> Adds the highlighted items in the Element list to the end of the current Format list.
Insert-> Inserts the highlighted items in the Element list before the first highlighted item of the current Format list.
<-Remove Moves the highlighted items in the Format list back to the current Element list.
Move Up-> Moves the highlighted items in the Format list up one position.
Move Down-> Moves the highlighted items in the Format list down one position.
Clear All Moves all of the items in the Format list back to the current Element list, effectively erasing all the fields from the header.
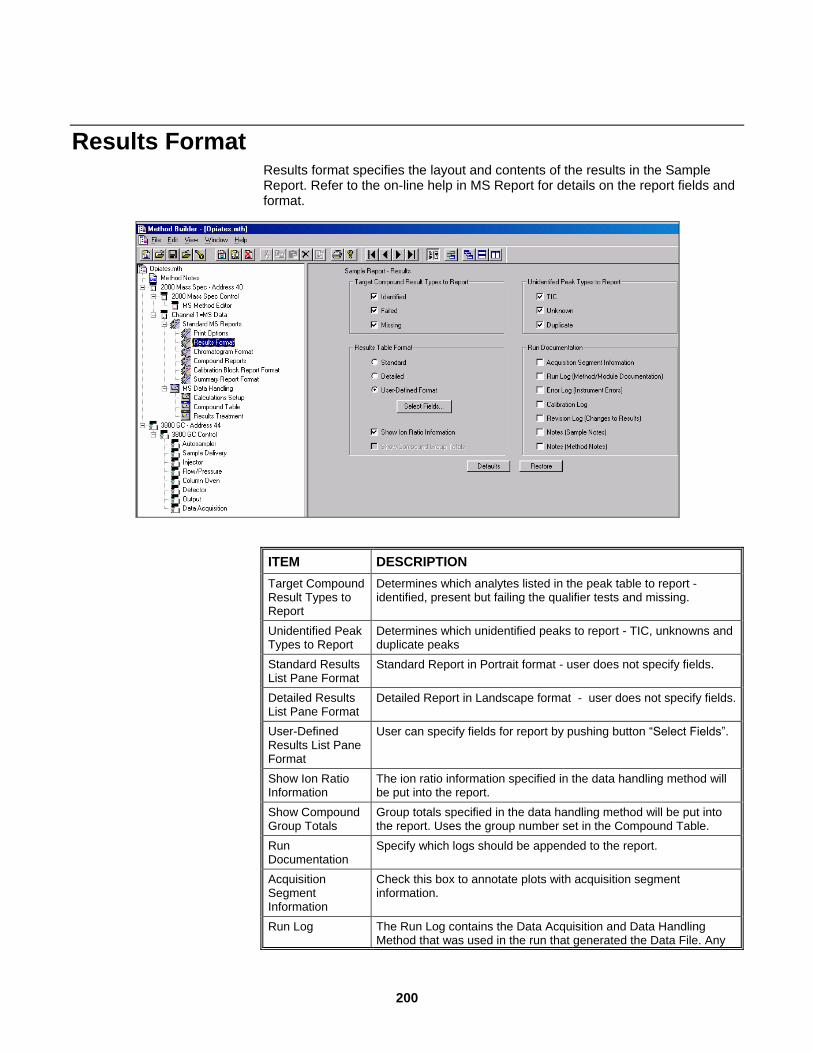
200
Results Format Results format specifies the layout and contents of the results in the Sample Report. Refer to the on-line help in MS Report for details on the report fields and format.
ITEM DESCRIPTION
Target Compound Result Types to Report
Determines which analytes listed in the peak table to report - identified, present but failing the qualifier tests and missing.
Unidentified Peak Types to Report
Determines which unidentified peaks to report - TIC, unknowns and duplicate peaks
Standard Results List Pane Format
Standard Report in Portrait format - user does not specify fields.
Detailed Results List Pane Format
Detailed Report in Landscape format - user does not specify fields.
User-Defined Results List Pane Format
User can specify fields for report by pushing button “Select Fields”.
Show Ion Ratio Information
The ion ratio information specified in the data handling method will be put into the report.
Show Compound Group Totals
Group totals specified in the data handling method will be put into the report. Uses the group number set in the Compound Table.
Run Documentation
Specify which logs should be appended to the report.
Acquisition Segment Information
Check this box to annotate plots with acquisition segment information.
Run Log The Run Log contains the Data Acquisition and Data Handling Method that was used in the run that generated the Data File. Any

201
ITEM DESCRIPTION
changes that occurred during the execution of the Method will be incorporated into the Run Log.
Error Log The Error Log is a list of errors that occurred during the run that generated the Data File.
Calibration Log The Calibration Log is included in the report if the Calibration Log checkbox is checked in the Results Format portion of the Report section of the Method. The Calibration Log is the list of data files used to create the calibration curves.
Revision Log The Revision Log contains the date/time and Method name used every time a recalculation is performed on the Data File. Results deletion is also documented in the Revision Log. Documentation of recalculations can be disabled from the Security Administration application.
Sample Notes The Sample Notes are the notes set in the SampleList in System Control when the injection was performed that generated the Data File.
Method Notes The Method Notes are the notes set in the SampleLog (in System Control) or in the Reintegration List (in Interactive Graphics) during the most recent recalculation performed on the Data File.
Sample Report User-Defined Format Fields
The following dialog is available from clicking Select Field on the Sample Report screen. Refer to the MS reports documentation for specific field definitions.
ITEM DESCRIPTION
Portrait/Landscape Mode
Pick the print orientation that will be used to produce the sample report.
Choose From Use the list box provided to pick new fields to be added to the current configuration.
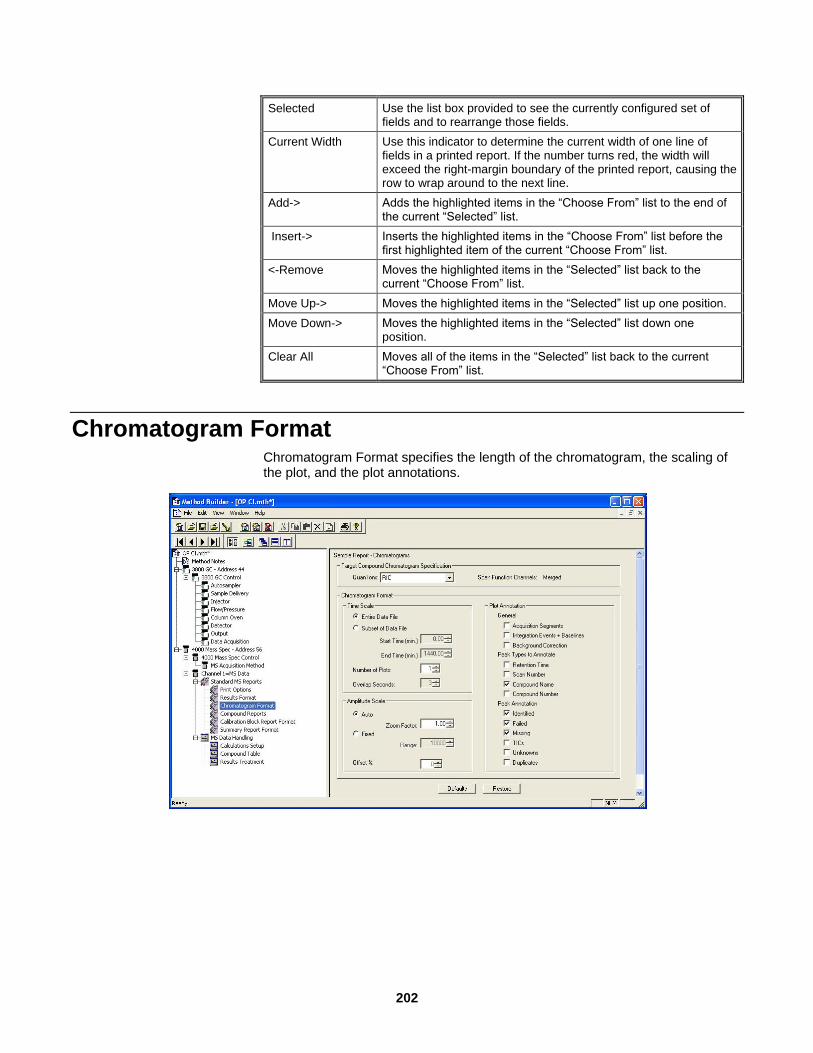
202
Selected Use the list box provided to see the currently configured set of fields and to rearrange those fields.
Current Width Use this indicator to determine the current width of one line of fields in a printed report. If the number turns red, the width will exceed the right-margin boundary of the printed report, causing the row to wrap around to the next line.
Add-> Adds the highlighted items in the “Choose From” list to the end of the current “Selected” list.
Insert-> Inserts the highlighted items in the “Choose From” list before the first highlighted item of the current “Choose From” list.
<-Remove Moves the highlighted items in the “Selected” list back to the current “Choose From” list.
Move Up-> Moves the highlighted items in the “Selected” list up one position.
Move Down-> Moves the highlighted items in the “Selected” list down one position.
Clear All Moves all of the items in the “Selected” list back to the current “Choose From” list.
Chromatogram Format Chromatogram Format specifies the length of the chromatogram, the scaling of the plot, and the plot annotations.

203

204
ITEM DESCRIPTION
Target Compound Chromatogram Specification
Plot the RIC or selected ions
Scan Function Channels
Allows selected scan channels to be shown in the report
Entire Data File Pick this item to use the entire data file as the chromatogram time scale.
Subset of Data File
Check Pick this item to use just a subset of the data file as the chromatogram time scale.
Start Time (minutes)
0.00 to 1440.00. Specifies a start time after injection for the chromatogram display and printout.
End Time (minutes)
0.01 to 1440.00. Specifies an end time for the chromatogram display and printout. If the End Time is greater than the actual end time in the data file, then the actual end time is used.
Number of Plots 1 to 10. Sets the number of pages used to print a chromatogram.
Overlap Seconds Use this field to define the overlap of more than one chromatogram displayed on the same page.
Amplitude Scale Determines the type of scaling to use for the plot: Auto or Fixed.
Auto Amplitude Scale Type
Adjusts the attenuation and the zero offset so that the chromatogram fills the screen or page. Fits the high and low amplitudes to the page.
Zoom Factor 0.01 to 1000.00. Zoom factor for auto scale type.
Fixed Amplitude Scale Type
Sets the magnification of the amplitude axis. 100,000 displays the maximum detector range, 1 displays the highest magnification. Also sets the offset of the baseline as a percentage of the full page.
Range 10 to 1,000,000. Range for fixed scale type.
Amplitude Scale Offset %
-10% to 100%. Sets the zero point of the displayed or printed chromatogram as a percentage of the full page.
Plot Annotations Select the annotations for the plot.
Peak Annotations Select the annotations for the peaks. Integration time events include peak start, end and apex.
Peak Types to Annotate
Select which types of peaks to annotate on a plot.

205
Compound Reports Compound format specifies the layout and contents of the compound report. Refer to the on-line help in MS Report for details on compound report fields and format.
ITEM DESCRIPTION
Target Compounds Results/ Text
Types to report, Standard, Detailed, Ion Ratios or User-Defined Format. Click on Select Fields to specify User-Defined Format.
Acq. Segment Info.
The Acquisition Segment Information is included in the report if the Acq. Segment Info. checkbox is checked.
Target Plots Up to six target plots may be selected. Use the combo boxes provided to specify the desired plots and their positions.
Unidentified Peaks Results/Text
Types to report, Standard or User-Defined Format. Click on Select Fields for User-Defined Format. Check Acq. Segment Info. to include acquisition segment information with the unidentified peak report.
Library Searched Plots
Up to six TIC plots may be selected. Use the combo boxes provided to specify the desired plots and their positions.
Plots Not Library Searched
Up to six plots of “compounds not library searched” may be selected. Use the combo boxes provided to specify the desired plots and their positions.

206
Compound Report User-Defined Format Fields
The following dialog is available from pressing the “Select Fields…” button on the Compound Report screen. Refer to the MS Reports documentation for specific field definitions.
ITEM DESCRIPTION
Portrait/Landscape Mode
These controls are disabled since Compound reports are always in portrait orientation.
Choose From Use the list box provided to pick new fields to be added to the current configuration.
Selected Use the list box provided to see the currently configured set of fields and to rearrange those fields.
Add-> Adds the highlighted items in the “Choose From” list to the end of the current “Selected” list.
Insert-> Inserts the highlighted items in the “Choose From” list before the first highlighted item of the current “Selected” list.
<-Remove Moves the highlighted items in the “Selected” list back to the current “Choose From” list.
Move Up-> Moves the highlighted items in the “Selected” list up one position.
Move Down-> Moves the highlighted items in the “Selected” list down one position.
Clear All Moves all of the items in the “Selected” list back to the current “Choose From” list.

207
Calibration Block Report Format These options affect the Calibration Block Report generated when a Print Calib entry is added to a SampleList or RecalcList in System Control.
ITEM DESCRIPTION
Calibration Block Report
Pick the Standard or the Detailed Format. Enter a block report title of up to 40 characters.
Calibration Curve Report
Adjust the # Curves Per Page field to get the desired number of calibration curves to fit on one printed page. The curves can be in linear or log/log format. Check the Show Outliers on Curve box to allow those calibration points flagged as outliers to be printed on the curve report. Enter a curve report title of up to 40 characters.
Calibration Block Report Content Descriptions
The following table entries describe the contents of the Calibration Block and Calibration Curve Reports produced:
Report Header
ITEM DESCRIPTION
Title Set in the Calibration Block Report portion of the Standard MS Reports section of the method. It appears at the top-center of the first page of the printed report, and in the first field of the first line of the ASCII report.
Recalc Method The file name of the Data Handling Method used to generate the current results. This may differ from the Method used when the data was first generated.
SampleList The name of the sample-injection list file used by System Control to

208
gather the original data.
SequenceList The name of the Sequence List file used (if any) by System Control to acquire the original data file.
Workstation Name The name of the Workstation Software that generated the report.
Peak Measurement
Set in the Calculations Setup window in the Data Handling Method section. Either Peak Area or Peak Height.
Last Calibration Date
The date and time of the last injection.
Composed Table updated
The date and time the results in this file were last recalculated.
Detector The type of detector on which data was acquired
Workstation Version
The version of the Workstation Software that generated the report.
Calibration Type Set in the Calculations Setup window in the Data Handling Method section. Either Percent, Internal Standard or External Standard.
Detail Data
Item Description
Data File List The Standard Report will include a list of all of the files (and their names, dates, indices, and calibration levels) that make up the calibration.
Compound Detail Rows
Following the Data File List of the Standard Report is a list of all of the compounds and their associated RF‟s (or RRF‟s) for each calibration level. Each row includes:
Compound Number
Compound Name
Correlation Coefficient
Average (Relative) Response Factor
(Relative) Standard Deviation
(Relative) Response Factors 1 through 10
Detailed Report Section
The Detailed Report includes a list of all of the Compounds and their Calibration Equation information, followed by a legend for the codes used to identify curve fitting, origin points, and regression weights. This is followed by another list of the compounds with detailed response data for each calibration level.

209
Summary Report Format These options affect the Summary Report and Control Charts generated when a Print Summary entry is added to a RecalcList in System Control.
Report results are collated and summarized for all records existing between the current and the previous Print Summary entry in, or the beginning of the RecalcList.
Common Options
ITEM DESCRIPTION
Include Run Types Click on the boxes next to the run types to be included in the summary report.
Sort By Use the list boxes provided to pick appropriate fields as summary record sort keys.
Number of Sample ID Chars to Sort on
Specifies the number of significant characters of the Sample ID to be used during a sort. Valid only when the Sample ID field is used as a sort key.
Group By Pick the key field to be used as the summarization group.
Summary Report Options
ITEM DESCRIPTION
Summary Report Title
Type in the title of the summary report (up to 40 characters).
Summarize Check the boxes to include summarizations of the relevant fields.

210
Control Chart Options
ITEM DESCRIPTION
Control Chart Title Type in the title of the control-chart report (up to 40 characters).
Chart Pick the summary field to be used as the dependent variable (y-axis) on all control charts.
Control Limits Pick the dependent-variable scale limits to be used in producing control charts. These limits are based on the average value of the dependent variable picked in the Chart group. Values for the percentage scale range from 1% to 100%.
Number of Plots/Page
Specify the number of plots that will fit on a printed page. Values are in the set {1, 2, 3, 4, 6, 8, 10, 12}.
Summary Report Content Descriptions
The following table entries describe the contents of the Summary Report produced:
Summary Report Header
ITEM DESCRIPTION
Title Set in the Summary Report portion of the Standard MS Reports section of the method. It appears at the top-center of every page of the printed report, and in the first field of the first line of the ASCII report.
File Name The name of the SampleList or RecalcList file which executed the Print Summary action.
Sorting Information
The keys, in order of precedence, used to sort the summary report records, and the grouping used.
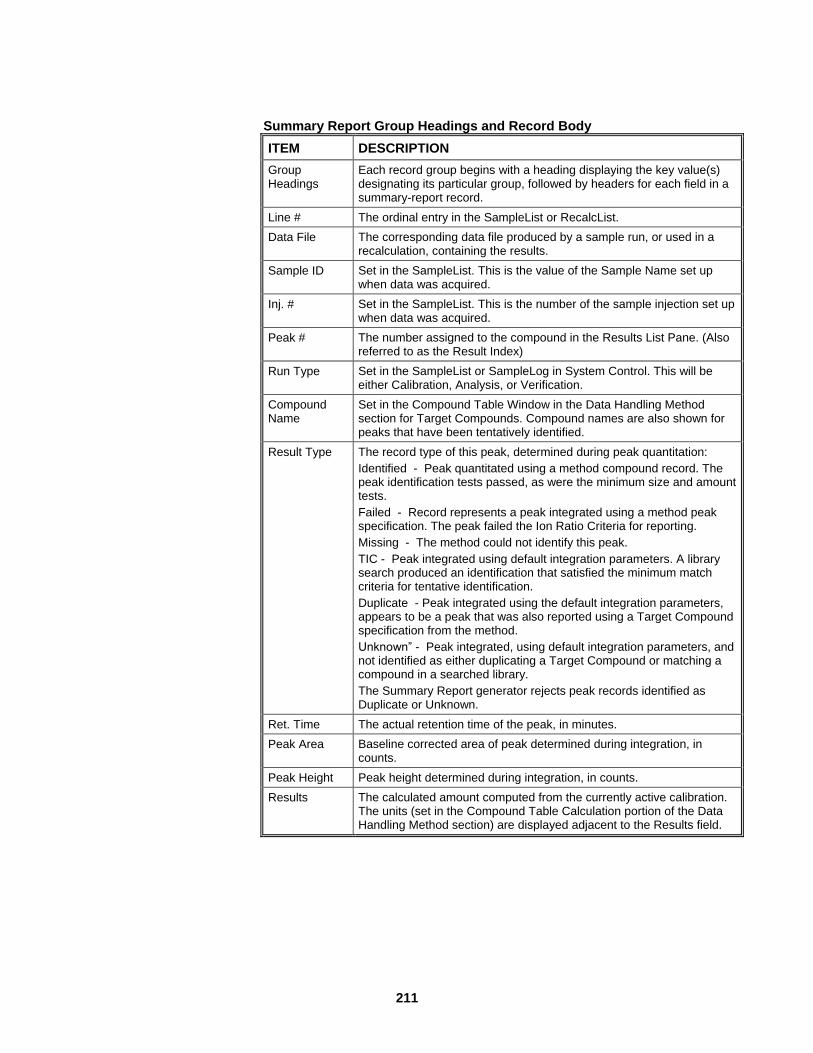
211
Summary Report Group Headings and Record Body
ITEM DESCRIPTION
Group Headings
Each record group begins with a heading displaying the key value(s) designating its particular group, followed by headers for each field in a summary-report record.
Line # The ordinal entry in the SampleList or RecalcList.
Data File The corresponding data file produced by a sample run, or used in a recalculation, containing the results.
Sample ID Set in the SampleList. This is the value of the Sample Name set up when data was acquired.
Inj. # Set in the SampleList. This is the number of the sample injection set up when data was acquired.
Peak # The number assigned to the compound in the Results List Pane. (Also referred to as the Result Index)
Run Type Set in the SampleList or SampleLog in System Control. This will be either Calibration, Analysis, or Verification.
Compound Name
Set in the Compound Table Window in the Data Handling Method section for Target Compounds. Compound names are also shown for peaks that have been tentatively identified.
Result Type The record type of this peak, determined during peak quantitation:
Identified - Peak quantitated using a method compound record. The peak identification tests passed, as were the minimum size and amount tests.
Failed - Record represents a peak integrated using a method peak specification. The peak failed the Ion Ratio Criteria for reporting.
Missing - The method could not identify this peak.
TIC - Peak integrated using default integration parameters. A library search produced an identification that satisfied the minimum match criteria for tentative identification.
Duplicate - Peak integrated using the default integration parameters, appears to be a peak that was also reported using a Target Compound specification from the method.
Unknown” - Peak integrated, using default integration parameters, and not identified as either duplicating a Target Compound or matching a compound in a searched library.
The Summary Report generator rejects peak records identified as Duplicate or Unknown.
Ret. Time The actual retention time of the peak, in minutes.
Peak Area Baseline corrected area of peak determined during integration, in counts.
Peak Height Peak height determined during integration, in counts.
Results The calculated amount computed from the currently active calibration. The units (set in the Compound Table Calculation portion of the Data Handling Method section) are displayed adjacent to the Results field.

212
ITEM DESCRIPTION
Status Code(s) are specific to a peak in the Results List Pane.
X If one of the following codes indicates an error, an “X” precedes the rest of them.
R Reference Peak
# Factors not updated
* Negative or imaginary result. Check calibration curve
+ More than one result, Check your calibration curve or use a lower order curve fit (specified in the Compound Table).
V Peak fails verification (verification runs only)
M Missing peak (if Report Missing Peaks is set in the Integration Parameters Window in the Data Handling section of the Method)
C Result out of calibration or tolerance range, check the calibration curve and the range tolerance setting in the Method.
S Internal Standard Peak (Designated in the Compound table for internal standard and normalized percent calculations only)
U User-defined peak endpoint (the peak size is affected by an endpoint that was manually placed by the user).
O Saturated Peak Amplitude.
T Relative Retention Time peak.
D Cannot quantitate Raw peak size reported.
I Cannot create Chromatogram. Check channels, time range and other parameters.
L Missing Libraries or Search Failed.
N No internal standards found for quantitating Unknowns.
Q Result is less than the Compound Report Threshold.
H Calibration levels too low. Raw peak size reported.
W Match is less than Threshold, not in Peak, or Peak is not in the Search window.
Y Peak not detected, less than size threshold, or not in the Search window.
Z Ion Ration failed. Check qualifier parameters
F Missing 1 or more sf channels. Quantitating available channels.
a S/N less than threshold
b RRT out of tolerance
Group Summary Information
ITEM DESCRIPTION
Average The group averages of each summarized parameter specified in the method.
Std. Deviation The standard deviations for the group of each summarized parameter specified in the method.
Rel. Std. Deviation
The standard deviations as a percentage of each of the group averages of the summarized parameters.

213
Standard MS Reports Application
Overview
Open the Standard MS Reports Application by clicking the icon
on the Varian WorkStation Toolbar. Standard MS Reports produces the “Single Run” reports for the specified data file. This application is interactive, reports may be viewed and modified and then the modified report can be generated.
When the Standard MS Reports application is used, the user is prompted to select a data file to use when generating the reports. If the data file contains a report method, that report method is used to generate the reports. If the data file does not contain a report method, the user is prompted to select a report method. The report method used to generate the report is saved in the data file. The user may edit the report method and regenerate the reports. The changed report method may optionally be saved in the data file.
The Standard MS Reports application shows either the Sample report or the Compound report. You can switch from one to the other. The report is displayed one page at a time and the user may navigate forward or backward through the report pages. The currently displayed report may be printed to the printer or to the spooler file.
In this section, the menu and toolbar are described; the next section has a detailed explanation of parameters that can be specified.

214
Menu and Toolbar A compound report with the menu and toolbar is shown below. The following sections explain the functions of the menu items and the toolbar icons.
Menu Items
The table lists the menu items and descriptions.
FILE DESCRIPTION
Open Displays the Select Plot dialog.
Import MS Report Method from
This command has two types of importation: from Data File and from Methods File. The Import MS Report Method from Data File displays the Select Control MS Data File dialog. The Import MS Report Method from Methods File displays the Select MS Reports Method dialog. From these boxes, you can choose the file to be imported.
Export MS Report Method
Displays the Select MS Reports Method dialog. From this box, you can choose the file to be exported.
Print Displays the Print Report dialog.
Printer Setup Displays the Print Setup dialog.
Convert (ASCII) Converts the text results report into an ASCII file. The name of the ASCII file is based on the data file name, with a “-MS” suffix applied to the base name of the data file. The extension of the ASCII file depends on the selection of field delimiter as specified in the report method. If the selection is “Use Regional Settings”, the extension will be “.csv”. If the selection is “Use Tab Character”, the extension will be “.txt”. If the selection is “Use Space Character”, the extension will be “.prn”.
Use Spooler File Toggles the standard MS Data Review Spooler File print option.
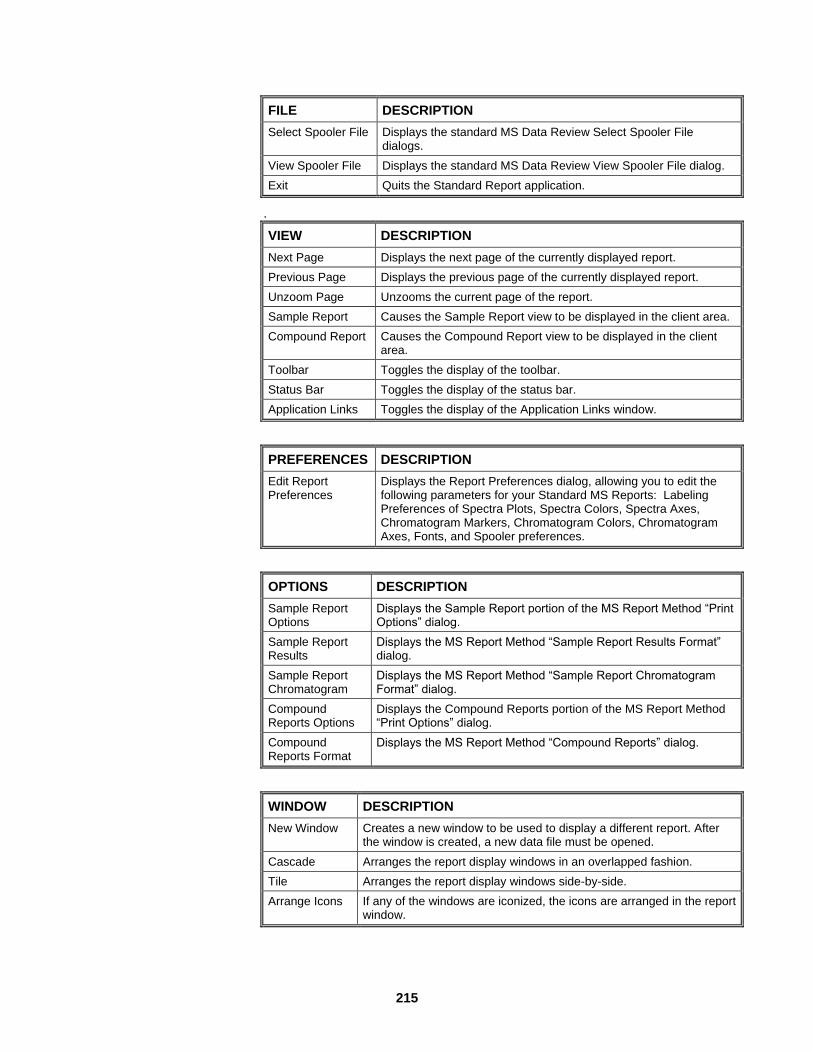
215
FILE DESCRIPTION
Select Spooler File Displays the standard MS Data Review Select Spooler File dialogs.
View Spooler File Displays the standard MS Data Review View Spooler File dialog.
Exit Quits the Standard Report application.
.
VIEW DESCRIPTION
Next Page Displays the next page of the currently displayed report.
Previous Page Displays the previous page of the currently displayed report.
Unzoom Page Unzooms the current page of the report.
Sample Report Causes the Sample Report view to be displayed in the client area.
Compound Report Causes the Compound Report view to be displayed in the client area.
Toolbar Toggles the display of the toolbar.
Status Bar Toggles the display of the status bar.
Application Links Toggles the display of the Application Links window.
PREFERENCES DESCRIPTION
Edit Report Preferences
Displays the Report Preferences dialog, allowing you to edit the following parameters for your Standard MS Reports: Labeling Preferences of Spectra Plots, Spectra Colors, Spectra Axes, Chromatogram Markers, Chromatogram Colors, Chromatogram Axes, Fonts, and Spooler preferences.
OPTIONS DESCRIPTION
Sample Report Options
Displays the Sample Report portion of the MS Report Method “Print Options” dialog.
Sample Report Results
Displays the MS Report Method “Sample Report Results Format” dialog.
Sample Report Chromatogram
Displays the MS Report Method “Sample Report Chromatogram Format” dialog.
Compound Reports Options
Displays the Compound Reports portion of the MS Report Method “Print Options” dialog.
Compound Reports Format
Displays the MS Report Method “Compound Reports” dialog.
WINDOW DESCRIPTION
New Window Creates a new window to be used to display a different report. After the window is created, a new data file must be opened.
Cascade Arranges the report display windows in an overlapped fashion.
Tile Arranges the report display windows side-by-side.
Arrange Icons If any of the windows are iconized, the icons are arranged in the report window.

216
HELP DESCRIPTION
Help Topics Displays the help you are now viewing.
Product Support Web Site
If you have Internet access and a web browser installed on your computer, this option will automatically open the MS Workstation Product Support Web Site. Here you will find the latest software and documentation updates for the MS Workstation suite of products, along with additional notes, tips, and answers to frequently asked questions.
You may wish to visit this site periodically to see if new information is available that may be pertinent to you.
About MS Report
Displays the About Box for the Standard Report application. The About Box contains information about the software version, installation information, and a list of the instrument control modules that you have installed.
Standard MS Reports Toolbar
Open the Standard MS Reports application by clicking on the icon in the Varian Work Station toolbar. The application opens with the toolbar below:
Opens a report for a new data file
Prints specified pages and number of copies
Select printer and observe status of printer
Converts the report to an ASCII file and allows user to choose where to save the new file
Go to previous page of report.
Go to next page of report.
Displays the Sample Report view. Shows chromatogram and results.
Displays the Compound Report view. Shows peak and three spectra for each Target compound. The spectra are the background corrected spectrum, the reference and the raw spectrum.
Allows selection of colors, fonts, formatting of axes, orientation of report, use of spooler file.
Displays the Header Editor dialog for editing Sample Report Print options. User selects a title for the sample report and what information to include in the header.

217
Displays the Sample Report Results Format dialog. Allows user to specify which Target Compounds and Unidentified Compounds are to be included in the sample report, optional ion report information and optional choice of Run Documentation Parameters.
Displays the Sample Report Chromatogram Format dialog. User specifies scale and annotations in the chromatogram.
Displays the Header Editor dialog for editing Custom Report Print options. User selects a title for the compound report and what information to include in the header.
Displays the Compound Reports Format dialog. User chooses which Target Compounds and Unidentified Compounds are to be included in the compound report plus options on plots for Target Compounds, Library Searched plots and Plots that were not library searched.
Help button
The Data File Quick Link button shows the current Data File. Use this Quick Link button to perform additional operations on the Data File.
The Method Quick Link button shows the Method used for the most recent recalculation for the data file. Use this Quick Link button to view, edit or print this Method.

218
Standard MS Reports Format Descriptions
Overview Sample Reports and Compound Reports can contain four sections:
1. Report Header
2. Graphics, including chromatogram and/or spectrum plots
3. Results, including Target Results and Unknowns
4. Run Documentation
The report method specifies which reports to generate, which sections they contain, and the content and format of each section. This allows generation of exactly the reports needed. Report contents also are affected by specifications in the SampleList and the Data handling Method that determine what calculations are done and what results are stored in the data files.
An example of typical Sample and Compound Reports are shown below, and all of the user-specifiable fields for the Header and Results sections are described in detail. The header fields are specified separately for Sample Reports vs. Compound Reports, but the list of selectable fields is identical
The formats of the corresponding ASCII text files are similar to the formats of the printed reports.
Sample Report
Standard Sample Report
The next page shows a standard sample report. The sample was urine
containing three target compounds, codeine, morphine and a heroin metabolite
6-MAM. The corresponding deuterated internal standards were also present.
Several other target compounds were not present. For each compound, there
was a quantitation ion and two qualifier ions and these are listed in the report.
A standard compound report is shown for the same sample. Compare it with
custom reports for the same samples.

219

220
Report Header Fields
The contents and format of the Sample Report header are specified from a single set of user-selectable fields. All Sample Reports generate the same header from this specification.
ITEM DESCRIPTION
Acquisition Date Time and date that the data file was acquired.
Calculation Date Time and date that the data file was last processed by data handling.
Calibration Type Percent, Internal Standard or External Standard. Set in the Calculations Setup window in the Data Handling Method section.
Data File The file name of the Data File containing the results. Generated from the Sample Name field in the SampleList.
Divisor The result for each peak is divided by this value. Used when processing Unknown Peaks, and Target Compounds if Sample Type Analysis or verification. Set in the Sample or RecalcList.
Duplicate Peaks The total number of Unknown Peaks tentatively matched to a corresponding Target Compound by retention time.
Failed Compounds The total number of Target Compounds which were identified, but which failed 1 or more Qualifier Ion specifications.
Header Time Date The time and date when the report was generated.
Identified Compounds The total number of Target Compounds that were found.
Injection The injection number of the sample that the data file was acquired from. Set in the Sample or RecalcList.
Instrument ID The ID of the Instrument used to acquire the data file. Set in the System Control Instrument Parameters dialog.
IS Factor Internal Std amounts specified in the Data Handling Method section are multiplied by this value when processing an Analysis sample. Set in the Sample or RecalcList, where it is identified as “Amount Std”.
Last Calibration Time and date that the calibration data used to calculate the calibration curves were last updated by data handling.
Level Calibration level of the Calibration or Verification sample that the data file was acquired from. Set in the Sample or RecalcList.
Measurement Type Results will be calculated based on either Area or Height integration. Set in the Calculations Setup window in the Data Handling Method section.
Method The file name of the Method used to generate the current results. This may differ from the Method used when the data was first acquired.
Missing Compounds The total number of Target Compounds that were not found.
Multiplier The result for each peak is multiplied by this value. Used when processing Unknown Peaks, and Target Compounds if Sample Type Analysis or Verification. Set in the SampleList or RecalcList.
Operator This is the value of the Operator Name when the data was acquired. Set in the System Control Instrument Parameters dialog.
Rack The rack number of the sample that the data file was acquired from. Set in the Autosampler section of the Sample or RecalcList.
Report Missing Whether or not Missing Compounds were reported. Set in the Calculations Setup window in the Data Handling Method section.
Report Unidentified Whether or not Unknown Peaks were processed and reported. Set in the Calculations Setup window in the Data Handling Method section.
Sample Type Calibration, Analysis, or Verification. Set in the Sample or RecalcList.
TIC Peaks The total number of Unknown Peaks reported as Tentatively Identified Compounds.

221
ITEM DESCRIPTION
Unknown Peaks The total number of Unknown Peaks not marked as Duplicate or TIC Peaks.
Vial The vial number of the sample that the data file was acquired from. Set in the Autosampler section of the Sample or RecalcList.
Volume The injection volume of the sample that the data file was acquired from. Set in the Autosampler section of the Sample or RecalcList.
Report Results Fields
The user can select one of the following Sample Report Results formats: Standard, Detailed, or User-Defined. The user-defined format is specified from a single set of user-selectable fields for both Target Compounds and Unknown Peaks, since both are present in a single report. However, only a sub-set of these fields are actually reported for each. The definitions given below explain whether each field is reported for one or the other or both types of results.
ITEM DESCRIPTION
1st Match Library
Entry Number The entry number of the first match in the searched library that contains it.
Reported for Unknown Peaks only.
1st Match Library
Name The name of the searched library that contains the first match.
Reported for Unknown Peaks only.
2nd
Match Library Entry Number
The entry number of the second match in the searched library that contains it.
Reported for Unknown Peaks only.
2nd
Match Library Name
The name of the searched library that contains the second match.
Reported for Unknown Peaks only.
3rd
Match Library Entry Number
The entry number of the third match in the searched library that contains it.
Reported for Unknown Peaks only.
3rd
Match Library Name
The name of the searched library that contains the third match.
Reported for Unknown Peaks only.
Amount The calculated result. The value and units depend upon whether it is calculated for a Target Compound or an Unknown Peak, and also on the value of the Sample Type, the Calibration Type, and RF To Use.
Target Compounds
Analysis or Verification: Calculated from calibration equation; units set on Compound Table Calculations page
Calibration, IS: Relative Response Factor; no units
Calibration, ES: Response Factor; no units
No Calibration Data: Calculated from integrated area or height; units are “Counts”
Unknown Peaks
Use Nearest IS RF: Calculated from RF of nearest internal std; units are those specified for the internal std
Use Absolute RF: Calculated from RF set in the Calculations Setup Dialog; units are “Counts”
%: % of total
** Selecting Amount in Target Compound -Compound Reports automatically includes Amount Reject.
Amount Reject Target Compounds whose calculated results are less than this amount will not be reported, if Sample Type = Analysis or Verification.
Set on the Compound Table Calculations page.
Amount Units The units of the calculated result.

222
ITEM DESCRIPTION
Set on the Compound Table Integration page.
Area The baseline-corrected area of the integrated peak, in counts.
** Selecting Area in Target Compound - Compound Reports automatically includes Area Reject if Measurement Type = Area
Baseline Code A two letter code indicating the relationship of the peak start and end to the baseline. Possible baseline codes are:
BV: Baseline to valley
BB: Baseline to baseline
VB: Valley to baseline
VV: Valley to valley
TS: Separated Tangent Peaks
TF: Fused tangent peaks
GR: Group Peak
BM: Baseline to mended end
MB: Mended end to baseline
MM: Mended end to mended end
MV: Mended end to valley
VM: Valley to mended end
Baseline Type Peak baselines are drawn based on this specification. Possible values are Normal, Valley Baseline, Horizontal Forward, Horizontal Backward and Horizontal Minimum.
Target Compounds: Set on the Compound Table Integration page.
Unknown Peaks: Any baseline types used for Unknown Peaks are reported in the Run Log. Set in the Time Events Table dialog.
Calculation Date Time and date that the data file was last processed by data handling.
Cali Curve Calculation
Target Compound calibration curves are calculated based on this specification.
Curve Fit Type: Linear, Quadratic, Cubic
Origin Point: Ignore, Include, Force
Regression Weighting: None, 1/n, 1/x, 1/nx, 1/x2, 1/nx2
Set on the Compound Table Calculations page.
Calibration Date Time and date that the calibration data used to calculate the Target Compound calibration curves were last updated by data handling.
Calibration Equation The Target Compound calibration curve that was calculated from the Cali Curve Calculation as described above.
CAS Number Chemical Abstracts number for this peak.
Target Compounds: Set on the Compound Table Attributes page.
Unknown Peaks: For an Unknown Peak that is tentatively identified by a library search, it is obtained from the library Match information.
Channels The Scan Function Channel specification used to generate the data processing chromatogram. If multiple channels are specified, they will be Merged.
Target Compounds: Set on the Compound Table Quan Ions page.
Unknown Peaks: Set in the Calculations Setup dialog.
Compound Number
The number from the Compound Table for the Target Compound in the report.
Correlation Coefficient
Target Compound Correlation Coefficient or Coefficient of Determination computed during calibration.
Error One or more single-character codes which identify errors that occurred during data processing. Possible error codes are:
*: No result can be calculated; check the calibration curve.
+: More than one result can be calculated; check the calibration curve.

223
ITEM DESCRIPTION
V: Peak fails verification (verification runs only)
M: Missing peak (an error only if the Missing compound is an internal std.)
C: Result out of calibration range; check the calibration curve and the range tolerance setting in the Method.
D: Cannot calibrate - Default to raw peak size.
I: Invalid scan function channel specification, or cannot generate a valid quantitation chromatogram
L: Missing one or more Libraries specified to search Unknown Peaks.
The error codes also are contained in Status as described below, along with additional non-error codes.
Expected RT The Target Compound expected retention time. It will be updated automatically if Sample Type = Calibration and Update Compound Table RT is checked in the Results Treatment dialog.
Set on the Compound Table Attributes page.
Forward Match A measure of to what degree the background corrected target spectrum is contained in the spectrum it is being compared to.
Target Compounds: The Reference Spectrum (target spectrum; set on the Compound Table Spectrum page) is compared to each scan in the Target Compound chromatogram if Search Type = Spectrum. The result for the Best-Fit spectrum is reported. Target Compound Spectrum Match results always use Fit.
Unknown Peaks: The peak apex scan (target spectrum) is searched for in the specified library(ies). Up to the top 3 matches can be reported. Unknown Peak Match results are ranked by the specified Match Type. All search parameters are set in the Library Search Parameters dialog.
** Selecting Fit in Target Compound- or Unknown Peak- Compound Reports automatically includes Match Threshold if Match Type = Fit.
Group Name Target Compounds for which a Group Name has been specified can have a summed total reported for the entire group, in addition to the individual results for each compound. Set on the Compound Table Attributes page.
Height The baseline-corrected height of the integrated peak, in counts.
** Selecting Height in Target Compound - Compound Reports automatically includes Height Reject if Measurement Type = Height
Ionization Time The Ionization time of the peak apex scan, in microseconds.
IS Amount The amount of the internal std in the sample, and is used to calculate the analyte amount. It is the amount set on the Compound Table Calculations page if Sample Type = Calibration. If Sample Type = Analysis or Verification, it is this value multiplied by the ISFactor value set in the Sample or RecalcList.
IS Area The baseline-corrected area of the integrated internal std peak, in counts.
IS Height The baseline-corrected area of the integrated internal std peak, in counts.
IS Peak Name The name of the internal std used to calculate the analyte amount.
IS Retention Time The retention time of the internal std used to calculate the analyte amount.
Match Result The match result for the specified Match Type.
Target Compounds always use Fit.
Unknown Peaks use the Match Type set in the Library Search Parameters dialog.
** Selecting Match Result in Target Compound- or Unknown Peak- Compound Reports automatically includes Match Type and Match Threshold.
Match Threshold Target Compounds: If identification is done by Spectrum Match, the compound will be marked as Missing if the Match Result is less than this value. Set on the Compound Table Identification page.
Unknown Peaks: If Unknown Peaks are library searched, a peak will be marked as “No Match” if the top Match Result is less than this value.

224
ITEM DESCRIPTION
Peak Name For Target Compounds, the name that is set on the Compound Table Attributes page.
For library-searched Unknown Peaks, the name of the first Match. If no match was found, the name will be “No Match”. If no search was done, the name will be “No Search”.
Peak Number The number of the Unknown Peak result, where the number of the first Unknown Peak = 1.
Peak Reject
Height Reject
Area Reject
A peak may be rejected if either the Height or Area are less than the stated value
If Measurement Type = Height, results are not reported for peaks that have heights less than this value.
Target Compounds: Rejected compounds will be marked as Missing. Set on the Compound Table Integration page.
Unknown Peaks: Rejected peaks will not be reported. Specified values are reported in the Run Log. Set in the Integration Parameters and Time Events Table dialogs.
If Measurement Type = Area, results are not reported for peaks that have areas less than this value.
Target Compounds: Rejected compounds will be marked as Missing. Set on the Compound Table Calculations page.
Unknown Peaks: Rejected peaks will not be reported. Specified values are reported in the Run Log. Set in the Integration Parameters and Time Events Table dialogs.
Peak Type A 2 or 3-character code for the Target Compound Type:
blank (Analyte)
SP (Internal Std)
RRT (Relative Retention Time)
Peak Width The measured peak width at ½ height, in seconds.
** Selecting Peak Width in Target Compound - Compound Reports automatically includes Peak Width Specification.
Peak Width Specification
Used by peak processing to detect peaks. Increasing the Peak Width smoothes the data points and favors the detection of small, broad, or poorly-shaped peaks.
Target Compounds: Set on the Compound Table Integration page
Unknown Peaks: Specified values are reported in the Run Log. Set in the Integration Parameters and Time Events Table dialogs.
Quan Ions The Quan Ion specification used to generate the data processing chromatogram.
Target Compounds: Set on the Compound Table Quan Ions page.
Unknown Peaks: Set in the Calculations Setup dialog.
R RT The retention time of the peak relative to that of the specified RRT Compound.
The RRT Compound is set on the Compound Table Attributes page. The Unretained Peak Time is set in the Calculations Setup dialog.
RRT % Deviation The Deviation of the RRT result from the RRT of the corresponding method Retention Time. The RRT Tolerance Range, Result, and Status are displayed.
Result Index The number of the peak result, starting with the first reported Target Compound and numbering consecutively through all Target Compounds and Unknown Peaks.
Result Type The record type of this peak, determined during peak processing.
Target Compounds
“Identified” - The compound was found by the specified Search Type, was detected, passed the specified Area or Height Reject Threshold, and passed any Qualifier Ion specifications.
“Failed” - The compound was found by the specified Search Type, was detected, passed the specified Area or Height Reject Threshold, but failed 1 or more Qualifier Ion specifications.
“Missing” - The compound was not found by the specified Search Type, was not detected, or failed the specified Area or Height Reject Threshold.
Unknown Peaks

225
ITEM DESCRIPTION
“Duplicate” - The peak was detected, passed the specified Area or Height Reject Threshold, and had an RT that was closest to a corresponding Target Compound.
“TIC” - The peak was detected, passed the specified Area or Height Reject Threshold, was library searched and passed the specified Match Threshold, and was not marked as a Duplicate Peak.
“Unknown” - The peak was detected, passed the specified Area or Height Reject Threshold, and was not marked as a TIC or a Duplicate peak.
Retention Time The actual retention time of the peak, in minutes.
** Selecting Retention Time in Target Compound - Compound Reports automatically includes Calibration RT and Retention Time Window.
RT Offset (min) The amount of time, in minutes, that the actual retention time differs from the Target Compound Calibration RT.
RT Window The Target Compound quantitation chromatogram is generated from the Calibration RT ± this time. All data processing is constrained to the data points contained in this chromatogram.
Set on the Compound Table Identification page.
Reverse Window A measure of to what degree the comparison spectrum is contained in the background corrected target spectrum.
Target Compounds: The Reference Spectrum (target spectrum; set on the Compound Table Spectrum page) is compared to each scan in the Target Compound chromatogram if Search Type = Spectrum. The result for the Best-Fit spectrum is reported. Target Compound Spectrum Match results always use Fit.
Unknown Peaks: The peak apex scan (target spectrum) is searched for in the specified library(ies). Up to the top 3 matches can be reported. Unknown Peak Match results are ranked by the specified Match Type. All search parameters are set in the Library Search Parameters dialog.
** Selecting Reverse Fit in Unknown Peak- Compound Reports automatically includes Match Threshold if Match Type = Reverse Fit.
RF Used The Response Factor used when calculating Unknown Peak Results. If RF Used = Nearest Internal Std, it is the RF of the peak in the Unknown Peaks quantitation chromatogram that corresponds to the nearest Target Compound. If RF Used = Absolute Value, it is the RF specified in the Calculations Setup dialog.
S/N Ratio Baseline-corrected peak apex height divided by the median calculated noise in a chromatogram segment ±`25 points around the apex.
S/N Reject The Signal to Noise ratio of the integrated peak relative to a specified threshold. The S/N Threshold, Result, and Status are displayed.
Scan Number The scan number of the peak apex.
Search Type Type of search used to find the peak.
Target Compounds: Spectrum or Retention Time. Set on the Compound Table Identification page.
Unknown Peaks: None or Library Search. Set in the Calculations Setup dialog.
Slope Sensitivity Used by peak processing to detect peaks. Decreasing the Slope Sensitivity favors the detection of small peaks and moves peak start and end points out from the peak apex.
Target Compounds: Set on the Compound Table Integration page
Unknown Peaks: Specified values are reported in the Run Log. Set in the Integration Parameters and Time Events Table dialogs.
Status One or more single-character codes which identify errors that occurred during data processing, or other status information. Possible codes are:
Error Codes
*: No result can be calculated; check the calibration curve.
+: More than one result can be calculated; check the calibration curve.
V: Peak fails verification (verification runs only)
M: Missing peak (an error only if the Missing compound is an internal std.)
C: Result out of calibration range, check the calibration curve and the range tolerance setting in the Method.

226
ITEM DESCRIPTION
D: Cannot calibrate - Default to raw peak size.
I: Invalid scan function channel specification, or cannot generate a valid quantitation chromatogram
L: Missing 1 or more Libraries specified to search Unknown Peaks.
Additional Status Codes
M: Missing Compound(if the Missing compound is not an internal std.).
S: Internal Standard Compound.
U: User-modified peak (peak start or end was moved in Manual Integration).
T: Relative Retention Time Compound.
Tangent Percent Peaks on the trailing edge of a peak will be integrated via a tangent skimming if their heights are < this % of the parent peak. If not, verticals are dropped to baseline from the valleys.
Target Compounds: Set on the Compound Table Integration page.
Unknown Peaks: Specified values are reported in the Run Log. Set in the Integration Parameters and Time Events Table dialogs.
Compound Reports
Standard Compound Report
The next page shows a standard compound report for the target compound codeine. Note that the quantitation ions and each qualifier ion are plotted for the compound and the quantitation ion was plotted for the internal standard. The reference spectrum and the actual spectrum for the analyte were compared.

227

228
Report Header Fields
The contents and format of the Compound Report header are specified separately from the Sample Report Header, but the set of user-selectable fields is identical. Refer to the field definitions listed under Sample Reports. All Compound Reports generate the same header from this specification.
Report Results Fields
The user can select one of the following basic Compound Reports Results formats: Standard, Detailed, Ion Ratios, or User-Defined. The user-defined format is specified separately for Target Compounds vs. Unknown Peaks, since a separate report is generated for each. Additionally, the list of fields that are selectable for each contain only the appropriate subset.
In contrast to Sample Reports, Compound Report result fields often contain the actual value, the value specified in the method, and a Pass/Fail status in the single field designation. Thus, the list of selectable fields for Compound Report results is a sub-set of the fields described for Sample Reports. Refer to the field definitions listed under Sample Reports. These definitions also explain whether each field is reported for results of Target Compounds or for results of Unknown Peaks, or both.
229
Custom MS Reports
Introduction Custom MS Reports formats information from MS Workstation data files into reports that can be printed or previewed. Use Custom MS Reports when reporting requirements are not provided by the Standard MS Reports. Custom MS Reports can be viewed interactively or printed automatically as part of a data acquisition or reprocessing sequence in System Control or when reprocessing in MS Data Review.
Custom MS Reports are implemented through a number of “Template Models.” These template models may be identified by their .MDB file extension. Some of these template models are provided with the core MS Workstation, while others are optional and must be purchased separately. The optional template models are typically, though not always, focused on specific applications such as Environmental, Toxicology, etc.
The “primary” Custom MS Report template model provided with the core MS Workstation, Custrept.mdb, provides a broad spectrum of customizable report formats.
Custrept is designed to produce useful results within minutes for the new user, yet allow enough flexibility to meet the evolving needs of the more experienced investigator.
At the introductory level, Custrept offers several preformatted reports that should cover most routine needs. At the intermediate level, reports can be designed using simple forms to show flexible subsets of data items contained in the quantitated result file. At the advanced level, data is available to Microsoft Office applications for analysis and presentation.
Other template models that come with the core MS Workstation cannot be customized that much and are for specific needs. These include the ToxPro.mdb, MultiCpdBasic.mdb, and SummaryBasic.mdb template models.
All of the Custom MS Reports template models, distributed with the core MS, Workstation are described in more detail in later sections of this document. Contact your Varian Customer Service Representative for information on the optional Custom MS Reports that are available.
NOTE: Custom MS Reports present data already stored in the data file. They do not modify results stored in the data file.
Custom MS Reports are based on Microsoft Access 2000 but do not require that the full version of Access be installed on your computer. Other versions of Microsoft Access (97, XP) are incompatible with Custom Reports and should not be installed.

230
Using Custom MS Reports
Generating Results on Which to Report
Custom MS Reports produce reports using the Data Handling Results within the MS Data File. As such, data handling results must exist in the specified data file for a useful report to be generated.
To generate data handling results, follow these steps:
1. Prepare the MS Data Handling method. Use MS Data Review in conjunction with the Method Editor to prepare an MS Data Handling method for use in integrating and quantitating the MS Data files of interest.
2. Quantitate the MS Data file. In order for an MS Data file to contain integrated peak information, MS Data Review or System Control must have processed the MS Data File using an MS Data Handling method. Changes made to the method only affect reported data file results after the data file has been reprocessed with the changed method. The data file contains copies of the method, including calibration result information, upon which the reported peak quantitation results are based.
Custom report file name limitations
When saving a custom report, such as EnviroPro, to run from the autolink command in system control the report name should not contain any spaces or the entire path should be enclosed in quotes. If the custom report is saved in a separate directory the entire path should be not contain spaces or be enclosed in quotes.
For example: DFTPP_Test.swt
Or
“c:\varianWS\dftpp test.swt”
Setting Up the Custom MS Reports Printer
Custom MS Reports produce reports on the default Windows printer. To select the default printer from the Windows Start Menu, select Settings->Printers. When the Printers folder is displayed, right-click on the desired printer and select the “Set as Default” option to make it the default.
NOTE: The Custom MS Reports do not follow the Workstation System Control flags and parameters. That is, they ignore the Workstation “Enable Automated Printing” flag and will print regardless.
Creating a Custom MS Working Template
A Working Template (.SWT) is the collection of information needed to define the format, layout, or presentation of the information in the report. Different Template Models (.MDB) allow different levels of customization options.
In order to generate a report, a Working Template must be created based on the desired Template Model. The user modifies the Template Model to produce a Working Template that includes the user‟s customizations. Multiple Working

231
Templates, each having different names, may be created from a single Template Model.
To create a Working Template from a Template Model, follow these steps:
1. Open the MS Workstation Toolbar and click on the “Custom MS Reports”
icon .
2. When the pop-up menu is displayed, select the New template… option. If its display has not already been disabled, the following informational dialog is displayed.
3. Click on OK. The following dialog is displayed to allow the selection of the desired Template Model on which to base the customized Working Template.
4. Click on the desired Template Model, CustRept.mdb in the above example, and click on Open. The following dialog is displayed to allow the specification of the Working Template name.
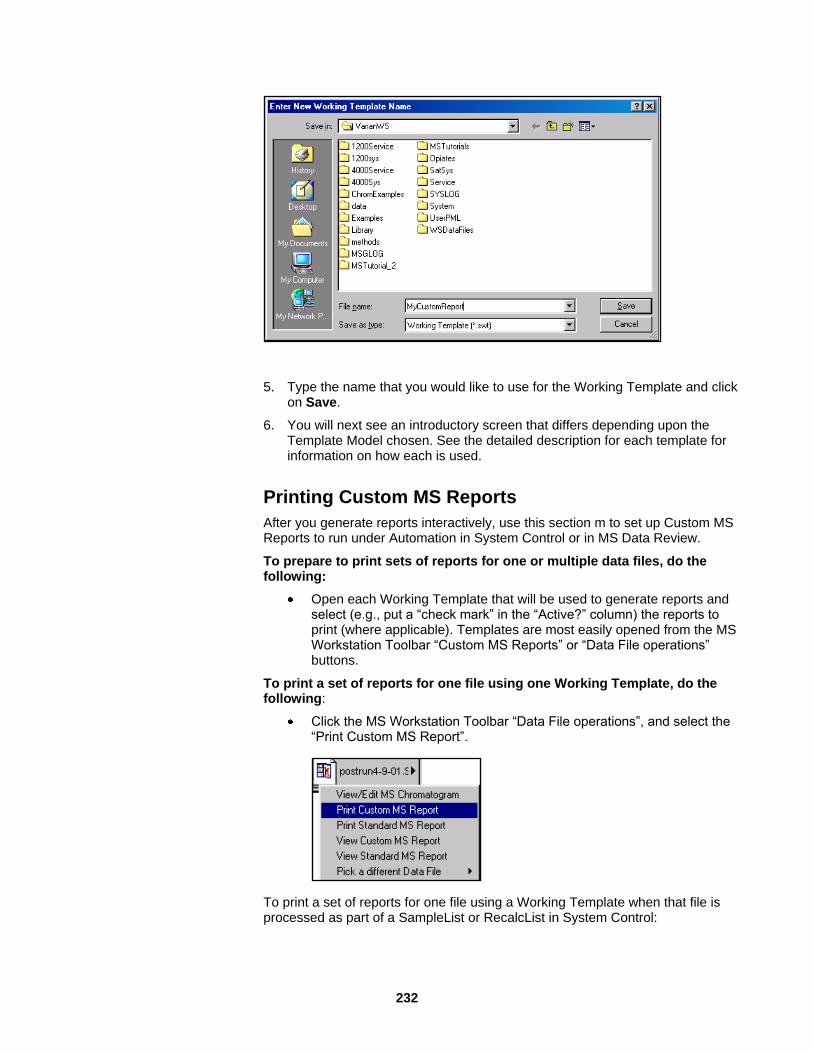
232
5. Type the name that you would like to use for the Working Template and click on Save.
6. You will next see an introductory screen that differs depending upon the Template Model chosen. See the detailed description for each template for information on how each is used.
Printing Custom MS Reports
After you generate reports interactively, use this section m to set up Custom MS Reports to run under Automation in System Control or in MS Data Review.
To prepare to print sets of reports for one or multiple data files, do the following:
Open each Working Template that will be used to generate reports and select (e.g., put a “check mark” in the “Active?” column) the reports to print (where applicable). Templates are most easily opened from the MS Workstation Toolbar “Custom MS Reports” or “Data File operations” buttons.
To print a set of reports for one file using one Working Template, do the following:
Click the MS Workstation Toolbar “Data File operations”, and select the “Print Custom MS Report”.
To print a set of reports for one file using a Working Template when that file is processed as part of a SampleList or RecalcList in System Control:

233
Enter the name of the Working Template (e.g., MyCustomReport.swt) in the AutoLink field in the SampleList or RecalcList on the lines of each data file to be reported.
If you wish to print different report sets or formats for different samples: configure different Working Templates to print the different report sets, and then use the appropriate Working Templates for each sample.
When you select a file and view the report, it is already in "Print Preview" view. If you select File >Menu and look closely at the Print Preview, you will see that the icon is chosen and depressed. If you click on Print Preview at this point, you will be deselecting the Print Preview Mode and the report will disappear as you have effectively instructed the report to go away.
Generating Custom Reports in MS Data Review
If Autolink is checked in the Process View, Custom Reports specified in the RecalcList are generated and sent to the printer when the list is processed.
Custrept
Creating Reports with Custrept
After creating or re-opening a Working Template based on the CustRept Template Model, the Report Selection & Preview dialog is displayed.
To create a report with CustRept:
1. Select an MS Data file for the Report. Click the “File” button to prepare to view data from an MS Data file (*.sms or *.xms).

234
NOTE: If both the desired MS Data File and the desired Working Template file have recently been used, the Working Template can be opened with the data file preloaded by selecting the MS Workstation Toolbar “Data File operations” button and choosing the “View Custom MS Report” option
2. Select a pre-defined Report Template from the Report List. Select a type of report from the list by clicking the record selector button to the far left of the desired report title on the “Report Selection & Preview” form.
3. Customize the Report. If necessary, edit the Report Template by clicking the Edit. You can customize the Header, Graphics, Record and Footer.
4. Load a run file into the form by clicking the File Button, selecting a file and then click Open. The file should have been processed and should contain results.
5. View the Report. Click the View. If the selected report is not based on individual peaks or compounds, a report image will be shown. If the selected report displays one page per compound or peak, then either the “Select Component” or “Select TIC (tentatively identified compound)” form will appear. To view the report, click on the record selector of the desired peak, and then click the Preview Report button. While a report is displayed, there will be a small toolbar directly above it containing icons to print and zoom the scaling of the report screen image. The record selector structure at the bottom left of the report window can be used to navigate through a multipage report.
6. Repeat steps 2-5 if necessary.
7. Exit program.
As mentioned, the report can also be called in System Control Automation or MS Data Review Reprocessing by using the Autolink feature. Every report shown on the “Report Selection & Preview” form which has a check in the “Active?” column will be printed when a report sequence is printed using this database. The “Active?” checkbox state for any record can be changed by clicking on it.
Reports of Type “A” (Compound) will generate one report for each compound in the method that is reported in the data file. Reports of Type “L” (TIC or Library Search) will generate one report for each peak integrated using default integration parameters that are reported in the data file.
Customizing CustRept Report Lists
While the CustRept Template Model comes preconfigured with a list of default Reports in the “Report Selection & Preview” form, reports may be added to, or deleted from the list by clicking either Create or Delete. You can change the types and numbers of reports that included in each Working Template.
Types of CustRept Report Templates
The type of data it reports classifies a CustRept Report Template. The classifications are:
C Calibration Report
A calibration report summarizes the calibration data stored in a data file. It can be used to summarize external standard response factors or internal standard relative response factors for up to 30 injections. It will list the data files in the

235
active calibration, their dates of acquisition, their calibration level, order in which they were processed, and selectable other data about the current analysis file. Up to twenty fields are available to report per record line. Multiple templates can be used to accomplish the complete report of one file. If more than thirty files have been used in the calibration, all files will be listed and all results will be included in the average, correlation, and standard deviation, but only the first thirty listed will be available as individual response factors.
S Sample or Summary Report
A Sample Report summarizes the analysis of peaks integrated and quantitated by method compound table entries. Depending on the specific template type chosen, zero to three graphs are included in the report header. Up to 20 fields may be reported per compound, and one line will be included for each compound in the data file. The footer may contain selected sections from the Instrument Log. The report is laid out in portrait mode.
U Unknowns or TIC Report
An Unknowns Report shows compounds included in the data file that were integrated using the default method integration parameters. Depending on the template type chosen, zero to three graphs may be included in the header. Up to 20 fields may be reported per compound, and one line will be reported for each peak included in the data file. The footer may contain selected sections from the Instrument Log.
A Analysis or Compound Report
A Compound Report prints one or more pages per compound integrated and quantitated by method compound table entries. It contains selected header fields, one record of compound data containing up to twenty items, and graphics. The graphics are configurable to show compound specific information, such as peak profile and apex spectrum.
L Library Search Report
A Library Search Report shows one or more pages for each peak included in the data file that was integrated using the default method integration parameters. The report contains selected header fields, one record of peak data containing up to twenty items, and a graphic. The graphic is configurable to show peak specific information, such as a comparison of the peak apex spectrum with the library spectrum determined to be the best fit by a library search.
T Tune Report
A Tune Report is designed to evaluate a data file containing centroid spectra of a calibration compound against tuning criteria. A spectrum is extracted from the file at a specified time and presented both in a graph and as a set of text records specified by criteria stored in the template. The default criteria are appropriate for FC43, but BFB and DFTPP criteria are available for selection for EPA methods 524, 525, 624, and 625. The tune criteria fields shown on the report are selectable. Tune criteria are editable. Additional tune criteria sets can be specified. The footer may contain selected sections of the Instrument Log, which includes the instrument calibration history and settings.

236
A Tune Verification Report, a special type of Tune Report, presents data from profile mode MS data files (*.sms) acquired during analysis of FC43. It shows up to five ion profiles in addition to a centroided mass spectrum. It is configured and reported like a normal Tune report.
The ion profiles shown on the report are controlled by the first few ions defined in the Tune Criteria set used by the report. The default criteria set for this report is FC43V.
Currently Defined Report Templates
The “Report Selection & Preview” form shows a scrollable list of the currently defined Report Templates. Each Report record shows whether the report will be printed during automated processing by System Control, the type of the report, and the title of the report. The report list can be scrolled using the scroll bar at the right of the form, or using the record selector controls at the bottom left of the form. The currently selected report is marked by a black triangle on the record button at the left edge, and is also indicated by the record number in record selector control at bottom left. This active Report is the one affected by the Edit or Delete keys, and is the Report used to generate a report when the View key is clicked.
Adding a New Report to the Report List
To create a new report, follow these steps:
1. Open the appropriate CustRept-based Working Template.
2. From the "Report Selection & Preview" form, click the Create button. You will see the following screen.
3. On the Create Report Template form, click the selector button to the left of the report type desired, and then click on the Create button.

237
4. The "Edit Report Template" form appears. Use it to customize the default report options, or just click the Save button to complete creation of the default report type.
The new Report will be listed at the bottom of the report list shown on the "Report Selection & Preview" form. It may be necessary to scroll down using the scroll bar on the right of the "Report Selection & Preview" form for the title of the newly created report to be visible.
When a Report is created, its “Active?” checkbox is checked, enabling printing during System Control or MS Data Review processing. To disable automatic printing, clear the “Active?” check box at the left of the report title on the "Report Selection & Preview" form. Clicking the left mouse button while the mouse cursor is over the box can change the state of the “Active?” checkbox.
Some report types listed on the Create Report Template form have several variants listed in the template list. These variants differ only in the number and/or placement of graphics. Once a report is created, its graphics can be modified to show alternate content, but the number of graphics and their relative placement on the page cannot be changed.

238
The Report Selection & Preview Window shown on the left is the default view. After modifying it, the Report Selection & Preview Window appears as shown on the right. Three reports will be printed (all three boxes in the Active? Column are checked):
A sample report
A compound report
A calibration report
Editing an Existing Report
To edit an existing Report, open the Report Selection & Preview form (see above), click the report selector button to the left of the report title of the report to be edited, then click the Edit button.
The "Edit Report Template" form will appear as shown below.
This dialog can be used to edit the Titles at the top of the report and can also be used to have up to two bitmaps appear on the report. This can be a company logo or any picture that you wish to display. Simply type in the file name of the desired bitmap in the Left or Right Image box. Select the Save button to save your settings and exit this dialog.
Report Titles
The Plot Titles specification in the User Chromatogram Plot Preferences is used by all chromatogram plot displays and reports in all MS applications. This includes Standard MS Reports and Custom MS Reports.
The top three fields on the "Edit Report Template" form define the main title and two subtitle lines on the report. These three lines are printed at the top of the report in a fixed position. Leaving the fields blank does not shorten the length of the report. Simply type in any information that you wish to appear on the top of the report in these fields. It is advisable to edit the main title line to contain a unique title, as it is used on the "Report Selection & Preview" and other forms as the report identifier.
Adding Icons or Bitmaps
Graphics with dimensions 3/4 in. high by 1.5 in. wide may be placed to the left and/or right of the Report Title block on a report. If the full pathname of an Icon file (*.ico), a Bitmap file (*.bmp), or a Graphic file (*.gif) is specified in the Left Image and/or Right Image fields of the Edit Report Template form, the corresponding image will be shown on the report.

239
The specified graphic may be of any native size. It will be scaled, preserving the aspect ratio, so it will fit inside the allotted space.
To browse for an existing graphic file, click the "Left Image" or "Right Image" button. Alternatively, the full pathname may be typed directly in the text box.
Report Header
The report header follows the title block on the report. t consists of zero to 20 fields, set up on the "Configure Header" form. The selected fields may be listed in a single column, listed in two columns, listed in three columns, or arranged to efficiently fill the space without truncating any fields (Auto). The fields will be listed in the report from left to right, top down in the order specified in the list of selected fields on the "Configure Header" form.
To change the report header:
1. From the "Report Selection & Preview" form, select the report to be edited, and then click the "Edit" button to show the "Edit Report Template" form.
2. On the "Edit Report Template" form, click on the "Configure Header" button to show the "Configure Header" form.
The screen shown above is the dialog that you will see when you select the Configure Header button.
For the above screen, “Sample Report” is the report title and the Subtitle 1 and Subtitle 2 fields are blank.
The top of the "Configure Header" form shows the report title and two subtitle lines. This is followed by a scrollable list of fields currently selected for inclusion in the report header. The bottom of the form consists of a list box of all fields available for inclusion in the header, six command buttons and a radio button group to select the header layout.
To change the layout format, click on the radio button corresponding to the desired number of columns.
To clear the header so no fields are displayed, click the "Delete All" button.
To delete a single field from the header, select the field to be deleted by clicking on its selector button, and then click the "Delete Field" button.

240
To change (replace) a field in the header, select the field to be changed, click on the replacement field selection in the list box at the lower left of the form, and then click the "Change Field" button.
To add a field to the bottom of the header: click on the field to be added in the list box on the lower left of the form, and then click on the "Add Field" button.
Report Header Fields
The Field List is a list of header items that can be placed in the report. You must use the scroll bar to view the entire list.
Acquisition Date
Time and date that the data file was acquired.
Calculation Date
Time and date that the data file was last processed by data handling.
Data File Name
Full path name of data file.
Last Calibration Sample
Time and date of most recently acquired file listed in the calibration log.
Inst. Method
Instrument Method. The full path name of the method used to acquire the data file.
Operator Name
This field reports the value of the Operator Name when the data was acquired. See System Control-Instrument Configuration-Instrument Parameters dialog.
Inj. Notes
This field reports the notes made when the data was acquired. See SampleList - Injection Notes in System Control.
Instrument ID
This field reports the value of the Instrument ID when the data file was acquired. See System Control-Instrument-Configuration-Instrument Parameters dialog.
Peak Measure
"Area", "Height" or "Unknown". Declares the peak measure used to compute RF and Amount fields. Set by data handling based on the method parameter MS Data Handling-Calculation Setup - Measurement Type.

241
Calculation Type
"Internal Standard", "External Standard", "Area Percent", or "Unknown". Declares the calibration type used to compute RF and Amount. Based on data handling errors, the method parameter MS Data Handling - Calculation Setup - Calibration Type, and influenced by the proper designation and successful identification of internal standard peaks when appropriate.
Sample Name
See SampleList - Sample Name in System Control. This field reports the value of the Sample Name set up when the data was acquired.
Calc Method
Full path name of the method used for last reprocessing of data file by data handling.
Recalc Notes
See RecalcList - Recalc Notes in System Control. This field reports the text of Recalc NOTEs set when file was last recalculated.
Graphics
Reports may contain from zero to six chromatogram/spectra frames. The number, relative size, and placement of these frames is determined by the template used to create the report. The content of each frame may be customized in ways that depend on the type of report. To modify a graphic frame:
1. From the "Report Selection & Preview" form, select the report to be edited, and then click the "Edit" button to show the "Edit Report Template" form.
2. On the "Edit Report Template" form, click the "Configure Graphic" button to show the "Select Graphic" form.
3. The "Select Graphic" form will show buttons whose relative size and position represent the graphic frames present in the report template being edited. Click on the button representing the frame to be edited to open the "Edit Graphic" form.
Configuring a Graphic
The "Edit Graphic" form is used to configure the content of a graphic frame in a report. The graphic display options vary by report type and some report types do not include graphics. Only the available options are visible.

242
Each graphic frame consists of two title lines and an embedded graphic. The embedded graphic may be a chromatogram, consisting of between one and three overlaid or stacked traces; and/or one or three spectra drawn from the chromatogram, the data handling method used to quantitate the chromatogram, the result of a library search, or a combination of these.
Graphic Controls
Title1
Top title line, printed in bold face.
Title2
Subtitle line, printed in normal face.
Title Alignment
Specifies whether title lines are left, center, or right aligned over graphic.
Logical Width, Logical Height
Width, Height in twips (1440 twips = 1 inch) of graph as drawn. This size is scaled to fit the actual size of the graphic as specified by the report template. The effect of these parameters is primarily to alter the relative size and placement of text on the graphic. Larger values reduce text size.

243
Graph Type
Select one of the following choices to determine the basic graphic type. Click the radio button for your choice.
Chrom
Show a chromatogram. One chromatogram is selected. Up to three traces derived from the chromatogram may be shown.
Spectrum
Show one spectrum. This can be a reference or sample spectrum.
S, C
Show one spectrum over a chromatogram in the same graphic box.
S1, S2, S1-S2
Show two spectra and their difference in the same graphic box.
S1, S2, S1-S2, C
Show two spectra and their difference over a chromatogram in the same graphic box. This can be cluttered due to size restrictions.
Time Range Type
This selection specifies the time range displayed in the chromatogram.
Fixed
The time range displayed is determined by the content of the Fixed Time Start and End edit boxes.
1 of 2
The first half of the chromatogram is displayed.
2 of 2
The second half of the chromatogram is displayed.
1 of 3
The first third of the chromatogram is displayed.
2 of 3
The middle third of the chromatogram is displayed.
3 of 3
The final third of the chromatogram is displayed.

244
Peak
This option is available only for Compound reports. The range of the chromatogram from (Calibration RT - SearchWindow) to (Calibration RT + SearchWindow) is displayed.
Fixed Time: Start, End
Specifies the start and end time in minutes for chromatogram display if the Time Range Type is fixed. If the values are both 0, the whole chromatogram is displayed.
Amplitude Min., Max.
Specifies the minimum and maximum amplitude of the chromatogram display. If the values are 0, the chromatogram display range will be scaled to the data being displayed.
Stack Chromatogram Plots
Specifies whether multiple chromatogram traces will be overlaid or shown in separate scales stacked one over another.
#1, #2, #3
These lines specify how a chromatogram trace will be constructed. Choices S,1,2,3,4,5, and I are only available for compound reports. The #1 line will always be shown if the chromatogram is part of the graphic. If the selection is F, lines #2 and #3 are shown only if the Mass Specification is not blank. Select the radio button for each line if you want this plot.
S The trace will be the sum of Qualifier Ion Intensities.
1 The trace will be the first Qualifier Ion intensity.
2 The trace will be the second Qualifier Ion intensity.
3 The trace will be the third Qualifier Ion intensity.
4 The trace will be the fourth Qualifier Ion intensity.
5 The trace will be the fifth Qualifier Ion intensity.
B The trace will be the intensity of the highest intensity mass at each time.
I The trace will be the sum of intensities of all ions specified in the method for integration of this peak.
F The trace will be determined by the content of the Mass Specification and Channel List boxes.

245
Mass Specification
If this box is blank on line #1, the RIC chromatogram will be displayed. If the boxes on lines #2 or #3 are blank and the trace selector is “F”, the corresponding trace will be omitted. For any line, to specify a trace content, enter a specification using one or a combination of the following forms:
60:120 to show the sum of intensities of all ions between 60 and 120;
60+62+85 to show sum of intensities of masses 60,62 and 85;
60 - 81 to show the intensity of m/z 60 minus the intensity of m/z 81;
Channel List
The Channel list is only used for MS/MS data files. Specifically it is used if the file is an MRM or AMD mode file. (See the MS Acquisition Method Editor help section for more information on this.)
If blank, the channel list specification is "merged" data. If the file is MRM or AMD, you can select a channel number from 1-10 to display a specific data channel. Enter the expression for the channels to be shown. (It is advisable to test the channel expression in MS Data Review on a file made from the acquisition method used to acquire the files to be reported. Explicitly indicating a channel in the expression that is not present in the file being reported may prevent report graphs from being updated or drawn when the report is printed. The default channel, blank, will never fail.)
Peak Annotation
This selection determines the type of annotation placed on peaks in the chromatogram window.
None
RT
Name
Status
Height
Area
Peak #
CAS #
Spectral Display: Low Mass, High Mass
Specifies the m/z range displayed in spectra windows. If both boxes contain 0, the mass range is determined by the spectrum being displayed.

246
#1, #2 Scan Type
These lines specify the content of the #1 and #2 spectra. They are used only if the Graph Type specifies that they are visible.
None
If none is selected then no spectral information will appear on the report.
Peak RT
When the Scan Type selection is Peak RT, the spectrum is taken at the time of the observed peak apex. This option is available in Tune, Compound, and Library Search Reports.
Calib. RT
When the Scan Type option is Calib. RT, the spectrum is taken at the time specified as the retention time in the method. This option is available in Tune and Compound Reports.
Method Ref
Spectrum stored in the method for identification of this peak. This option is only available for compound reports.
Library Search
Spectrum identified as best match to peak apex spectrum in the libraries searched during quantitation for this peak. This option is only available for Library Search reports. If no spectral match was found, this spectrum (and the difference spectrum) will be hidden when the report is displayed.
Fixed Time
If this option is selected, the spectrum will be extracted from the chromatogram at the time specified in the Time box.
Time
Only used if the Fixed Time option is specified, Time (in minutes) of the spectrum in the chromatogram to be used. The #1 Scan Type Time field is used by Tune Reports to specify the spectrum used for analysis in the text portion of the report.
Background Correct
This option determines if the Chromatogram displayed in the report has the background corrected for noise before it is displayed.
Apex Scans To Average
There are three options (1, 3, and 5). Specify one of the options to choose how many apex scans should be averaged for that scan type. This will determine how the Chromatogram is displayed for the report.

247
Configuring Tune Verification Report Graphics
The Tune Verification Report shows ion profiles for one to five ions plus a centroided mass spectrum.
The ion profiles have no user-controlled parameters other than the mass at the center of the profile mass range for each ion. These ions are edited using the "Edit Tune Acceptance Criteria" form, accessed from the "Edit Report Template" form using the "Tune Criteria" button. One ion profile is displayed for each mass shown on this form, for up to the first five tune criteria records entered. Ion profiles are shown in the order criteria were originally entered, which may not be in order of ascending mass. More than five tune criteria may be entered, and will be reported, but a maximum of five ion profiles will be shown.
NOTE: The Tune Verification Report is designed to report Profile data files only. If it is used to report a Centroid data file, all graphics will show a "chromatogram" profile. Almost all files in the MS Workstation are acquired in Centroid mode. To configure a method to acquire data in Profile Mode, open the method in the Method Editor, select the "MS Method Editor" section, click the Special Applications button, and then click the "Profile Mode?" checkbox to the true (checked) state. In Custom MS Reports, all reports other than the Tune and Tune Verification Report are designed to process Centroid mode files only.
Report Record
The Report Record section of reports can be configured by clicking on the “Configure Record” button that follows the title header and graphics sections of the report. It consists of a page header line titling record fields followed by one or more data records. For Calibration, Sample, Unknown, and Tune reports, there are as many data records as there are compounds, peaks or masses to report. For Compound and Library Search reports, only one line of data is reported and there are as many reports generated as there are compounds or peaks to report.
The fields available to report depend on the report type. Up to twenty fields may be selected per report record, however fewer than ten will typically fit on one page. If more fields are specified than fit on the width of one page, the extra fields will be printed on an overflow page immediately following the main page. The overflow page will not contain a report header or footer, but will contain the page header. It is a better strategy to compose two reports than one report with fields that collectively overflow the width of one page.
The data record content is specified on the "Configure Record" form. This form contains a scrollable list of the field captions currently selected for the report, together with the field width of each. A record width box at the bottom right of the form displays the total width of the report. The top field on the list will be at the left edge of the report, with remaining selected fields shown from left to right on the report as the order proceeds from top to bottom on the "Configure Record" form.
To edit a report record:
1. From the "Select Report & Preview" form, select the report to be modified, and then click the "Edit" button to open the "Edit Report Template" form.
2. Click on the Configure Record button to open the "Configure Record" form.

248
The Field List is a list of header items that can be placed on the report. You must use the scroll bar to view the entire list.
Add Field Button
The Add Field button allows you to add a field to the report. To use this feature, select an item in the field list by clicking on it and then select the Add Field button. The item selected will appear at the end of the list above.
Change Field Button
To Change a field you must make two selections. First you should click on the record selector that you want to remove in the top left list. Next click on the item in the field list that you wish to have in the top list. Now select the Change Field button. The old field will be replaced with the newly selected field.
Delete Field Button
The Delete Button is used to remove a field from the list. Click on the record selector on the left side of the header list for the item you wish to delete. Now select the Delete button and that item is removed from the list.
Delete All Button
The Delete All button will delete all of the items from the Header list.
Field Width
The Field Width reports how much space is given to each column in the test report. The dimension is in inches. (This field may not be edited.).
Record Width
The Record Width is the sum of the widths of all of the fields in the report. Watching this number will help you determine if more columns can fit on a particular page.
Save Button
The Save button causes all of the edits to be saved to this file.

249
Help Button
The Help button will take you to the help pages. All of the CustRept manual information is included in the help pages.
Field Definitions: Calibration Reports
Calibration Reports are for files processed with internal or external standard calibration specified in the data handling method. The following fields may be selected for inclusion in Calibration reports.
#
Calibration Compound Number, the record number shown in the method editor for the Compound table.
Compound Name
The compound name shown in the method.
Corr.
Correlation Coefficient or Coefficient of Determination computed during calibration.
Count
The sum of the number of replicates over all calibration levels used in the calibration.
Avg RRF or Avg RF
Average response factor if the Calculation Type is "External Standard", or the average relative response factor if the Calculation Type is "Internal Standard".
%RSD
Percent relative standard deviation of the (relative) response factors contributing to the average (relative) response factor.
RT
The expected retention time of the compound.
Std
The calibration compound number of the internal standard used for the compound.
Group Name
The text string entered for the group name field in the method for this compound.

250
RFn, RRFn where n = 1…30
The (relative) response factor for the nth calibration file for this compound. When this report is computed, response factors are computed for each file included in the calibration. A unique index value, starting from 1 and incrementing, is assigned to each file used in calibration. All (relative) response factors for a single file instance used in calibration will have the same index value and be stored in the same column. If more than 30 files were used in integration, all files and response factors will be used in computing the AvgRRF (or Avg RF) and %RSD, but only the first 30 files will have response factor results stored and available to report. The same result is reported for both RFn and RRFn where n is the same number. The result type will be relative response factor if "Calculation Type" is internal standard
NOTE: If an internal standard Calculation Type is specified, but the required internal standard data are missing, then the field value reported will be the response factor rather than the relative response factor as expected. This can happen, for example, if the internal standard amount is not specified for the calibration level, or the internal standard peak is not designated in the method compound table,
Field Definitions: Compound, Sample, Unknowns, & Library Search Reports
The following fields may be selected for inclusion in Sample and Compound reports. The fields marked with (*) may also be included in Unknowns and Library Search reports.
#
Calibration Compound Number: the number of the compound in the method.
Compound Name (*)
Compound name from the method in Compound and Sample reports.
Compound name of library search best fit in Unknowns and Library Search reports.
RT (*)
Retention time determined during peak integration, in minutes.
Quan Ions (*)
Ion formula specified in method for integration.
Area (*)
Baseline corrected area determined during integration, in counts.
Area Percent (*)
Compound, Sample reports: Area percent computed from areas of identified, missing and failed peaks included in data file.

251
Unknowns, Library Search reports: Area percent computed from areas of unknown, TIC, and duplicate peaks included in the data file.
Amount
Amount in units of “Units” field, computed from the currently active calibration.
If the Amount field is blank, the actual amount calculated was negative. Examine the calibration results and error codes reported to determine the source of the error.
Area Reject
Peak Area Reject (in counts) entered in the method.
Height (*)
Peak height determined during integration, in counts.
Height Reject
Peak Height Reject (in counts) entered in method.
Fit (*)
Forward Search Fit value.
For Sample, Compound reports: Measures fit to method reference spectrum.
For Unknowns, Library Search value: Measures fit to identified compound in library.
Fit Limit (*)
Minimum fit value for identification, as set in method. Refers to Fit, Rfit, or Purity as specified in the Match field and the method, and reported in MatchVal field.
For Sample, Compound reports, refers to fit to compound reference spectrum stored in method.
For Unknowns, Library Search reports, refers to fit to best fit in library search.
Calib RT
Calibration retention time (minutes), as stored in the method used in quantitation.
Group Name
Group Name as stored in the method.

252
IS#
Internal standard number used to quantitate this peak. This is the calibration record number in the method of the internal standard. This field is meaningless unless the calibration type in the method and the report header is "internal standard".
IS
"Std" if this peak is an internal standard reference, " " if not.
BC (*)
Baseline correction codes from peak integration of the peak. Allowed values are:
BV Baseline to Valley
BB Baseline to Baseline
MB Mended End to Baseline
VB Valley to Baseline
VV Valley to Valley
MM Mended End to Mended End
MV Mended End to Valley
TS Separated Tangent Skim
TF Fused Tangent Skim
GR Group Peak
BM Baseline to Mended End
VM Valley to Mended End
HF Horizontal Forward
HB Horizontal Backward
HM Horizontal Minimum
Width (*)
Measured peak width (seconds).
Ion Time (*)
Ionization time of spectrum at peak apex (microseconds).

253
Calibration Equation
The calibration field consists of two parts. The first piece documents how the origin was treated during computation of the calibration equation. These are the available options: "Ignore 0", "Force 0", or "Include 0".
The second part is the calibration equation itself. This takes one of the following forms:
y = bx + a
y = cx2 + bx +a
"Cubic equation"
where a, b, and c are numerical constants, x is the amount (for external standard) or amount/amount internal standard (for internal standard calibration), and y is area (for external standard) or area/area internal standard (for internal standard calibration).
CAS# (*)
Chemical Abstracts number from the method in the case of Sample or Target Compound reports, or a library match value in the case of Unknowns or Library Search reports.
RFit (*)
In Unknowns or Library Search reports, the fit of the peak apex spectrum to method Reference Spectrum. In Sample or Target Compound reports, Reverse fit value for the best match of library spectrum to peak apex Spectrum.
Purity (*)
In Unknowns or Library Search reports, the fit of the peak apex spectrum to the method Reference Spectrum. In Sample or Target Compound reports, Purity fit value for best match of library spectrum to peak apex spectrum.
Match (*)
The type of fit used to determine the best fit of library or method spectrum to peak apex, ("Fit", "RFit", or "Purity").
Match Val (*)
The best fit value of the "Match" type of peak apex to library or method reference spectrum.
Scan
The scan number of the peak apex.
Corr.
The coefficient of determination or correlation coefficient describing the fit of the calibration points to the calibration equation.

254
RC# (*)
Report compound number.
SrchWin
Search window (minutes) from method.
SrchMeth
Search method type for peak identification (from method). "RT" or "Spectrum"
S/N (*)
Measured signal to noise ratio.
Channel (*)
Channel specification used to integrate peak.
ResultType
The record type of this peak, determined during peak quantitation:
Identified - Peak quantitated using a method compound record. The peak identification tests were passed, as were the minimum size and amount tests.
Failed - Record represents a peak integrated using a method peak specification. The peak failed one or more of the peak criteria for reporting.
Missing - The method could not identify this peak.
TIC - This peak was integrated using default integration parameters. A library search produced an identification that satisfied the minimum fit criteria for tentative identification.
Duplicate - This peak, integrated using the default integration parameters, appears to be a peak that was also reported using a mass specification from the method.
Unknown - This peak was integrated using default integration parameters, but was not identified as either duplicating a peak integrated using compound specific parameters or matching a compound in a searched library.
RF
Response factor computed using the quantitation criteria. This is either a response factor if the header field "Calculation Type" is "External Standard", or a relative response factor if "Calculation Type" is "Internal Standard". It is computed from areas if the header field "Peak Measure" is "area", or from heights if "Peak Measure" is height.
RRT
Relative Retention Time.

255
QI1, QI2, QI3, QI4, QI5
Qualifier Ion 1, 2, 3, 4, or 5 from method.
QIR1Lo, QIR2Lo, QIR3Lo, QIR4Lo, QIR5Lo
Qualifier Ion Ratio 1, 2, 3, 4, or 5 Low Limit from method.
QIR1Hi, QIR2Hi, QIR3Hi, QIR4Hi, QIR5Hi
Qualifier Ion Ratio 1, 2, 3, 4, or 5 High Limit from method.
QIR1, QIR2, QIR3, QIR4, QIR5
Actual Qualifier Ion Ratio as determined during quantitation.
Units
Actual units of Amount field, as determined from the method "Units" field and the processing results during quantitation.
Amnt Reject
The minimum value of the "Amount" field to report as "identified", from the method "Report Threshold" parameter.
Status Codes (*)
Alphanumeric string of status codes set during peak quantitation.
(An “X” is at the start of status codes that represent an error status. Codes S,R, T, and U are advisory codes that do not represent an error condition.
The character codes are interpreted as follows:
R Reference Peak
# Factors not updated
* No result can be calculated
+ More than one result
V Peak fails verification
M Missing Peak
C Result out of calibration range
S Internal Standard peak
U User defined end points
O Overrange peak
T Relative Retention Time peak
D Cannot calibrate - Default to raw peak size
I Invalid scan function channel specification

256
Weight
The regression weighting used in determining the calibration curve.
Field Definitions: Tune Reports
The following fields are available for inclusion in Tune reports. Editing the Tune Criteria form sets the items marked (*). The remaining fields are computed when the Tune report is prepared.
m/z
The m/z to be tested.
IonInt
The intensity of the m/z ion being tested.
Criteria (*)
Text description of the qualification tests for acceptance. Has no influence on the criteria used to compute the acceptability of the ion intensity.
LowLimit (*)
Lower limit, expressed as percent of the intensity of the CompMass ion, of the acceptable intensity for IonInt.
HighLimit (*)
Higher limit, expressed as percent of the intensity of the CompMass ion, of the acceptable intensity for IonInt.
Comp m/z
The m/z ion used for the major comparison of intensities. If 0, the ion of highest intensity in the spectrum is used for comparison and field is reported as "Base Ion".
Rel Int1 (*)
The relative intensity, expressed as percent, of IonInt to the intensity of the ion specified by CompMass.
Pass Fail
"Pass" or "Fail". The value will be "Pass" if LowLimit1 <= Rel Int1 < HighLimit1 and LowLimit2 <= Rel Int2; otherwise it will be "Fail".
CompMass2 (*)
Comparison mass 2, m/z of the second comparison mass. If 0, implies the m/z of the most intense ion in the spectrum.

257
LowLimit2 (*)
The lower limit of the acceptable value, expressed as percent, of the value of RelInt2.
Rel Int2
The relative intensity, expressed as percent, of IonInt to the intensity of the ion specified by CompMass2.
IsoMass (*)
Isotopic m/z whose intensity is to be compared to that of "Mass".
IsoInt
Intensity of IsoMass.
IsoRatio
Ratio of IsoInt to IonInt, expressed as percent.
Tune Criteria
The Tune Type text box is located on the "Edit Report Template" form in the lower left corner. It is visible only when the report type being edited is "T”. A Tune report, when created, will default to reporting FC43 criteria. (FC43V is the appropriate type for a Tune Verification Report.) To change the tune criteria being used and reported:
1. From the "Report Selection & Preview" form, select the Tune report to be edited, and then click on the "Edit" button to show the "Edit Report Template" form.
2. To change the Tune criteria being reported, click in the Tune Type text box and enter the name of the criteria data set to be used. These are: FC43, FC43V, and EPA methods 524, 525, 624, and 625. Typing any of these names (FC43, FC43V, 524, 525, 624, and 625) will cause the tune criteria to be loaded automatically. Select the Tune Criteria button after you type in one of these names to check the loaded criteria. To create a totally new set of criteria, enter a name in this box.
To edit or review the report's tune criteria, click on the "Tune Criteria" button to view the "Edit Tune Acceptance Criteria" form.

258
The dialog above is visible when you edit a tune report.
Editing Tune Criteria
NOTE: Changing a tune criteria set will permanently change the Tune Criteria for all Tune reports that use the same Tune Criteria set name. If you wish to customize Tune Criteria, we suggest you create a new set rather than changing one of the sets provided on installation. If the selected criteria set is changed from FC43 to "524", "525", "624", or "625", it is advisable to change the Report Record definition. Delete all fields and then add "m/z", "Criteria", "Comp m/z1", "Rel Int1","Comp m/z", "Rel Int2", and "Pass/Fail" fields to get one type of appropriate report for these criteria sets. The specific scan used to test Tune Criteria in a tune report is controlled by the "Spectrum - #1 Scan Type - Fixed Time - Time" parameter edit box on the lower right side of the "Edit Graphic" form. This edit box controls both the spectrum analyzed and the spectrum displayed on the report. This time is set to 0.8 minutes in the default Tune Report. In Tune Verification Reports, the acquisition time of the spectrum reported is set in the "Edit Tune Verification Graphics" form in the "Spectrum Time (min.)" text box. The default time is 0.3 minutes. To reach the "Edit Graphic" form from the "Edit Report Template" form, click the "Configure Graphic" button to view the "Select Graphic" form. From the "Select Graphic" form, click the "Graphic 1" button to view the "Edit Graphic" form.
To edit a field, click on the field and enter the new value.
To add a record, click on any field in the empty record at the bottom of the form and enter a new value.
To delete a record, click on the record selector to the left of the record to be deleted, and then press the "Delete" key on the keyboard.
NOTE: If the value of Mass1 or Mass2 is 0, the base ion m/z is implied. An ion intensity ratio = Low1 or Low2 is considered to be acceptable; an ion intensity ratio = High1 is unacceptable.

259
Configure Report Footer (Instrument Log)
The report footer can be included in Sample, Unknowns, and Tune type reports. To configure the footer, click the Configure Footer button on the "Edit Report Template" form to open the "Configure Instrument Log" form. The dialog below is displayed if you select the configure footer button for the report type in which it is available. Some of the form's controls are:
Autosampler Report
Presents vial location, injection volume and injection number used by the autosampler.
Segment Summary
Consists of one line per data acquisition segment summarizing the segment name, type of acquisition, channel information, mass range and the time range of each segment.
MS Run Log
Consists of several pages of instrument settings, including instrument calibration.
View a Compound Report
To view a Compound Report, you must select the View button from the main page after you have selected a data file. A screen similar to the one below is visible when the view button is selected for a compound report. The following information is given for all of the compounds in the peak table:

260
Report#
The report # refers to the number of the compound in the peak table. Click on the selector button to the left of the report # to select which compound report you wish to preview and then select the Preview Report button.
Compound
The Compound column shows the compound name as it appears in the method peak table. This helps you to select which compound to preview in the report.
RT
The RT column shows the retention time of the compound.
Area
The Area column shows the integrated area counts for that compound according to the conditions in the method.
Height
The Height column shows the integrated Height counts for that compound according to the conditions in the method.
Reference Match
The Reference Match column shows the library fit match when comparing the sample spectrum to the reference spectrum in the method used for data processing.
Preview Report Button
The Preview Reports button allows you to see the Compound Report for the specific compound selected. The compound selection is made by clicking the appropriate position in the selector on the left side of the displayed table.

261
Help Button
The Help button will take you to the help pages. All of the CustRept manual information is included in the help pages.
Close Button
Selecting the Close button will allow you to exit the Compound Report dialog and return to the CustRept main page.
View a Library Search Report
To view a Library Search Report, select the View button from the main page after you have selected a data file. The data file must contain compounds that were identified by a library search during processing. A data handling method must be selected for processing and the calculation setup section specify a library search for unknown compounds. The following is from Method Builder- Calculations Setup
Click View in the library search report to open the following window.

262
Report#
The report # refers to the number of the compound in the peak table. Click on the selector button to the left of the report # to select which compound report you wish to preview and then select the Preview Report button.
Compound
The Compound column shows the compound name of the top hit from the library search. This helps you to select which compound to preview in the report.
RT
The RT column shows the retention time of the compound.
Area
The Area column shows the integrated area counts for that compound according to the conditions in the method.
Height
The Height field shows the integrated height counts for that compound according to the conditions in the method.
Reference Match
The Reference Match column shows the library fit match when comparing the sample spectrum to the reference spectrum in the method used for data processing.
Preview Report Button
The Preview Report button allows you to see the Compound Report for the specific compound selected. The compound selection is made by clicking the appropriate position in the selector on the left side of the displayed table.

263
Help Button
The Help button will take you to the help pages. All of the CustRept manual information is included in the help pages.
Close Button
Selecting the Close button will allow you to exit the Compound Report dialog and return to the CustRept main page.
Deleting a Report
From the "Report Selection and Preview" form, select the report to be deleted by clicking on the record selector button to the left of the report title, then click the "Delete" button in the "Report Template" group
ToxPro
The ToxPro template generates two types of fixed format reports designed for toxicology applications.
FC-43 Tune Report
The FC-43 Tune Report is designed to display the instrument tune from a profile mode data file of FC-43 spectra. The data file should contain continuous FC-43 spectra from time zero to one minute or longer. The report shows a fifteen scan averaged spectrum centered at 0.3 minutes, or the closest approximation to that average that is available from the data file. Peak profiles are shown for m/z of 69, 264, and 503, along with selected instrument conditions. If any other type of data file is reported using this report template, the result will likely be nonsensical, typically showing chromatogram profiles where spectral profiles should be.

264
Examples of Reports Created from the Custrept Template
The following pages show examples of a sample report, target compound report and calibration report for the urine sample containing opiates, that was described in “Standard Sample Report”. Note that the Custrept template allowed the placement of the company logo on the reports.
Sample Report
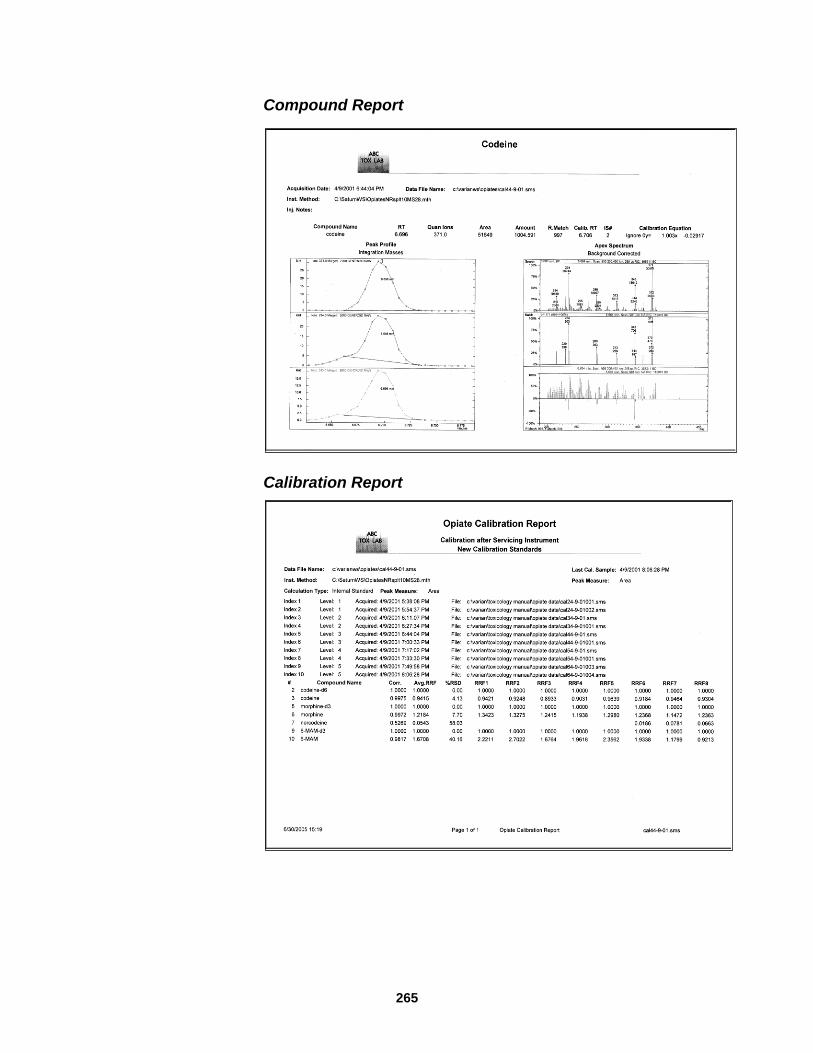
265
Compound Report
Calibration Report

266
MultiCpdBasic Report The Basic Multi-Compound Template Model offers two fixed format reports that summarize target compounds from a designated data file in graphics and text.
These reports feature graphics for up to a maximum of nine compounds, followed by text for all included compounds. All target compounds in a file may be included, or, if the Workstation method designated group names for compounds, the report graphics and text may be limited to compounds with a specific group name. All of the internal standard compounds are listed first; then the target analytes are listed. Report headers may be edited, and the group name selected, using the Edit dialog, accessed by clicking the Edit button.
A greater range of graphical summary report styles, each with more customization, is available in the optional Multi-Compound application.
SummaryBasic Report Unlike the other custom reports, described in this section, which report data from a single run file or a series of calibration files, this report will summarize the data from all of the calibration and analysis files in a Recalculation List. For each analyte in the compound table of a MS Data Handling method, the following information will be listed:
Area counts for the compound and its internal standard
Retention time of each compound (including mean and standard deviation for the retention times of analytes in calibration runs)
Parameters for the linearity curve (slope, intercept, correlation coefficient)
The calculated value for each compound in analysis runs
The fit of each analyte to its reference spectrum in the compound table
Using the SummaryBasic Report
1. Build a RecalcList for the series of MS Data files that you wish to summarize. (The RecalcList may be built automatically when running a SampleList). The

267
list may contain all analysis files if satisfactory calibration data already exist in the method, or it may contain calibration files, followed by analysis files.
2. After processing the data, click the Custom Report icon in the MS Workstation Toolbar. Choose “New Template…” and select SummaryBasic.mdb as the template model. You are asked to name the report.
3. The dialog page appears. Enter comments to include in the report. Click “Report” and select the RecalcList file that contains the runs that you want to summarize. Normally “Print to File” or “Print to Tabbed File” are not checked.
4. The report will be generated and may be printed. Each compound is listed on a separate page with calibration samples on top and analysis samples below.

268
NOTE: Checking “print to file or tabbed file” causes the generation of a text file of the same path and name as the report template, in place of sending the formatted report to a printer. This output text file can be opened in either Excel or Word to provide a report that is editable. The text file does not contain the calibration information block in the right side of the header of the formatted report (calibration equation, correlation coefficient, etc.).
When Custom Reports Are Not Enough Some applications may require capabilities not directly supported by (either the core or optional) MS Custom Reports. Examples of these needs would be applications requiring specific calculations based on analytical values not supported by the MS Workstation's built in calculations, reports summarizing series of analyses, or customization of reports beyond that provided within Custom MS Reports.
Most of these needs can be addressed by using Microsoft Office programs to access data stored in Custom MS Report‟s internal tables.
If the application extension can be handled in Excel, the Excel Data menu item GetExternalData can be used to extract essentially the entire data handling method and result content of a data file into Excel tables.
(This Excel feature uses Microsoft Query. Microsoft Query is not loaded during a default Excel installation. See Microsoft Excel Help.)
One strategy to do this for automated reporting is to include a Report Template file (e.g., MyTemplate.swt) on the first line of AutoLink processing, even if no reports are selected. Include your Excel application on the second line of the AutoLink execution form. When the System Control SampleList or RecalcList line is executed, the Report Template will read the current data file into its tables, report (if any report is requested), and then exit. The Excel application will then execute, and has available to it tables containing data from the last file processed by the template.
If the use of Microsoft Access is preferred, a similar strategy can be followed. A new database can be created, and tables in a Custrept Working Template file can be attached to the new database. Custom reports and calculations based on

269
the attached tables can now be created using the full power of the retail Microsoft Access 2000 product.
The useful resources in Custrept Working Template files available to external Excel and Access applications include:
RunHeader, a table containing a single record describing the last analysis file reported.
RunRecords, a table containing records with comprehensive data for each compound and peak detected in the last analysis file reported.
Compound, a table containing most of the method parameters relating to compound specific information used to quantitate the last analysis file reported.
AnalysisRecords, a query containing Compound table and RunRecord table information on peaks quantitated using method compound information
UnknownsRecords, a query containing all peaks integrated using default integration.
While the Custom MS Reports are completely open applications whose design could be modified by a user, we recommend that this not be done. The Microsoft Access databases on which the templates are built are tightly integrated. What seem to be minor local design changes can have very broad and unforeseen consequences.

270
Batch MS Report Printing without Recalculating
Overview When performing batch recalculations in System Control, reports are automatically generated using the Report parameters in the active Method. You may wish to print reports for a batch of Data Files without recalculating them.
Batch Printing in System Control Create or open a SequenceList from the File menu or from the Automation File
Editor in the Varian Work Station toolbar.
Specify a Print action.
Specify a Method containing the Report sections that you wish to apply.
Specify a RecalcList containing the names of the Data Files for which you wish to generate reports.
If the sequence file was created in the Automation File Editor, open System Control and then open the sequence list. Press the Begin button to start printing.

271
Data File Conversion
Conversion of Old Saturn MS Files to SMS format
The MS/SMS File Conversion button in the Varian Workstation Toolbar
will open a utility program to convert old Saturn files (file extension MS) to the new format (file extension SMS). The converted files may be viewed and processed in the new software. This utility may also be used to convert new data files to Saturn files, for use with existing Saturn Procedure Language and third party programs.
Open the file conversion utility on the Varian Workstation Toolbar.
Select the desired conversion. For this example, we will convert old Saturn files to the new windows format.
Open Windows Explorer program and setup the windows adjacent to each other.

272
Select the old Saturn files that you want to convert and drag-and-drop these files in the Batch Conversion screen. Once the files are converted they will appear in the file window with the new extension.
Files will not be converted if they are in use, if they are corrupted, or if the destination files already exist. Any files that are not converted will be shown in the window.

273
Conversion of Old 1200 dat Files to XMS Format In the same manner, old files from the 1200 MS (dat extension), can be converted to XMS files. To open the conversion utility, click on the dat
conversion icon in the Varian Workstation Toolbar.
The following window opens and the dat files are dragged from Windows Explorer into the window for conversion to XMS files.
Conversion of MS Workstation XMS Files to MGF MS Workstation XMS files can be converted automatically to MGF (Mascot Generic Format) by the standalone utility, Export MS/MS Ions, or by AutoLink from the RecalcList or SampleList.
To convert the files using AutoLink:
1. From the RecalcList or SampleList dialog, click the AutoLink button.
2. In the Command box, type: exportions –rai
The new files have the same name and path as the old files but with the extension MGF. Existing MGF files with the same name are overwritten.
To convert the files using the Export MS/MS Ions utility:
1. Click Start and then point to All Programs.
2. Point to MS Workstation and then Utilities.
3. Click Extract MSMS Scans.
In addition, if the Export MS/MS Ions utility is opened and the parameters are changed, the changes are retained even when the utility is closed. The parameters that were set through the utility are applied to any ions exported from the AutoLink command.

274
Appendix: Summary of MS Data Review Main Menu and Toolbars
In this section the commands in the main menu of MS Data Review are listed and briefly summarized. The main toolbar of MS Data Review and the Chromatogram and Spectra Toolbar are also summarized. Most of these items are described in more detail in the main body of this manual.
MS Data Review Main Toolbar
Selects data file to plot and allows the user to select a mass or range of masses.
Print Opens the Make Reports Window for various printing options for chromatograms, spectra, etc.
Export Opens a menu for exporting chromatograms, spectra and various views to relevant applications such as ASCII, the clipboard and spectra to spectra lists.
Opens the Plot Chromatogram and Spectra View.
Search Offers a choice of library searching the active spectrum or the active spectrum list or target list searching the active chromatogram or active spectrum.
Opens the Process Data View.
Opens the Results View.
Opens the NIST MS Search application and initiates a NIST library search of the active spectrum.
Opens the AMDIS application for the active chromatogram.
Converts the chromatograms and spectra pane at the right of the Plots View to full screen. Clicking this icon again restores the original view.
Rotates plots and spectra (side by side to top and bottom).
Opens the Help menu.

275
MS Data Review Main Menu
FILE Select File/Chromatogram - opens data files
Printer setup
Print - same as Print Icon in the Toolbar
Export - exports views and files - same as the export icon in the toolbar
Preview Reports - if checked will show a report on the monitor before printing
Send Reports to Spooler File - if checked will send reports to the active spooler file instead of the printer
Select Spooler File - open a dialog for creating a new spooler file and if the user does not then a selection from existing spooler files is allowed. The selected or new spooler file becomes the active file.
View Spooler File - opens the active spooler file
Exits MS Data Review
CHROMATOGRAM Select Active File as Reference File - the active plot is designated a reference file. It remains in the plot pane when other files are opened so that they can be compared to the reference file.
Save Active Chromatogram as User Descriptor - special characteristics of the active plot are put in the user descriptor pane (for example if the active file is a plot of the sum of two ions, the sum of these two ions will be added to the user descriptor pane). This new user descriptor will be associated with that file only.
Filter Chromatogram: brings up a menu so that the active plot can be viewed as raw data, filtered data or both data can be overlaid. See “View Effect of Chromatogram Filtering”.
Target List Search Active Chromatogram - does a search on the chromatogram using the active target list (msp file containing target compounds and reference spectra).
Set Single Click Action - opens a menu that allows the user to determine the action for a mouse click on the chromatogram such as displaying or library searching a spectrum.
Set Click And Drag Action - opens a menu that allows the user to determine the action for dragging a mouse click on the chromatogram such as zooming or moving a chromatogram.
Set Point/Spectrum Selection - determines if selecting a peak will generate a spectrum at the point where the selection is made or a spectrum at the apex.
Set Spectra to Average - opens a menu where the user chooses 1-7 point to average a spectrum. If one point is chosen, the spectrum will be shown at the point of selection on a peak; otherwise an average spectrum may be displayed representing up to 7 scans (point of selection plus up to three scans on either side of the selection)
Set Chromatogram Display - stacked, overlaid or normalized (normalized are overlaid chromatograms that are normalized to the tallest peak in each chromatogram).
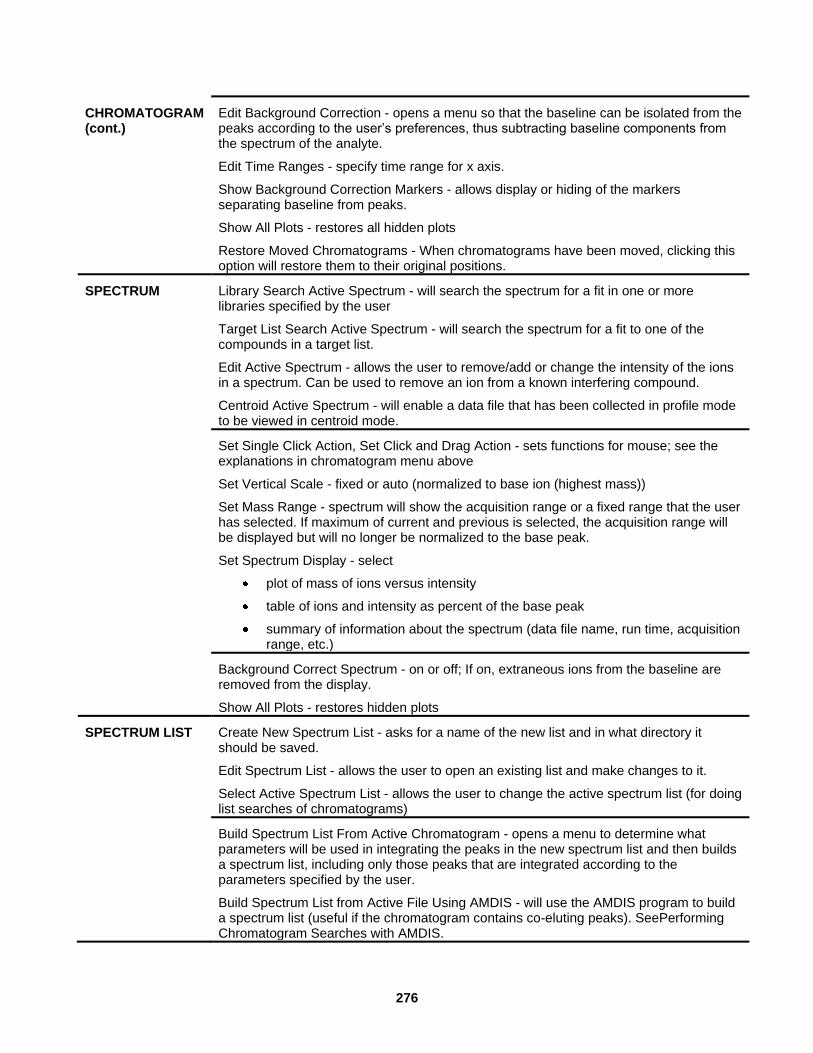
276
CHROMATOGRAM (cont.)
Edit Background Correction - opens a menu so that the baseline can be isolated from the peaks according to the user‟s preferences, thus subtracting baseline components from the spectrum of the analyte.
Edit Time Ranges - specify time range for x axis.
Show Background Correction Markers - allows display or hiding of the markers separating baseline from peaks.
Show All Plots - restores all hidden plots
Restore Moved Chromatograms - When chromatograms have been moved, clicking this option will restore them to their original positions.
SPECTRUM Library Search Active Spectrum - will search the spectrum for a fit in one or more libraries specified by the user
Target List Search Active Spectrum - will search the spectrum for a fit to one of the compounds in a target list.
Edit Active Spectrum - allows the user to remove/add or change the intensity of the ions in a spectrum. Can be used to remove an ion from a known interfering compound.
Centroid Active Spectrum - will enable a data file that has been collected in profile mode to be viewed in centroid mode.
Set Single Click Action, Set Click and Drag Action - sets functions for mouse; see the explanations in chromatogram menu above
Set Vertical Scale - fixed or auto (normalized to base ion (highest mass))
Set Mass Range - spectrum will show the acquisition range or a fixed range that the user has selected. If maximum of current and previous is selected, the acquisition range will be displayed but will no longer be normalized to the base peak.
Set Spectrum Display - select
plot of mass of ions versus intensity
table of ions and intensity as percent of the base peak
summary of information about the spectrum (data file name, run time, acquisition range, etc.)
Background Correct Spectrum - on or off; If on, extraneous ions from the baseline are removed from the display.
Show All Plots - restores hidden plots
SPECTRUM LIST Create New Spectrum List - asks for a name of the new list and in what directory it should be saved.
Edit Spectrum List - allows the user to open an existing list and make changes to it.
Select Active Spectrum List - allows the user to change the active spectrum list (for doing list searches of chromatograms)
Build Spectrum List From Active Chromatogram - opens a menu to determine what parameters will be used in integrating the peaks in the new spectrum list and then builds a spectrum list, including only those peaks that are integrated according to the parameters specified by the user.
Build Spectrum List from Active File Using AMDIS - will use the AMDIS program to build a spectrum list (useful if the chromatogram contains co-eluting peaks). SeePerforming Chromatogram Searches with AMDIS.
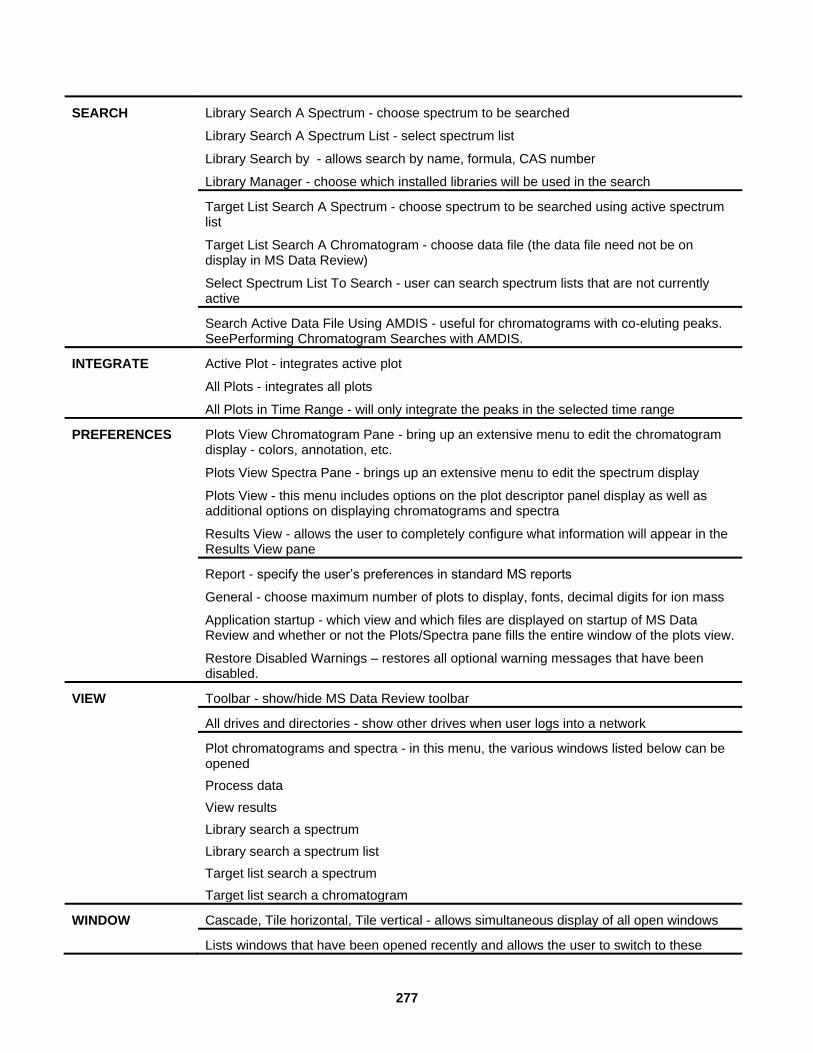
277
SEARCH Library Search A Spectrum - choose spectrum to be searched
Library Search A Spectrum List - select spectrum list
Library Search by - allows search by name, formula, CAS number
Library Manager - choose which installed libraries will be used in the search
Target List Search A Spectrum - choose spectrum to be searched using active spectrum list
Target List Search A Chromatogram - choose data file (the data file need not be on display in MS Data Review)
Select Spectrum List To Search - user can search spectrum lists that are not currently active
Search Active Data File Using AMDIS - useful for chromatograms with co-eluting peaks. SeePerforming Chromatogram Searches with AMDIS.
INTEGRATE Active Plot - integrates active plot
All Plots - integrates all plots
All Plots in Time Range - will only integrate the peaks in the selected time range
PREFERENCES Plots View Chromatogram Pane - bring up an extensive menu to edit the chromatogram display - colors, annotation, etc.
Plots View Spectra Pane - brings up an extensive menu to edit the spectrum display
Plots View - this menu includes options on the plot descriptor panel display as well as additional options on displaying chromatograms and spectra
Results View - allows the user to completely configure what information will appear in the Results View pane
Report - specify the user‟s preferences in standard MS reports
General - choose maximum number of plots to display, fonts, decimal digits for ion mass
Application startup - which view and which files are displayed on startup of MS Data Review and whether or not the Plots/Spectra pane fills the entire window of the plots view.
Restore Disabled Warnings – restores all optional warning messages that have been disabled.
VIEW Toolbar - show/hide MS Data Review toolbar
All drives and directories - show other drives when user logs into a network
Plot chromatograms and spectra - in this menu, the various windows listed below can be opened
Process data
View results
Library search a spectrum
Library search a spectrum list
Target list search a spectrum
Target list search a chromatogram
WINDOW Cascade, Tile horizontal, Tile vertical - allows simultaneous display of all open windows
Lists windows that have been opened recently and allows the user to switch to these

278
windows (example: results window, library search window)
HELP Hot keys - displays keyboard actions for quickly accomplishing tasks in MS Data Review (may be printed as a reference)
Results codes - list of codes that are used in reporting results (may be printed as a reference)
Results List columns - description of all columns that can be selected in the Results List pan in the Results View.
Search for help on - accessed help data base
Product support web site - connects to Varian web site for support
About MS Data Review - software version and installation information
Chromatogram Toolbar
Hide toolbar.
Expand chromatogram to full scale on x and y axes.
Return to previous scaling of chromatogram.
Click to moves the marker backwards scan by scan to display spectrum at each point.
Click to move the marker forwards scan by scan to display spectrum at each point.
Open the menu to set single click action of the mouse in the chromatogram window.
Open the menu to set click and drag action of the mouse in the chromatogram window.
Select if the spectrum at the point of selection on a peak is displayed or the peak apex spectrum is displayed when clicking a peak with the mouse.
Shown the spectrum, of the point of selection on a peak or an average spectrum. May represent up to 7 scans (point of selection plus up to three scans on either side of the selection)
Open the menu for plots to be stacked, overlaid or overlaid with all peaks normalized to the tallest peak in each plot
Edit background correction: open a menu so that the baseline can be isolated from the peaks according to the user‟s preferences, thus subtracting baseline components from the spectrum of the analyt
Background correction markers: display or hide the markers separating the baseline from the peaks.
HiRes Plots displays the HiRes chromatogram and spectrum. By default, HiRes data is displayed.
Non-DDS Mode: The BP icon only works for the TIC plot. Click the Base Peak icon to display the Intensity of the Base Peak. If extracted ions or other scan descriptors are displayed when the Base Peak icon is pressed, no change is made
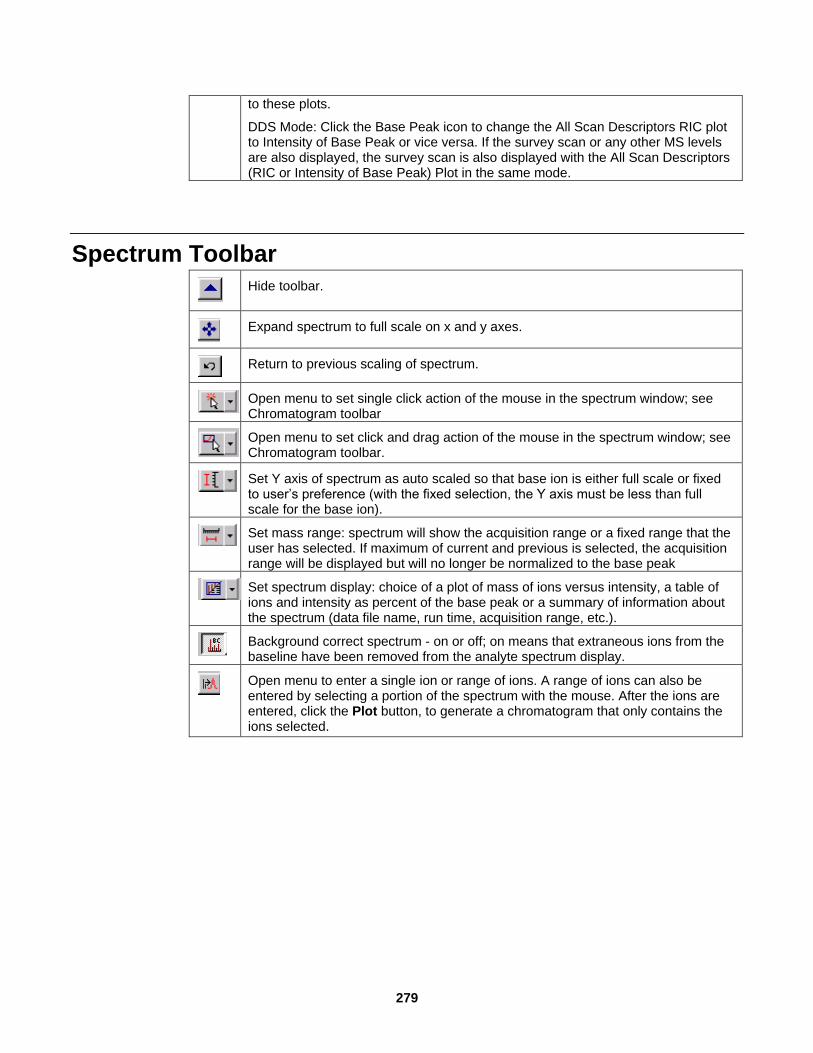
279
to these plots.
DDS Mode: Click the Base Peak icon to change the All Scan Descriptors RIC plot to Intensity of Base Peak or vice versa. If the survey scan or any other MS levels are also displayed, the survey scan is also displayed with the All Scan Descriptors (RIC or Intensity of Base Peak) Plot in the same mode.
Spectrum Toolbar
Hide toolbar.
Expand spectrum to full scale on x and y axes.
Return to previous scaling of spectrum.
Open menu to set single click action of the mouse in the spectrum window; see Chromatogram toolbar
Open menu to set click and drag action of the mouse in the spectrum window; see Chromatogram toolbar.
Set Y axis of spectrum as auto scaled so that base ion is either full scale or fixed to user‟s preference (with the fixed selection, the Y axis must be less than full scale for the base ion).
Set mass range: spectrum will show the acquisition range or a fixed range that the user has selected. If maximum of current and previous is selected, the acquisition range will be displayed but will no longer be normalized to the base peak
Set spectrum display: choice of a plot of mass of ions versus intensity, a table of ions and intensity as percent of the base peak or a summary of information about the spectrum (data file name, run time, acquisition range, etc.).
Background correct spectrum - on or off; on means that extraneous ions from the baseline have been removed from the analyte spectrum display.
Open menu to enter a single ion or range of ions. A range of ions can also be entered by selecting a portion of the spectrum with the mouse. After the ions are entered, click the Plot button, to generate a chromatogram that only contains the ions selected.

280
Shortcuts
Hot Keys Data Files Pane
Mouse Click - Replace data file
<Ctrl> + Click - Add data file
F5 - Update All Drives and Directories
Plot Descriptors Pane
Mouse Click - Replace descriptor
<Ctrl> + Click - Add descriptor
<Shift> + Click - Add range of descriptors
<Alt> + Click - Add descriptor to active chromatogram
Chromatogram Plot Control
Single-Click Actions
s - Display Spectrum
<ctrl> + s - Display Spectrum in Empty Plot Area if Available
l - Library Search Selected Spectrum
j - Target List Search Selected Spectrum
e - Export Selected Spectrum to Active Spectrum List
Left-Click/Right-Click Point/Spectrum Selection Override
a - Nearest Apex
t - Nearest Point
Click-And-Drag Actions
z - Zoom Chromatogram
w - Average Selected Spectra
n - Calculate Noise
r - Calculate Time Range
m - Move Chromatogram
i - Integrate Area
b - Export to Clipboard
d – TurboDDS Time Range
Double-Click Override
u - Only Auto Scale Vertical Scales
Keyboard Actions
left arrow - Previous Spectrum
down arrow - Previous Spectrum
right arrow - Next Spectrum
up arrow - Next Spectrum

281
Spectra Plot Control
Single-Click-Actions
l - Library Search Selected Spectrum
j - Target List Search Selected Spectrum
e - Export Selected Spectrum to Active Spectrum List
p - Create New Chromatogram Plot using Mass
........r – Enable Mass Ruler
Click-And-Drag Actions
z - Zoom Spectrum
p - Create New Chromatogram Plot using Mass Range
b - Export to Clipboard
r – Enable Mass Ruler
Mass Ruler Mass Selection Override
a – Highest m/z
t – Nearest m/z
Window Arrangement
c - Cascade
h - Tile Horizontally
v - Tile Vertically
Miscellaneous
F1 - Help
Results Codes Results View Study Pane
Compounds
S - Internal Standard Peak
R - Reference Peak
T - Relative Retention Peak
NA - Not Active
Data Files
IMF - Number of Identified, Missing, and Failed compounds
TUD - Number of Tentatively Identified, Unknown, and Duplicate
unknown peaks
Result Codes
R : Reference Peak.
# : Factors not updated.
* : Negative or imaginary result. Check calibration curve.
+ : More than one result. Check calibration curve.
V : Peak fails Verification.
M : Missing Peak.
C : Result out of Tolerance or Calibration Range.
S : Internal Standard Peak.

282
U : User-defined EndPoints.
O : Saturated Peak Amplitude.
T : Relative Retention Time Peak.
D : Can't quantitate. Reporting Raw Peak Size.
I : Can't create chromatogram. Check Channels, time range.
L : Missing Library or Search failed.
N : No internal stds found to quantitate Unknowns.
Q : Result < Compound Report Threshold.
H : Cali levels too low. Reporting Raw Peak Size.
W : Match < Threshold or not in Peak, or Peak not in Search Window.
Y : Peak not detected, < Size Threshold, or not in Search Window.
Z : Ion Ratio failed. Check Qualifier parameters.
F : Missing 1 or more sf channels. Quantitating available channels.
a : S/N less than threshold.
b : RRT out of tolerance.
e : Peak size < curve minimum. Check calibration curve.
f : Peak size > curve maximum. Check calibration curve.
g : No Calibration Data. Reporting Peak Size.
h : No Reference Peaks. Reporting Peak Size.
j : Internal Std Missing or Not Active. Reporting Peak Size.
l : Too many similar spectra. Search may be incomplete.
m : Too few points to quantitate. Check time range.
p : Peak < Size Threshold. Check Integration params.
Result Codes
BV : Baseline to Valley
BB : Baseline to baseline
MB : Mended end to baseline
VB : Valley to baseline
VV : Valley to valley
MM : Mended end to mended end
MV : Mended end to valley
TS : Separated tangent peaks
TF : Fused tangent peaks
GR : Group peak, post run calculation function
BM : Baseline to mended end
VM : Valley to mended end
HF : Horizontal forward
HB : Horizontal backward
HM : Horizontal minimum
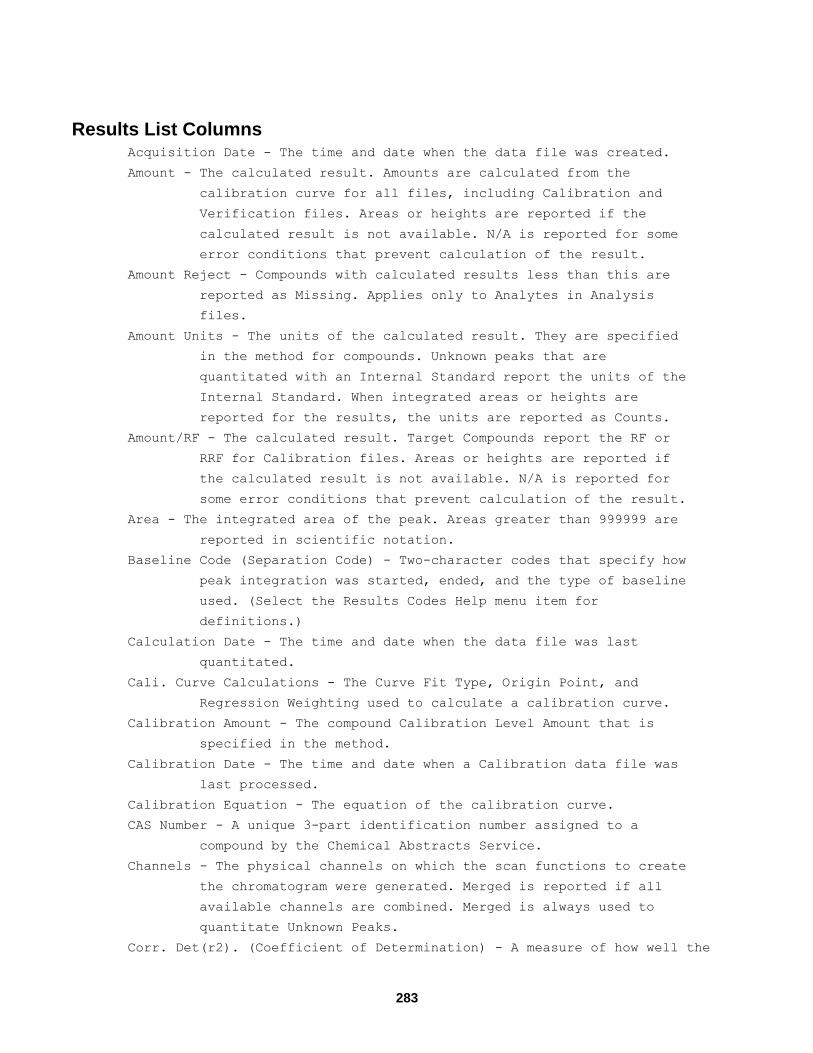
283
Results List Columns Acquisition Date - The time and date when the data file was created.
Amount - The calculated result. Amounts are calculated from the
calibration curve for all files, including Calibration and
Verification files. Areas or heights are reported if the
calculated result is not available. N/A is reported for some
error conditions that prevent calculation of the result.
Amount Reject - Compounds with calculated results less than this are
reported as Missing. Applies only to Analytes in Analysis
files.
Amount Units - The units of the calculated result. They are specified
in the method for compounds. Unknown peaks that are
quantitated with an Internal Standard report the units of the
Internal Standard. When integrated areas or heights are
reported for the results, the units are reported as Counts.
Amount/RF - The calculated result. Target Compounds report the RF or
RRF for Calibration files. Areas or heights are reported if
the calculated result is not available. N/A is reported for
some error conditions that prevent calculation of the result.
Area - The integrated area of the peak. Areas greater than 999999 are
reported in scientific notation.
Baseline Code (Separation Code) - Two-character codes that specify how
peak integration was started, ended, and the type of baseline
used. (Select the Results Codes Help menu item for
definitions.)
Calculation Date - The time and date when the data file was last
quantitated.
Cali. Curve Calculations - The Curve Fit Type, Origin Point, and
Regression Weighting used to calculate a calibration curve.
Calibration Amount - The compound Calibration Level Amount that is
specified in the method.
Calibration Date - The time and date when a Calibration data file was
last processed.
Calibration Equation - The equation of the calibration curve.
CAS Number - A unique 3-part identification number assigned to a
compound by the Chemical Abstracts Service.
Channels - The physical channels on which the scan functions to create
the chromatogram were generated. Merged is reported if all
available channels are combined. Merged is always used to
quantitate Unknown Peaks.
Corr. Det(r2). (Coefficient of Determination) - A measure of how well the

284
calibration points fit the calculated curve.
Data File - The name of the data file.
Delta RT (min) - The difference between the expected compound
retention time specified in the method and the actual
retention time of the result.
Dev % - Amount - The % Deviation of the Target Compound Amount
in a Calibration file, relative to the Calibration Level
Amount in the method.
Dev % - Curve - The % Deviation of the Target Compound Amount
in a Calibration file, relative to the calibration curve.
Divisor - A divisor factor specified in the recalc list that is
used to calculate Analysis and Verification results. The
Divisor can be edited in the Automation Editor.
Error - Single-character result codes that report problems which
occurred when the peak was processed. (Select the Results
Codes Help menu item for definitions.)
Expected RT (min) - The expected compound retention time that is
specified in the method.
F. Match - A measure of how well a sample spectrum is contained in a
library or reference spectrum.
Group Name - All compounds assigned to a method-specified group are
reported as a single summed result in addition to the
individual compound results.
Height - The baseline-corrected height of an integrated peak. Heights
greater than 999999 are reported in scientific notation.
In Lib Prob. - The probability that the reported match is in the
searched library. This applies only to Normal - Forward
searches of Unknown Peaks.
Ion Ratios - The ion ratio specifications and results for the
qualifier ions that have been specified for a compound.
Ion Time (usec) - The ionization time at the apex point of the peak.
Applies only to Ion Trap detectors.
IS % Dev - The % Deviation of the Internal Standard peak size from the
average of the Internal Standard sizes in all of the files.
IS Amount - The nominal amount of the Internal Standard used to
quantitate an Analyte as specified in the method.
IS Area - The integrated area of the Internal Standard peak used to
quantitate an Analyte.
IS Factor - A factor used to adjust the Internal Standard Calibration
Amount on a per-sample basis. Applies only to Analysis files.
The IS Factor can be edited in the Automation Editor.
IS Height - The baseline-corrected height of the Internal Standard
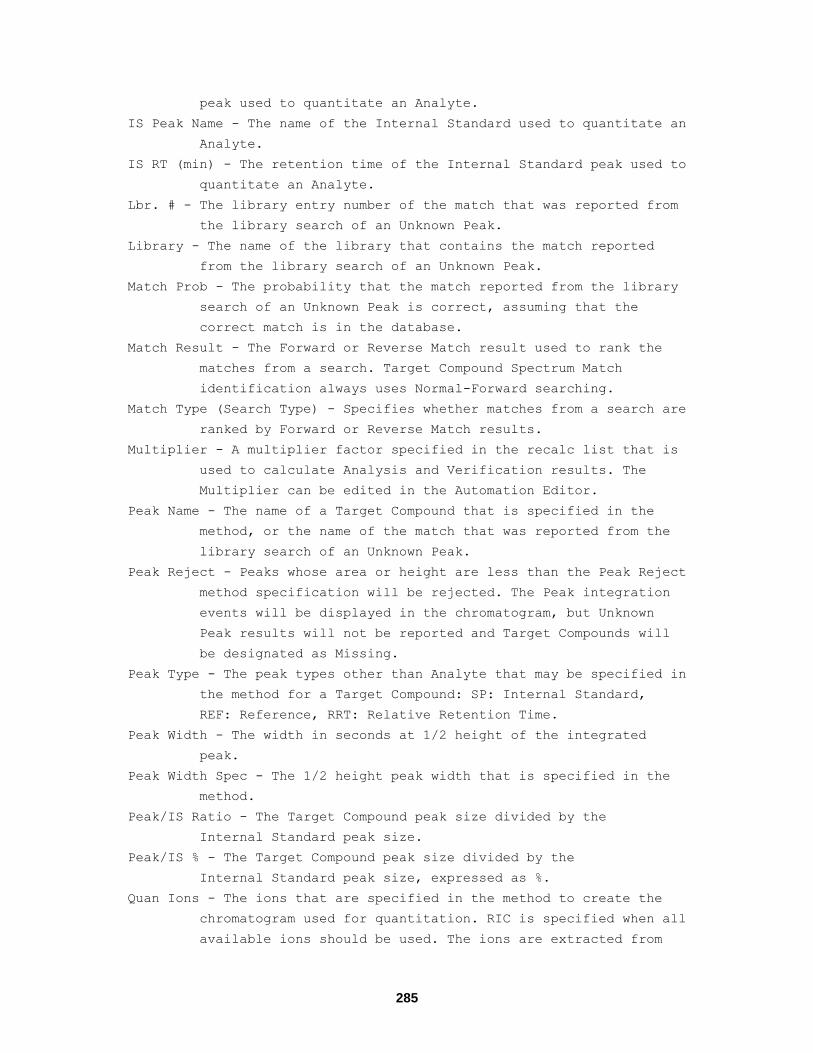
285
peak used to quantitate an Analyte.
IS Peak Name - The name of the Internal Standard used to quantitate an
Analyte.
IS RT (min) - The retention time of the Internal Standard peak used to
quantitate an Analyte.
Lbr. # - The library entry number of the match that was reported from
the library search of an Unknown Peak.
Library - The name of the library that contains the match reported
from the library search of an Unknown Peak.
Match Prob - The probability that the match reported from the library
search of an Unknown Peak is correct, assuming that the
correct match is in the database.
Match Result - The Forward or Reverse Match result used to rank the
matches from a search. Target Compound Spectrum Match
identification always uses Normal-Forward searching.
Match Type (Search Type) - Specifies whether matches from a search are
ranked by Forward or Reverse Match results.
Multiplier - A multiplier factor specified in the recalc list that is
used to calculate Analysis and Verification results. The
Multiplier can be edited in the Automation Editor.
Peak Name - The name of a Target Compound that is specified in the
method, or the name of the match that was reported from the
library search of an Unknown Peak.
Peak Reject - Peaks whose area or height are less than the Peak Reject
method specification will be rejected. The Peak integration
events will be displayed in the chromatogram, but Unknown
Peak results will not be reported and Target Compounds will
be designated as Missing.
Peak Type - The peak types other than Analyte that may be specified in
the method for a Target Compound: SP: Internal Standard,
REF: Reference, RRT: Relative Retention Time.
Peak Width - The width in seconds at 1/2 height of the integrated
peak.
Peak Width Spec - The 1/2 height peak width that is specified in the
method.
Peak/IS Ratio - The Target Compound peak size divided by the
Internal Standard peak size.
Peak/IS % - The Target Compound peak size divided by the
Internal Standard peak size, expressed as %.
Quan Ions - The ions that are specified in the method to create the
chromatogram used for quantitation. RIC is specified when all
available ions should be used. The ions are extracted from
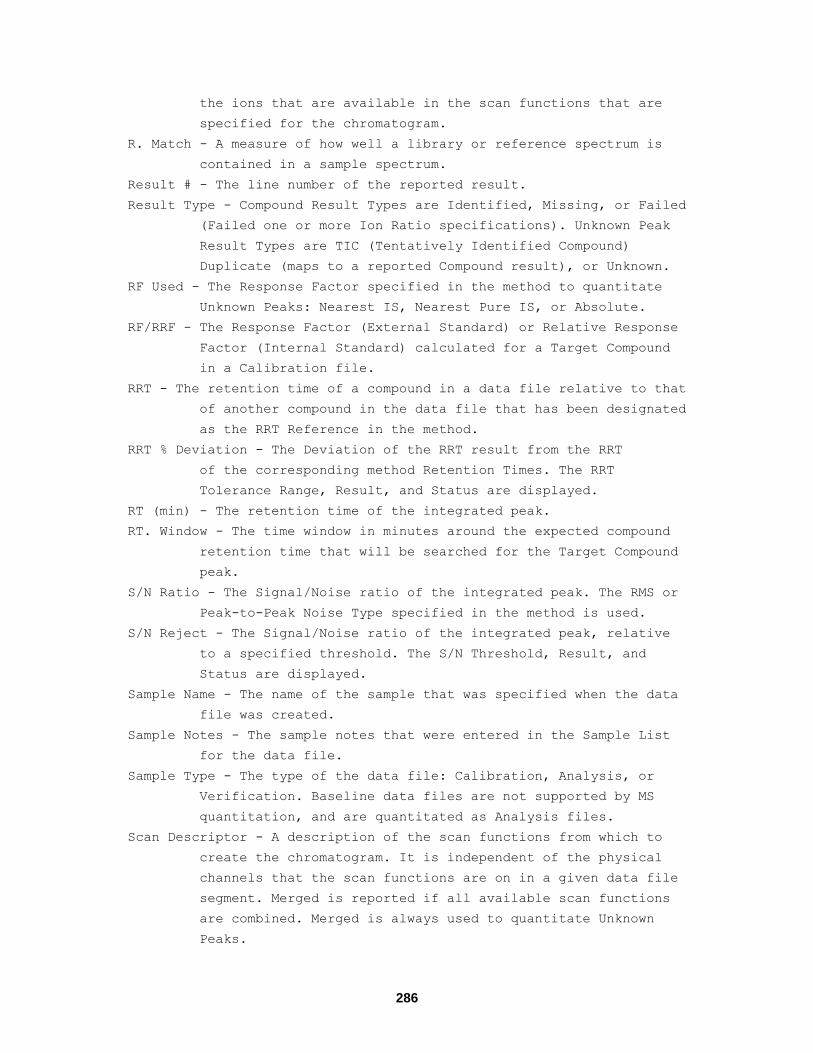
286
the ions that are available in the scan functions that are
specified for the chromatogram.
R. Match - A measure of how well a library or reference spectrum is
contained in a sample spectrum.
Result # - The line number of the reported result.
Result Type - Compound Result Types are Identified, Missing, or Failed
(Failed one or more Ion Ratio specifications). Unknown Peak
Result Types are TIC (Tentatively Identified Compound)
Duplicate (maps to a reported Compound result), or Unknown.
RF Used - The Response Factor specified in the method to quantitate
Unknown Peaks: Nearest IS, Nearest Pure IS, or Absolute.
RF/RRF - The Response Factor (External Standard) or Relative Response
Factor (Internal Standard) calculated for a Target Compound
in a Calibration file.
RRT - The retention time of a compound in a data file relative to that
of another compound in the data file that has been designated
as the RRT Reference in the method.
RRT % Deviation - The Deviation of the RRT result from the RRT
of the corresponding method Retention Times. The RRT
Tolerance Range, Result, and Status are displayed.
RT (min) - The retention time of the integrated peak.
RT. Window - The time window in minutes around the expected compound
retention time that will be searched for the Target Compound
peak.
S/N Ratio - The Signal/Noise ratio of the integrated peak. The RMS or
Peak-to-Peak Noise Type specified in the method is used.
S/N Reject - The Signal/Noise ratio of the integrated peak, relative
to a specified threshold. The S/N Threshold, Result, and
Status are displayed.
Sample Name - The name of the sample that was specified when the data
file was created.
Sample Notes - The sample notes that were entered in the Sample List
for the data file.
Sample Type - The type of the data file: Calibration, Analysis, or
Verification. Baseline data files are not supported by MS
quantitation, and are quantitated as Analysis files.
Scan Descriptor - A description of the scan functions from which to
create the chromatogram. It is independent of the physical
channels that the scan functions are on in a given data file
segment. Merged is reported if all available scan functions
are combined. Merged is always used to quantitate Unknown
Peaks.

287
Scan Number - The scan number of the apex point of the integrated
peak.
Search Type - The search type specified in the method to identify the
integrated peak. Target Compounds: Spectrum, Nearest,
Highest, First, or Last. Unknown Peaks: Library Search, or
None.
Slope Sensitivity (S/N) - A Peak Start is detected when the
chromatogram slope exceeds this threshold. The number of
points used to calculate the slope is determined by the data
rate and the specified Peak Width.
Status - Single character result codes that report status information
or problems which occurred when a peak was processed. Error
codes are a subset of the Status codes. (Select the Results
Codes Help menu item for definitions.)
Tangent % - Peaks on the trailing edge of a peak will be integrated as
tangent peaks if their heights are less than the specified
percent of the parent peak height.
Threshold - At least one match result must be equal to or greater than
this threshold for a Target Compound or an Unknown Peak to be
identified.
Top Match - The top match result that meets the Threshold
specification will be reported when an Unknown Peak is
library searched.
Top 2 Matches - The top 2 match results that meet the Threshold
specification will be reported when an Unknown Peak is
library searched.
Top 3 Matches - The top 3 match results that meet the Threshold
specification will be reported when an Unknown Peak is
library searched.