mrf ltd detailed report with dec09 results...
TRANSCRIPT

1
MRF Limited
BUY Target Price: Rs.6825.00
CMP: Rs.6040.00 Market Cap. : Rs.25609.60mn.
Date: January 22nd
, 2010
Key Ratios:
Particulars FY08
(12 m)
FY09E
(12 m)
FY10E
(12 m)
OPM (%) 13 13 13
NPM (%) 4 5 5
ROE (%) 19 18 17
ROCE (%) 19 19 18
P/BV(x) 1.88 1.54 1.28
P/E(x) 10.12 8.49 7.72
EV/EBDITA(x) 1.03 3.42 3.38
Debt-Equity ratio 0.78 0.70 0.64
Key Data:
Sector Auto Tyres
Face Value Rs.10.00
52 wk. High/Low Rs.6899.00/1501.00
Volume (2 wk. Avg.) 13082
BSE Code 500290
SYNOPSIS • MRF is India`s largest tyre manufacturer, having a 22%
market share. The company derives over 95% of its
revenues from its core business i.e. tyres, the rest comes
from its presence in toys and paints. This focus on tyres
has enabled it to constantly increase capacities, and
maintain market leadership and profitability in most
segments. MRF exports its products to over 75 countries.
• The company has already declared and paid two interim
dividends of Rs 3 each per share for the year, thus
aggregating to a total dividend of Rs 25 per share for
FY09.
• Credit rating agency, CARE has assigned a AA+ rating to
the Long-term Bank Facilities of MRF (MRF). This rating is
applicable for facilities having tenure of over one year.
• The company signed the memorandum of understanding
(MoU) with government of Tamil Nadu for the new MRF
plant to be located at Perambulur, Trichy and also for
expansion of its existing plants in Tamil Nadu. This will be
MRF`s third plant to be established in Tamil Nadu.
• MRF will invest Rs 1.25 billion in production facility of the
tyres the product is produced after three years of in
house research. The production will start at its Medak
facility in Andhra Pradesh.
• The company’s Net sales and PAT are expected to grow at
a CAGR of 11% and 32% over FY08 to FY11E.
Share Holding Pattern:
V.S.R. Sastry
Vice President
Equity Research Desk
91-22-25276077
Dr. V.V.L.N. Sastry Ph.D.
Chief Research Officer
2
Table of Content
Content Page No.
1. Investment Highlights 03
2. Peer Group Comparison 07
3. Key Concerns 07
4. Financials 08
5. Charts & Graph 10
6. Outlook and Conclusion 12
7. Industry Overview 13

3
Investment Highlights
• Result Updates (Q4FY09)
For the fourth quarter, the top line of the company increased 5%YoY and stood at
Rs.14768.40mn against Rs.14021.40mn of the same period of the last year. The bottom
line of the company for the quarter stood at Rs.969.40mn from Rs.-46.70mn of the
corresponding period of the previous year i.e., an increase of 2176%YoY.
EPS of the company for the quarter stood at Rs.228.63 for equity share of Rs.10.00 each.
4
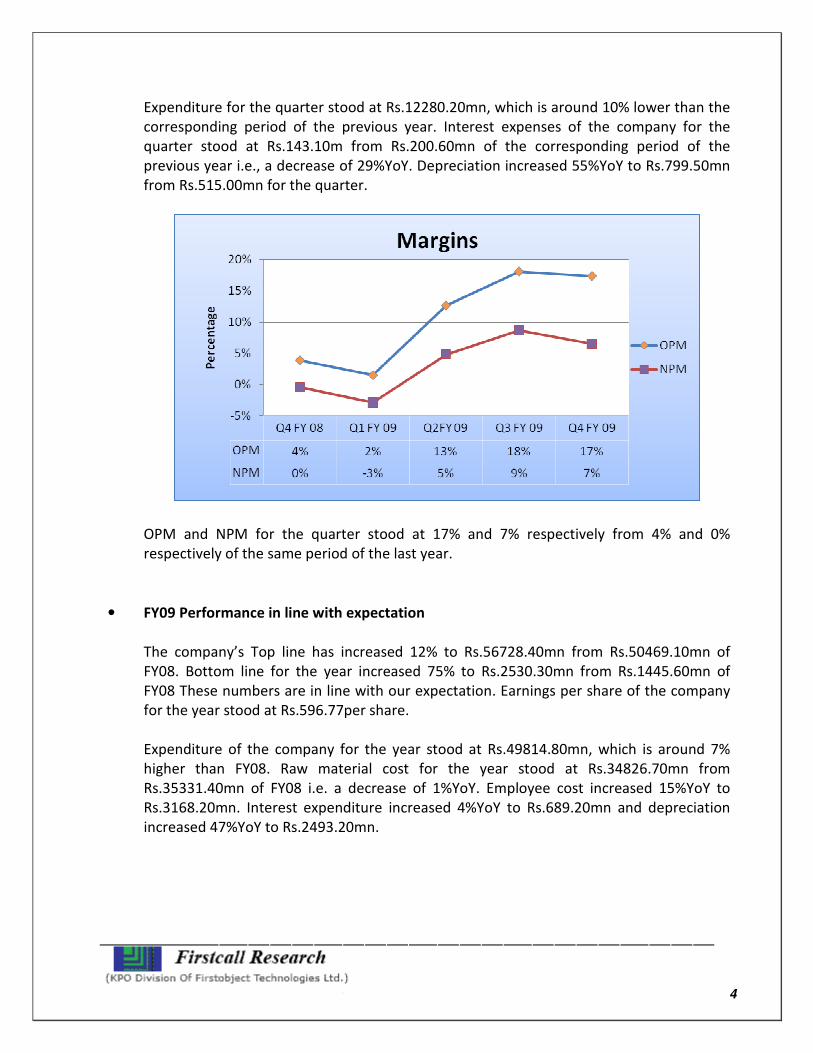
Expenditure for the quarter stood at Rs.12280.20mn, which is around 10% lower than the
corresponding period of the previous year. Interest expenses of the company for the
quarter stood at Rs.143.10m from Rs.200.60mn of the corresponding period of the
previous year i.e., a decrease of 29%YoY. Depreciation increased 55%YoY to Rs.799.50mn
from Rs.515.00mn for the quarter.
OPM and NPM for the quarter stood at 17% and 7% respectively from 4% and 0%
respectively of the same period of the last year.
• FY09 Performance in line with expectation
The company’s Top line has increased 12% to Rs.56728.40mn from Rs.50469.10mn of
FY08. Bottom line for the year increased 75% to Rs.2530.30mn from Rs.1445.60mn of
FY08 These numbers are in line with our expectation. Earnings per share of the company
for the year stood at Rs.596.77per share.
Expenditure of the company for the year stood at Rs.49814.80mn, which is around 7%
higher than FY08. Raw material cost for the year stood at Rs.34826.70mn from
Rs.35331.40mn of FY08 i.e. a decrease of 1%YoY. Employee cost increased 15%YoY to
Rs.3168.20mn. Interest expenditure increased 4%YoY to Rs.689.20mn and depreciation
increased 47%YoY to Rs.2493.20mn.

5
• Recommended a final dividend
The board of directors of the company has recommended a final dividend of Rs 19 per
share on the paid-up capital as at September 30, 2009.
The company has already declared and paid two interim dividends of Rs 3 each per share
for the above year, thus aggregating to a total dividend of Rs 25 per share for the year.
• Care assigns `AA+` & `PR+` ratings to MRF
Credit rating agency, CARE has assigned a AA+ rating to the Long-term Bank Facilities of
MRF (MRF). This rating is applicable for facilities having tenure of over one year.
Facilities with this rating are considered to offer high safety for timely servicing of debt
obligations and with this rating would have strong capacity for timely payment of short-
term debt obligations and carry lowest credit risk. Also, CARE has assigned PR1+ rating to
the Short-term Bank Facilities of the company. The above ratings are assigned for an
aggregate amount of Rs 8,450 million. CARE assigns `+` or `-` signs after the assigned
rating (wherever necessary) to indicate the relative position within the band covered by
the rating symbol.
Facility Amount (Rs million) Rating
Fund Based facilities 5600 AA+
Non-Fund based facilities 2850 PR1+
Total 8450

6
CARE has also assigned a PR1+ rating to the Rs.2 billion Commercial Paper Programme of
MRF. Instruments with this rating would have strong capacity for timely payment of short-
term debt obligations and carry lowest credit risk. The CP issue would have a maximum
maturity of 364 days and would be carved out of the working capital limits of the
company.
Rating Rationale
The ratings factor in the long operational track record of the company, its market
leadership position in the Indian Tyre industry with diverse product offerings, strong
brand image and wide distribution network, healthy growth in income and strong cash
accruals in the past and comfortable liquidity position. The ratings are constrained by the
low profitability margins, volatility in raw material prices which led to losses in Sep`08 and
Dec`08 quarters, not so favorable industry scenario consequent to the slowdown in
economic growth and the intensely competitive nature of the industry.
• Signing of ‘MOU’
The company signed the memorandum of understanding (MoU) with government of
Tamil Nadu for the new MRF plant to be located at Perambulur, Trichy and also for
expansion of its existing plants in Tamil Nadu. This will be MRF`s third plant to be
established in Tamil Nadu. The other factories in Tamil Nadu are located at Tiruvottiyur
and Arakonam. MRF is acquiring nearly 290 acres of land for its new facility in Perambulur.
• MRF to foray into aviation tyres
The company has announced entry in production of aviation tyres. The company will
invest Rs 1.25 billion in production facility of the tyres the product is produced after three
years of in house research. The production will start at its Medak facility in Andhra
Pradesh.
The company has announced its foray into the aviation tyre space with the unveiling of
Aero Muscle, a product born out of in-house research and perfected over the last three
years. The tyres were subjected to ground and flight trials. Upon completion of these,
MRF had been given provisional certificate for the commercial production of the approved
prototype aviation tyre. Tyres were approved for Chetak helicopters the Centre for
Military Airworthiness Certification and the Regional Centre for Military Airworthiness.
The company will also try to sell the tyres to private aviation company. This step according
to the company will help India by achieving self-sufficiency in such an import-substitute
product is always good for the country.

7
Peer Group Comparison
Name of the
company
CMP(Rs.)
(As on
January
22nd
, 2010)
Market Cap.
(Rs. Mn.)
EPS
(Rs.)
P/E (x) P/BV
(x)
Dividend
(%)
MRF 6040.00 25609.60 596.61 10.13 1.87 200.00
Apollo Tyres ltd 53.80 27116.50 4.93 10.91 2.00 45.00
Goodyear India 187.20 4318.10 26.90 6.96 2.74 60.00
Balakrishna
industries 543.70 10510.70 70.68 7.69 2.25 60.00
Key Concerns
� Recession in global economy
� Fluctuations in exchange rates
� High competition from global players
� Adverse Govt. policies

8
Financials Results Update
12 months ended Profit and Loss A/C (Standalone):
Value(Rs in million) FY08A FY09A FY10E FY11E
Description 12m 12m 12m 12m
Net Sales 50469.10 56728.40 62401.24 68641.36
Other Income 362.60 253.60 278.96 306.86
Total Income 50831.70 56982.00 62680.20 68948.22
Expenditure -46360.10 -49814.80 -54289.08 -59717.99
Operating Profit 4471.60 7167.20 8391.12 9230.23
Interest -662.50 -689.20 -756.76 -832.44
Gross Profit 3809.10 6478.00 7634.36 8397.79
Depreciation -1695.20 -2493.20 -2991.84 -3291.02
Profit before Tax 2113.90 3984.80 4642.52 5106.77
Tax -668.30 -1454.50 -1624.88 -1787.37
Net Profit 1445.60 2530.30 3017.64 3319.40
Equity Capital 42.40 42.40 42.40 42.40
Reserves 11165.50 13571.80 16589.44 19908.84
Face Value 10.00 10.00 10.00 10.00
Total No. of Shares 4.24 4.24 4.24 4.24
EPS 340.94 596.77 711.71 782.88
� Year ending September.

9
Quarterly ended Profit and Loss A/C (Standalone):
Value(Rs. in million) 31-Mar-08 30-Jun-09 30-Sep-09 31-Dec-09E
Description 3m 3m 3m 3m
Net Sales 14058.20 14382.10 14768.40 15211.45
Other Income 43.90 87.90 81.20 82.82
Total Income 14102.10 14470.00 14849.60 15294.28
Expenditure -12317.80 -11867.90 -12280.20 -12777.62
Operating Profit 1784.30 2602.10 2569.40 2516.66
Interest -202.80 -115.40 -143.10 -150.26
Gross Profit 1581.50 2486.70 2426.30 2366.40
Depreciation -550.80 -606.10 -799.50 -831.48
Profit before Tax 1030.70 1880.60 1626.80 1534.92
Tax -343.80 -623.60 -657.40 -537.22
Net Profit 686.90 1257.00 969.40 997.70
Equity Capital 42.40 42.40 42.40 42.40
Face Value 10.00 10.00 10.00 10.00
Total No. of Shares 4.24 4.24 4.24 4.24
EPS 162.00 296.46 228.63 235.31

10
Charts
• Net sales & PAT
• P/E Ratio (x)

11
• P/BV (X)
• EV/EBITDA(X)
12
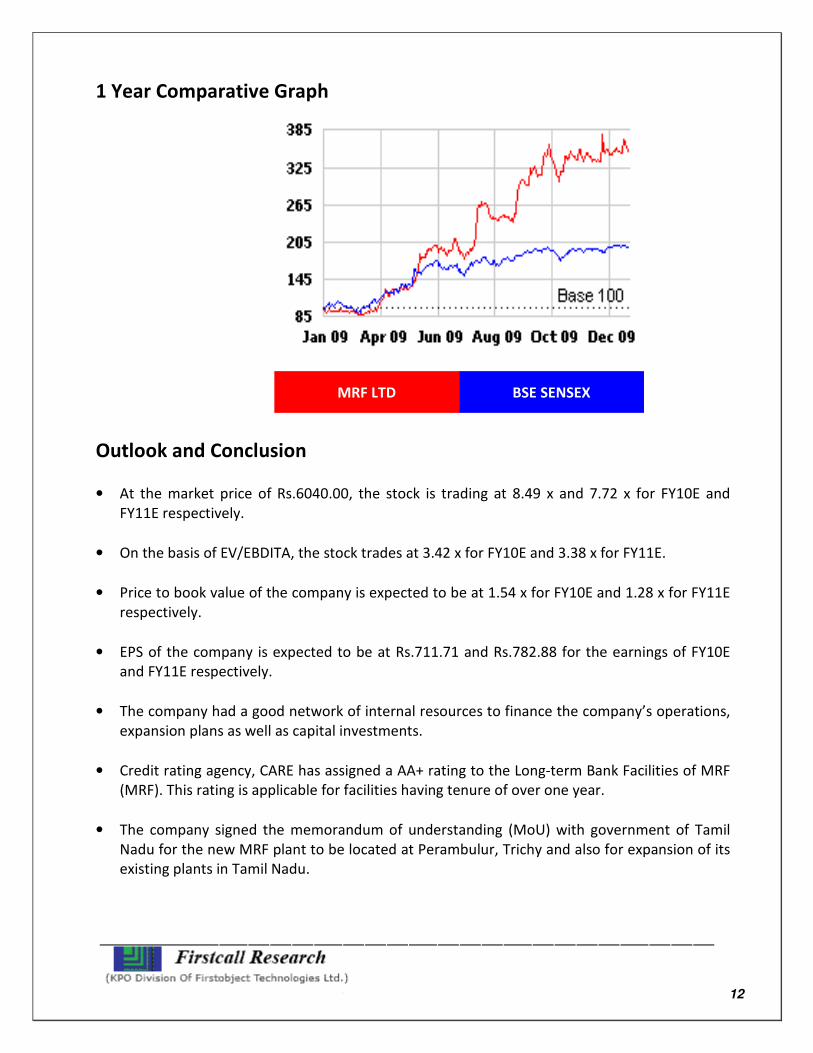
1 Year Comparative Graph
Outlook and Conclusion
• At the market price of Rs.6040.00, the stock is trading at 8.49 x and 7.72 x for FY10E and
FY11E respectively.
• On the basis of EV/EBDITA, the stock trades at 3.42 x for FY10E and 3.38 x for FY11E.
• Price to book value of the company is expected to be at 1.54 x for FY10E and 1.28 x for FY11E
respectively.
• EPS of the company is expected to be at Rs.711.71 and Rs.782.88 for the earnings of FY10E
and FY11E respectively.
• The company had a good network of internal resources to finance the company’s operations,
expansion plans as well as capital investments.
• Credit rating agency, CARE has assigned a AA+ rating to the Long-term Bank Facilities of MRF
(MRF). This rating is applicable for facilities having tenure of over one year.
• The company signed the memorandum of understanding (MoU) with government of Tamil
Nadu for the new MRF plant to be located at Perambulur, Trichy and also for expansion of its
existing plants in Tamil Nadu.
MRF LTD BSE SENSEX

13
• MRF will invest Rs 1.25 billion in production facility of the tyres the product is produced after
three years of in house research. The production will start at its Medak facility in Andhra
Pradesh.
• We recommend ‘BUY’ with a target price of Rs.6825.00 for long term.
Industry Overview
• Demand for tyres is derived from demand for automobiles. Therefore it is a ‘derived
demand’ product and its fortunes are very closely linked to those of the auto segment.
Within the tyre industry the trucks and buses (T&B) segment accounts for more than 70%
of sales. Though scooters and motorcycle tyre demand also plays a vital role, in value
terms, CVs gain significance.
• Tyre varieties can be divided into two categories – cross ply and radial. The domestic
industry is dominated by cross-ply tyres, due to the poor conditions of roads in the
country and overloading of CVs. This is also the reason why penetration of radial tyres in
the CV segment is negligible and finds presence only in the passenger car segment. On the
other hand, radial tyres dominate western markets. Radial tyres can be differentiated on
the type of belt used – fiberglass, steel and nylon. Worldwide, steel belted radials are
more popular due to their performance advantage.
• There are three major consumer segments for tyres namely replacement segment,
Original Equipment Manufacturers (OEMs) and exports. Though fortunes of the sector are
closely tied with the automobile industry, replacement demand continues to remain the
key growth driver. Replacement demand accounts for as high as 57% of industry volumes.
However, the contribution from OEM and replacement segments varies across sub-
segments in the auto sector. For instance, for the passenger car segment, demand is
balanced from replacement and OEM categories i.e. 50:50.
14
• Another key transition that is taking place in the industry is the entry of multinationals like
Good Year, Bridgestone and Michelin in the domestic market. MNC tyre makers have
cornered a higher market share in India in the last three years due to their international
relationships apart from superior technology. Since Honda, Hyundai and Toyota have an
international sourcing agreement with Bridgestone; it is also the preferred supplier in
India. Goodyear is believed to be the preferred supplier for Ford India.
• An extensive distribution network and strong brand recall are factors critical to tyre sales.
Brand building is given a lot of importance by manufacturers, who allot 2-3% of sales to
advertising. With the introduction of radial tyres, even technology has assumed
significance. All foreign cars introduced in the country are on radial tyres.
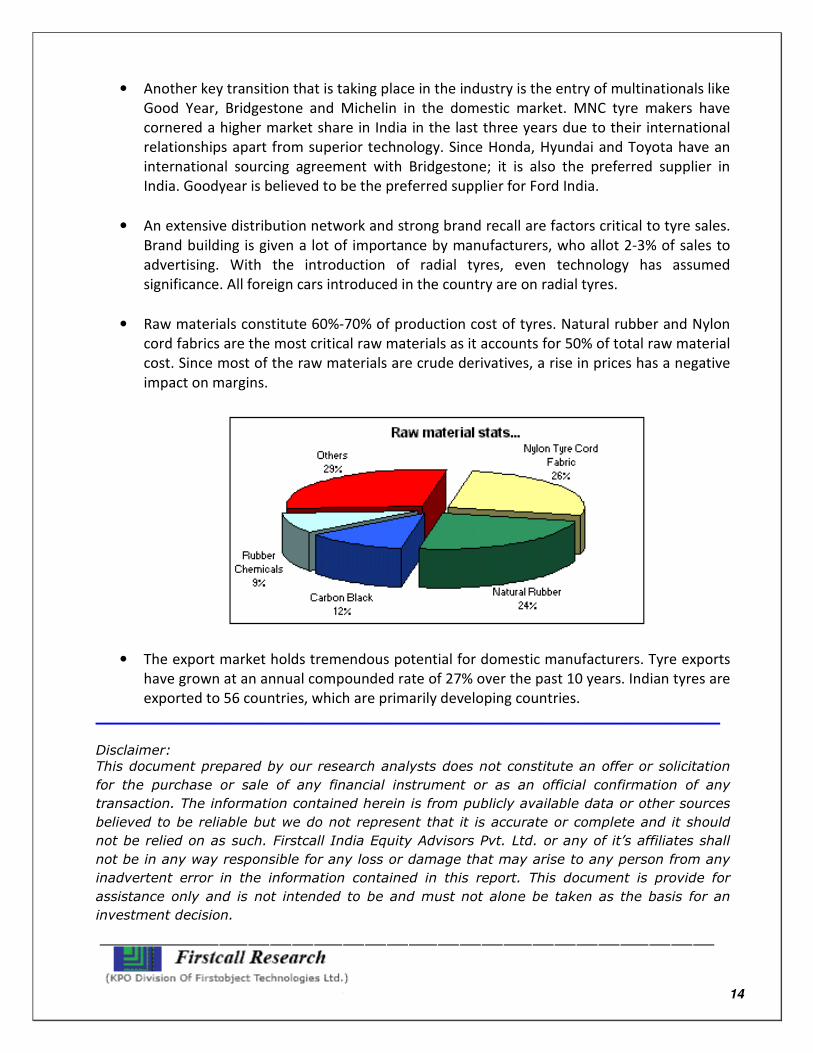
• Raw materials constitute 60%-70% of production cost of tyres. Natural rubber and Nylon
cord fabrics are the most critical raw materials as it accounts for 50% of total raw material
cost. Since most of the raw materials are crude derivatives, a rise in prices has a negative
impact on margins.
• The export market holds tremendous potential for domestic manufacturers. Tyre exports
have grown at an annual compounded rate of 27% over the past 10 years. Indian tyres are
exported to 56 countries, which are primarily developing countries.
____________________________________________________________
Disclaimer:
This document prepared by our research analysts does not constitute an offer or solicitation
for the purchase or sale of any financial instrument or as an official confirmation of any
transaction. The information contained herein is from publicly available data or other sources
believed to be reliable but we do not represent that it is accurate or complete and it should
not be relied on as such. Firstcall India Equity Advisors Pvt. Ltd. or any of it’s affiliates shall
not be in any way responsible for any loss or damage that may arise to any person from any
inadvertent error in the information contained in this report. This document is provide for
assistance only and is not intended to be and must not alone be taken as the basis for an
investment decision.

15
Firstcall India Equity Research: Email – [email protected]
B. Harikrishna Banking
B. Prathap IT
A. Rajesh Babu FMCG
C.V.S.L.Kameswari Pharma
U. Janaki Rao Capital Goods
E. Swethalatha Oil & Gas
D. Ashakirankumar Automobile
Rachna Twari Diversified
Kavita Singh Diversified
Nimesh Gada Diversified
Priya Shetty Diversified
Tarang Pawar Diversified
Neelam Dubey Diversified
Firstcall India also provides
Firstcall India Equity Advisors Pvt.Ltd focuses on, IPO’s, QIP’s, F.P.O’s, Takeover
Offers, Offer for Sale and Buy Back Offerings.
Corporate Finance Offerings include Foreign Currency Loan Syndications,
Placement of Equity / Debt with multilateral organizations, Short Term Funds
Management Debt & Equity, Working Capital Limits, Equity & Debt
Syndications and Structured Deals.
Corporate Advisory Offerings include Mergers & Acquisitions (domestic and
cross-border), divestitures, spin-offs, valuation of business, corporate
Restructuring-Capital and Debt, Turnkey Corporate Revival – Planning &
Execution, Project Financing, Venture capital, Private Equity and Financial
Joint Ventures
Firstcall India also provides Financial Advisory services with respect to raising
of capital through FCCBs, GDRs, ADRs and listing of the same on International
Stock Exchanges namely AIMs, Luxembourg, Singapore Stock Exchanges and
other international stock exchanges.
For Further Details Contact:
3rd Floor, Sankalp, The Bureau, Dr.R.C.Marg, Chembur, Mumbai 400 071
Tel.: 022-2527 2510/2527 6077/25276089 Telefax: 022-25276089
E-mail: [email protected]
www.firstcallindiaequity.com