mq5: investment by insurance companies, pension funds … · page 2 of 39 1 . main points total net...
TRANSCRIPT
Page 1 of 39
Next release: 22 March 2018
Release date: 14 December 2017
Contact: Fred Norris [email protected] +44 (0)1633 456109
Statistical bulletin
MQ5: Investment by insurance companies, pension funds and trusts: July to September 2017Investment choices of financial institutions based on financial transactions (investments and disinvestments), including balance sheet data for short-term assets and liabilities, and income and expenditure data.
Table of contents
1. Main points
2. Things you need to know about this release
3. Net investment by asset type
4. Net investment by institutional group
5. Income and expenditure by institutional group
6. Holdings at market values
7. Accessing MQ5 data
8. Revisions
9. Response rates
10. Quality and methodology
Page 2 of 39
1 . Main points
Total net investment by insurance companies, pension funds and trusts is estimated at £25 billion in Quarter 3 (July to Sept) of 2017; this was the third consecutive quarter of net investment. In terms of context, the five-year quarterly average for this series is net investment of £9 billion.
In 2016, the annual estimate of net disinvestment (£6 billion) by these businesses was the first year of net disinvestment since the start of this series in 1987.
The net investment of £4 billion in other assets (mainly mutual funds) by unit trusts and property unit trusts in Quarter 3 2017, was the largest since the start of this series in 1987.
The 2016 estimate of net investment of £38 billion in gilts (UK government bonds) was the largest since the start of this series in 1984.
In 2016, the estimates of net disinvestment of £27 billion in overseas ordinary shares and of £5 billion other overseas securities were the largest for both of these series since records began in 1986.
This release reports on these institutions’ balance sheets at the end of 2016; total assets were valued at £4,188 billion, compared with £3,696 billion at the end of 2015. This annual increase of 13% was the largest since 2005, when it grew by 16%.
2 . Things you need to know about this release
This publication considers the investment choices of insurance companies, self-administered pension funds, investment trusts, unit trusts and property unit trusts. Before viewing the MQ5 publication, it is recommended that readers familiarise themselves with the covered within.institutional groups
These institutions control £4 trillion of assets and engage in considerable volumes of investment activity to fund their operations. An understanding of their investments and assets is important to monitor the stability of the financial sector and is used in the compilation of the UK National Accounts.
The MQ5 release includes quarterly net investment data arising from financial transactions (investments) made by these institutions. Also included are quarterly balance sheet data for short-term assets and liabilities, plus quarterly income and expenditure data for insurance companies and self-administered pension funds. All data are reported at current prices (effects of price changes included).
We make every effort to provide informative commentary on the data in this release. As part of the quality assurance process, individual businesses are contacted in an attempt to capture reasons for extreme period-on-period data movements. It can prove difficult to elicit detailed reasons from some businesses to help inform the commentary. Frequently, reasons given for data movements refer to a “change in investment strategy” or a “fund manager’s decision”. Consequently, it is not possible for all data movements to be fully explained.
This release contains final estimates for 2016 for the first time, based on these institutions’ balance sheets at the end of 2016, the latest period for which annual results are available.
Data for Quarter 1 (Jan to Mar) 2017 onwards remain provisional and subject to revision until the incorporation of the 2017 annual survey results in December 2018 (see section 8 Revisions).
It is sometimes necessary to suppress figures for certain items to avoid disclosing investment activity by individual institutions. In these cases the figures are usually combined with those for another item and this will be indicated in the tables by means of a footnote.

Page 3 of 39
All estimates are reported on a current price basis (that is they are not adjusted to remove the effects of inflation).
A is available to assist your understanding of the terms used in this release.Glossary
3 . Net investment by asset type
During 2016, these businesses acquired £1,666 billion and disposed of £1,641 billion longer-term financial instruments. Net investment is the difference between acquisitions and disposals of longer-term assets, as well as changes in holdings of short-term assets, and can therefore be volatile. Table 1 (at the end of this section) displays net investment data by asset type.
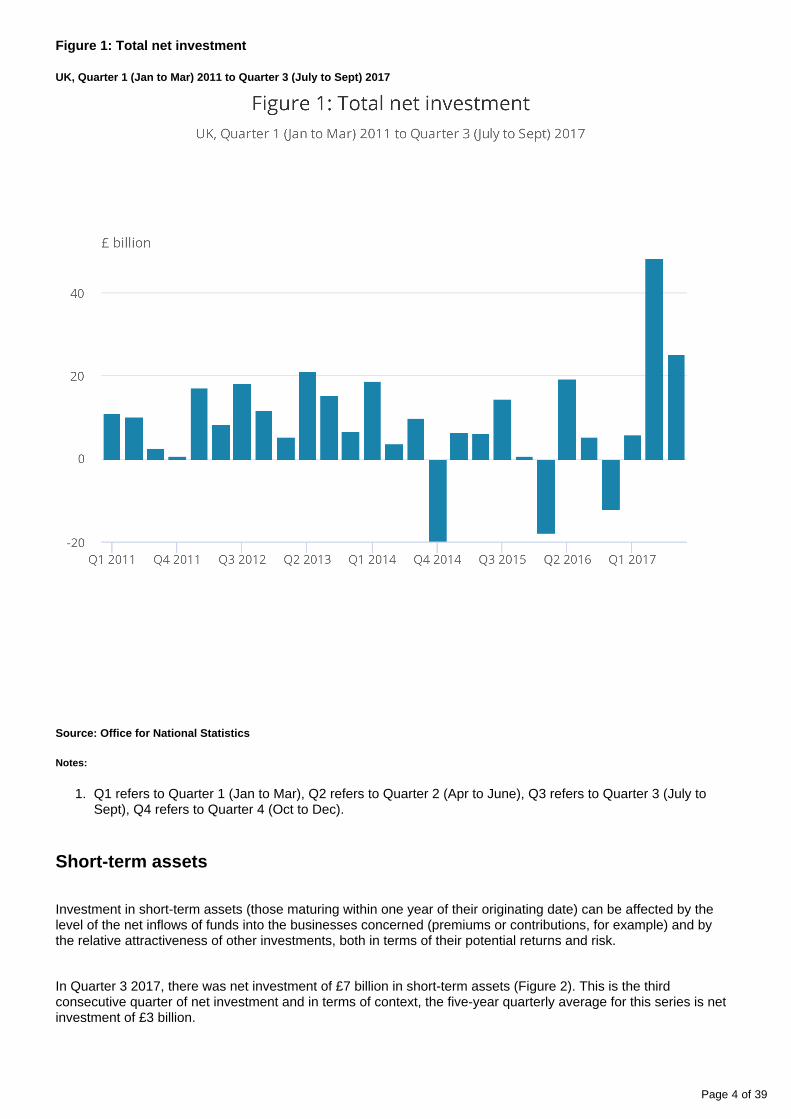
In Quarter 3 (July to Sept) 2017, there was net investment of £25 billion (Figure 1). The five-year quarterly average for this series is net investment of £9 billion. Net investment was reported in UK government sterling securities, short-term assets, UK corporate securities, other assets and overseas securities.
Net investment or net disinvestment varies across the quarters of a calendar year and so an increase or decrease in investment from one quarter to the next is not necessarily an indicator of improved or worsening economic activity. A better gauge of investor activity is the composition of investment between types of instruments over a number of quarters, which is more likely to reflect varying investment strategies.
For 2016 as a whole, the institutions covered in this release reported net disinvestment of £6 billion. This was the first year of overall disinvestment since the start of this time series in 1987 and was caused mainly by net disinvestment in overseas securities (£32 billion) and UK corporate securities (£17 billion), partly offset by net investment of £38 billion in UK government sterling securities (gilts).
Page 4 of 39
1.
Figure 1: Total net investment
UK, Quarter 1 (Jan to Mar) 2011 to Quarter 3 (July to Sept) 2017
Source: Office for National Statistics
Notes:
Q1 refers to Quarter 1 (Jan to Mar), Q2 refers to Quarter 2 (Apr to June), Q3 refers to Quarter 3 (July to Sept), Q4 refers to Quarter 4 (Oct to Dec).
Short-term assets
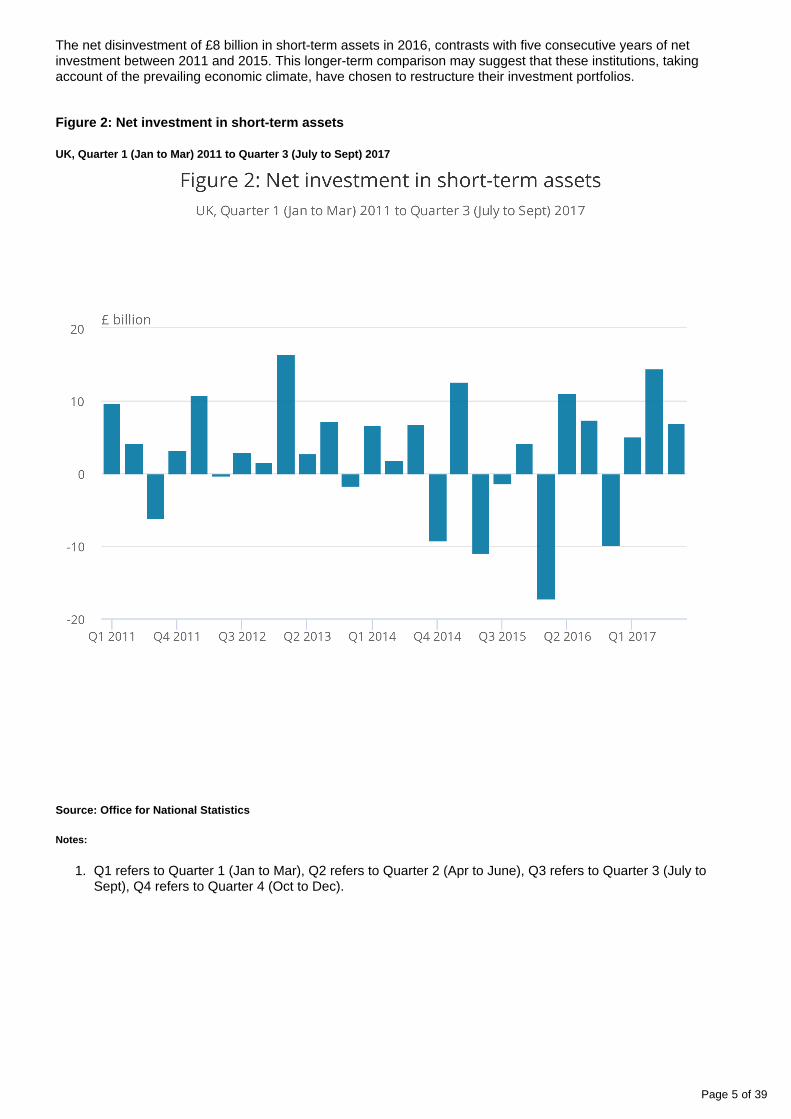
Investment in short-term assets (those maturing within one year of their originating date) can be affected by the level of the net inflows of funds into the businesses concerned (premiums or contributions, for example) and by the relative attractiveness of other investments, both in terms of their potential returns and risk.
In Quarter 3 2017, there was net investment of £7 billion in short-term assets (Figure 2). This is the third consecutive quarter of net investment and in terms of context, the five-year quarterly average for this series is net investment of £3 billion.
Page 5 of 39
1.
The net disinvestment of £8 billion in short-term assets in 2016, contrasts with five consecutive years of net investment between 2011 and 2015. This longer-term comparison may suggest that these institutions, taking account of the prevailing economic climate, have chosen to restructure their investment portfolios.
Figure 2: Net investment in short-term assets
UK, Quarter 1 (Jan to Mar) 2011 to Quarter 3 (July to Sept) 2017
Source: Office for National Statistics
Notes:
Q1 refers to Quarter 1 (Jan to Mar), Q2 refers to Quarter 2 (Apr to June), Q3 refers to Quarter 3 (July to Sept), Q4 refers to Quarter 4 (Oct to Dec).
Page 6 of 39
UK government sterling securities (gilts)
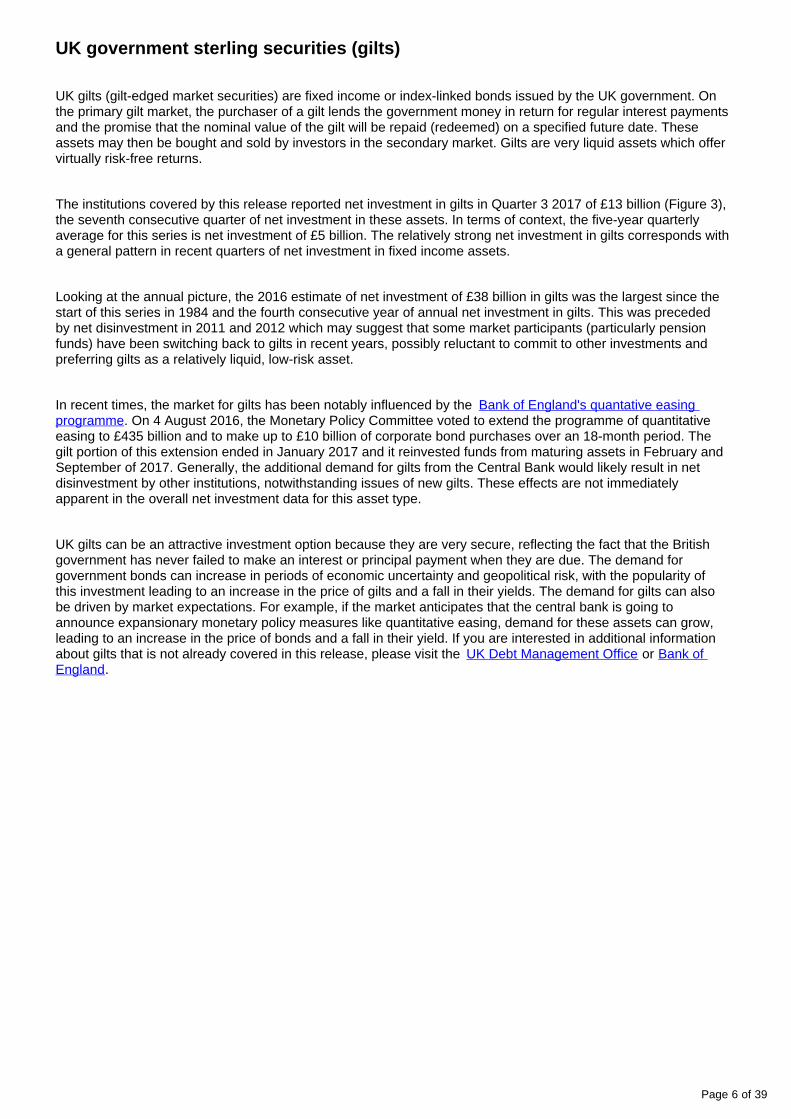
UK gilts (gilt-edged market securities) are fixed income or index-linked bonds issued by the UK government. On the primary gilt market, the purchaser of a gilt lends the government money in return for regular interest payments and the promise that the nominal value of the gilt will be repaid (redeemed) on a specified future date. These assets may then be bought and sold by investors in the secondary market. Gilts are very liquid assets which offer virtually risk-free returns.
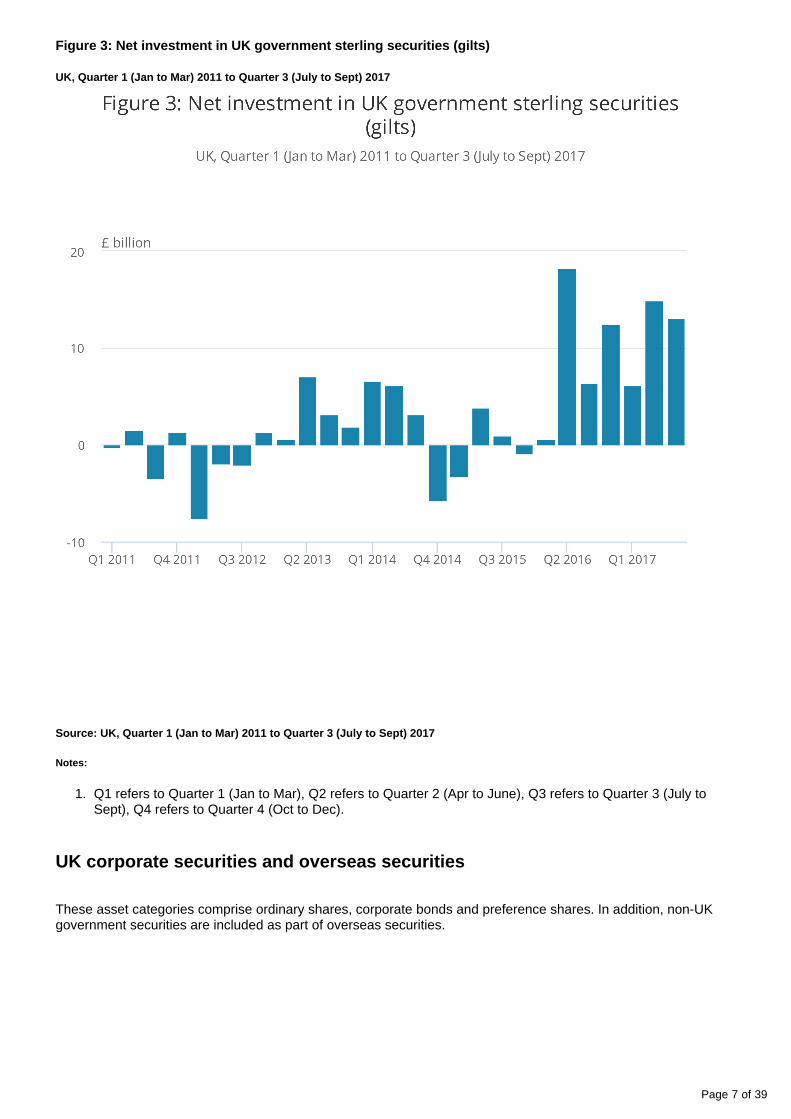
The institutions covered by this release reported net investment in gilts in Quarter 3 2017 of £13 billion (Figure 3), the seventh consecutive quarter of net investment in these assets. In terms of context, the five-year quarterly average for this series is net investment of £5 billion. The relatively strong net investment in gilts corresponds with a general pattern in recent quarters of net investment in fixed income assets.
Looking at the annual picture, the 2016 estimate of net investment of £38 billion in gilts was the largest since the start of this series in 1984 and the fourth consecutive year of annual net investment in gilts. This was preceded by net disinvestment in 2011 and 2012 which may suggest that some market participants (particularly pension funds) have been switching back to gilts in recent years, possibly reluctant to commit to other investments and preferring gilts as a relatively liquid, low-risk asset.
In recent times, the market for gilts has been notably influenced by the Bank of England's quantative easing . On 4 August 2016, the Monetary Policy Committee voted to extend the programme of quantitative programme
easing to £435 billion and to make up to £10 billion of corporate bond purchases over an 18-month period. The gilt portion of this extension ended in January 2017 and it reinvested funds from maturing assets in February and September of 2017. Generally, the additional demand for gilts from the Central Bank would likely result in net disinvestment by other institutions, notwithstanding issues of new gilts. These effects are not immediately apparent in the overall net investment data for this asset type.
UK gilts can be an attractive investment option because they are very secure, reflecting the fact that the British government has never failed to make an interest or principal payment when they are due. The demand for government bonds can increase in periods of economic uncertainty and geopolitical risk, with the popularity of this investment leading to an increase in the price of gilts and a fall in their yields. The demand for gilts can also be driven by market expectations. For example, if the market anticipates that the central bank is going to announce expansionary monetary policy measures like quantitative easing, demand for these assets can grow, leading to an increase in the price of bonds and a fall in their yield. If you are interested in additional information about gilts that is not already covered in this release, please visit the or UK Debt Management Office Bank of
.England
Page 7 of 39
1.
Figure 3: Net investment in UK government sterling securities (gilts)
UK, Quarter 1 (Jan to Mar) 2011 to Quarter 3 (July to Sept) 2017
Source: UK, Quarter 1 (Jan to Mar) 2011 to Quarter 3 (July to Sept) 2017
Notes:
Q1 refers to Quarter 1 (Jan to Mar), Q2 refers to Quarter 2 (Apr to June), Q3 refers to Quarter 3 (July to Sept), Q4 refers to Quarter 4 (Oct to Dec).
UK corporate securities and overseas securities
These asset categories comprise ordinary shares, corporate bonds and preference shares. In addition, non-UK government securities are included as part of overseas securities.

Page 8 of 39
1.
UK corporate securities
In Quarter 3 2017 there was net investment of £2 billion in UK corporate securities (Figure 4). This was the first quarter of net investment for this series since the third quarter of 2015 (£2 billion) and was caused mainly by net investment of £3 billion in other UK corporate securities (corporate bonds and preference shares).
In terms of context, the five-year quarterly average for this series is net disinvestment of £5 billion.
Figure 4: Net investment in UK corporate securities
UK, Quarter 1 (Jan to Mar) 2011 to Quarter 3 (July to Sept) 2017
Source: Office for National Statistics
Notes:
Q1 refers to Quarter 1 (Jan to Mar), Q2 refers to Quarter 2 (Apr to June), Q3 refers to Quarter 3 (July to Sept), Q4 refers to Quarter 4 (Oct to Dec).

Page 9 of 39
Overseas securities
In Quarter 3 2017, there was net investment of £0.2 billion (Figure 5) in overseas securities, following net investment of £15 billion in Quarter 2 (Apr to June) 2017. This was caused mainly by net investment of £11 billion by unit trusts and property unit trusts, offset in part by net disinvestment by self-administered pension funds (£6 billion) and long-term insurance companies (£5 billion).
In terms of context, the five-year quarterly average for this series is net investment of £1 billion.
The 2016 estimate of net disinvestment in overseas securities (£32 billion) was the largest since the start of this series in 1986. This was mainly due to record levels of net disinvestment in overseas ordinary shares (£27 billion) and other overseas securities (mainly corporate bonds and preference shares) of £5 billion. This may indicate that these businesses saw overseas equities to be a relatively unattractive investment option, possibly due to uncertainty and declining value of the pound over the course of 2016, making overseas investments more expensive. Also perhaps businesses holding assets in foreign currency chose to take profit by disinvesting.

Page 10 of 39
1.
Figure 5: Net investment in overseas securities
UK, Quarter 1 (Jan to Mar) 2011 to Quarter 3 (July to Sept) 2017
Source: Office for National Statistics
Notes:
Q1 refers to Quarter 1 (Jan to Mar), Q2 refers to Quarter 2 (Apr to June), Q3 refers to Quarter 3 (July to Sept), Q4 refers to Quarter 4 (Oct to Dec).
Other assets
The category “other assets” covers UK and overseas investment in:
Page 11 of 39
mutual fund investments
insurance-managed funds
UK government securities denominated in foreign currency
local authority and public corporation securities
loans
fixed assets
insurance policies and annuities
direct investment
other assets not elsewhere classified
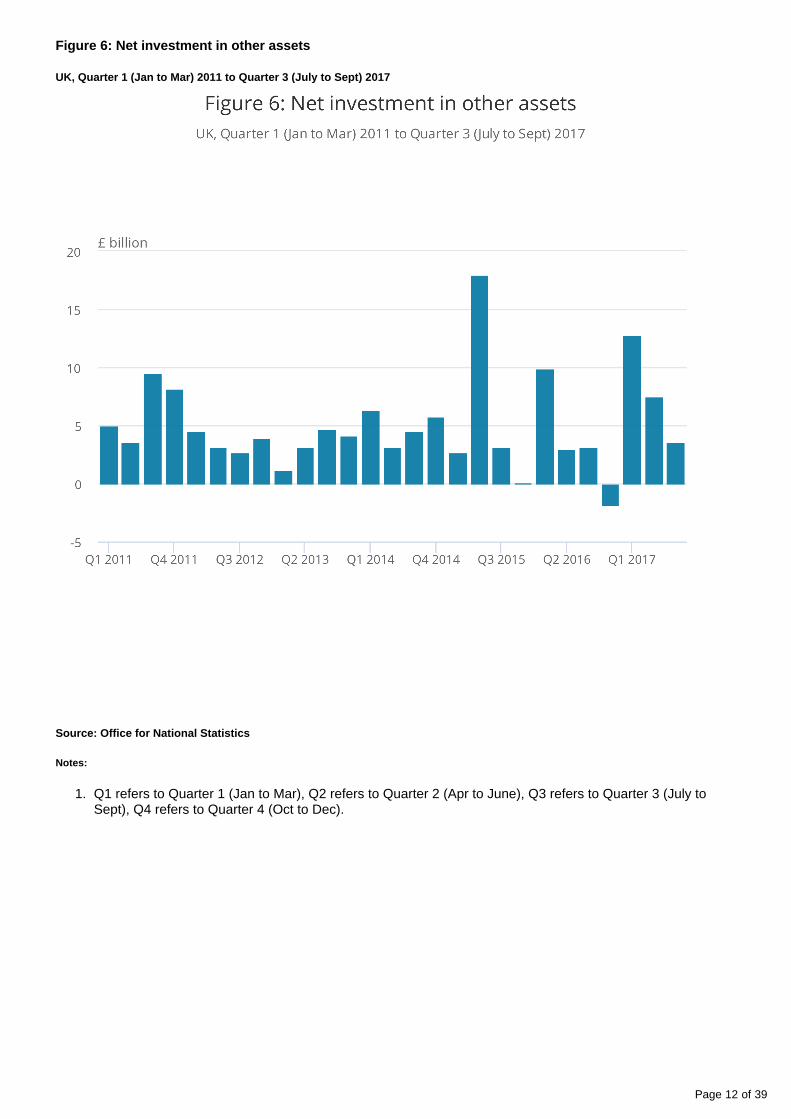
In Quarter 3 2017, there was net investment of £4 billion (Figure 6) in other assets. In terms of context, the five-year quarterly average for this series is net investment of £5 billion.
The net investment of £4 billion in other assets by unit trusts and property unit trusts in Quarter 3 2017, was the largest since the start of this series in 1987. This was caused mainly by net investment in mutual funds and other assets not elsewhere classified.
Page 12 of 39
1.
Figure 6: Net investment in other assets
UK, Quarter 1 (Jan to Mar) 2011 to Quarter 3 (July to Sept) 2017
Source: Office for National Statistics
Notes:
Q1 refers to Quarter 1 (Jan to Mar), Q2 refers to Quarter 2 (Apr to June), Q3 refers to Quarter 3 (July to Sept), Q4 refers to Quarter 4 (Oct to Dec).

Page 13 of 39

Page 14 of 39
Table 1: Net investment by asset type UK, Quarter 1 (Jan to Mar) 2011 to Quarter 3 (July to Sep) 2017, £ billion

Page 15 of 39
£ billion
Total
Short-term assets
UK government sterling securities
UK corporate securities
Overseas securities
Other assets
2011 24.3 10.9 -0.8 -25.5 13.3 26.3
2012 55.6 15.0 -10.2 -10.0 46.5 14.3
2013 48.4 24.9 12.6 -20.4 18.1 13.3
2014 12.5 5.9 10.2 -22.6 -0.7 19.8
2015 27.6 4.5 0.8 -20.6 18.8 24.1
2016 -5.7 -8.5 37.8 -17.3 -31.9 14.2
Q1 2011
11.0 9.7 -0.2 -5.6 2.0 5.0
Q2 2011
10.1 4.1 1.5 -3.0 3.9 3.6
Q3 2011
2.5 -6.1 -3.4 -3.3 5.9 9.5
Q4 2011
0.7 3.2 1.3 -13.5 1.5 8.2
Q1 2012
17.1 10.7 -7.6 -4.4 13.9 4.5
Q2 2012
8.4 -0.3 -1.9 -2.3 9.7 3.2
Q3 2012
18.3 3.0 -2.0 1.6 13.0 2.7
Q4 2012
11.8 1.6 1.3 -4.8 9.9 3.9
Q1 2013
5.4 16.5 0.6 -6.6 -6.3 1.2
Q2 2013
21.1 2.8 7.1 -1.6 9.6 3.2
Q3 2013
15.2 7.3 3.1 -9.3 9.4 4.7
Q4 2013
6.7 -1.7 1.9 -3.0 5.3 4.1
Q1 2014
18.8 6.6 6.6 -6.6 6.0 6.3
Q2 2014
3.8 1.9 6.2 -2.9 -4.6 3.2
Q3 2014
9.8 6.7 3.2 -3.6 -1.1 4.5
Q4 2014
-19.8 -9.3 -5.7 -9.5 -1.1 5.8
Q1 2015
6.4 12.6 -3.2 -8.8 3.0 2.7
Q2 2015
6.1 -10.9 3.9 -9.6 4.7 18.0
Page 16 of 39
Q3 2015
14.5 -1.4 1.0 1.8 9.9 3.2
Q4 2015
0.6 4.1 -0.9 -4.0 1.2 0.1
Q1 2016
-17.9 -17.2 0.6 -7.6 -3.5 9.9
Q2 2016
19.3 11.1 18.3 -0.8 -12.4 3.0
Q3 2016
5.2 7.4 6.4 -4.4 -7.5 3.2
Q4 2016
-12.2 -9.8 12.5 -4.6 -8.5 -1.8
Q1 2017
5.9 5.1 6.1 -15.2 -3.0 12.8
Q2 2017
48.3 14.5 14.9 -4.2 15.5 7.5
Q3 2017
25.3 6.9 13.1 1.5 0.2 3.6
Source: Office for National Statistics
Notes:
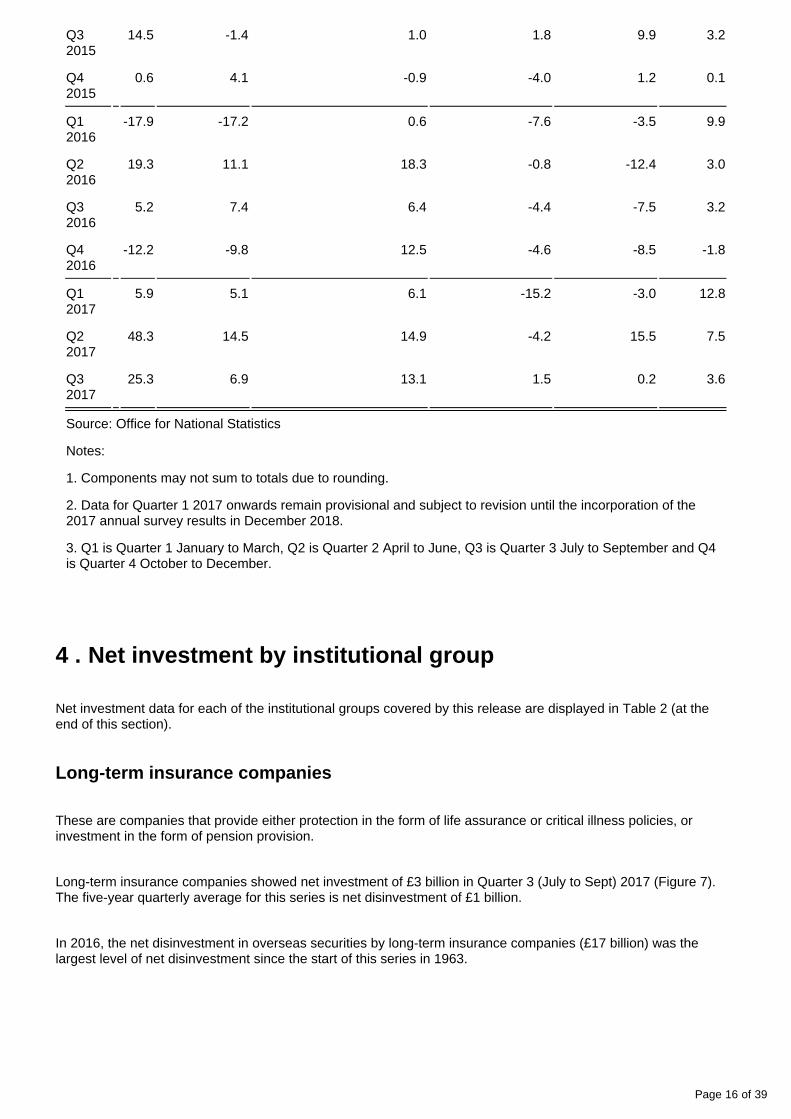
1. Components may not sum to totals due to rounding.
2. Data for Quarter 1 2017 onwards remain provisional and subject to revision until the incorporation of the 2017 annual survey results in December 2018.
3. Q1 is Quarter 1 January to March, Q2 is Quarter 2 April to June, Q3 is Quarter 3 July to September and Q4 is Quarter 4 October to December.
4 . Net investment by institutional group
Net investment data for each of the institutional groups covered by this release are displayed in Table 2 (at the end of this section).
Long-term insurance companies
These are companies that provide either protection in the form of life assurance or critical illness policies, or investment in the form of pension provision.
Long-term insurance companies showed net investment of £3 billion in Quarter 3 (July to Sept) 2017 (Figure 7). The five-year quarterly average for this series is net disinvestment of £1 billion.
In 2016, the net disinvestment in overseas securities by long-term insurance companies (£17 billion) was the largest level of net disinvestment since the start of this series in 1963.

Page 17 of 39
1.
Figure 7: Net investment by long-term insurance companies
UK, Quarter 1 (Jan to Mar) 2011 to Quarter 3 (July to Sept) 2017
Source: Office for National Statistics
Notes:
Q1 refers to Quarter 1 (Jan to Mar), Q2 refers to Quarter 2 (Apr to June), Q3 refers to Quarter 3 (July to Sept), Q4 refers to Quarter 4 (Oct to Dec).
General insurance companies
These are companies that undertake other types of insurance such as motor, home and travel. This type of insurance is usually over a shorter period, most commonly 12 months.
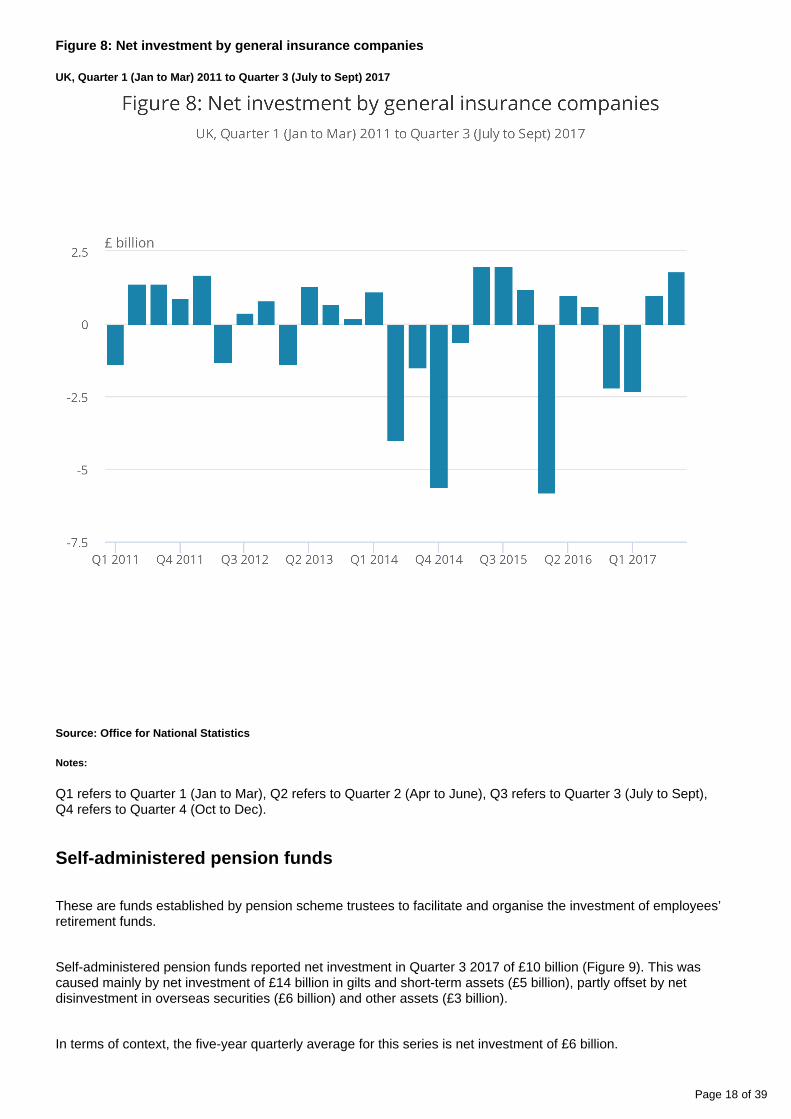
General insurance companies showed net investment in Quarter 3 2017 of £2 billion (Figure 8). The five-year quarterly average for this series is net disinvestment of £0.5 billion.
Page 18 of 39
Figure 8: Net investment by general insurance companies
UK, Quarter 1 (Jan to Mar) 2011 to Quarter 3 (July to Sept) 2017
Source: Office for National Statistics
Notes:
Q1 refers to Quarter 1 (Jan to Mar), Q2 refers to Quarter 2 (Apr to June), Q3 refers to Quarter 3 (July to Sept), Q4 refers to Quarter 4 (Oct to Dec).
Self-administered pension funds
These are funds established by pension scheme trustees to facilitate and organise the investment of employees’ retirement funds.
Self-administered pension funds reported net investment in Quarter 3 2017 of £10 billion (Figure 9). This was caused mainly by net investment of £14 billion in gilts and short-term assets (£5 billion), partly offset by net disinvestment in overseas securities (£6 billion) and other assets (£3 billion).
In terms of context, the five-year quarterly average for this series is net investment of £6 billion.

Page 19 of 39
1.
In 2016, the estimate of net investment by self-administered pension funds in gilts (£41 billion) followed net investment of £20 billion in 2015. These were the highest levels of annual net investment in gilts by pension funds, since the start of this series in 1963. By contrast, in 2016 these businesses reported net disinvestment in overseas securities (£12 billion), the largest disinvestment for this series since records began in 1963. This, along with the increased move towards government gilts, may indicate that these businesses were pursuing a relatively liquid investment portfolio over this period.
Figure 9: Net investment by self-administered pension funds
UK, Quarter 1 (Jan to Mar) 2011 to Quarter 3 (July to Sept) 2017
Source: Office for National Statistics
Notes:
Q1 refers to Quarter 1 (Jan to Mar), Q2 refers to Quarter 2 (Apr to June), Q3 refers to Quarter 3 (July to Sept), Q4 refers to Quarter 4 (Oct to Dec).

Page 20 of 39
Investment trusts
Investment trusts acquire financial assets with money subscribed by shareholders or borrowed in the form of loan capital. Investment trusts are not trusts in the legal sense, but are limited companies with two special characteristics: their assets consist of securities and they are debarred by their articles of association from distributing capital gains as dividends. Shares of investment trusts are traded on the Stock Exchange and increasingly can be bought direct from the company.
In Quarter 3 2017, investment trusts reported net disinvestment of £0.1 billion, in keeping with the five-year quarterly average for this series.
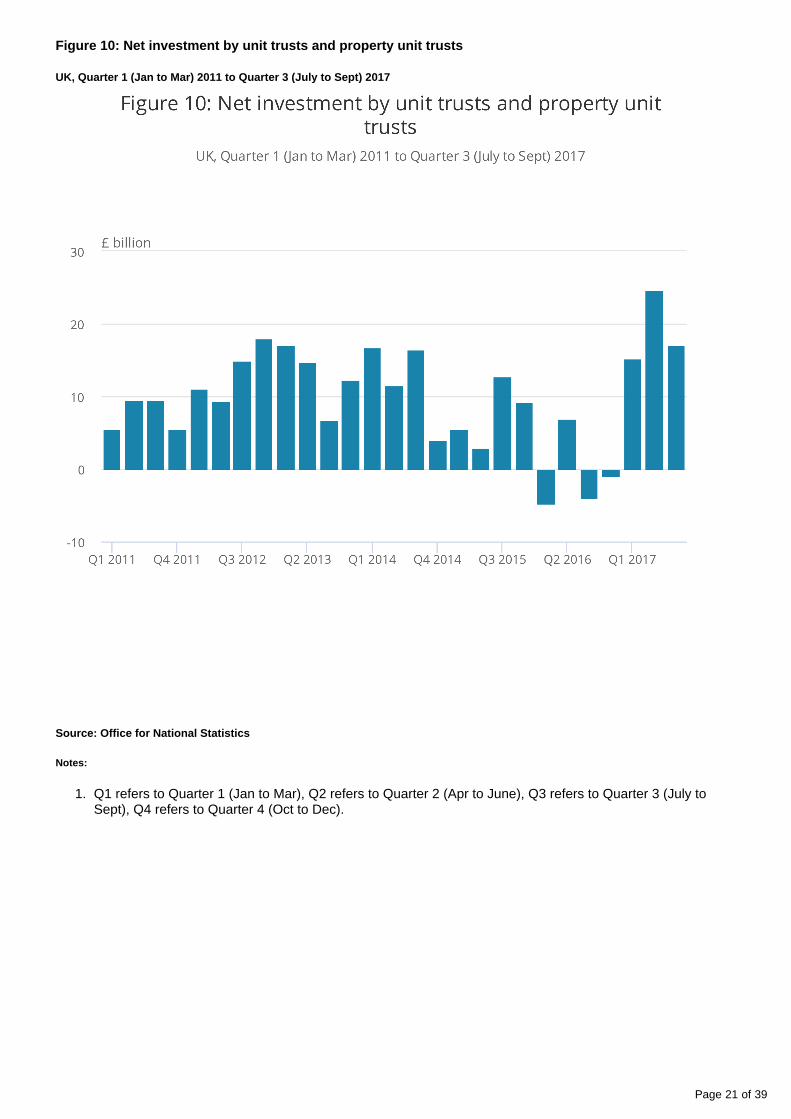
Unit trusts and property unit trusts
Unit trusts include open-ended investment companies (OEICs) but do not cover other unitised collective investment schemes or those based offshore. They are set up under trust deeds, the trustee usually being a bank or insurance company. The funds in the trusts are managed not by the trustees, but by independent management companies. Units representing a share in the trusts’ assets can be bought from the managers or resold to them at any time.
Property unit trusts invest predominantly in freehold or leasehold commercial property yet may hold a small proportion of their investments in the securities of property companies.
In Quarter 3 2017, unit trusts and property unit trusts reported net investment of £17 billion (Figure 10). The five-year quarterly average for this series is net investment of £10 billion.
Page 21 of 39
1.
Figure 10: Net investment by unit trusts and property unit trusts
UK, Quarter 1 (Jan to Mar) 2011 to Quarter 3 (July to Sept) 2017
Source: Office for National Statistics
Notes:
Q1 refers to Quarter 1 (Jan to Mar), Q2 refers to Quarter 2 (Apr to June), Q3 refers to Quarter 3 (July to Sept), Q4 refers to Quarter 4 (Oct to Dec).

Page 22 of 39

Page 23 of 39
Table 2: Net Investment by institutional group UK, Quarter 1 (Jan to Mar) 2011 to Quarter 3 (July to Sep) 2017, £ billion

Page 24 of 39
£ billion
Long-term insurance companies
General insurance companies
Self-administered
pension funds
Investment
trusts
Unit trusts and property
unit trusts
Consolidation adjustment1
2011 -4.2 2.3 8.6 0.4 30.3 -13.0
2012 3.7 1.6 19.7 -0.2 53.5 -22.6
2013 -17.3 0.8 18.8 0.6 50.9 -5.4
2014 -14.6 -10.0 10.3 0.8 48.7 -22.7
2015 -5.0 4.6 13.6 0.2 30.5 -16.3
2016 3.9 -6.3 20.4 1.4 -2.8 -22.3
Q1 2011
-5.6 -1.4 11.1 0.6 5.5 0.7
Q2 2011
5.1 1.4 -2.9 0.3 9.6 -3.4
Q3 2011
1.3 1.4 -1.6 -0.1 9.6 -8.1
Q4 2011
-4.9 0.9 2.1 -0.5 5.5 -2.3
Q1 2012
2.3 1.7 4.9 0.1 11.1 -3.0
Q2 2012
2.1 -1.3 -3.4 0.1 9.4 1.6
Q3 2012
-2.4 0.4 9.8 -0.4 15.0 -4.0
Q4 2012
1.8 0.8 8.4 0.1 18.0 -17.2
Q1 2013
-1.4 -1.4 -4.0 0.5 17.1 -5.5
Q2 2013
-0.4 1.3 6.5 -0.2 14.8 -1.0
Q3 2013
-4.7 0.7 10.5 0.1 6.7 1.9
Q4 2013
-10.8 0.2 5.8 0.1 12.3 -0.8
Q1 2014
-0.3 1.1 9.7 0.1 16.8 -8.6
Q2 2014
-5.9 -4.0 9.2 0.3 11.5 -7.3
Q3 2014
-1.0 -1.5 -0.1 0.4 16.4 -4.4
Q4 2014
-7.4 -5.6 -8.4 0.0 4.0 -2.4
Q1 2015
-3.4 -0.6 6.9 -0.9 5.5 -1.1
Q2 2015
-2.2 2.0 6.7 0.8 3.0 -4.1

Page 25 of 39
Q3 2015
2.6 2.0 1.1 0.2 12.8 -4.3
Q4 2015
-1.9 1.2 -1.1 0.1 9.2 -6.8
Q1 2016
-8.2 -5.8 8.1 0.5 -4.8 -7.7
Q2 2016
0.1 1.0 16.8 1.1 6.9 -6.6
Q3 2016
9.9 0.6 3.5 -0.7 -4.0 -4.2
Q4 2016
2.2 -2.2 -8.0 0.5 -0.9 -3.8
Q1 2017
-3.0 -2.3 7.0 -2.0 15.3 -9.2
Q2 2017
7.1 1.0 24.4 -1.6 24.6 -7.2
Q3 2017
2.7 1.8 10.3 -0.1 17.1 -6.4
Source: Office for National Statistics
Notes:
1. The consolidation adjustment is an adjustment to remove inter-sectoral flows between the different types of institution covered. The adjustment includes (i) investment in authorised unit trust units, open-ended investment companies and investment trust securities by insurance companies, pension funds and trusts and (ii) investment by pension funds in insurance managed funds and property unit trust units.
2. Components may not sum to totals due to rounding.
3. Data for Quarter 1 2017 onwards remain provisional and subject to revision until the incorporation of the 2017 annual survey results in December 2018.
4. Q1 is Quarter 1 January to March, Q2 is Quarter 2 April to June, Q3 is Quarter 3 July to September and Q4 is Quarter 4 October to December.
5 . Income and expenditure by institutional group
Rather than provide analysis on total income and expenditure for the institutional groups, it is considered more beneficial to users, based on their feedback, if commentary is concentrated on particular components. For insurance companies, the focus is on premiums and claims, while contributions (net of refunds) and payments are the focus for self-administered pension funds (see Table 3, at the end of this section).
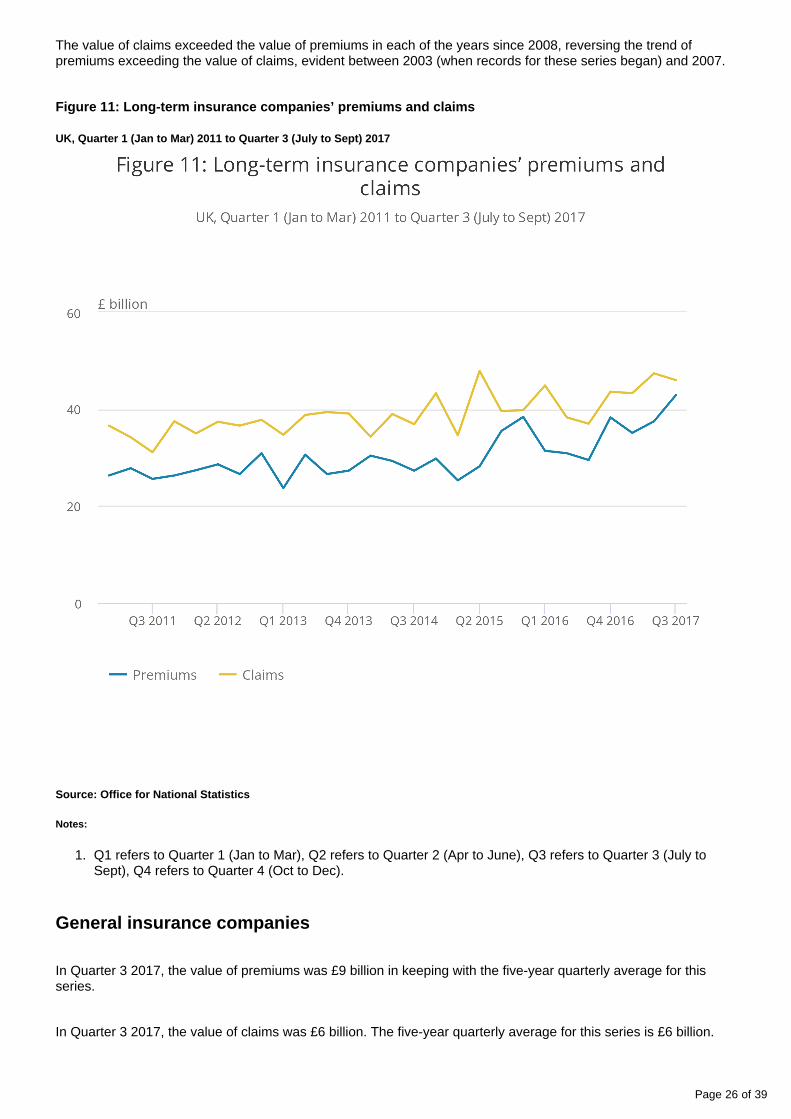
Long-term insurance companies
In Quarter 3 (July to Sept) 2017, the value of claims was £46 billion. In terms of context, the five-year quarterly average for this series is £40 billion.
The value of premiums in Quarter 3 2017 was £43 billion. The five-year quarterly average for this series is £31 billion.
Page 26 of 39
1.
The value of claims exceeded the value of premiums in each of the years since 2008, reversing the trend of premiums exceeding the value of claims, evident between 2003 (when records for these series began) and 2007.
Figure 11: Long-term insurance companies’ premiums and claims
UK, Quarter 1 (Jan to Mar) 2011 to Quarter 3 (July to Sept) 2017
Source: Office for National Statistics
Notes:
Q1 refers to Quarter 1 (Jan to Mar), Q2 refers to Quarter 2 (Apr to June), Q3 refers to Quarter 3 (July to Sept), Q4 refers to Quarter 4 (Oct to Dec).
General insurance companies
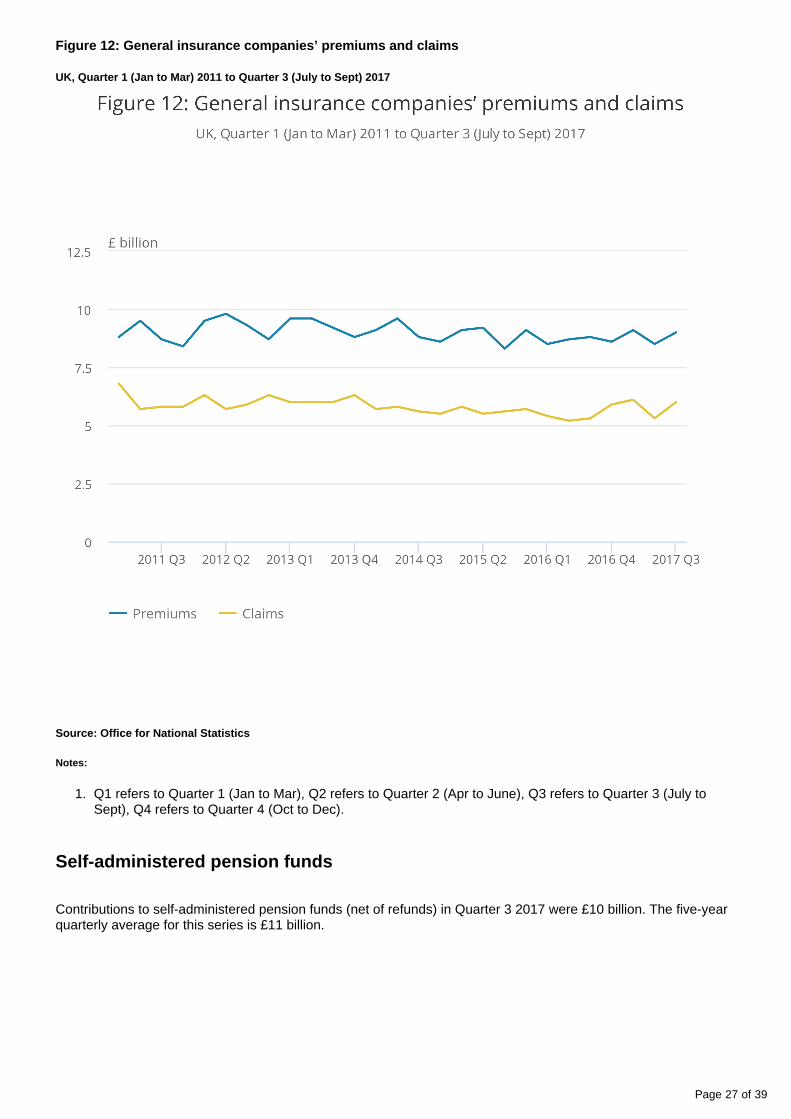
In Quarter 3 2017, the value of premiums was £9 billion in keeping with the five-year quarterly average for this series.
In Quarter 3 2017, the value of claims was £6 billion. The five-year quarterly average for this series is £6 billion.
Page 27 of 39
1.
Figure 12: General insurance companies’ premiums and claims
UK, Quarter 1 (Jan to Mar) 2011 to Quarter 3 (July to Sept) 2017
Source: Office for National Statistics
Notes:
Q1 refers to Quarter 1 (Jan to Mar), Q2 refers to Quarter 2 (Apr to June), Q3 refers to Quarter 3 (July to Sept), Q4 refers to Quarter 4 (Oct to Dec).
Self-administered pension funds
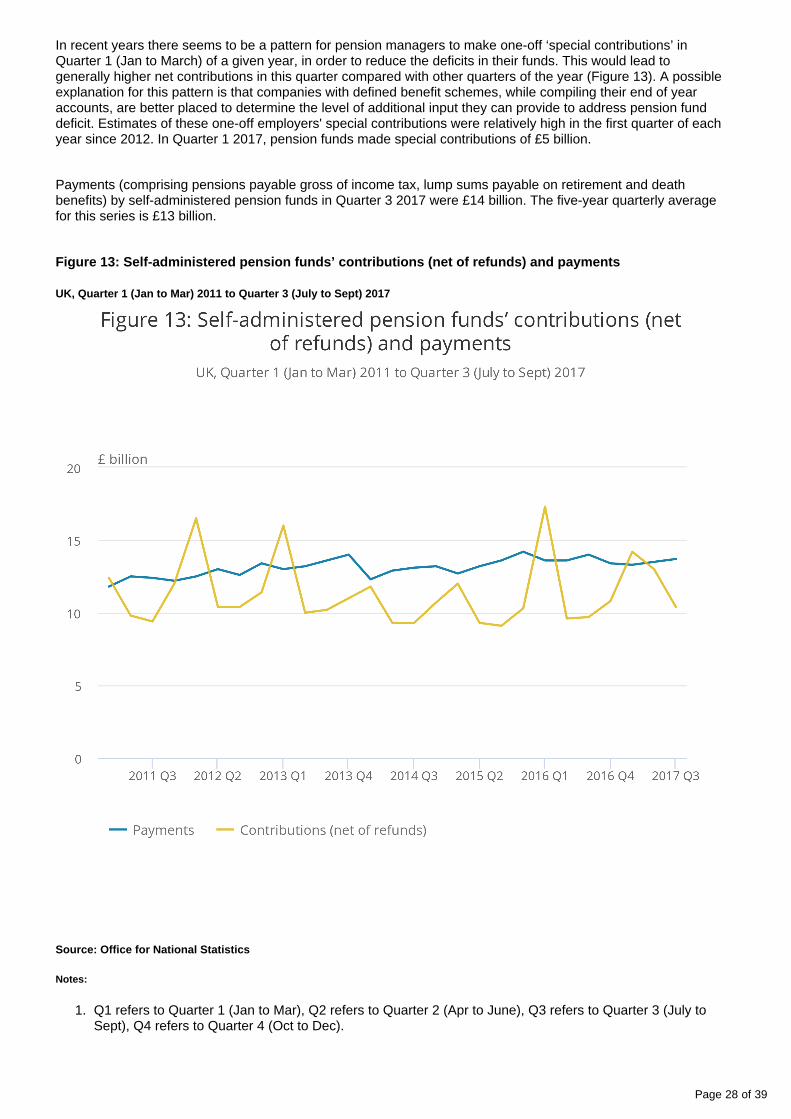
Contributions to self-administered pension funds (net of refunds) in Quarter 3 2017 were £10 billion. The five-year quarterly average for this series is £11 billion.
Page 28 of 39
1.
In recent years there seems to be a pattern for pension managers to make one-off ‘special contributions’ in Quarter 1 (Jan to March) of a given year, in order to reduce the deficits in their funds. This would lead to generally higher net contributions in this quarter compared with other quarters of the year (Figure 13). A possible explanation for this pattern is that companies with defined benefit schemes, while compiling their end of year accounts, are better placed to determine the level of additional input they can provide to address pension fund deficit. Estimates of these one-off employers' special contributions were relatively high in the first quarter of each year since 2012. In Quarter 1 2017, pension funds made special contributions of £5 billion.
Payments (comprising pensions payable gross of income tax, lump sums payable on retirement and death benefits) by self-administered pension funds in Quarter 3 2017 were £14 billion. The five-year quarterly average for this series is £13 billion.
Figure 13: Self-administered pension funds’ contributions (net of refunds) and payments
UK, Quarter 1 (Jan to Mar) 2011 to Quarter 3 (July to Sept) 2017
Source: Office for National Statistics
Notes:
Q1 refers to Quarter 1 (Jan to Mar), Q2 refers to Quarter 2 (Apr to June), Q3 refers to Quarter 3 (July to Sept), Q4 refers to Quarter 4 (Oct to Dec).

Page 29 of 39

Page 30 of 39
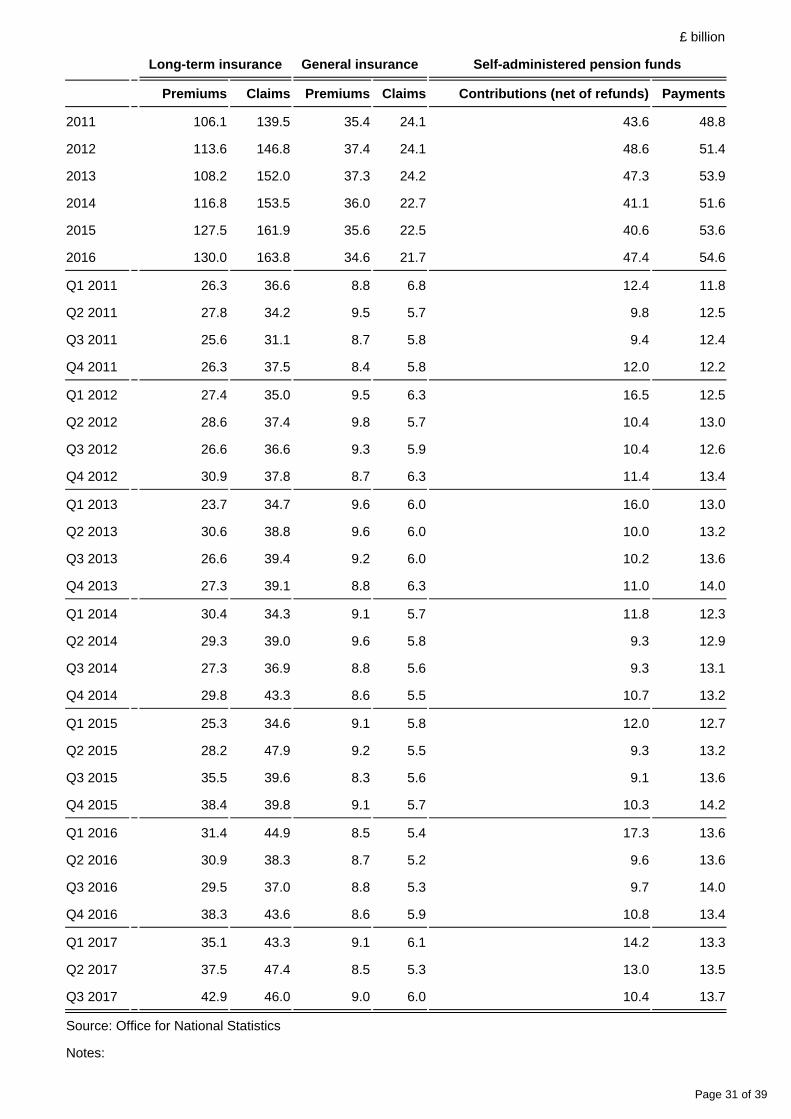
Table 3: Income and expenditure by institutional group UK, Quarter 1 (Jan to Mar) 2011 to Quarter 3 (July to Sep) 2017, £ billion
Page 31 of 39
£ billion
Long-term insurance General insurance Self-administered pension funds
Premiums Claims Premiums Claims Contributions (net of refunds) Payments
2011 106.1 139.5 35.4 24.1 43.6 48.8
2012 113.6 146.8 37.4 24.1 48.6 51.4
2013 108.2 152.0 37.3 24.2 47.3 53.9
2014 116.8 153.5 36.0 22.7 41.1 51.6
2015 127.5 161.9 35.6 22.5 40.6 53.6
2016 130.0 163.8 34.6 21.7 47.4 54.6
Q1 2011 26.3 36.6 8.8 6.8 12.4 11.8
Q2 2011 27.8 34.2 9.5 5.7 9.8 12.5
Q3 2011 25.6 31.1 8.7 5.8 9.4 12.4
Q4 2011 26.3 37.5 8.4 5.8 12.0 12.2
Q1 2012 27.4 35.0 9.5 6.3 16.5 12.5
Q2 2012 28.6 37.4 9.8 5.7 10.4 13.0
Q3 2012 26.6 36.6 9.3 5.9 10.4 12.6
Q4 2012 30.9 37.8 8.7 6.3 11.4 13.4
Q1 2013 23.7 34.7 9.6 6.0 16.0 13.0
Q2 2013 30.6 38.8 9.6 6.0 10.0 13.2
Q3 2013 26.6 39.4 9.2 6.0 10.2 13.6
Q4 2013 27.3 39.1 8.8 6.3 11.0 14.0
Q1 2014 30.4 34.3 9.1 5.7 11.8 12.3
Q2 2014 29.3 39.0 9.6 5.8 9.3 12.9
Q3 2014 27.3 36.9 8.8 5.6 9.3 13.1
Q4 2014 29.8 43.3 8.6 5.5 10.7 13.2
Q1 2015 25.3 34.6 9.1 5.8 12.0 12.7
Q2 2015 28.2 47.9 9.2 5.5 9.3 13.2
Q3 2015 35.5 39.6 8.3 5.6 9.1 13.6
Q4 2015 38.4 39.8 9.1 5.7 10.3 14.2
Q1 2016 31.4 44.9 8.5 5.4 17.3 13.6
Q2 2016 30.9 38.3 8.7 5.2 9.6 13.6
Q3 2016 29.5 37.0 8.8 5.3 9.7 14.0
Q4 2016 38.3 43.6 8.6 5.9 10.8 13.4
Q1 2017 35.1 43.3 9.1 6.1 14.2 13.3
Q2 2017 37.5 47.4 8.5 5.3 13.0 13.5
Q3 2017 42.9 46.0 9.0 6.0 10.4 13.7
Source: Office for National Statistics
Notes:

Page 32 of 39
1. Components may not sum to totals due to rounding.
2. Data for Quarter 1 2017 onwards remain provisional and subject to revision until the incorporation of the 2017 annual survey results in December 2018.
3. Q1 is Quarter 1 January to March, Q2 is Quarter 2 April to June, Q3 is Quarter 3 July to September and Q4 is Quarter 4 October to December.
6 . Holdings at market values
Market value is the quoted price at which assets are bought or sold, at a given time. Increase or decrease in the total holdings of assets reflects both the revaluation of assets held through the year and the balance between the sales of some assets and the purchase of others (net investment or transactions).
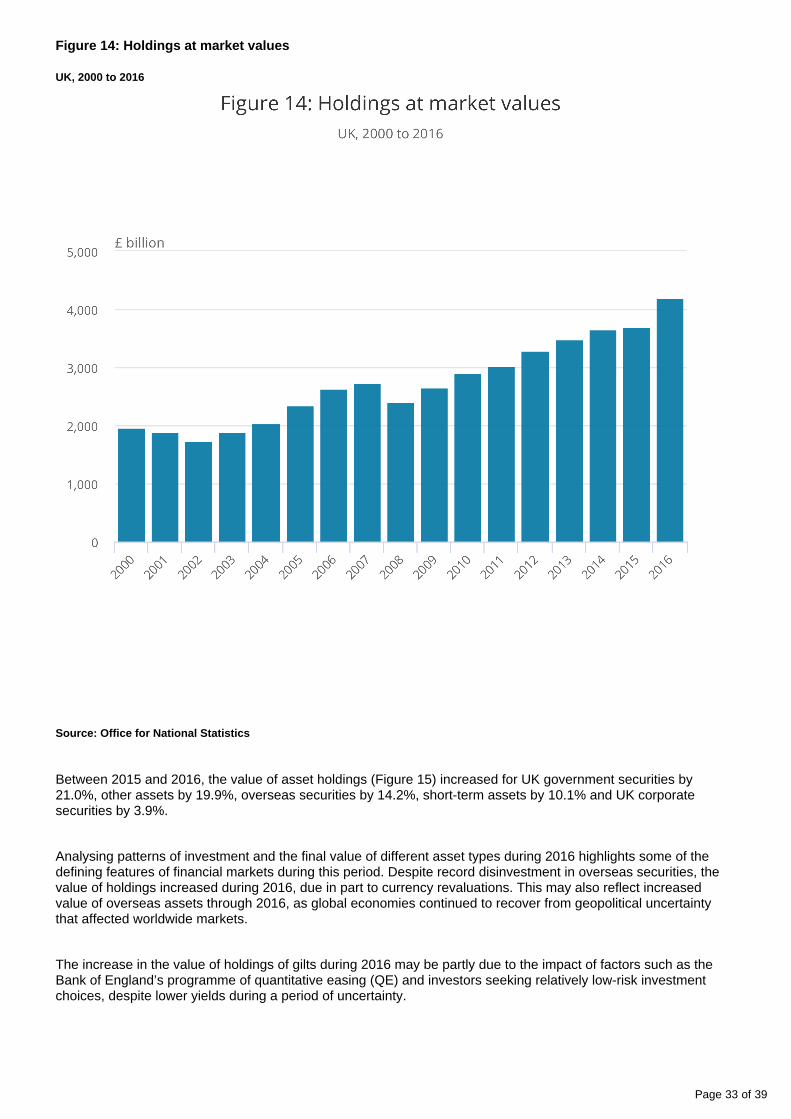
The total assets held by insurance companies, pension funds and trusts (at market values) has increased each year since 2008 and at the end of 2016 was valued at £4,188 billion. This compares with £3,696 billion at the end of 2015 (Figure 14) and the increase of 13.3% in the level of total assets held by these institutional groups, is the largest since 2005 (16%).
Page 33 of 39
Figure 14: Holdings at market values
UK, 2000 to 2016
Source: Office for National Statistics
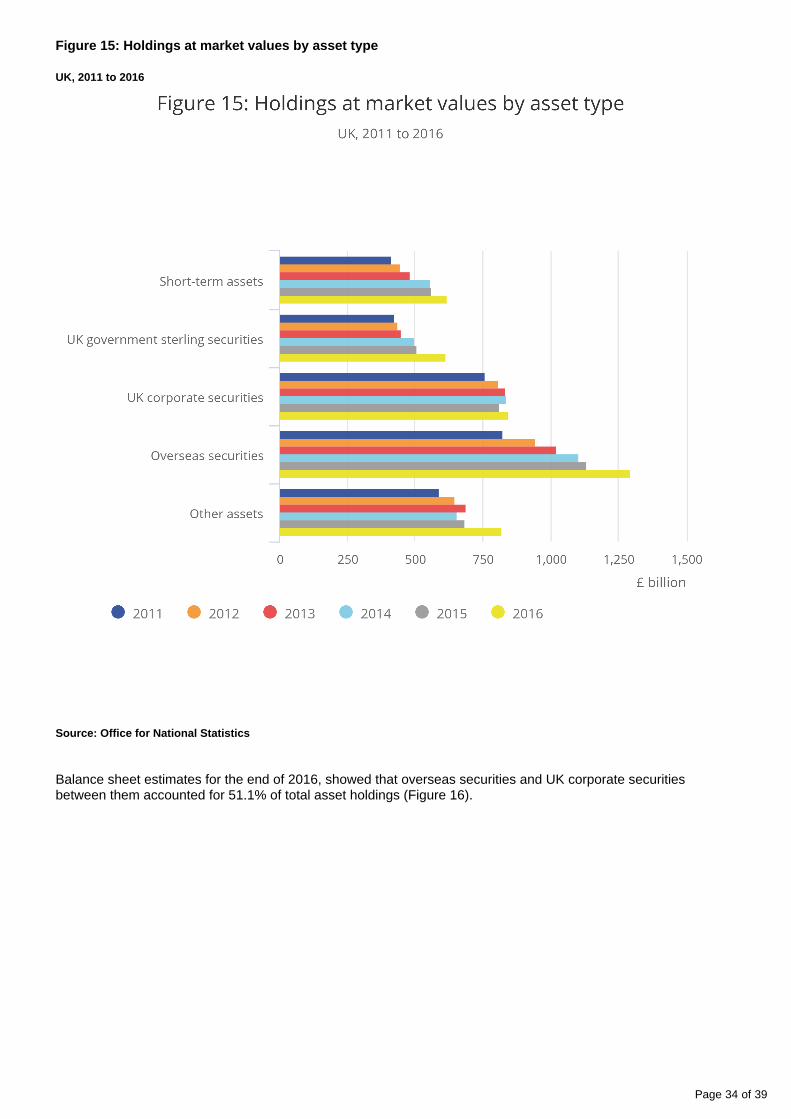
Between 2015 and 2016, the value of asset holdings (Figure 15) increased for UK government securities by 21.0%, other assets by 19.9%, overseas securities by 14.2%, short-term assets by 10.1% and UK corporate securities by 3.9%.
Analysing patterns of investment and the final value of different asset types during 2016 highlights some of the defining features of financial markets during this period. Despite record disinvestment in overseas securities, the value of holdings increased during 2016, due in part to currency revaluations. This may also reflect increased value of overseas assets through 2016, as global economies continued to recover from geopolitical uncertainty that affected worldwide markets.
The increase in the value of holdings of gilts during 2016 may be partly due to the impact of factors such as the Bank of England’s programme of quantitative easing (QE) and investors seeking relatively low-risk investment choices, despite lower yields during a period of uncertainty.
Page 34 of 39
Figure 15: Holdings at market values by asset type
UK, 2011 to 2016
Source: Office for National Statistics
Balance sheet estimates for the end of 2016, showed that overseas securities and UK corporate securities between them accounted for 51.1% of total asset holdings (Figure 16).

Page 35 of 39
Figure 16: Holdings at market values by asset type, as a proportion of total holdings
UK, 2016
In 2016, overseas securities continued to be the largest asset type as a proportion of total holdings (30.9%). This asset type has increased its contribution to total holdings in each of the past five years (Figure 17). By contrast, the value of UK corporate securities, as a proportion of total holdings, decreased from 22.0% in 2015 to 20.2% in 2016. This is in keeping with a long-term trend going back to 1996.
In 2016, the value of overseas securities as a proportion of total holdings continued to exceed that of UK corporate securities. This trend was seen for the first time in 2009 (this series started in 1964) and the subsequent divergence between the contributions of these assets types to total holdings may suggest that investors have felt that overseas securities offered a more profitable return.

Page 36 of 39
Figure 17 Holdings at market values by asset type, as a proportion of total holdings
UK, 2000 to 2016
Source: Office for National Statistics
7 . Accessing MQ5 data
There are several ways to view the data underlying this release.
The shows data from both the MQ5: Investment by insurance companies, pension funds and trusts datasetquarterly and annual series:

Page 37 of 39
Tables A to D combine information from the different institutions
Section 1 combines information from the long-term and general insurance surveys
Section 2 covers information from the surveys of long-term insurance companies
Section 3 covers information from the surveys of general insurance companies
Section 4 covers information from the surveys of self-administered pension funds
Section 5 covers information from the surveys of investment trusts
Section 6 covers information from the surveys of unit trusts and property unit trusts
If you are interested in a particular series or groups of series covering a longer period of time (pre-2010), then you can access the Investment by Insurance Companies, Pension Funds and Trusts .time series dataset
There is scope to expand coverage of these datasets and/or add further datasets. We are keen to hear your views – please email us: [email protected]
8 . Revisions
A is available to assist users with their understanding of the cycle and frequency of data revisions policyrevisions. You are strongly advised to read this policy before using these data for research or policy-related purposes.
Data for 2017 remain provisional and subject to revision, until the incorporation of the 2017 annual survey results in December 2018. In Quarter 2 2017 (Apr to June) the estimate of net investment has been revised, from £36 billion to £48 billion.
The revisions policy explains the annual alignment process which is conducted at Quarter 3 (July to Sept). Revisions to the data for 2016 have been caused by incorporating the results of the 2016 annual insurance and pension funds surveys. As part of the processing of these results, discrepancies in the returns of individual respondents are identified by comparing their quarterly and annual returns, which were then reconciled.
Total net disinvestment in 2016 has been revised upwards to £6 billion from net disinvestment of £54 billion published last quarter. This revision is due primarily to the alignment process and also to some updating of data returned by businesses. It is important to note that many businesses forecast their first estimates. This further helps to explain the sizeable discrepancy between the two estimates, especially if financial markets do not perform in line with business expectations.
Revisions to data provide one indication of the reliability of main indicators. A spreadsheet is available giving a of estimates of net investment from 1996 to date. This also includes information on average revisions triangle
revisions to other series contained in this publication.
9 . Response rates
The figures in this release are based on a system of quarterly and annual surveys collecting data on income and expenditure, transactions in financial assets and the balance sheet in separate surveys. Response rates in Quarter 3 (July to Sept) 2017 are broadly in line with previous quarters response rates.

Page 38 of 39
Table 4: Overall response rate by survey Q3 2017 and 2016 Annual
%
Quarter 3 (July to September) 2017
Transactions
Long-term insurance companies
91
General insurance companies 92
Self-administered pension funds
84
Unit trusts 75
Investment trusts 94
Property unit trusts 88
Income and expenditure
Long-term insurance companies
91
General insurance companies 89
Self-administered pension funds
85
2016 Annual %
Balance sheet
Long-term insurance companies
99
General insurance companies 93
Self-administered pension funds
94
Income and expenditure
Long-term insurance companies
98
General insurance companies 92
Assets and liabilities
Unit trusts 93
Investment trusts 87
Property unit trusts 85
Source: Office for National Statistics

Page 39 of 39
10 . Quality and methodology
The Investment by insurance companies, pension funds and trusts (MQ5) Quality and Methodology Information contains important information on:document
the strengths and limitations of the data and how it compares with related data
uses and users of the data
how the output was created
the quality of the output including the accuracy of the data