Іmpact of migration on net reproduction rate, and an
TRANSCRIPT
204
Canadian Studies in Population 40, no. 3–4 (2013): 204–217.
Іmpact of migration on net reproduction rate, and an assessment of the speed of
population growth in the presence of migration, in the districts of Кerala and Аssam (India)
Rajan Sarma1
Labananda Choudhury
Abstract
In India, due to the lack of age-specific death and birth data, direct calculation of Net Reproduc-tion Rate is not possible, particularly at the district level. Also, conventional Net Reproduction Rate and intrinsic growth rate measures are not suitable for populations affected by migration. The present study attempts to recapture the scenario of migration in the districts of two diverged states of India—Kerala and Assam—by estimating the Net Reproduction Rates before and after allowance for migration. The study also attempts to assess the speed of population growth of these districts from the intrinsic growth rates in the presence of migration.
Keywords: net reproduction rate, intrinsic growth rate, India, districts, migration.
Résumé
En Inde, compte tenu du manque de données précises sur les décès et les naissances, il n’est pas possible d’établir le calcul direct du taux de reproduction net, surtout pour les districts. De plus, le taux de reproduction net traditionnel et les mesures intrinsèques du taux de croissance ne conviennent pas aux populations touchées par la migration. La présente étude vise à capter de nouveau le scénario de la migration dans les districts de deux états opposés de l’Inde, notamment Kerala et Assam, en donnant une estimation des taux de reproduction nets avant et après avoir tenu compte de la migration. L’étude essaie aussi d’évaluer la vitesse de la croissance de la popula-tion de ces districts à partir des taux de croissance intrinsèques en présence de la migration.
Mots-clés : taux de reproduction net, taux de croissance intrinsèque, Inde, districts, migration.
Introduction
The enormous size and rapid growth of the population in India have been a major hurdle in achieving the goal of population stabilization. The National Population Policy launched in 2000 had the medium-term objective to achieve replacement-level fertility by 2010. It also envisaged that states would develop individual policies, giving priority to local issues in coherence with the goals and objectives prescribed in the national policy (IIPS 2011). The current need, then, is not
1. Rajan Sarma, Department of Statistics, Darrang College, Tezpur-784001, Assam, India. Email: [email protected]. With Labananda Choudhury, Department of Statistics, Gauhati University, Guwahati-781014, Assam,India.
Sarma and Choudhury: Impact of migration on net reproduction rate in the districts of Kerala and Assam
205
only to look at the population problem at a macro, or all-India, level alone, but also to pay special attention to the problem of the individual states, and to inter-state variations. From this, a popula-tion policy needs to be formulated that will take into account these variations and make the na-tionwide all-India policy an integrated whole of appropriate policies for the constituent individual states (Rao 1981).
In addition to births and deaths, migration is the third factor which influences the growth of a population. Kerala and Assam are two states of India which are impacted by migration, though in different directions. Kerala is known for outflow of people to the Middle East and the rest of India; this seems to have decelerated in the last few decades, due to a decline in the demand for labour re-sulting from a slowdown in the Gulf economies. However, migration of people from other states to Kerala in recent years might have compensated the outflow, but at the same time it has impacted the demographic characteristics of the state. Assam is known to have received a large number of legal/illegal immigrants from other states and neighbouring Bangladesh, which is believed to have taken its toll on the demography of the state.
Kerala is the only state in India that has achieved demographic characteristics analogous to those of developed countries—marked by high life expectancy at birth, low mortality, below–replacement-level fertility, and high literacy. However, migration has been the single most dynamic factor in the otherwise unpromising development scenario of Kerala in the last quarter of the past century. On the one hand, emigration has contributed more to poverty alleviation and reduction in unemploy-ment than any other factor (Zachariah et al. 1999); on the other hand, higher wages for unskilled labour in the state, and increased opportunities for employment due to the shortage of local labour, paradoxically despite the high unemployment rate in the state, led to the massive influx of migrant labour from the other states. According to the 2001 census, 1.3 per cent of the population of Ker-ala consists of migrants (by place of birth) from other states. These migrants are from Tamil Nadu (67.8 per cent), Karnataka (13.5 per cent), Maharashtra (4.5 per cent), Andhra Pradesh (2.3 per cent), Pondicherry (2.1 per cent), Uttar Pradesh (1.4 per cent), and West Bengal (1 per cent; Surabhi and Kumar 2007).
Assam, a strategic border state of India, is a less-developed state, characterized by low life expectancy at birth, high mortality, above-replacement-level fertility, and moderate literacy. It has witnessed the influx of migrants since the days of British rule from then–East Bengal, now Ban-gladesh. The influx was largely engineered by the British, given the economic rationale of cheap labour that the migrants provided for the sprawling tea estates in Assam. This was mostly undocu-mented migration. In a recent study, it was estimated that the volume of undocumented migration in Assam was over half a million during 1991–2001 and over 1.3 million during 1971–2001 (Nath et al. 2012). However, this issue of migration assumed political and communal overtones after independence, and continues to be an issue of concern. The continuance of illegal Bangladeshi migration allegedly threatens the demographic pattern of Assam, so much so that the majority As-samese community is under threat of being relegated to minority status (Goswami 1996; Governor of Assam 1998).
The growth of a population being a function of both fertility and mortality (without migra-tion), Net Reproduction Rate (NRR) is a more appropriate index of the extent to which population stabilization is attained. The NRR is a synthetic demographic rate that measures the average number of daughters per woman that survive to average reproductive age. Essentially, the Net Reproduction Rate measures to what extent one generation is replaced by the next generation—taking into account both the level of (period) fertility and mortality. The NRR is probably the most accurate (period)
Canadian Studies in Population 40, no. 3–4 (2013)
206
measure of the actual demographic situation in a particular population. It eliminates age structure effects, which can seriously distort the rates of population increase or decline, as well as the birth and death rates. The NRR shows how a population would change with the current vital rates (China-Profile 2011).
In populations with low levels of mortality, as in most developed countries, the replacement level of Total Fertility Rate (TFR) is about 2.1, whereas in populations with higher mortality—in par-ticular, high childhood mortality—the replacement level of TFR can be as high as 3.5 or 4.0. Thus, fertility rates that correspond to an NRR of 1.00 are often referred to as replacement-level fertility (Preston et al. 2003).
In India, due to insufficient vital registration, the Sample Registration System (SRS) has emerged as the main source of fertility and reproduction estimates [Crude Birth Rate (CBR), Total Fertility Rate (TFR), and Gross Reproduction Rate (GRR)]2 at the state level, but does not provide district-level estimates. Even SRS does not provide state-level estimates of NRR. Moreover, though the National Family Health Surveys (NFHS) provide comparable estimates of fertility for the states and the union territories, they do not give district-level estimates. The District Health and Facility Surveys (DHLS) do not provide these estimates, either.
Traditionally, computation of NRR requires the female age-specific survival probabilities within the childbearing period (generally obtained from a female life table) and the female age specific fertil-ity rates, both of which are not available at the district level of India from the readily available sources like the SRS and NFHSs, nor can they be computed directly, due to poor registration of births and deaths.
Demographers have developed several mechanisms to estimate fertility by different direct and indirect methods: the Concept of Dual Record System by Chandra Sekar and Deming (1949); Birth Order Statistics in Stable Condition (Brass and Coale 1968); the Reverse Survival Technique (Shryock and Seigel 1976); Brass’s P/F Ratio Method (Brass and Coale 1968); Rele’s (1967, 1987) Method; Stable Population Method (United Nations 1983); Coale’s (1981) Method; Generalized Population Method (Preston 1983); Palmore (1978) Method; Gunasekaran and Palmore (1984) Method; etc.
In India, Bhat (1996) has used the regression method to estimate TFR from CBR for state-level data from SRS for the periods 1979–81 and 1989–91. However, low coverage of birth registration in the vital registration system possibly could not attract many demographers to utilize these data to estimate fertility. So far, fertility estimates at regular intervals below the state level are not readily available from any other source. A few researchers (Parasuraman and Ram 1988; Das Gupta and Bhat 1995; Guilmoto and Rajan 2002) and the Registrar General of India (1989, 1997) have used different indirect techniques to estimate fertility rates at the district level using census data (IIPS 2011). How-ever, possibly due to the absence of reliable mortality information (Life Tables), none attempted to estimate NRR at the district level of India.
2. CBR (period) is the number of births in a particular period divided by the number of person-years lived in the population during the same period. TFR is the average number of children a woman would bear if she survived through the end of the reproductive life span and experienced at each age a particular set of age-specific fertility rates. GRR represents the number of female births an average woman would have if she lived through the end of her reproductive age. NRR represents the average number of daughters that the female members of a birth cohort would bear during their reproductive life span if they were subject to the observed age-specific maternity rates and mortality rates throughout their lifetimes. If NRR is greater than, equal to, or less than 1.00, then a cohort of girl babies will leave behind a larger, equal, or smaller cohort of daughters, respectively, than they themselves represented.
Sarma and Choudhury: Impact of migration on net reproduction rate in the districts of Kerala and Assam
207
The conventional NRR and the intrinsic rate of growth (derived from the NRR and the age specific fertility rates) are measures not well suited to a world in which migration plays a major role. These measures demonstrate the implications of keeping age-specific rates of fertility and/or mortality fixed at some observed level, and setting age-specific migration rate at zero. However, compact formulas can be derived without the assumption of zero net migration (Preston and Wang 2007).
One of the indirect methods, called ‘The variable-r method’ (Preston et al. 2003) suggests that NRR can be recaptured without any reference to the underlying mortality and fertility schedule if good-quality age data are available from two censuses taken 5 or 10 years apart, along with the data of inter-censal age-specific female births. The NRR computed from such inter-censal data (termed NRR*) and the intrinsic growth rate derived from the NRR* (termed r*) include a provision for the allowance of net migration. The NRR* indicates how many daughters would be born, on average, to a cohort of female babies who pass through life and are subject at each age to observed rates of fer-tility, mortality, and migration. The intrinsic growth rate in the presence of migration (r*) is a precise measure of how fast a population would eventually grow if the current age-specific rate of fertility, mortality, and migration were maintained indefinitely. Of course r* will not be affected by migration that occurs beyond the age of childbearing (Preston and Wang 2007).
India has 28 states and 7 union territories with 593 districts, as per the 2001 census. Consid-ering the opposing demographic characteristics of Kerala and Assam, and the enormity of giving a district-level analysis for all the districts in a single paper, we chose the districts of these two states for estimating NRR, before and after allowance for migration, and shall assess the speed of population growth of these districts in the presence of migration. We have taken the period 1991–2001 for this paper, as the 2011 census data had not been published at the time of prepar-ing this paper.
Data and method
Estimation of conventional NRR (before allowance for migration)
Choudhury and Sarma (2011) have generated one-parameter model life tables for the major states of India, where life expectancy at birth (e0
0 ) is the only input. The e00 for the districts can be
estimated by regression method, using the estimated infant mortality rates of the districts and the proportion of persons aged 65 years and above (Sarma and Choudhury 2010). Thus, the life tables for the districts of the major states can be obtained from the estimated e0
0.Guilmoto and Rajan (2002) estimated the Total Fertility Rate (TFR) for the districts of India,
using 2001 census data. These are recent estimates at the district level, and are used in the present study for estimating GRR and NRR for the districts of Kerala and Assam.3
The Birth Rates for the selected major states and their districts can be estimated by the reverse survival technique, using the 0–4 population of 2001 census and the 0–4 survival probabilities from
3. (Preston et al. 2003),
where SRB is the sex ratio at birth, computed as ,
and BR(M), BR(F), and BR(T) denote the male, female, and total Birth Rates, respectively.
SRBTFRGRR
+=
11*
3
available from two censuses taken 5 or 10 years apart, along with the data of inter-censal age-specific female births. The NRR computed from such inter-censal data (termed NRR*) and the intrinsic growth rate derived from the NRR* (termed r*) include a provision for the allowance of net migration. The NRR* indicates how many daughters would be born, on average, to a cohort of female babies who pass through life and are subject at each age to observed rates of fertility, mortality, and migration. The intrinsic growth rate in the presence of migration (r*) is a precise measure of how fast a population would eventually grow if the current age-specific rate of fertility, mortality, and migration were maintained indefinitely. Of course r* will not be affected by migration that occurs beyond the age of childbearing (Preston and Wang 2007).
India has 28 states and 7 union territories with 593 districts, as per the 2001 census. Considering the opposing demographic characteristics of Kerala and Assam, and the enormity of giving a district-level analysis for all the districts in a single paper, we chose the districts of these two states for estimating NRR, before and after allowance for migration, and shall assess the speed of population growth of these districts in the presence of migration. We have taken the period 1991–2001 for this paper, as the 2011 census data had not been published at the time of preparing this paper.
Data and Method
(i) Estimation of conventional NRR (before allowance for migration)
Choudhury and Sarma (2011) have generated one-parameter model life tables for the major states of India, where life expectancy at birth (e0
0) is the only input. The e00 for the districts can be estimated by regression
method, using the estimated infant mortality rates of the districts and the proportion of persons aged 65 years and above (Sarma and Choudhury 2010). Thus, the life tables for the districts of the major states can be obtained from the estimated e0
0.
Guilmoto and Rajan (2002) estimated the Total Fertility Rate (TFR) for the districts of India, using 2001 census data. These are recent estimates at the district level, and are used in the present study for estimating GRR and NRR for the districts of Kerala and Assam.2
The Birth Rates for the selected major states and their districts can be estimated by the reverse survival technique, using the 0–4 population of 2001 census and the 0–4 survival probabilities from our generated life tables. These Birth Rates are centered on mid-1998, as the 0–4 population in the 2001 census refers to the births during 1996–2001.3
2
SRBTFRGRR
11* , (Preston et al. 2003)
ly.respectiveRates,Birthtotalandfemale,male,thedenote)(and),(),(
and,)(
)()()()(ascomputedbirth,atratiosextheiswhere
TBRFBRMBRFBR
FBRTBRFBRMBRSRBSRB
3 The population as of mid-1998 is computed by r
mid ePP 5.220011998
, where 2001P is the total population in 2001, r is the exponential growth rate of population
during 1991 to 2001.
The BR for mid-1998 is computed by the Reverse Survival Method, as
Canadian Studies in Population 40, no. 3–4 (2013)
208
our generated life tables. These Birth Rates are centered on mid-1998, as the 0–4 population in the 2001 census refers to the births during 1996–2001.4
This estimation process is sensitive to the level of age misstatement of the 0–4 population. However, with rapid improvement in the literacy level, the intensity of age misstatement is decreas-ing rapidly and the quality of age data in the 2001 census has most probably improved compared to the previous censuses (Guilmoto and Rajan 2002).
Using the estimated GRR, NRR can be estimated by multiplying the GRR with the probability of survival of a female baby to the mean age of childbearing.5
The probability of survival of a female baby to the mean age of childbearing [ p(AM) = p(29)]can be calculated from the generated female life tables by interpolating between age 25 and 30.
From SRS data, AM are computed for the states of India and found to vary from 25.9 to 29.6 years. However, the estimates of NRR computed by taking AM = 29 do not differ from the ones taking the corresponding estimated values of AM for the states. So, the assumption of AM = 29 is justified.
It is to be noted that the SRB calculated from the estimated birth rates are centered on mid-1998 while the TFR estimated by Guilmoto and Rajan (2002) are centered on 1997.
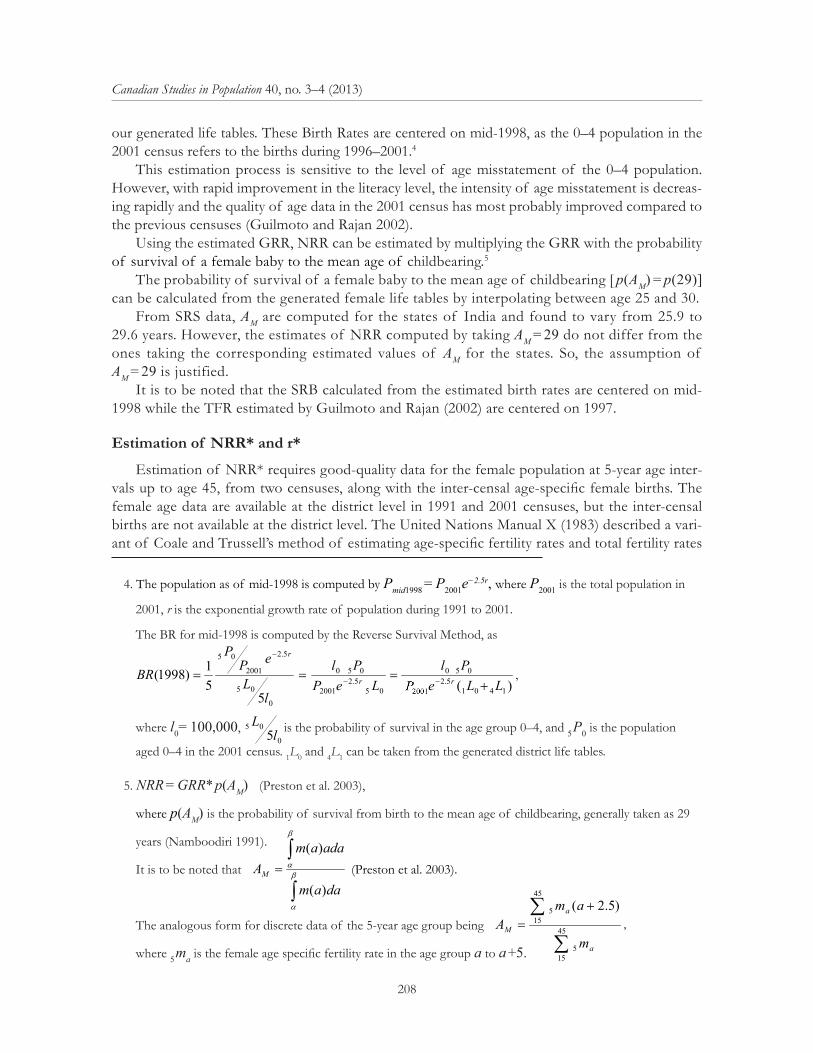
Estimation of NRR* and r*
Estimation of NRR* requires good-quality data for the female population at 5-year age inter-vals up to age 45, from two censuses, along with the inter-censal age-specific female births. The female age data are available at the district level in 1991 and 2001 censuses, but the inter-censal births are not available at the district level. The United Nations Manual X (1983) described a vari-ant of Coale and Trussell’s method of estimating age-specific fertility rates and total fertility rates
4. The population as of mid-1998 is computed by Pmid1998 = P2001e−2.5r, where P2001 is the total population in
2001, r is the exponential growth rate of population during 1991 to 2001.
The BR for mid-1998 is computed by the Reverse Survival Method, as
where l0= 100,000, is the probability of survival in the age group 0–4, and 5 P0 is the population
aged 0–4 in the 2001 census. 1L0 and 4L1 can be taken from the generated district life tables.
5. NRR = GRR* p(AM) (Preston et al. 2003),
where p(AM) is the probability of survival from birth to the mean age of childbearing, generally taken as 29
years (Namboodiri 1991).
It is to be noted that (Preston et al. 2003).
The analogous form for discrete data of the 5-year age group being
where 5 ma is the female age specific fertility rate in the age group a to a +5.
4
This estimation process is sensitive to the level of age misstatement of the 0–4 population. However, with rapid improvement in the literacy level, the intensity of age misstatement is decreasing rapidly and the quality of age data in the 2001 census has most probably improved compared to the previous censuses (Guilmoto and Rajan 2002).
Using the estimated GRR, NRR can be estimated by multiplying the GRR with the probability of survival of a female baby to the mean age of childbearing.4
The probability of survival of a female baby to the mean age of childbearing [ )]29()( pAp M can be calculated from the generated female life tables by interpolating between age 25 and 30.
From SRS data, MA are computed for the states of India and found to vary from 25.9 to 29.6 years. However, the estimates of NRR computed by taking MA = 29 do not differ from the ones taking the corresponding estimated values of MA for the states. So, the assumption of MA = 29 is justified.
It is to be noted that the SRB calculated from the estimated birth rates are centered on mid-1998 while the TFR estimated by Guilmoto and Rajan (2002) are centered on 1997.
)(5
51)1998(
14015.2
2001
050
055.2
2001
050
0
05
5.2
2001
05
LLepPl
LePPl
lL
ePP
BR rr
r
,
where 0l = 100,000, 0
055l
L is probability of survival in the age group 0–4, and 05 P is the population aged 0–4 in 2001
census. 1L0 and 4L1 can be taken from the generated district life tables.
4 )(* MApGRRNRR (Preston et al. 2003),
where )( MAp is the probability of survival from birth to the mean age of childbearing, generally taken as 29 years
(Namboodiri 1991).
It is to be noted that
daam
adaamAM
)(
)( (Preston et al. 2003)
The analogous form for discrete data of the 5-year age group being
45
155
45
155 )5.2(
a
a
M
m
amA ,
where am5 is the female age specific fertility rate in the age group a to a+5.
4
This estimation process is sensitive to the level of age misstatement of the 0–4 population. However, with rapid improvement in the literacy level, the intensity of age misstatement is decreasing rapidly and the quality of age data in the 2001 census has most probably improved compared to the previous censuses (Guilmoto and Rajan 2002).
Using the estimated GRR, NRR can be estimated by multiplying the GRR with the probability of survival of a female baby to the mean age of childbearing.4
The probability of survival of a female baby to the mean age of childbearing [ )]29()( pAp M can be calculated from the generated female life tables by interpolating between age 25 and 30.
From SRS data, MA are computed for the states of India and found to vary from 25.9 to 29.6 years. However, the estimates of NRR computed by taking MA = 29 do not differ from the ones taking the corresponding estimated values of MA for the states. So, the assumption of MA = 29 is justified.
It is to be noted that the SRB calculated from the estimated birth rates are centered on mid-1998 while the TFR estimated by Guilmoto and Rajan (2002) are centered on 1997.
)(5
51)1998(
14015.2
2001
050
055.2
2001
050
0
05
5.2
2001
05
LLepPl
LePPl
lL
ePP
BR rr
r
,
where 0l = 100,000, 0
055l
L is probability of survival in the age group 0–4, and 05 P is the population aged 0–4 in 2001
census. 1L0 and 4L1 can be taken from the generated district life tables.
4 )(* MApGRRNRR (Preston et al. 2003),
where )( MAp is the probability of survival from birth to the mean age of childbearing, generally taken as 29 years
(Namboodiri 1991).
It is to be noted that
daam
adaamAM
)(
)( (Preston et al. 2003)
The analogous form for discrete data of the 5-year age group being
45
155
45
155 )5.2(
a
a
M
m
amA ,
where am5 is the female age specific fertility rate in the age group a to a+5. 4
This estimation process is sensitive to the level of age misstatement of the 0–4 population. However, with rapid improvement in the literacy level, the intensity of age misstatement is decreasing rapidly and the quality of age data in the 2001 census has most probably improved compared to the previous censuses (Guilmoto and Rajan 2002).
Using the estimated GRR, NRR can be estimated by multiplying the GRR with the probability of survival of a female baby to the mean age of childbearing.4
The probability of survival of a female baby to the mean age of childbearing [ )]29()( pAp M can be calculated from the generated female life tables by interpolating between age 25 and 30.
From SRS data, MA are computed for the states of India and found to vary from 25.9 to 29.6 years. However, the estimates of NRR computed by taking MA = 29 do not differ from the ones taking the corresponding estimated values of MA for the states. So, the assumption of MA = 29 is justified.
It is to be noted that the SRB calculated from the estimated birth rates are centered on mid-1998 while the TFR estimated by Guilmoto and Rajan (2002) are centered on 1997.
)(5
51)1998(
14015.2
2001
050
055.2
2001
050
0
05
5.2
2001
05
LLepPl
LePPl
lL
ePP
BR rr
r
,
where 0l = 100,000, 0
055l
L is probability of survival in the age group 0–4, and 05 P is the population aged 0–4 in 2001
census. 1L0 and 4L1 can be taken from the generated district life tables.
4 )(* MApGRRNRR (Preston et al. 2003),
where )( MAp is the probability of survival from birth to the mean age of childbearing, generally taken as 29 years
(Namboodiri 1991).
It is to be noted that
daam
adaamAM
)(
)( (Preston et al. 2003)
The analogous form for discrete data of the 5-year age group being
45
155
45
155 )5.2(
a
a
M
m
amA ,
where am5 is the female age specific fertility rate in the age group a to a+5.
Sarma and Choudhury: Impact of migration on net reproduction rate in the districts of Kerala and Assam
209
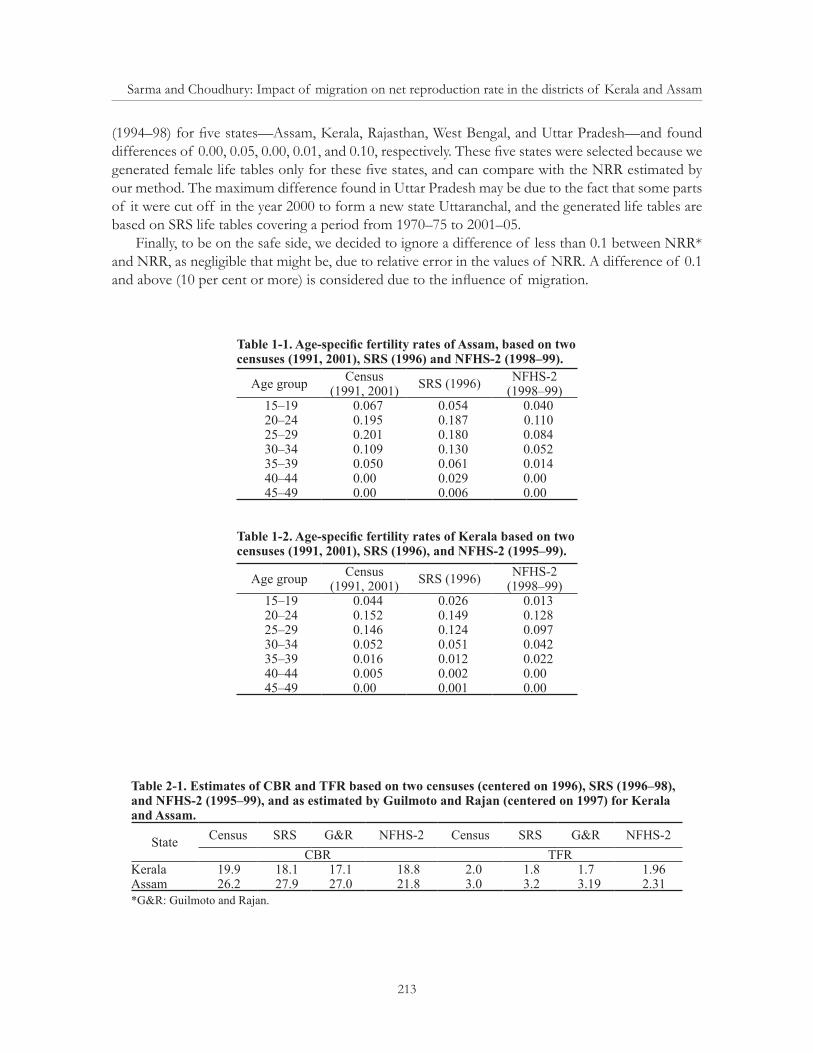
between two censuses. The data required for this are children ever-born, classified by 5-year age group of mothers, and the number of women, classified by 5-year age group, both from two cen-suses, 5 or 10 years apart. These data are available at the district level of India from 1991 and 2001 censuses. There is a general tendency for older women to omit some of their children, perhaps those who have died or who have left home. Such omission errors may result in under-estimation of fertility of older women (United Nations 1983). In estimating the age-specific fertility for Ker-ala and Assam and their districts, we have encountered, in some cases, such omission errors in the age group of 40–44 and 45–49. However, the magnitudes of the fertility rates in these age groups are so small that they may be ignored. A comparison of the age-specific fertility rates estimated this way, and that of SRS and NFHS-2, are presented in Table 1-1 and 1-2. After estimating the age-specific fertility rates, the inter-censal age-specific births are obtained from the age-specific fertility rates by multiplying them with the corresponding interpolated female population of 1996. Divid-ing the age-specific inter-censal births by (1+ SRB), the age-specific inter-censal female births are estimated. Using these estimated age-specific inter-censal female births and the age distribution of the female population of 1991 and 2001 censuses, NRR* for the districts can be estimated.6 Using the estimated NRR*, the age-specific proportion of female births and age distribution of the female population from the two censuses r* can be estimated by the iteration method (Preston 2003).7
Results and discussion
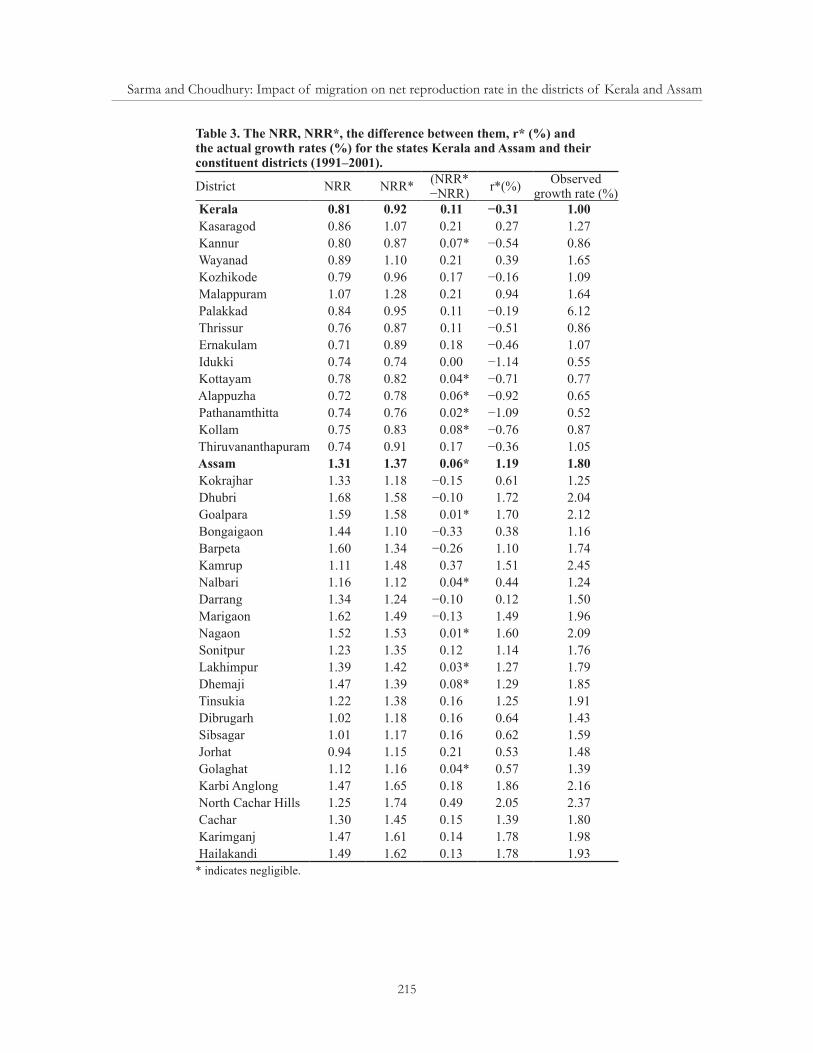
Table 3 presents the estimates of NRR, NRR*, the difference between them, r* (in percentage), and the observed growth rates of the population (in percentage) for the states Kerala and Assam and their constituent districts. In Kerala, only one district (Malapuram, NRR = 1.07) has above-replace-ment-level NRR, while in Assam, only one district (Jorhat, NRR = 0.94) achieved below-replacement-level NRR.
Allowing for migration shows that all the districts of Kerala except Idukki are recipients of net immigration. The immigration to the districts Kannur, Kottayam, Alappuzha, Pathanamthitta, and Kolam are considered to be negligible (see limitations). In the other districts, immigration raises the NRR by 0.10–0.21, and also raises the NRR of the Kasaragod, Wayanad, and Malappuram districts
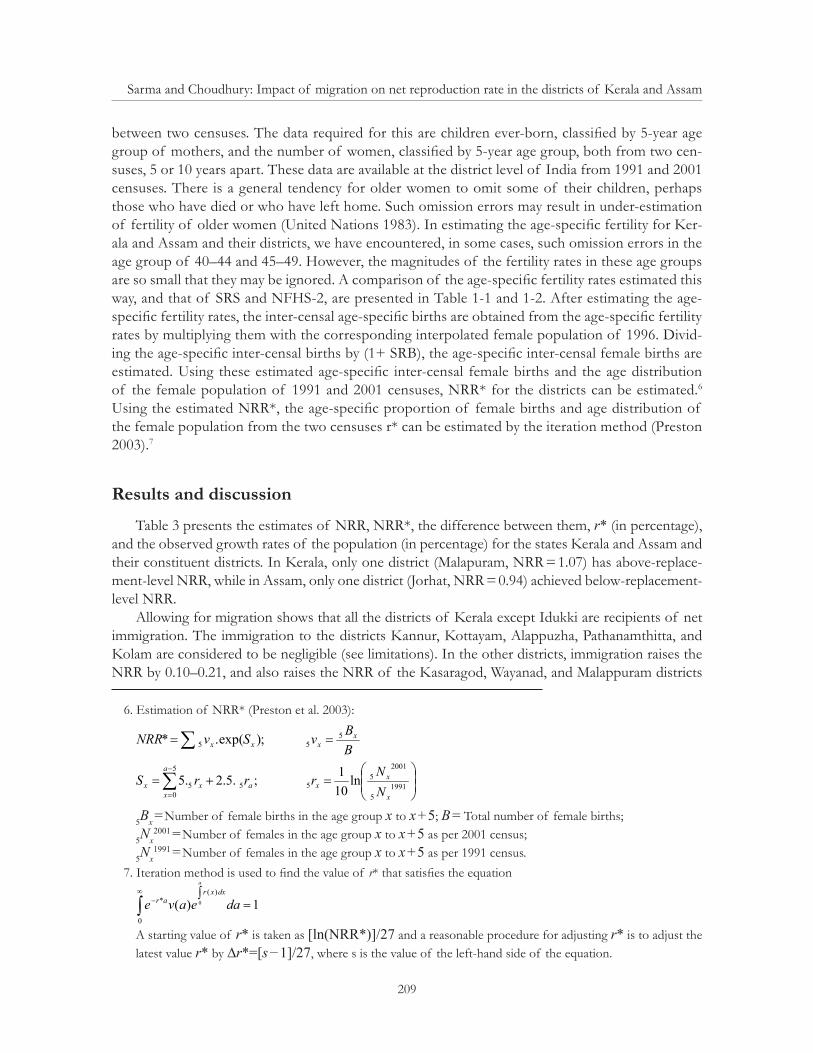
6. Estimation of NRR* (Preston et al. 2003):
5Bx = Number of female births in the age group x to x + 5; B = Total number of female births;
5Nx2001 = Number of females in the age group x to x + 5 as per 2001 census;
5Nx1991 = Number of females in the age group x to x + 5 as per 1991 census.
7. Iteration method is used to find the value of r* that satisfies the equation
A starting value of r* is taken as [ln(NRR*)]/27 and a reasonable procedure for adjusting r* is to adjust the latest value r* by ∆r*=[s − 1]/27, where s is the value of the left-hand side of the equation.
5
(ii) Estimation of NRR* and r*
Estimation of NRR* requires good-quality data for the female population at 5-year age intervals up to age 45, from two censuses, along with the inter-censal age-specific female births. The female age data are available at the district level in 1991 and 2001 censuses, but the inter-censal births are not available at the district level. The United Nations Manual X (1983) described a variant of Coale and Trussell’s method of estimating age-specific fertility rates and total fertility rates between two censuses. The data required for this are children ever-born, classified by 5-year age group of mothers, and the number of women, classified by 5-year age group, both from two censuses, 5 or 10 years apart. These data are available at the district level of India from 1991 and 2001 censuses. There is a general tendency for older women to omit some of their children, perhaps those who have died or who have left home. Such omission errors may result in under-estimation of fertility of older women (United Nations 1983). In estimating the age-specific fertility for Kerala and Assam and their districts, we have encountered, in some cases, such omission errors in the age group of 40–44 and 45–49. However, the magnitudes of the fertility rates in these age groups are so small that they may be ignored. A comparison of the age-specific fertility rates estimated this way, and that of SRS and NFHS-2, are presented in Table 1(i)–(ii). After estimating the age-specific fertility rates, the inter-censal age-specific births are obtained from the age-specific fertility rates by multiplying them with the corresponding interpolated female population of 1996. Dividing the age-specific inter-censal births by (1+ SRB), the age-specific inter-censal female births are estimated. Using these estimated age-specific inter-censal female births and the age distribution of the female population of 1991 and 2001 censuses, NRR* for the districts can be estimated.5 Using the estimated NRR*, the age-specific proportion of female births and age distribution of the female population from the two censuses r* can be estimated by the iteration method (Preston 2003).6
Results and discussion
Table 3 presents the estimates of NRR, NRR*, the difference between them, r* (in percentage), and the observed growth rates of the population (in percentage) for the states Kerala and Assam and their constituent
5 Estimation of NRR* (Preston et al. 2003)
BBvSvNRR x
xxx5
55 ;)exp(.*
1991
5
20015
5
5
055 ln
101;.5.2.5
x
xx
a
xaxx N
NrrrS
censusperasxtoxgroupagetheinfemalesofNumberN
censusperasxtoxgroupagetheinfemalesofNumberN
birthsfemaleofnumberTotalBxtoxgroupagetheinbirthsfemaleofNumberB
x
x
x
19915
20015
;5
19915
20015
5
6 Iteration method is used to find the value of r* that satisfies the equation
0
)(* 1)( 0 daeave
a
dxxrar
A starting value of r* is taken as [ln(NRR*)]/27 and a reasonable procedure for adjusting r* is to adjust the latest value r*
by ∆r*=[s−1]/27, where s is the value of the left-hand side of the equation.
5
(ii) Estimation of NRR* and r*
Estimation of NRR* requires good-quality data for the female population at 5-year age intervals up to age 45, from two censuses, along with the inter-censal age-specific female births. The female age data are available at the district level in 1991 and 2001 censuses, but the inter-censal births are not available at the district level. The United Nations Manual X (1983) described a variant of Coale and Trussell’s method of estimating age-specific fertility rates and total fertility rates between two censuses. The data required for this are children ever-born, classified by 5-year age group of mothers, and the number of women, classified by 5-year age group, both from two censuses, 5 or 10 years apart. These data are available at the district level of India from 1991 and 2001 censuses. There is a general tendency for older women to omit some of their children, perhaps those who have died or who have left home. Such omission errors may result in under-estimation of fertility of older women (United Nations 1983). In estimating the age-specific fertility for Kerala and Assam and their districts, we have encountered, in some cases, such omission errors in the age group of 40–44 and 45–49. However, the magnitudes of the fertility rates in these age groups are so small that they may be ignored. A comparison of the age-specific fertility rates estimated this way, and that of SRS and NFHS-2, are presented in Table 1(i)–(ii). After estimating the age-specific fertility rates, the inter-censal age-specific births are obtained from the age-specific fertility rates by multiplying them with the corresponding interpolated female population of 1996. Dividing the age-specific inter-censal births by (1+ SRB), the age-specific inter-censal female births are estimated. Using these estimated age-specific inter-censal female births and the age distribution of the female population of 1991 and 2001 censuses, NRR* for the districts can be estimated.5 Using the estimated NRR*, the age-specific proportion of female births and age distribution of the female population from the two censuses r* can be estimated by the iteration method (Preston 2003).6
Results and discussion
Table 3 presents the estimates of NRR, NRR*, the difference between them, r* (in percentage), and the observed growth rates of the population (in percentage) for the states Kerala and Assam and their constituent
5 Estimation of NRR* (Preston et al. 2003)
BBvSvNRR x
xxx5
55 ;)exp(.*
1991
5
20015
5
5
055 ln
101;.5.2.5
x
xx
a
xaxx N
NrrrS
censusperasxtoxgroupagetheinfemalesofNumberN
censusperasxtoxgroupagetheinfemalesofNumberN
birthsfemaleofnumberTotalBxtoxgroupagetheinbirthsfemaleofNumberB
x
x
x
19915
20015
;5
19915
20015
5
6 Iteration method is used to find the value of r* that satisfies the equation
0
)(* 1)( 0 daeave
a
dxxrar
A starting value of r* is taken as [ln(NRR*)]/27 and a reasonable procedure for adjusting r* is to adjust the latest value r*
by ∆r*=[s−1]/27, where s is the value of the left-hand side of the equation.
Canadian Studies in Population 40, no. 3–4 (2013)
210
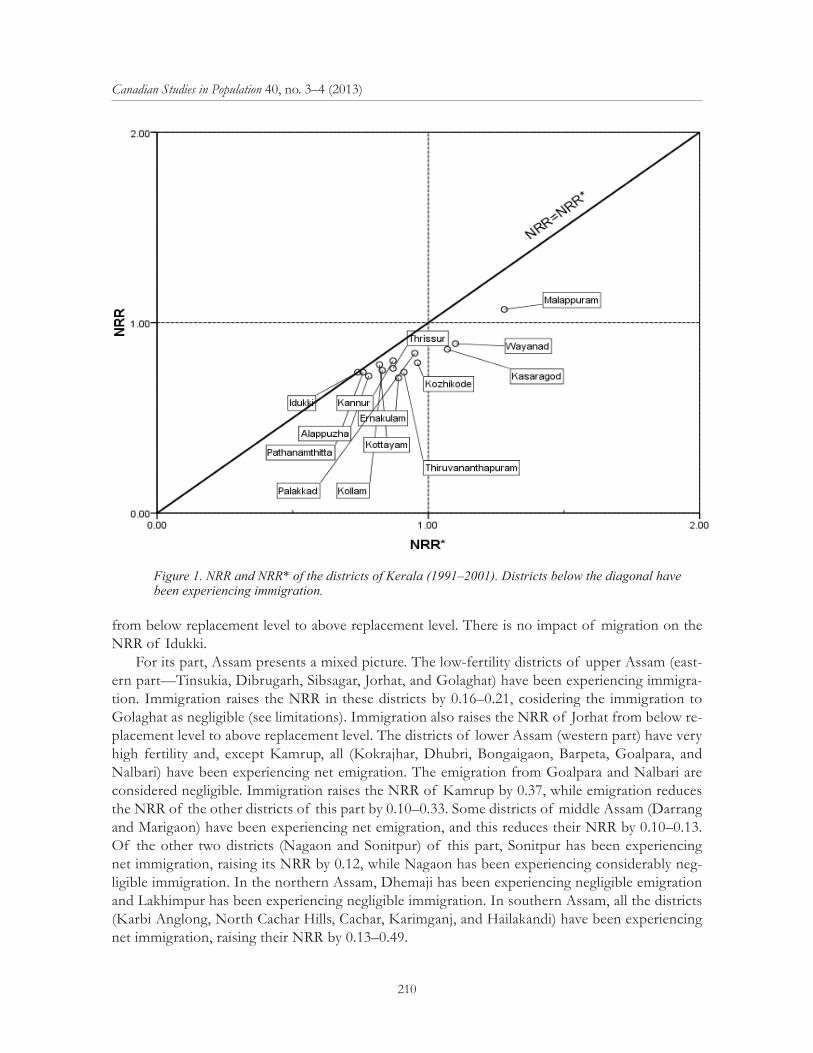
from below replacement level to above replacement level. There is no impact of migration on the NRR of Idukki.
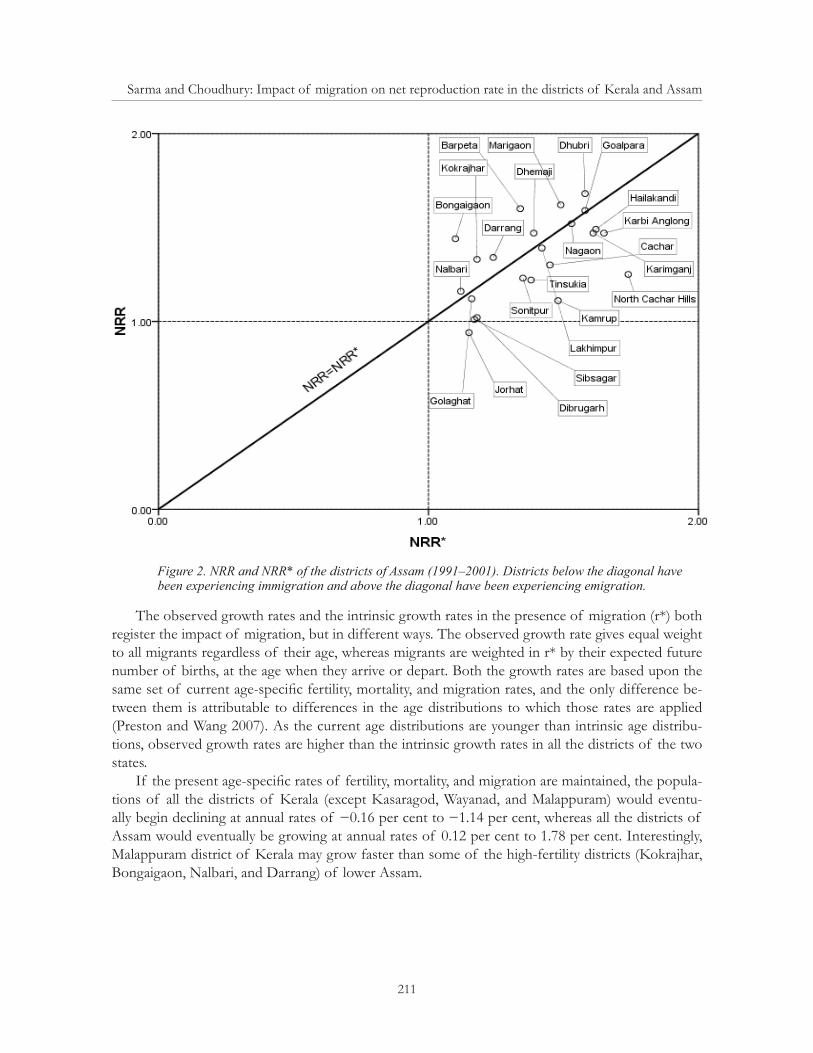
For its part, Assam presents a mixed picture. The low-fertility districts of upper Assam (east-ern part—Tinsukia, Dibrugarh, Sibsagar, Jorhat, and Golaghat) have been experiencing immigra-tion. Immigration raises the NRR in these districts by 0.16–0.21, cosidering the immigration to Golaghat as negligible (see limitations). Immigration also raises the NRR of Jorhat from below re-placement level to above replacement level. The districts of lower Assam (western part) have very high fertility and, except Kamrup, all (Kokrajhar, Dhubri, Bongaigaon, Barpeta, Goalpara, and Nalbari) have been experiencing net emigration. The emigration from Goalpara and Nalbari are considered negligible. Immigration raises the NRR of Kamrup by 0.37, while emigration reduces the NRR of the other districts of this part by 0.10–0.33. Some districts of middle Assam (Darrang and Marigaon) have been experiencing net emigration, and this reduces their NRR by 0.10–0.13. Of the other two districts (Nagaon and Sonitpur) of this part, Sonitpur has been experiencing net immigration, raising its NRR by 0.12, while Nagaon has been experiencing considerably neg-ligible immigration. In the northern Assam, Dhemaji has been experiencing negligible emigration and Lakhimpur has been experiencing negligible immigration. In southern Assam, all the districts (Karbi Anglong, North Cachar Hills, Cachar, Karimganj, and Hailakandi) have been experiencing net immigration, raising their NRR by 0.13–0.49.
Districts of Kerala NRR Kasaragod 0.86 Kannur 0.80 Wayanad 0.89 Kozhikode 0.79 Malappuram 1.07 Palakkad 0.84 Thrissur 0.76 Ernakulam 0.71 Idukki 0.74 Kottayam 0.78 Alappuzha 0.72 Pathanamthitta 0.74 Kollam 0.75 Thiruvananthapuram 0.74
Figure 1. NRR and NRR* of the districts of Kerala (1991–2001). Districts below the diagonal have been experiencing immigration.
Sarma and Choudhury: Impact of migration on net reproduction rate in the districts of Kerala and Assam
211
The observed growth rates and the intrinsic growth rates in the presence of migration (r*) both register the impact of migration, but in different ways. The observed growth rate gives equal weight to all migrants regardless of their age, whereas migrants are weighted in r* by their expected future number of births, at the age when they arrive or depart. Both the growth rates are based upon the same set of current age-specific fertility, mortality, and migration rates, and the only difference be-tween them is attributable to differences in the age distributions to which those rates are applied (Preston and Wang 2007). As the current age distributions are younger than intrinsic age distribu-tions, observed growth rates are higher than the intrinsic growth rates in all the districts of the two states.
If the present age-specific rates of fertility, mortality, and migration are maintained, the popula-tions of all the districts of Kerala (except Kasaragod, Wayanad, and Malappuram) would eventu-ally begin declining at annual rates of −0.16 per cent to −1.14 per cent, whereas all the districts of Assam would eventually be growing at annual rates of 0.12 per cent to 1.78 per cent. Interestingly, Malappuram district of Kerala may grow faster than some of the high-fertility districts (Kokrajhar, Bongaigaon, Nalbari, and Darrang) of lower Assam.
Figure 2. NRR and NRR* of the districts of Assam (1991–2001). Districts below the diagonal have been experiencing immigration and above the diagonal have been experiencing emigration.
Canadian Studies in Population 40, no. 3–4 (2013)
212
Limitations of the methodology and findings
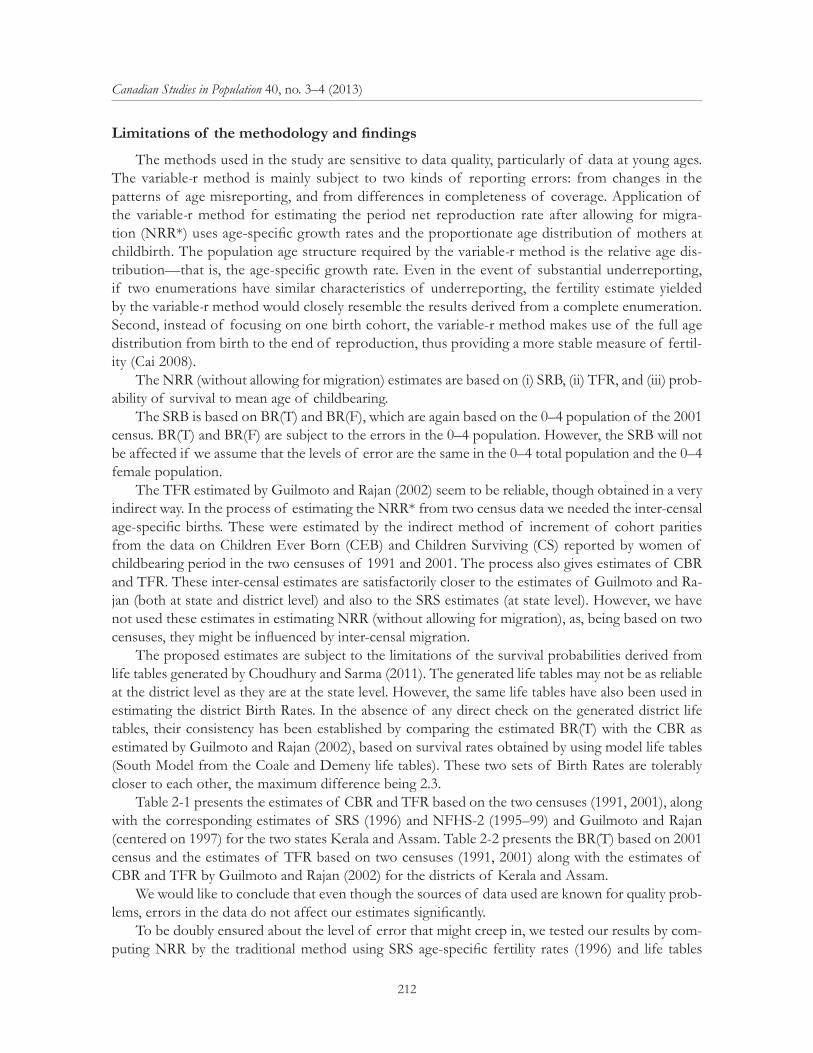
The methods used in the study are sensitive to data quality, particularly of data at young ages. The variable-r method is mainly subject to two kinds of reporting errors: from changes in the patterns of age misreporting, and from differences in completeness of coverage. Application of the variable-r method for estimating the period net reproduction rate after allowing for migra-tion (NRR*) uses age-specific growth rates and the proportionate age distribution of mothers at childbirth. The population age structure required by the variable-r method is the relative age dis-tribution—that is, the age-specific growth rate. Even in the event of substantial underreporting, if two enumerations have similar characteristics of underreporting, the fertility estimate yielded by the variable-r method would closely resemble the results derived from a complete enumeration. Second, instead of focusing on one birth cohort, the variable-r method makes use of the full age distribution from birth to the end of reproduction, thus providing a more stable measure of fertil-ity (Cai 2008).
The NRR (without allowing for migration) estimates are based on (i) SRB, (ii) TFR, and (iii) prob-ability of survival to mean age of childbearing.
The SRB is based on BR(T) and BR(F), which are again based on the 0–4 population of the 2001 census. BR(T) and BR(F) are subject to the errors in the 0–4 population. However, the SRB will not be affected if we assume that the levels of error are the same in the 0–4 total population and the 0–4 female population.
The TFR estimated by Guilmoto and Rajan (2002) seem to be reliable, though obtained in a very indirect way. In the process of estimating the NRR* from two census data we needed the inter-censal age-specific births. These were estimated by the indirect method of increment of cohort parities from the data on Children Ever Born (CEB) and Children Surviving (CS) reported by women of childbearing period in the two censuses of 1991 and 2001. The process also gives estimates of CBR and TFR. These inter-censal estimates are satisfactorily closer to the estimates of Guilmoto and Ra-jan (both at state and district level) and also to the SRS estimates (at state level). However, we have not used these estimates in estimating NRR (without allowing for migration), as, being based on two censuses, they might be influenced by inter-censal migration.
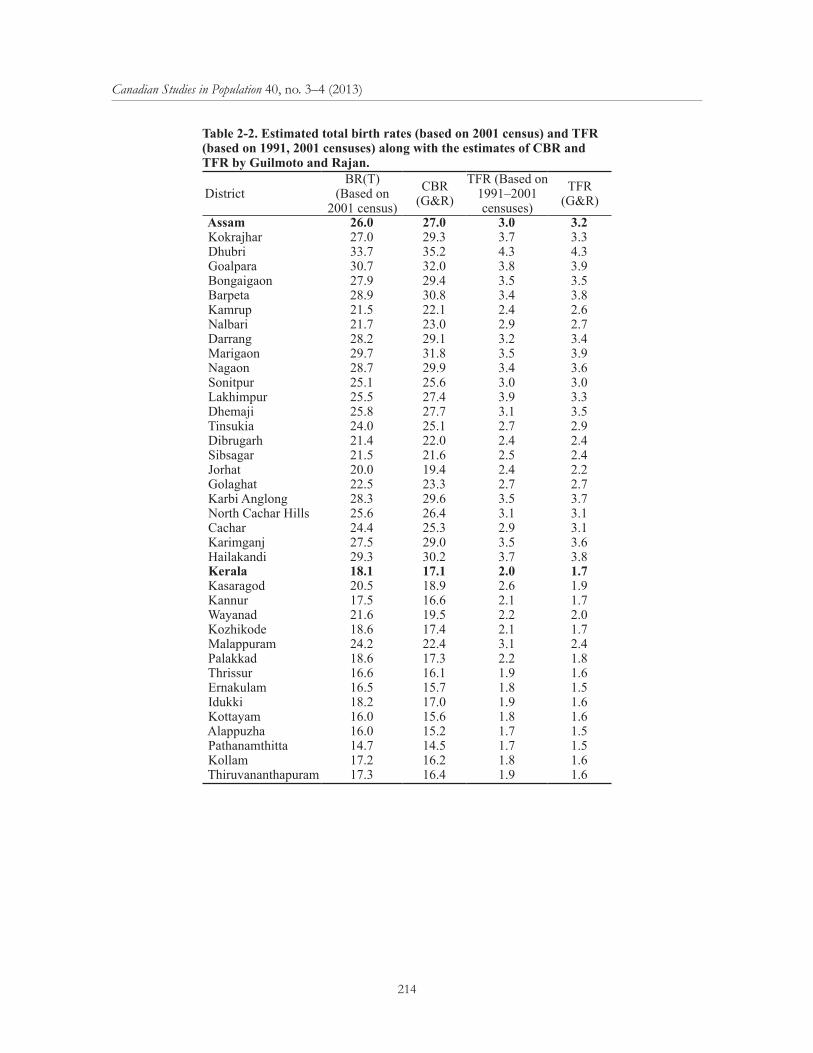
The proposed estimates are subject to the limitations of the survival probabilities derived from life tables generated by Choudhury and Sarma (2011). The generated life tables may not be as reliable at the district level as they are at the state level. However, the same life tables have also been used in estimating the district Birth Rates. In the absence of any direct check on the generated district life tables, their consistency has been established by comparing the estimated BR(T) with the CBR as estimated by Guilmoto and Rajan (2002), based on survival rates obtained by using model life tables (South Model from the Coale and Demeny life tables). These two sets of Birth Rates are tolerably closer to each other, the maximum difference being 2.3.
Table 2-1 presents the estimates of CBR and TFR based on the two censuses (1991, 2001), along with the corresponding estimates of SRS (1996) and NFHS-2 (1995–99) and Guilmoto and Rajan (centered on 1997) for the two states Kerala and Assam. Table 2-2 presents the BR(T) based on 2001 census and the estimates of TFR based on two censuses (1991, 2001) along with the estimates of CBR and TFR by Guilmoto and Rajan (2002) for the districts of Kerala and Assam.
We would like to conclude that even though the sources of data used are known for quality prob-lems, errors in the data do not affect our estimates significantly.
To be doubly ensured about the level of error that might creep in, we tested our results by com-puting NRR by the traditional method using SRS age-specific fertility rates (1996) and life tables
Sarma and Choudhury: Impact of migration on net reproduction rate in the districts of Kerala and Assam
213
(1994–98) for five states—Assam, Kerala, Rajasthan, West Bengal, and Uttar Pradesh—and found differences of 0.00, 0.05, 0.00, 0.01, and 0.10, respectively. These five states were selected because we generated female life tables only for these five states, and can compare with the NRR estimated by our method. The maximum difference found in Uttar Pradesh may be due to the fact that some parts of it were cut off in the year 2000 to form a new state Uttaranchal, and the generated life tables are based on SRS life tables covering a period from 1970–75 to 2001–05.
Finally, to be on the safe side, we decided to ignore a difference of less than 0.1 between NRR* and NRR, as negligible that might be, due to relative error in the values of NRR. A difference of 0.1 and above (10 per cent or more) is considered due to the influence of migration.
Table 1-1. Age-specific fertility rates of Assam, based on two censuses (1991, 2001), SRS (1996) and NFHS-2 (1998–99).
Age group Census(1991, 2001) SRS (1996) NFHS-2
(1998–99)15–19 0.067 0.054 0.04020–24 0.195 0.187 0.11025–29 0.201 0.180 0.08430–34 0.109 0.130 0.05235–39 0.050 0.061 0.01440–44 0.00 0.029 0.0045–49 0.00 0.006 0.00
Table 1-2. Age-specific fertility rates of Kerala based on two censuses (1991, 2001), SRS (1996), and NFHS-2 (1995–99).
Age group Census (1991, 2001) SRS (1996) NFHS-2
(1998–99)15–19 0.044 0.026 0.01320–24 0.152 0.149 0.12825–29 0.146 0.124 0.09730–34 0.052 0.051 0.04235–39 0.016 0.012 0.02240–44 0.005 0.002 0.0045–49 0.00 0.001 0.00
Table 2-1. Estimates of CBR and TFR based on two censuses (centered on 1996), SRS (1996–98), and NFHS-2 (1995–99), and as estimated by Guilmoto and Rajan (centered on 1997) for Kerala and Assam.
State Census SRS G&R NFHS-2 Census SRS G&R NFHS-2CBR TFR
Kerala 19.9 18.1 17.1 18.8 2.0 1.8 1.7 1.96Assam 26.2 27.9 27.0 21.8 3.0 3.2 3.19 2.31*G&R: Guilmoto and Rajan.
Canadian Studies in Population 40, no. 3–4 (2013)
214
Table 2-2. Estimated total birth rates (based on 2001 census) and TFR (based on 1991, 2001 censuses) along with the estimates of CBR and TFR by Guilmoto and Rajan.
DistrictBR(T)
(Based on 2001 census)
CBR (G&R)
TFR (Based on 1991–2001 censuses)
TFR(G&R)
Assam 26.0 27.0 3.0 3.2 Kokrajhar 27.0 29.3 3.7 3.3 Dhubri 33.7 35.2 4.3 4.3 Goalpara 30.7 32.0 3.8 3.9 Bongaigaon 27.9 29.4 3.5 3.5 Barpeta 28.9 30.8 3.4 3.8 Kamrup 21.5 22.1 2.4 2.6 Nalbari 21.7 23.0 2.9 2.7 Darrang 28.2 29.1 3.2 3.4 Marigaon 29.7 31.8 3.5 3.9 Nagaon 28.7 29.9 3.4 3.6 Sonitpur 25.1 25.6 3.0 3.0 Lakhimpur 25.5 27.4 3.9 3.3 Dhemaji 25.8 27.7 3.1 3.5 Tinsukia 24.0 25.1 2.7 2.9 Dibrugarh 21.4 22.0 2.4 2.4 Sibsagar 21.5 21.6 2.5 2.4 Jorhat 20.0 19.4 2.4 2.2 Golaghat 22.5 23.3 2.7 2.7 Karbi Anglong 28.3 29.6 3.5 3.7 North Cachar Hills 25.6 26.4 3.1 3.1 Cachar 24.4 25.3 2.9 3.1 Karimganj 27.5 29.0 3.5 3.6 Hailakandi 29.3 30.2 3.7 3.8 Kerala 18.1 17.1 2.0 1.7 Kasaragod 20.5 18.9 2.6 1.9 Kannur 17.5 16.6 2.1 1.7 Wayanad 21.6 19.5 2.2 2.0 Kozhikode 18.6 17.4 2.1 1.7 Malappuram 24.2 22.4 3.1 2.4 Palakkad 18.6 17.3 2.2 1.8 Thrissur 16.6 16.1 1.9 1.6 Ernakulam 16.5 15.7 1.8 1.5 Idukki 18.2 17.0 1.9 1.6 Kottayam 16.0 15.6 1.8 1.6 Alappuzha 16.0 15.2 1.7 1.5 Pathanamthitta 14.7 14.5 1.7 1.5 Kollam 17.2 16.2 1.8 1.6 Thiruvananthapuram 17.3 16.4 1.9 1.6
Sarma and Choudhury: Impact of migration on net reproduction rate in the districts of Kerala and Assam
215
Table 3. The NRR, NRR*, the difference between them, r* (%) and the actual growth rates (%) for the states Kerala and Assam and their constituent districts (1991–2001).
District NRR NRR* (NRR* −NRR) r*(%) Observed
growth rate (%) Kerala 0.81 0.92 0.11 −0.31 1.00 Kasaragod 0.86 1.07 0.21 0.27 1.27 Kannur 0.80 0.87 0.07* −0.54 0.86 Wayanad 0.89 1.10 0.21 0.39 1.65 Kozhikode 0.79 0.96 0.17 −0.16 1.09 Malappuram 1.07 1.28 0.21 0.94 1.64 Palakkad 0.84 0.95 0.11 −0.19 6.12 Thrissur 0.76 0.87 0.11 −0.51 0.86 Ernakulam 0.71 0.89 0.18 −0.46 1.07 Idukki 0.74 0.74 0.00 −1.14 0.55 Kottayam 0.78 0.82 0.04* −0.71 0.77 Alappuzha 0.72 0.78 0.06* −0.92 0.65 Pathanamthitta 0.74 0.76 0.02* −1.09 0.52 Kollam 0.75 0.83 0.08* −0.76 0.87 Thiruvananthapuram 0.74 0.91 0.17 −0.36 1.05 Assam 1.31 1.37 0.06* 1.19 1.80 Kokrajhar 1.33 1.18 −0.15 0.61 1.25 Dhubri 1.68 1.58 −0.10 1.72 2.04 Goalpara 1.59 1.58 0.01* 1.70 2.12 Bongaigaon 1.44 1.10 −0.33 0.38 1.16 Barpeta 1.60 1.34 −0.26 1.10 1.74 Kamrup 1.11 1.48 0.37 1.51 2.45 Nalbari 1.16 1.12 0.04* 0.44 1.24 Darrang 1.34 1.24 −0.10 0.12 1.50 Marigaon 1.62 1.49 −0.13 1.49 1.96 Nagaon 1.52 1.53 0.01* 1.60 2.09 Sonitpur 1.23 1.35 0.12 1.14 1.76 Lakhimpur 1.39 1.42 0.03* 1.27 1.79 Dhemaji 1.47 1.39 0.08* 1.29 1.85 Tinsukia 1.22 1.38 0.16 1.25 1.91 Dibrugarh 1.02 1.18 0.16 0.64 1.43 Sibsagar 1.01 1.17 0.16 0.62 1.59 Jorhat 0.94 1.15 0.21 0.53 1.48 Golaghat 1.12 1.16 0.04* 0.57 1.39 Karbi Anglong 1.47 1.65 0.18 1.86 2.16 North Cachar Hills 1.25 1.74 0.49 2.05 2.37 Cachar 1.30 1.45 0.15 1.39 1.80 Karimganj 1.47 1.61 0.14 1.78 1.98 Hailakandi 1.49 1.62 0.13 1.78 1.93* indicates negligible.
Canadian Studies in Population 40, no. 3–4 (2013)
216
Acknowledgement
We are grateful to the anonymous reviewers for comments and suggestions that improved the paper.
ReferencesBhat, P.N.M. 1996. Contours of fertility decline in India: A district level study based on the 1991
Census, in Population Policy and Reproductive Health, edited by K. Srinivasan. New Delhi: Hindustan Publishing Corporation, pp. 96–179.
Brass, W., and J. Coale. 1968. Methods of analysis and estimation, in The Demography of Tropical Africa, edited by W. Brass et al. Princeton: Princeton University Press, pp. 88–150.
Cai, Y. 2008. An assessment of China’s fertility level using the variable-r method. Demography 45(2):271–281.
Chandra Sekar, C., and W.E. Deming. 1949. On a method of estimating birth and death rates and the extent of registration. Journal of American Statistical Association 44(245):101–115.
China-Profile. 2011. www.china-profile.com/data/fig_WPP2010_NRR_1.htm (accessed on 24th August, 2011).
Choudhury, L., and R. Sarma. 2011. Generation of model life tables for the major states of India. International Journal of Statistics and Analysis 1(4):419–441.
Coale, A.J. 1981. A Reassessment of World Population Trends. International Population Conference, Manila 1981, 1983 proceedings, pp. 35–8. International Union for the Scientific Study of Population.
Das Gupta, M., and P.N.M. Bhat. 1995. Intensified gender bias in India: A consequence of fertility decline. Working Paper 95.02, Harvard Center for Population and Development Studies, Harvard University.
Goswami, N. 1996. Illegal migration in Assam: A concern for India’s national security. IDSA Issue Brief, Institute for Defense Studies and Analysis (http://www.idsa.in/issuebrief/BangladeshiillegalMigrationintoAssam_ngoswami_140110), New Delhi, India.
Governor of Assam. 1998. Report on illegal migration into Assam. A report submitted to the President of India by the Governor of Assam, 1998, Rajbhavan, Guwahati (www.assamganaparishad.in/article/SK Sinha’s REPORT.pdf).
Guilmoto, C.J., and S.I. Rajan. 2002. District level estimates of fertility from India’s 2001 census. Economic and Political Weekly, February 16, 2002, 665–672.
Gunasekaran and J.A. Palmore. 1984. Regression estimates of the gross reproduction rate using moments of the female age distribution. Asia and the Pacific Census Forum 10(4).
IIPS. 2011. www.iipsindia.org/pdf/05_b_09cchep3.pdf, (accessed on 15th Dec, 2011).
Namboodiri, K. 1991. Demographic Analysis: A Stochastic Approach. New York: Academic Press.
Nath, B.K., D.C. Nath, and B. Bhattacharya. 2012. Undocumented migration in the state of Assam in northeast India: Estimates since 1971 to 2001. Asian Journal of Applied Sciences 5(3):164–173.
Sarma and Choudhury: Impact of migration on net reproduction rate in the districts of Kerala and Assam
217
Palmore, J.A. 1978. Regression estimates of changes in fertility, 1995–60 to 1965–75, for most major nations and territories. Paper of the East-West Population Institute, no. 58, East-West Center, Honolulu, Hawaii.
Parasuraman, S., and F. Ram. 1988. Estimation of fertility for the district of Gujarat: An analysis 1981 Census. Reprint of International Institute of Population Studies, Mumbai-88.
Preston, S.H. 1983. An integrated system of demographic estimation from two age distributions. Demography 20(2):213–226.
Preston, S.H., and H. Wang. 2007. Intrinsic growth rates and net reproduction rates in the presence of migration. Population and Development Review 33(4):657–666.
Preston, S.H., P. Heuveline, and M. Guillot. 2003. Demography-Measuring and Modeling Population Processes. UK: Blackwell Publishers Limited.
Rao, K.V. 1981. Inter-state variations in population growth and population policy. Economic and Political Weekly 16(51):2105–2108.
Registrar General of India. 1989. Fertility in India: An analysis of 1981 census data. Occasional Paper No 13 of 1988, Controller of Publications, New Delhi.
———. 1997. District level estimate of fertility and child mortality for 1991 and their interrelations with other variables. Occasional Paper No 1 of 1997, Controller of Publications, New Delhi.
Rele, J.R. 1967. Fertility Analysis Through Extension of Stable Population Concepts. Institute of International Studies, University of California, Berkeley: Republished by Greenwood Press, Westport CT.
———. 1987. Fertility levels and trends in India, 1951–81. Population and Development Review 13(3):513–530.
Sarma, R., and Choudhury L. 2010. Indirect Estimation of Life expectancy at Birth at the District Level of India: A regression Approach. Paper presented at the 32nd Annual Conference and National Seminar on Population and Public Health, Indian Association for the Study of Population, Bhubaneswar, India (November 28–30).
Shryock, H.S., and J.S. Seigel. 1976. Methods and Materials of Demography. New York: Academic Press.
Surabhi, K.S., and N.A. Kumar. 2007. Labour Migration to Kerala: A Study of Tamil Migrant Labourers in Kerala. Working Paper 16, 2007, Centre for Socio-Economic and Environmental studies, Kochi, Kerala.
United Nations. 1983. Estimation of age specific fertility from increment of cohort parities between two surveys, in Indirect Techniques for Demographic Estimation, Manual X. Population Studies 81:58–61, New York, USA.
Zachariah, K., E.T. Mathew, and S.I. Rajan. 1999. Socio-Economic and Demographic Consequences of Migration in Kerala. Working Paper 303, Centre for Development Studies, Trivendrum, India.