moving beyond math & reading 3-8: how value-added models can incorporate other types of...
TRANSCRIPT

Moving Beyond Math & Reading 3-8: How Value-
Added Models Can Incorporate Other Types
of Assessments
Garron Gianopulos, PhDNorth Carolina Department of Public
Instruction
Marianne Motley, Ohio Department of Education
John White, PhDSAS, Instititute
June 25, 2014

Moving Beyond Math & Reading 3-8: How Value-Added Models Can Incorporate Other Types of Assessments
Marianne Mottley, Assistant Director, Office of Accountability
Ohio Department of Education
“A principal or a superintendent must be
able to say to the school board and the public:
Everyone who teaches here is good – and here’s how I know.”
- Charlotte Danielson


Improve teaching and
learning
Ultimate goal of teacher
evaluation

How do we get there?
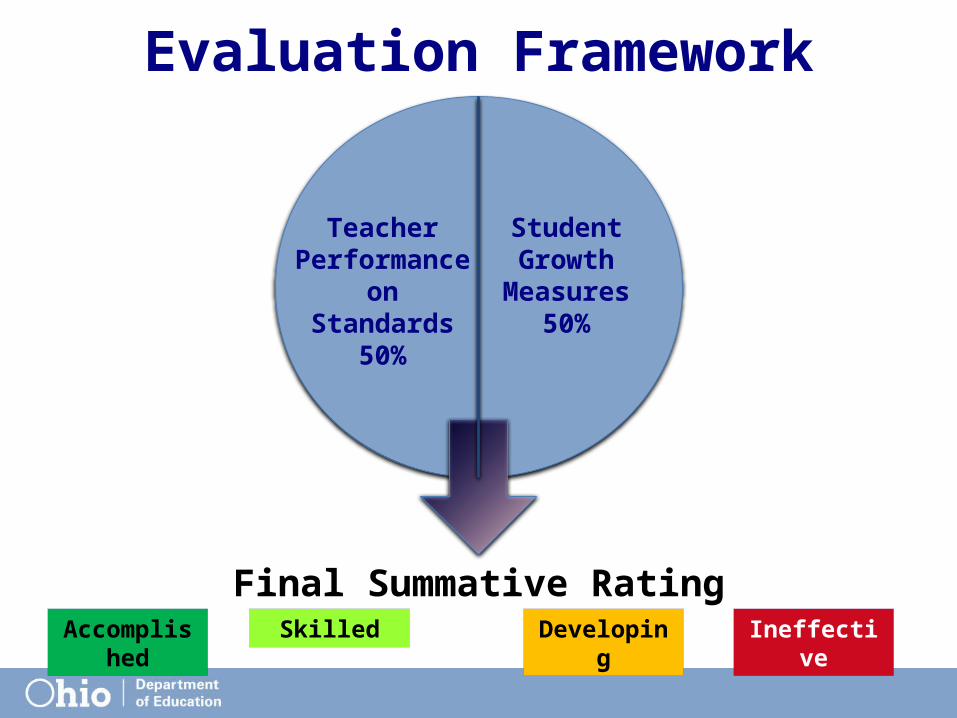
Evaluation Framework
Accomplished Skilled Developing Ineffective
Final Summative Rating
Teacher Performance on Standards
50%
Student Growth
Measures 50%

RttT Teacher-Student Linkage
Spring 2011
30% of Ohio’s
LEAs Participated
Spring 2012
60% of Ohio’s
LEAs Participated
Spring 2013
100% of Ohio’s
LEAs Participated

Linkage
Required Linkage Grades 4-8
- Reading
- Math
Optional Linkage for Extended Testing
- Grades K-3 reading and math
- Grades K-4, 6, 7 science
- Grades K-8 social studies
- Grades 9-12 all content areas

Extended Testing Programs
RttT Mini-Grant
- Grades 1-3 R/M
- Grades 2-3 Science
- Grade 3 Social Studies
Project SOAR
- Grade 3 R/M
- Grades 3-8 Social Studies
- Grades 3, 4, 6, 7 Science
- High School EOC Exams
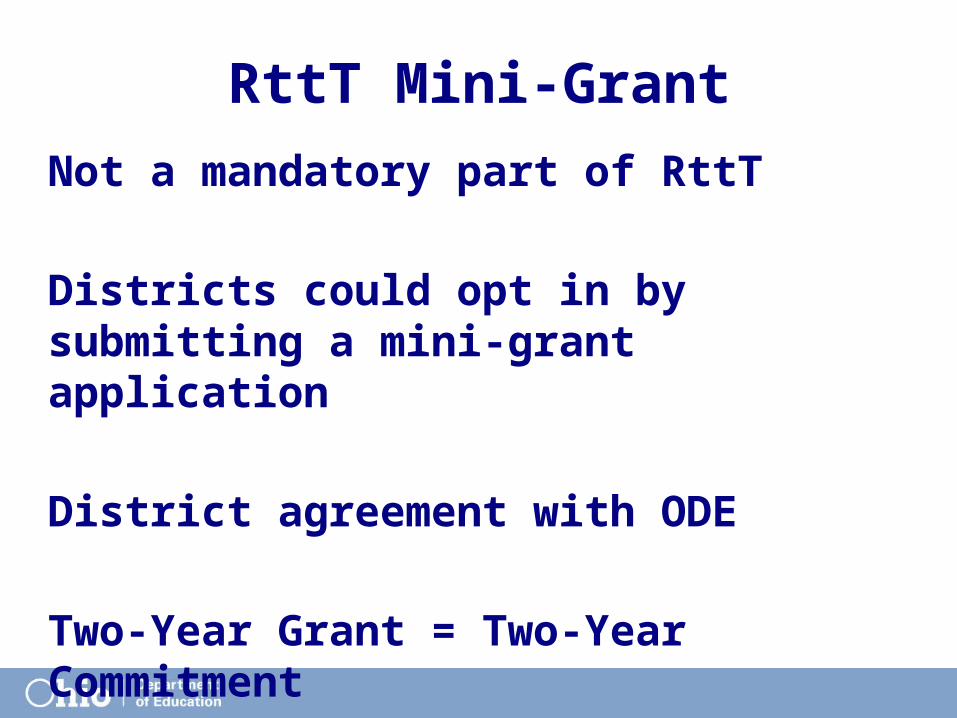
RttT Mini-Grant
Not a mandatory part of RttT
Districts could opt in by submitting a mini-grant application
District agreement with ODE
Two-Year Grant = Two-Year Commitment
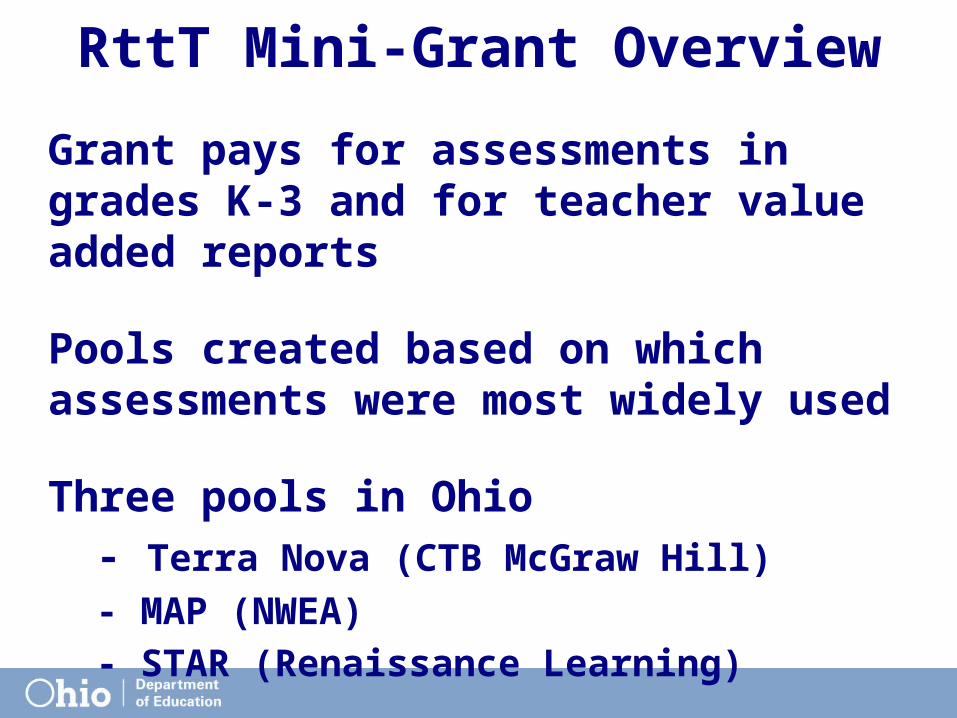
RttT Mini-Grant Overview
Grant pays for assessments in grades K-3 and for teacher value added reports
Pools created based on which assessments were most widely used
Three pools in Ohio
- Terra Nova (CTB McGraw Hill)
- MAP (NWEA)
- STAR (Renaissance Learning)

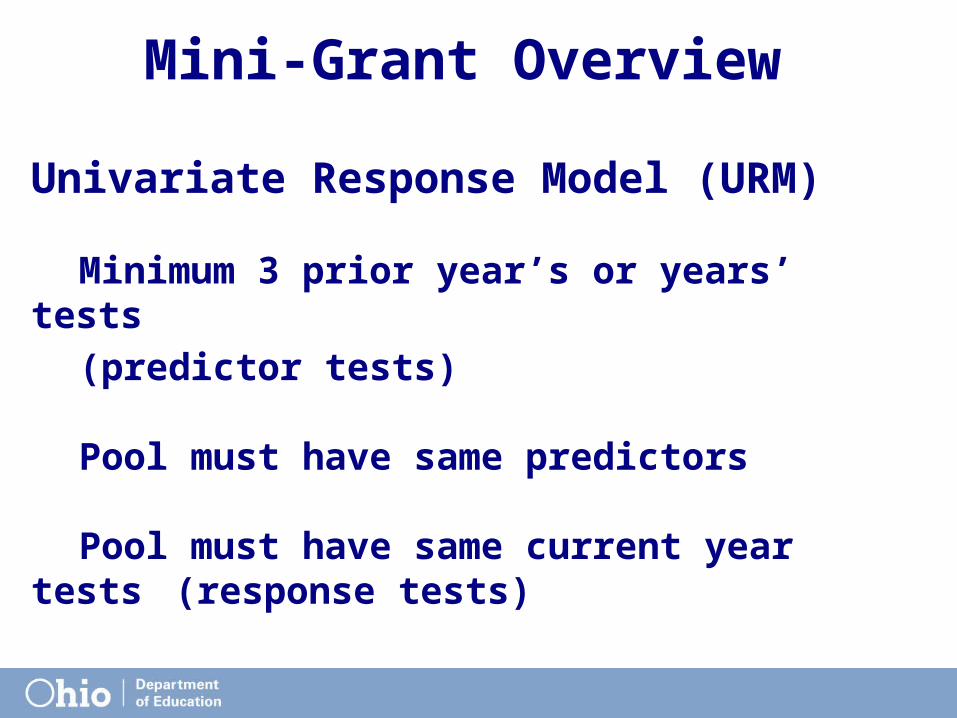
Mini-Grant Overview
Univariate Response Model (URM)
Predicted Mean Approach
Tests Properties
- High correlation to curricular objectives
- Have sufficient stretch
- Must be sufficiently reliable
Mini-Grant Overview
Univariate Response Model (URM)
Minimum 3 prior year’s or years’ tests
(predictor tests)
Pool must have same predictors
Pool must have same current year tests (response tests)

RttT Mini-Grant Overview
Predictor Testing Requirements
Terra Nova - Spring window in at least 3 subjects
- Reading and math mandatory
- Science or social studies optional
MAP/STAR- Fall & spring windows in at least 2
subjects - Reading and math mandatory

Mini-Grant Overview
Some districts had prior test data and received reports in 2013
For others, 2014 will be their first year when reports will be generated
Pools must remain stable across years
Districts cannot deviate from a pool
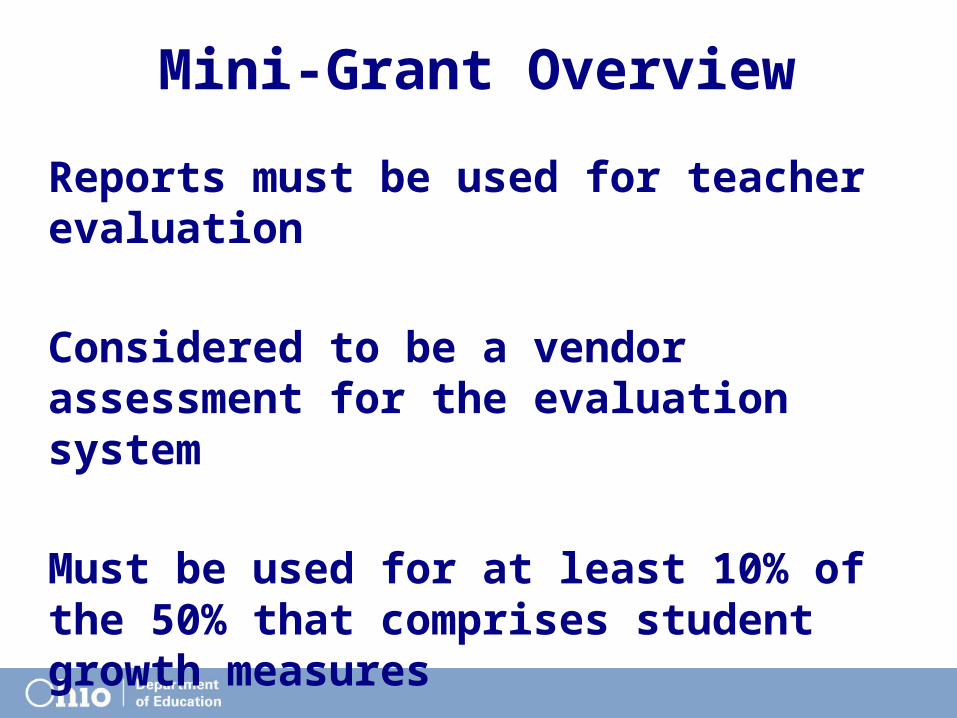
Mini-Grant Overview
Reports must be used for teacher evaluation
Considered to be a vendor assessment for the evaluation system
Must be used for at least 10% of the 50% that comprises student growth measures
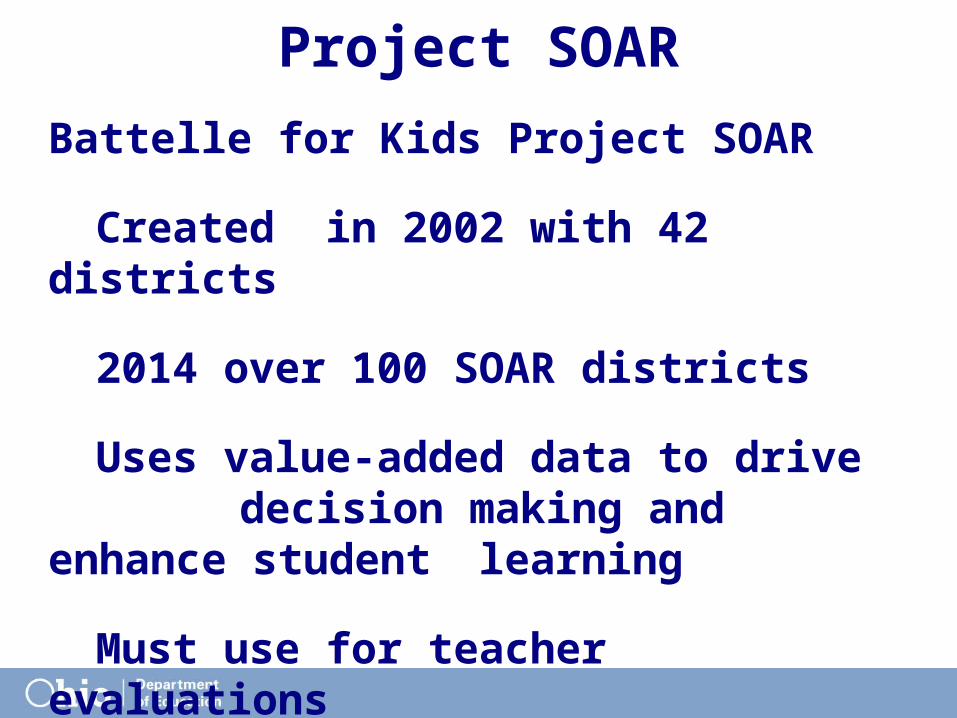
Project SOAR
Battelle for Kids Project SOAR
Created in 2002 with 42 districts
2014 over 100 SOAR districts
Uses value-added data to drive decision making and enhance
student learning
Must use for teacher evaluations
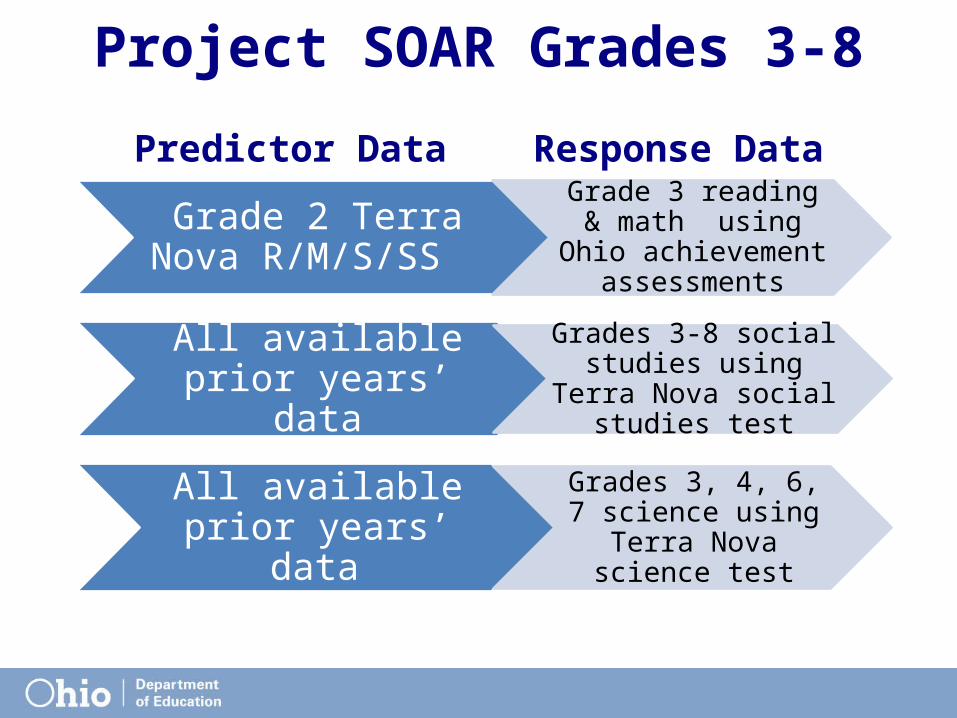
Project SOAR Grades 3-8
Grade 2 Terra Nova R/M/S/SS
Grade 3 reading & math using Ohio achievement
assessments
All available prior years’ data
Grades 3-8 social studies using Terra Nova social
studies test
All available prior years’ data
Grades 3, 4, 6, 7 science using Terra Nova
science test
Predictor Data Response Data
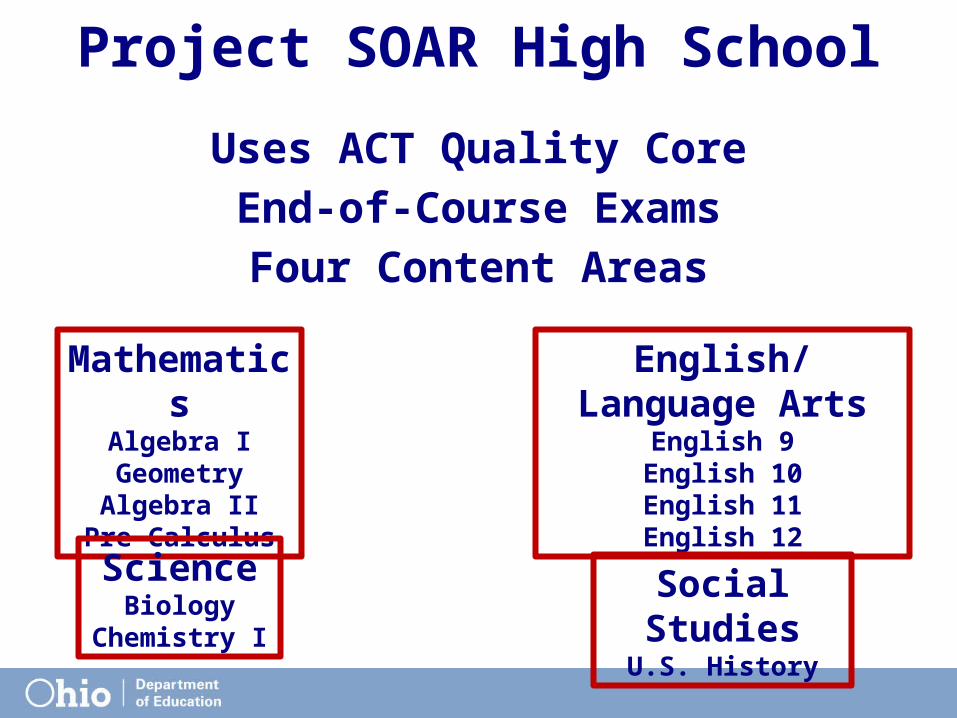
Project SOAR High School
Uses ACT Quality Core
End-of-Course Exams
Four Content Areas
MathematicsAlgebra I
GeometryAlgebra II
Pre-Calculus
English/Language ArtsEnglish 9
English 10English 11English 12
ScienceBiology
Chemistry I
Social StudiesU.S. History
Other BFK ClientsNWEA and possibly other vendors
Using “single year” Multivariate Response Model (MRM) for Year 1
- Uses fall tests as baseline data
- Uses spring tests to measure growth
Using “across years” MRM approach for Year 2 and beyond

Other BFK Clients
Districts will partner directly with BFK
Exact grades/subjects yet to be determined
Grade 3 reading and math will use Ohio’s achievement assessments as response
(using URM calculation)

education.ohio.gov

Social Media
@OHEducation
ohio-department-of-education
Ohio Families and EducationOhio Teachers’ Homeroom
OhioEdDept
storify.com/ohioEdDept

Moving Beyond Math & Reading 3-8: How Value-
Added Models Can Incorporate Other Types
of Assessments
Garron Gianopulos, PhDPsychometrician, Technical Development
of Statewide Assessments, Design and Implementation of Tests,
North Carolina Department of Public Instruction
June 25, 2014

OverviewA Year of ChangeHow NC Uses EVAASOutcomes and Plans for the Future

2012-13: A Year of Change
2005: Implemented new growth formula
28
READY Assessments• Introduced all new READY end-of-grade (EOG)
Assessments in grades 3 through 8• New READY end-of-course (EOC) assessments • All EOGs and EOCs were aligned to the common
core state standards, adopted in 2010• All new standards classifying students as ready for
the next grade level and on-track to college• New proficiency levels
2012-13: A Year of Change
2005: Implemented new growth formula
29
New Laws• Read to Achieve
• Law required third graders to demonstrate proficiency in reading
• 35 new third grade portfolio reading assessments• Beginning-of-grade 3 Reading assessment
• School Letter Grades• Grade letter determined by proficiency and EVAAS
growth
2012-13: A Year of Change
2005: Implemented new growth formula
30
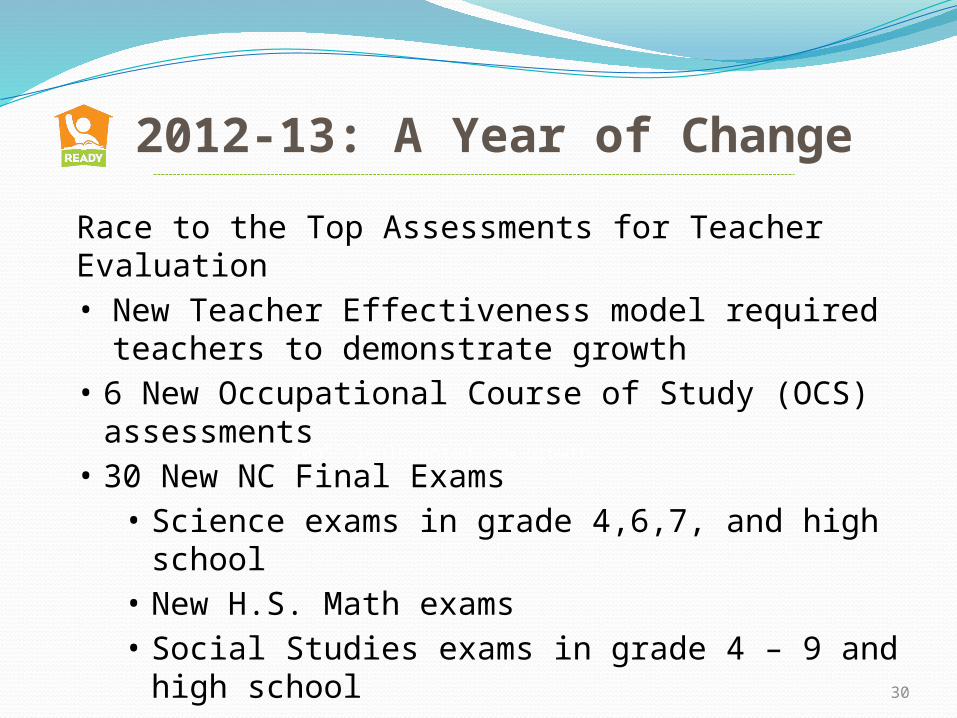
Race to the Top Assessments for Teacher Evaluation• New Teacher Effectiveness model required teachers to
demonstrate growth• 6 New Occupational Course of Study (OCS)
assessments• 30 New NC Final Exams
• Science exams in grade 4,6,7, and high school• New H.S. Math exams• Social Studies exams in grade 4 – 9 and high school
• Historically non-tested subjects

2012-13: A Year of Change
2005: Implemented new growth formula
31
State Board of Education (SBE)• Not all board members were comfortable with the new
proficiency levels• A policy decision was made to change original 4
achievement levels to 5 achievement levels• The new level differentiates between readiness for next
grade level and being on-track for college• NC is a governing member of the Smarter Balanced
Assessment Consortium (SBAC); however, the SBE is re-evaluating consortia and future testing options
• Keeping current READY assessments through 2015-16
OverviewA Year of ChangeHow NC Uses EVAASOutcomes and Plans for the Future

How NC Uses the Educator Value Added Assessment System (EVAAS)
33
• Educator Instructional Planning• School Accountability• Educator Effectiveness

Instructional Planning2012-13: EVAAS provides projections of
EOG/EOC percentile scores at the beginning of the school year to help with instructional plans
Student-level EVAAS projections are also provided for ACT, PLAN, and EXPLORE
2013-14: EOG/EOC Scale score projections will be provided

35
The School Accountability System

We have a total of 6 standards in our teacher evaluation system. All standards, 1-6, are of equal value. Our goal:• Identify our strongest teachers and explore their
methodologies, and• Support teachers who need to increase their
effectiveness• Three years of EVAAS growth measures needed before
ratings apply
North Carolina Educator Evaluation Process
Teachers
1 2 3 4 5 6Establish Environment
KnowContent
Facilitate Learning
Demonstrate Leadership
Reflect on Practice
Contribute to
Academic Success

Training Provided
37
Webinars with EVAAS team focused on how staff will continue to get value-added data with a change in standards
–Understanding the EVAAS system of value-added growth
–Conversion of assessment data to Normal Curve Equivalents (NCE’s)
–Understanding the use of assessments in various growth models

EVAAS Models Used in NC
38
Multivariate Response Model (MRM)• 17 End-of-grade Math and ELA assessments• Used in the school accountability system
Univariate Response Model (URM)• 3 End-of-course assessments• 6 Occupational Course of Study assessments• 70 Career and Technical Exams • 30 NC Final Exams (historically non-tested subjects)• All available assessments used in educator
effectiveness

What Types of Scores Can be Used in EVAAS?
39
• Sufficient spread in the scale • Limited ceiling or floor effects • Correlation between covariates and score > .60• High reliability • Test content needs to align closely to the
instructed curriculum• High Validity• Standardized assessments need curricula that
are also standardized
OverviewA Year of ChangeHow NC Uses EVAASOutcomes and Plans for the Future
Outcomes from 2012-13
41
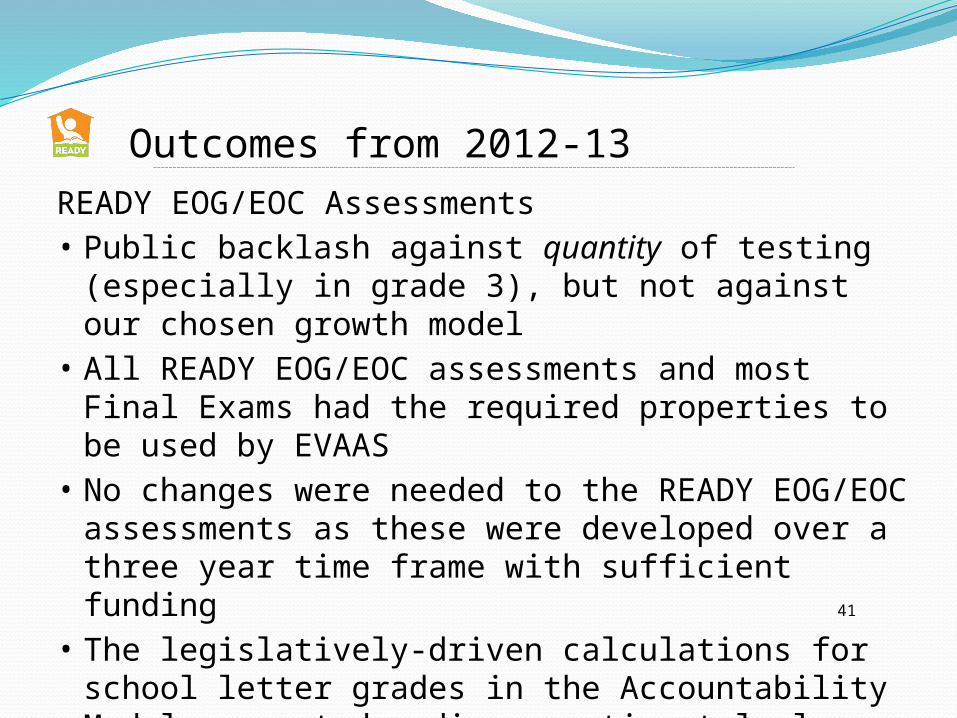
READY EOG/EOC Assessments• Public backlash against quantity of testing (especially in
grade 3), but not against our chosen growth model• All READY EOG/EOC assessments and most Final
Exams had the required properties to be used by EVAAS• No changes were needed to the READY EOG/EOC
assessments as these were developed over a three year time frame with sufficient funding
• The legislatively-driven calculations for school letter grades in the Accountability Model generated a disproportionately large percent of Fs and Ds

Outcomes from 2012-13
42
Final Exams• Certain Final Exams and OCS assessments did not
meet requirements to be utilized in the EVAAS models– Insufficient sample size– Insufficient correlations between covariates and
test score– Insufficient reliabilities
• Floor effects surfaced on some High School Math assessments
Outcomes from 2012-13
43
Constructed Response Items (CR)• NCDP provided general guidelines for managing
CR item scoring process, but each district implemented their own process
• Constructed response (CR) items too labor intensive to score by teachers
• Many concerns about the security, inter-rater reliability, and accuracy of teacher-scored CR items
Outcomes from 2012-13
44
Response from Educators• The large majority (79%) of teachers met or
exceeded growth expectations• Teachers with insufficient individual estimates were
excluded from the rating system• Few groups are comparing their own growth
measures to EVAAS• Most educators seem to be responding favorably to
the EVAAS reports

Changes in 2013-14
45
Managerial Changes• New chief in charge of the test development section• The test development section is now managing the test
development process for all Final Exams• Increased test development staff to manage work load
Changes in 2013-14
46
Final Exams• Name was changed from Common Exams to Final
Exams to emphasize that they are intended to replace teacher-made final exams
• Testing time increased from 90 minutes to 120 minutes• Reduced the number of Final Exams with CR items • Reduced the number of CR items per exam• Tests lengthened with MC items to increase reliability• CR items scored by contractor rather than by NC
teachers
47
Final Exams• Moving many of the Final Exams to online
administration• Implementing common item non-equivalent equating
design• Experimental items embedded to provide greater
statistical control in form assembly• Reduced difficulty of some Math High School tests to
improve reliability and remove floor effects
Changes in 2013-14

48
• Providing more detail in test specifications to help teachers know what to instruct in those subjects where the curriculum standards are not specific enough
• The EVAAS team will determine if they can use the beginning-of-grade 3 assessment to measure growth
Changes in 2013-14

2013-14: More Change Ahead?
2005: Implemented new growth formula
49
• The weight given to EVAAS growth within the school Accountability Model will likely increase to produce a more acceptable distribution of letter grades
• Two bills approved by senate and the house to rescind the Common Core State Standards
• Will funding for Final Exams remain at the same level?

Questions
Every Student READY