motorcycle helmet drop tests using a hybrid iii dummy … · the dummy test programme consisted of...
TRANSCRIPT

MOTORCYCLE HELMET DROP TESTS USING A HYBRID III DUMMY
A. M. Hering, S. Derler
Swiss Federal Laboratories for Material Testing and Research, St. Gallen, Switzerland
ABSTRACT
Falling headform tests, which are used to simulate impacts of a helmeted head in a motorcycle accident, take no account of the rider's body. In order to investigate the influence of the body mass on the dynamics of the head, drop tests using a complete helmeted Hybrid III dummy were carried out under various impact conditions. The comparison to equivalent falling headform tests showed that the linear and rotational accelerations of the head depend on the dynamic effects of the body and on the mechanical properties ofthe neck. For oblique impacts onto an abrasive anvil the body of the dummy led to increased linear and rotational accelerations of the head. In case of impacts onto a flat anvil the results systematically depended on the body impact angle. Due to an increased effective mass of the head lower linear accelerations were found for dummy drop tests. This work was part of the European research action COST 327 Motorcycle Safety Heimets (www.cordis.lu/cost-transport/home.html).
Key words: COST 327, rotational acceleration, linear acceleration, dummy drop test, falling headfonn test, flat anvil, oblique anvi l .
THE MECHANICAL BEHA VIOUR OF MOTORCYCLE HELMETS in impact situations is directly related to head injury risks such as linear and rotational acceleration of the brain. In real accidents rotational and linear acceleration usually occur together and both cause injury (COST 327 Literature Review, 1997). Whereas current helmet standards provide shock absorption tests measuring linear acceleration using a falling headfonn, so far no reliable test methods are available conceming the risk of rotational acceleration. Furthennore, the use of a detached headfonn may not adequately simulate the dynamics of the head for all motorcycle accidents. Particularly, the effect of the body mass on the linear and rotational acceleration experienced by the head is not fully understood. Full scale crash tests in which a complete helmeted dummy riding a motorcycle was impacted into the side of a car showed much greater peak values of rotational acceleration and lower linear accelerations than observed in falling headform tests which were carried out in order to replicate helmet damages in the laboratory (Dixon et al., 1997; COST 327 Reconstruction, 2000). The different results were interpreted as a consequence of the interaction between the dummy's body and the head by the neck during the impact. The conclusion was that the dynamic behaviour of a human head in an impact would be between that of a free headform and that of a headform attached to a body via a stiff dummy neck.
Full scale crash tests impacting a complete dummy riding a motorcycle are the most realistic reproduction of an accident. A disadvantage of these tests is that they are very time consuming and expensive. Thus, as a link between standard falling headform tests and füll scale crash tests, a complete dummy was used for drop tests in the laboratory. lts helmeted head impacted on a flat or on an oblique anvil, respectively. The results were compared to those obtained with an identical test configuration but using a detached headfonn. lt is expected that the complex dynamics of the human head and neck in an accident can be simulated more realistically with a dummy. The aim of this study
IRCOBI Conference - Montpellier (France), September 2000 307
was to determine the influence of the neck and the body on the l inear and rotational acceleration experienced by the dummy headform in comparison with the detached headform. lt was further investigated how far falling headform tests as used in current helmet standards can replace dummy drop tests if appropriate test parameters are defined. This work was performed at EMPA (Swiss Federal Laboratories for Material Testing and Research) as part of the European research action COST 327.
Only a few experiments similar to those described here have been reported in the literature. Aldman et al. ( 1 978) dropped a helmeted Ogle-Opat dummy onto an impact surface made of asphalt concrete, using a test car to release the dummy and, at the same time, to define a vertical and a horizontal velocity component. Peak values of angular acceleration between 4.8 and 12.4 krad/s2 were measured in the head. The results were similar to those obtained by dropping the same helmeted headform, which was attached to a rail-guided carriage, onto a simulated road surface mounted on a rotating disc (Aldman et al„ 1 976). To our knowledge, no previous experiments of a dummy being dropped onto an oblique abrasive anvil have been published.
EQUIPMENT
A standard 501h-percentile adult male Hybrid III pedestrian dummy was used for the drop tests. The Hybrid III dummy head was equipped with nine accelerometers (Endevco 72648-2000) positioned on a mounting block in a 3-2-2-2 array following the recommendations of Padgaonkar et al. ( 1 975). The accelerometer signals were amplified by three voltage amplifiers (Endevco Model 136) and recorded at a sampling rate of 1 00 kHz using two Nicolet BE490XE transient recorder boards.
For both the flat and the oblique anvil, a tri-axial Kistler type 9366AB force transducer was used, allowing the measurement of normal and tangential force components. Impacts with the flat anvil were performed directly onto the smooth mounting plate (230x300 mm) of the force transducer, whereas for oblique impact tests the force transducer was inclined at 15° to the vertical and the impact area was covered with a sheet of abrasive paper (grade 80 closed-coat aluminium oxide) according to the British Standard (BS 6658, 1985). The abrasive paper was replaced after each impact.
A computer program was used for data acquisition and to process the accelerometer data. Force signals were measured directly, whereas l inear and rotational accelerations, as weil as additional parameters had to be computed (rotational acceleration was calculated according to Padgaonkar et al„ 1 975). The accelerometer and force transducer signals were filtered according to CFC600. Data were recorded at intervals of 25 ms in order to measure the first and primary head impact. Secondary head impacts are considerably less violent (Aldman et al„ 1978).
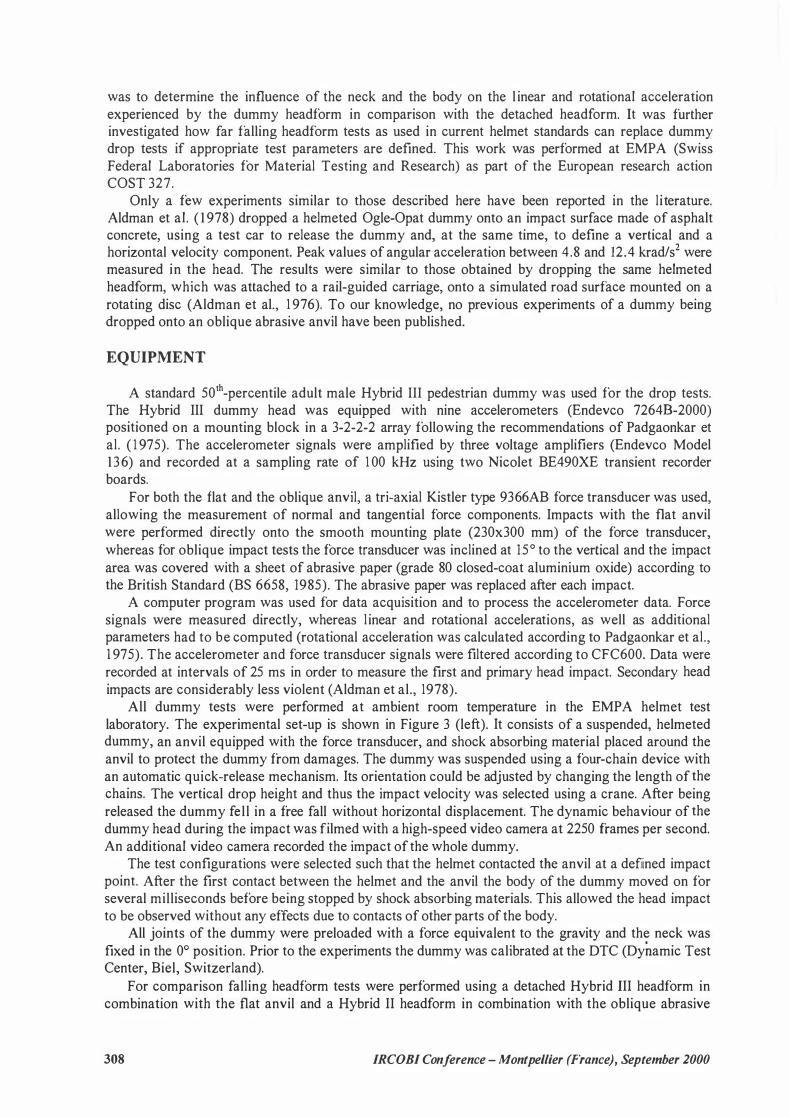
All dummy tests were performed at ambient room temperature in the EMPA helmet test laboratory. The experimental set-up is shown in Figure 3 (left). lt consists of a suspended, helmeted dummy, an anvil equipped with the force transducer, and shock absorbing material placed around the anvil to protect the dummy from damages. The dummy was suspended using a four-chain device with an automatic quick-release mechanism. lts orientation could be adjusted by changing the length of the chains. The vertical drop height and thus the impact velocity was selected using a crane. After being released the dummy fell in a free fall without horizontal displacement. The dynamic behaviour of the dummy head during the impact was filmed with a high-speed video camera at 2250 frames per second. An additional video camera recorded the impact of the whole dummy.
The test configurations were selected such that the helmet contacted the anvil at a defined impact point. After the first contact between the helmet and the anvil the body of the dummy moved on for several milliseconds before being stopped by shock absorbing materials. This allowed the head impact to be observed without any effects due to contacts of other parts of the body.
All joints of the dummy were preloaded with a force equivalent to the gravity and the neck was fixed in the 0° position. Prior to the experiments the dummy was calibrated at the DTC (Dynamic Test Center, Biel, Switzerland).
For comparison falling headform tests were performed using a detached Hybrid III headform in combination with the flat anvil and a Hybrid II headform in combination with the oblique abrasive
308 IRCOBI Conference - Montpellier (France), September 2000
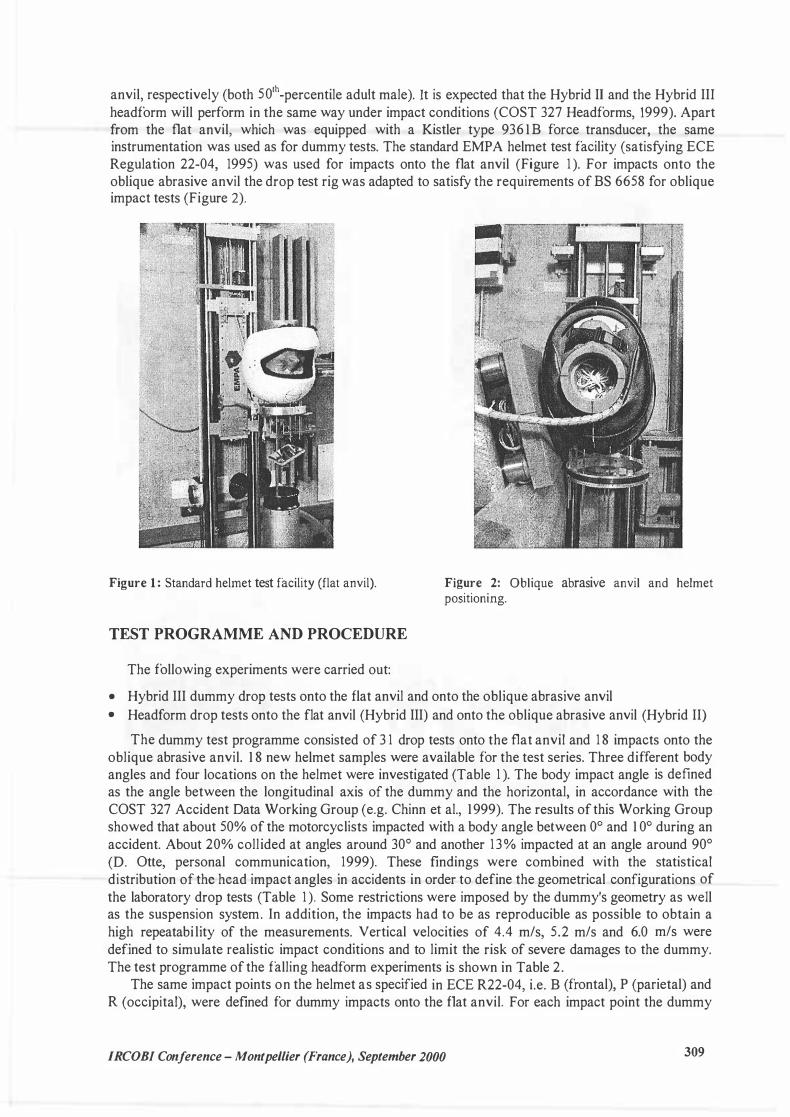
anvil, respectively (both 50111-percentile adult male). lt is expected that the Hybrid II and the Hybrid III headform will perform in the same way under impact conditions (COST 327 Headforms, 1999). Apart from the flat anvil, which was equipped with a Kistler type 936 1 B force transducer, the same instrumentation was used as for dummy tests. The standard EMPA helmet test facility (satisfying ECE Regulation 22-04, 1995) was used for impacts onto the flat anvil (Figure 1 ). For impacts onto the oblique abrasive anvil the drop test rig was adapted to satisfy the requirements of BS 6658 for oblique impact tests (Figure 2).
Figure 1 : Standard helmet test facility (flat anvil). Figure 2: Oblique abrasive anvil and helmet positioning.
TEST PROGRAMME AND PROCEDURE
The following experiments were carried out:
• Hybrid III dummy drop tests onto the flat anvil and onto the oblique abrasive anvil • Headform drop tests onto the flat anvil (Hybrid III) and onto the oblique abrasive anvil (Hybrid II)
The dummy test programme consisted of 3 1 drop tests onto the flat anvil and 1 8 impacts onto the oblique abrasive anvil. 1 8 new helmet samples were available for the test series. Three different body angles and four locations on the helmet were investigated (Table 1 ). The body impact angle is defined as the angle between the longitudinal axis of the dummy and the horizontal, in accordance with the COST 327 Accident Data Working Group (e.g. Chinn et al., 1999). The results of this Working Group showed that about 50% of the motorcyclists impacted with a body angle between 0° and 1 0° during an accident. About 20% collided at angles around 30° and another 13% impacted at an angle around 90° (D. Otte, personal communication, 1999). These findings were combined with the statistical distribution of thc hcad impact angles in accidents in order to define the geometrical configurations of the laboratory drop tests (Table 1 ). Some restrictions were imposed by the dummy's geometry as weil as the suspension system. In addition, the impacts had to be as reproducible as possible to obtain a high repeatabi lity of the measurements. Vertical velocities of 4.4 m/s, 5.2 m/s and 6.0 m/s were defined to simulate realistic impact conditions and to limit the risk of severe damages to the dummy. The test programme of the falling headform experiments is shown in Table 2.
The same impact points on the helmet as specified in ECE R22-04, i.e. B (frontal), P (parietal) and R (occipital), were defined for dummy impacts onto the flat anvil. For each impact point the dummy
IRCOBI Conference - Montpellier (France), September 2000 309

was positioned with a defined body angle and released from the selected drop height when it was completely motionless. The corresponding test configurations are shown in the Figures 3 and 4 (left). In case of impacts with the oblique anvil the dummy was dropped with a body angle of 0° (Figure 4 right). The left and right lateral impact points as weil as the positioning of the helmets were m accordance with BS 6658 for oblique impact tests using a headform (Figure 2).
Figure 3: Experimental set-up for dummy drop tests: configuration for R/0°-impacts (left) and for P/90°-impacts (right).
Figure 4: Drop test configuration for B/30°-impacts (left) and lateral/0°-impacts onto the oblique abrasive anvil (right).
Heimet samples of the same size (58) and of the same type, an AGV R3/R4 fibreglass helmet certified according to ECE R22-04, were used in all experiments to provide a good comparability between the results. Each helmet was impacted at the points B, P and R onto the flat anvil and on the left and right lateral side onto the oblique anvil. The visors as weil as the visor mounts were removed from all helmets. Before each drop test a helmet was positioned on the headform with a fixed distance
310 IRCOBI Conference - Montpellier (France), September 2000

between the eyeline and the helmet rim, and the retention system was fastened tightly. Body, legs and arms of the dummy were arranged in the correct position.
Table 1 : Summary ofthe dummy test programme
No. of Impact velocity [m/s] Anvil Body impact Head impact point Tests an2le
9 4.4, 5.2, 6.0 flat 30° frontal (B, ECE R22-04) 1 1 4.4, 5.2, 6.0 flat 90° parietal (P, ECE R22-04) 1 1 4.4, 5.2, 6.0 flat oo occipital (R, ECE R22-04) 1 8 4.4, 5.2, 6.0 oblique abrasive ( 1 5°) oo lateral left and right (BS 6658)
Table 2: Summary ofthe headfonn test programme
No. of Tests Impact velocitv rm/sl Anvil / Headform Head imoact point 9 4.4, 5.2, 6.0 flat I Hybrid III frontal (B, ECE R22-04) 4 4.4, 6.0 flat I Hybrid III parietal (P, ECE R22-04) 6 4.4, 5.2 flat / Hybrid III occipital (R, ECE R22-04) 8 6.0, 7.5 oblique abrasive ( 1 5°) / Hybrid II lateral left and right (BS 6658)
OBLIQUE IMPACT TESTS USING A DUMMY: RESULTS AND DISCUSSION
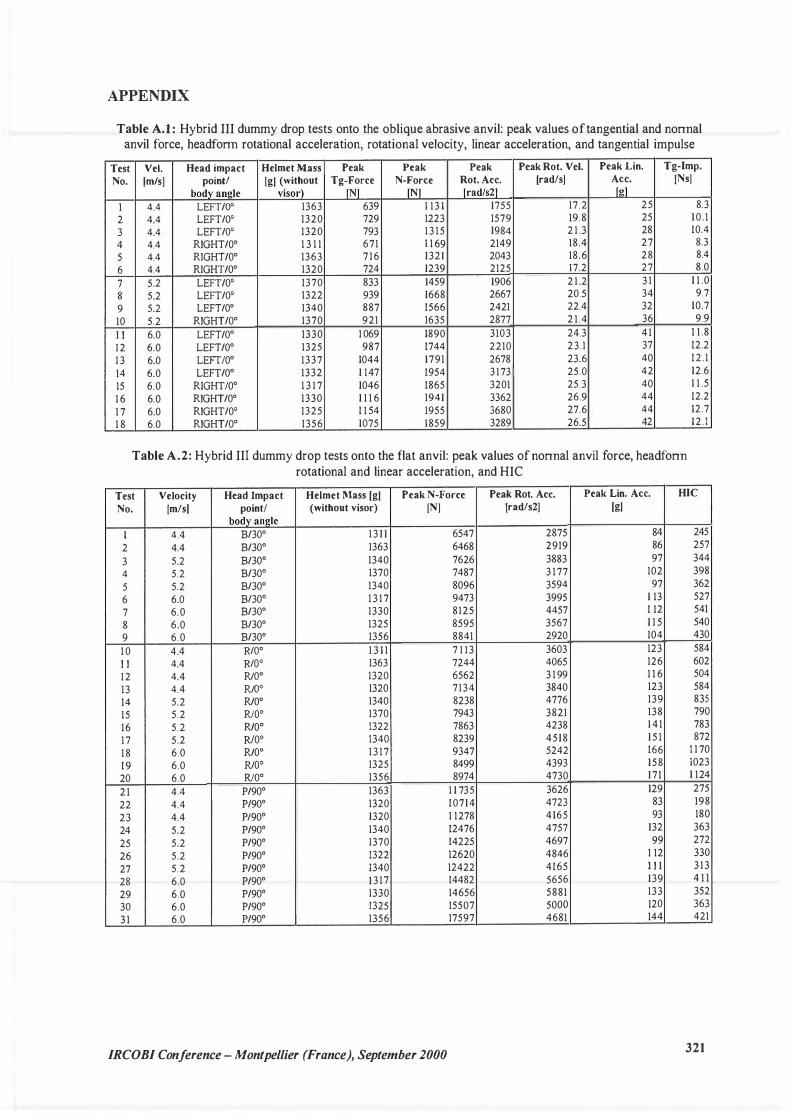
Table A. l (Appendix) contains the results of the dummy drop tests onto the oblique abrasive anvil. The measured peak values of l inear acceleration are relatively low and range from 25 g to 44 g depending on the impact velocity. The peak values of rotational acceleration vary between 1 579 rad/s2 and 3680 rad/s2 and those ofthe tangential forces between 639 N and 1 1 54 N.
Figure 5 shows mean time histories of the resultant linear and rotational accelerations of the headform and of the tangential forces measured on the anvil for oblique impacts of the dummy (left) and the headform (right) at an impact velocity of 6.0 mls. Very similar curves are found for all three impact velocities, but the peak values increase with velocity (not shown in Figure 5).
3500 r-----------;::===:::;.,- 1400 6. 0 m/s Hybrid III Dummy
3000 8 Impacts
!:" 2500 :ä � 2000 ü � 1500 & 1000
500
0 5 10 15 Time(ms)
- Rot. Ace.
800 C> �
600 s ü
400 � c �---=:::i. 200 ::::;
20 25
3500 �--------------,- 1400 6.0 m/s
3000 4 Impacts
!:" 2500 :ä � 2000 ü � 1500
& 1000
500
0 5
Hybrid II Headfonn
10 1 5 Time [ms]
20
1200 � „
1000 I:! 0 u. 800
C> � 600 s
ü 400 � c 200 ::::;
Figure 5: Mean time histories for drop tests onto the oblique abrasive anvil. For a better representation linear acceleration values on the right axis are multiplied by a factor of30. The mean values were calculated using all
available measurements (the number is indicated in the plots).
The plots in Figure 5 show that the force signal rises about 1 ms earlier than the accelerometer signals, indicating the first contact between the helmet shell and the abrasive anvil. Acceleration and rotation of the dummy headform follow with a short time delay. The curves for linear and rotational acceleration are qualitatively similar and reach their maximum at the same time (the correspondence is better for dummy tests). The broad peaks of the tangential forces also coincide with the peaks of linear and rotational acceleration. The signal forms of all three plotted parameters are comparable for dummy and headform tests, although the peak values are somewhat greater using the dummy. The time histories of the tangential forces show narrow peaks during the first phase of the contact. As
IRCOBI Co11ference - Montpellier (Fra11ce), September 2000 311

high-speed videos confirm these peaks are associated with the onset of considerable helmet shell deformations.
The analysis of high-speed videos reveals that the trajectory and the orientation of the dummy's body (Figure 4 right) are practically not influenced by the contact between the head and the oblique abrasive anvil. The great body mass and the stiffness of the neck are probably the main reason for this. In contrast, the contact between the helmet shell and the anvil induces a strong rotation of the head and the neck about the vertical dummy axis. The dynamics resembles that observed for a detached headform colliding with the oblique anvil.
STATISTICAL ANALYSIS
In Table 3 mean values, standard deviations (sd) and coefficients of variation (v), i.e. standard deviations expressed as percentages of the means: v = lOO·sd/mean, are listed for the peak values of rotational and linear acceleration, tangential force and rotational velocity resulting in dummy drop tests and falling headform tests. The peak tangential force was determined from the broad maximum of the force signal which is closely related to the headform rotation (see Figure 5).
Table 3: Mean peak values resulting in oblique impact tests onto an abrasive anvil using a Hybrid III dummy and a Hybrid II headform (#).
lmp. No. Rot. sd V Tg-F. sd V Rot. sd V Lin. sd V Vel. of Ace. [rad/s2] [%] [N] [N] [%] Vel. [rad/s] [%] Ace. [Ns] [%)
[m/sl Tests f rad/s2l frad/sl r!!l 4.4 6 1 939 226 1 1 .7 7 1 2 53 7.4 1 8.8 1 .6 8.5 26.7 1 .3 5.0 5.2 4 2468 4 1 8 1 7.0 895 47 5.2 2 1 .4 0.8 3.7 33.3 2.0 6 . 1 6.0 8 3087 45 1 14.6 1 080 57 5.2 25.3 1 . 6 6.4 4 1 .2 2.2 5.4
6.0 (#) 4 2488 1 58 6.3 801 86 10.7 23.9 2.7 1 1 .3 30.9 2.7 8.8 7.5 (#) 4 3393 289 8.5 1238 79 6.4 26.6 4.3 16 . 1 49. l 2.7 5.6
In dummy tests the mean peak values of linear acceleration are relatively low and range from 27 g to 4 1 g and the mean peak values of rotational acceleration from ab out 1 900 rad/s2 to 3 1 00 rad/s2. The rotational velocities vary between 1 9 rad/s and 25 rad/s and the mean peak values of the tangential forces between about 700 N and 1 100 N. The scatter of the measured data doesn 't depend on the impact velocity and the coefficients of variation are below 1 0 % except for rotational acceleration measurements. Thus the repeatabi lity is quite good for all impact velocities and the calculated mean values are representative for the experiments.
The results of all four considered parameters increase with the impact velocity, for both dummy and headform tests. Comparisons between the mean values in Table 3 show that the dummy drop test results for an impact velocity of 5.2 m/s approximately correspond to those found for headform impacts at 6.0 m/s. The results of Hybrid III dummy measurements at an impact velocity of 6.0 m/s lie between those of the Hybrid II headform measurements at 6.0 m/s and at 7.5 m/s, respectively. Consequently, for the same impact velocity the values of the measured parameters are greater for dummy drop tests than for falling headform tests. The differences may be due to the inertial effects of the body mass acting on the head through the neck. Since the motion of the dummy's body is practically unaffected by the impact, the vertical velocity of the body slightly exceeds that of the head after the contact with the anvil. This causes a momentum forcing the head to rotate about an axis in the neck area parallel to that passing through the ears. The corresponding contribution to the resultant rotational acceleration can clearly be identified in the data measured in dummy drop tests, whereas it is not found in headform tests. Although this component is considerably smaller than the rotation about the longitudinal axis of the headform, it accounts for the most part of the differences between dummy and headform experiments.
312 IRCOBI Conference - Montpellier (France), September 2000

DUMMY HEADFORM ROTATION
In Figure 6 rotational accelerations are plotted against tangential forces measured in 1 8 dummy drop tests onto the oblique abrasive anvil. The results of impacts on the right and on the left helmet side at impact velocities of 4.4 m/s, 5.2 m/s and 6.0 mls are shown. The calculated linear regression and the correlation coefficient (r = 0.90) indicate a significant linear relationship between the peak values of rotational acceleration and tangential force. In previous experiments at EMPA, in which a helmeted Hybrid II headform was impacted with an oblique anvil at five velocities between 6 mls and 12 m/s (84 impacts), a very similar relationship was found between these two parameters (COST 327 Test Procedures, 2000).
Figure 7 shows a direct comparison of the dummy drop test results (Figure 6) with the results of falling headform tests. For both test series rotational accelerations and tangential forces increase with the impact velocity. The results of the dummy tests are in line with those of the headform experiments, indicating a common relationship between rotational acceleration and tangential force. However, for the same impact velocity the data points for dummy drop tests are shifted towards higher values (see also Table 3 and the related text above). lt can be concluded that in order to assess rotational acceleration in dummy drop tests at a certain impact velocity, falling headform tests have to be carried out at a slightly higher velocity.
5000 Pv.oc = 3.28Fr0 • 435
r = 0.90 4000 .r
.!!! X „ � 3000 / " X " <( � 2000 0 + "' + „ „ 0. 1000 1 +4.4 mts1
0 5.2 m/s x6.0 m/s
0 500 1000 1500 Peak Tangential Force [N)
Figure 6: Peak rotational acceleration versus peak tangential force for dununy impacts onto the oblique abrasive anvil.
5000
r:""' 4000 � „ =.. 3000 .; u <( ... � 2000
"' „ „ 0. 1000
0
., • 6.0 m/s Headform
• 7.5 m/s Headform
1 + 4.4 m/s Dummy
o 5.2 m/s Dummy x 6.0 m/s Dummy
•
0 500
0 • 0 X
. � • X + .:- •o
X •
1000 1500
Peak Tangential Force [NJ
Figure 7: Peak rotational acceleration versus peak tangential force for dununy and headform impacts onto the oblique abrasive anvil.
DUMMY DROP TESTS ONTO A FLAT ANVIL: RESULTS AND DISCUSSION
The results of the dummy drop tests onto the flat anvil are summarised in Table A.2 (Appendix). Peak values of linear acceleration between 83 g and 1 7 1 g were measured depending on impact velocity and test configuration. The peak values of rotational acceleration range from about 2900 rad/s2 to 5900 rad/s2 and those of the normal forces on the anvil from about 6500 N to 1 7600 N.
Figure 8 (left side) shows examples of mean time histories of the resultant linear and rotational accelerations and normal forces for the different dummy drop test configurations. The results of corresponding headform tests are plotted on the right side. The signal forms of all three parameters are more complicated in dummy tests than in headform tests. Especially the rotational acceleration curves show important differences, indicating that both linear and rotational motion of a headform connected to a dummy are more complex than for a detached headform. On the other band, qualitatively similar linear accelerations assuming their peak values at comparable times, are found in dummy and headform experiments. At a given impact point the average signals of rotational and linear acceleration and normal force are qualitatively similar for all investigated impact velocities (not shown in Figure 8). The dummy headform is accelerated with a time delay of about 1 ms after the first contact between helmet shell and anvil, regardless of being attached to the dummy or not.
IRCOBJ Conference - Montpellier (France), September 2000 313

6000 r:s .�2
-mJ�s---
H-
yb_
ri_
d_
lll_
D_
um_
m_
y--�-==
Ro=
1.=Acc
=.:::::;-r 10000
4 Impacts ·-· N-Force 5000
� 4000
� u 3000 .'i 75 2000 a:
1000
0
R I 0" „, - Lin.Acc.•so :
10 15 Time[ms]
20 25
8000 � t-!
6000 0 ...
0 "'
4000 � u .'i
2000 c ::;
6000 ...--------------� 10000
5000
� 4000 .., � u 3000 .'i 75 2000 a:
1000
0
6.0 mls 4 Impacts B / 30°
5 10 15
Time [ms]
20
8000 � „ 6000
t-! 0 ...
� 4000 � u
.'i 2000 c ::;
6000 ..---------------� 16000
5000 ,.... i 4000
u 3000 .'i -5 2000 a:
1000
0
6.0 mJs 4 Impacts p / 90°
„. ,.•"\ / .... ····� ..
, .., .·
10 15
nme [ms]
20 25
12000 �
8000 0 ...
u 4000 .'i
6000 ..-------------------. 10000
5000
,.... � 4000
� u 3000 .'i -5 2000 a:
1000
0
Hybrid III Headform
10 15 Time [ms]
5.2 mts 3 Impacts R
20 25
8000 �
6000
„ t-! :t. 0 "'
4000 � u � 2000 c ::;
6000 ...-----------------,. 1 0000
5000 I:"' � 4000
� u 3000 � 75 2000 a:
1000
6.0 mts 3 lmpads B 6000 �
t-! 6000
0 ... o · "'
4000 � u .'i
2000 c ::; o .i.--4'...__.._..,_. __ ,,____::::::::;::;::�,._,..,;:;;;;;;�-=-=-;:;;!.. o
0 5 10 15 Tlme(ms]
20 25
6000 ...------------------,- 16000
5000
1000
6.0 mts 2 lmpads p �
12000 � �
8000 � � u u
4000 < c ::; o .1.-........,!....-....... .......,--....... �-=::;::::;:=.=-;:::;:,,;;;;;;_..,.....,....l. o
0 5 10 15 Time [ms]
20 25
Figure 8: Mean time histories for dummy (left) and headfonn (right) impacts onto the flat anvil for different impact configurations. B/30°- and P/90°-impacts are shown for the velocity of 6.0 m/s. R/0°-impacts are shown for the velocity of 5.2 m/s because headfonn impacts at 6.0 mls are not available. Linear acceleration values on the right axes are multiplied by a factor of 50 for a better representation. The mean values were calculated using
all available measurements (the number is indicated in the plots).
The high-speed videos of R/0°-impacts (Figure 3 left) show that the dummy headform continues to move downwards during the first phase of the contact between helmet shell and anvil. After a contact time of about 8 ms the headform seems to rotate inside the helmet, while the helmet itself remains in the same position. This moment in time coincides with a local minimum of the rotational acceleration (Figure 8 left). About 1 2 ms after the first contact, the helmet also begins to rotate in the direction of the chin, about an axis passing through a point in the neck area rather than through the centre of gravity, as would do a detached headform. The first peak of the rotational acceleration signal coincides with a great extemal force and is therefore directly related to the impact. On the other hand, the second peak corresponds to a period with very low extemal force and is probably a consequence of the elastic properties of the neck. Presumably, the neck releases the energy accumulated in the first phase of the impact by rotation or compression or flexion. This behaviour of the neck does not exactly simulate a human neck, which is more flaccid than the Hybrid III neck. The detached headform shows a qualitatively similar signal for the normal force and the linear acceleration (Figure 8 right), but the missing of a second peak in rotational acceleration confirms that this peak is a consequence of the combined effects of the body dynamics and neck properties in dummy tests. Thus for the data analysis
314 IRCOBI Con/erence - Montpellier (France), September 2000

the first peak of rotational acceleration is interpreted as the relevant maximum. The behaviour of a human head in a motorcycle accident would probably be between that of a dummy headform attached to a body by a stiff neck and a detached headform. lt is found that the peak values of linear and rotational acceleration are greater in headform tests, whereas peak normal forces are comparable.
The analysis of impacts at point B with a body angle of 30° (Figure 4 left) shows that the motion of the dummy headform is not affected by the impact in the first phase of the contact between helmet and anvil. Film analysis as well as the shape of the normal force signal indicate that the helmet contacts the anvil without rebound during this period (Figure 8 left). About 7 ms after the first contact, the helmet begins to slide forward and then to rotate backwards until the chin guard touches the anvil. The rotational acceleration signal shows two small peaks followed by a broad and high maximum. This )arge maximum corresponds to a period with Jow external force and seems to be a consequence of the elastic behaviour of the neck (an analogous observation was made for impacts at point R). The maximum of rotational acceleration is thus determined from the first two peaks. The results of the falling headform tests in Figure 8 (right) differ from the dummy measurements, although rotational acceleration is qualitatively similar for the first two peaks. In headform tests, greater peak values are found for linear and rotational acceleration, but Jower peak values for the normal force. In dummy tests, the normal force reaches its peak value later than in falling headform tests, indicating the effect of the dummy's body.
The most complex signal forms are found in case of impacts at point P with a body angle of 90° (Figure 3 right). The high-speed videos show that the helmet practically remains in the same position after the first contact with the anvil, while body and neck of the dummy continue to move downwards. A rebound of the helmet can be observed during which the helmet seems to loose contact with the anvil for a short time. The rebound motion is reversed about 3 ms after the first contact when the normal force assumes a local minimum (Figure 8 left). At a contact time of 8 ms the helmet begins to rotate backwards and then to slide forwards onto the anvil while the legs and the body of the dummy follow in the opposite direction. Throughout this period very high and approximately constant normal forces are exerted on the anvil. The rotational acceleration peak takes place during this phase, when the linear acceleration has fallen to relatively low values following a double peak. In most of the accidents the sustained injuries are a consequence of the combined effect of linear and rotational acceleration (COST 327 Literature Review, 1 997). The two types of accelerations can also occur one after the other. Thus for the data analysis, the rotational acceleration peak at the centre of the measuring time is considered to be the relevant maximum. Even if the results of falling headform tests deviate from those of dummy drop tests, the rebound of the helmet can be observed in the first part of the normal force signal (Figure 8 right). The linear acceleration signals are qualitatively similar, although the peak values are much greater in falling headform tests. The rotational acceleration peaks are higher and occur later for dummy tests. The measured signals demonstrate that in case of the impact configuration P/90° the dynamic behaviour of the dummy head is essentially influenced by the forces which are transmitted to the head through the neck.
STATISTICAL ANALYSIS
Table 4 contains mean values, standard deviations (sd) and coefficients of variation (v) for the peak values of rotational acceleration, normal force, linear acceleration and HIC, which were calculated for the dummy and the headform drop tests. The listed values represent the results of two, three or four drop tests with the same configuration.
The mean peak values of rotational acceleration vary between about 2900 rad/s2 and 5300 rad/s2
in dummy tests. The peak values of linear acceleration range from 85 g to 165 g and those of the normal force from about 6500 N to 1 5600 N. At a given impact point the results of all four parameters considered in Table 4 clearly increase with impact velocity. The results of headform drop tests show an analogous behaviour, except for rotational acceleration. As expected, impacts at 6.0 m/s represent the worst case of linear and rotational acceleration of the dummy head. For dummy tests most of the coefficients of variation in Table 4 are below 1 2 % at a given impact point and velocity and only a few vary between 1 3 % and 24 %. lt seems that the scatter of the data does not depend on the impact velocity or on the impact point and that it lies in the same order of magnitude for dummy and
IRCOBJ Conference - Montpellier (France), September 2000 315

headform tests. Despite the complexity of the Hybrid III dummy drop tests in comparison with headform tests, it can be concluded that the repeatability of these results is quite good and that the calculated mean values are representative.
Table 4: Mean peak values for Hybrid III dummy tests and Hybrid III headform (#) drop tests onto the flat anvil.
Imp. No. Rot. sd V N-F. sd V Lin. sd V HIC sd V Point / of Ace. [rad/s2] [%] [N] [N] [%] Ace. [g] [%] [%]
Velocity Tests lrad/s2J [gJ B/30° 4.4 2 2897 3 1 1 . 1 6507 56 0.9 85 1 .9 2.2 25 1 8 . 1 3.2
5.2 3 355 1 355 10.0 7736 3 1 9 4. 1 99 3.2 3.3 368 27.6 7.5 6.0 4 3735 654 1 7.5 8758 561 6.4 1 1 1 4.6 4. 1 5 1 0 53.2 10.4
R/0° 4.4 4 3677 370 10. I 701 3 307 4.4 122 4.2 3.5 568 43.6 7.7 5.2 4 4338 409 9.4 8071 196 2.4 142 5.8 4 . 1 820 4 1 .8 5 . 1 6.0 3 4789 427 8.9 8940 425 4.8 165 6.3 3.8 1 106 75. l 6.8
P/90° 4.4 3 4 1 72 548 1 3 . 1 1 1243 5 1 1 4.5 102 24.5 24. l 2 18 50. 1 23.0 5.2 4 461 6 307 6.7 12936 864 6.7 1 1 3 1 3 .6 12 . l 320 37.8 1 1 .8 6.0 4 5304 559 10.5 1 5560 1430 9.2 134 1 0.3 7.7 387 34.4 8.9
B (#) 4.4 3 3905 642 1 6.5 5601 322 5.8 120 6.7 5.6 505 28.5 5.6 5.2 3 4941 271 5.5 6 1 1 9 459 7.5 126 1 1 .3 9.0 635 84.2 13.3 6.0 3 4814 66 1 .4 7505 462 6.2 1 66 3.7 2.2 1 074 59.0 5.5
R (#) 4.4 3 5504 5 1 9 9.4 7 1 09 436 6 . 1 1 38 5 . 1 3 .7 689 39.0 5.7 5.2 3 5557 1 1 7 2 . 1 87 1 5 265 3.0 1 82 8.7 4.8 1 198 66.2 5.5 6.0 n.a. n.a. n.a. n.a. n.a. n.a. n.a. n.a. n.a. n.a. n.a. n.a. n.a.
p (#) 4.4 2 1574 47 3.0 6908 673 9.7 136 1 0.5 7.7 535 82.8 1 5 .5 5.2 n.a. n.a. n.a. n.a. n.a. n.a. n.a. n.a. n.a. n.a. n.a. n.a. n.a. 6.0 2 3390 244 7.2 1095 1 4 1 0.4 2 19 8.0 3.7 1 5 1 5 88.5 5.8
n.a.: not available
For a given impact velocity the mean values systematically depend on the impact point and the test configuration. The greatest normal forces result in impacts at point P with a body angle of 90°. This is not surprising because the dummy is dropped perpendicularly to the impact surface. The measured forces are much greater than for the other test configurations. Also the greatest rotational accelerations are measured in P/90°-impacts, although the differences are Jess significant. Considering linear acceleration and HIC, the greatest values are found for impacts at point R.
Table 4 shows that for the same impact velocity the normal forces for B/30° and P/90°-impacts are greater when using a dummy instead of a headform. For impacts at point R the normal forces are similar in both cases. These findings are not surprising because the mean time histories of the normal forces in Figure 8 are most similar for R-impacts, indicating only a weak influence of the additional body mass. In contrast, there is an evident effect for B/30°-impacts and, even more, for P/90°-impacts. Rotational acceleration is much greater using a complete dummy in P/90°-impacts than a detached headform, probably due to the body dynamics transmitting Jarge forces to the head trough the neck. On the other hand, B/30° and R/0°-impacts show lower peaks of rotational acceleration using a dummy. Presumably the freedom of movement of the impacting headform is reduced if it is connected to the body.
For the same impact point and velocity the linear accelerations and HIC values are lower for dummy drop tests than for falling headform tests (Table 4). The greatest differences are found for impacts at point P, followed by impacts at B, whereas the differences are small for impacts at R. During an impact the force acting on the head of the dummy is transmitted by the neck to the body. For the same impact force the resulting linear acceleration of the head will therefore be reduced compared to the unattached headform, due to an increased effective mass of the dummy headform (COST 327 Reconstruction, 2000). Dixon et al. ( 1 997) found lower linear acceleration in a füll scale crash test than in falling headform tests in which equivalent helmet damages were replicated. lt was assumed that the same extemal force will produce the same helmet damage, since the force of the füll scale impact had to be estimated.
316 IRCOBI Co11fere11ce - Montpellier (Fra11ce), September 2000

In our study the information on forces and linear accelerations is available for both dummy and headform tests, so that impacts at the same point with a similar level of normal force can be compared by means of the equation:
where: mc: effective mass ofthe helmeted dumrny head ac: linear acceleration ofthe helmeted dummy head mh: mass ofthe detached helmeted headform a11: linear acceleration ofthe detached helmeted headform
The assumption that the same kinetic energy is required to produce equivalent helmet damage in falling headform tests and dummy drop tests provides a second equation:
where: vc: impact velocity ofthe dummy head vh: impact velocity ofthe detached headform
The mass of the Hybrid III headform is 4.6 kg and the mean helmet mass about 1 .4 kg, thus 6 kg is used as the mass of the detached helmeted headform. Table 4 shows that comparable normal forces are measured on the anvil in B/30°-impacts at 5.2 m/s (dummy) and 6.0 m/s (headform), in R/0°impacts at 4.4 m/s (both) and in P/90°-impacts at 4.4 m/s (dummy) and 6.0 m/s (headform). With the known velocities and the measured linear accelerations the following effective masses of the helmeted dummy headform can be calculated from the energy/force equations:
B/30°: 8 kg I 1 0 kg; R/0°: 6 kg / 7 kg; P/90°: 1 1 kg / 1 3 kg
These results confirm that an increased effective mass of the dummy headform reduces the linear acceleration of the head. The greatest effective mass and thus the greatest difference between dummy and headform tests occurs in P/90°-impacts, whereas R/0°-impacts increase the effective mass only slightly. The effect of the dummy's body and the neck are thus more important for greater body impact angles, where the direction of the normal impact forces coincides with the longitudinal neck axis.
Only a few experiments similar to this study have been reported in the literature. In the following, our results are compared with the measurements carried out by Aldman et al. ( 1976, 1978) using an Ogle-Opat dummy wearing a polycarbonate jet helmet. The main difference from our measurements was the use of a test car to release the dummy, imposing an additional horizontal velocity component (typically 8-9 m/s) which caused an oblique impact with a flat surface made of asphalt concrete. Vertical impact velocities of 4.4 m/s and 5.2 m/s were used in the drop tests. Considering the test configurations which were similar to our experiments (impacts onto the flat anvil at the helmet impact points and body impact angles of R/25°, R/0° and B/30°), there is a good correspondence between Aldman's and our results with regard to linear acceleration. This could be explained by the fact that linear acceleration mainly depends on the vertical impact velocity which is given by the drop height. On the other hand, Aldman measured rotational accelerations up to two or three times higher than our results. Despite differences in the impact surfaces and in neck and headform characteristics, the differing horizontal impact velocities can explain the !arge discrepancies in rotational acceleration. This is confirmed by extrapolation of our results of dummy drop tests onto the oblique abrasive anvil (see Table 3) to higher impact velocities where the vertical and horizontal velocity components allow a direct comparison with one experimental configuration of Aldman. The extrapolated rotational accelerations lie in the same order of magnitude as Aldman's results.
LINEAR AND ROTATIONAL ACCELERA TION
In Figure 9 peak values of rotational acceleration are plotted against peak values of linear acceleration for dummy drop tests onto the flat anvil. The regression lines for the different impact configurations can clearly be distinguished. Impacts at point R show the strongest linear relationship
IRCOBI Co11/ere11ce - Mo11tpellier (France), September 2000 317
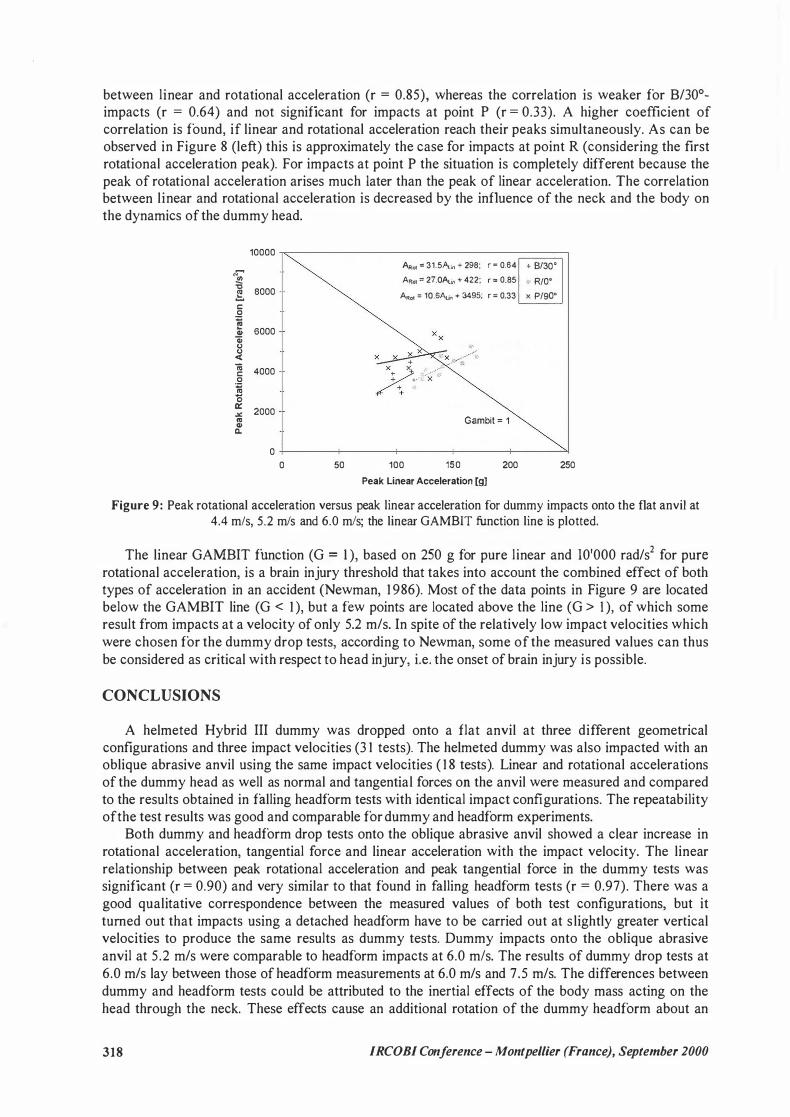
between linear and rotational acceleration (r = 0.85), whereas the correlation is weaker for B/30°impacts (r = 0.64) and not significant for impacts at point P (r = 0.33). A higher coefficient of correlation is found, if linear and rotational acceleration reach their peaks simultaneously. As can be observed in Figure 8 (left) this is approximately the case for impacts at point R (considering the first rotational acceleration peak). For impacts at point P the situation is completely different because the peak of rotational acceleration arises much Jater than the peak of linear acceleration. The correlation between linear and rotational acceleration is decreased by the influence of the neck and the body on the dynamics of the dummy head.
10000 N-.!!! 't:l 8000 �
c 0 � 6000 „ Qi (,) (,) < öi 4000 c 0 � ö 0:: 2000 � "' „ Q.
0 0 50
p,,.01 = 31.5Au,, + 298; r = 0.64 + 8/30' Ai.ot = 27.0Au,, + 422; r "' 0.85 " R/0°
ARot "' 10.6Au,, + 3495; r "' 0.33 x P/90°
Gambit = 1
100 150 200 Peak Linear Acceleration (g]
250
Figure 9: Peak rotational acceleration versus peak linear acceleration for dummy impacts onto the flat anvil at 4.4 m/s, 5.2 mls and 6.0 mls; the linear GAMBIT function line is plotted.
The linear GAMBIT function (G = 1 ), based on 250 g for pure linear and 10'000 rad/s2 for pure rotational acceleration, is a brain injury threshold that takes into account the combined effect of both types of acceleration in an accident (Newman, 1 986). Most of the data points in Figure 9 are located below the GAMBIT line (G < 1 ), but a few points are Jocated above the line (G > 1 ), of which some result from impacts at a velocity of only 5.2 m/s. In spite of the relatively low impact velocities which were chosen for the dummy drop tests, according to Newman, some of the measured values can thus be considered as critical with respect to head injury, i.e. the onset of brain injury is possible.
CONCLUSIONS
A helmeted Hybrid III dummy was dropped onto a flat anvil at three different geometrical configurations and three impact velocities (3 1 tests). The helmeted dummy was also impacted with an oblique abrasive anvil using the same impact velocities ( 1 8 tests ). Linear and rotational accelerations of the dummy head as well as normal and tangential forces on the anvil were measured and compared to the results obtained in falling headform tests with identical impact configurations. The repeatability ofthe test results was good and comparable for dummy and headform experiments.
Both dummy and headform drop tests onto the oblique abrasive anvil showed a clear increase in rotational acceleration, tangential force and linear acceleration with the impact velocity. The linear relationship between peak rotational acceleration and peak tangential force in the dummy tests was significant (r = 0.90) and very similar to that found in falling headform tests (r = 0.97). There was a good qualitative correspondence between the measured values of both test configurations, but it tumed out that impacts using a detached headform have to be carried out at slightly greater vertical velocities to produce the same results as dummy tests. Dummy impacts onto the oblique abrasive anvil at 5.2 m/s were comparable to headform impacts at 6.0 mls. The results of dummy drop tests at 6.0 m/s lay between those of headform measurements at 6.0 m/s and 7.5 m/s. The differences between dummy and headform tests could be attributed to the inertial effects of the body mass acting on the head through the neck. These effects cause an additional rotation of the dummy headform about an
318 IRCOBI Conference - Montpellier (France), September 2000

axis in the neck area parallel to that passing through the ears. lts contribution to the resultant rotational acceleration accounts for the most part of the difference in rotational acceleration.
In dummy drop tests onto the flat anvil the motion of the head is more complex than for a detached headform. The measured linear and rotational accelerations, normal forces and HIC values increase with the impact velocity. For a given impact velocity the results systematically depend on the impact point and on the test configuration. For impacts at point P the peak rotational acceleration is much greater using a complete dummy instead of a detached headform. lt was concluded that this is probably due to the body dynamics transmitting !arge forces to the dummy head trough the neck. On the other band impacts at the points B and R showed lower rotational acceleration peaks when using a dummy. The reduced freedom of movement ofthe head, coupled to the body by the neck, could be the reason for this.
For drop tests onto a flat anvil the peak values of linear acceleration were significantly lower for dummy tests than for the equivalent headform tests. This was attributed to an increased effective mass of the headform when attached to the dummy. The greatest effective mass was found in P/90°-impacts where the normal impact forces act in the direction of the neck axis, whereas R/0°-impacts showed only a small increase.
The performed dummy drop tests demonstrate the combined effects of the body mass and the neck on the dynamics of an impacting dummy headform. The effects are less significant for oblique impacts than for impacts onto the flat anvil. Falling headform tests onto the oblique abrasive anvil are a good replacement for dummy tests if they are carried out at a slightly greater impact velocity. In case of impacts onto the flat anvil the influence of the dummy strongly depends on the impact configuration. Headform drop tests onto the flat anvil represent the worse case than dummy tests with regard to linear acceleration of the head, but this is not generally valid for rotational acceleration. Further investigations should include additional drop test configurations, as well as grea�er vertical and horizontal impact velocity components.
In future helmet standards falling headform tests will still be important to assess the linear acceleration of an impacting head. However, if rotational acceleration turns out to be an important head injury mechanism for certain impact configurations, dummy drop tests could be considered as a possible test method. In any case, dummy drop tests are an interesting alternative helmet test method to simulate füll scale impacts of a dummy riding a motorcycle against an obstacle.
Since the dynamics of the impacted headform depends on the dummy neck, the mechanical properties of the neck as weil as the forces and moments occurring during the impact should be studied in more detail. lt is known that the Hybrid III standard neck is stiffer than a human neck, so that it is not clear how accurately the Hybrid III dummy drop tests replicate a rider in a motorcycle accident. Future experiments should be carried out with an improved neck model, in order to simulate the impact of a head more realistically.
ACKNOWLEDGMENTS
The measurements were funded by the Swiss Federal Office for Education and Science (BBW). We wish to thank R. Bivetti and R. Stämpfli from our Institute for the support in the experimental work. We also thank Dr. B. Chinn and his group at the Transport Research Laboratory for the valuable discussions and Mr. Frattini of AGV and ANCMA for supplying the helmet samples for these tests.
REFERENCES
Aldman A., Lundell B., and Thomgren L.: Non-perpendicular irnpacts, an experimental study on crash helmets. Proceedings ofthe 1976 IRCOBI conference, pp. 322-3 3 1 .
Aldman A., Lundell B., and Thomgren L.: Heimet attenuation of the head response in oblique impacts to the ground. Proceedings ofthe 1978 IRCOBl conference, pp. 1 1 8- 128.
British Standard Institution: Specification for protective helmets for vehicle users. BS 6658: 1 985.
IRCOBI Co11fere11ce - Mo11tpellier (Fra11ce), September 2000 319

Chinn B. P„ Doyle D„ Otte D„ and Schuller E.: Motorcyclists head injuries: mechanisms identified from accident reconstruction and helmet damage replication. Proceedings of the 1999 IRCOBI conference, pp. 53-7 1 .
COST 327 Motorcycle Safety Heimets: Final Report of the Action. European Commission, Luxembourg: Office for Official Publications ofthe European Communities, 2000.
COST 327 Motorcycle Safety Heimets: Literature Review Final Report. TRL, UK, 1997.
COST 327 Motorcycle Safety Heimets: Accident Data Final Report. Accident Research Unit, Medical University Hannover, Germany, 1 999.
COST 327 Motorcycle Safety Heimets: Headforms Final Report. TRL, UK, 1 999.
COST 327 Motorcycle Safety Heimets: Reconstruction Final Report. TRL, UK, 2000.
COST 327 Motorcycle Safety Heimets: Test Procedures Final Report. EMPA St. Gallen, Switzerland, 2000.
Dixon P. R„ Karimi H„ and Mellor A. N.: Replication oftest lOP. TRL, UK, 1997.
ECE Regulation 22-04: United Nations Agreement. Uniform provisions conceming the approval of protective helmets for drivers and passengers ofmotorcycles and mopeds. 1995.
Newman J. A.: A generalised acceleration model for brain injury threshold (GAMBIT). Proceedings of the 1986 IRCOBI conference, pp. 1 2 1 - 1 3 1 .
Otte D.: Personal communication. 1999.
Padgaonkar A. J„ Krieger K. W„ and King A. I.: Measurement of angular acceleration of a rigid body using linear accelerometers. J. Appl. Mech„ 1975, pp. 552-556.
320 IRCOBI Co11fere11ce - Montpellier (Fra11ce}, September 2000
APPENDIX
Table A.l : Hybrid III dummy drop tests onto the oblique abrasive anvil: peak values oftangential and nonnal anvil force, headfonn rotational acceleration, rotational velocity, linear acceleration, and tangential impulse
Test Vel. Head impact Heimet Mass Peak Peak Peak Peak Rot. Vel. Peak Lin. Tg-Imp. No. [m/s) point/ [g] (without Tg-Force N-Force Rot. Ace. (rad/s) Ace. (Ns]
bodv angle visor) fNl INl [radfs21 l!!I 1 4.4 LEFT/O° 1363 639 1 13 1 1755 17.2 25 8.3 2 4.4 LEFT/0° 1320 729 1223 1579 19.8 25 10 . 1 3 4.4 LEFT/0° 1320 793 1 3 1 5 1984 2 1 .3 28 10.4 4 4.4 RIGHT/0° 1 3 1 1 671 1 1 69 2149 18.4 27 8.3 5 4.4 RIGHT/0° 1363 7 1 6 1321 2043 18.6 28 8.4 6 4.4 RIGHT/0° 1320 724 1239 2125 17.2 27 8.0
7 5.2 LEFT/0° 1370 833 1459 1906 2 1 .2 3 1 1 1 .0
8 5.2 LEFT/0° 1322 939 1668 2667 20.5 34 9.7
9 5.2 LEFT/0° 1340 887 1566 2421 22.4 32 10.7
10 5.2 RIGHT/0° 1370 921 1635 2877 2 1 .4 36 9.9
I I 6.0 LEFT/0° 1330 1 069 1890 3103 24.3 4 1 1 1 .8
1 2 6.0 LEFT/0° 1325 987 1744 2210 23.1 37 12.2 1 3 6.0 LEFTf0° 1337 1044 1791 2678 23.6 40 12.1
14 6.0 LEFT/0° 1332 1 147 1954 3 1 73 25.0 42 12.6 15 6.0 RJGHTf0° 1 3 1 7 1046 1865 3201 25.3 40 1 1 .5
1 6 6.0 RIGHT/0° 1330 1 1 1 6 1941 3362 26.9 44 12.2
1 7 6.0 RIGHT/0° 1325 1 1 54 1955 3680 27.6 44 12.7 1 8 6.0 RIGHT/0° 1356 1075 1859 3289 26.5 42 12.1
Table A.2: Hybrid III dummy drop tests onto the flat anvil: peak values ofnonnal anvil force, headfonn rotational and linear acceleration, and HIC
Test Velocity Head Impact Heimet Mass (g] Peak N-Force Peak Rot. Ace. Peak Lin. Ace. HIC No. [m/s) point/ (without visor) (N] (rad/s2) (g]
bodv an2le 1 4.4 8/30° 1 3 1 1 6547 2875 84 245
2 4.4 8/30° 1363 6468 2919 86 257
3 5.2 8/30° 1340 7626 3883 97 344
4 5.2 8/30° 1370 7487 3 1 77 102 398
5 5.2 8/30° 1340 8096 3594 97 362
6 6.0 8/30° 1 3 1 7 9473 3995 1 13 527
7 6.0 8/30° 1330 8125 4457 1 12 541
8 6.0 8/30° 1325 8595 3567 1 1 5 540
9 6.0 8/30° 1356 8841 2920 104 430
1 0 4.4 R/00 1 3 1 1 7 1 13 3603 123 584
I I 4.4 R/Oo 1363 7244 4065 126 602
1 2 4.4 R/00 1320 6562 3 1 99 1 1 6 504
13 4.4 R/00 1320 7134 3840 123 584
14 5.2 R/00 1340 8238 4776 139 835
15 5.2 R/Oo 1370 7943 3821 138 790
16 5.2 R/00 1322 7863 4238 141 783
1 7 5.2 R/00 1340 8239 4518 1 5 1 872
1 8 6.0 R/Oo 1 3 1 7 9347 5242 166 1 1 70
19 6.0 R/Oo 1325 8499 4393 158 1023
20 6.0 R/00 1356 8974 4730 171 1 124
2 1 4.4 P/90° 1363 1 1 735 3626 129 275
22 4.4 P/90° 1320 10714 4723 83 198
23 4.4 P/90° 1320 1 1278 4165 93 180
24 5.2 P/90° 1340 12476 4757 132 363
25 5.2 P/90° 1370 14225 4697 99 272
26 5.2 P/90° 1322 12620 4846 1 12 330
27 5.2 P/90° 1340 12422 4165 I I I 3 1 3
28 6.0 P/90° 1 3 1 7 14482 5656 139 4 1 1
29 6.0 P/90° 1330 14656 5881 133 352
30 6.0 P/90° 1325 15507 5000 120 363
3 1 6.0 P/90° 1356 17597 4681 144 421
IRCOBI Conference - Montpellier (France), September 2000 321