mortgagemonitor · summer’s multiple major hurricanes » the inventory of loans 90 or more days...
TRANSCRIPT
NOVEMBER 2017 REPORT
MONITORMORTGAGE
NOVEMBER 2017MONITORMORTGAGE
Confidential, Proprietary and/or Trade SecretTM SM ® Trademark(s) of Black Knight IP Holding Company, LLC, and/or an affiliate.
© 2018 Black Knight Financial Technology Solutions, LLC. All Rights Reserved.
CONTENTS
1 | NOVEMBER FIRST LOOK RELEASE
2 | Q3 2017 EQUITY & REFINANCE UPDATE
3 | ARM ORIGINATIONS & INTEREST RATE RESET RISK
4 | APPENDIX
5 | DISCLOSURES

NOVEMBER 2017MONITORMORTGAGE
Confidential, Proprietary and/or Trade SecretTM SM ® Trademark(s) of Black Knight IP Holding Company, LLC, and/or an affiliate.
© 2018 Black Knight Financial Technology Solutions, LLC. All Rights Reserved.
NOVEMBER 2017 OVERVIEW
Each month, the Black Knight Mortgage Monitor looks at a variety of issues related to the mortgage and financial services industry.
This month, as always, we begin with a look at some of the high-level mortgage performance statistics reported in the company’s most recent First Look report, with an update on delinquency, foreclosure and prepayment trends. Given that the lingering effects of this summer’s major hurricanes led to the largest monthly increase in 90-day delinquencies since 2008 – when the financial crisis began to take hold – we also provide an update on those impacts specifically.
Next, we review recent home price trends and examine how they have affected the levels of both negative and lendable equity nationwide, as well the number of mortgage holders with interest rate incentive to refinance and the share who are doing so. Finally, we revisit the adjustable rate mortgage (ARM) market, examining recent trends with regard to ARM originations and prepayment activity. We also look at the volume and make-up of active ARMs nationwide, while providing some insight into associated interest rate reset risk in 2018.
In producing the Mortgage Monitor, the Data & Analytics division of Black Knight aggregates, analyzes and reports upon the most recently available mortgage performance data from the company’s McDash loan-level database. For more information on McDash or Black Knight Data & Analytics in general, please call 844-474-2537 or email [email protected].
Stay connected with Black Knight Data & Analytics
NOVEMBER 2017MONITORMORTGAGE
Confidential, Proprietary and/or Trade SecretTM SM ® Trademark(s) of Black Knight IP Holding Company, LLC, and/or an affiliate.
© 2018 Black Knight Financial Technology Solutions, LLC. All Rights Reserved.
NOVEMBER FIRST LOOK RELEASE
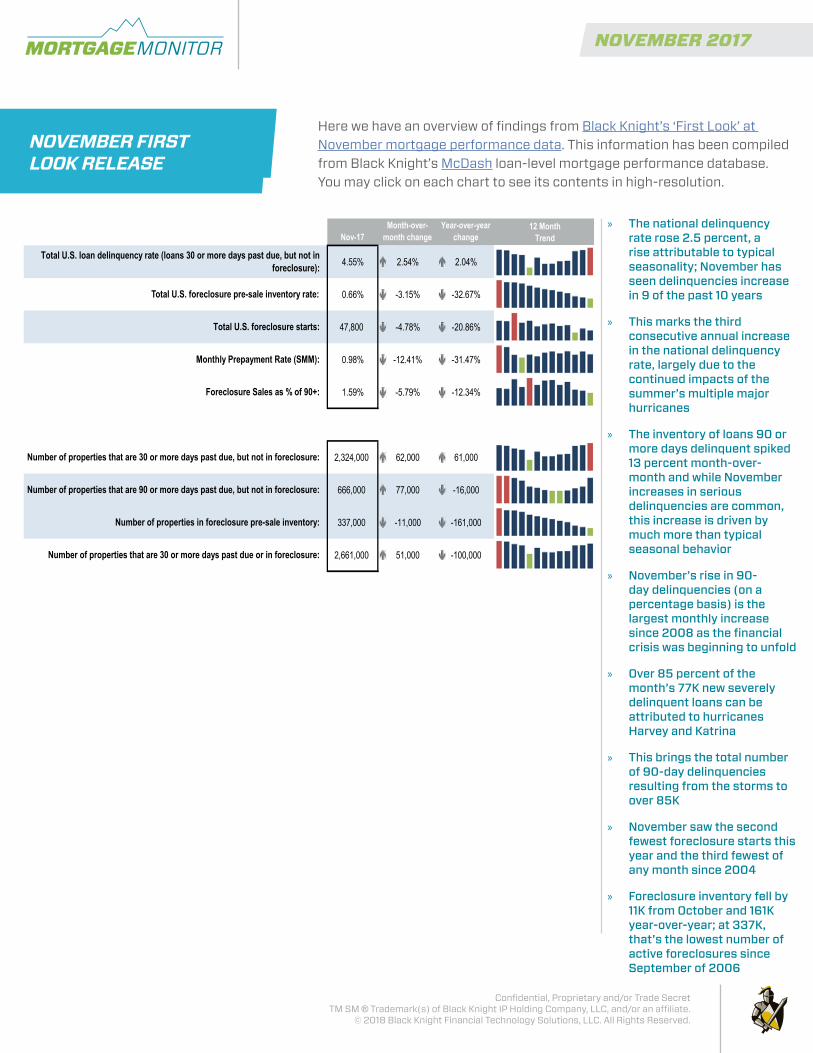
Here we have an overview of findings from Black Knight’s ‘First Look’ at November mortgage performance data. This information has been compiled from Black Knight’s McDash loan-level mortgage performance database. You may click on each chart to see its contents in high-resolution.
» The national delinquency rate rose 2.5 percent, a rise attributable to typical seasonality; November has seen delinquencies increase in 9 of the past 10 years
» This marks the third consecutive annual increase in the national delinquency rate, largely due to the continued impacts of the summer’s multiple major hurricanes
» The inventory of loans 90 or more days delinquent spiked 13 percent month-over-month and while November increases in serious delinquencies are common, this increase is driven by much more than typical seasonal behavior
» November’s rise in 90-day delinquencies (on a percentage basis) is the largest monthly increase since 2008 as the financial crisis was beginning to unfold
» Over 85 percent of the month’s 77K new severely delinquent loans can be attributed to hurricanes Harvey and Katrina
» This brings the total number of 90-day delinquencies resulting from the storms to over 85K
» November saw the second fewest foreclosure starts this year and the third fewest of any month since 2004
» Foreclosure inventory fell by 11K from October and 161K year-over-year; at 337K, that's the lowest number of active foreclosures since September of 2006
Nov-17Month-over-
month changeYear-over-year
change
4.55% 2.54% 2.04%
0.66% -3.15% -32.67%
47,800 -4.78% -20.86%
0.98% -12.41% -31.47%
1.59% -5.79% -12.34%
2,324,000 62,000 61,000
666,000 77,000 -16,000
337,000 -11,000 -161,000
2,661,000 51,000 -100,000
Number of properties that are 30 or more days past due, but not in foreclosure:
Number of properties that are 90 or more days past due, but not in foreclosure:
Number of properties in foreclosure pre-sale inventory:
Number of properties that are 30 or more days past due or in foreclosure:
Total U.S. foreclosure starts:
Monthly Prepayment Rate (SMM):
Foreclosure Sales as % of 90+:
Total U.S. foreclosure pre-sale inventory rate:
12 Month Trend
Total U.S. loan delinquency rate (loans 30 or more days past due, but not in foreclosure):
© 2017 - Black Knight Financial Services, Inc.: Unauthorized use is strictly prohibited. Based on data believed to be reliable, not guaranteed as to accuracy or completeness. Page 1 of 1
NOVEMBER 2017MONITORMORTGAGE
Confidential, Proprietary and/or Trade SecretTM SM ® Trademark(s) of Black Knight IP Holding Company, LLC, and/or an affiliate.
© 2018 Black Knight Financial Technology Solutions, LLC. All Rights Reserved.
NOVEMBER FIRST LOOK RELEASE
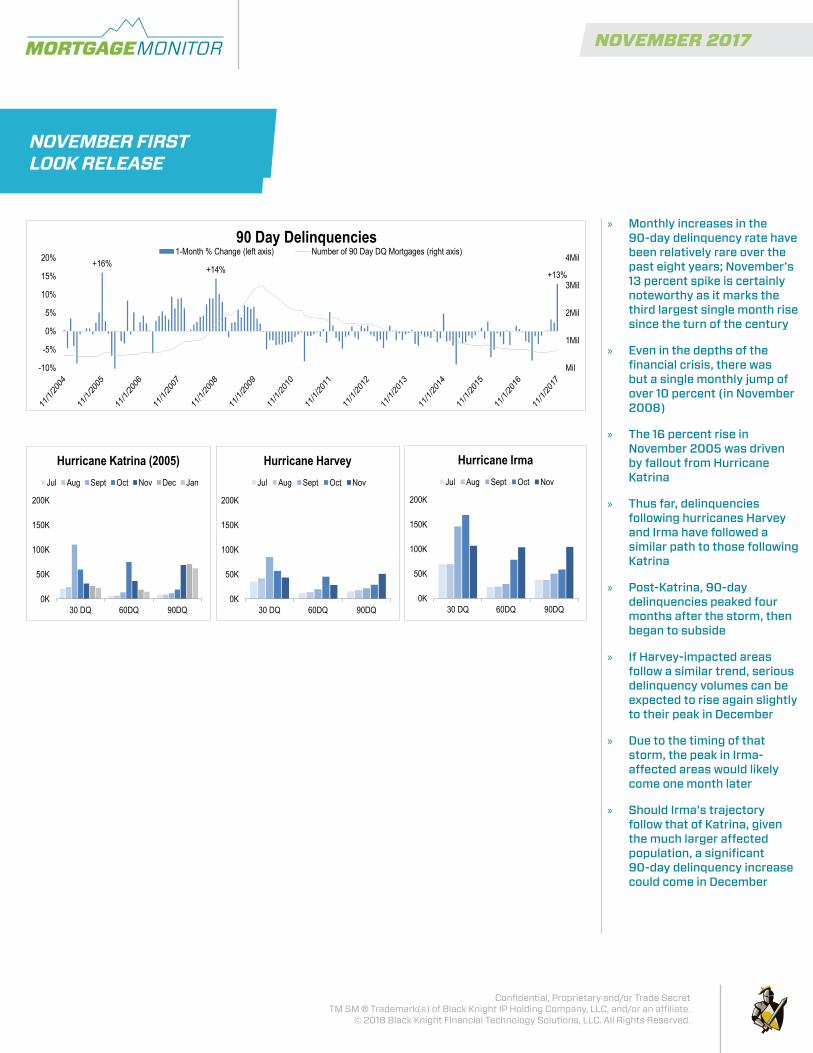
» Monthly increases in the 90-day delinquency rate have been relatively rare over the past eight years; November’s 13 percent spike is certainly noteworthy as it marks the third largest single month rise since the turn of the century
» Even in the depths of the financial crisis, there was but a single monthly jump of over 10 percent (in November 2008)
» The 16 percent rise in November 2005 was driven by fallout from Hurricane Katrina
» Thus far, delinquencies following hurricanes Harvey and Irma have followed a similar path to those following Katrina
» Post-Katrina, 90-day delinquencies peaked four months after the storm, then began to subside
» If Harvey-impacted areas follow a similar trend, serious delinquency volumes can be expected to rise again slightly to their peak in December
» Due to the timing of that storm, the peak in Irma-affected areas would likely come one month later
» Should Irma’s trajectory follow that of Katrina, given the much larger affected population, a significant 90-day delinquency increase could come in December
+16% +14% +13%
Mil
1Mil
2Mil
3Mil
4Mil
-10%
-5%
0%
5%
10%
15%
20%
90 Day Delinquencies 1-Month % Change (left axis) Number of 90 Day DQ Mortgages (right axis)
0K
50K
100K
150K
200K
30 DQ 60DQ 90DQ
Hurricane Harvey Jul Aug Sept Oct Nov
0K
50K
100K
150K
200K
30 DQ 60DQ 90DQ
Hurricane Irma Jul Aug Sept Oct Nov
0K
50K
100K
150K
200K
30 DQ 60DQ 90DQ
Hurricane Katrina (2005) Jul Aug Sept Oct Nov Dec Jan
© 2017 - Black Knight Financial Services, Inc.: Unauthorized use is strictly prohibited. Based on data believed to be reliable, not guaranteed as to accuracy or completeness. Page 1 of 1
NOVEMBER 2017MONITORMORTGAGE
Confidential, Proprietary and/or Trade SecretTM SM ® Trademark(s) of Black Knight IP Holding Company, LLC, and/or an affiliate.
© 2018 Black Knight Financial Technology Solutions, LLC. All Rights Reserved.
NOVEMBER FIRST LOOK RELEASE
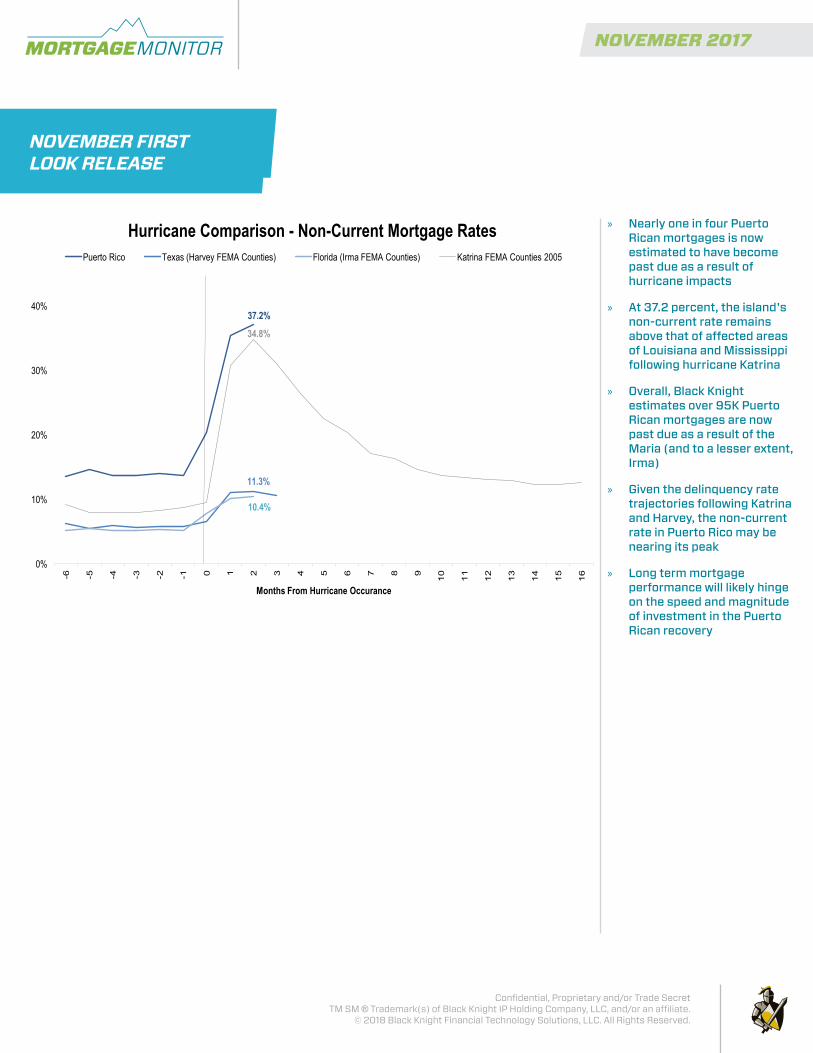
» Nearly one in four Puerto Rican mortgages is now estimated to have become past due as a result of hurricane impacts
» At 37.2 percent, the island's non-current rate remains above that of affected areas of Louisiana and Mississippi following hurricane Katrina
» Overall, Black Knight estimates over 95K Puerto Rican mortgages are now past due as a result of the Maria (and to a lesser extent, Irma)
» Given the delinquency rate trajectories following Katrina and Harvey, the non-current rate in Puerto Rico may be nearing its peak
» Long term mortgage performance will likely hinge on the speed and magnitude of investment in the Puerto Rican recovery
37.2%
11.3%
10.4%
34.8%
0%
10%
20%
30%
40%
-6
-5
-4
-3
-2
-1
0
1
2
3
4
5
6
7
8
9
10
11
12
13
14
15
16
Months From Hurricane Occurance
Hurricane Comparison - Non-Current Mortgage Rates Puerto Rico Texas (Harvey FEMA Counties) Florida (Irma FEMA Counties) Katrina FEMA Counties 2005
NOVEMBER 2017MONITORMORTGAGE
Confidential, Proprietary and/or Trade SecretTM SM ® Trademark(s) of Black Knight IP Holding Company, LLC, and/or an affiliate.
© 2018 Black Knight Financial Technology Solutions, LLC. All Rights Reserved.
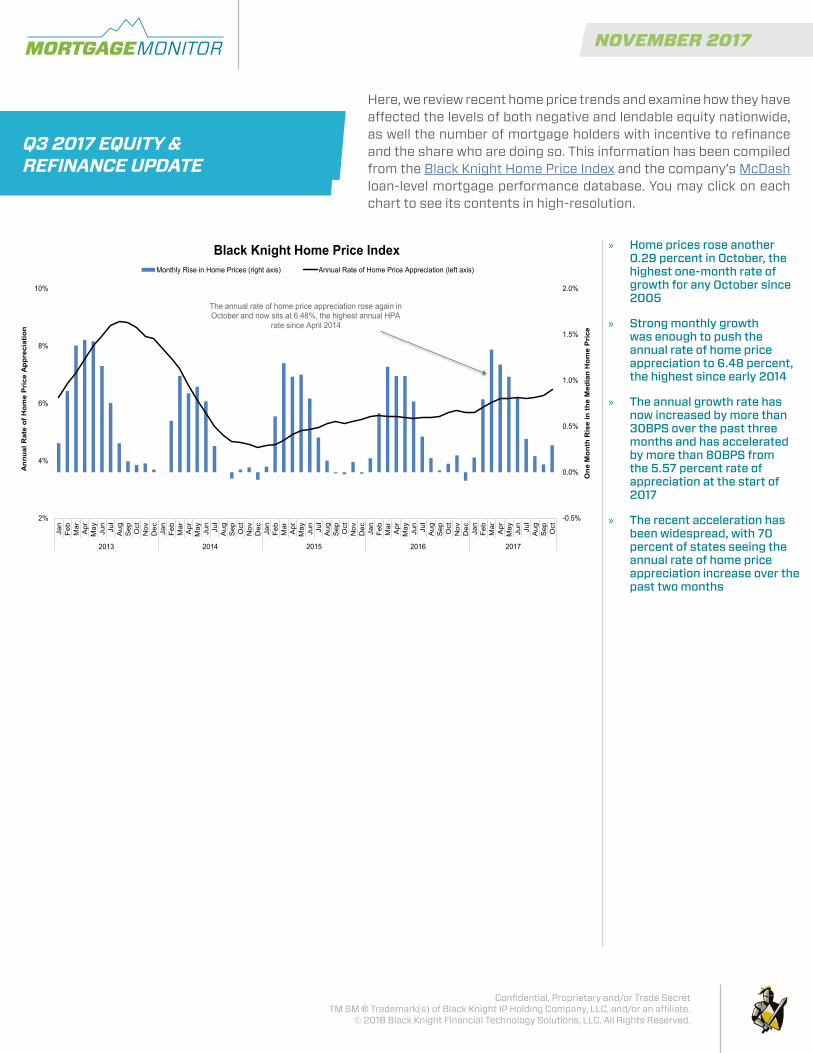
» Home prices rose another 0.29 percent in October, the highest one-month rate of growth for any October since 2005
» Strong monthly growth was enough to push the annual rate of home price appreciation to 6.48 percent, the highest since early 2014
» The annual growth rate has now increased by more than 30BPS over the past three months and has accelerated by more than 80BPS from the 5.57 percent rate of appreciation at the start of 2017
» The recent acceleration has been widespread, with 70 percent of states seeing the annual rate of home price appreciation increase over the past two months
-0.5%
0.0%
0.5%
1.0%
1.5%
2.0%
2%
4%
6%
8%
10%
Jan
Feb
Mar
A
pr
May
Ju
n Ju
l A
ug
Sep
O
ct
Nov
D
ec
Jan
Feb
Mar
A
pr
May
Ju
n Ju
l A
ug
Sep
O
ct
Nov
D
ec
Jan
Feb
Mar
A
pr
May
Ju
n Ju
l A
ug
Sep
O
ct
Nov
D
ec
Jan
Feb
Mar
A
pr
May
Ju
n Ju
l A
ug
Sep
O
ct
Nov
D
ec
Jan
Feb
Mar
A
pr
May
Ju
n Ju
l A
ug
Sep
O
ct
2013 2014 2015 2016 2017
One
Mon
th R
ise
in th
e M
edia
n H
ome
Pri
ce
Ann
ual R
ate
of H
ome
Pri
ce A
ppre
ciat
ion
Black Knight Home Price Index Monthly Rise in Home Prices (right axis) Annual Rate of Home Price Appreciation (left axis)
The annual rate of home price appreciation rose again in October and now sits at 6.48%, the highest annual HPA
rate since April 2014
Here, we review recent home price trends and examine how they have affected the levels of both negative and lendable equity nationwide, as well the number of mortgage holders with incentive to refinance and the share who are doing so. This information has been compiled from the Black Knight Home Price Index and the company’s McDash loan-level mortgage performance database. You may click on each chart to see its contents in high-resolution.
Q3 2017 EQUITY & REFINANCE UPDATE
NOVEMBER 2017MONITORMORTGAGE
Confidential, Proprietary and/or Trade SecretTM SM ® Trademark(s) of Black Knight IP Holding Company, LLC, and/or an affiliate.
© 2018 Black Knight Financial Technology Solutions, LLC. All Rights Reserved.
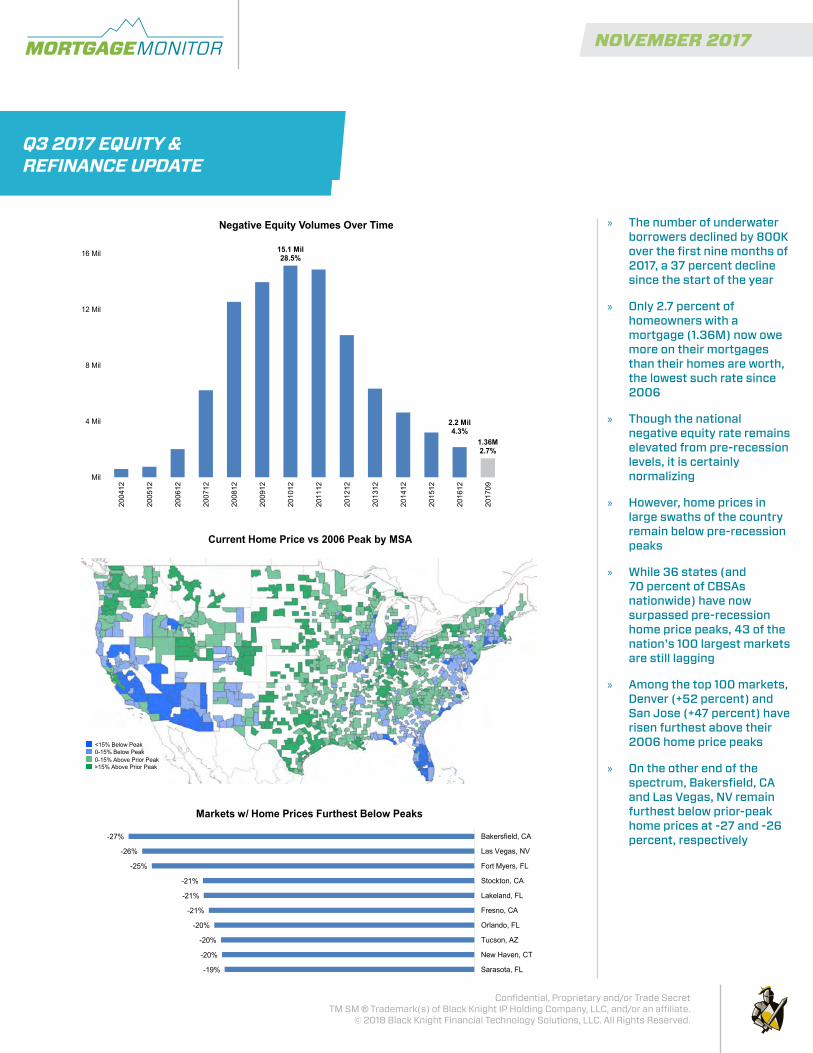
» The number of underwater borrowers declined by 800K over the first nine months of 2017, a 37 percent decline since the start of the year
» Only 2.7 percent of homeowners with a mortgage (1.36M) now owe more on their mortgages than their homes are worth, the lowest such rate since 2006
» Though the national negative equity rate remains elevated from pre-recession levels, it is certainly normalizing
» However, home prices in large swaths of the country remain below pre-recession peaks
» While 36 states (and 70 percent of CBSAs nationwide) have now surpassed pre-recession home price peaks, 43 of the nation's 100 largest markets are still lagging
» Among the top 100 markets, Denver (+52 percent) and San Jose (+47 percent) have risen furthest above their 2006 home price peaks
» On the other end of the spectrum, Bakersfield, CA and Las Vegas, NV remain furthest below prior-peak home prices at -27 and -26 percent, respectively
15.1 Mil 28.5%
2.2 Mil 4.3%
1.36M 2.7%
Mil
4 Mil
8 Mil
12 Mil
16 Mil
2004
12
2005
12
2006
12
2007
12
2008
12
2009
12
2010
12
2011
12
2012
12
2013
12
2014
12
2015
12
2016
12
2017
09
Negative Equity Volumes Over Time
-19%
-20%
-20%
-20%
-21%
-21%
-21%
-25%
-26%
-27%
Sarasota, FL
New Haven, CT
Tucson, AZ
Orlando, FL
Fresno, CA
Lakeland, FL
Stockton, CA
Fort Myers, FL
Las Vegas, NV
Bakersfield, CA
Markets w/ Home Prices Furthest Below Peaks
Current Home Price vs 2006 Peak by MSA
<15% Below Peak 0-15% Below Peak 0-15% Above Prior Peak >15% Above Prior Peak
Q3 2017 EQUITY & REFINANCE UPDATE
NOVEMBER 2017MONITORMORTGAGE
Confidential, Proprietary and/or Trade SecretTM SM ® Trademark(s) of Black Knight IP Holding Company, LLC, and/or an affiliate.
© 2018 Black Knight Financial Technology Solutions, LLC. All Rights Reserved.
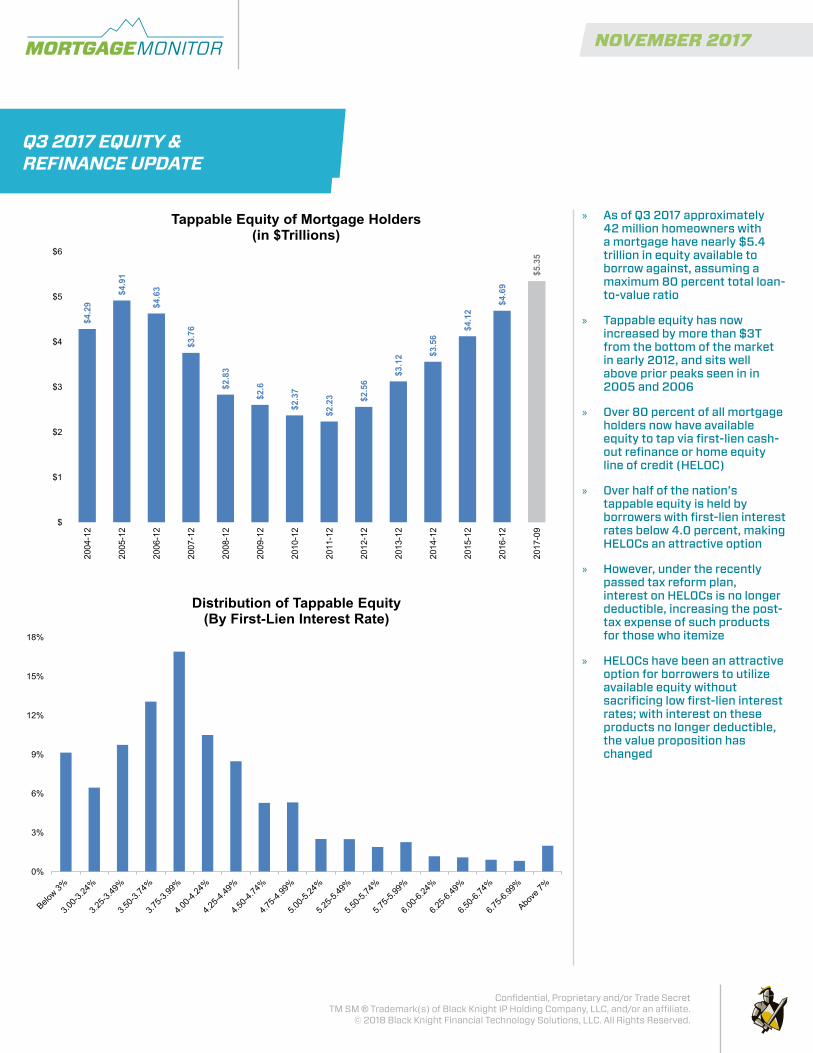
» As of Q3 2017 approximately 42 million homeowners with a mortgage have nearly $5.4 trillion in equity available to borrow against, assuming a maximum 80 percent total loan-to-value ratio
» Tappable equity has now increased by more than $3T from the bottom of the market in early 2012, and sits well above prior peaks seen in in 2005 and 2006
» Over 80 percent of all mortgage holders now have available equity to tap via first-lien cash-out refinance or home equity line of credit (HELOC)
» Over half of the nation’s tappable equity is held by borrowers with first-lien interest rates below 4.0 percent, making HELOCs an attractive option
» However, under the recently passed tax reform plan, interest on HELOCs is no longer deductible, increasing the post-tax expense of such products for those who itemize
» HELOCs have been an attractive option for borrowers to utilize available equity without sacrificing low first-lien interest rates; with interest on these products no longer deductible, the value proposition has changed
$4.2
9
$4.9
1
$4.6
3
$3.7
6
$2.8
3
$2.6
$2.3
7
$2.2
3 $2.5
6
$3.1
2 $3.5
6
$4.1
2
$4.6
9
$5.3
5 $
$1
$2
$3
$4
$5
$6
2004
-12
2005
-12
2006
-12
2007
-12
2008
-12
2009
-12
2010
-12
2011
-12
2012
-12
2013
-12
2014
-12
2015
-12
2016
-12
2017
-09
Tappable Equity of Mortgage Holders (in $Trillions)
0%
3%
6%
9%
12%
15%
18%
Distribution of Tappable Equity (By First-Lien Interest Rate)
Q3 2017 EQUITY & REFINANCE UPDATE
NOVEMBER 2017MONITORMORTGAGE
Confidential, Proprietary and/or Trade SecretTM SM ® Trademark(s) of Black Knight IP Holding Company, LLC, and/or an affiliate.
© 2018 Black Knight Financial Technology Solutions, LLC. All Rights Reserved.
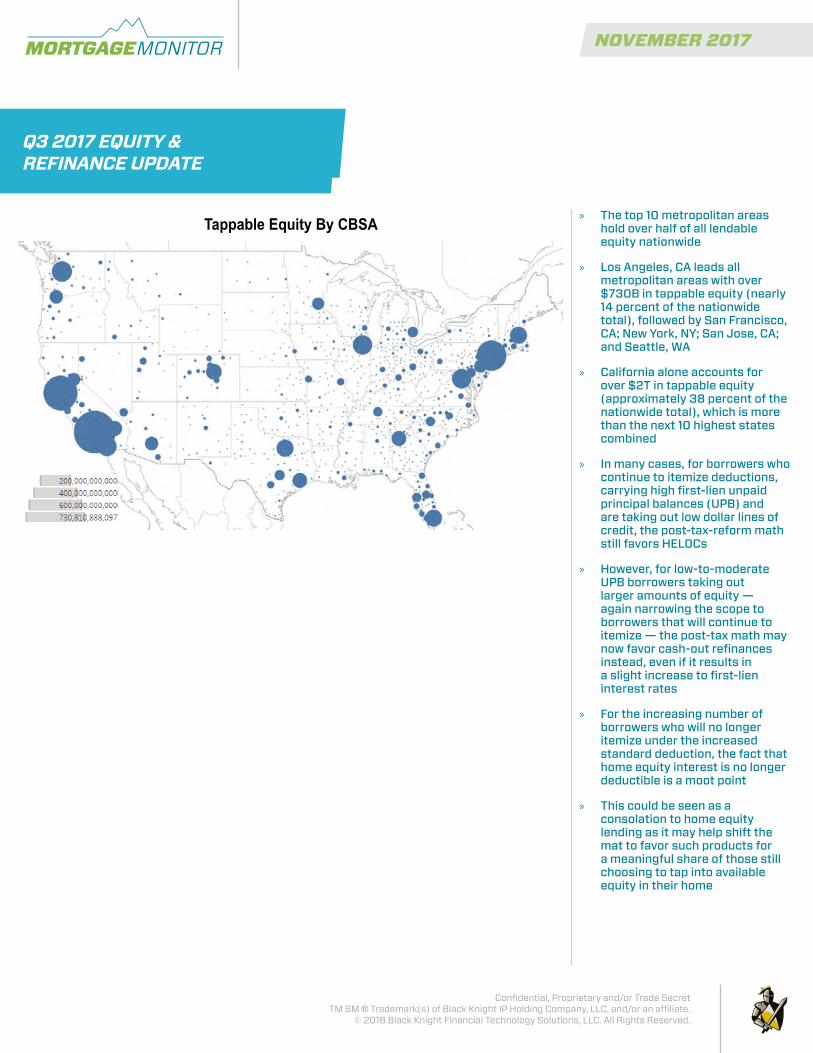
» The top 10 metropolitan areas hold over half of all lendable equity nationwide
» Los Angeles, CA leads all metropolitan areas with over $730B in tappable equity (nearly 14 percent of the nationwide total), followed by San Francisco, CA; New York, NY; San Jose, CA; and Seattle, WA
» California alone accounts for over $2T in tappable equity (approximately 38 percent of the nationwide total), which is more than the next 10 highest states combined
» In many cases, for borrowers who continue to itemize deductions, carrying high first-lien unpaid principal balances (UPB) and are taking out low dollar lines of credit, the post-tax-reform math still favors HELOCs
» However, for low-to-moderate UPB borrowers taking out larger amounts of equity — again narrowing the scope to borrowers that will continue to itemize — the post-tax math may now favor cash-out refinances instead, even if it results in a slight increase to first-lien interest rates
» For the increasing number of borrowers who will no longer itemize under the increased standard deduction, the fact that home equity interest is no longer deductible is a moot point
» This could be seen as a consolation to home equity lending as it may help shift the mat to favor such products for a meaningful share of those still choosing to tap into available equity in their home
Tappable Equity By CBSA
Q3 2017 EQUITY & REFINANCE UPDATE

NOVEMBER 2017MONITORMORTGAGE
Confidential, Proprietary and/or Trade SecretTM SM ® Trademark(s) of Black Knight IP Holding Company, LLC, and/or an affiliate.
© 2018 Black Knight Financial Technology Solutions, LLC. All Rights Reserved.
» 356K cash-out refinances were completed in Q3 2017, up from 356K in Q2 but down 14 percent from one year ago due to interest rate tightening
» Borrowers pulling cash out through first-lien refinances withdrew $68K in equity on average (down slightly from $69k on average last quarter) for a total of $26B in Q3
» Despite annual declines, the cash-out refinance market share has soared over the past two quarters and now accounts for 62 percent of all refinances
» Barring a noticeable drop in interest rates, this share is likely to continue to rise given rate/term refinance burnout
» Still, 75 percent fewer borrowers are pulling equity out each quarter via cash-out refis than at the peak of activity in 2005
» Peak cash-out market share was seen in Q2 2006 (corresponding to the pre-crisis peak for home prices), when 84 percent of all refi activity was driven by borrowers accessing home equity
Q3 2017 EQUITY & REFINANCE UPDATE
NOVEMBER 2017MONITORMORTGAGE
Confidential, Proprietary and/or Trade SecretTM SM ® Trademark(s) of Black Knight IP Holding Company, LLC, and/or an affiliate.
© 2018 Black Knight Financial Technology Solutions, LLC. All Rights Reserved.
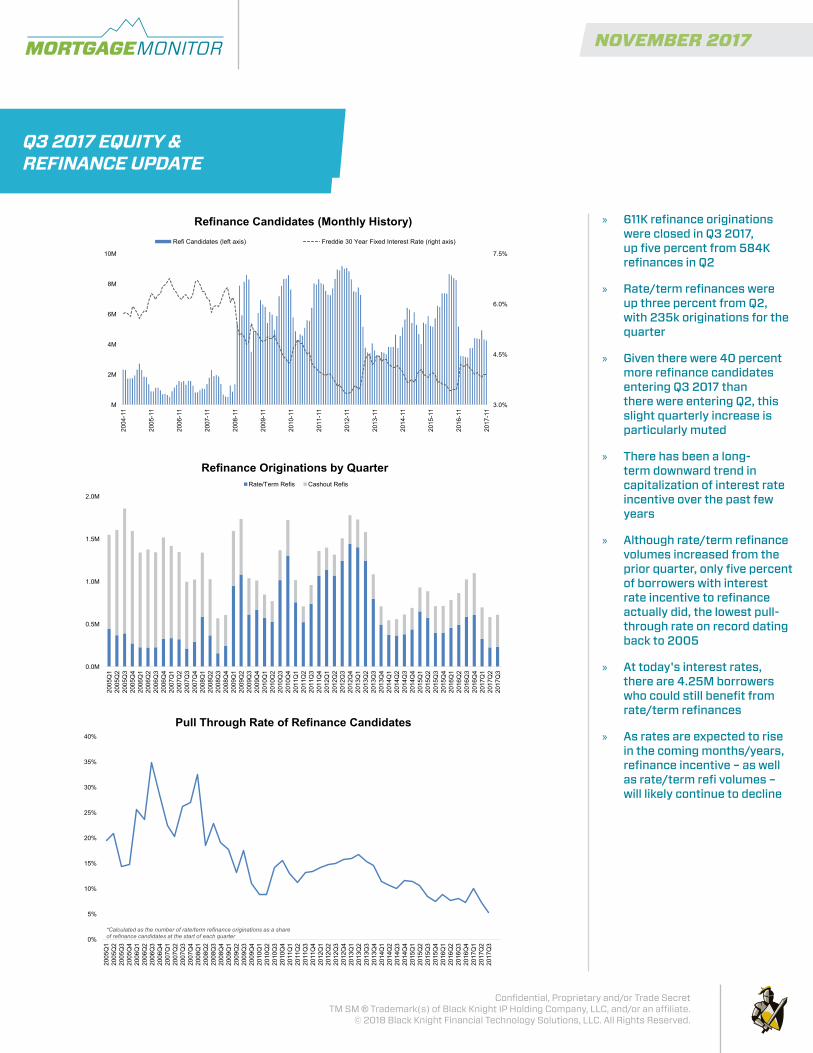
» 611K refinance originations were closed in Q3 2017, up five percent from 584K refinances in Q2
» Rate/term refinances were up three percent from Q2, with 235k originations for the quarter
» Given there were 40 percent more refinance candidates entering Q3 2017 than there were entering Q2, this slight quarterly increase is particularly muted
» There has been a long-term downward trend in capitalization of interest rate incentive over the past few years
» Although rate/term refinance volumes increased from the prior quarter, only five percent of borrowers with interest rate incentive to refinance actually did, the lowest pull-through rate on record dating back to 2005
» At today's interest rates, there are 4.25M borrowers who could still benefit from rate/term refinances
» As rates are expected to rise in the coming months/years, refinance incentive – as well as rate/term refi volumes – will likely continue to decline
0.0M
0.5M
1.0M
1.5M
2.0M
2005
Q1
2005
Q2
2005
Q3
2005
Q4
2006
Q1
2006
Q2
2006
Q3
2006
Q4
2007
Q1
2007
Q2
2007
Q3
2007
Q4
2008
Q1
2008
Q2
2008
Q3
2008
Q4
2009
Q1
2009
Q2
2009
Q3
2009
Q4
2010
Q1
2010
Q2
2010
Q3
2010
Q4
2011
Q1
2011
Q2
2011
Q3
2011
Q4
2012
Q1
2012
Q2
2012
Q3
2012
Q4
2013
Q1
2013
Q2
2013
Q3
2013
Q4
2014
Q1
2014
Q2
2014
Q3
2014
Q4
2015
Q1
2015
Q2
2015
Q3
2015
Q4
2016
Q1
2016
Q2
2016
Q3
2016
Q4
2017
Q1
2017
Q2
2017
Q3
Refinance Originations by Quarter Rate/Term Refis Cashout Refis
0%
5%
10%
15%
20%
25%
30%
35%
40%
2005
Q1
2005
Q2
2005
Q3
2005
Q4
2006
Q1
2006
Q2
2006
Q3
2006
Q4
2007
Q1
2007
Q2
2007
Q3
2007
Q4
2008
Q1
2008
Q2
2008
Q3
2008
Q4
2009
Q1
2009
Q2
2009
Q3
2009
Q4
2010
Q1
2010
Q2
2010
Q3
2010
Q4
2011
Q1
2011
Q2
2011
Q3
2011
Q4
2012
Q1
2012
Q2
2012
Q3
2012
Q4
2013
Q1
2013
Q2
2013
Q3
2013
Q4
2014
Q1
2014
Q2
2014
Q3
2014
Q4
2015
Q1
2015
Q2
2015
Q3
2015
Q4
2016
Q1
2016
Q2
2016
Q3
2016
Q4
2017
Q1
2017
Q2
2017
Q3
Pull Through Rate of Refinance Candidates
*Calculated as the number of rate/term refinance originations as a share of refinance candidates at the start of each quarter
3.0%
4.5%
6.0%
7.5%
M
2M
4M
6M
8M
10M
2004
-11
2005
-11
2006
-11
2007
-11
2008
-11
2009
-11
2010
-11
2011
-11
2012
-11
2013
-11
2014
-11
2015
-11
2016
-11
2017
-11
Refinance Candidates (Monthly History) Refi Candidates (left axis) Freddie 30 Year Fixed Interest Rate (right axis)
Q3 2017 EQUITY & REFINANCE UPDATE

NOVEMBER 2017MONITORMORTGAGE
Confidential, Proprietary and/or Trade SecretTM SM ® Trademark(s) of Black Knight IP Holding Company, LLC, and/or an affiliate.
© 2018 Black Knight Financial Technology Solutions, LLC. All Rights Reserved.
» Post-recession, we've seen a strong correlation between interest rate movement and the ARM share of mortgage originations
» As interest rates increase, so does the ARM share of mortgage lending, in terms of both purchase and refinance originations
» The delta between interest rate offerings on 30-year-fixed mortgages vs. hybrid ARMs has increased as rates have risen, making ARMs more appealing, particularly as mortgage related expenses rise in tandem
» Likewise, as rates softened in mid to late 2017, ARMs made up a lower share of overall originations
» As of October, the ARM share of originations was roughly four percent by count (the lowest in nearly six years) and ~10 percent by dollar amount (lowest in nearly three years)
» ARMs being originated today are markedly different than pre-recession ARMs, with tighter underwriting criteria and longer initial fixed periods on average as well
» ARMs are also prepaying at a much faster rate than fixed rate loans; on average, the conditional prepayment rate (CPR) on ARMs has been 6.7 percentage points higher than that of fixed rate mortgages
» In addition, 70 percent of borrowers refinancing ARMs are subsequently taking out fixed rate mortgages
0%
5%
10%
15%
20%
25%
30%
2005
-11
2006
-11
2007
-11
2008
-11
2009
-11
2010
-11
2011
-11
2012
-11
2013
-11
2014
-11
2015
-11
2016
-11
2017
-11
Prepayment Rate (CPR) by Interest Type ARM Fixed
3.0%
4.0%
5.0%
6.0%
7.0%
-10%
-5%
0%
5%
10%
15%
2005
-11
2006
-11
2007
-11
2008
-11
2009
-11
2010
-11
2011
-11
2012
-11
2013
-11
2014
-11
2015
-11
2016
-11
2017
-11
Delta Between ARM and Fixed Prepay Speeds (CPR) Delta Between ARM and Fixed CPR (left axis) Freddie 30-Year Fixed Rate (right axis)
2.0%
3.5%
5.0%
6.5%
8.0%
0%
10%
20%
30%
40%
50%
60%
70%
2000
-10
2001
-10
2002
-10
2003
-10
2004
-10
2005
-10
2006
-10
2007
-10
2008
-10
2009
-10
2010
-10
2011
-10
2012
-10
2013
-10
2014
-10
2015
-10
2016
-10
2017
-10
ARM Share of Originations By Volume (left axis) By Count (left axis)
Freddie 30-Year Intrest Rate (right axis)
*Calculated by subtracting CPR on Fixed Rate Loans from that of ARM Loans
ARM ORIGINATIONS & INTEREST RATE RESET RISK
Here we examine recent trends with regard to adjustable rate mortgage (ARM) originations and prepayment activity. We also look at the volume and make-up of active ARMs nationwide, while providing some insight into ARM interest rate reset risk in 2018. This information has been compiled from Black Knight’s McDash loan-level mortgage performance database. You may click on each chart to see its contents in high-resolution.

NOVEMBER 2017MONITORMORTGAGE
Confidential, Proprietary and/or Trade SecretTM SM ® Trademark(s) of Black Knight IP Holding Company, LLC, and/or an affiliate.
© 2018 Black Knight Financial Technology Solutions, LLC. All Rights Reserved.
» As a result of low ARM origination volumes, higher than average ARM prepayment speeds, and borrowers refinancing out of ARMs into fixed rate mortgages, the number of outstanding ARMs has steadily declined over the past 11 years
» Overall volumes are down by more than 8.4M (over 60 percent) from their 2006 peak
» Today, fewer than 5M ARMs remain active, the fewest since 2002
» ARMs now make up less than 10 percent of all active loans - down from one quarter of all active mortgages at the peak in 2006 - the lowest market share since the turn of the century
» Just 1.4M ARMs remain under initial fixed term rates, slightly more than a year ago, but markedly lower than the 10.5M+ seen in 2006
» These pre-reset ARM loans are typically viewed as high risk, as they may be subject to payment increases when their initial fixed term expires
» 3.4M active ARMs are operating under their adjustable rate phase, and rising indexes can impact both interest rates and monthly payments for those borrowers
» Such borrowers make up nearly seven percent of all outstanding mortgages
» While the adjustable nature of these loans presented little risk during the recession as indexes were extremely low, these indexes have recently begun to rise
ARM ORIGINATIONS & INTEREST RATE RESET RISK
NOVEMBER 2017MONITORMORTGAGE
Confidential, Proprietary and/or Trade SecretTM SM ® Trademark(s) of Black Knight IP Holding Company, LLC, and/or an affiliate.
© 2018 Black Knight Financial Technology Solutions, LLC. All Rights Reserved.
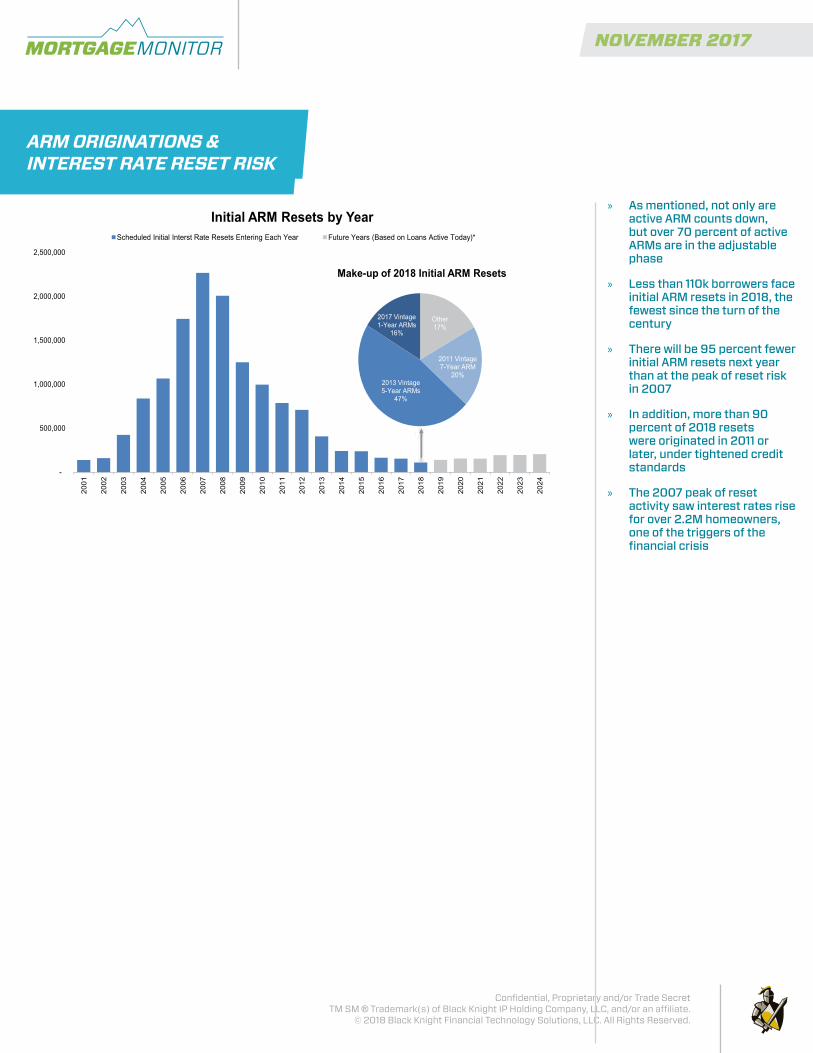
» As mentioned, not only are active ARM counts down, but over 70 percent of active ARMs are in the adjustable phase
» Less than 110k borrowers face initial ARM resets in 2018, the fewest since the turn of the century
» There will be 95 percent fewer initial ARM resets next year than at the peak of reset risk in 2007
» In addition, more than 90 percent of 2018 resets were originated in 2011 or later, under tightened credit standards
» The 2007 peak of reset activity saw interest rates rise for over 2.2M homeowners, one of the triggers of the financial crisis
-
500,000
1,000,000
1,500,000
2,000,000
2,500,000
2001
2002
2003
2004
2005
2006
2007
2008
2009
2010
2011
2012
2013
2014
2015
2016
2017
2018
2019
2020
2021
2022
2023
2024
Initial ARM Resets by Year Scheduled Initial Interst Rate Resets Entering Each Year Future Years (Based on Loans Active Today)*
Other 17%
2011 Vintage 7-Year ARM
20% 2013 Vintage 5-Year ARMs
47%
2017 Vintage 1-Year ARMs
16%
Make-up of 2018 Initial ARM Resets
ARM ORIGINATIONS & INTEREST RATE RESET RISK
NOVEMBER 2017MONITORMORTGAGE
Confidential, Proprietary and/or Trade SecretTM SM ® Trademark(s) of Black Knight IP Holding Company, LLC, and/or an affiliate.
© 2018 Black Knight Financial Technology Solutions, LLC. All Rights Reserved.
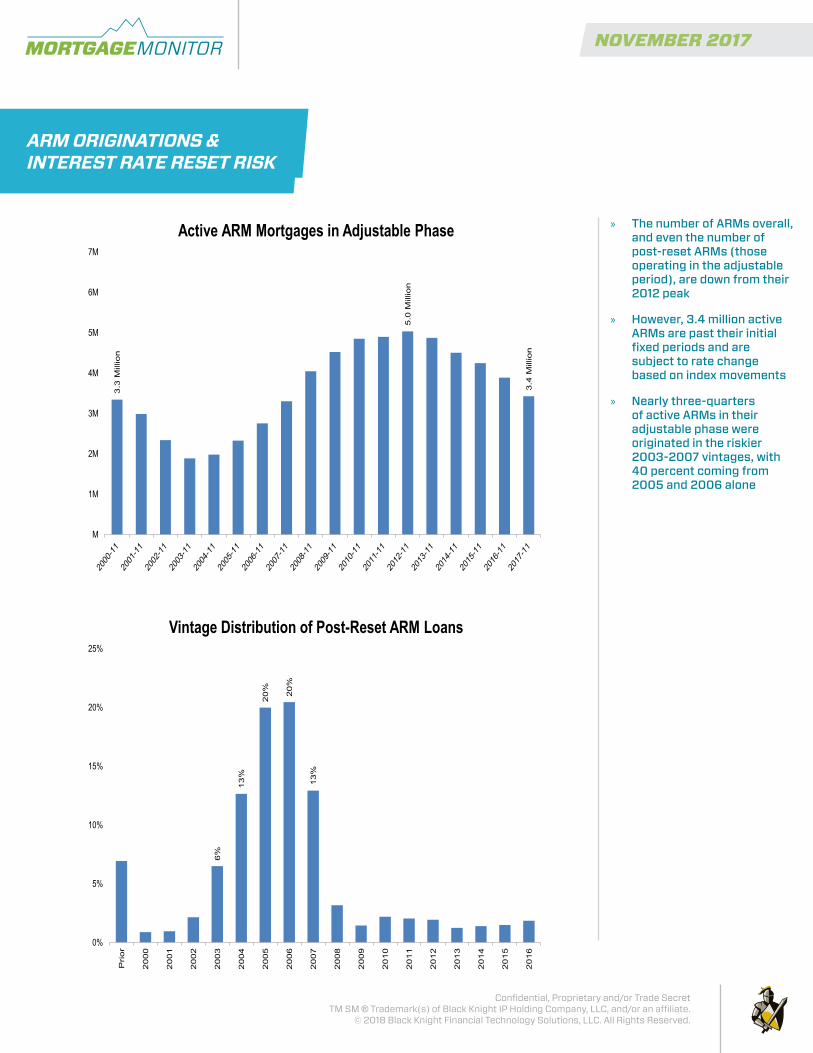
» The number of ARMs overall, and even the number of post-reset ARMs (those operating in the adjustable period), are down from their 2012 peak
» However, 3.4 million active ARMs are past their initial fixed periods and are subject to rate change based on index movements
» Nearly three-quarters of active ARMs in their adjustable phase were originated in the riskier 2003-2007 vintages, with 40 percent coming from 2005 and 2006 alone
3.3
Mill
ion
5.0
Mill
ion
3.4
Mill
ion
M
1M
2M
3M
4M
5M
6M
7M
Active ARM Mortgages in Adjustable Phase 6
%
13
%
20
%
20%
13%
0%
5%
10%
15%
20%
25%
Pri
or
20
00
20
01
20
02
20
03
20
04
20
05
2006
2007
20
08
20
09
20
10
20
11
20
12
20
13
20
14
20
15
20
16
Vintage Distribution of Post-Reset ARM Loans
ARM ORIGINATIONS & INTEREST RATE RESET RISK
NOVEMBER 2017MONITORMORTGAGE
Confidential, Proprietary and/or Trade SecretTM SM ® Trademark(s) of Black Knight IP Holding Company, LLC, and/or an affiliate.
© 2018 Black Knight Financial Technology Solutions, LLC. All Rights Reserved.
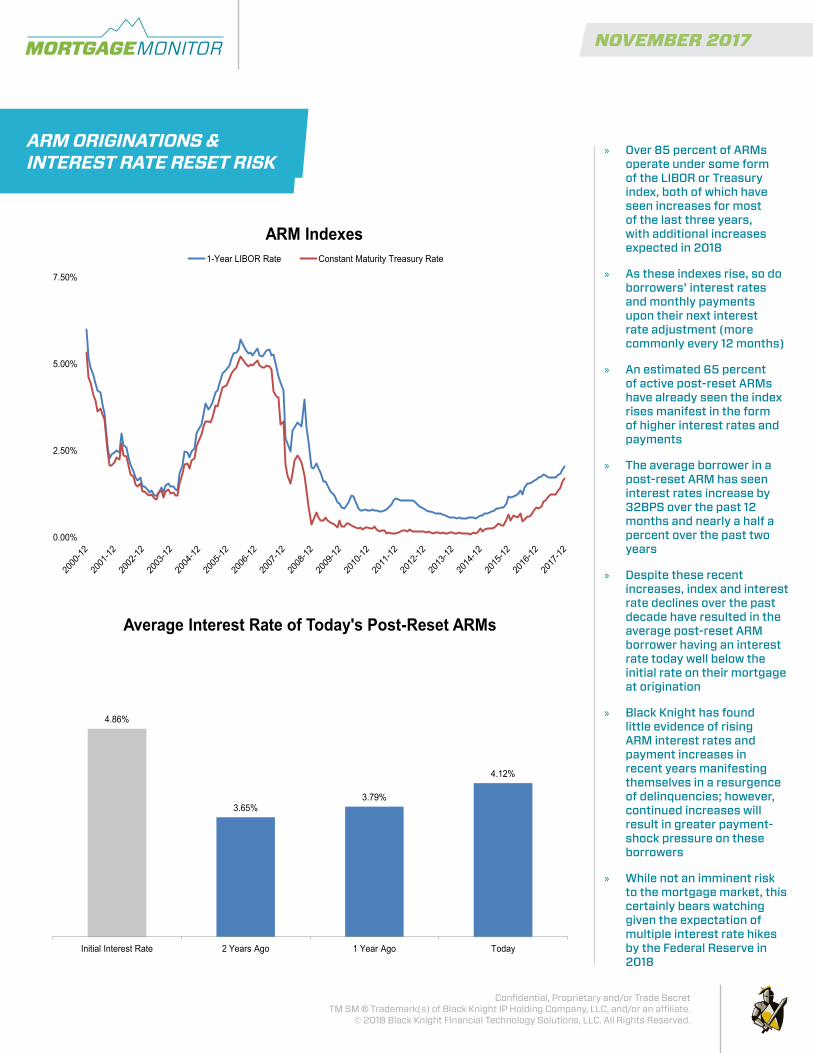
» Over 85 percent of ARMs operate under some form of the LIBOR or Treasury index, both of which have seen increases for most of the last three years, with additional increases expected in 2018
» As these indexes rise, so do borrowers' interest rates and monthly payments upon their next interest rate adjustment (more commonly every 12 months)
» An estimated 65 percent of active post-reset ARMs have already seen the index rises manifest in the form of higher interest rates and payments
» The average borrower in a post-reset ARM has seen interest rates increase by 32BPS over the past 12 months and nearly a half a percent over the past two years
» Despite these recent increases, index and interest rate declines over the past decade have resulted in the average post-reset ARM borrower having an interest rate today well below the initial rate on their mortgage at origination
» Black Knight has found little evidence of rising ARM interest rates and payment increases in recent years manifesting themselves in a resurgence of delinquencies; however, continued increases will result in greater payment-shock pressure on these borrowers
» While not an imminent risk to the mortgage market, this certainly bears watching given the expectation of multiple interest rate hikes by the Federal Reserve in 2018
0.00%
2.50%
5.00%
7.50%
ARM Indexes 1-Year LIBOR Rate Constant Maturity Treasury Rate
4.86%
3.65% 3.79%
4.12%
Initial Interest Rate 2 Years Ago 1 Year Ago Today
Average Interest Rate of Today's Post-Reset ARMs
30-35% 30-35% 30%
0.1%
58%
19% 17%
7%
0%
20%
40%
60%
80%
GSE Portfolio GNMA PRIVATE
Market Share by Investor
Puerto Rico Rest of U.S.
The Puerto Rican mortgage market is estimated to contain approximately 425,000 active mortgages carrying principal balances of $40B
The heaviest concentration of mortgaged properties lie in the northeastern region of the island. Areas highlighted above contain approximately half of all mortgages properties.
*Based on sample of more than 300,000 active Puerto Rican mortgages encompassing over 70 percent of the active Puerto Rican mortgage market.
ARM ORIGINATIONS & INTEREST RATE RESET RISK
NOVEMBER 2017MONITORMORTGAGE
Confidential, Proprietary and/or Trade SecretTM SM ® Trademark(s) of Black Knight IP Holding Company, LLC, and/or an affiliate.
© 2018 Black Knight Financial Technology Solutions, LLC. All Rights Reserved.
APPENDIX
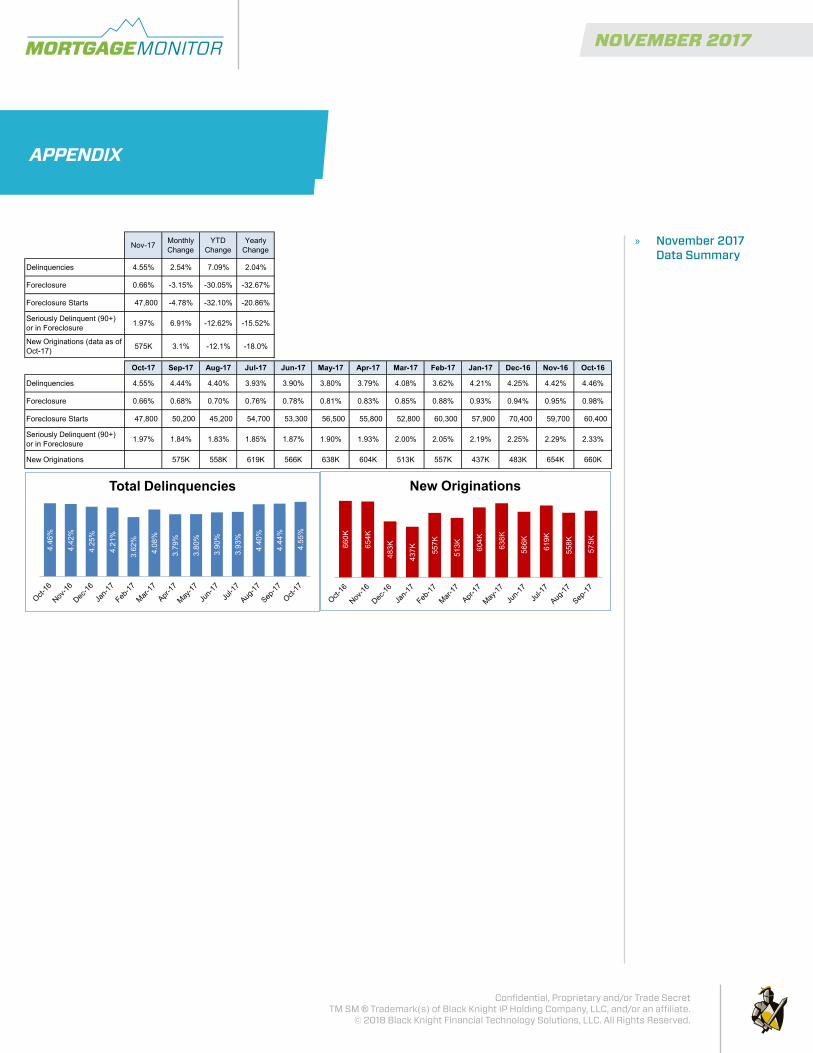
» November 2017 Data Summary
Nov-17 Monthly Change
YTD Change
Yearly Change
Delinquencies 4.55% 2.54% 7.09% 2.04%
Foreclosure 0.66% -3.15% -30.05% -32.67%
Foreclosure Starts 47,800 -4.78% -32.10% -20.86%
Seriously Delinquent (90+) or in Foreclosure 1.97% 6.91% -12.62% -15.52%
New Originations (data as of Oct-17) 575K 3.1% -12.1% -18.0%
Oct-17 Sep-17 Aug-17 Jul-17 Jun-17 May-17 Apr-17 Mar-17 Feb-17 Jan-17 Dec-16 Nov-16 Oct-16
Delinquencies 4.55% 4.44% 4.40% 3.93% 3.90% 3.80% 3.79% 4.08% 3.62% 4.21% 4.25% 4.42% 4.46%
Foreclosure 0.66% 0.68% 0.70% 0.76% 0.78% 0.81% 0.83% 0.85% 0.88% 0.93% 0.94% 0.95% 0.98%
Foreclosure Starts 47,800 50,200 45,200 54,700 53,300 56,500 55,800 52,800 60,300 57,900 70,400 59,700 60,400
Seriously Delinquent (90+) or in Foreclosure 1.97% 1.84% 1.83% 1.85% 1.87% 1.90% 1.93% 2.00% 2.05% 2.19% 2.25% 2.29% 2.33%
New Originations 575K 558K 619K 566K 638K 604K 513K 557K 437K 483K 654K 660K
4.46
%
4.42
%
4.25
%
4.21
%
3.62
%
4.08
%
3.79
%
3.80
%
3.90
%
3.93
%
4.40
%
4.44
%
4.55
%
Total Delinquencies
660K
654K
483K
437K
557K
513K
604K
638K
566K
619K
558K
575K
New Originations
© 2016 - Black Knight Financial Services, Inc.: Unauthorized use is strictly prohibited. Based on data believed to be reliable, not guaranteed as to accuracy or completeness.
NOVEMBER 2017MONITORMORTGAGE
Confidential, Proprietary and/or Trade SecretTM SM ® Trademark(s) of Black Knight IP Holding Company, LLC, and/or an affiliate.
© 2018 Black Knight Financial Technology Solutions, LLC. All Rights Reserved.
APPENDIX
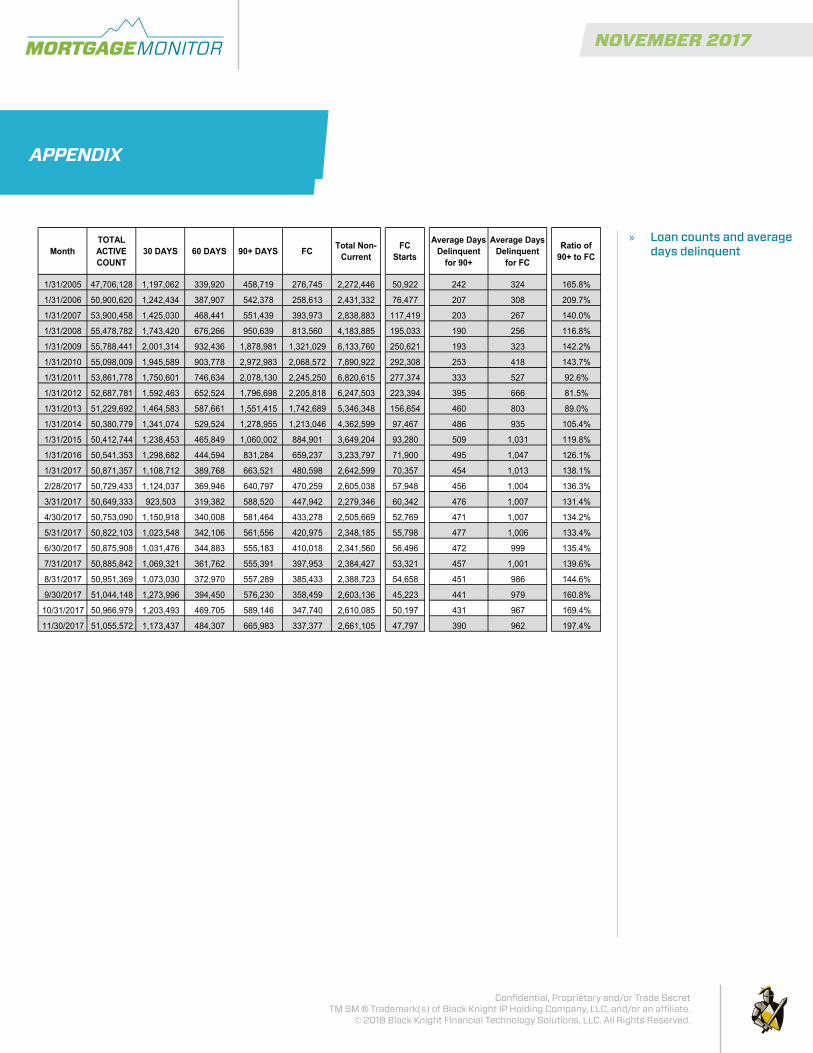
» Loan counts and average days delinquentMonth
TOTAL ACTIVE COUNT
30 DAYS 60 DAYS 90+ DAYS FC Total Non-Current
FC Starts
Average Days Delinquent
for 90+
Average Days Delinquent
for FC
Ratio of 90+ to FC
1/31/2005 47,706,128 1,197,062 339,920 458,719 276,745 2,272,446 50,922 242 324 165.8%
1/31/2006 50,900,620 1,242,434 387,907 542,378 258,613 2,431,332 76,477 207 308 209.7%
1/31/2007 53,900,458 1,425,030 468,441 551,439 393,973 2,838,883 117,419 203 267 140.0%
1/31/2008 55,478,782 1,743,420 676,266 950,639 813,560 4,183,885 195,033 190 256 116.8%
1/31/2009 55,788,441 2,001,314 932,436 1,878,981 1,321,029 6,133,760 250,621 193 323 142.2%
1/31/2010 55,098,009 1,945,589 903,778 2,972,983 2,068,572 7,890,922 292,308 253 418 143.7%
1/31/2011 53,861,778 1,750,601 746,634 2,078,130 2,245,250 6,820,615 277,374 333 527 92.6%
1/31/2012 52,687,781 1,592,463 652,524 1,796,698 2,205,818 6,247,503 223,394 395 666 81.5%
1/31/2013 51,229,692 1,464,583 587,661 1,551,415 1,742,689 5,346,348 156,654 460 803 89.0%
1/31/2014 50,380,779 1,341,074 529,524 1,278,955 1,213,046 4,362,599 97,467 486 935 105.4%
1/31/2015 50,412,744 1,238,453 465,849 1,060,002 884,901 3,649,204 93,280 509 1,031 119.8%
1/31/2016 50,541,353 1,298,682 444,594 831,284 659,237 3,233,797 71,900 495 1,047 126.1%
1/31/2017 50,871,357 1,108,712 389,768 663,521 480,598 2,642,599 70,357 454 1,013 138.1%
2/28/2017 50,729,433 1,124,037 369,946 640,797 470,259 2,605,038 57,948 456 1,004 136.3%
3/31/2017 50,649,333 923,503 319,382 588,520 447,942 2,279,346 60,342 476 1,007 131.4%
4/30/2017 50,753,090 1,150,918 340,008 581,464 433,278 2,505,669 52,769 471 1,007 134.2%
5/31/2017 50,822,103 1,023,548 342,106 561,556 420,975 2,348,185 55,798 477 1,006 133.4%
6/30/2017 50,875,908 1,031,476 344,883 555,183 410,018 2,341,560 56,496 472 999 135.4%
7/31/2017 50,885,842 1,069,321 361,762 555,391 397,953 2,384,427 53,321 457 1,001 139.6%
8/31/2017 50,951,369 1,073,030 372,970 557,289 385,433 2,388,723 54,658 451 986 144.6%
9/30/2017 51,044,148 1,273,996 394,450 576,230 358,459 2,603,136 45,223 441 979 160.8%
10/31/2017 50,966,979 1,203,493 469,705 589,146 347,740 2,610,085 50,197 431 967 169.4%
11/30/2017 51,055,572 1,173,437 484,307 665,983 337,377 2,661,105 47,797 390 962 197.4%
© 2017 - Black Knight Financial Services, Inc.: Unauthorized use is strictly prohibited. Based on data believed to be reliable, not guaranteed as to accuracy or completeness.Page 1 of 1
NOVEMBER 2017MONITORMORTGAGE
Confidential, Proprietary and/or Trade SecretTM SM ® Trademark(s) of Black Knight IP Holding Company, LLC, and/or an affiliate.
© 2018 Black Knight Financial Technology Solutions, LLC. All Rights Reserved.
APPENDIX
State Del % FC % Non-Curr %
Yr/Yr Change in
NC%State Del % FC % Non-
Curr %
Yr/Yr Change in
NC%State Del % FC % Non-
Curr %
Yr/Yr Change in
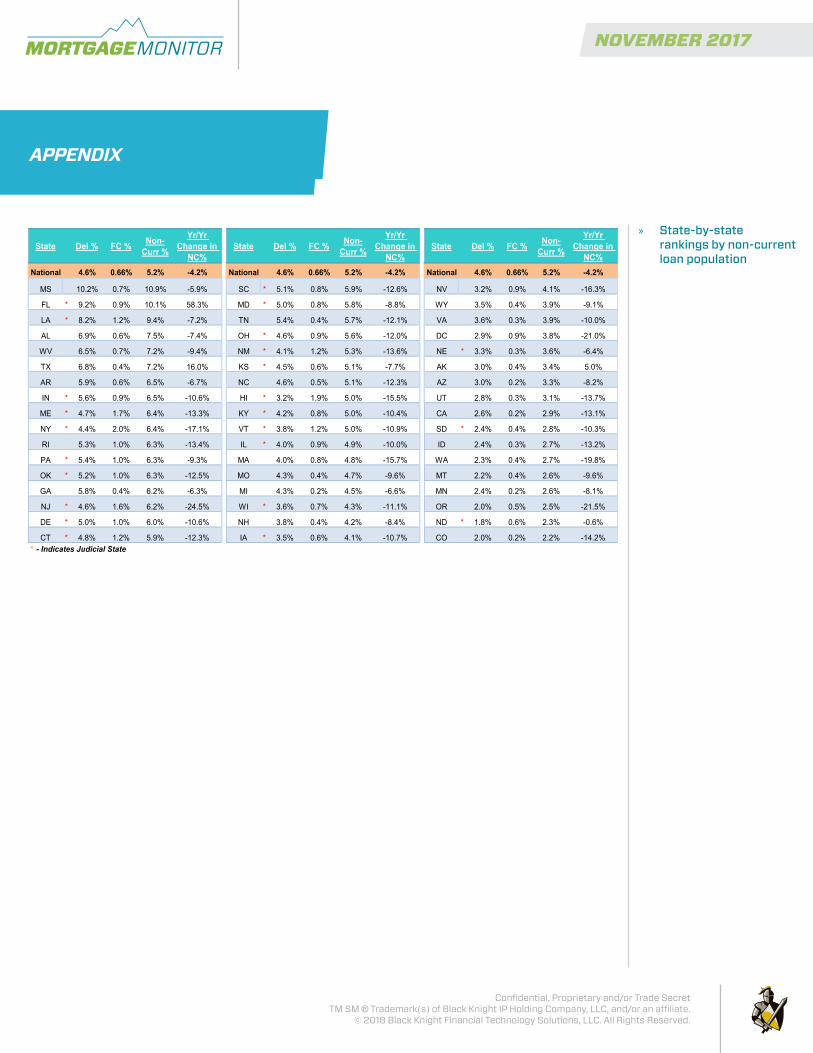
NC%National 4.6% 0.66% 5.2% -4.2% National 4.6% 0.66% 5.2% -4.2% National 4.6% 0.66% 5.2% -4.2%
MS 10.2% 0.7% 10.9% -5.9% SC * 5.1% 0.8% 5.9% -12.6% NV 3.2% 0.9% 4.1% -16.3%
FL * 9.2% 0.9% 10.1% 58.3% MD * 5.0% 0.8% 5.8% -8.8% WY 3.5% 0.4% 3.9% -9.1%
LA * 8.2% 1.2% 9.4% -7.2% TN 5.4% 0.4% 5.7% -12.1% VA 3.6% 0.3% 3.9% -10.0%
AL 6.9% 0.6% 7.5% -7.4% OH * 4.6% 0.9% 5.6% -12.0% DC 2.9% 0.9% 3.8% -21.0%
WV 6.5% 0.7% 7.2% -9.4% NM * 4.1% 1.2% 5.3% -13.6% NE * 3.3% 0.3% 3.6% -6.4%
TX 6.8% 0.4% 7.2% 16.0% KS * 4.5% 0.6% 5.1% -7.7% AK 3.0% 0.4% 3.4% 5.0%
AR 5.9% 0.6% 6.5% -6.7% NC 4.6% 0.5% 5.1% -12.3% AZ 3.0% 0.2% 3.3% -8.2%
IN * 5.6% 0.9% 6.5% -10.6% HI * 3.2% 1.9% 5.0% -15.5% UT 2.8% 0.3% 3.1% -13.7%
ME * 4.7% 1.7% 6.4% -13.3% KY * 4.2% 0.8% 5.0% -10.4% CA 2.6% 0.2% 2.9% -13.1%
NY * 4.4% 2.0% 6.4% -17.1% VT * 3.8% 1.2% 5.0% -10.9% SD * 2.4% 0.4% 2.8% -10.3%
RI 5.3% 1.0% 6.3% -13.4% IL * 4.0% 0.9% 4.9% -10.0% ID 2.4% 0.3% 2.7% -13.2%
PA * 5.4% 1.0% 6.3% -9.3% MA 4.0% 0.8% 4.8% -15.7% WA 2.3% 0.4% 2.7% -19.8%
OK * 5.2% 1.0% 6.3% -12.5% MO 4.3% 0.4% 4.7% -9.6% MT 2.2% 0.4% 2.6% -9.6%
GA 5.8% 0.4% 6.2% -6.3% MI 4.3% 0.2% 4.5% -6.6% MN 2.4% 0.2% 2.6% -8.1%
NJ * 4.6% 1.6% 6.2% -24.5% WI * 3.6% 0.7% 4.3% -11.1% OR 2.0% 0.5% 2.5% -21.5%
DE * 5.0% 1.0% 6.0% -10.6% NH 3.8% 0.4% 4.2% -8.4% ND * 1.8% 0.6% 2.3% -0.6%
CT * 4.8% 1.2% 5.9% -12.3% IA * 3.5% 0.6% 4.1% -10.7% CO 2.0% 0.2% 2.2% -14.2%* - Indicates Judicial State
© 2017 - Black Knight Financial Services, Inc.: Unauthorized use is strictly prohibited. Based on data believed to be reliable, not guaranteed as to accuracy or completeness.
» State-by-state rankings by non-current loan population
NOVEMBER 2017MONITORMORTGAGE
Confidential, Proprietary and/or Trade SecretTM SM ® Trademark(s) of Black Knight IP Holding Company, LLC, and/or an affiliate.
© 2018 Black Knight Financial Technology Solutions, LLC. All Rights Reserved.
DISCLOSURESPlease refer to the links below for specific disclosures relating to Product Definitions, Metrics Definitions and Extrapolation Methodology.
>> PRODUCT DEFINITIONS>> METRICS DEFINITIONS>> EXTRAPOLATION METHODOLOGY