mortgagemonitor - bkfs.com · performance statistics reported in the company’s most recent first...
TRANSCRIPT

JANUARY 2018 REPORT
MONITORMORTGAGE

JANUARY 2018MONITORMORTGAGE
Confidential, Proprietary and/or Trade SecretTM SM ® Trademark(s) of Black Knight IP Holding Company, LLC, and/or an affiliate.
© 2018 Black Knight Financial Technology Solutions, LLC. All Rights Reserved.
CONTENTS
1 | JANUARY FIRST LOOK RELEASE
2 | EARLY-2018 RATE INCREASE IMPACTS
3 | HOME PRICE & AFFORDABILITY UPDATE
4 | 2017 ORIGINATIONS
5 | APPENDIX
6 | DISCLOSURES

JANUARY 2018MONITORMORTGAGE
Confidential, Proprietary and/or Trade SecretTM SM ® Trademark(s) of Black Knight IP Holding Company, LLC, and/or an affiliate.
© 2018 Black Knight Financial Technology Solutions, LLC. All Rights Reserved.
JANUARY 2018 OVERVIEW
Each month, the Black Knight Mortgage Monitor looks at a variety of issues related to the mortgage and financial services industry.
This month, as always, we begin with a review of some of the high-level mortgage performance statistics reported in the company’s most recent First Look report, with an update on delinquency, foreclosure and prepayment trends. In addition, we take a look at the latest data related to the lingering impact on mortgage performance from the 2017 hurricane season.
Next, we examine the effect a 43 BPS rise in the 30-year fixed interest rate over just the first six weeks of 2018 is having on the mortgage market. In particular, we see how the increase has changed the size and make-up of the population of remaining refinance candidates.
Then, using a final look at 2017 home price appreciation metrics as our starting point, we provide an update on home affordability. Specifically, we examine how rising home prices coupled with interest rate increases have affected the national affordability landscape. Finally, we review 2017 mortgage originations volumes and make-up and see how they compare to historical levels.
In producing the Mortgage Monitor, the Data & Analytics division of Black Knight aggregates, analyzes and reports upon the most recently available mortgage performance data from the company’s McDash loan-level database. For more information on McDash or Black Knight Data & Analytics in general, please call 844-474-2537 or email [email protected].
Stay connected with Black Knight Data & Analytics

JANUARY 2018MONITORMORTGAGE
Confidential, Proprietary and/or Trade SecretTM SM ® Trademark(s) of Black Knight IP Holding Company, LLC, and/or an affiliate.
© 2018 Black Knight Financial Technology Solutions, LLC. All Rights Reserved.
JANUARY FIRST LOOK RELEASE
Here we have an overview of findings from Black Knight’s ‘First Look’ at January mortgage performance data. We also revisit the lingering effects on mortgage performance from the 2017 hurricane season. This information has been compiled from Black Knight’s McDash loan-level mortgage performance database. You may click on each chart to see its contents in high-resolution.
» Though January declines in delinquencies are seasonally typical, this month's 8.57 percent drop was the largest decline to start any year since the turn of the century
» Declines in hurricane-related and calendar-driven delinquencies (recovery from December’s Sunday month-end), plus seasonal effects drove the improvement
» Every state other than Alaska saw delinquencies decline, and 48 states saw them fall by at least 5.0 percent
» Serious delinquencies (90+ days past due) fell in 44 states, but improvement in Florida and Texas accounted for nearly half of the total national decline
» Loans in active foreclosure prior to the hurricanes – but put on hold after – are shifting back to that status as foreclosure moratoria become set to expire
» As a result, foreclosure starts spiked in January, jumping 40 percent from December's post-recession low to hit a 12-month high
» 62 percent of January's starts were repeat foreclosures, the second highest share ever recorded
» This year’s increase was larger than the otherwise commonly-seen increases in January (which typically follow holiday moratoriums)
» The rise in starts outpaced an increase in foreclosure sales, resulting in active foreclosure inventory increasing by 6,000, only the second monthly rise in more than five years
Jan-18Month-over-
month changeYear-over-year
change
4.31% -8.57% 1.31%
0.66% 1.84% -30.35%
62,300 40.00% -11.51%
0.79% -14.73% -16.80%
1.74% 42.25% -21.75%
2,202,000 -210,000 40,000
707,000 -19,000 43,000
337,000 6,000 -144,000
2,539,000 -204,000 -104,000
Number of properties that are 30 or more days past due, but not in foreclosure:
Number of properties that are 90 or more days past due, but not in foreclosure:
Number of properties in foreclosure pre-sale inventory:
Number of properties that are 30 or more days past due or in foreclosure:
Total U.S. foreclosure starts:
Monthly Prepayment Rate (SMM):
Foreclosure Sales as % of 90+:
Total U.S. foreclosure pre-sale inventory rate:
12 Month Trend
Total U.S. loan delinquency rate (loans 30 or more days past due, but not in foreclosure):
© 2018 - Black Knight Financial Services, Inc.: Unauthorized use is strictly prohibited. Based on data believed to be reliable, not guaranteed as to accuracy or completeness. Page 1 of 1

JANUARY 2018MONITORMORTGAGE
Confidential, Proprietary and/or Trade SecretTM SM ® Trademark(s) of Black Knight IP Holding Company, LLC, and/or an affiliate.
© 2018 Black Knight Financial Technology Solutions, LLC. All Rights Reserved.
JANUARY FIRST LOOK RELEASE
» Puerto Rico's non-current rate (loans 30+ days past due or in active foreclosure) fell to 26.8 percent from over 34 percent in December
» That represented a decline of 31,600 past due mortgages, the vast majority of which (27,300) were hurricane-related delinquencies
» Puerto Rico's non-current rate is now almost identical to that of the areas affected by Hurricane Katrina at a comparable point in time
» This is despite Puerto Rico's noncurrent rate being 4.7 percentage points higher than that of the Katrina region heading into the respective storms
26.8%
26.4%
0%
10%
20%
30%
40%
-6 -5 -4 -3 -2 -1 0 1 2 3 4 5 6 7 8 9 10 11 12 13 14 15 16
Months From Hurricane Occurance
Hurricane Comparison - Non-Current Mortgage RatesPuerto Rico Hurricane Katrina FEMA Counties 2005
JANUARY 2018MONITORMORTGAGE
Confidential, Proprietary and/or Trade SecretTM SM ® Trademark(s) of Black Knight IP Holding Company, LLC, and/or an affiliate.
© 2018 Black Knight Financial Technology Solutions, LLC. All Rights Reserved.
JANUARY FIRST LOOK RELEASE
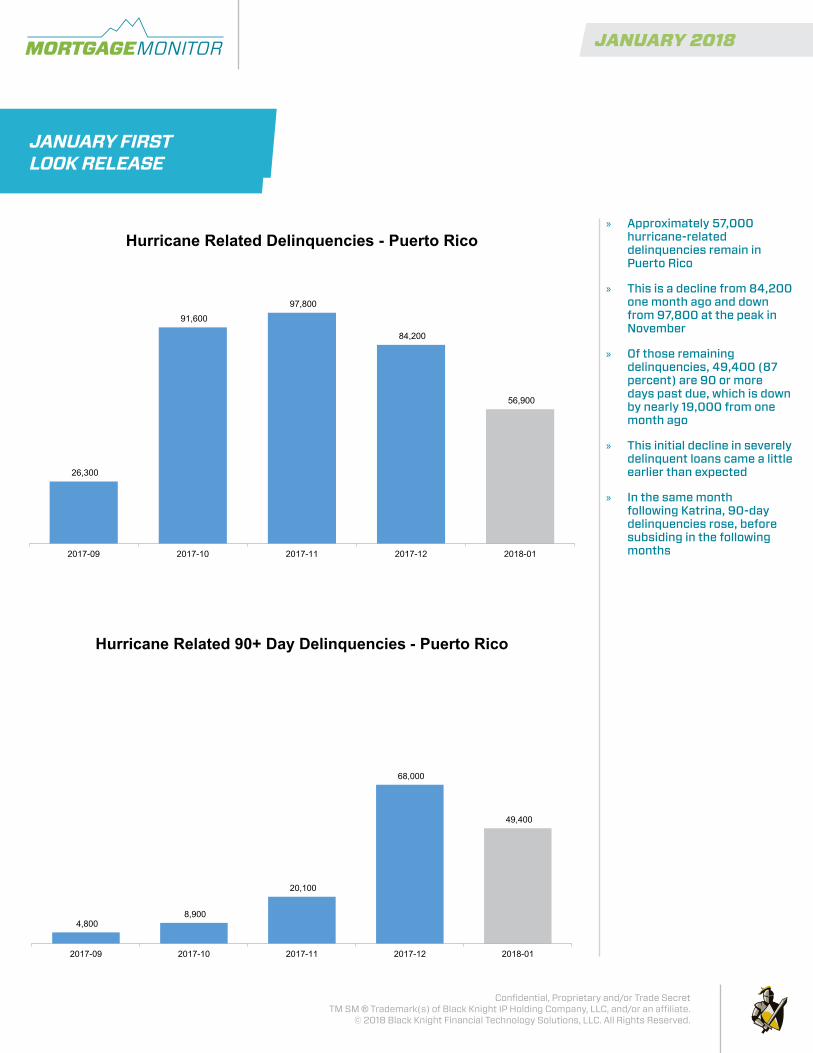
» Approximately 57,000 hurricane-related delinquencies remain in Puerto Rico
» This is a decline from 84,200 one month ago and down from 97,800 at the peak in November
» Of those remaining delinquencies, 49,400 (87 percent) are 90 or more days past due, which is down by nearly 19,000 from one month ago
» This initial decline in severely delinquent loans came a little earlier than expected
» In the same month following Katrina, 90-day delinquencies rose, before subsiding in the following months
26,300
91,600
97,800
84,200
56,900
2017-09 2017-10 2017-11 2017-12 2018-01
Hurricane Related Delinquencies - Puerto Rico
4,800 8,900
20,100
68,000
49,400
2017-09 2017-10 2017-11 2017-12 2018-01
Hurricane Related 90+ Day Delinquencies - Puerto Rico

JANUARY 2018MONITORMORTGAGE
Confidential, Proprietary and/or Trade SecretTM SM ® Trademark(s) of Black Knight IP Holding Company, LLC, and/or an affiliate.
© 2018 Black Knight Financial Technology Solutions, LLC. All Rights Reserved.
JANUARY FIRST LOOK RELEASE
» Overall hurricane-related delinquencies declined 17 percent (>30K loans) from one month ago and have dropped by 83K from the peak of over 225k in October
» Stronger declines were observed in parts of Florida and Georgia impacted by Hurricane Irma than in Harvey-affected areas of Texas
» This is despite delinquencies in these Texas areas peaking a month earlier
» Overall delinquencies dropped by 20% and serious delinquencies (90+ days past due) dropped by 9.0 percent in Irma-affected areas
» Harvey-affected areas saw roughly half those levels of declines; it's too early to be certain, but this may be an early sign of delayed recovery in those areas
13,300
34,900 40,100 38,500
0K
30K
60K
90K
120K
150K
180K
2017-08 2017-09 2017-10 2017-11 2017-12 2018-01
Hurricane Related Delinquencies - TexasSevere Delinquencies (90+ Days) Early Stage DQs (<90 Days)
11,00019,700
64,900
102,50093,600
0K
20K
40K
60K
80K
100K
120K
140K
160K
180K
2017-08 2017-09 2017-10 2017-11 2017-12 2018-01
Hurricane Related Delinquencies - Florida & GeorgiaSevere Delinquencies (90+ Days) Early Stage DQs (<90 Days)

JANUARY 2018MONITORMORTGAGE
Confidential, Proprietary and/or Trade SecretTM SM ® Trademark(s) of Black Knight IP Holding Company, LLC, and/or an affiliate.
© 2018 Black Knight Financial Technology Solutions, LLC. All Rights Reserved.
JANUARY FIRST LOOK RELEASE
» A slightly larger share of borrowers in Harvey’s storm path remain 90+ days delinquent (3.2 percent) as compared to Irma (2.9 percent)
» Still, Irma areas have nearly 2.5X the number of delinquencies (both early stage and serious) as Harvey-affected areas and nearly 2x that seen in Puerto Rico
» Puerto Rico has seen the largest per capita impact; over 11 percent of borrowers are seriously delinquent due to Maria (and Irma)
» 132K loans remain seriously delinquent in the mainland U.S. as a result of hurricanes Harvey and Irma
» Another 49K Puerto Rican mortgages remain 90+ days past due, for a total of over 181K+ serious delinquencies remaining from the 2017 hurricane season
» Roughly half of remaining hurricane-related serious delinquencies are in Florida alone
3.2%2.9%
11.6%
Harvey(Texas)
Irma(Florida/Georgia)
Maria(Puerto Rico)
Share of Borrowers 90+ DQ As Result of Hurricane
38,500
93,600
49,400
Harvey(Texas)
Irma(Florida/Georgia)
Maria(Puerto Rico)
90+ DQs Attributed to Each Hurricane as of Jan 2018

JANUARY 2018MONITORMORTGAGE
Confidential, Proprietary and/or Trade SecretTM SM ® Trademark(s) of Black Knight IP Holding Company, LLC, and/or an affiliate.
© 2018 Black Knight Financial Technology Solutions, LLC. All Rights Reserved.
» According the the Freddie Mac Primary Mortgage Market Survey®, the average rate on a 30-year fixed mortgage increased by 43BPS from January 4th through February 15th
» The 4.38 percent 30-year fixed rate average seen in mid-February is the highest since April 2014
» Increases have also been observed in the introductory rate for 5/1 ARMs, a trend which began prior to the rise in the 30-year fixed rate
» Though rates on 5/1 ARMs are up 47 BPS since mid-October, the delta between fixed and ARM products has increased to 75BPS, the highest in over two years
» Given this increasing delta and the tightening of affordability from rising interest rates, it would not be surprising to see the ARM share of mortgage lending rise
» Rising interest rates and increasing deltas between fixed and ARM product offerings have historically tended to spur ARM origination activity
2.00%
2.50%
3.00%
3.50%
4.00%
4.50%
5.00%
4/18
/201
3
7/11
/201
3
10/3
/201
3
12/2
6/20
13
3/20
/201
4
6/12
/201
4
9/4/
2014
11/2
6/20
14
2/19
/201
5
5/14
/201
5
8/6/
2015
10/2
9/20
15
1/21
/201
6
4/14
/201
6
7/7/
2016
9/29
/201
6
12/2
2/20
16
3/16
/201
7
6/8/
2017
8/31
/201
7
11/2
2/20
17
2/15
/201
8
Primary Mortgage Market Survey - Freddie Mac30-Year Fixed Rate Mortgage 5/1 Adjustable Rate Mortgage
Source: Freddie Mac Primary Mortgage Market Survey®
Here, we examine the effect recent interest rate spikes have had on the mortgage market. In particular, we see how the 43 BPS increase in rates over just the first six weeks of 2018 has changed the size and make-up of the population of remaining refinance candidates. This information has been compiled from Black Knight’s McDash loan-level mortgage performance database. You may click on each chart to see its contents in high-resolution.
EARLY-2018 RATE INCREASE IMPACTS

JANUARY 2018MONITORMORTGAGE
Confidential, Proprietary and/or Trade SecretTM SM ® Trademark(s) of Black Knight IP Holding Company, LLC, and/or an affiliate.
© 2018 Black Knight Financial Technology Solutions, LLC. All Rights Reserved.
» Closing out a very steady second half of the year, the population of refinance candidates varied by less than 3.0 percent (<120K) over the final 12 weeks of 2017
» However, the recent spike in interest rates cut the population of borrowers with an interest rate incentive to refinance by nearly 40 percent in 40 days
» Approximately 1.4 million borrowers lost the interest rate incentive to refinance in just the first six weeks of 2018
» 2.65 million potential candidates could still both benefit from and likely qualify for a refinance at today’s rates
» That is the smallest this population has been since late 2008, prior to the initial decline in rates during the recession
» Though the population is only 10 percent off its February 2017 mark, rate/term refinance production could see a more significant impact than this might suggest due to increasing burnout in the market
» A corresponding drop in the average credit score of refinance originations is typically observed when rates rise
M
1M
2M
3M
4M
5M
6M
7M
8M
9M
10M
2008
-02
2009
-02
2010
-02
2011
-02
2012
-02
2013
-02
2014
-02
2015
-02
2016
-02
2017
-02
2018
-02
Refinance Candidates - 10 Year History
M
1M
2M
3M
4M
5M
6M
8/17
/201
7
8/31
/201
7
9/14
/201
7
9/28
/201
7
10/1
2/20
17
10/2
6/20
17
11/9
/201
7
11/2
2/20
17
12/7
/201
7
12/2
1/20
17
1/4/
2018
1/18
/201
8
2/1/
2018
2/15
/201
8
Refinance Candidates6-Month History by Week
EARLY-2018 RATE INCREASE IMPACTS

JANUARY 2018MONITORMORTGAGE
Confidential, Proprietary and/or Trade SecretTM SM ® Trademark(s) of Black Knight IP Holding Company, LLC, and/or an affiliate.
© 2018 Black Knight Financial Technology Solutions, LLC. All Rights Reserved.
» Virtually all of the decline in potential refinance candidates was among 2009 and later vintages
» Fewer than 100K traditional refinance candidates (720+ credit score, <80 percent loan-to-value (LTV) ratio) remain in 2012 and later vintages
» 2009–2011 and 2013-2014 vintages are likely to see dampened prepayment rates after seeing the heaviest declines in candidates over the past two months
» Surprisingly, despite recent interest rate rises, the number of candidates in older vintages has remained steady, even increasing in some cases
» Custom loan terms or term reduction refinances will likely continue to be popular products among remaining candidates in seasoned mortgages
» While cash-outs will likely continue to dominate the shrinking refinance market, the market share for borrowers looking to remove mortgage insurance has room for growth
» Looking at borrowers with rate incentive but who fall outside broad-based eligibility criteria, it becomes apparent that easing credit score requirements would drive a larger increase in the population than easing LTV requirements
EARLY-2018 RATE INCREASE IMPACTS
-
100,000
200,000
300,000
400,000
500,000
600,000
700,000
800,000
900,000
Pre 2004 2004 2005 2006 2007 2008 2009 2010 2011 2012 2013 2014 2015 2016
Distribution of Refinance Candidates by VintageDecember 2017 February 2018

JANUARY 2018MONITORMORTGAGE
Confidential, Proprietary and/or Trade SecretTM SM ® Trademark(s) of Black Knight IP Holding Company, LLC, and/or an affiliate.
© 2018 Black Knight Financial Technology Solutions, LLC. All Rights Reserved.
» 2017 saw calendar-year growth of 6.6 percent, up from 5.7 percent in 2016, a 90 BPS acceleration in the annual rate of appreciation in the past 12 months
» The annual rate of appreciation jumped by nearly 20BPS in December alone
» 2017's 6.6 percent growth rate was the highest of any year since 2013, and well above the 25 year average of 3.8 percent
» The annual rate of home price appreciation declined for 16 consecutive months in late 2013 through 2014; it has now accelerated in 30 of the past 36 months, including each of the last five months of 2017
» The median home in the US increased in value by $17,570 in 2017 (the largest rise by dollar amount since 2006), hitting a new all-time high ($283k to end the year)
» The median home value is now 5.8 percent ($15,400) higher than at the peak of the market in 2006
» $17,570 marks the third highest rise by dollar amount for the median home price since Black Knight began collecting the data in 1991, behind only 2005 and 2006
2.3% 3.0%
2.8%
2.8%
2.7% 3.
5%
6.0% 7.
2% 8.7%
6.5% 8.
6%
8.8%
12.6
%
11.6
%
1.5%
-4.7
%
-10.
0%
-4.3
%
-4.7
% -3.1
%
5.4%
8.3%
4.5% 5.
4% 5.7% 6.
6%
$264K $283K
$0
$50,000
$100,000
$150,000
$200,000
$250,000
$300,000
1992
1993
1994
1995
1996
1997
1998
1999
2000
2001
2002
2003
2004
2005
2006
2007
2008
2009
2010
2011
2012
2013
2014
2015
2016
2017
-15%
-10%
-5%
0%
5%
10%
15%
20%
25%
30%
Black Knight Home Price IndexHome Price Appreciation By Calendar Year (right axis) Median Home Price (left axis)
HOME PRICE & AFFORDABILITY UPDATE
Here, using 2017 year-end home price appreciation metrics as our starting point, we provide an update on home affordability. Specifically, we examine how rising home prices coupled with interest rate increases have affected the national affordability landscape. This information has been compiled from the Black Knight Home Price Index and the company’s McDash loan-level mortgage performance database. You may click on each chart to see its contents in high-resolution.

JANUARY 2018MONITORMORTGAGE
Confidential, Proprietary and/or Trade SecretTM SM ® Trademark(s) of Black Knight IP Holding Company, LLC, and/or an affiliate.
© 2018 Black Knight Financial Technology Solutions, LLC. All Rights Reserved.
» Recent rate jumps coupled with climbing home prices have increased the cost to purchase the median home by $67/month (+6 percent) over the past six weeks
» Overall, it costs $1,141 in monthly principal and interest to purchase the median home using a 30-year fixed mortgage with 20 percent down, the largest monthly payment required since late 2008
» It currently takes 23 percent of the median income to purchase the median home, the highest share since 2009
» However, overall affordability remains better than long-term historical averages, even taking the recent rate jump into consideration
» Purchasing the median home requires one percent less of the median income than 1995-1999, three percent less than 2000-2003 (before the sharp run-up in home prices) and two percent below those combined benchmarks (1995-2003)
» Average incomes are more than 20 percent higher today than in 2006 (according to the Census Bureau) and interest rates 2.3 percent lower
» As such, affordability remains much better than at the pre-recession peak, even though today’s home prices have surpassed 2006 levels
» Assuming all else remains equal, to return to 2006 affordability levels, interest rates would have to climb north of 8.0 percent or the median home price increase to $420K
34%
17%
23%
8.52%
4.38%
$199K
$283K
2.00%
9.00%
0%
5%
10%
15%
20%
25%
30%
35%
40%
Paym
ent t
o In
com
e R
atio
National Payment to Income Ratio*Payment to Income Ratio Freddie 30-Year Fixed Rate (not on axis) National Median Price (not on axis)
*The National Payment to Income Ratio is the % of the median household income needed to purchase the median home using an 80% LTV 30-year fixed rate mortgage at the FHLMC 30-year rate.
HOME PRICE & AFFORDABILITY UPDATE

JANUARY 2018MONITORMORTGAGE
Confidential, Proprietary and/or Trade SecretTM SM ® Trademark(s) of Black Knight IP Holding Company, LLC, and/or an affiliate.
© 2018 Black Knight Financial Technology Solutions, LLC. All Rights Reserved.
» Rising interest rates may put more pressure on borrowers with below average incomes buying below average priced homes
» Affordability is lower in those segments compared to long-term benchmarks, and rising interest rates put more strain on affordability
» The annual rate of appreciation on Tier 1 properties (lowest 20 percent by price) is 1.9 percent higher than the overall market average
» Although the margin has declined in recent months, as of December 2017, the Tier 1 annual rate of appreciation was 75 percent higher than that of Tier 5 (a difference of 3.6 percent)
» Tier 1 home prices have now been the fastest-appreciating quintile nationally for 67 consecutive months
» The same trend holds true in 45 of 50 states and 90 of the nation’s largest 100 metro areas
» Larger overall increases in value among lower-priced homes is not just a recent trend, though; the same dynamic is observed when looking back over the past 15 years
-15%
-10%
-5%
0%
5%
10%
15%
20%
1998
-12
1999
-12
2000
-12
2001
-12
2002
-12
2003
-12
2004
-12
2005
-12
2006
-12
2007
-12
2008
-12
2009
-12
2010
-12
2011
-12
2012
-12
2013
-12
2014
-12
2015
-12
2016
-12
2017
-12
Annual Rate of Home Price Appreciation by Price TierTier 1 (1st Quintile) Tier 2 All Properties Tier 4 Tier 5 (5th Quintile)
0%
10%
20%
30%
40%
50%
60%
70%
1 Year 5 Year 10 Year 15 Year
Home Price Appreciation by Price Tier (Quintile)Tier 1 (1st Quintile) Tier 2 All Properties Tier 4 Tier 5 (5th Quintile)
HOME PRICE & AFFORDABILITY UPDATE

JANUARY 2018MONITORMORTGAGE
Confidential, Proprietary and/or Trade SecretTM SM ® Trademark(s) of Black Knight IP Holding Company, LLC, and/or an affiliate.
© 2018 Black Knight Financial Technology Solutions, LLC. All Rights Reserved.
» While the nearly 50 percent increase in the median home price over the past 15 years has significantly outpaced the approximately 40 percent growth in the median income, lower interest rates today have more than offset that difference
» However, according to Census Bureau data, income growth in the lower quintiles has not kept up with the higher ends of the market
» As shown in this simple analysis matching income level to price tier, the lower the quintile, the closer affordability is to long term norms
» For those in the first quintile of incomes, buying in the first quintile of home prices would require 3.2 percent more of available income today than historic norms
» Given the disproportionate appreciation of low priced homes as compared to income growth, affordability at the lower end of the market remains a challenge
» Recent affordability reductions from higher rates could put more pressure on lower income buyers by increasing competition for lower priced homes, as borrowers’ overall buying power is diminished
0%
10%
20%
30%
40%
50%
1 Year 5 Year 10 Year 15 Year
Median Household Income Growth by Quintile1st Quintile 2nd Quintile 3rd Quintile 4th Quintile 5th Quintile
Source: Census Bureau
+3.2%
-1.7%-1.9%
-2.7%
-3.5%
1st Quintile 2nd Quintile Median 4th Quintile 5th Quintile
Payment to Income Ratios Today vs. 1995-2003 Avg
HOME PRICE & AFFORDABILITY UPDATE

JANUARY 2018MONITORMORTGAGE
Confidential, Proprietary and/or Trade SecretTM SM ® Trademark(s) of Black Knight IP Holding Company, LLC, and/or an affiliate.
© 2018 Black Knight Financial Technology Solutions, LLC. All Rights Reserved.
» Purchase originations saw a 7.4 percent increase in Q4 2017 from one year prior and overall growth of 8.3 percent for the year
» Despite the highest level of purchase lending since 2006, total origination volumes for 2017 fell 12 percent from 2016 due to declining refinance origination volumes
» Refinance lending declined significantly in 2017, falling 29 percent by number of loans and total volume down by $355 billion, a 34 percent year-over-year decline
» Refinance volumes did rebound slightly in both Q3 and Q4 after hitting a three-year low in Q2 2017
» This marks the lowest annual volume of refinance originations since 2014 and the second lowest annual total in 17 years
» Should interest rates remain steady, or continue to rise, a further decline in 2018 refinance originations is likely
» $1.19T in purchase loans and $681B in refinance loans were originated in 2017 for a total of $1.87T in total first lien originations
» Despite growth in each of the past six years and 25 of the past 26 quarters, purchase lending is still 22 percent below 2005 peaks
» Over 40 percent fewer purchase loans were originated in 2017 than in 2005
$.0
$.5
$1.0
$1.5
$2.0
$2.5
$3.0
$3.5
$4.0
2000 2001 2002 2003 2004 2005 2006 2007 2008 2009 2010 2011 2012 2013 2014 2015 2016 2017
First-Lien Mortgage Originations in $TrillionsPurchase Originations Refinance Originations
-5%
5%
15%
25%
35%
Annual Growth Rate of Purchase Lending
With full year-end data now in, here we review 2017 mortgage originations volumes and make-up and compare these to historical levels. This information has been compiled from Black Knight’s McDash loan-level mortgage performance database. You may click on each chart to see its contents in high-resolution.
2017 ORIGINATIONS

JANUARY 2018MONITORMORTGAGE
Confidential, Proprietary and/or Trade SecretTM SM ® Trademark(s) of Black Knight IP Holding Company, LLC, and/or an affiliate.
© 2018 Black Knight Financial Technology Solutions, LLC. All Rights Reserved.
» Refinances accounted for 36 percent of total origination volume in 2017, the lowest share in 17 years
» Q2 marked the calendar year low, as the refinance share fell to fewer than 30 percent of originations, as well as the lowest single quarter since Q4 2000
» Declines in refinance originations were more pronounced in higher credit score buckets, which is the source of the bulk of existing refinance volume
» Refinance originations to borrowers with 780+ credit scores declined by 40 percent, while those at the lowest end (<660) were down by only 8.0 percent
» In addition, 2017 saw a six point overall reduction in the average refinance credit score (737 in 2017 vs. 743 in 2016)
» Lower average credit scores among refinance loans along with an above-average share of purchase originations will likely have a dampening effect on 2017 vintage mortgage performance as compared to other post crisis-vintages
21%
68%
65%
40%
49%
36%
0%
10%
20%
30%
40%
50%
60%
70%
80%
2000
2001
2002
2003
2004
2005
2006
2007
2008
2009
2010
2011
2012
2013
2014
2015
2016
2017
Refinance Share of First-Lien Lending
-8%
-16%
-23%
-34%
-40%
-34%
620-659 660-699 700-740 740-779 780+ Overall
Annual Decline in Refinance LendingBy Credit Score Bucket
Figures above are a comparison of total dollars lent via first lien refinance transactions in 2017 vs 2016
2017 ORIGINATIONS

JANUARY 2018MONITORMORTGAGE
Confidential, Proprietary and/or Trade SecretTM SM ® Trademark(s) of Black Knight IP Holding Company, LLC, and/or an affiliate.
© 2018 Black Knight Financial Technology Solutions, LLC. All Rights Reserved.
APPENDIX
» January 2018 Data SummaryJan-18 Monthly
ChangeYTD
ChangeYearly
Change
Delinquencies 4.31% -8.57% 0.00% 1.31%
Foreclosure 0.66% 1.84% 0.00% -30.35%
Foreclosure Starts 62,300 40.00% 0.00% -11.51%
Seriously Delinquent (90+) or in Foreclosure 2.04% -1.15% 0.00% -9.32%
New Originations (data as of Dec-17) 549K 0.6% 0.0% -16.4%
Jan-18 Dec-17 Nov-17 Oct-17 Sep-17 Aug-17 Jul-17 Jun-17 May-17 Apr-17 Mar-17 Feb-17 Jan-17
Delinquencies 4.31% 4.71% 4.55% 4.44% 4.40% 3.93% 3.90% 3.80% 3.79% 4.08% 3.62% 4.21% 4.25%
Foreclosure 0.66% 0.65% 0.66% 0.68% 0.70% 0.76% 0.78% 0.81% 0.83% 0.85% 0.88% 0.93% 0.94%
Foreclosure Starts 62,300 44,500 47,800 50,200 45,200 54,700 53,300 56,500 55,800 52,800 60,300 57,900 70,400
Seriously Delinquent (90+) or in Foreclosure 2.04% 2.06% 1.97% 1.84% 1.83% 1.85% 1.87% 1.90% 1.93% 2.00% 2.05% 2.19% 2.25%
New Originations 549K 545K 599K 571K 634K 578K 652K 617K 524K 568K 445K 496K
4.25
%
4.21
%
3.62
%
4.08
%
3.79
%
3.80
%
3.90
%
3.93
%
4.40
%
4.44
%
4.55
%
4.71
%
4.31
%
Total Delinquencies
496K
445K 56
8K
524K 61
7K
652K
578K
634K
571K
599K
545K
549K
New Originations
© 2016 - Black Knight Financial Services, Inc.: Unauthorized use is strictly prohibited. Based on data believed to be reliable, not guaranteed as to accuracy or completeness.

JANUARY 2018MONITORMORTGAGE
Confidential, Proprietary and/or Trade SecretTM SM ® Trademark(s) of Black Knight IP Holding Company, LLC, and/or an affiliate.
© 2018 Black Knight Financial Technology Solutions, LLC. All Rights Reserved.
APPENDIX
» Loan counts and average days delinquentMonth
TOTAL ACTIVE COUNT
30 DAYS 60 DAYS 90+ DAYS FC Total Non-Current
FC Starts
Average Days Delinquent
for 90+
Average Days Delinquent
for FC
Ratio of 90+ to FC
1/31/2000 40,192,541 1,176,769 296,820 374,724 234,074 2,082,387 55,426 241 331 160.1%1/31/2001 42,340,690 1,321,334 346,119 438,737 223,602 2,329,792 63,753 211 304 196.2%1/31/2002 43,454,963 1,353,355 380,012 515,985 340,401 2,589,754 90,160 219 289 151.6%1/31/2003 44,275,177 1,331,861 365,393 494,180 344,037 2,535,471 101,211 231 297 143.6%1/31/2004 44,769,847 1,186,809 352,515 501,740 321,294 2,362,357 77,360 269 344 156.2%1/31/2005 47,706,128 1,197,062 339,920 458,719 276,745 2,272,446 50,922 242 324 165.8%1/31/2006 50,900,620 1,242,434 387,907 542,378 258,613 2,431,332 76,477 207 308 209.7%1/31/2007 53,900,458 1,425,030 468,441 551,439 393,973 2,838,883 117,419 203 267 140.0%1/31/2008 55,478,782 1,743,420 676,266 950,639 813,560 4,183,885 195,033 190 256 116.8%1/31/2009 55,788,441 2,001,314 932,436 1,878,981 1,321,029 6,133,760 250,621 193 323 142.2%1/31/2010 55,098,009 1,945,589 903,778 2,972,983 2,068,572 7,890,922 292,308 253 418 143.7%1/31/2011 53,861,778 1,750,601 746,634 2,078,130 2,245,250 6,820,615 277,374 333 527 92.6%1/31/2012 52,687,781 1,592,463 652,524 1,796,698 2,205,818 6,247,503 223,394 395 666 81.5%1/31/2013 51,229,692 1,464,583 587,661 1,551,415 1,742,689 5,346,348 156,654 460 803 89.0%1/31/2014 50,380,779 1,341,074 529,524 1,278,955 1,213,046 4,362,599 97,467 486 935 105.4%1/31/2015 50,412,744 1,238,453 465,849 1,060,002 884,901 3,649,204 93,280 509 1,031 119.8%1/31/2016 50,541,353 1,298,682 444,594 831,284 659,237 3,233,797 71,900 495 1,047 126.1%1/31/2017 50,871,357 1,108,712 389,768 663,521 480,598 2,642,599 70,357 454 1,013 138.1%1/31/2018 51,155,753 1,083,162 412,676 706,623 336,613 2,539,074 62,312 364 932 209.9%
© 2018 - Black Knight Financial Services, Inc.: Unauthorized use is strictly prohibited. Based on data believed to be reliable, not guaranteed as to accuracy or completeness.Page 1 of 1
JANUARY 2018MONITORMORTGAGE
Confidential, Proprietary and/or Trade SecretTM SM ® Trademark(s) of Black Knight IP Holding Company, LLC, and/or an affiliate.
© 2018 Black Knight Financial Technology Solutions, LLC. All Rights Reserved.
APPENDIX
State Del % FC % Non-Curr %
Yr/Yr Change in
NC%State Del % FC % Non-
Curr %
Yr/Yr Change in
NC%State Del % FC % Non-
Curr %
Yr/Yr Change in
NC%
National 4.3% 0.66% 5.0% -4.5% National 4.3% 0.66% 5.0% -4.5% National 4.3% 0.66% 5.0% -4.5%
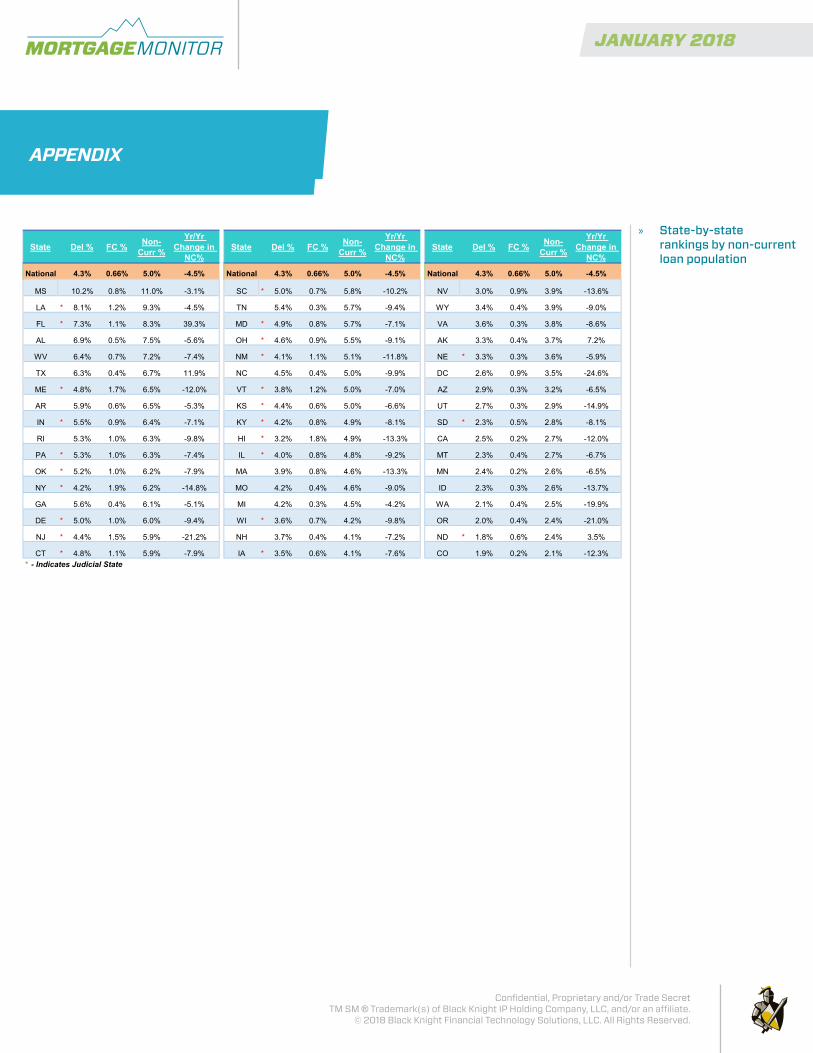
MS 10.2% 0.8% 11.0% -3.1% SC * 5.0% 0.7% 5.8% -10.2% NV 3.0% 0.9% 3.9% -13.6%
LA * 8.1% 1.2% 9.3% -4.5% TN 5.4% 0.3% 5.7% -9.4% WY 3.4% 0.4% 3.9% -9.0%
FL * 7.3% 1.1% 8.3% 39.3% MD * 4.9% 0.8% 5.7% -7.1% VA 3.6% 0.3% 3.8% -8.6%
AL 6.9% 0.5% 7.5% -5.6% OH * 4.6% 0.9% 5.5% -9.1% AK 3.3% 0.4% 3.7% 7.2%
WV 6.4% 0.7% 7.2% -7.4% NM * 4.1% 1.1% 5.1% -11.8% NE * 3.3% 0.3% 3.6% -5.9%
TX 6.3% 0.4% 6.7% 11.9% NC 4.5% 0.4% 5.0% -9.9% DC 2.6% 0.9% 3.5% -24.6%
ME * 4.8% 1.7% 6.5% -12.0% VT * 3.8% 1.2% 5.0% -7.0% AZ 2.9% 0.3% 3.2% -6.5%
AR 5.9% 0.6% 6.5% -5.3% KS * 4.4% 0.6% 5.0% -6.6% UT 2.7% 0.3% 2.9% -14.9%
IN * 5.5% 0.9% 6.4% -7.1% KY * 4.2% 0.8% 4.9% -8.1% SD * 2.3% 0.5% 2.8% -8.1%
RI 5.3% 1.0% 6.3% -9.8% HI * 3.2% 1.8% 4.9% -13.3% CA 2.5% 0.2% 2.7% -12.0%
PA * 5.3% 1.0% 6.3% -7.4% IL * 4.0% 0.8% 4.8% -9.2% MT 2.3% 0.4% 2.7% -6.7%
OK * 5.2% 1.0% 6.2% -7.9% MA 3.9% 0.8% 4.6% -13.3% MN 2.4% 0.2% 2.6% -6.5%
NY * 4.2% 1.9% 6.2% -14.8% MO 4.2% 0.4% 4.6% -9.0% ID 2.3% 0.3% 2.6% -13.7%
GA 5.6% 0.4% 6.1% -5.1% MI 4.2% 0.3% 4.5% -4.2% WA 2.1% 0.4% 2.5% -19.9%
DE * 5.0% 1.0% 6.0% -9.4% WI * 3.6% 0.7% 4.2% -9.8% OR 2.0% 0.4% 2.4% -21.0%
NJ * 4.4% 1.5% 5.9% -21.2% NH 3.7% 0.4% 4.1% -7.2% ND * 1.8% 0.6% 2.4% 3.5%
CT * 4.8% 1.1% 5.9% -7.9% IA * 3.5% 0.6% 4.1% -7.6% CO 1.9% 0.2% 2.1% -12.3%* - Indicates Judicial State
© 2018 - Black Knight Financial Services, Inc.: Unauthorized use is strictly prohibited. Based on data believed to be reliable, not guaranteed as to accuracy or completeness.
» State-by-state rankings by non-current loan population

JANUARY 2018MONITORMORTGAGE
Confidential, Proprietary and/or Trade SecretTM SM ® Trademark(s) of Black Knight IP Holding Company, LLC, and/or an affiliate.
© 2018 Black Knight Financial Technology Solutions, LLC. All Rights Reserved.
DISCLOSURESPlease refer to the links below for specific disclosures relating to Product Definitions, Metrics Definitions and Extrapolation Methodology.
>> PRODUCT DEFINITIONS>> METRICS DEFINITIONS>> EXTRAPOLATION METHODOLOGY