morphology, celldivision, andviabilityof saccharomyces at ... · morphology, celldivision,...
TRANSCRIPT

Morphology, cell division, and viability of Saccharomycescerevisiae at high hydrostatic pressureKhanh Nguyen1, Steven Murray1 Jeffrey A. Lewis2, Pradeep Kumar1*
1Department of Physics, University of Arkansas, Fayetteville, AR 72701 USA2Department of Biological Sciences, University of Arkansas, Fayetteville, AR 72701 USA
High hydrostatic pressure is commonly encountered in many environments, but the effectsof high pressure on eukaryotic cells have been understudied. To understand the effects ofhydrostatic pressure in the model eukaryote, Saccharomyces cerevisiae, we have performedquantitative experiments of cell division, cell morphology, and cell death under a wide rangeof pressures. We developed an automated image analysis method for quantification of theyeast budding index - a measure of cell cycle state - as well as a continuum model of buddingto investigate the effect of pressure on cell division and cell morphology. We find that thebudding index, the average cell size, and the eccentricity - a measure of how much the cellmorphology varies from the being elliptical - of the cells decrease with increasing pressure.Furthermore, high hydrostatic pressure led to the small but finite probability of cell deathvia both apoptosis and necrosis. Our experiments suggest that decrease of budding indexarises from cellular arrest or death at the cell cycle checkpoints during different stages of celldivision.
Introduction
Both prokaryotic and eukaryotic microbes thrive under a staggering array of diverse environmentalconditions 1–6 including high pressure and extremes of temperature. High pressure and tempera-ture present biophysical challenges to cells, thus, cellular growth and survival of organisms livingunder these extreme conditions are likely maintained by subtle adaptations of their biomolecularmachinery, and hence optimizing molecular function for each particular environmental challenge.Extremes of pressure and temperature are known to affect the stability and functionality of pro-teins 7–9. Many proteins are known to denature at a pressure above 200MPa due to decreasinghydrophobicity of proteins with pressure 10, 11. While moderate pressures may not lead to a com-plete denaturation of proteins; they may affect the functionality of proteins 12, 13. Although theeffects of pressure on physicochemical basis is well defined, the effects on the living organismshave been elusive due to complexities of the organisms 14.
Multiples studies on mesophilic organisms have suggested that high pressure can causegrowth inhibition, cellular arrest, as well as cell death 2, 15, 16. Recent studies suggest that elon-gation of Escherichia coli (E. coli) at high pressure results from depolymerization of a key cy-toskeletal proteins FtsZ 17 and MreB 18. Furthermore, these studies also reveal the heterogeneousstochastic nature of cell division at high pressures 13, 19. The elongated cells obtained up to 70MPa
1
arX
iv:1
703.
0054
7v1
[q-
bio.
CB
] 1
Mar
201
7

revert to their normal length once the pressure is decreased to atmospheric pressure suggesting thatthe cellular processes retain their normal functionality over a short time once the high pressure isreleased 18. Nishiyama et. al. using a high-pressure imaging chamber have shown that increas-ing pressure results in the decrease of motility of cells with a complete inhibition of motility at80MPa 20. Spectroscopy and imaging techniques revealed that very high pressure could damagecell membrane of E. coli. Study on application of very high pressure on Escherichia coli suggestthat the cells can be killed above 550 MPa 15, while extremophilic prokaryotes isolated from theMariana Trench can grow well above pressure 100 MPa 2. On the contrary, eukaryotic organismstend to be more sensitive to pressure, with the exception of tardigrades (Milnesium tardigradum),which can survive over 600 MPa16.
To understand and model the effects of high pressure in eukaryotes, we chose the buddingyeast Saccharomyces cerevisiae due to the wealth of genetic tools and physiological knowledge.Yeast is a unicellular eukaryotic organism belonging to Fungi kingdom. A typical yeast cell isaround 5-10 micrometers in diameter, and the cells reproduce through a process called budding.Budding is a form of asymmetric asexual cell division; when once a “mother” cell reaches a criticalsize, it gives rise to a “daughter” cell (the bud) made of an entirely new surface. A bud appearsearly in the cell cycle (G1 phase), and the site at which the bud is formed becomes a channel thatconnects the mother and daughter cell so that the nucleus and other organelles can pass to thedaughter cell 21–23. The replicative lifespan of S. cerevisiae is as short as 2 days, which makes itan excellent laboratory candidate for studying the effect of high hydrostatic pressure on the growthand the viability of yeast 24–26.
High hydrostatic pressure has been shown to affect the activities of S. cerevisiae of the certainstrains up to 300 MPa 10, 27. For example, high pressure can induce loss of mitochondrial function28, chromosome abnormalities including polyploidy 29–31, and it disrupts the ultrastructure of thecells 32. It also has been found that a short duration of heat shock at 43oC for 30 minutes increasesthe yeast’s tolerance to pressure and allows the cells to survive up to 150 MPa 33. Recent studiessuggest protein synthesis is entirely shut down at 67 MPa 10, and the protein denaturation occursin the pressure range of 100-300 MPa.
While other studies have explored the effect of high pressure on S. cerevisiae, a quantitativeunderstanding of the effects of long exposure to high pressure is still missing. Here we sought aquantitative study of the effects of high hydrostatic pressure on the cell division, cell morphology,and cell viability of S. cerevisiae. We subjected S. cerevisiae to a wide range of high hydrostaticpressures and quantified the cell size, cell morphology, cell division, and budding index. Ourresults suggest that high pressure suppresses the budding of S.cerevisiae leading to a decreasedbudding index consistent with G1 cell cycle arrest. Furthermore, we also investigated the nature ofcell death upon long exposure to high pressures. We find that yeast cells exposed to high pressuresfor an extended period can undergo early stages of apoptosis, as well as necrotic cell death. More-over, we develop a continuum phenomenological model to account for the high-pressure effects onthe cell division.
2
Materials and Methods
Cell culture and media
A fully prototrophic haploid lab derivative of DBY8268 (S288C background) 34 of S.cerevisiaewas used for all the experiments reported here. A small amount of cells were first streaked out ontoa petri dish containing agar-YPD (1.5% agar, 1% yeast extract, 2% peptone, 2% dextrose) 35 andwere allowed to grow for 48 hours. A single colony was picked from the petri dish and transferredinto a tube containing 10 ml of liquid YPD media. The cells were then grown in an incubator at30◦C for 24 hours. After the incubation, 50 µL of the liquid culture was added to 1200 µL of YPDmedia and was subsequently transferred into the high-pressure cuvette for pressure experiments.
Propidium iodide and Annexin staining
To investigate the cause of cell death, yeast cells were stained using Propidium Iodide (PI)and Annexin V (AnnV). PI and AnnV conjugated with Alexa Fluor 488 were purchased from Ther-mofisher, USA. After subjecting the cells to high pressures, cells were washed with PhosphateBuffered Saline (PBS) 1X 5 times and were resuspended in 1X Annexin-binding buffer (Ther-mofisher, USA). AnnV and PI were then added to the solution and the sample was incubated atroom temperature for 15-20 minutes. After the staining, cells were washed with 1X Annexin bind-ing buffer 5 times and the phase-contrast, as well as fluorescent images of the cells were recordedusing a Nikon Optiphot 2 microscope.
Experimental setup
The experimental setup for temperature regulated high-pressure experiments is shown inFig.1 13. A sample in a cylindrical cuvette (Spectrocell; volume: 1200 µL) with a removableTeflon cap is loaded into the high-pressure cell (ISS, Illinois USA). A piston (HIP Inc., Pennsyl-vania, USA) is used to pressurize the water inside the pressure cell, and the pressure is measuredusing a pressure gauge attached to the piston. The temperature of the sample is maintained usinga circulating water bath (NesLab, USA) and it is measured using a thermocouple (National In-struments, USA) connected to the high pressure chamber and is recorded using a data acquisitioncard (National Instruments, USA) mounted on a PC. The equilibrium temperature fluctuations are±0.2oC, and the pressure uncertainty is estimated to be 1 MPa. All the experiments at high pres-sures were performed at temperature T = 30◦C. Since temperature equilibration is slower than thepressure equilibration; we first equilibrated the temperature of the pressure chamber to the desiredtemperature after which the cuvette with the sample is loaded into the pressure chamber. Afterloading the sample into the pressure chamber, the piston is used to achieve the desired pressure forthe experiment.
Quantification of cell-size distribution, cell morphology, and budding index
3

High pressure chamber
Piston
Sample cuvette
Teflon cap
To water circulating bath
Thermocouple
PCPressure gauge
Figure 1: Schematic of the temperature regulated high-pressure experimental setup.
In order the quantify the budding index of the sample at different pressures, phase contrastimages of the cells were acquired using a 40X objective and Spot Imaging camera mounted ona Nikon Optiphot 2 microscope. The acquired images were analyzed using a Matlab code forthe determination of budding index as well measures of cell morphology such as circumferenceand eccentricity of the cells. A detailed flowchart of our method of image analysis is shown inFig. 2. Multiple phase contrast images of the cells were first acquired. Images were then processedand converted to binary images and segmented for the identification of cells. Once the cells wereidentified, each cell was then fitted with an ellipse using an open source Matlab code 36. Thecoordinates of each cell in an image were then rotated such that the semi-major axis of the ellipselied on the x-axis. The local curvature of the periphery of the cells was obtained by a movingn-point linear fit to the boundary points as a function of x, where the value of n (typically about5) was varied to optimize the precision of the obtained local curvature. For each cell, the localcurvature along the periphery of the cell was then plotted as a function of x and was analyzed forthe determination of whether the cell is budding or not. A non-budding cell will only have onechange in the sign of its derivative, positive to negative, over the semi-major axis while a buddingcell will have more than one.
4

Budding Non - Budding
Fig. 3 – S288c Lab Strain’s Image Processing
Figure 2: Quantification of budding and non-budding cells. Initial phase contrast images are con-verted to binary images and are segmented for cell identification. After the identification of thecells, each cell in an image is fitted with an ellipse. The cells are rotated such that the semi-majoraxis of the ellipses align with the x-axis. The local curvature of the periphery of the cells is plottedagainst x. The budding and non-budding cells are identified by a number of zero-crossings of thelocal curvature of the boundary of the cells.
Results
Cell-size distribution and budding index of Saccharomyces cerevisiae at atmospheric pressure
To investigate the effect of pressure on the cell division of S. cerevisiae, we first performeda control experiment to determine the cell size distribution and the budding index of the cells atpressure P = 0.1 MPa. In Fig. 3, we show the probability distribution, P (`), of the cell size asmeasured by the circumference of cells, `, at atmospheric pressure. We find that the distributionof cell size is bimodal and can be fit very well with a sum of two Gaussians centered at the meanvalues of circumference corresponding to the budding and non-budding cells. The area underthe two Gaussian curves are the fractions, fNB and fB, of the non-budding and budding cellsrespectively. The ratio fB/fNB is known as the budding index. We find that the budding index ofthe strain used in our experiments is ≈ 0.463 at a pressure of 0.1 MPa and a temperature of 30◦ C.Since high pressure can affect the budding index by affecting the timescales of different cellular
5

III Experimental Results
A Cell distribution of Saccharomyces cerevisiae at 0.1 MPa
Figure 3: S.cerevisiae S288c Haploid at 0.1 MPa and 30oC.
Before we carried out the experiment at a various range of pressure, we performedcontrol experiment to investigate the budding index of S288c Haploid at normal con-ditions. In Fig. 3, we show the cell distribution of budding index at atmosphericpressure. We found that the circumference of non-budding cells is around 107.2 pix-els (13.4 µm in diameter)and the circumference of budding cells is around 191.7 pixels(24 µm in diameter).
6
Fig 3. (a) Phase contrast image of S.cerevisiae 1 atm and 30oC. (b) Cell-sizedistribution as measured by the circumference of the cells. The bars are theexperimental data and the solid black curve is a fit using a sum of two Gaussians shownas solid brown and green curves respectively. The area under the two Gaussians is thefraction of the non-budding and budding cells respectively.
Effects of hydrostatic pressure on the cell morphology of 135
S.cerevisiae 136
We next investigated the effect of high pressure on the morphological changes in 137
S.cerevisiae. In Figure [?], we show a representation of the morphological changes in the 138
cells as a function of pressure (what about characterizing it?). We find that the cells 139
become progressively smaller and circular in shape as the pressure is increased. 140
Cell cycle arrest and cell death at high pressures 141
After exposing yeasts to pressure, we dyed the cells with AnnV and PI to identify the 142
apoptotic and necrotic cells. The identification of each stage is shown in Fig.7. There 143
are 4 types of cells that can be identified after the staining process; live cell when both 144
AnnV and PI are negative (weak AnnV staining on the cellular membrane and weak PI 145
staining of the nucleus), early stage of apoptotic cell when AnnV is positive, and PI is 146
negative, primary necrotic cells due to ruptured membrane when AnnV is negative, and 147
PI is positive, and at last, both AnnV and PI are positive in which the cells are death. 148
A continuum model of S.cerevisiae’s cell division to account for 149
the budding index at normal and high pressures 150
At normal pressure, cell division of budding yeast proceeds through an initial growth of 151
non-budding cells. When a non-budding cell reaches a certain size the cell begins the 152
budding process to form a daughter cell. A daughter cell appears early in the cycle in 153
the shape of a bud. The site that the bud arises from turns into a channel that 154
connecting the mother and the daughter cell. This channel allows the nucleus and other 155
organelles to pass through from the mother cell to the daughter cell [9]. A schematic of 156
a cell cycle process is shown in Fig.??. We assume that the rate constant of initial 157
growth of the non-budding cell is k1 which relates to the time-scale of initial growth ⌧1. 158
When the bud is formed, the mother and daughter cells are formed over the time-scale 159
⌧2 with the corresponding rate constant k2. Following the argument above, the growth 160
PLOS 6/15
10 20 30l (µm)
0.00
0.02
0.04
0.06
0.08
0.10
P(l)
P=0.1MPa(b)(a)
Figure 3: (a) Phase contrast image of S.cerevisiae at a pressure of 0.1MPa and a temperature of30oC. (b) Probability distribution of the cell size as measured by the circumference of the cells.The bars are the experimental data, and the solid black curve is a fit to the data using a sum oftwo Gaussian functions shown as solid red and green curves respectively. The areas under the twoGaussian curves are the fractions of the non-budding and budding cells respectively.
processes as well as the cell morphology, we next investigate the effect of high pressures on thebudding index and the cell-size distribution.
Effects of hydrostatic pressure on the cell-size distribution and budding index of S.cerevisiae
To determine the effects of high pressure on S. cerevisiae, we performed high pressure ex-periments for four different pressure: P = 20 MPa, P = 30 MPa, P = 40 MPa, and P = 50 MPa.The experiments at high pressures were carried out until the cell growth reaches the saturation.Since the growth rate of cells depend on the pressure, the total time over which the pressure wasapplied to the cells varied with pressure. For pressure P = 0.1MPa, the duration was 12 hours,while for P = 20 MPa and 30 MPa, we ran the experiments for 24 hours and for the higher pres-sures, P = 40 MPa and P = 50MPa, the durations of experiments were 48 hours. After exposingthe cells to these pressures, the samples were taken out of the high pressure chamber and imagedimmediately for the determination of cell morphology and budding index. For the statistical signif-icance of the experimental data, multiple images of the cells were acquired and the statistics weregathered for more than 4000 cells for each pressure.
The probability distribution of cell size of S.cerevisiae, P (`), as measured by the circumfer-ence of the cells `, as a function of `, is shown in Fig.4 for four pressures (a) 20 MPa, (b) 30 MPa,(c) 40 MPa, and (d) 50 MPa. Similar to the probability distribution of l for P = 0.1 MPa (seeFig. 3), the distribution of all the pressures can be reasonably fit with a sum of two Gaussian func-tions (shown as solid black curves). The individual Gaussian functions are also shown as solidred and green curves for all the pressures. The area under the red curves and green curves are thefractions of non-budding and budding cells respectively.
6

10 15 20 25 30 35 l (µm)
0.00
0.02
0.04
0.06
0.08
0.10
0.12
0.14
P(l)
(b)
P=30MPa
10 15 20 25 30 35l (µm)
0.00
0.02
0.04
0.06
0.08
0.10
0.12
0.14
P(l)
(a)
P=20MPa
10 20 30l (µm)
0.00
0.02
0.04
0.06
0.08
0.10
0.12
0.14
0.16
P(l)
(c)
P=40MPa
10 15 20 25 30l (µm)
0.000.020.040.060.080.100.120.140.160.180.200.22
P(l)
(d)P=50MPa
Figure 4: Probability distribution of cell size, as measured by the circumference of the cells, atT = 30◦C and pressures (a) 20 MPa. (b) 30 MPa, (c) 40 MPa, and (d) 50 MPa. The distributionof cell size can be fit well with a sum of two Gaussian functions (shown as the solid black curve).The individual Gaussian functions are plotted as solid red and green curves respectively. The areaunder the red Gaussian curve is the fraction of non-budding cells while the area under the greensolid curve is the fraction of budding cells.
7

Figure 5: The ratio r of non-budding to budding cells as a function of pressure. Red circles arethe data, and the solid black curve is a linear fit through the experimental data points. The valueof r increase as pressure increases, suggesting that the budding index decreases upon increasingpressure.
Figure 5, we show the ratio of the fractions of non-budding to budding cells, r = fNB/fBas a function of pressure. We find that r increases with pressure suggesting that the budding indexdecreases with increasing pressure. In other words, the budding index is a function of pressure anddecreases upon increasing pressure.
Effects of hydrostatic pressure on the cell morphology of S.cerevisiae
We next investigated the effect of high pressure on the morphological changes in S.cerevisiae.The essential morphology in the classification and identification of yeasts includes the descriptionof shape, size, and internal structure of yeast cells; the differences during reproduction of cells andthe position of the daughter cells to the parents; the changes when the cells undergo sexual activ-ities. The shape of yeast cell and its structural parts under the microscope can be viewed as two-dimensional objects, such as circular, elliptical or bottle shaped 37–39. The standard S.cerevisiaeare elliptical, or occasionally spherically shaped with a typical diameter of 4 to 8 µm for spheres,and about 7 µm along the semimajor axis for elliptical cells 38. To quantify the morphology ofcells exposed to different pressures, we measured average cell size and eccentricity of the cellsafter exposing the cells to different pressures. In Fig. 6 (a), we show a representative image ofthe morphological changes in the cells as a function of pressure. We find that the cells becomeprogressively smaller and circular in shape as the pressure is increased.
8

IV Discussion
A Cell morphology of S.cerevisiae under high pressure
0.1 MPa 20 MPa 30 MPa 40 MPa 50 MPa
Non-budding
cell
Budding cell
Figure 10: Yeast cells change from an elliptical shape to more of a circular shapeas the pressure increases. Moreover, the cell size decreases (from 8µm to 6µm) withincreasing pressure.
The morphology essential in the classification and identification of yeasts includesthe description of shape, size, and internal structure of yeast cells; the differencesduring reproduction of cells and the position of the daughter cells to the parents;the changes when the cells undergo sexual activities. The shape of yeast cell and itsstructural parts under the microscope can be view as two-dimensional objects, such ascircular, elliptical or bottle shaped [35–37]. The standard S.cerevisiae are elliptical,or occasionally spherical shape with typical dimensions of 4 to 8 µm for spheres, andabout 7 µm for elliptical cells [36]. Based on the result, we found that as pressureincreases, the cells changed to more circular cells and the size decreases from 6 to 4µm for non-budding cells, 8 to 6 µm for budding cells.
16
0 10 20 30 40 50P (MPa)
10
15
20
25
30
<l>
(µ
m)
Non-buddingBudding
(b)
(a)
0 10 20 30 40 50P (MPa)
0.48
0.52
0.56
0.60
0.64
e (P
)
(c)
Figure 6: (a)Representative morphology of cells after exposure to different pressures. The cellstend to become smaller and more circular with increasing pressure. (b) Average cell size 〈`〉 asa function of pressure. 〈`〉 decreases with increasing pressure. (c) Average eccentricity, e(P) ofthe non-budding cells. Eccentricity decreases upon increasing pressure, suggesting that the cellsbecome more circular.
9
C S.cerevisae S288c Haploid with AnnV/PI staining
Live cell Early stage of apoptosis Primary necrosis Late apoptotic cells/secondary necrosis cells
Phase -contrast Image
Annexin V
Propidium Iodide
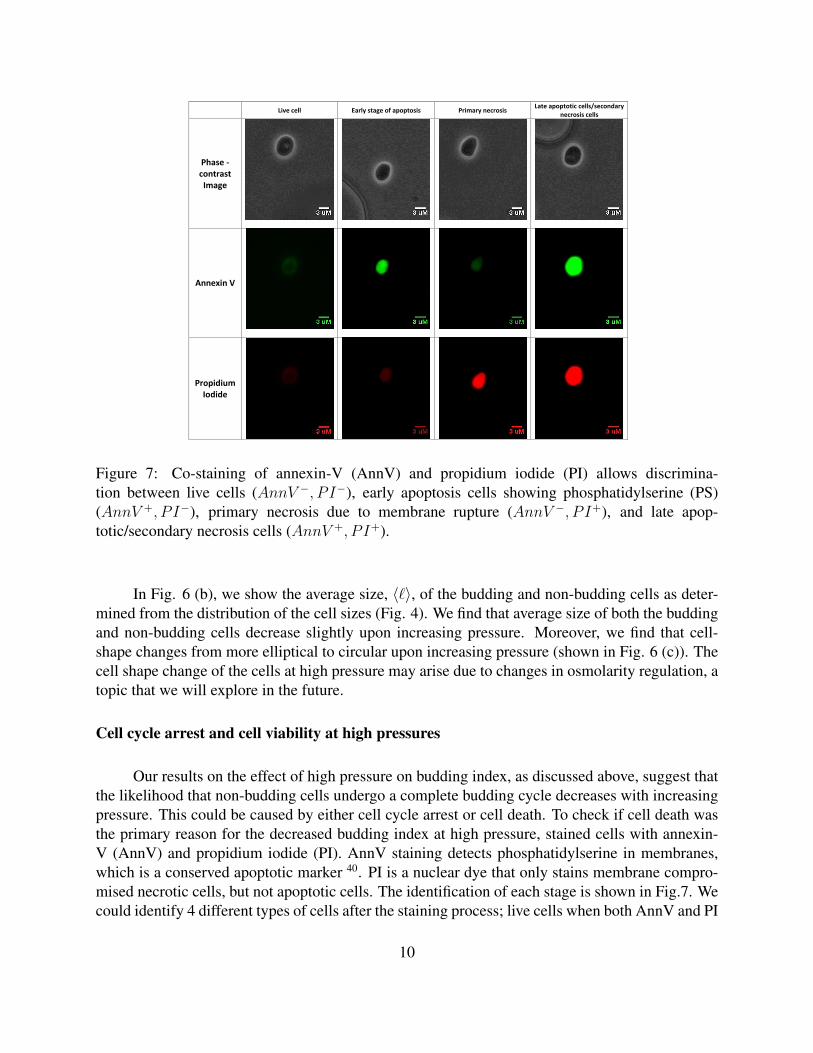
Figure 6: Co-staining of annexin-V (AnnV) and propidium iodide (PI) allows dis-crimination between live cells (AnnV +, P I+), early apoptosis cells showing phos-phatidylserine (PS) (AnnV +, P I�), primary necrosis due to membrane ruptured(AnnV �, P I+), and late apoptostic/secondary necrosis cells (AnnV +, P I�).
After exposing yeasts to pressure, we dyed the cells with AnnV and PI to identify theapoptotic and necrotic cells. The identification of each stage is shown in Fig.6. Thereare 4 types of cells that can be identified after the staining process; live cell whenboth AnnV and PI are negative (weak AnnV staining on the cellular membrane andweak PI staining of the nucleus), early stage of apoptotic cell when AnnV is positive,and PI is negative, primary necrotic cells due to ruptured membrane when AnnV isnegative, and PI is positive, and at last, both AnnV and PI are positive in which the
9
Figure 7: Co-staining of annexin-V (AnnV) and propidium iodide (PI) allows discrimina-tion between live cells (AnnV −, P I−), early apoptosis cells showing phosphatidylserine (PS)(AnnV +, P I−), primary necrosis due to membrane rupture (AnnV −, P I+), and late apop-totic/secondary necrosis cells (AnnV +, P I+).
In Fig. 6 (b), we show the average size, 〈`〉, of the budding and non-budding cells as deter-mined from the distribution of the cell sizes (Fig. 4). We find that average size of both the buddingand non-budding cells decrease slightly upon increasing pressure. Moreover, we find that cell-shape changes from more elliptical to circular upon increasing pressure (shown in Fig. 6 (c)). Thecell shape change of the cells at high pressure may arise due to changes in osmolarity regulation, atopic that we will explore in the future.
Cell cycle arrest and cell viability at high pressures
Our results on the effect of high pressure on budding index, as discussed above, suggest thatthe likelihood that non-budding cells undergo a complete budding cycle decreases with increasingpressure. This could be caused by either cell cycle arrest or cell death. To check if cell death wasthe primary reason for the decreased budding index at high pressure, stained cells with annexin-V (AnnV) and propidium iodide (PI). AnnV staining detects phosphatidylserine in membranes,which is a conserved apoptotic marker 40. PI is a nuclear dye that only stains membrane compro-mised necrotic cells, but not apoptotic cells. The identification of each stage is shown in Fig.7. Wecould identify 4 different types of cells after the staining process; live cells when both AnnV and PI
10

cells are death.
D Model of S.cerevisiae’s cell division at normal pressure
At normal pressure, cell division of budding yeast proceeds through an initial growthof non-budding cells. When a non-budding cell reaches a certain size, which is in theG1 phase (first gap phase), the cell begins the budding process to form a daughtercell. A daughter cell appears early in the cycle in the shape of a bud. The site thatthe bud arises from turns into a channel that connecting the mother and the daughtercell. This channel allows the nucleus and other organelles to pass through from themother cell to the daughter cell [9]. A schematic of a cell cycle process is shown inFig.7. We assume that the rate constant of initial growth of the non-budding cell isk1 which relates to the time-scale of initial growth ⌧1. When the bud is formed, themother and daughter cells are formed over the time-scale ⌧2 with a rate constant ofk2.
Figure 7: Schematic of S.cerevisiae cell division at normal pressure.
Following the argument above, the growth kinetics of budding yeast at normalpressure:
dNB
dt= k1NB + 2k2B (1)
10
E Model of S.cerevisiae’s cell division at high pressure
High hydrostatic pressure affects both the growth and the budding of yeast cells. Ageneral model that captures the effects of high pressure on the budding is shown inFig. 8. There is a small probability of the non-budding and budding cells of beingarrested in its current state and do not go on budding or forming two non-buddingdaughter cells. We expect that the high pressure will affect both k1 and k2, as wellas the likelihood of cellular arrest in the budding and non-budding states.
Figure 8: Schematic of S.cerevisiae’s cell division at high hydrostatic pressure. Asalient of the cell division at high pressure is the existence of a pressure dependent ofthe likelihood of cell arrest.
The above argument leads to a modification of the growth kinetics of the celldivision and can be written as:
dNB
dt= (k1 + k3)(NB) + k2B (10)
dB
dt= k1(NB) (k2 k4)B (11)
12
(a) Atmospheric pressure (b) High pressure
Figure 8: Schematic of the model of cell division at normal and high pressure.
are negative (weak AnnV staining of the cellular membrane and weak PI staining of the nucleus),early stage apoptotic cells when AnnV is positive, and PI is negative, primary necrotic cells dueto ruptured membranes when AnnV is negative, and PI is positive, and lastly, both AnnV and PIpositive dead cells, which we interpret as late apoptotic 40–44. Our results suggest low cellular deathrates under the pressure tested, though cell death does increase with increasing pressure. Most ofthe observed cell death was necrotic, consistent with the previous finding that pressure can causemembrane rupture 45.
A continuum model of S.cerevisiae’s cell division to account for the budding index at normal andhigh pressures
At normal pressure, cell division of budding yeast begins with the growth of non-budding“mother” cells. When a mother cell reaches a certain size early in G1 phase, a “daughter” budemerges. The mother and daughter cells remain connected by a cytoplasmic channel that allowsthe nucleus and other organelles to pass through from mother cell to daughter cell 21. A schematicof a cell cycle process is shown in Fig.8. We assume that the rate constant of the initial growthof the non-budding cell is k1 which relates to the time-scale of initial growth τ1. When the bud isformed, the mother and daughter cells are formed over the time-scale τ2 with the correspondingrate constant k2. Following the argument above, the growth kinetics of budding yeast at normalpressure can be written as
dNB
dt= −k1NB + 2k2B (1)
dB
dt= k1NB − k2B (2)
11

where B and NB are a number of budding and non-budding cells respectively. It can be shownthat the long-time behavior of the ratio of number of non-budding and budding cells reaches astationary value S1 and hence
NB
B= r (3)
where the ratio r is related to the budding index by r−1 = fB/fNB and depends only on the valuesof k1 and k2 and hence only the values of τ1 and τ2. It is found the value of r can be different fordifferent strains of budding yeast 46. The long-time behavior r can be written in terms of k1 and k2(see the Supporting Information)
r =(k2 − k1) +
√(k1 + k2)2 + 4k1k2
2k1(4)
Hence the fraction of fNB, and fB of the cells at non-budding state and the budding state at normalpressure, respectively can be written as
fNB =r
1 + r(5)
andfB =
1
1 + r(6)
High hydrostatic pressure affects both the growth and budding index of yeast cells. A generalcontinuum model that captures the effects of high pressure on budding yeast S.cerevisiae is shownin Fig. 8 (b). At high pressure, non-budding and budding cells have a small probability of goingthrough cellular arrest and death, which inhibits them from proceeding through the normal cellcycle. We expect that the high pressure will affect both k1 and k2, as well as the likelihood ofcellular arrest (or death) in the budding and non-budding states. The above argument leads to amodification of the growth kinetics of the cell division and can be written as:
dNB
dt= −(k1 + k3)(NB) + 2k2B (7)
dB
dt= k1(NB)− (k2 + k4)B (8)
dNBCA
dt= k3NB (9)
dBCA
dt= k4B (10)
12

0 10 20 30 40 50P (MPa)
0.50
0.52
0.54
0.56
0.58
0.60
0.62
K(P
)
Figure 9: The ratio of K(P ) as a function of pressure. The ratio K(P ) decreases with increasingpressure leading to a decrease of budding index at high pressure.
where B, NB, BCA, NBCA are the number of budding, non-budding, cell cycle arrested budding,and cell cycle arrested non-budding cells respectively, and k3 and k4 are pressure-dependent ratesof cellular arrest or death arising in non-budding and budding states, respectively. The ratio r,depends only on k1 and k2, is given by:
r =(k2(P )− k1(P )) +
√(k1(P ) + k2(P ))2 + 4k1(P )k2(P )
2k1(P )(11)
In Fig. 9, we show the behavior of the ratio of K(P ) = k1k2(P ) as a function of pressure,
P . Our results show that K(P ) decreases upon increasing pressure, resulting in the budding indexdecrease with increasing pressure discussed above. Determination of parameters k3, and k4 willrequire further experiments quantifying the fraction of cell deaths at different pressures that wewill explore in the future.
13

Discussion
Adaptive evolution of organisms to extremes of physicochemical conditions poses an attractiveand exciting challenge to understand the evolutionary trajectories of adaptation. Before one canexplore adaptive evolution of mesophilic organisms to extreme conditions, one must first investi-gate the effects of these conditions on the organism in order to determine the best parameter spacefor evolution experiments. We have performed a quantitative investigation of the effects of highhydrostatic pressure on the budding index, cell morphology, and cell death of a model eukaryote,Saccharomyces cerevisiae. We find that while cells are able to grow and reproduce up to 50 MPa, asmall fraction of cells either undergo cell death or cellular arrest in both budding and non-buddingstages of cell cycle. Furthermore budding index of the cells decreases with increasing pressure.Our phenomenological model that captures the cellular states – namely budding and non-budding– suggests that the ratio of rates determining the cell state changes from non-budding to budding(k1) and from budding to non-budding (k2) decreases with increasing pressure. Moreover, we findthat the high pressure affects morphological determinants of the cells such as ellipticity and cellsize. Our results show that cells become smaller and less elliptical upon increasing pressure. Thesechanges in morphology may arise due to high pressure induced changes in cell wall elasticity.
In addition, we find that high pressure induces both apoptotic and necrotic cell deaths albeitwith a much smaller probability. Yeast cells can undergo apoptosis showing some specific markers,such as DNA cleavage and apoptosis-typical chromatin condensation (margination), externaliza-tion of phosphatidylserine to the outer leaflet of the plasma membrane 40. On the other hand,necrotic cells (accidental cell death) results from devastating cellular injuries such as chemical orphysical disruption of the plasma membrane 42, dysfunction of cell organelles, such as vacuoledysfunction, peroxisomal dysfunction. It has been shown that there is evidence that vacuole acidi-fication at high pressure 47 causes a decrease of pH inside the cells leading to cell death. However,we also find evidence of early and late apoptosis of the cells exposed to very high pressure. Thiscould be caused by one of the many factors that cause DNA damage such chromatin condensation.Factors determining apoptotic and necrotic cell death at high pressure will be studied in detailsin our future experiments. The region of the parameter space relevant for evolution experimentspresumably lies at the tipping point between cell growth and cell death. Our results suggest thatfor the temperature 37◦ C, a pressure range of 50 − 70 MPa is a viable choice for the adaptiveevolution of S. Cerevisiae to high pressures.
Conclusion
We have performed quantitative investigations of the effects of pressure on Saccharomyces cere-visiae. More specifically, we have quantified the effect of high hydrostatic pressure on the buddingindex, cell morphology, and cell viability of this model eukaryote. We find that high hydrostaticpressure decreases the budding index both via cell cycle arrest and cell death. While the majority ofthe cells are still able to undergo budding at high pressures up to 50 MPa; there is a finite probabil-
14

ity of cellular arrest and cell death as the pressure increases. Moreover, we find that the likelihoodof cell death increases upon increasing pressure. We find evidence of apoptotic and necrotic celldeaths upon increasing pressure with a higher proportion of necrotic death. Application of highhydrostatic pressure results in cell morphology changes as well. Specifically, we find that the cellsbecome progressively smaller and less elliptical upon increasing pressure. Finally, we develop aphenomenological continuum model to account for the effects of pressure on the budding index.Our results besides providing invaluable quantitative insights into the effect of pressure on the bud-ding cycle and cell death of S. cerevisiae, paves the way for determining the region of temperatureand pressure relevant for adaptive evolution of this model eukaryote, a theme that our lab has beenexploring.
Supporting Information
S1 Long-time limit of the ratio of budding and non-budding cells in a population.
Here we show that the ratio of non-budding to budding cells in a population reaches a con-stant in the long-time limit. A schematic of the process is shown in figure 8. We assume that therate constant of initial growth of the unbounded cell is k1 which is related to the time-scale of theinitial growth τ1. Once a bud is formed, two new cells are formed from the budding cells over atime-scale τ2 or with a rate constant k2.
Following the above argument, we can write the growth kinetics of budding yeast asdNB
dt= −k1NB + 2k2B (12)
dB
dt= k1NB − k2B (13)
In the following, we will show that the ratio of the budding to non-budding cells at long timesreaches a stationary value whereas this ratio depends on k1 and k2 and is independent of initialvalues of NB and B.
Dividing Eq. 1 by 1/B and Eq. 2 by NB/B2 and subtracting the resulting equations, we get1
y
dNB
dt− NB
B2
dB
dt= −k1(
NB
B) + 2k2 − k1(
NB
B)2 + k2(
NB
B) (14)
Substituting r = NBB
, which is the ratio of non-budding to budding cells, we get
dr
dt= (k2 − k1)r − k1r2 + 2k2 (15)
Solution of the above equation can be written as
r(t) =A−Bψe−
k1A−B
t
1− ψe−k1
A−Bt
(16)
15

where A =(k2−k1)+
√(k1+k2)2+4k1k2
2k1, B = − 4k2
(k1−k2)+√
(k1+k2)2+4k1k2, and ψ = r(t=0)−A
r(t=0)−B Since,
A−B > 0, the long-time limit of r(t) converges and hence
limt→∞
r(t) = limt→∞
A−Bψe−k1
A−Bt
1− ψe−k1
A−Bt
= A =(k2 − k1) +
√(k1 + k2)2 + 4k1k2
2k1(17)
Acknowledgments
We thank Sudip Nepal, Kionna Henderson, and Barrett Johnson for fruitful discussions and ArkansasBio Institute for support.
1. Yayanos AA, Dietz AS, Boxtel RV. Obligately barophilic bacterium from the Mariana trench.Proc. Natl. Acad. Sci. USA. 1981;78: 5212-5215.
2. Kato C, Li L, Nogi Y, Nakamura Y, Tamaoka J, Horikoshi K. Extremely barophilic bacte-ria isolated from the Mariana Trench, Challenger Deep, at a depth of 11,000 meters. Appl.Environ. Microbiol. 1998;64: 1510-1513.
3. Brock TD, Freeze H. Thermus aquaticus gen. n. and sp. n., a nonsporulating extreme ther-mophile. J. Bacteriol. 1969;98: 289-297.
4. Bakermans C, Tsapin AI, Souze-Egipsy V, Gilichinsky DA, Nealson KH. Reproduction andmetabolism at −10oC of bacteria isolated from Silberian permafrost. 2003;5: 321-326.
5. Schleper C, Piihler G, Kuhlmorgen B, Zillig W. Life at extremely low pH. Nature. 1995;375:741-742.
6. Horikoshi K, Akiba T. Alkalophilic Microorganisms: A New Microvial World. Springer: Hei-delberg, Germany. 1982.
7. Hawley SA. Reversible pressure-temperature denaturation of chymotrypsinogen. Biochem-istry. 1971;10: 2436-2442.
8. Mozhaev VV, Heremans K, Frank J, Masson P, Balny C. High pressure effects on proteinstructure and function. Proteins: Structure, Function and Bioformatics. 1996;24: 81-91.
9. Privalov PL. Cold denaturation of proteins. Crit. Rev. Biochem Mol. Biol. 1990;25: 281-305.
10. Gross M, Jaenicke R. Proteins under pressure. The influence of high hydrostatic pressureon structure, function and assembly of proteins and protein complexes. Eur. J. Biochem.1994;221: 617-630.
11. Hummer G, Garde S, Garcia AE, Paulaitis ME, Pratt LR. The pressure dependence of hy-drophobic interactions is consistent with the observed pressure denaturation of proteins.PNAS. 1998;95: 1552-1555.
16

12. Merrin J, Kumar P, Libchaber A. Effects of pressure and temperature on the binding of RecAprotein to single-stranded DNA. PNAS. 2011;108: 19913-19918.
13. Kumar P, Lichaber A. Pressure and temperature dependence of growth and morphology ofEscherichia coli: Experiments and Stochastic Model. Biophysic Journal. 2013;105: 783-793.
14. Abe F. Piezophysiology of yeast: occurrence and significance. Cellular and Molecular Biology2004;50: 437-445.
15. Sonoike K, Setoyama T, Kuma Y, Shinno T, Fukumoto K, Ishihara M. Effects of pressure andtemperature on death rate of Lactobacillus casei and Escherichia coli. In: Blany C, HayashiR, Heremans K, Masson P, editors. High Pressure and Biotechnology. Colloque INSERM.1992;224: 297-301.
16. Seki K, Toyoshima M. Preserving tardigrades under pressure. Nature. 1998;395: 853-854.
17. Ishii A, Sato T, Kato C. Effects of high hydrostatic pressure on bacterial cytoskeleton FtsZpolymers in vivo and in vitro. Microbiology. 2004;150: 1965-1972.
18. Kumar P, Libchaber A. Cell fate and reversibility of Escherichia coli with pressure. (underreview).
19. Huh D, Paulsson J. Random partitioning of molecules at cell divisions. PNAS. 2011;108:15004-15009.
20. Nishiyama M, Sowa Y. Microscopic analysis of bacterial motility at high pressure. BiophysicalJournal. 2012;102: 1872-1880.
21. Hartwell L. Saccharomyces cerevisiae Cell Cycle. Bacteriological Reviews. 1974;38: 167-1980.
22. Johnston GC, Pringle JR, Hartwell LH. Coordination of growth with cell division in the yeastSaccharomyces cerevisiae. Experimental Cell Research 1977;105: 79-98.
23. Hartwell LH, Culotti J, Pringle JR, Reid BJ. Genetic control of the cell division in yeast.Science 1974:183: 46-51.
24. Fernandes PM. How does yeast response to pressure? Brazilian Journal of Medical and Bio-logical Research 2005;38: 1239-1245.
25. Palou E, Lopez-Malo A, Barbosa-Canovas GV, Welti=Chanes J, Davidson PM, SwansonG. High hydrostatic pressure come up time and yeast viability. Journal of Food Protection.1998;61: 1657-1660.
26. Shibata M, Torigoe M, Matsumoto Y, Yamamoto, M, Takizawa N, Hada Y, et al. Tolerance ofbudding yeast Saccharomyces cerevisiae to ultra high pressure. Journals of Physics: Confer-ence Series. 2014;500.
17

27. Lammi M, Elo M, Sironen R, Karjalainen H, Kaarniranta K, Helminen H. Hydrostaticpressure-induced changes in cellular protein synthesis. Biorheology. 2004;41: 309-313.
28. Rosin MP, Zimmerman AM. The induction of cytoplasmic petite mutants of Saccharomycescerevisiae by hydrostatic pressure. J. Cell Sci. 1977;26: 373-385.
29. Hamada K, Nakatomi Y, Shimada S. Direct induction of tetraploids or homozygous diploids inthe industrial yeast Saccharomyces cerevisiae by hydrostatic pressure. Cure Genet. 1992;22:371-376.
30. Bravim F, Silva L, Souza D, Lippman S, Broach J, Fernandes A, Fernandes P. High hydrostaticpressure activates transcription factors involved in Saccharomyces cerevisiae stress tolerance.Curr Pharm Biotechnol. 2014;13: 2712-2720 .
31. Fernandes P, Domitrovic T, Kao C, Kurtenbach E. Genomic expression pattern in Saccha-romyces cerevisiae cells in response to high hydrostatic pressure. FEBS Letters. 2004;556:153-160.
32. Kobori H, Sato M, Tameike A, Shimada S, Osumi M. Ultrastructure effects of pressure stressto the nucleus in Saccharomyces cerevisiae: a study by immunoelectron microscopy usingfrozen thin sections. FEMS Microbiol. Lett. 1995;132: 253-258.
33. Iwahashi H, Kaul SC, Obuchi K, Komatsu Y. Induction of barotolerance by heat shock treat-ment in yeast. FEMS Microbiol. Lett. 1991;80: 325-328.
34. Kim HS, Fay JC. Genetic variation in the cysteine biosynthesis pathway causes sensitivity topharmacological compounds. Proc. Natl. Acad. Sci. USA. 2007;104: 19387-19391.
35. Saghbini M, Hoekstra D, Gautsch J. Media formulations for various two-hybrid systems.Methods Mol. Biol. 2001;177: 15-39.
36. Gal O. Fit Ellipse. MathWorks: in MatLab. Available from:https://www.mathworks.com/matlabcentral/fileexchange/3215-fit-ellipse.
37. Suzuki M, Asada Y, Watanabe D, Ohya Y. Cell shape and growth of budding yeast cells inrestrictive microenvironments. Yeast. 2004:21: 983-989.
38. Becze GE. A Microbiological Process Report Yeast: I. Morphology Applied and Environmen-tal Microbiology. 1995.
39. Knop M. Yeast cell morphology and sexual reproduction - a short overview and some consid-erations. Comptes Rendus Biologies. 2011;334: 599-606.
40. Madeo F, Frohlich E, Frohlich K. A yeast mutant showing diagnostic markers of early and lateapoptosis. The Journal of Cell Biology. 1997;139: 729-734.
41. Carmona-Gutierrez D, Eisenberg T, Buttner S, Meisinger C, Kroemer G, Madeo F. Apoptosisin yeast: triggers, pathways, subroutines. Cell Death and Differentiation. 2010;17: 763-773.
18

42. Eisenberg T, Carmona-Gutierrez D, Buttner S, Tavernarakis N, Madeo,F. Necrosis in yeast.Apoptosis. 2010;15: 257-268.
43. Buttner S, Eisenberg E, Herker E, Carmona-Gutierrez D, Kroemer G, Madeo F. Why yeastcells can undergo apoptosis: death in time of peace, love and war. The Journal of Cell Biology.2006;175: 521-525.
44. Carmona-Gutierrez D, Madeo F. Tracing the roots of death: apoptosis in Saccharomyces cere-visiae. In: Zheng D, Yin XM, editors. Essentials of Apoptosis: A guide for basic and clinicalresearch. Humana Press; 2009. pp. 325-354.
45. Zong W, Thompson CB. Necrotic death as cell fate. Genes & Dev. 2006;20: 1-15.
46. Zettel MF, Garza LR, Cass AM, Myhre RA, Haizlip LA, Osadebe SN, et al. The buddingindex of Saccharomyces cerevisiae deletion strains identifies genes important for cell cycleprogression. FEMS Micro. Lett. 2003;223: 253-258.
47. Abe F, Horikoshi K. Hydrostatic pressure promotes the acidification of vacuoles in Saccha-romyces cerevisiae. FEMS Microbiol. Lett. 1995;130: 307-312.
19