morgan stanley investor conference - anz personal … · 1 morgan stanley investor conference brian...
TRANSCRIPT
1
Morgan Stanley Investor Conference
Brian HartzerGroup Managing Director, Personal
2
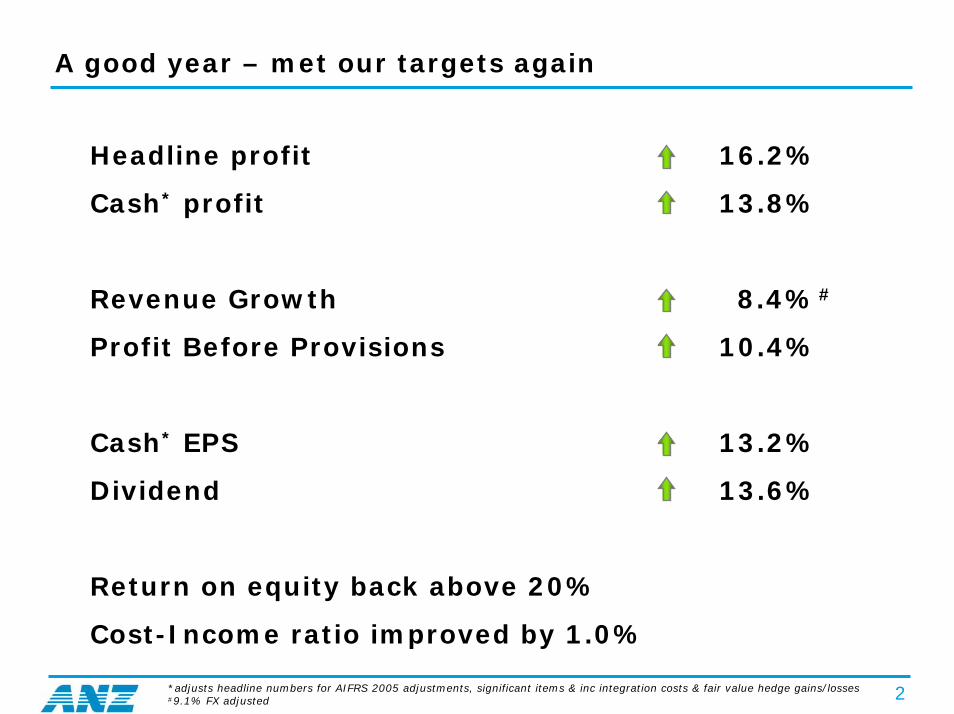
A good year – met our targets again
Headline profit 16.2%
Cash* profit 13.8%
Revenue Growth 8.4%#
Profit Before Provisions 10.4%
Cash* EPS 13.2%
Dividend 13.6%
Return on equity back above 20%
Cost-Income ratio improved by 1.0%
*adjusts headline numbers for AIFRS 2005 adjustments, significant items & inc integration costs & fair value hedge gains/losses#9.1% FX adjusted
3
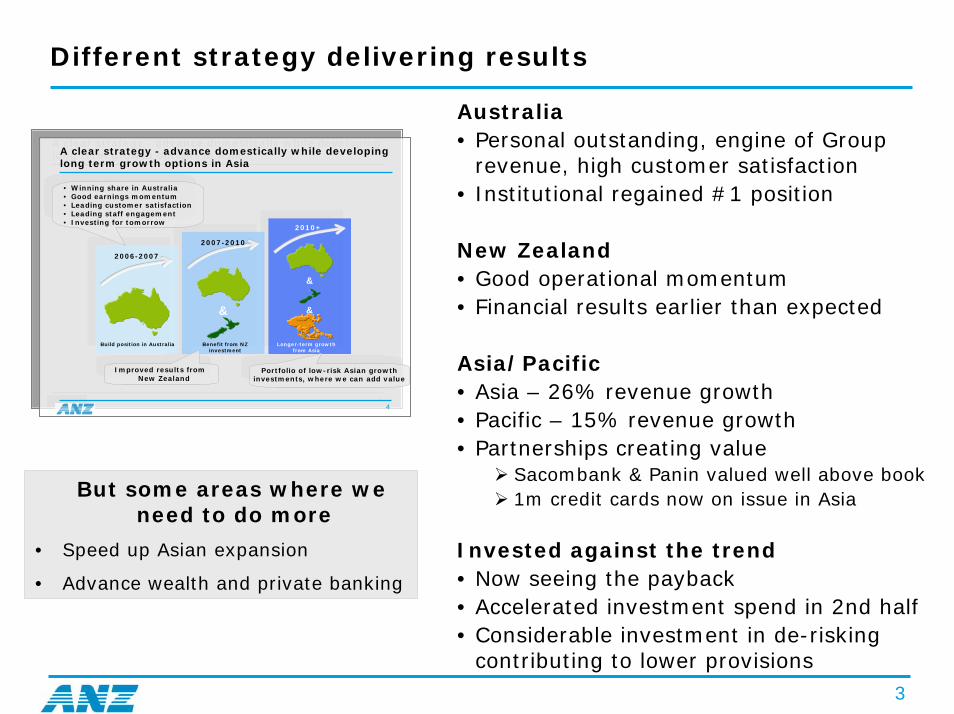
Different strategy delivering results
4
A clear strategy - advance domestically while developing long term growth options in Asia
Build position in Australia
2006-2007
&
2007-2010
Benefit from NZ investment
&
&
2010+
Longer-term growth from Asia
• Winning share in Australia• Good earnings momentum• Leading customer satisfaction• Leading staff engagement• Investing for tomorrow
Improved results from New Zealand
Portfolio of low-risk Asian growth investments, where we can add value
Australia• Personal outstanding, engine of Group
revenue, high customer satisfaction• Institutional regained #1 position
New Zealand• Good operational momentum• Financial results earlier than expected
Asia/Pacific• Asia – 26% revenue growth• Pacific – 15% revenue growth• Partnerships creating value
Sacombank & Panin valued well above book1m credit cards now on issue in Asia
Invested against the trend• Now seeing the payback• Accelerated investment spend in 2nd half• Considerable investment in de-risking
contributing to lower provisions
But some areas where we need to do more
• Speed up Asian expansion
• Advance wealth and private banking

4
Good performance from Divisions, particularly Personal
Cash NPAT ($m)Sep-06 v Sep-05
Institutional
Personal
New Zealand*
1,25622%
11%
20%
1,396
1,006 NZD
Division
NZD
Australia
New Zealand
Asia/Pacific
2,37716%
26%
25%
35%
238
130
964 NZD
NPAT increase
NPAT decrease
Sep-05 NPAT
Other
Geography Cash NPAT ($m)
* New Zealand Banking, which includes NZ Institutional
NZD
5
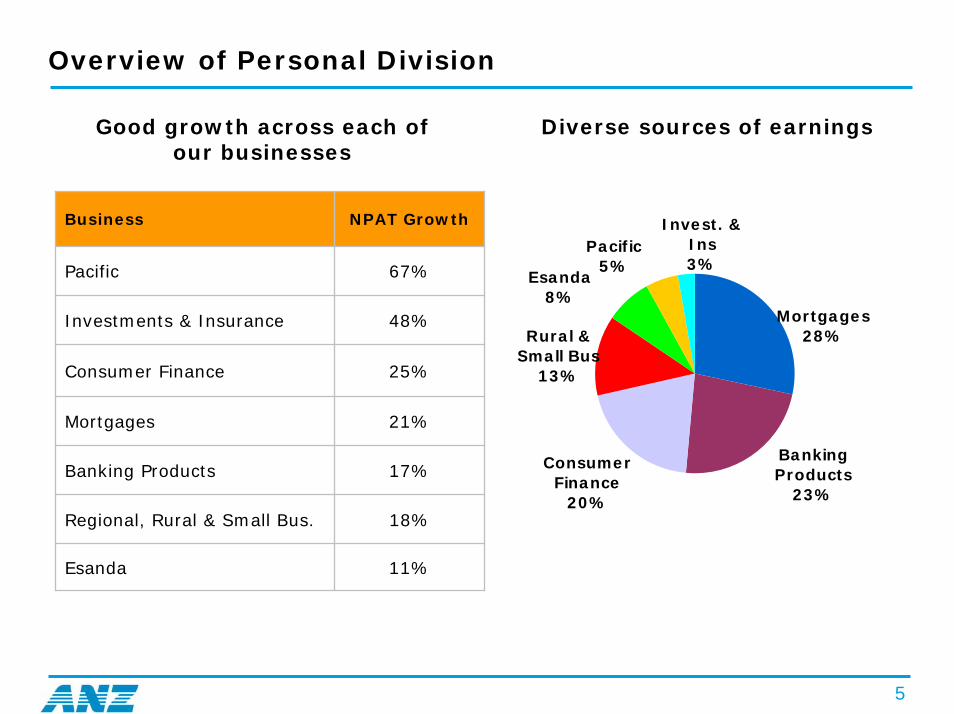
Overview of Personal Division
Diverse sources of earnings
Business NPAT Growth
Pacific 67%
Investments & Insurance 48%
Consumer Finance 25%
Mortgages 21%
Banking Products 17%
Regional, Rural & Small Bus. 18%
Esanda 11%
Good growth across each of our businesses
Rural & Small Bus
13%
Mortgages28%
Pacific5%
Invest. & Ins3%
Esanda8%
Consumer Finance
20%
Banking Products
23%

6
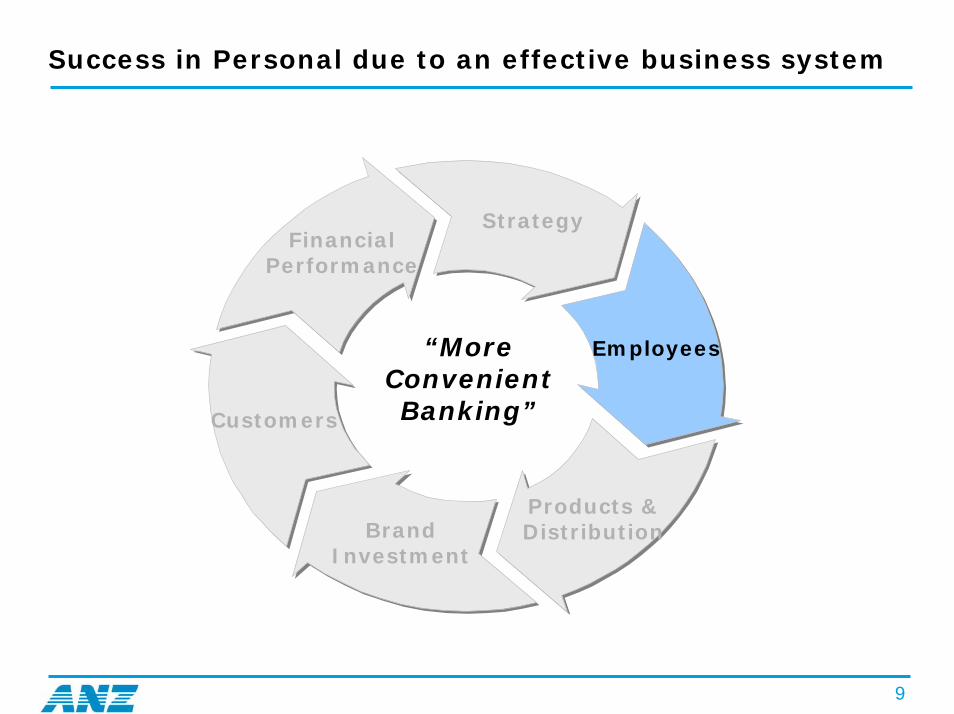
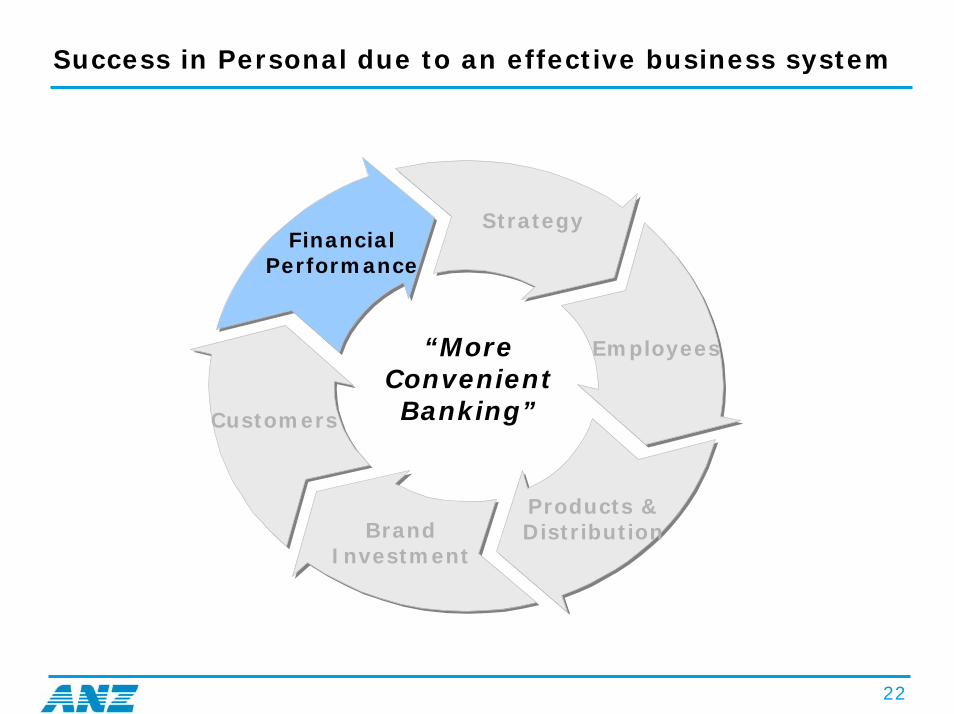
Success in Personal due to an effective business system
Strategy
Products & DistributionBrand
Investment
Customers
Financial Performance
Employees“More Convenient Banking”
7
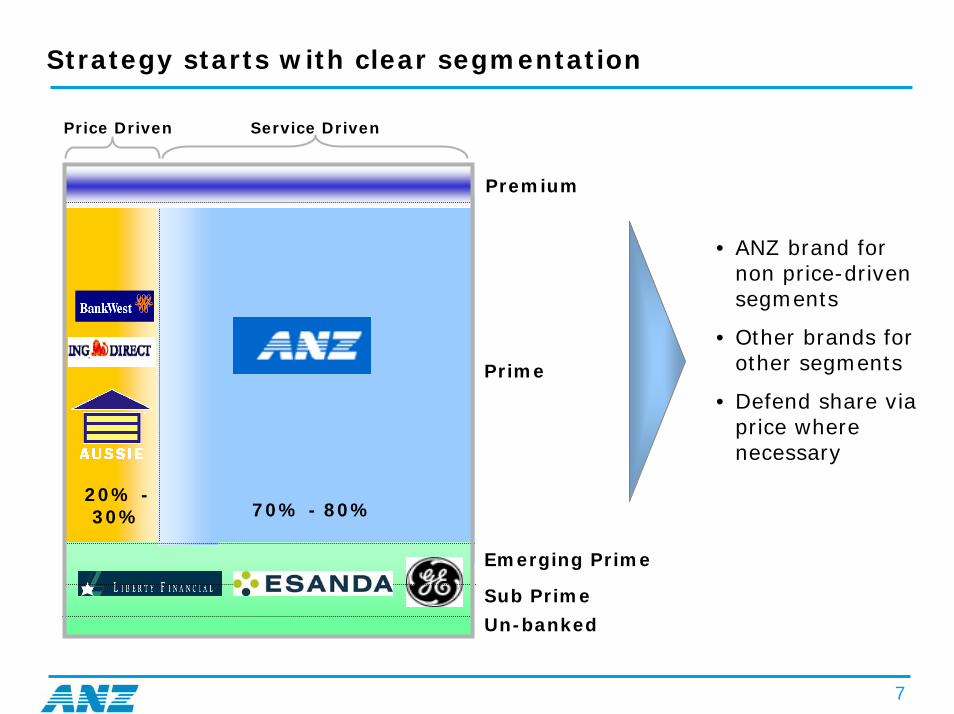
Strategy starts with clear segmentation
Un-banked
Prime
20% -30% 70% - 80%
Price Driven Service Driven
Premium
• ANZ brand for non price-driven segments
• Other brands for other segments
• Defend share via price where necessary
Emerging Prime
Sub Prime
8
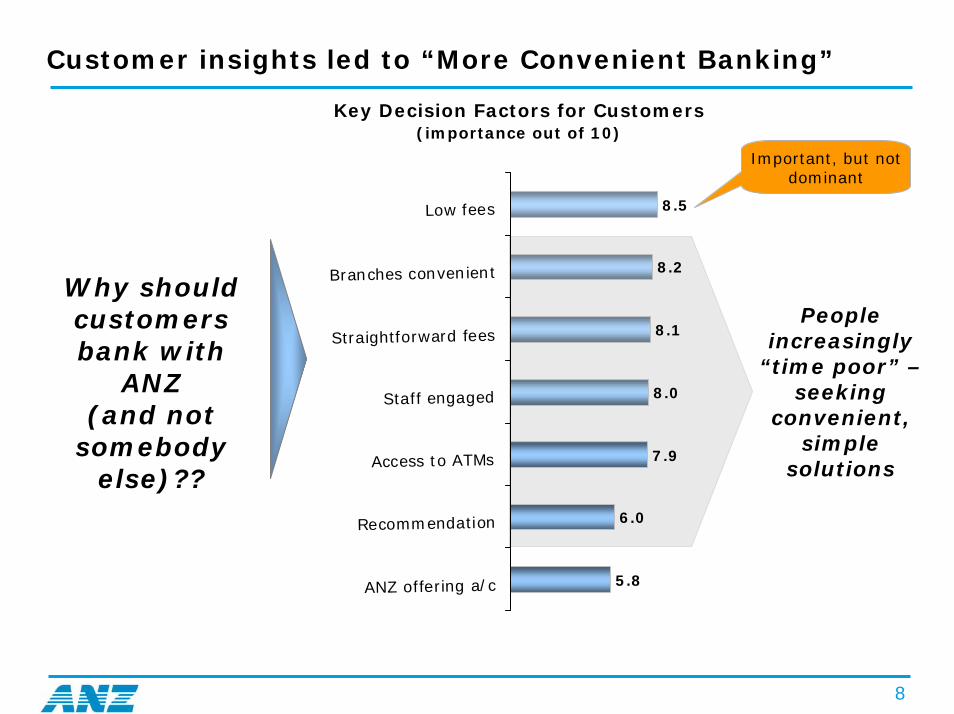
Customer insights led to “More Convenient Banking”
Key Decision Factors for Customers(importance out of 10)
People increasingly
“time poor” –seeking
convenient, simple
solutions
Important, but not dominant
5.8
6.0
7.9
8.0
8.1
8.2
8.5
ANZ offering a/c
Recommendation
Access to ATMs
Staff engaged
Straightforward fees
Branches convenient
Low fees
Why should customers bank with
ANZ (and not
somebody else)??
9
Success in Personal due to an effective business system
Strategy
Products & DistributionBrand
Investment
Customers
Financial Performance
Employees“More Convenient Banking”
10
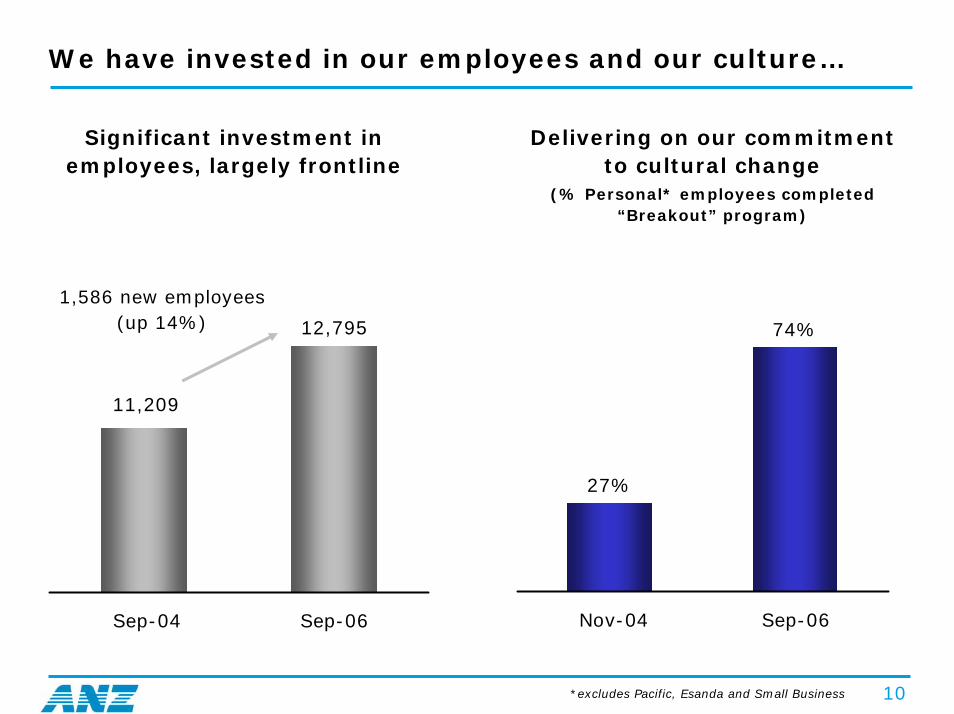
We have invested in our employees and our culture…
Significant investment in employees, largely frontline
Delivering on our commitment to cultural change
(% Personal* employees completed “Breakout” program)
12,795
11,209
Sep-04 Sep-06
1,586 new employees (up 14%)
27%
74%
Nov-04 Sep-06
*excludes Pacific, Esanda and Small Business

11
…resulting in a highly engaged workforce
High levels of engagement across Personal
Dramatic shift in staff satisfaction (“am I satisfied working at the ANZ?”)
57%
88%
4%
20%
0%
20%
40%
60%
80%
100%
1999 2000 2001 2002 2003 2004
Positive Responses
Negative Responses
82%86%
2004 2006
Branch Manager engagementS
hif
t to
“e
ng
ag
em
en
t”
51%
60%
66%
PersonalDivision
ANZ Group BankingBenchmark
12
Success in Personal due to an effective business system
Strategy
Products & DistributionBrand
Investment
Customers
Financial Performance
Employees“More Convenient Banking”

Specialisation has delivered product and service excellence
13
Money Magazine Awards 2006* Home Loan Lender of the Year* Readers' Choice Award for Service
Excellence
Australian Service Excellence Awards 2006 * Winner of the Large Business
category - Best Call Centre in Australia

14
Expanding distribution to improve convenience
700
720
740
760
780
800
Sep-04 Sep-05 Sep-06800
1,000
1,200
1,400
1,600
1,800
2,000
Branches (LHS) ATMs (RHS)
New Branches and ATMs
25 Branches & 330 ATMs added
during FY06
# #
15
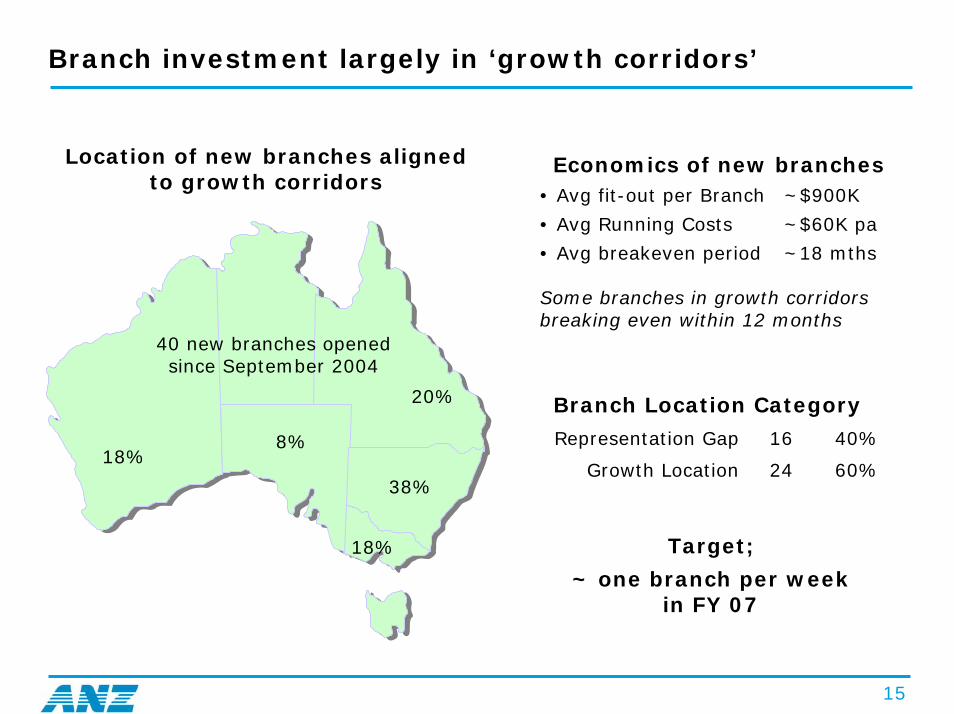
Branch investment largely in ‘growth corridors’
40 new branches opened since September 2004
Economics of new branches• Avg fit-out per Branch ~$900K
• Avg Running Costs ~$60K pa
• Avg breakeven period ~18 mths
Some branches in growth corridors breaking even within 12 months
Location of new branches aligned to growth corridors
Target;
~ one branch per week in FY 07
Branch Location Category
Representation Gap 16 40%
Growth Location 24 60%38%
18%
8%18%
20%
16
Success in Personal due to an effective business system
Strategy
Products & DistributionBrand
Investment
Customers
Financial Performance
Employees“More Convenient Banking”

17
“Proof points” starting to differentiate ANZ brand…
Investment in the franchise reflected in improved brand image*
More ATM locations in key areas
0
4
8
12
16
Sep-04 Mar-05 Sep-05 Mar-06 Sep-06
ANZ Peer 1Peer 2 Peer 3
First major bank to launch Visa Debit card
*Brand Image, Source: ANZ Brand Health Monitor

18
…which drives future acquisition and retention
Improved “Trial Intention”(Day to Day Transaction Accounts*)
Lowest propensity to defect#
(Intend to switch main bank in next 12 months)
%
0
2
4
6
8
Sep-02 Sep-03 Sep-04 Sep-05 Aug-06
ANZ Peer 1 Peer 2 Peer 3
%
0
5
10
15
20
25
30
ANZ Major Peer Average
Sep-04 Sep-06
Next highest peer
# Source: Roy Morgan Research – Main Financial Institution, excluding can’t say.Australian Pop’n 14+ yrs, 12 monthly moving average
*Source: ANZ Brand Health Monitor, 6 month moving average
19
Success in Personal due to an effective business system
Strategy
Products & DistributionBrand
Investment
Customers
Financial Performance
Employees“More Convenient Banking”

20
Customer satisfaction at top of major banks…
ANZ customer satisfaction* at top of major peers despite recent softening
across the industry
50
60
70
80
Sep-00 Sep-01 Sep-02 Sep-03 Sep-04 Sep-05 Sep-06
%
ANZ Peer 1Peer 2 Peer 3
*Source: Roy Morgan Research – Main Financial Institution, % Satisfied (Very or Fairly Satisfied), 6 monthly moving average
21
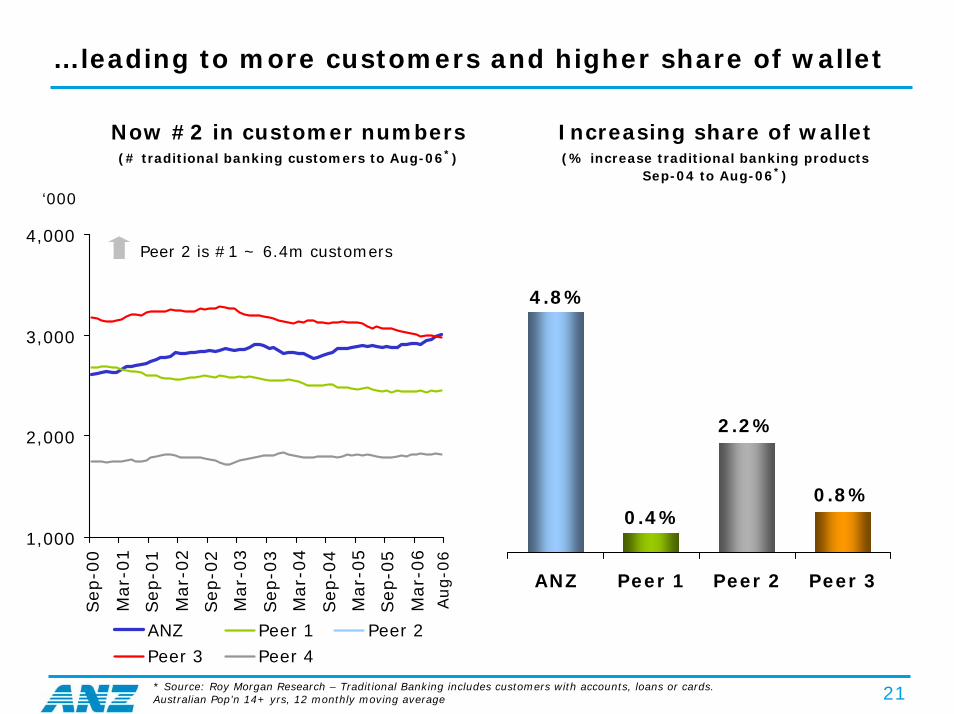
…leading to more customers and higher share of wallet
Now #2 in customer numbers(# traditional banking customers to Aug-06*)
Increasing share of wallet(% increase traditional banking products
Sep-04 to Aug-06*)
1,000
2,000
3,000
4,000
Sep-0
0
Mar-
01
Sep-0
1
Mar-
02
Sep-0
2
Mar-
03
Sep-0
3
Mar-
04
Sep-0
4
Mar-
05
Sep-0
5
Mar-
06
ANZ Peer 1 Peer 2Peer 3 Peer 4
0.8%
4.8%
0.4%
2.2%
ANZ Peer 1 Peer 2 Peer 3
‘000
Peer 2 is #1 ~ 6.4m customers
Aug-0
6
* Source: Roy Morgan Research – Traditional Banking includes customers with accounts, loans or cards.Australian Pop’n 14+ yrs, 12 monthly moving average
22
Success in Personal due to an effective business system
Strategy
Products & DistributionBrand
Investment
Customers
Financial Performance
Employees“More Convenient Banking”
23
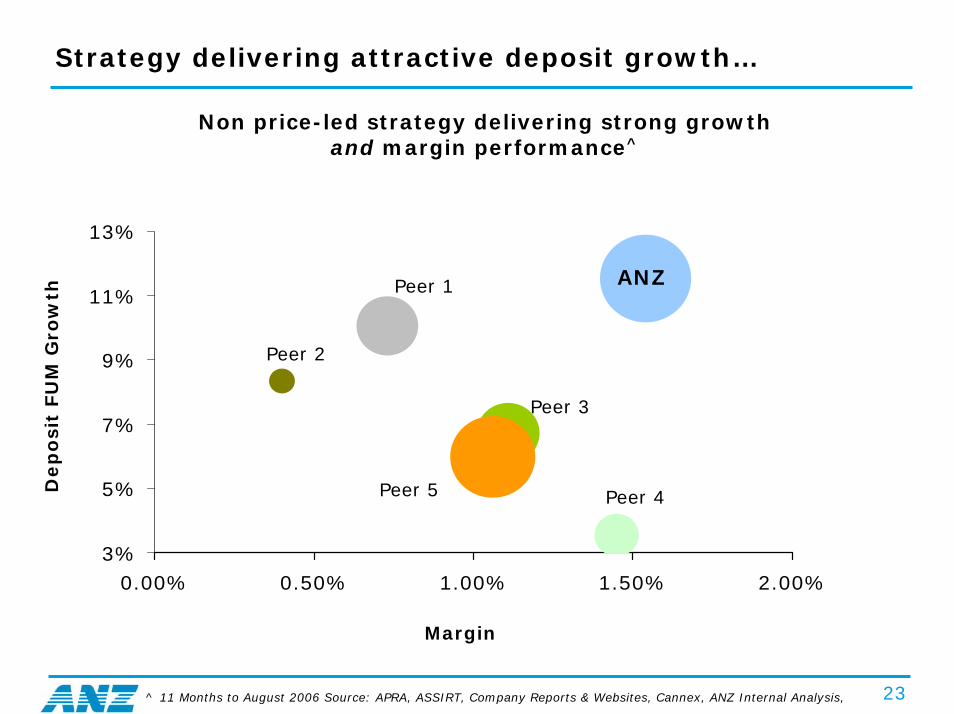
Strategy delivering attractive deposit growth…
Non price-led strategy delivering strong growth and margin performance^
3%
5%
7%
9%
11%
13%
0.00% 0.50% 1.00% 1.50% 2.00%
ANZPeer 1
Peer 2
Peer 3
Peer 4Peer 5Dep
osi
t FU
M G
row
th
Margin
^ 11 Months to August 2006 Source: APRA, ASSIRT, Company Reports & Websites, Cannex, ANZ Internal Analysis,
24
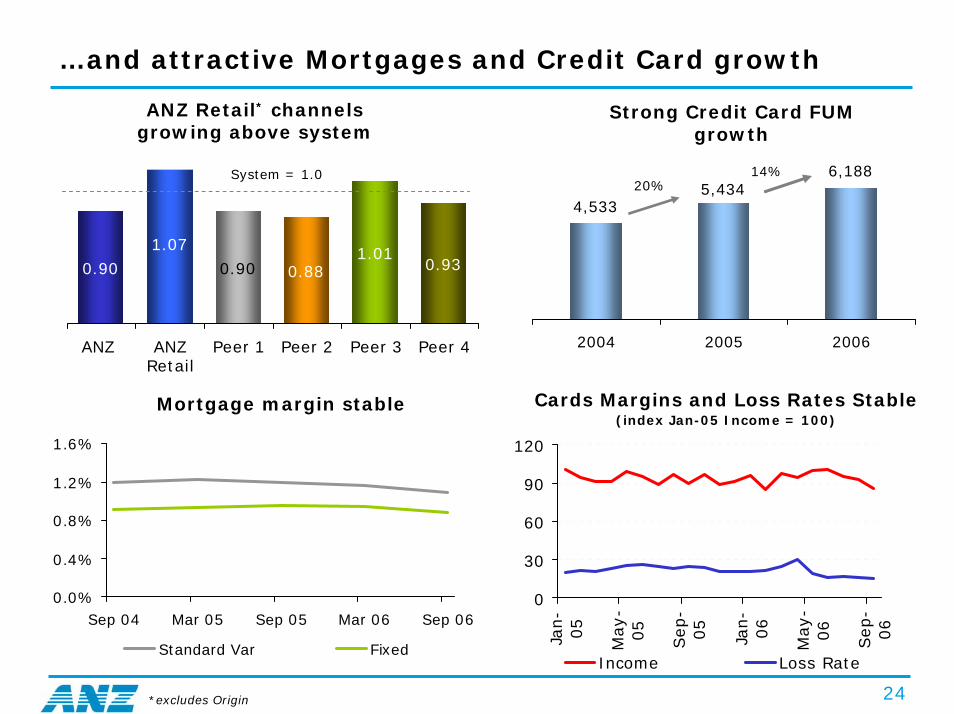
…and attractive Mortgages and Credit Card growth
ANZ Retail* channels growing above system
6,1885,434
4,533
2004 2005 2006
Strong Credit Card FUM growth
20%14%
1.07
0.881.01
0.90 0.930.90
ANZ ANZRetail
Peer 1 Peer 2 Peer 3 Peer 4
System = 1.0
0
30
60
90
120
Jan-
05
May-
05
Sep-
05
Jan-
06
May-
06
Sep-
06
Income Loss Rate
Cards Margins and Loss Rates Stable (index Jan-05 Income = 100)
Mortgage margin stable
0.0%
0.4%
0.8%
1.2%
1.6%
Sep 04 Mar 05 Sep 05 Mar 06 Sep 06
Standard Var Fixed
*excludes Origin

25
Strong revenue growth driving out-performance
Revenue growth in part determines level of cost growth*
Strong profit momentum (pcp)
15.1%
11.0%10.6%
7.3%
11.6%
8.7%
2H05 1H06 2H06
Income Growth Expense Growth
12.7%
16.2%
26.9%
2H05 1H06 2H06
*pcp growth 1H06 & 2H06 AIFRS, 2H05 AGAAP

26
Parts of the formula can be copied, yet success is not guaranteed
Strategy
Products & DistributionBrand
Investment
Customers
Financial Performance
Employees
Needs to be distinctive and well executed to succeed
Culture takes years to develop and each
bank is different
Focus on innovation and 1st to market
requires right culture and investment
Consistent delivery required on all dimensions
Not guaranteed, requires time, execution and
investment
Our challenge:
To stay one step ahead of
the pack!
Significant investment required; must be
distinctive & relevant
27
Summary
• No “silver bullet” explains ANZ’s Retail Banking success
• Our business system is delivering strong, sustainable growth
• We will continue to invest in “More Convenient Banking”
• Lots more upside in customer #s, wallet share, and efficiency

28
Additional Information

29
Early signs of a slight deterioration in credit quality
0
100
200
300
400
500
Mar-05 Sep-05 Mar-06 Sep-06
High Security Lower Security
24%
(1%)
Growth has mainly been in the Australian highly secured portfolio
(90+ days past due loans Aust.)
0.0%
0.1%
0.2%
0.3%
0.4%
0.5%
Sep-05 Dec-05 Mar-06 Jun-06 Sep-06
NSW/ACT VIC Other
Mortgage concerns have largely been in NSW
(90+ days past due % GLA* by State)
0
5
10
15
20
25
30
35
40
2001 2002 2003 2004 2005 2006
bp
The cycle has turned with higher interest rates & fuel costs impacting some consumers, but 90+ days still
at low levels
90+ days past due as % of GLA*
*Gross Lending Assets

30
Credit card losses result from four key drivers aside from outstandings growth
1
Sep-03 Mar-04 Sep-04 Mar-05 Sep-05 Mar-06 Sep-06Low Rate LoyaltyProprietary Portfolio
¹Cut-off scores are set to maximise risk adjusted revenue(RAR) 3
Credit cards 60+days arrears stable at portfolio level
Source: Annual results 2006
Year 1 Year 2 Year 3 Year 4+
Wri
te-o
ffs
% O
uts
tan
din
gs
Revolver - Higher Credit Costs Medium Credit Costs Transactor - Low Credit Costs
¹Age of accounts: Credit costs generally peak around 18 to 24 months after an account is opened
Note: Inherent credit card losses are in turn inflated/deflated by the economic cycle and the effectiveness of collections activity.
42
50100100Annual growth
5.541Net Losses
2%
3%
1%
2.2%*2.0%1.0%Net Losses % O/S
2--Year 3+ Loss
33-Year 2 Loss
0.511Year 1 Loss
250200100Outstandings ($m)
Year 3+
Year 2
Year 1
¹ Illustrative
Source and channel:
Existing customers have lower losses than new customers
Branch-originated accounts have lower losses than phone and internet-originated accounts

31
ANZ’s losses driven by product mix shift and prior years’outstandings growth
Loss rates likely to increase as low rate balances ‘season’
(Loss Rates by Vintage by Product Index YR1 = 100)
64% 57% 52%
30%26%
24%
6%17% 24%
FY04 FY05 FY06
Loyalty Proprietary Low Rate
Risk mix shift
20% 14%Growth rate
0100200300400500600700
YR1 YR2 YR3 YR4+
Low Rate Proprietary Loyalty
Index
67% 8%11%
14%YR4
+
YR1
YR2
YR3
% Ave. Total O/S Balances
Source: Annual results 2006 Source: Annual results 2006
SUMMARY
• Credit card loss growth due to shift to higher-revolving, low rate products and portfolio seasoning
• Credit quality remains sound. There is no deterioration of loss rates within product segments, year of booking, cut-off score, or channel/source
• To offset the expected impact of a the economic cycle, we are increasing collector numbers and refining collections strategies/tactics
32
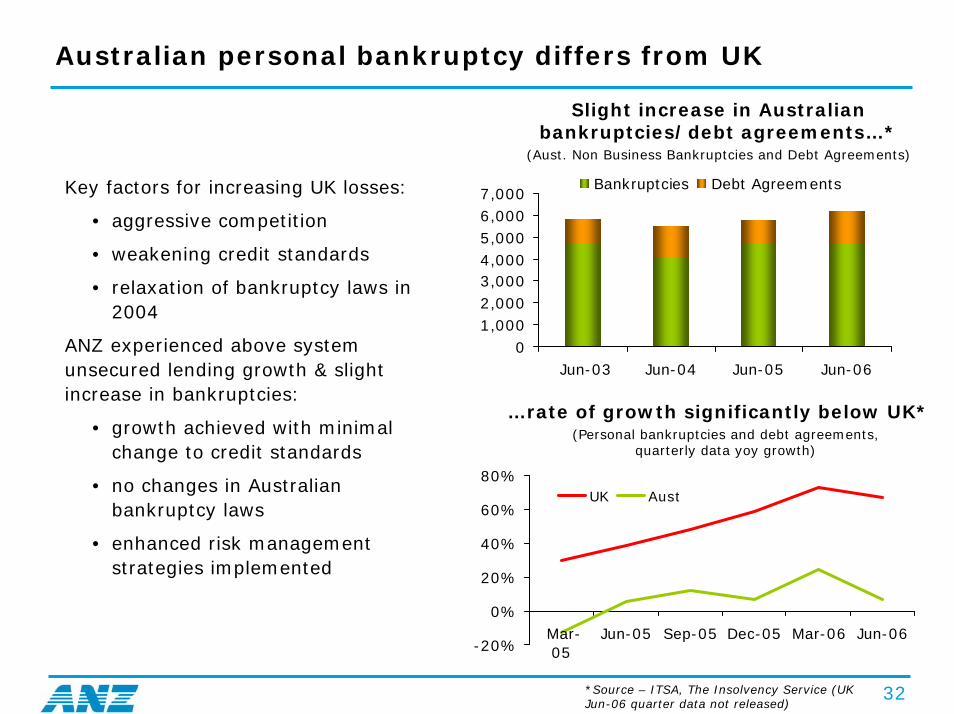
Australian personal bankruptcy differs from UK
Slight increase in Australian bankruptcies/debt agreements…*
(Aust. Non Business Bankruptcies and Debt Agreements)
Key factors for increasing UK losses:
• aggressive competition
• weakening credit standards
• relaxation of bankruptcy laws in 2004
ANZ experienced above system unsecured lending growth & slight increase in bankruptcies:
• growth achieved with minimal change to credit standards
• no changes in Australian bankruptcy laws
• enhanced risk management strategies implemented
…rate of growth significantly below UK*(Personal bankruptcies and debt agreements,
quarterly data yoy growth)
01,0002,0003,0004,0005,0006,0007,000
Jun-03 Jun-04 Jun-05 Jun-06
Bankruptcies Debt Agreements
-20%
0%
20%
40%
60%
80%
Mar-05
Jun-05 Sep-05 Dec-05 Mar-06 Jun-06
UK Aust
*Source – ITSA, The Insolvency Service (UK Jun-06 quarter data not released)

33
The material in this presentation is general background information about the Bank’s activities current at the date of the presentation. It is information given in summary
form and does not purport to be complete. It is not intended to be relied upon as advice to investors or potential investors and does not take into account the investment
objectives, financial situation or needs of any particular investor. These should be considered, with or without professional advice when deciding if an investment is
appropriate.
For further information visit
www.anz.comor contact
Stephen HigginsHead of Investor Relations
ph: (613) 9273 4185 fax: (613) 9273 4091 e-mail: [email protected]