more mathematics into medicine! - zib | zuse institute … · 2009-03-18 · more mathematics into...
TRANSCRIPT
More Mathematics into Medicine!
P. Deuflhard∗, O. Dossel†, A.K. Louis‡, S. Zachow§
March 5, 2009
Abstract
This article presents three success stories that show how the coac-tion of mathematics and medicine has pushed a development towardspatient specific models on the basis of modern medical imaging and “vir-tual labs”, which, in the near future, will play an increasingly importantrole. Thereby the interests of medicine and mathematics seem to be con-sonant: either discipline wants the results fast and reliably. As for themedical side, this means that the necessary computations must run inshortest possible times on a local PC in the clinics and that their resultsmust be accurate and resilient enough so that they can serve as a basisfor medical decisions. As for the mathematical side, this means that high-est level requirements for the efficiency of the applied algorithms and thenumerical and visualization software have to be met. Yet there is still along way to go, until anatomically correct and medically useful individualfunctional models for the essential body parts and for the most frequentdiseases will be at hand. This will only be possible, if more mathematicsenters into medicine.
∗Zuse Institute Berlin (ZIB) and Freie Universitat Berlin, Institute for Mathematics†Universitat Karlsruhe (TH), Institut fur Biomedizinische Technik‡Universitat des Saarlandes, Saarbrucken, Institute for Mathematics§Zuse Institute Berlin (ZIB), Research Group Medical Planning
1

1 Mathematics in Medical Imaging
1.1 History of a success
When Konrad Rontgen discovered the “X-rays” in 1895 in Wurzburg, Germany,he opened a window to non-invasive insight into the human body. The attenu-ation of X-rays is strongly dependent on the tissue through which they travel,for example, bone attenuates more than fat. The thus produced shadow imagesdeliver visual information about the interior of the body. The disadvantage isthat dense tissue like bones masks the tissue along the same path of the X-rays, whence the application was restricted to those parts of the body with fewbones. Examinations of the brain were, due to the surrounding skull, virtuallyimpossible without the dangerous addition of contrast agents.
The conceptual and technical breakthrough was achieved in the sixties: No-bel laureates Allan Cormack and Godfrey Hounsfield suggested an imaging sys-tem, where shadow images of an imaginary cross section through the body andfor many directions are registered simultaneously. Each of these shadow imagescontributes only little information. The exploitation of the fact that all of theseimages cover the same part of the body allowed for images of the interior of thebody with previously unknown resolution. This was the starting point of a longsuccess story.
Computed Tomography (CT). Computed tomography, also known as com-puter assisted tomography (CAT), is the name of an imaging system, where therole of mathematics is evident. With the large number of collected data thecalculation of the desired image information can be achieved only by means ofpowerful computers. Fundamental for the use of computers is the developmentof efficient algorithms, based on a precise mathematical model of the complexconnection between measured data and image information to be determined.The measured data, i.e. the attenuation of the X-ray intensity after travellingthrough the body, is related to the X-ray attenuation coefficient, interpretedmostly as the density of the tissue, along the path of the rays. In mathematicalterms, the observed attenuation is related to the line integral of the X-ray at-tenuation coefficient along the ray path. The arising integral equation is, in the2D case, named as Radon transform, after the Austrian mathematician JohannRadon. In the first commercial scanners, Godfrey Hounsfield solved this integralequation by standard discretization methods. He projected the solution on apixel basis, resulting in large, unstructured systems of linear equations that hesolved iteratively. Only in the mid-seventies the integral equation was actuallyrecognized as the Radon transform, for which Radon had derived an analyticalinversion formula already in 1917.
However, it has been a long way to go from his mathematical formula toworking algorithms, questions to be answered first concerned image resolution,non-uniqueness for finitely many data, and optimization of parameters and stepsizes. In addition, a phenomenon typical for all imaging methods showed up:These problems are so-called inverse problems, where unavoidable input dataerrors, due to photon scattering, beam hardening, or miscounts in the detector,are extremely amplified in the solution. In order to avoid this unwanted effect,the problem has to be regularized, such that a balance between best possibleresolution in the image and maximal damping of the noise is obtained. In the
1

Figure 1: Reconstruction of a trans axial cut through the head. Source: SiemensHealthcare, SOMATOM Definition AS+.
case of CT this is achieved by elimination of the high frequency components inthe data. Nowadays, the method developed by the mathematicians Shepp andLogan [17] is well established. The resulting algorithms consist of two steps, afiltering of the data, via discrete convolution in the two-dimensional applicationor via Fourier techniques in higher dimensions, and a backprojection of thefiltered data onto the reconstruction region. Both steps can be performed inparallel during the measuring process, resulting in a dramatic gain in computertime. It is worth mentioning that the acceleration of computing time due tothe progress of mathematical algorithms is much higher than the one due to theprogress in computer hardware.
Of course, the advancement of engineering performance should be mentioned,which allowed for an essential speed-up in time and accuracy of the measure-ment process. This led to completely new scanning geometries and thus to newchallenges in mathematics. The originally introduced parallel geometry, whereone path was measured at a time instance, was replaced by fan-beam geometries,where, at one time instance, the complete plane under consideration was cov-ered by a set of divergent beams. The helical scan, where the patient is movedthrough the gantry, first realized with a few detector lines, was established inthe early nineties. Today real 3D scanning with a detector array is the objectof intensive research, already widely used in non-destructive material testing.The mathematical model remains to be line integrals over the paths of the rays.The thus computed reconstructions are often processed in order to enhance thediagnosis. Methods, wherein parts of the image process steps are integratedparallel to the reconstruction method are presently under development. Amongthe pioneers from the mathematical side are Gabor Herman, Kennan Smith,or Frank Natterer. An extensive presentation can be found in Natterer’s mostrecent monograph [15].
Magnetic Resonance Imaging (MRI). Magnetic resonance spectroscopy,1946 independently developed by Felix Bloch and Edward Purcell, gives informa-tion on the chemical surrounding in a molecule, by exciting it to resonance in astrong magnetic field. This was the starting point for magnetic resonance imag-
2

ing (MRI, formerly called nuclear magnetic resonance (NMR)). Paul Lauterbur,Nobel laureate for medicine in 2003, achieved a spatial resolution by modulatingthe primary homogeneous magnetic field by so-called gradient fields in such away that the regions of constant resonance frequency became planes throughthe body. In that way, plane integrals over the proton distribution inside thebody were measured. The corresponding mathematical model is the 3D Radontransform [14]. In the early eighties there were no desktop computers avail-able, allowing for handling these huge data sets within tolerable time. PeterMansfield, Nobel laureate as well in 2003, further developed gradient fields andexcitations such that the Fourier transform could be used to invert the data.The regularization, already discussed above in the context of X-ray CT, wasachieved by eliminating the high frequency components. In that way, with hightechnical complexity, the mathematical problem had been simplified to be solv-able with the computers of that time.
Figure 2: Reconstruction und visualization based on MRI-data. Source:Siemens Healthcare, Sektor Magnetresonanztomographie, MAGNETOM Verio3T.
Ultrasound. This imaging technique has been used in medicine for quite atime. Well established are B-scan devices, acting as emitter and receiver atthe same time sending ultrasound waves into the body. Measured are traveltimes of the echoes, which are produced at interfaces of tissues with differentacoustic impedance and scattering properties. Upon assuming that the speedof sound is independent of the tissue an image can be computed. Even thoughthis is only approximately correct, nevertheless the images contain sufficientdiagnostic information. If, in addition, the frequency shift is recorded, thenusing the Doppler effect, the speed of blood can be calculated.
1.2 Mathematics as innovation factor
For many years, medical industry worldwide has played an internationally lead-ing economical role. The following numbers may document this statement for
3

Germany. In 2002, commodities in X-rays & CT for over 2 Billion Euro havebeen produced. The German trade surplus with respect to X-rays and CT fig-ures around 1 Billion Euro, around 600 Mio. Euro for MRI systems.1. Leadingcompanies in Germany are Siemens Medical Solutions, but also Phillips HealthCare and General Electric. A main location factor seems to be well-trainedapplied mathematicians and engineers with a sound understanding of mathe-matics.
1.3 Perspective: new imaging methods
The perspective in medical imaging is dominated by the development of newermeasuring technologies.
3D tomography. In non-destructive material testing, 3D X-ray CT is widelyused in connection with a circular scanning geometry; i.e., the X-ray tube ismoved on a circle in a plane around the examined object with the detectorplane positioned at the opposite side. Helical geometry is favoured in medicalapplications, but the therein necessary variable shift of the patient has not beensolved yet satisfactorily in existing algorithms. In principle, X-ray tube anddetector can be moved along arbitrary trajectories around the patient. Thedetermination of trajectories that are optimal with respect to resolution andstability remains a mathematical challenge. Higher hardware capacities willallow for new approaches different from the classical filtered backprojectiontype.
Figure 3: Three-dimensional visualization of two-dimensional CT scans througha human heart. Source: Siemens Healthcare, Sektor, Computertomographie,SOMATOM Definition AS+.
4D tomography. Since the early eighties, 3D spatial presentations have beencomputed from a series of 2D images. If one combines these volumetric imagesfor different instances, clearly time enters as a fourth dimension. The resultingmovies, for example from a beating heart, are impressive: Figure 3 is a snap-shot from such a movie. Certainly, it will take some time to develop this kind
1foreign trade statistics of OECD and German Ministry of Education and Research
4

of technique for routine application. At present, each image frame is treatedseparately, a regularization with respect to time, as would be necessary, e.g., incurrent intensity reconstruction from MEG/EEG data, is not yet implemented.
Electron paramagnetic resonance imaging. In this technique a decou-pling of the fourth dimension is not possible, since there, besides the three spa-tial dimensions, a spectral dimension shows up additionally. The correspondingmathematical model is the Radon transform in four dimensions. This technol-ogy is presently studied in the stages of pharmaceutical research and animalexperiments. However, due to the limitations in field strength, the data inRadon space cannot be sampled completely with the consequence that a lim-ited angle problem has to be solved. Theoretically, the desired distributionwould be uniquely determined, if all data in the restricted range were available,but instabilities and strong artefacts complicate the reconstruction problem.
Ultrasound CT. In this approach sender and receiver are spatially sepa-rated, the corresponding mathematical model is an inverse scattering problemfor the determination of the spatially varying sound impedance and the scat-tering properties. The difficulty here is that, in contrast to CT, the paths ofthe waves depend upon the variable to be computed, which makes the problemhighly nonlinear. A linearization of the problem via Born or Rytov approxima-tion neglects the effects of multiple scattering and is therefore not sufficientlyaccurate. That is why ultrasound tomography today is still a challenge to math-ematics and algorithm development.
Transmission electron microscopy (TEM). For the visualization of biomo-lecules by TEM, various approaches are pursued. If one does not aim at aver-aging over many probes of the same kind, again a limited angle problem arises.In addition, wave phenomena enter for small sized objects, leading, as in ul-trasound tomography, to nonlinear inverse scattering problems. Fortunately,linearization is feasible here, which facilitates the development of algorithmssignificantly.
Phase contrast tomography. In this technology, where complex-valued sizeshave to be reconstructed, linearizations are applicable, too. The phase suppliesinformation even when the density differences within the object are extremelysmall. Using data from a synchrotron, impressive results have been achieved,see Figure 4. Due to different scanning geometries, medical application stillgenerates challenging problems for the development of algorithms.
Diffusion tensor MRI. This method provides a tensor at each reconstructionpoint, thus bearing information concerning the diffusivity of water moleculesin tissue, see Figure 2. Here reconstruction and regularization are performedseparately. Only after having computed the tensors, properties of the tensorlike symmetry or positive definiteness are produced point by point.
The above list of imaging techniques under present development is by nomeans complete. Methods like impedance tomography are studied as well asthose applying light to detect objects close to the skin. In all of the mentionedmeasuring techniques, the technological development is so advanced that the
5

Figure 4: Phase contrast tomography: phase information, see [9].
solution of the associated mathematical problems – like modelling, determina-tion of achievable resolution and development of efficient algorithms – will yielda considerable innovation thrust.
Image fusion. Different imaging systems supply different kinds of informa-tion, the fusion of which in a single image can give a lot more insight to thephysician. Prerequisite of image fusion is an imaging of (almost) identical crosssections through the body or of volumetric presentations. Different physicalformats have to be mapped to each other. This requires methods of imagerecognition, for example segmentation (see Section 3), to determine the geo-metric mappings. First methods exist, partially applied in connection with therapidly developing intensity modulated radio therapy (IMRT).
0.5
1
1.5
2
2.5
3
3.5
4
4.5
0.5
1
1.5
2
2.5
3
3.5
4
4.5
Figure 5: Comparison of image analysis methods, see [13]: Left: Integrated inthe reconstruction algorithm. Right: Performed separately, as usual so far.
Feature reconstruction. Supporting medical doctors in the interpretationof the ever increasing amount of information is an extremely important task.
6

In non-destructive testing in materials science, where tomographic methods areapplied as well, tools for an automatic recognition of precisely defined proper-ties are in use, such as the detection of blow holes inside metal. In medicalapplications, this surely is not the aim at the moment. Nevertheless, a prepro-cessing of images is often useful. At present, the two steps, reconstruction andpre-processing, are performed separately. In [13], a novel technique has beenpresented, wherein the pre-processing step is optimally integrated into the re-construction algorithm. In this way, significantly refined results can be realized,as shown in Figure 5. Nearly without any additional effort both the classicalreconstruction and the enhanced images can be computed. This approach ofcombining image reconstruction and image analysis paves the way for featurereconstruction.
2 Mathematics in Cardiology andCardial Surgery
2.1 Success stories: ECG and biosignal processing
Everyday some million Electrocardiograms (ECGs) are recorded, many of themHolter ECGs (long term ECGs). A single 24h ECG contains about 100 000heart beats. It is practically impossible that a medical doctor can look throughall these data to filter out events of diagnostic relevance. Not only that precioustime would be lost, in addition there is the danger that alertness drops quitefast and important events are overlooked.
Telemedicine is an important future market – currently many companiesposition themselves in the market. Sportsmen and elderly people can buy acontinuous monitoring of their state of health – 24 hours per day and 7 daysper week. In addition to the ECG often also other vital health parameters aremeasured, like weight, body temperature, blood oxygen saturation etc. Alsoin this case it is neither practical nor would it be affordable that physiciansmonitor all these data.
A solution is offered by software packages that support the medical doctorin ECG data analysis. With their aid the essential characteristics of the ECGare revealed and the most important parts of the data stream are highlighted.During monitoring in the intensive care unit of the hospital or in Telemedicine, alife threatening state of the patient must be detected immediately and with highreliability and an alarm must be given. But which algorithm is able to performthis data analysis with the highest possible reliability? These algorithms must beapplicable to all (!) ECGs, even if the ECG of an individual patient is extremelyseldom and strange. And they must be very robust, since often artefacts aremuch larger than the biosignals of interest.
Today mathematical methods together with the implemented software areindispensable tools for good biosignal analysis. Companies of medical systemshave recognized that the added value in the production chain for ECG and mon-itoring systems is only to one half due to hardware (e.g. in electronics). Theother half comes from intelligent signal processing and analysis. Suppression ofartefacts is carried out using filters in the frequency domain, but also wavelettransformation is applied, since it allows for best possible frequency separationsimultaneously with good temporal resolution. Detection of data intervals of
7

diagnostic relevance is realized by first extracting characteristic features usingmathematical methods followed by a mathematical classification (nearest neigh-bor, Bayes-maximum-likelihood, neural networks etc.). This way, e.g., a QRScomplex can be separated from an extrasystole [18]. Also model based tech-niques like Kalman filters or Markov models are employed. Figure 6 shows atypical ECG, as can be found in long term ECG acquisitions, together with theannotation of the most important time instants like the R-peak, the P-wave, orthe T-wave.
Figure 6: Measured ECG together with the result of a computer assisted anno-tation of the most important time instants [11].
For an early detection of trends in the ECG, new mathematical methods oftime series analysis are employed. Using these methods, stochastic fluctuationscan be separated from deterministic ones and significant changes can be uncov-ered long before the eye of the medical doctor can find it in the ECG. Currently,one is trying to find mathematical rules (linear and non-linear ones) that areable to predict the ECG of the next beat from the preceding ones. Once theserules will have been found, the detection of any deviation is an indication to anearly stage of a disease. This research is right in the centre of the mathematicalfield of “complex dynamical systems” that will enable to detect many charac-teristics of diagnostic relevance in the ECG. For example, most often stabletrajectories can be found in the state space of the heart, but sometimes theypass through bifurcations into chaos (like fibrillation [5]).
2.2 Mathematics as innovation factor
In medical engineering in general and in cardiology and heart surgery in par-ticular it is of increasing importance to recognize the essentials out of a hugeamount of information about a very complex system, and to draw the rightconclusions. Algorithms and computers can help in this task. By no meansit is planned to replace the medical doctor by a computer. But the computerwith its implemented algorithms can already today give valuable advice to thephysician and this trend will continue and gain relevance.
In the first stage, algorithms can highlight or zoom into information con-tained in the data that cannot be recognized with the naked eye: small changesof the ECG, unusual objects in the images, characteristic deviations of haema-tological data etc. In the second stage, values of diagnostic importance aredetermined quantitatively. Often the decision to choose one or another line of
8

therapy depends on whether a specific value is above or below a given thresh-old. Using mathematical methods these values can be found as accurately aspossible even in disturbed and noisy data. Finally, mathematical methods canbe employed to optimize therapy by trying out various variants and evaluatethe outcome using objective and traceable criteria.
In future, it will be decisive for manufacturers of medical devices to integratethe huge amount of patient data into a comprehensive view in an intelligent wayand to support the medical doctor in his/her diagnosis and therapy decision.Only companies that can offer these options will play a major role in the futureworld market.
2.3 Perspective: the virtual heart
Integration of imaging, electrophysiology, and in-vitro diagnostics.The ECG described above is an important source of diagnostic information forthe physician, but by far not the only one: Medical images and in-vitro diag-nostics like, e.g., haematological data are indispensable additional sources ofinformation. Mathematical methods will play a major role in integrating allthese data into a comprehensive picture about the state of the patient. Purelygeometrical information of the medical images like projection X-ray, CT, ultra-sound or MRI is complemented by functional data. Some of these functionaldata can be gained from medical imaging devices: metabolism, e.g., from PET,flow, e.g., from Doppler ultrasound, or perfusion, e.g., from contrast enhancedX-ray. In the next step, other data have to be integrated like, e.g., ECG, bloodpressure, blood oxygen saturation, haematological data, and enzyme activitiesand, on the long run, also genetic profiles that show up a predisposition fora disease. The objective is to integrate all these data into a complete patientmodel so that finally important functional characteristics can be determined.(For readers with medical and physiological knowledge: such functional char-acteristics are, e.g., elasticity, contractility, propagation of electrophysiologicaldepolarization, perfusion, enzyme activity, etc.)
Such an integrated heart model, a virtual heart, can depict how the realheart of the patient deviates from the physiological average. This opens manynew options both in diagnosis and therapy planning.
Therapy Planning. Mathematical models of heart and circulation have manyinteresting applications in cardiology and heart surgery.
Upon using electrophysiological models, it will be possible to
• optimize RF ablation for atrial fibrillation,
• adapt stimulation sequences for heart pacemaker and cardiac resynchro-nization therapy,
• predict the effect of new pharmaceutical drugs for the treatment of ar-rhythmias.
9

Upon using elastomechanical models, it will be possible to
• optimize surgical cuts in open heart surgery for therapy of aneurysms andfor surgical reconstruction of ventricles,
• evaluate the elastomechanical consequences of an infarction.
Using fluid dynamical models of vessels one can
• better understand the etiology of stenoses (plaque in a blood vessel),
• optimize stents to open stenoses and to treat aneurysms.
Using circulation models it will be possible to
• evaluate new drugs to treat hypertension (high blood pressure),
• control extracorporal circulation during heart surgery.
For the purpose of further explaining these options, one of them is highlightedin the following.
Planning of RF ablation at atrial fibrillation. RF ablation means theprecise destruction of cells (often tumour cells) by feeding a radio frequencycurrent into the tissue. Using an image guided catheter the tissue is heatedlocally above 42◦ C so that the proteins are coagulated in an area near to the tipof the catheter. A well-defined scar is created. This therapy is also a preferredchoice in case of atrial fibrillation.
Electrophysiological computer models of the heart start with the various ionchannels in the membrane of cardiac cells. The dynamics of ion channels canbe described by “stiff” ordinary differential equations. Their rate constants area function of the transmembrane voltage [6]. Single cells lead to a nonlinearsystem of about 20 coupled differential equations. The spatial coupling of thecells is modelled by partial differential equations, e.g., in the so-called “bidomainmodel” [7]. As eventually electric potentials in the body are to be determined,basically the equations of electromagnetic field theory have to be applied. Elec-trophysiological processes in the human body are comparably slow, which is whyonly the Poisson equation of electrostatic problems - an elliptic partial differen-tial equation - has to be solved. Numerical simulation of these equations requiresthe discretization of space and time. In biomedical engineering, an explicit Eulerdiscretization is preferred up to now, [6], whereas the mathematical communityapplies stiff integrators as a standard (see [1] and references therein). Here isspace left for improvement via mutual exchange of methods and ideas. Spatialdiscretization is carried out, e.g., by finite element methods - with uniform oradaptive meshes - or by finite differences. In case of uniform discretization aproblem with some million degrees of freedom has to be solved, preferably inthe clock pulse of a second. Also the so-called “forward problem”, which is usedto find the electric signals on the body surface (including the ECG) from theelectric source distributions in the heart, leads to a Poisson equation. Figure 7(top row) shows a simulation of the depolarization of a healthy human atrium:the electric depolarization starts in the sinus node, the natural “pace maker” ofthe heart, and then spreads out across the right and left atrium.
10

Next we present details of the modelling of pathologies, here especially ofatrial fibrillation. For this application, new parameters have to be assigned tothe atrial tissue that are able to describe the pathological case. In this case, thecomputer model switches into a chaotic state so that patterns of depolarizationcan be observed in the model which amazingly well resemble the patterns ob-served in real patients that actually suffer from atrial fibrillation. A more andmore applied therapy now is to heat small spots on the atrial tissue in such away that a scar is formed, which then will not conduct the excitation furtheron(this is the RF ablation, see bottom row of Figure 7). This procedure can easilybe implemented in a computer model.
Figure 7: Simulation of the spread of depolarization in the human atrium.Transmembrane voltages at different time instants of depolarization, see [16].Top row: healthy atrium. Center row: atrial flutter. Bottom row: test of anablation therapy.
11

An important, but still open question is how to find the optimal strategyfor RF ablation. What would be the best choice of ablation points and linesin the atrium so that fibrillation is terminated reliably using as little scar aspossible and, in addition, protecting the patient from flaring up of the disease?Computer models can indeed answer this question by testing different strategiesin the virtual atrium. With a “reset” the virtual atrium can be switched backto the original situation and a new test can be started. This is obviously notpossible in real patients. A scar that has been burnt into the atrium cannot beremoved again!
The above sketched method for optimization of RF-ablation has not beentransferred to clinical practice yet. Validation requires still many more exper-iments. The biggest challenge will be to adapt the computer model to theindividual patient using measurements (images and electrical data) to derive apatient-specific ablation strategy. A bottleneck on the way towards this goalare also algorithms for the computation of cell models and the field equations:Here new mathematical methods are needed to speed up the whole simulationprocess – so as to “catch up” with the heart dynamics.
3 Mathematics in Therapy andOperation Planning
In recent years, mathematics has gained an increasingly important role in med-ical planning. Palpable successes have been achieved in the cancer therapyhyperthermia as well as in cranio-maxillo-facial (CMF) surgery, liver surgery,and orthopaedic surgery.
3.1 Success story: CMF surgery
Problem formulation. A “beautiful” face has demonstrably social advan-tages. But the contrary occurs, when a face has been malformed from birthon or by an accident (cf. Figure 8). In CMF surgery, bony structures of theskull are operatively corrected with the aim of both functional and aestheticreconstruction.
Figure 8: Patients with congenital malformations [4].
Success by mathematics. Already since the early 90’s, computer scientistshave dealt with computer assisted 3D planning of cranio-maxillo-facial oper-ations on the basis of CT data (see [21] and references therein). Meanwhilemathematics, too, plays a crucial role in the planning of highly complex opera-tions. Its most important tools appeared to be virtual labs for therapy and op-eration planning [2]; this term describes extensive software environments (such
12

Figure 9: Comparisons of two patients: before operation, after operation, over-lays with predictions [22].
as, e.g., AmiraTM[19]), within which patient specific geometric models are inte-grated with partial differential equations for elastomechanics, fluid dynamics, ordiffusion as well as with fast algorithms for their numerical solution and visu-alization. Today, before the surgeon performs his first cut, reliable predictionsabout the postoperative appearance can be made. For the purpose of illustra-tion, Figure 8 shows a series of patients whose operation planning has been donein cooperation of clinics and ZIB. In Figure 9, a comparison of the computedpredictions and the actual outcome of two operations is given [21].
3.2 Mathematics as innovation factor
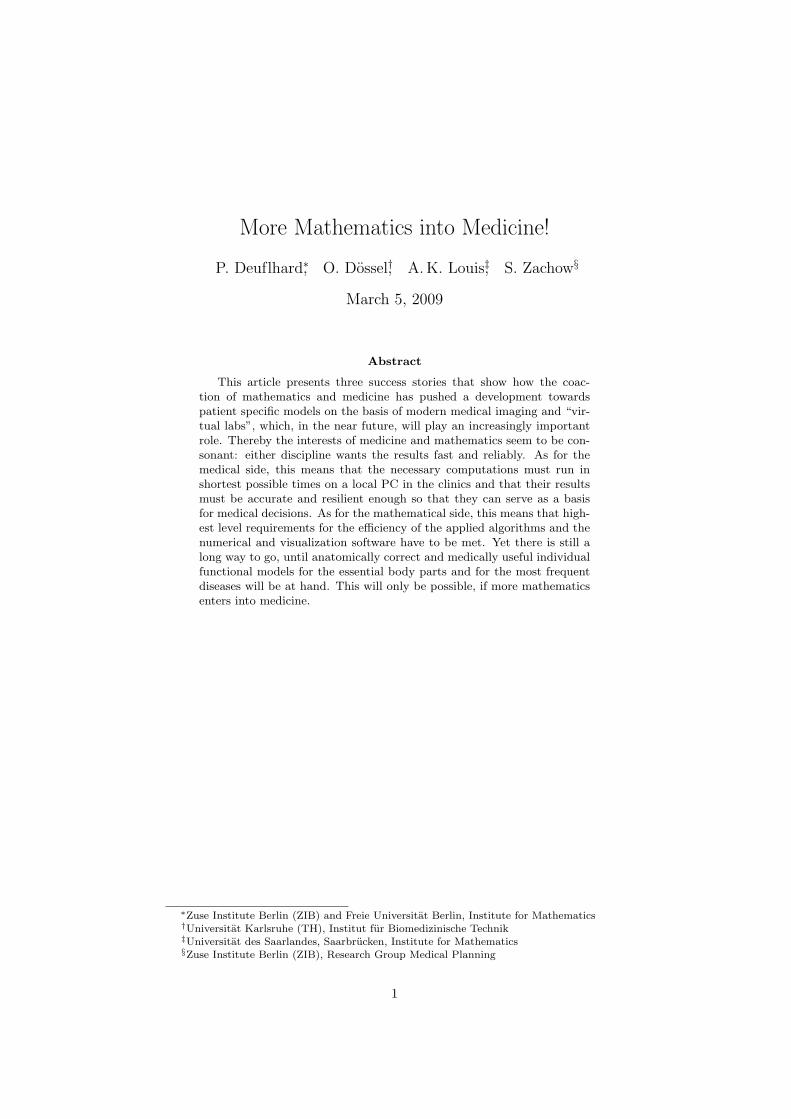
In the course of many years of collaboration between mathematics and medicine,a paradigm has crystalized that might be characterized as follows: (see Fig-ure 10):
• Generation of a “virtual patient” from data of the real patient,• mathematical therapy and operation planning in a “virtual lab”,• transfer of the results back to the situation of the real patient.
The first step requires the construction of a sufficiently accurate 3D computermodel of the patient from medical imaging data. The second step contains thefast numerical solution of partial differential equations over a realistic bodygeometry of the individual patient. The third step comprises techniques ofregistration and navigation for an exact implementation of the planning. Allsteps have the importance of an efficient 3D visualization in common. Thecorresponding mathematics and computer science is not treated here in depth;for intested readers, we refer to the papers [4, 21, 22].
On the way from the real to the virtual patient a sequence of sub-steps hasto be taken, which contain a lot of mathematics themselves.
Geometric modelling [23]. Tomographic imaging (cf. Section 1) yields astack of 2D planar cross sectional images. However, any therapy planning willabsolutely require 3D models of the individual anatomy. For this reason, meth-ods need to be provided, which generate a reliable geometric 3D patient modelfrom this kind of 2D information.
As the first task therein, segmentation is incurred, whereby the organic sub-structure is to be derived from the pure density information of CT or MRTimages by classification of image subdomains. This substructure is one of thecrucial prerequisites of functional patient models. Methods available until a few
13
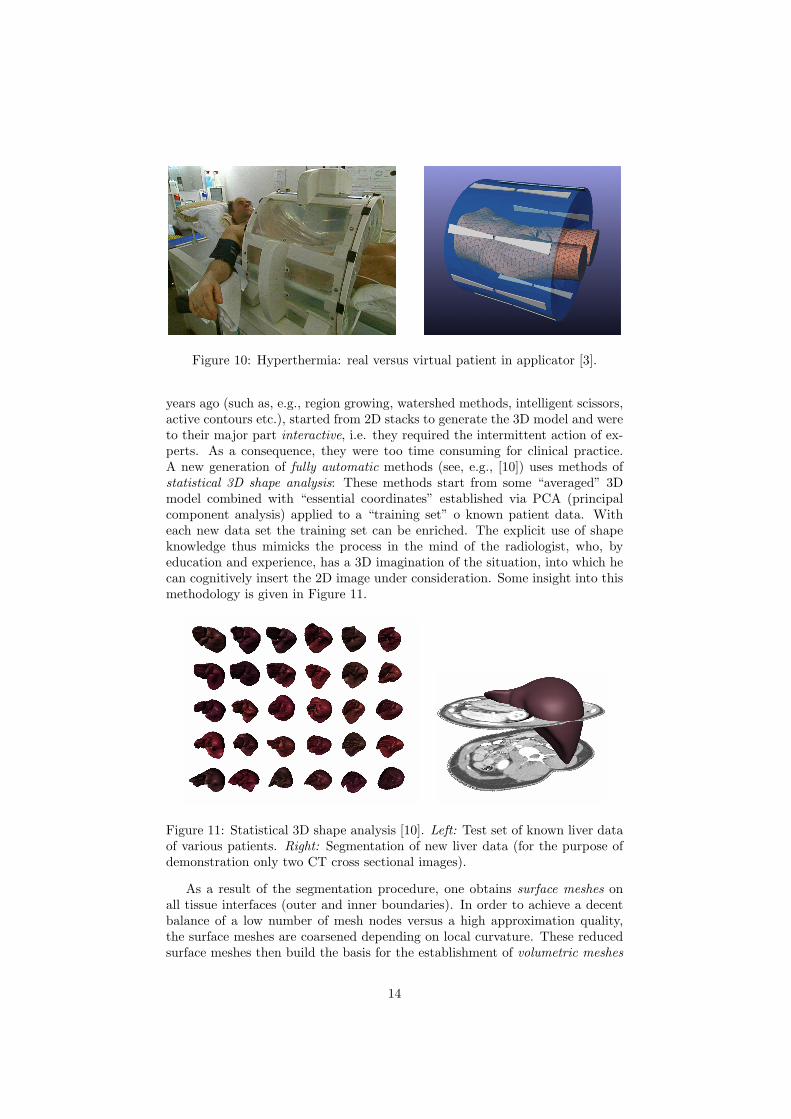
Figure 10: Hyperthermia: real versus virtual patient in applicator [3].
years ago (such as, e.g., region growing, watershed methods, intelligent scissors,active contours etc.), started from 2D stacks to generate the 3D model and wereto their major part interactive, i.e. they required the intermittent action of ex-perts. As a consequence, they were too time consuming for clinical practice.A new generation of fully automatic methods (see, e.g., [10]) uses methods ofstatistical 3D shape analysis: These methods start from some “averaged” 3Dmodel combined with “essential coordinates” established via PCA (principalcomponent analysis) applied to a “training set” o known patient data. Witheach new data set the training set can be enriched. The explicit use of shapeknowledge thus mimicks the process in the mind of the radiologist, who, byeducation and experience, has a 3D imagination of the situation, into which hecan cognitively insert the 2D image under consideration. Some insight into thismethodology is given in Figure 11.
Figure 11: Statistical 3D shape analysis [10]. Left: Test set of known liver dataof various patients. Right: Segmentation of new liver data (for the purpose ofdemonstration only two CT cross sectional images).
As a result of the segmentation procedure, one obtains surface meshes onall tissue interfaces (outer and inner boundaries). In order to achieve a decentbalance of a low number of mesh nodes versus a high approximation quality,the surface meshes are coarsened depending on local curvature. These reducedsurface meshes then build the basis for the establishment of volumetric meshes
14

by tetrahedrons (see [23] and references). Such types of meshes are particularlywell-suited for successive refinement – a feature that is crucial in connection withadaptive multigrid methods for the fast solution of partial differential equations.
Example: osteotomy planning [21]. Osteotomy means the surgical cuttingof bone. This part of the planning primarily aims at functional rehabilitation.Whenever several bone segments are involved, which need to be arranged inmutual relationship, or when different therapy variants come into play, then theexpected aesthetic outcome will be an important criterion to be taken into ac-count in the planning. A variety of different operation strategies can be plannedin the computer with respect to cost efficiency and to surgical safety, in partic-ular for complex bone dislocations. The simulation of the associated soft tissueappearance permits an assessment of relocations of the upper and lower jaws inview of aesthetics. Basic for a reliable prognosis of facial appearance after theintended arrangements of bone structures is, on one hand, an adequate geomet-ric model of the tissue volume with all embedded structures and neighboringbone boundaries, and, on the other hand, a physical deformation model thatdescribes the mechanical properties of biological tissue in acceptable approxi-mation.
Already with the geometric model alone important tasks in medicine can beperformed, such as
• the localization of a tumor for the purpose of an exact planning of surgicalopenings or radiological measures,
• the selection of a patient’s hip, knee or tooth implant and its precise im-plantation into the body,
• a better planning of the relocation of some bone to be performed by com-puter assistance and navigation techniques.
On the way from a geometrical to a functional model some more mathemat-ical steps are necessary, which will be presented in the sequel.
Mathematical modelling and simulation. A functional patient modelcomprises, beyond the geometrical model, additionally a sufficiently accuratemathematical-physical description, mostly via partial differential equations. Forillustration purposes, let us mention a few: the Lame-Navier equations for linearelastomechanics and its nonlinear generalizations (geometry and material prop-erties) in biomechanics, Maxwell’s equations and the bio-heat-transfer equationin the cancer therapy hyperthermia, the Navier-Stokes equations for the anal-ysis of fluid motion in the context of plaque building in blood vessels and inaneurysms. Whenever the required answers to the questions from medicine al-low, then simpler, so-called reduced models will do. Generally speaking, math-ematical models are only useful, if their input parameters have been analyzedwith respect to their sensitivity.
A typical feature of medical models is their multiscale structure: The mathe-matical equations express relations between microscopic spatial dimensions andour everyday life dimensions. By intruding sufficiently deep into the mathemat-ical description, we obtain a whole hierarchy of scales to be taken into account,depending on the problems in question. An illustrative example is given by the
15

international project Physiome [8], which spans scales from nm (molecules) viamm (tissue) up to m (organs).
Virtual labs. The partial differential equations arising in the model must besolved numerically fast and reliably and, in view of clinical application, embed-ded in a 3D visualization environment, a “virtual lab”. As for the simulation ofthe mathematical models, the aims of mathematics and medicine are in accor-dance: Both disciplines want the solution in 3D, within short computing timesand with reliable accuracy. Only, if these requirements are met, a mathemat-ical therapy or operation planning can hope to be accepted in the clinics andserve as a basis for responsible medical decisions. Among efficient algorithmsavailable are: (a) domain decomposition methods for fixed meshes in connectionwith parallelization or (b) multigrid methods in combination with adaptivity inspace and time.
Example: hyperthermia [2]. Upt to now, research in regional hyperthermiahas been restricted for ethical reasons to the treatment of deeply seated, non-operable tumors, i.e. to hitherto hopeless cases. The aim of this treatment is toheat cancer cells locally thus sensitizing them to radio or chemotherapy withoutdamaging healthy tissue by too high temperatures. In Figure 10, the settingof the method is shown. The patient is positioned in an applicator with (here)eight antennas that emit radio waves into the body. The heat inside the bodyis generated non-invasively. By separate control of the individual antennas, theinterference field can be adjusted to each individual patient, to locally applyhigh thermal energy to the tumor region only. The scientific question is: Howshould the antennas be tuned (in terms of amplitudes and phases) such thatthe tumor is heated within a temperature window between 42,5◦ and 45◦ C,but no healthy tissue. The impact of the different tuning parameters on thetherapeutically effective temperature distribution is so complex that optimaltherapy plans can be determined only via numerical simulation. The associatedfunctional patient model here comprises Maxwell’s equations for the descriptionof the electric fields and the bio-heat-transfer equation which governs the heatdistribution inside the body.
Figure 12: Hyperthermia: adaptive hierarchical spatial meshes (ZIB).
16

In order to illustrate the importance of spatial adaptivity, we show, in Fig-ure 12, an actually generated mesh for the solution of Maxwell’s equations: Withspace adaptivity we obtain about 120.000 nodes, whereas uniform meshes wouldhave required an estimated number of 16.000.000 nodes. The applied multigridmethods require computing times proportional to the number of nodes, whichimplies that adaptive methods are about a factor of 130 faster – in this medicallyrelevant example and at a comparable accuracy!
Example: soft tissue simulation [4]. In cranio-maxillo-facial surgery themathematical model consists of the biomechanical differential equations. Theyare to be solved numerically (by efficient multigrid methods) to permit a reliableprediction of the postoperative facial appearance – assuming the operation wentwell as planned. The present standard of prediction is represented in Figure 9at two examples [21]; the presently achievable prediction quality is already ex-cellent. Apart from the improved operation preparation, this kind of computerassisted operation planning including the soft tissue prognosis leads to an im-proved patient information and thus eventually to a higher patient motivation,see Figure 13.
Figure 13: Patient preparation by the virtual lab [22].
3.3 Perspective: the virtual patient
Beyond the described medical applications, mathematics (including computerscience) already today provides extensive methods to accompany therapy andoperation planning. On an intermediate time scale, it would be reasonable toopen more space in public health to mathematics. The following lines of devel-opment can be foreseen:
Radiology will more and more move on from mere 2D image interpretation to3D model reconstruction. This requires substantial “screening” of individual im-age data by means of automated segmentation techniques. The correspondingincrease of patient specific data will lead to a twofold development: (a) the build-up of centralized medical data bases in large hospitals, and (b) a population-wideintroduction of (only personally disposable) individual data carriers (the “elec-tronic patient”). Google-med may be a possible format of storing such data; it
17

will, however, need to be modified due to national differences in health organi-sations and mentality as well as with respect to its non-guaranteed security ofindividual data.
Central archives (such as PACS, S-PACS) will, apart from individual data,store general geometrical anatomy models on the basis of statistical shape mod-els, i.e. via mean anatomical shapes (averaged over local populations) includingessential coordinates that describe the variability of the underlying patient sets.In addition, mathematical functional models will be stored, i.e. mathematicaldescriptions of functions of organs or of moving parts of the skeleton via multi-scale models to be differentiated further. Provokingly, the function of an organwill not be fully understood, before it has been expressed by a realistic mathe-matical model covering both the healthy and the unhealthy case.
Both the legal and the order political frames will have to be clarified. Radi-ologists will certainly continue to bear the legal responsibility for the correctnessof the interpretation of medical image data and the therefrom derived anatomi-cal models. However, in countries like Germany, insurance companies will needto include model assisted planning on the basis of geometrical 3D models andmathematical functional models into their catalogue of financially supported ser-vices. Apart from medical indication, the new kind of planning tools is useful inview of an improved patient information as well as of education, documentation,and quality assurance.
4 Vision and options
This article has shown, at selected examples, how the coaction of mathematicsand medicine has pushed a dynamic development towards patient specific mod-els (“virtual heart” in Section 2, “virtual patient” in Section 3) on the basisof modern medical imaging techniques (Section 1). This development will cer-tainly expand in the near future. However, there is still a long way to go, untilanatomically correct and medically useful functional models will be availableeven for the most essential body parts and the most frequent diseases. Withinthe German funding system, the corresponding research will, on a quite longrun, remain dependent on public funding. In any case, political frames in healthand research will need to be adjusted in close cooperation with selected medicaldoctors, engineers, and – mathematicians!
18

References
[1] P. Colli Franzone, P. Deuflhard, B. Erdmann, J. Lang, L. F. Pavarino:Adaptivity in Space and Time for Reaction-Diffusion Systems in Electro-cardiology. SIAM J. SISC., Vol. 28, No. 3, pp. 942-962, 2006.
[2] P. Deuflhard: Differential Equations in Technology and Medicine: Compu-tational Concepts, Adaptive Algorithms, and Virtual Labs. In: R. Burkhard,P. Deuflhard, A. Jameson, J.-L. Lions, G. Strang (eds.): ComputationalMathematics Driven by Industrial Problems. Springer Lecture Notes inMathematics, vol. 1739, pp. 70-125, 2000.
[3] P. Deuflhard, R. Hochmuth: Multiscale abnalysis of thermoregulation in thehuman microvasular system. Math. Meth. Appl. Sci., vol. 27, pp. 971-989,2004.
[4] P. Deuflhard, M. Weiser, S. Zachow: Mathematics in Facial Surgery. No-tices of the AMS, vol. 53, no. 9, pp. 1012-1016, 2006.
[5] O. Dossel: Kausalitat bei der Entstehung, der Diagnose und der Therapievon Krankheiten – aus dem Blickwinkel des Ingenieurs. Kausalitat in derTechnik, Berlin-Brandenburg. Akad. Wiss., pp. 69-80, 2006.
[6] O. Dossel, D. Farina, M. Mohr, M. Reumann, G. Seemann: Modelling andimaging electrophysiology and contraction of the heart. In.: T. M. Buzug,D. Holz, S. Weber, J. Bongartz, M. Kohl-Bareis and U. Hartmann (eds).Advances in Medical Engineering, Springer, pp. 3-16, 2007.
[7] C. S. Henriquez, A. L. Muzikant, C. K. Smoak: Anisotropy, fiber curva-ture, and bath loading effects on activation in thin and thick cardiac tissuepreparations: simulations in a three-dimensional bidomain model. J. Car-diovascular Electrophysiology, pp. 424-444, 1996.
[8] P. J. Hunter, T. K. Borg: Integration from proteins to organs: the Physiomeproject. Nature Rev., Mol. Cell Biology, vol. 4. pp. 237-243, 2003.
[9] P. Jonas, A. K. Louis: Phase contrast tomography using holographic mea-surements. Inverse Problems, vol. 20, pp. 75-102, 2004.
[10] D. Kainmuller, Th. Lange, H. Lamecker: Shape constrained automatic seg-mentation of the liver based on a heuristic intensity model. In: T. Heimann,M. Styner, B. van Ginneken (eds.). Proc. MICCAI Workshop 3D Segmen-tation in the Clinic: A Grand Challenge, pp. 109-116, 2007.
[11] A. Khawaja, O. Dossel: Predicting the QRS complex and detecting smallchanges using principal component analysis. Biomed. Technik, pp. 11-17,2007.
[12] A. K. Louis: Medical Imaging: State of the Art and Future Development.Inverse Problems, vol. 8, pp. 709-738, 1992.
[13] A. K. Louis: Combining Image Reconstruction and Image Analysis with anApplication to Two-dimensional Tomography. SIAM J. Imaging Sciences,Vol. 1, No. 2. pp. 188-208, 2008.
19

[14] R. B. Marr, C. Chen, P. C. Lauterbur: On two approaches to 3D recon-struction in NMR zeugmatography. In: G.T. Herman, F. Natterer (eds.):Mathematical aspects of computerized tomography, Springer LNMI pp.225-240, 1981.
[15] F. Natterer, F. Wubbeling: Mathematical methods in image reconstruction.SIAM, 2001.
[16] M. Reumann, J. Bohnert, B. Osswald, S. Hagl, O. Dossel: Multiplewavelets, rotos, and snakes in atrial fibrillation – a computer simulationstudy. J. Electrocardiology, pp. 328-334, 2007.
[17] L. A. Shepp, B. F. Logan: The Fourier reconstruction of a head section.IEEE Trans. Nucl. Sci. NS-21. pp. 21-43, 1974.
[18] L. Sornmo, P. Laguna: Bioelectrical signal processing in cardiac and neu-rological applications. Elsevier Inc., 2005.
[19] D. Stalling, M. Westerhoff, H.-C. Hege et al.: Amira: A Highly Inter-active System for Visual Data Analysis. In: C. D. Hansen, C. R. Johnson(eds.): The Visualization Handbook. Chapter 38, pp. 749 - 767, 2005. URL:amira.zib.de
[20] K. H. ten Tusscher, A.V. Panfilov: Alternans and spiral breakup in a humanventricular tissue model. Am. J. Heart Circulation Physiology, pp. 1088-1100, 2006.
[21] S. Zachow: Computergestutzte 3D-Osteotomieplanung in der Mund-Kiefer-Gesichtschirurgie unter Berucksichtigung der raumlichen Weichgewe-beanordnung. Medizininformatik, Verlag Dr. Hut, 2005.
[22] S. Zachow, H.-C. Hege, P. Deuflhard: Computer Assisted Planning inCranio-Maxillofacial Surgery. J. Comput. Inform. Technology – Special Is-sue on Computer-Based Craniofacial Modelling and Reconstruction, pp.53-64, 2006.
[23] S. Zachow, M. Zilske, H.-C. Hege: 3D Reconstruction of IndividualAnatomy from Medical Image Data. In: Proc. ANSYS Conference & CAD-FEM Users’ Meeting, Dresden. Siehe auch: Report 07-41, ZIB, 2007.
20