morbidity and mortality weekly report - centers for disease control … · since 1975, a total of...
TRANSCRIPT

Morbidity and Mortality Weekly Report
Weekly October 31, 2003 / Vol. 52 / No. 43
depardepardepardepardepartment of health and human sertment of health and human sertment of health and human sertment of health and human sertment of health and human servicesvicesvicesvicesvicesCenters for Disease Control and PreventionCenters for Disease Control and PreventionCenters for Disease Control and PreventionCenters for Disease Control and PreventionCenters for Disease Control and Prevention
INSIDE
1042 Prevalence of Selected Risk Factors for Chronic Disease— Jordan, 2002
1044 Measles Epidemic Attributed to Inadequate VaccinationCoverage — Campania, Italy, 2002
1047 Barium Toxicity After Exposure to ContaminatedContrast Solution — Goias State, Brazil, 2003
1049 Assessment of the Epidemiologic Capacity in State andTerritorial Health Departments — United States, 2001
1051 Terrorism Preparedness in State Health Departments —United States, 2001–2003
1053 West Nile Virus Activity — United States, October 23–29, 2003
1054 Notices to Readers
Building Epidemiology CapacityField epidemiology is an essential component of effec-
tive public health practice, and developing such capacity isa critical step in a country’s efforts to improve the health ofits citizens. Since 1975, a total of 28 Field EpidemiologyTraining Programs (FETPs) have been established world-wide (Figure). Most FETPs have resulted from partner-ships among CDC, host country health agencies, the WorldHealth Organization, the U.S. Agency for InternationalDevelopment, and others. Modeled on CDC’s EpidemicIntelligence Service (EIS), FETPs follow the EIS approachof combining service with training. FETPs also participatein the Training Programs in the Epidemiology and PublicHealth Interventions Network, which provides a venue forinformation sharing, program development, and qualityimprovement. In 2003, EIS and FETPs graduated approxi-mately 250 field epidemiologists. Four reports in this issueof MMWR illustrate how FETPs respond to health needs,and two reports describe the need to improve epidemio-logic capacity in the United States.
Efficiency of Quarantine Duringan Epidemic of Severe Acute
Respiratory Syndrome —Beijing, China, 2003
During March–July 2003, an epidemic of severe acute res-piratory syndrome (SARS) in Beijing, China, accounted for2,521 probable cases* (attack rate: 19 per 100,000 popula-tion). To control the epidemic, public health officials initi-ated enhanced surveillance, isolation of SARS patients, use ofpersonal protective equipment (PPE) by health-care workers,and quarantine of contacts of known SARS patients. Approxi-mately 30,000 Beijing residents were quarantined in theirhomes or quarantine sites. To guide future quarantine policy,the Chinese Field Epidemiology Training Program (ChinaFETP) of the Chinese Center for Disease Control and Pre-vention (China CDC) conducted a survey to estimate the riskfor acquiring SARS among quarantined residents of Haidian
FIGURE. Locations of field epidemiology and trainingprograms (FETPs), by status — worldwide, 2003
FETPs establishedFETPs in development
* Defined by using the case definition of the Chinese Ministry of Health (CMoH),which is similar to the World Health Organization case definition (1). TheCMoH case definition differs principally by including pneumonia patientswhose contacts acquired SARS and by requiring radiographic evidence of atypicalpneumonia.

1038 MMWR October 31, 2003
SUGGESTED CITATIONCenters for Disease Control and Prevention. [ArticleTitle]. MMWR 2003;52:[inclusive page numbers].
Centers for Disease Control and Prevention
Julie L. Gerberding, M.D., M.P.H.Director
Dixie E. Snider, M.D., M.P.H.(Acting) Deputy Director for Public Health Science
Donna F. Stroup, Ph.D., M.Sc.(Acting) Associate Director for Science
Epidemiology Program Office
Stephen B. Thacker, M.D., M.Sc.Director
Office of Scientific and Health Communications
John W. Ward, M.D.Director
Editor, MMWR Series
Suzanne M. Hewitt, M.P.A.Managing Editor, MMWR Series
Jeffrey D. Sokolow, M.A.(Acting) Lead Technical Writer/Editor
Jude C. RutledgeTeresa F. Rutledge
Douglas W. WeatherwaxWriters/Editors
Lynda G. CupellMalbea A. LaPete
Visual Information Specialists
Kim L. Bright, M.B.A.Quang M. Doan, M.B.A.
Erica R. ShaverInformation Technology Specialists
Division of Public Health Surveillanceand Informatics
Notifiable Disease Morbidity and 122 Cities Mortality DataRobert F. Fagan
Deborah A. AdamsFelicia J. ConnorLateka DammondDonna Edwards
Patsy A. HallPearl C. Sharp
The MMWR series of publications is published by theEpidemiology Program Office, Centers for Disease Controland Prevention (CDC), U.S. Department of Health andHuman Services, Atlanta, GA 30333.
District (2001 population: 2.24 million), Beijing, in May2003, 1 month after the epidemic peaked. This report sum-marizes the results of that survey, which indicate that, as acomponent of a comprehensive SARS-control program, quar-antine should be limited to persons who have contact with anactively ill SARS patient in the home or hospital, allowing forbetter focus of resources in future outbreaks.
The 33 precincts in Haidian District were divided into fivelocations: north (seven precincts), south (six), west (seven),east (six), and central (seven). From each location, the pre-cinct with the greatest number of persons quarantined wasselected based on lists from precinct quarantine officers. Theselected precincts had 171 (29%) SARS cases and 1,210 (23%)persons quarantined in the district. Quarantined persons wereasked to complete a self-administered questionnaire regard-ing the reasons for quarantine. Quarantined persons and theircontacts were categorized as having SARS according to thecriteria released by the Chinese Ministry of Health (CMoH).Persons with probable SARS on quarantine and surveillancelists for the precincts and the district were compared with sur-veyed persons to verify SARS in quarantined persons and theircontacts.
In Beijing, contact was defined as 30 minutes’ exposure inthe following situations to a SARS patient who required quar-antine: 1) health-care workers who did not use PPE whileevaluating or treating a SARS patient; 2) other persons (e.g.,family members) who provided care for a SARS patient;3) persons who shared the same living quarters as a SARSpatient; 4) persons who visited a SARS patient; 5) personswho worked in the same office room or workshop as a SARSpatient; 6) classmates or teachers of a SARS patient; and7) persons using the same public conveyance as a SARSpatient (rules varied by conveyance). Quarantine was for14 days after exposure. Quarantine was initially for personsexposed to a SARS patient <14 days before the patient’s ill-ness onset, but this period was reduced to 10 and then to3 days. Travelers who had fever (>100.4º F [>38º C]) arrivingfrom other SARS-affected cities were placed under personalsurveillance† instead of quarantine. All quarantined personswere followed up daily by a home visit or telephone call fromthe precinct quarantine officer and were given food and, ifneeded, medicine. If they acquired fever while under quaran-tine, they were transferred to a hospital for isolation. Someemployers paid salaries to their employees under quarantine.
In Haidian District, during March 1–May 23, a total of5,186 persons (0.23% of 2.24 million residents) were quar-antined. During May 26–June 4, a total of 1,210 residents
† Close medical or other supervision of contacts to permit prompt recognitionof infection or illness but without restricting their movements (2).

Vol. 52 / No. 43 MMWR 1039
were sampled; 1,028 (85%) completed the questionnaire. Atotal of 232 (2.3%; 95% confidence interval [CI] = 1.6%–3.5%) residents of the surveyed population (n = 1,010)acquired probable SARS while under quarantine (Table 1).The median quarantine period was 14 days (range: 1–28 days).Only quarantined persons who had a history of contact witha SARS patient acquired SARS during quarantine. In con-trast, none of the quarantined persons whose exposure didnot involve contact with a SARS patient acquired SARS; theseincluded persons (e.g., a contact of a SARS contact or a con-tact of a patient with fever only) who had been quarantinedmistakenly early in the outbreak before procedures were wellknown to all quarantine officers. In addition, as hospital iso-lation of persons under surveillance for SARS was relaxed,these persons required quarantine for potential exposure toan actual SARS patient in the hospital.
Among the 626 (62%) quarantined persons with knowncontact with persons with probable SARS, those who caredfor an actively ill SARS patient had the highest attack rate(Table 2). In contrast, quarantined persons who had contactwith a SARS patient before they became ill had no detectablerisk (95% CI = 0%–2.8%). In addition, no secondary trans-mission to relatives or other contacts was detected from per-sons who had SARS while under quarantine. No SARS patientsdetected through SARS surveillance reported a history of con-tact with a person under quarantine.Reported by: J Ou, Q Li, G Zeng, MSc, Chinese Field EpidemiologyTraining Program, Chinese Center for Disease Control and Prevention;
Z Dun, A Qin, Haidian District Center for Disease Control andPrevention, Beijing, China. RE Fontaine, MD, Div of InternationalHealth, CDC.
Editorial Note: Quarantine is the separation and/or restric-tion of movement of persons who, because of recent exposureto a communicable disease, risk acquiring that disease andsubsequently exposing others. Estimates of the risk foracquiring disease are used to assess the efficiency of quaran-tine measures among persons with different types of expo-sure. The findings from this survey indicate that the efficiencyof SARS quarantine could be improved greatly in future out-breaks. Focusing only on persons who had contact withan actively ill SARS patient would have reduced the numberof persons quarantined by approximately 66%, without com-promising its effectiveness. Persons exposed to SARS patientsonly during the incubation period appeared to have low or norisk for acquiring SARS (2,3). Because fever is a reliable markerfor both onset of SARS and risk for transmission, persons incontact with a SARS patient could be placed under personalsurveillance, with temperature taken daily or more frequently.If fever is detected within the 10-day incubation period ofSARS, they could then be isolated. Such a modification ofquarantine policy could reduce resources expended for quar-antine, including time adults spend in quarantine.
The findings in this report are subject to at least five limita-tions. First, the five selected precincts, although considered tobe representative of Haidian District, were not a probabilitysample. Therefore, some selection bias might affect estimates of
proportions in different exposure catego-ries but would have a minimal effect onthe estimated attack rates. Second,although exposure categories had esti-mated attack rates equal to 0, CIs forthese estimates were too wide to deter-mine if the actual rates differed frombackground or to suggest that personsin the exposure categories did or did notrequire special quarantine or controlmeasures. Third, self-reported data aresubject to recall bias and inaccuratereporting of reasons for quarantine.Fourth, because SARS cases were notlaboratory-confirmed, some personswho were quarantined for exposure toanother respiratory disease and somequarantined persons who had anotherrespiratory disease might have beenincluded. These two effects can coun-teract each other, and their magnitudewould depend on the background
TABLE 1. Attack rates for probable severe acute respiratory syndrome (SARS)*among quarantined persons, by exposure category — Haidian District, Beijing, China,2003†
Exposed Attack rateExposure category % (95% CI§) % (95% CI)
Quarantine required¶
Contact with SARS patient 62.4 (59.3–65.4) 3.8 (2.5–5.7)Contact with excluded SARS patient(s) 13.8 (11.8–16.2) 0 (0–3.3)Excluded SARS patients 4.5 (3.3–6.0) 0 (0–9.8)Other discharged patients 0.8 (0.4–1.6) 0 NC**
Total 81.5 (78.9–83.8) 2.9 (1.9–4.4)
Quarantine not required¶
Contact with contact of a SARS patient 12.8 (10.9–15.1) 0 (0–3.6)Fever patients or contacts of fever patients 3.0 (2.1–4.4) 0 NCNo contact with any patients or contacts 2.6 (1.7–3.8) 0 NC
Total 18.5 (16.2–21.1) 0 (0–2.5)
Total 100.0 (99.5–100.0) 2.3 (1.6–3.5)
* Defined by using the case definition of the Chinese Ministry of Health (CMoH), which is similar tothe World Health Organization case definition (1). The CMoH case definition differs principally byincluding pneumonia patients whose contacts acquired SARS and by requiring radiographic evidenceof atypical pneumonia.
†N = 1,010. Excludes 18 quarantined residents who returned the questionnaire but did not answerspecified question.
§Confidence interval.
¶According to quarantine rules in Beijing.
** Not calculated because proportion exposed was too small.

1040 MMWR October 31, 2003
incidence of other atypical pneumonias, which was probablyvery low relative to SARS. Finally, no information was avail-able regarding the reasons for nonresponse, and some addi-tional selection bias could result. However, because thenonresponse rate was relatively low, this effect should be mini-mal.
Although the findings described in this report suggest thatquarantine effectively eliminated the risk for transmission ofSARS from quarantined persons to others in the community,they also reveal certain challenges with applying quarantinemeasures under field conditions. Certain persons who werequarantined in Beijing did not have illnesses consistent withthe quarantine criteria. In addition, early in the outbreak, per-sons were quarantined who had been exposed to persons evalu-ated for SARS who were excluded later. Furthermore, thesesame excluded SARS patients required quarantine for expo-sure to a SARS patient while in the hospital. Although thiswas corrected as SARS was characterized, more uniform andcareful application of quarantine criteria at the beginning of aSARS epidemic might further reduce the number of personsquarantined.
The SARS attack rates in Beijing among all quarantinedpersons and special, well-defined exposure groups (i.e., per-sons treating or caring for a SARS patient, living in the samehome with a SARS patient, or visiting a SARS patient) wereapproximately 10 times greater than those reported in arecent evaluation of SARS quarantine in Taiwan (4). Differ-ences between the two outbreaks in the ratio of true SARScases to SARS-like pneumonias from other causes, as well as
differing classifications of exposure, could, in part, accountfor these findings.
China FETP was initiated in October 2001 in the ChinaCDC. China FETP also has training sites in several cooperat-ing provincial CDCs. All 20 China FETP participants con-tributed substantially to the surveillance, investigation, andcontrol of the 2003 SARS outbreak and completed five addi-tional epidemiologic studies on SARS.
The use of quarantine, in combination with enhanced sur-veillance, isolation of SARS patients, and comprehensive useof PPE by health-care workers, appears to have been effectivein controlling the recent epidemic of SARS in Beijing. Limit-ing quarantine to persons who have contact with an activelyill SARS patient will likely improve the efficiency of quaran-tine and allow for better focus of resources in future outbreaks.References1. World Health Organization. Management of severe acute respiratory
syndrome (SARS). Available at http://www.who.int/csr/sars/casedefinition/en.
2. Chin J, ed. Control of Communicable Diseases Manual, 17 ed. Wash-ington, DC: American Public Health Association, 2000.
3. Xie S, Zeng G, Lei J, et al. Analyses of one case of severe acute respira-tory syndrome “super-transmitter” and chain of transmission. Chin JEpidemiol 2003;24:449–53.
4. Li Q, Zeng G, Ou J, et al. Epidemiological study of the transmissionchain of a severe acute respiratory syndrome outbreak. Natl Med J China2003;83:906–9.
5. CDC. Use of quarantine to prevent transmission of severe acute respi-ratory syndrome—Taiwan, 2003. MMWR 2003;52:680–3.
TABLE 2. Attack rates for probable severe acute respiratory syndrome (SARS)* among persons quarantined for direct contact witha probable SARS patient, by nature of contact — Haidian District, Beijing, March–May 2003†
Contact during symptomatic period (n = 383) Contact only during incubation period (n = 167)Contacts Attack rate Contacts Attack rate
Nature of contact % (95% CI§) % (95% CI) % (95% CI) % (95% CI)
Cared for SARS patient¶ 15.9 (12.5–20.1) 31.1 (20.2–44.4) 2.4 (0.8–6.4)** 0 NC††
Visited SARS patient§§ 11.7 (8.8–15.5) 8.9 (2.9–22.1) 4.2 (1.8–8.8) 0 NCLived in same residence¶¶ 50.9 (45.8–56.0) 4.6 (2.3–8.9) 31.1 (24.3–38.8) 0 (0–8.6)Lived in same building*** 26.9 (22.5–31.7) 0 (0–4.5) 13.7 (9.1–20.2) 0 NCWorked with SARS patients††† 2.0 (0.8–3.9) 0 NC 38.9 (31.6–46.8) 0 (0–7.0)Other manner of contact 6.0 (3.9–9.0) 0 NC 13.2 (8.6–19.5) 0 NC
Total 100.0 (98.8–100.0) 6.3 (4.1–9.3) 100.0 (97.2–100.0) 0 (0–2.8)
* Defined by using the case definition of the Chinese Ministry of Health (CMoH), which is similar to the World Health Organization case definition (1). TheCMoH case definition differs principally by including pneumonia patients whose contacts acquired SARS and by requiring radiographic evidence ofatypical pneumonia.
†N = 550. Excludes 80 persons with direct contact who did not answer specified question.
§Confidence interval.
¶Both at home and in the hospital.
** Cared for patients who had other medical conditions during these patients’ incubation period.††
Not calculated because proportion exposed was too small.§§
Includes some persons who lived in the same residence or building.¶¶
Includes some persons who visited or cared for a SARS patient.*** Includes some persons who visited or cared for a SARS patient and excludes persons who lived in the same residence as a SARS patient.†††
Excludes persons who visited, cared for, lived with, or lived in the same building as a SARS patient.

Morbidity and Mortality Weekly Report
Recommendations and Reports
September 13, 2002 / Vol. 51 / No. RR-13
Centers for Disease Control and Prevention
Centers for Disease Control and Prevention
Centers for Disease Control and Prevention
Centers for Disease Control and Prevention
Centers for Disease Control and Prevention
SAFER • HEAL
SAFER • HEAL
SAFER • HEAL
SAFER • HEAL
SAFER • HEALTHIER • PEOPLE
THIER • PEOPLE
THIER • PEOPLE
THIER • PEOPLE
THIER • PEOPLE TM
Folic Acid and Prevention
of Spina Bifida and Anencephaly
10 Years After the U.S. Public Health
Service Recommendation
know what matters.
trust • wor • thy: adj 1 : worthy of belief
2 : capable of being depended upon;
see also MMWR.
('tr st-"w r-the)e e

1042 MMWR October 31, 2003
Prevalence of Selected Risk Factorsfor Chronic Disease — Jordan, 2002
In Jordan, the average life expectancy in 2002 was 72 years(1), and chronic diseases are becoming increasingly prevalent(2–4). Because personal behavior can influence the occurrenceand progression of many chronic diseases, the Jordan Minis-try of Health (JMoH) established surveillance for behavioralrisk factors, particularly those related to cardiovascular dis-eases and diabetes. This report summarizes the key findingsof the 2002 Behavioral Risk Factor Survey, the first reportingsegment in Jordan’s surveillance program for chronic diseases.The findings indicate that smoking, physical inactivity, andobesity contribute substantially to the burden of chronic dis-ease in Jordan and underscores the need for effective publichealth interventions.
In May 2002, a total of 28 questions about behavioral riskfactors and noncommunicable disease prevalence were addedto the Jordan Department of Statistics’ quarterly, multistage,cross-sectional employment and unemployment survey. Thesample was based on the sampling frame provided by the 1994Jordan Population and Housing Census. The frame excludedpersons living in remote areas, the majority of whom arenomads, and those living in collective dwellings (e.g., hotels,hospitals, work camps, and prisons). The sampling frame wasrepresentative nationally and stratified by governorate, majorcity, and other urban and rural areas. Within each stratum,sample blocks were selected systematically with probabilityproportional to size, and sample households were selected byusing a systematic random procedure. One respondent aged>18 years was selected from each sample household and inter-viewed directly. All reported estimates were weighted toaccount for the sample design and were further adjusted forthe noninterview response rate. STATA-7 software (5) wasused to calculate 95% confidence intervals.
Respondents were asked whether they ever had their bloodpressure or cholesterol checked by a health-care professionaland whether a health-care professional had ever told themthat they had high blood pressure, high cholesterol, asthma,or diabetes or that they had had a heart attack. Gestationaldiabetes was excluded from the analysis. Smokers were classi-fied as “ever smokers” (i.e., smokers who had smoked >100cigarettes during their lifetime) or “current smokers” (i.e.,smokers who had ever smoked 100 cigarettes and currentlysmoke every day or some days). Questions on self-reportedheight and weight were included, and body mass index (BMI)(i.e., ratio of weight in kilograms to height in meters squared[kg/m2]) was calculated. Being overweight was classified ashaving a BMI of 25.0–25.9, and obesity was classified as hav-ing a BMI of >30. Respondents were asked whether they
engaged in weekly moderate or vigorous activity. Moderateactivity was defined as any activity that caused light sweatingand small increases in heart rate or breathing for 30 minutes.Vigorous activity was defined as any activity that caused heavysweating or large increases in heart rate or breathing for 20minutes. Respondents also were asked when they had lastsought health care from a health-care professional.
A total of 8,791 questionnaires were completed among 9,601sampled households (response rate: 92%), excluding vacantand closed houses. The prevalence of persons who had everhad their blood pressure checked was 67% (74% of womenand 61% of men) (Table). Of 6,147 respondents who everhad their blood pressure checked, 22% had been told by ahealth-care professional that they had high blood pressure. Atotal of 19% of respondents reported ever having had theirblood cholesterol checked; however, this prevalence was 35%among respondents aged 50–64 years. The overall reportedprevalence of diabetes was 6%; however, this prevalenceincreased to 20% for persons aged 50–64 years. The reportedprevalence of asthma was 5% (6% of women and 4% of men),and 2% of respondents had ever been told by a health-careprofessional that they had had a heart attack. A total of 30%of respondents reported currently smoking cigarettes every dayor some days, and 38% reported ever smoking >100 ciga-rettes. Nearly half (51%) of the male respondents were cur-rent smokers, compared with 8% of female respondents.Among current smokers, men smoked approximately 23 ciga-rettes per day, compared with 12 cigarettes a day amongwomen. Among current smokers who had visited a health-care professional during the preceding 6 months, 43% hadreceived counseling about smoking. The prevalence of beingoverweight was 32%, and the prevalence of obesity was 13%(16% of women and 10% of men). Among obese respon-dents who visited a health-care professional during the pre-ceding 6 months, 26% received counseling about exercise and34% about nutrition. The prevalence of any weekly vigorousphysical activity was 32%, and 53% of all respondentsreported weekly physical activity.Reported by: F Shehab, MD, Field Epidemiology Training Program;A Belbeisi, MD, Jordan Ministry of Health. H Walke, MD, Div ofInternational Health, Epidemiology Program Office, CDC.
Editorial Note: Chronic disease represents a substantial healthproblem for residents of Jordan. Because many questions inthe Jordan survey are similar to those asked in the U.S.Behavioral Risk Factor Surveillance System, the two sets ofresults can be compared.
In 2001, of all U.S. states and territories in the United Statesin which respondents were asked if a health-care professionalhad ever told them they had high blood cholesterol, hyper-tension, or diabetes, the median percentages of persons

Vol. 52 / No. 43 MMWR 1043
responding “yes” were 30%, 26%, and 7%, respectively (6).Reporting of high blood cholesterol was substantially higherin the United States than in Jordan. This difference might beattributable to such factors as diet and genetic predisposition;however, the substantial differences in the percentages of personsin the two countries ever checked for high blood cholesterol (19%in Jordan versus 77% in the United States) suggest that Jordani-ans are less likely to seek or obtain preventive services. Efforts areneeded to improve awareness among patients and health-careprofessionals of the value of preventive health care.
The median prevalence of current smoking in the UnitedStates was 23% (26% for men and 21% for women). Smok-ing in Jordan among men was more prevalent, with 51% ofmen aged >18 years being current smokers. The low preva-lence (8%) of smoking among Jordanian women probablyreflects cultural norms that dissuade women from starting tosmoke. Creation of primary prevention programs that pro-mote nonsmoking among young Jordanian women might beuseful in sustaining this low prevalence in the future.
The substantial levels of obesity in Jordan, especially amongwomen, combined with the overall low physical activity levelsamong both sexes, reflects the need to increase opportunitiesfor counseling on exercise and nutrition. Such counseling byhealth-care professionals can improve health-related choices.
The findings in this report are subject to at least three limi-tations. First, the survey relied only on self-reports of diag-nosed diseases such as diabetes and hypertension, and manypersons might have undiagnosed disease. Second, the calcu-lated BMIs might have been affected by biases in self-reportedheight and weight; the validity of such measures has not beenstudied in Jordan. Finally, in face-to-face interviews, womenmight have underreported their smoking habits because ofgeneral disapproval of smoking among women in Jordan.
The survey described in this report was conducted as partof the Jordan Field Epidemiology Training Program (FETP).The Jordan FETP began in 1999 as a 2-year program withinJMoH’s Directorate of Disease Control. Each year, the pro-gram accepts five to seven residents who are involved prima-rily in outbreak investigations and projects that strengtheninfectious and noncommunicable disease surveillance.
The 2002 Jordan Behavioral Risk Factor Survey highlightssubstantial levels of risk for chronic disease in the Jordanianpopulation. This survey represents an important step towardestablishing the regular collection of information on risk fac-tors, which can be useful for public health-care professionalsin planning and evaluating interventions. JMoH will repeatthe survey in 2004 and thereafter at regular intervals. The2004 survey will include additional questions on nutrition,maternal health, and smoking-related behavior.
TABLE. Prevalence of selected risk factors for chronic diseases, by sex and age group — Behavioral Risk Factor Survey, Jordan,2002
Sex Age group (yrs)
Men Women 18–34 35–49 50–64 >65 Total
Risk factor % (95% CI*) % (95% CI) % (95% CI) % (95% CI) % (95% CI) % (95% CI) % (95% CI)
High blood pressure 21.0 (±2.4) 23.2 (±2.1) 8.8 (±1.4) 22.8 (±2.5) 44.3 (±4.5) 43.8 (±6.3) 22.2 (±1.6)High blood cholesterol 21.2 (±4.0) 20.5 (±4.4) 8.8 (±5.0) 18.3 (±4.5) 32.1 (±5.8) 34.0 (±9.9) 20.9 (±3.0)Diabetes 6.5 (±1.0) 6.2 (±1.2) 0.7 (±0.3) 6.2 (±1.4) 19.9 (±3.5) 23.3 (±4.7) 6.4 (±0.8)Heart attack history 3.2 (±0.7) 1.5 (±0.6) 0.2 (±0.1) 1.5 (±0.7) 8.2 (±2.4) 10.8 (±3.0) 2.4 (±0.5)Asthma 3.7 (±0.7) 6.4 (±1.1) 3.7 (±0.8) 6.6 (±1.6) 6.8 (±2.0) 6.6 (±2.7) 5.1 (±0.7)
SmokingEver smoker† 64.4 (±2.0) 10.9 (±1.7) 33.3 (±2.9) 44.5 (±3.8) 42.9 (±4.8) 45.5 (±6.0) 38.2 (±2.8)Current smoker§ 50.5 (±2.2) 8.3 (±1.4) 29.0 (±2.7) 34.9 (±3.2) 27.8 (±3.9) 22.2 (±5.3) 29.8 (±2.3)
WeightOverweight¶ 36.0 (±2.2) 27.8 (±2.2) 26.2 (±2.1) 41.0 (±2.9) 41.0 (±4.4) 38.1 (±7.7) 32.4 (±1.7)Obesity** 10.3 (±1.3) 16.2 (±1.9) 5.8 (±1.0) 20.8 (±2.4) 25.0 (±4.0) 19.3 (±6.0) 12.8 (±1.1)
Physical activityAny weekly vigorous†† 38.9 (±2.4) 23.9 (±1.9) 35.8 (±2.5) 33.5 (±2.6) 22.3 (±3.5) 10.0 (±3.4) 31.6 (±1.7)Any weekly activity§§ 56.9 (±2.6) 48.2 (±2.4) 57.7 (±2.4) 54.9 (±2.8) 43.8 (±3.9) 22.0 (±4.4) 52.6 (±1.7)
Ever checkedBlood pressure 61.1 (±2.3) 73.9 (±2.0) 56.1 (±2.2) 78.7 (±2.4) 83.6 (±2.8) 81.9 (±5.0) 67.4 (±1.6)Cholesterol 20.8 (±2.0) 16.1 (±1.8) 9.6 (±1.2) 26.0 (±3.0) 35.0 (±4.2) 28.0 (±5.4) 18.5 (±1.3)
* Confidence interval.†
Ever smoked >100 cigarettes during lifetime.§
Ever smoked >100 cigarettes during lifetime and currently smoke every day or some days.¶
Body Mass Index (BMI) (i.e., ratio of weight in kilograms to height in meters squared [kg/m2]) of 25.0–29.9.** BMI of >30.††
Vigorous activity (i.e., causing heavy sweating and large increases in breathing or heart rate for 20 minutes).§§
Any moderate activity (i.e., causing light sweating and small increases in breathing or heart rate for 30 minutes) or vigorous activity.

1044 MMWR October 31, 2003
cdc.gov/mmwr
Chinese Proverb
"Learning is like rowing upstream; not to advance is to fall back."
ContinuingEducation
MMWR Continuing Education
provides timely courses on public
health and clinical topics that help
you advance your clinical skills.
Review course descriptions, take
exams, track results, and receive
course certificates – all from your
own computer, when and where
your schedule allows.
MMWR CE
Log on. Sit ready. Advance.
AcknowledgmentsThis report is based on contributions by N Salem, PhD,
Minnesota Dept of Health. D Holtzman, PhD, Public HealthPractice Program Office; D McQueen, ScD, National Center forChronic Disease Prevention and Health Promotion, CDC.
References1. Jordan Department of Statistics. Jordan in Figures. Amman, Jordan:
Jordan Department of Statistics, 2002.2. Khoury SA, Massad D, Fardous T. Mortality and causes of death in
Jordan 1995–1996: assessment by verbal autopsy. Bull World HealthOrgan 1999;77:641–50.
3. Abbas AA, Khoury SA, Massad D, Karabsheh S. Prevalence of over-weight and obesity in adult Jordanians aged 25 years and over: results ofa national survey. Journal of the Arab Board of Medical Specializations2002;4:90–7.
4. Ajlouni K, Jaddou H, Batieha A. Diabetes and impaired glucose toler-ance in Jordan: prevalence and associated risk factors. J Intern Med1998;244:317–23.
5. StataCorp. Stata Statistical Software: Release 7.0. College Station, Texas:Stata Corporation, 2001.
6. CDC. State-specific prevalence of selected chronic disease-related char-acteristics—Behavioral Risk Factor Surveillance System, 2001. In: Sur-veillance Summaries (August 22). MMWR 2003;52(No. SS-8).
Measles Epidemic Attributedto Inadequate Vaccination
Coverage — Campania, Italy, 2002In Italy, measles has been a mandatory reportable disease
for >100 years. During the prevaccination era, approximately25,000–90,000 cases were reported annually. During the late1980s and 1990s, incidence declined with increasing measlesvaccination coverage, but measles epidemics continued tooccur periodically, most recently during 1995–1997 (Figure 1).In early 2002, measles incidence increased sharply; the areamost affected was Campania (2001 population: approximately5,782,000, including 1,100,000 children aged <15 years), a
FIGURE 1. Number of measles cases and percentage ofchildren vaccinated by age 24 months, by year — Italy, 1960–2001
0
20,000
40,000
60,000
80,000
100,000
Year
0
20
40
60
80
100
Percentage
No. casesVaccination coverage byage 24 months
Num
ber
1960 1965 1970 1975 1980 1985 1990 1995 2000

Vol. 52 / No. 43 MMWR 1045
large region in southern Italy (Figure 2). In 2001, estimatedmeasles vaccination coverage for the 1998 Campania birthcohort was 65% (1). Regional health authorities and theNational Institute of Health investigated the measles outbreakin Campania. This report summarizes the preliminary resultsof the investigation, which attributed the epidemic to inad-equate vaccination coverage. A coordinated effort is neededto interrupt measles transmission in Italy.
To monitor the incidence of measles and other vaccine-preventable diseases among children aged <15 years, in Janu-ary 2000, a national pediatric sentinel surveillance system(SPES) was initiated, covering approximately 4% of childrenaged <15 years (2). Children are tracked by National HealthSystem primary-care pediatricians who participate voluntar-ily. These pediatricians report cases of measles and other vac-cine-preventable diseases diagnosed during the precedingmonth by e-mail or fax to the National Institute of Health inRome. SPES uses a standard clinical case definition for measles(3), but laboratory confirmation is not required. Informationcollected on each case includes date of birth, date of illnessonset, sex, and vaccination status. Reporting on presence orabsence of cases is required, and the monthly incidence rate iscalculated by using the number of reported cases as thenumerator and the total patient population cared for by thepediatricians participating in the surveillance system duringthat month as the denominator.
Data on measles-associated hospitalizations that occurredduring January–July 2002 were collected by reviewing dis-charge records of the five main regional hospitals with infec-tious diseases units. For each patient, information about sex,date of birth, admission and discharge dates, and diagnosis atdischarge was collected. Information on regional vaccinationcoverage was derived from a survey conducted during 2000–2001 of a sample of 12,647 children aged 24–36 months who
were born in 1998 (1).In 2002, an average of 51
pediatricians in Campania par-ticipated in SPES, covering anestimated 41,888 children (3.8%of the regional total). A total of1,571 measles cases were reported,resulting in an annual incidenceof 3,750 cases per 100,000 chil-dren aged <15 years. The major-ity (1,543 [98%]) of casesoccurred during January–July,with a peak in May (Figure 3).
Incidence increased with age,from 1,088 per 100,000 in chil-dren aged <1 year to 2,413 in
those aged 1–4 years, 3,506 in those aged 5–9 years, and 5,592in those aged 10–14 years. Incidences were highest in the prov-inces of Naples and Caserta, the areas with the lowest measlesvaccination coverage (Table).
Vaccination status was known for 1,543 (98%) of thereported patients; of these, 101 (7%) were vaccinated, andthe remainder were unvaccinated. The number of adminis-tered doses was reported for 72 (71%) children; 70 were vac-cinated with 1 dose, and two with 2 doses. The proportion ofvaccinated patients aged >1 year decreased with age, from10.5% among children aged 1–4 years to 5.5% among chil-dren aged 5–14 years.
Hospital record review identified 594 measles-associatedhospitalizations that occurred during January–July 2002. Ofthese, 469 (79%) occurred among children aged <15 years,and 44 (7%) in infants aged <1 year. Diagnosis at dischargewas available for 425 (91%) children; 99 (23%) had respira-tory complications (pneumonia/bronchopneumonia), 12 (3%)encephalitis, and two (1%) thrombocytopenia. Of the remain-
TABLE. Number of children aged <15 years under surveillancefor measles, number of measles cases reported, incidence*,and percentage of children born in 1998 who havereceived measles vaccine, by province — Campania, Italy, 2002
% children bornin 1998 who
No. No. have receivedProvince children cases Incidence measles vaccine†
Caserta 3,364 276 8,204 61Napoli 9,982 892 8,936 63Salerno 8,007 186 2,323 67Avellino 1,298 2 154 70Benevento 19,237 215 1,118 84Total 41,888 1,571 3,750 65
* Per 100,000 children.†Estimated in 2001.
FIGURE 2. Location ofmeasles epidemic —southern Italy, 2002
Campania
Abruzzo
Puglia
Calabria
Initial outbreak
Subsequent spread
FIGURE 3. Incidence* of measles among children aged <15years, by month of onset — Campania, Italy, 2002
* Per 100,000 children.
0
200
400
600
800
1,000
Jan Feb Mar Apr May Jun Jul Aug Sep Oct Nov Dec
Inci
denc
e
Month

1046 MMWR October 31, 2003
ing children, 15 (4%) had other complications, and 297 (70%)had uncomplicated measles. Three children (aged 6 months,4 years, and 10 years, respectively) died. The remaining 125(21%) cases of identified measles-associated hospitalizationsoccurred among persons aged >15 years, including threeadditional cases of encephalitis and one measles-associateddeath attributed to respiratory failure in a person aged 29 years.
Regional health authorities recommended 1) vaccinating per-sons exposed to patients in family and school settings;2) offering measles, mumps, and rubella (MMR) vaccine to allpersons who had not been vaccinated or who did not have ahistory of measles; and 3) temporarily lowering the age of MMRvaccination to 6 months, with subsequent revaccination after 1year of those children vaccinated at age 6–12 months. How-ever, these measures did not stop the epidemic, which spreadsubsequently to other areas. Approximately 1,000 additionalcases were reported to SPES from other regions, and thenational annual attack rate in children aged <15 years was 738per 100,000. The most affected regions were central and south-ern Italy, with regional incidences seven to 36 times higher thanin northern Italy. After an apparent decline in reported inci-dence during August–December 2002, the epidemic contin-ued during the first half of 2003, affecting the southern regionsof Abruzzo, Puglia, and Calabria (Figure 2) (4).Reported by: ML Ciofi degli Atti, MD, F Fabi, MS, S Salmaso, D Biol,National Center for Epidemiology, Surveillance, and Health Promotion,National Institute of Health. R Pizzuti, MD, E de Campora, MD,Regional Health Authority, Campania, Italy.
Editorial Note: Four measles-associated deaths and 594 hos-pitalizations occurred during January–July 2002 in Campania.This outbreak indicates that measles can be severe and some-times fatal, even in industrialized countries. The outbreakoccurred as a result of low vaccination coverage and affectedprimarily unvaccinated school-aged children. Vaccination cov-erage levels were lower for school-aged children than for pre-school-aged children. The regional measles vaccinationcoverage estimated for the 1991 birth cohort was 16% in 1993(5), increasing to 65% for the 1998 birth cohort (1). Inad-equate vaccination coverage could not interrupt virus circula-tion but resulted in a prolonged interepidemic interval(an earlier epidemic in Campania occurred in 1996) and ashift of the disease incidence toward older age groups duringthe 2002 epidemic.
The findings in this report are subject to at least two limita-tions. First, although SPES is four times more sensitive thanstatutory notification in detecting measles cases at the nationallevel, and 22 times more sensitive in southern Italy (1), itobtains data only on children aged <15 years. Because inci-dence data on older adolescents and adults were lacking, theextent of the epidemic probably was underestimated, and
biased age distribution of cases probably occurred. Becauseincidence increased with age and peaked among children aged10–14 years, many cases probably occurred among personsaged >15 years, which is consistent with data obtained throughthe hospital record review. Second, provincial results shouldbe interpreted cautiously. SPES was designed to obtain infor-mation at the regional level. Although the large number ofchildren in Campania under surveillance permitted estima-tion of incidence figures for each province, not all provinceswere represented equally.
In Italy in 1979, measles vaccination was recommended forchildren aged >15 months. During the early 1990s, combinedMMR vaccines were introduced, and in 1999, the recom-mended age of administration was lowered to 12–15 months.In areas where vaccine coverage among infants aged <2 yearswas >80%, administration of a second dose at age 5–6 yearsor at age 11–12 years has been recommended since 1999.However, each of the country’s 20 regions establishes its ownmeasles vaccination policy, and adherence to recommenda-tions has not been universal. As a result, national vaccinationcoverage with 1 dose of MMR vaccine by age 24 monthsremains inadequate, with an estimated coverage of 74% in2001 (6). Coverage is lowest in southern Italy (7).
Italy’s Field Epidemiology Training Program (FETP, knownlocally as PROFEA) assisted in this investigation. Modeledafter CDC’s Epidemic Intelligence Service, PROFEA was cre-ated to establish an experienced group of epidemiologists atlocal and regional levels.
Measles elimination requires achieving and sustaining 2-dosecoverage of >95% in multiple subsequent cohorts, eitherthrough routine vaccination (8) or a combination of routineand supplemental immunization activities (9). The WorldHealth Organization’s European Region aims to eliminatemeasles by 2007, but large differences in vaccination coverageand disease incidence exist among European countries (10).In Italy, the interruption of measles transmission can beachieved at the national level only with coordinated and uni-form actions throughout the country. For this reason, anational plan has been developed jointly by regional healthauthorities, the National Institute of Health, and the Minis-try of Health. Key strategies to achieve measles elimination inItaly include 1) improving routine coverage with 1 dose ofMMR vaccine to >95% of children aged 24 months, 2) con-ducting a national “catch-up” vaccination campaign for chil-dren aged 6–13 years during 2004–2005, 3) achieving andsustaining a high coverage with a second routine dose of MMRvaccine among children aged 5–6 years while administeringthe MMR vaccine simultaneously with the DTaP booster doseincluded in the national schedule, and 4) strengthening sur-veillance.
Vol. 52 / No. 43 MMWR 1047
References1. Bove C, Caiazzo AL, Castiello R, et al. Survey on childhood vaccine
coverage in Campania. National Epidemiologic Bulletin 2002. Avail-able at http://www.epicentro.iss.it/ben/pre_2002/marzo02/1.htm.
2. Ciofi degli Atti ML, Salmaso S, Bella A, et al. Paediatric sentinel sur-veillance of vaccine-preventable diseases in Italy: Pediatr Infect Dis J2002;21:763–9.
3. CDC. Case definitions for infectious conditions under public healthsurveillance. MMWR 1997;46(No. RR-10).
4. Ciofi degli Atti ML, Salmaso S, Vellucci L, Caraffa De Stefano D.New measles epidemic in southern Italy: 1,217 cases reported to senti-nel surveillance, January–May 2003. Euro Surveill 2003. Available athttp://www.eurosurveillance.org/ew/2003/030703.asp.
5. The Italian Vaccine Coverage Survey Working Group. Childhood vac-cination coverage in Italy: results of a seven-regions survey. Bull WorldHealth Organ 1994;72:885–95.
6. Italian Ministry of Health. Routine vaccination coverage data. Avail-able at http://www.ministerosalute.it/promozione/malattie/dati_statistici.jsp?label=cop.
7. Salmaso S, Rota MC, Ciofi degli Atti ML, Tozzi AE, Kreidl P, ICONAStudy Group. Infant immunization coverage in Italy by cluster surveyestimates. Bull World Health Organ 1999;77:843–51.
8. Peltola H, Heinonen OP, Valle M, et al. The elimination of indig-enous measles, mumps and rubella from Finland by a 12-year, two-dose vaccination program. N Engl J Med 1994;331:1397–402.
9. Biellik R, Madema S, Taole A, et al. First 5 years of measles elimina-tion in Southern Africa: 1996–2000. Lancet 2002;359:1564–8.
10. Spika JS, Wassilak S, Pebody R, et al. Measles and rubella in the WorldHealth Organization European region: diversity creates challenges.J Infect Dis 2003;187:S191–S197.
Barium Toxicity After Exposureto Contaminated Contrast Solution
— Goias State, Brazil, 2003Barium-containing contrast solutions are commonly used
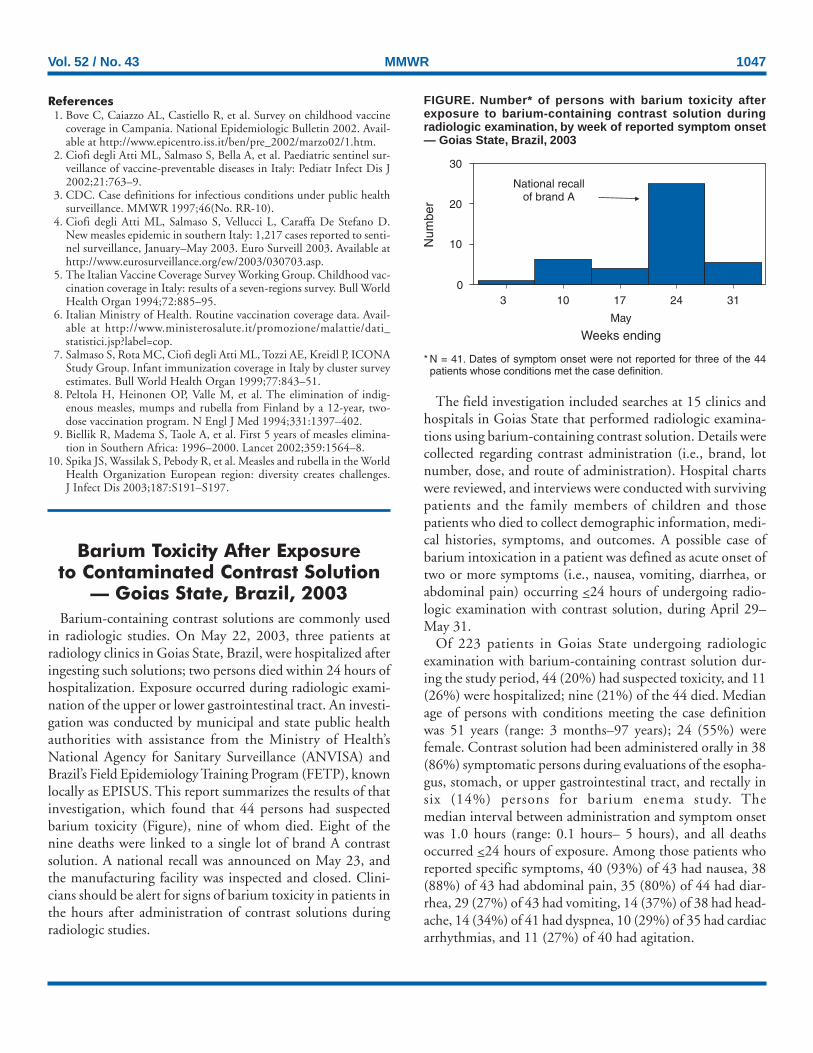
in radiologic studies. On May 22, 2003, three patients atradiology clinics in Goias State, Brazil, were hospitalized afteringesting such solutions; two persons died within 24 hours ofhospitalization. Exposure occurred during radiologic exami-nation of the upper or lower gastrointestinal tract. An investi-gation was conducted by municipal and state public healthauthorities with assistance from the Ministry of Health’sNational Agency for Sanitary Surveillance (ANVISA) andBrazil’s Field Epidemiology Training Program (FETP), knownlocally as EPISUS. This report summarizes the results of thatinvestigation, which found that 44 persons had suspectedbarium toxicity (Figure), nine of whom died. Eight of thenine deaths were linked to a single lot of brand A contrastsolution. A national recall was announced on May 23, andthe manufacturing facility was inspected and closed. Clini-cians should be alert for signs of barium toxicity in patients inthe hours after administration of contrast solutions duringradiologic studies.
The field investigation included searches at 15 clinics andhospitals in Goias State that performed radiologic examina-tions using barium-containing contrast solution. Details werecollected regarding contrast administration (i.e., brand, lotnumber, dose, and route of administration). Hospital chartswere reviewed, and interviews were conducted with survivingpatients and the family members of children and thosepatients who died to collect demographic information, medi-cal histories, symptoms, and outcomes. A possible case ofbarium intoxication in a patient was defined as acute onset oftwo or more symptoms (i.e., nausea, vomiting, diarrhea, orabdominal pain) occurring <24 hours of undergoing radio-logic examination with contrast solution, during April 29–May 31.
Of 223 patients in Goias State undergoing radiologicexamination with barium-containing contrast solution dur-ing the study period, 44 (20%) had suspected toxicity, and 11(26%) were hospitalized; nine (21%) of the 44 died. Medianage of persons with conditions meeting the case definitionwas 51 years (range: 3 months–97 years); 24 (55%) werefemale. Contrast solution had been administered orally in 38(86%) symptomatic persons during evaluations of the esopha-gus, stomach, or upper gastrointestinal tract, and rectally insix (14%) persons for barium enema study. Themedian interval between administration and symptom onsetwas 1.0 hours (range: 0.1 hours– 5 hours), and all deathsoccurred <24 hours of exposure. Among those patients whoreported specific symptoms, 40 (93%) of 43 had nausea, 38(88%) of 43 had abdominal pain, 35 (80%) of 44 had diar-rhea, 29 (27%) of 43 had vomiting, 14 (37%) of 38 had head-ache, 14 (34%) of 41 had dyspnea, 10 (29%) of 35 had cardiacarrhythmias, and 11 (27%) of 40 had agitation.
FIGURE. Number* of persons with barium toxicity afterexposure to barium-containing contrast solution duringradiologic examination, by week of reported symptom onset— Goias State, Brazil, 2003
* N = 41. Dates of symptom onset were not reported for three of the 44patients whose conditions met the case definition.
0
10
20
30
3 10 17 24 31
May
Weeks ending
Num
ber
National recallof brand A

1048 MMWR October 31, 2003
In Goias State, three brands of barium-containing contrastsolution were used by radiology clinics during the outbreakperiod. However, a single lot of brand A contrast solution wasassociated with eight (89%) of the nine deaths. Although brandA was not administered routinely at the clinic visited by theninth victim, medical staff believed brand A might have beenadministered unintentionally after purchase at a local phar-macy. Laboratory testing of unopened containers of the impli-cated lot of contrast solution showed the concentration of solublebarium was 7,190 + 863 mg/L (mean + 1 s.d.) compared witha reference standard of <5 mg/L (1). In the implicated lot ofcontrast solution, soluble barium salts (e.g., carbonate or sulfite)were present at approximately 12,370 mg/100 mL (most fre-quent solution dosage was 150 mL). Previous findings basedon animal and human data suggest a lethal oral dose forhumans in the range of 2,000 mg–4,000 mg (2).
Active searches in other states using the same case defini-tion found that, overall, barium toxicity likely occurred inseven (58%) of the 12 states where brand A was distributed.In states other than Goias, 25 persons were identified withsuspected barium toxicity; six (24%) died. A site inspectionof the factory producing brand A documented purchases ofprimary ingredients that were not of pharmaceutical grade.In response, ANVISA revoked the manufacturer’s license andforced closure of all facilities.Reported by: RF Silva, National Institute for Quality Control inHealth; LQ Santi, AA Santos, MD, F Freitas, Investigation andPrevention of Infection and Adverse Events Unit; MF Dias, MPH,Pharmacological Surveillance Unit; PA Bezerra, National Agency forSanitary Surveillance; LZ Daufenbach, CP Nascimento, FieldEpidemiology Training Program; EH Carmo, MD, Dept ofEpidemiological Surveillance; JB da Silva, MD, National Secretariatof Health Surveillance, Ministry of Health, Brazil. DL Hatch, MD,Div of International Health, Epidemiology Program Office, CDC.
Editorial Note: Radio-opaque solutions containing bariumare used worldwide to provide contrast for diagnostic radio-graphic examinations, mainly of the gastrointestinal tract (3).Barium sulfate has minimal toxicity when used in contrastsolutions because this salt is insoluble in water or lipid andnot normally absorbed by the gastrointestinal mucosa. Nev-ertheless, severe, life-threatening intoxication can occur afteringestion or inhalation of even minute amounts of theabsorbable salts of barium (e.g., barium chloride, carbonate,or sulfide) during radiologic examination or in occupationalsettings (e.g., mining, refining operations, or production offireworks or rodenticides) (4–7).
Brazil’s FETP assisted in this investigation. Created in 2000to establish an experienced core group of epidemiologists inthe Ministry of Health, the program has trained 21 epidemi-ologists to rapidly investigate infectious disease outbreaks,
natural disasters, and other events of public health impor-tance.
Nausea, vomiting, and profuse watery diarrhea can occurrapidly after exposure to soluble barium salts. Symptoms ofintoxication can include severe muscle weakness, respiratoryarrest, coma, cardiac arrhythmia, or electrolyte imbalance (e.g.,severe hypokalemia) (8–10). Clinicians should watch for signsof barium toxicity in persons receiving contrast solutions dur-ing radiologic studies and be prepared to monitor and stabi-lize cardiorespiratory dysfunction or electrolyte imbalances thatmight occur rapidly after exposure. In addition, regulatorsshould ensure that only pharmaceutical grade barium sulfateis used in the production of contrast solution for radiologicstudies.
AcknowledgmentsThis report is based in part on contributions by LC Alencar,
MA Vieira, PC Eliam, FM Barbosa, Dept of Sanitary Surveillance,Municipal Secretary of Health, Goiânia; AG Araújo, DD Dias,Center for Toxicological Information; AM Cardoso, SA Silva,GS Mendonça, JF Moraes, MC Brito, Dept of Sanitary Surveillance;LF Tomé, NC Paula, Central Public Health Laboratory;MA Fernandes, VG Albernaz, PC Fonseca, Dept of EpidemiologicalSurveillance, State Secretariat of Health, Goias State, Brazil.J Stocklin, U.S. Food and Drug Administration, Washington,DC. RL Jones, PhD, J Osterloh, MD, Div of Laboratory Sciences,National Center for Environmental Health, CDC.
References1. National Agency for Sanitary Surveillance. ANVISA preliminary report:
investigation of outbreak of barium toxicity, Goias. Brasilia, Brazil:Ministry of Health, National Agency for Sanitary Surveillance, 2003.
2. National Institute for Occupational Safety and Health. Barium (solublecompounds, as Ba). In: Documentation for immediately dangerous tolife or health concentrations. Washington, DC: U.S. Department ofHealth and Human Services, National Institute for Occupational Safetyand Health, CDC, 1994; NTIS publication no. PB-94-195047. Avail-able at http://www.cdc.gov/niosh/idlh/7440393.html.
3. Ott DJ, Gelfand DW. Gastrointestinal contrast agents: indications,uses, and risks. JAMA 1983;249:2380–4.
4. Gould DB, Sorrell MR, Lupariello AD. Barium sulfide poisoning: somefactors contributing to survival. Arch Intern Med 1973;132:891–4.
5. Wetherill SF, Guarino MJ, Cox RW. Acute renal failure associated withbarium chloride poisoning. Ann Intern Med 1981;95:187–8.
6. McNally WD. Two deaths from administration of barium salts. JAMA1925;84:1805–7.
7. National Institute for Occupational Safety and Health. NIOSH pocketguide to chemical hazards (NPG). Washington, DC: U.S. Departmentof Health and Human Services, National Institute for OccupationalSafety and Health, CDC, 2003; DHHS publication no. (NIOSH) 97-140. Available at http://www.cdc.gov/niosh/npg/npg.html.
8. Ahlawat SK, Sachdev A. Hypokalaemic paralysis. Postgrad Med J1999;75:193–7.
9. Roza O, Berman LB. The pathophysiology of barium: hypokalemicand cardiovascular effects. J Pharmacol Exp Ther 1971;177:433–9.
10. Berning J. Hypokalaemia of barium poisoning (Letter). Lancet1975;1:110.

Vol. 52 / No. 43 MMWR 1049
Assessment of the EpidemiologicCapacity in State and Territorial
Health Departments —United States, 2001
Epidemiology is essential for the detection, control, andprevention of major health problems. Described as the foun-dation of all public health functions (1), epidemiology pro-vides information needed to perform the 10 essential publichealth services (2). One of the national health objectives for2010 calls for increases in the proportion of tribal, state, andlocal public health agencies that provide or ensure compre-hensive epidemiology services to support essential public healthservices (objective 23-14) (3). Although national infectiousdisease capacity has been assessed (4–6), no comprehensivenational assessment of epidemiologic capacity has been con-ducted. To assess core epidemiology and infectious diseasecapacity of public health departments, the Council of Stateand Territorial Epidemiologists (CSTE) surveyed state andterritorial health departments in November 2001 (7), imme-diately before the release of approximately $1 billion in fed-eral funding to state health departments for terrorism andpublic health emergency preparedness. This report summa-rizes the results of that survey, which indicate that thenational epidemiology infrastructure in state and local healthdepartments is far below optimal capacity and that approxi-mately 42% of epidemiologists working in public health haveno formal epidemiologic training. Although recent terrorismpreparedness initiatives have improved capacity in infectiousdisease epidemiology, increased resources are needed to buildepidemiologic capacity necessary to address the major causesof morbidity and mortality.
In October 2001, a draft version of the EpidemiologyCapacity Assessment (ECA) was piloted in 10 states. InNovember, the final version was sent electronically and by mailto the 50 states, the District of Columbia, and the five territo-ries. Responses were received during November 2001–April2002. ECA included general questions about the epidemiologyworkforce and specific questions pertaining to the 10 essentialpublic health services. Of the 108 questions, 22 addressed coreepidemiologic capacity, and 86 addressed infectious diseasecapacity. State epidemiologists were identified as key informants,and follow-up was made by telephone and e-mail tononresponding states. A total of 41 states and three territories(78.6%) responded to the survey.
As of November 2001, responding state and territorial healthdepartments employed 1,366 persons as epidemiologists inall program areas; 652 (47.7%) worked in infectious diseaseprograms, and <50 worked in each of the areas of injury epi-demiology, occupational epidemiology, or oral health. A total
of 77 (5.6%) persons were former CDC Epidemic IntelligenceService (EIS) officers. Among persons employed as epidemi-ologists in state health departments, the level of training var-ied substantially (Table); 787 (42.4%) persons had no formaltraining in epidemiology. Formal training included either aca-demic coursework or other training in epidemiology (e.g., theEIS program).
The median total state (n = 26) expenditure for all epidemi-ology programs was $2.7 million (interquartile range [IQR]:$1.15 million–$6.6 million), with a median per-capitaexpenditure of $0.70 (IQR: $0.31–$1.73). Federal sourcesprovided 61.3% and state sources 36.6% of funding for allepidemiology programs in the reporting state and territories(n = 42).
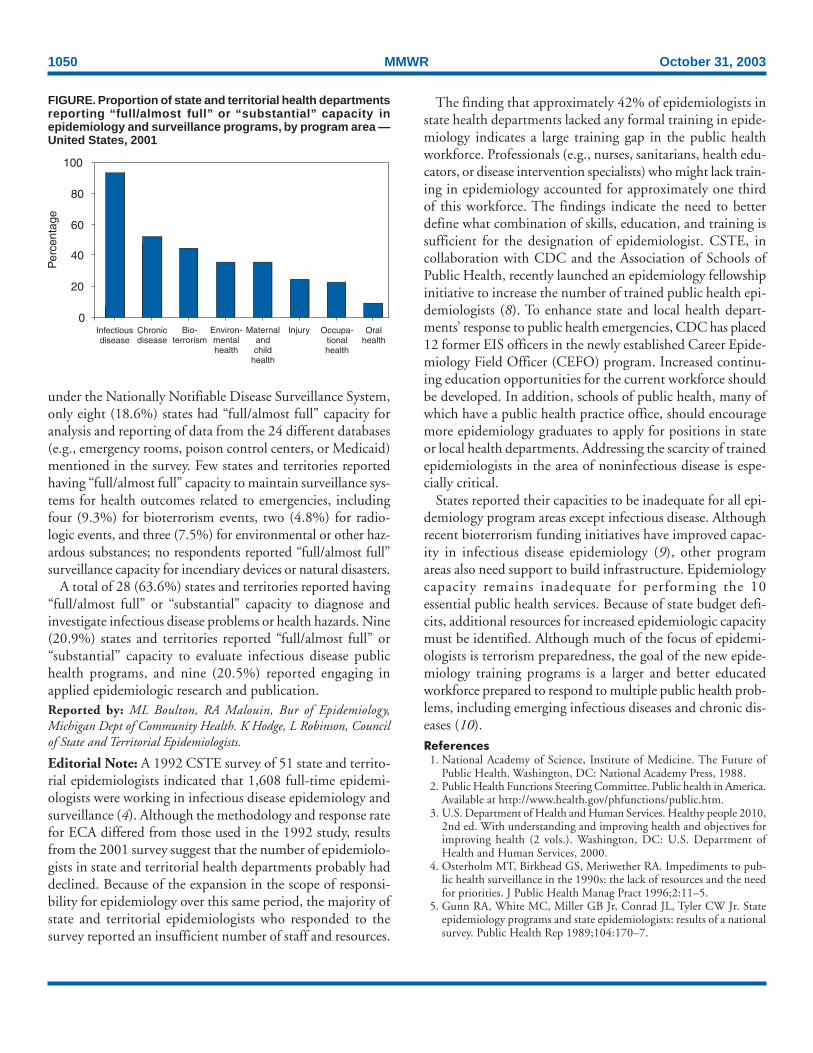
States were asked to assess core epidemiologic capacity ineight program areas (i.e., infectious disease, chronic disease,maternal/child health, injury, bioterrorism/emergency man-agement, environmental health, oral health, and occupationalhealth) by using a four-point scale* based on the estimatedpercentage of the activity or resource described in the ques-tion that was met (Figure). In addition, states were asked toassess the four essential public health services with a substan-tial epidemiologic component. “Partial” or “minimal to no”capacity was reported by 24 (54.5%) respondents in moni-toring health status to identify and solve community healthproblems; 17 (39.5%) in diagnosing and investigating healthproblems and health hazards in the community; 32 (72.7%)in evaluating effectiveness, accessibility, and quality of per-sonal and population-based services; and 41 (93.2%) in con-ducting research for new insights and innovative solutions tohealth problems.
States’ self-assessed capacity for conducting the 10 essentialservices varied substantially. Although 31 (72.1%) statesreported “full/almost full” capacity to monitor all diseases
* “Full/almost full”: 75%–100% of activity or resource described in the questionis met; “substantial”: 50%–75%; “partial”: 25%–50%; or “minimal to no”:<25%.
TABLE. Number* and percentage of epidemiologists in stateand territorial† health departments with academic training, bydegree§/level of training — United States, 2001Degree/Level of training No. (%)
Doctoral degree 390 (28.6)Masters degree 546 (40.0)Baccalaureate degree 252 (18.4)Other degree/training 179 (13.1)
* N = 1,366.†The reporting territories (n = three) had the lowest proportion of personswith doctoral degrees (15.9%) and the highest proportion of epidemiologistswith “other training” (28.4%).
§Academic degrees might be in areas other than public health orepidemiology; 787 (42.4%) epidemiologists had no formal training inepidemiology.
1050 MMWR October 31, 2003
under the Nationally Notifiable Disease Surveillance System,only eight (18.6%) states had “full/almost full” capacity foranalysis and reporting of data from the 24 different databases(e.g., emergency rooms, poison control centers, or Medicaid)mentioned in the survey. Few states and territories reportedhaving “full/almost full” capacity to maintain surveillance sys-tems for health outcomes related to emergencies, includingfour (9.3%) for bioterrorism events, two (4.8%) for radio-logic events, and three (7.5%) for environmental or other haz-ardous substances; no respondents reported “full/almost full”surveillance capacity for incendiary devices or natural disasters.
A total of 28 (63.6%) states and territories reported having“full/almost full” or “substantial” capacity to diagnose andinvestigate infectious disease problems or health hazards. Nine(20.9%) states and territories reported “full/almost full” or“substantial” capacity to evaluate infectious disease publichealth programs, and nine (20.5%) reported engaging inapplied epidemiologic research and publication.Reported by: ML Boulton, RA Malouin, Bur of Epidemiology,Michigan Dept of Community Health. K Hodge, L Robinson, Councilof State and Territorial Epidemiologists.
Editorial Note: A 1992 CSTE survey of 51 state and territo-rial epidemiologists indicated that 1,608 full-time epidemi-ologists were working in infectious disease epidemiology andsurveillance (4). Although the methodology and response ratefor ECA differed from those used in the 1992 study, resultsfrom the 2001 survey suggest that the number of epidemiolo-gists in state and territorial health departments probably haddeclined. Because of the expansion in the scope of responsi-bility for epidemiology over this same period, the majority ofstate and territorial epidemiologists who responded to thesurvey reported an insufficient number of staff and resources.
The finding that approximately 42% of epidemiologists instate health departments lacked any formal training in epide-miology indicates a large training gap in the public healthworkforce. Professionals (e.g., nurses, sanitarians, health edu-cators, or disease intervention specialists) who might lack train-ing in epidemiology accounted for approximately one thirdof this workforce. The findings indicate the need to betterdefine what combination of skills, education, and training issufficient for the designation of epidemiologist. CSTE, incollaboration with CDC and the Association of Schools ofPublic Health, recently launched an epidemiology fellowshipinitiative to increase the number of trained public health epi-demiologists (8). To enhance state and local health depart-ments’ response to public health emergencies, CDC has placed12 former EIS officers in the newly established Career Epide-miology Field Officer (CEFO) program. Increased continu-ing education opportunities for the current workforce shouldbe developed. In addition, schools of public health, many ofwhich have a public health practice office, should encouragemore epidemiology graduates to apply for positions in stateor local health departments. Addressing the scarcity of trainedepidemiologists in the area of noninfectious disease is espe-cially critical.
States reported their capacities to be inadequate for all epi-demiology program areas except infectious disease. Althoughrecent bioterrorism funding initiatives have improved capac-ity in infectious disease epidemiology (9), other programareas also need support to build infrastructure. Epidemiologycapacity remains inadequate for performing the 10essential public health services. Because of state budget defi-cits, additional resources for increased epidemiologic capacitymust be identified. Although much of the focus of epidemi-ologists is terrorism preparedness, the goal of the new epide-miology training programs is a larger and better educatedworkforce prepared to respond to multiple public health prob-lems, including emerging infectious diseases and chronic dis-eases (10).References
1. National Academy of Science, Institute of Medicine. The Future ofPublic Health. Washington, DC: National Academy Press, 1988.
2. Public Health Functions Steering Committee. Public health in America.Available at http://www.health.gov/phfunctions/public.htm.
3. U.S. Department of Health and Human Services. Healthy people 2010,2nd ed. With understanding and improving health and objectives forimproving health (2 vols.). Washington, DC: U.S. Department ofHealth and Human Services, 2000.
4. Osterholm MT, Birkhead GS, Meriwether RA. Impediments to pub-lic health surveillance in the 1990s: the lack of resources and the needfor priorities. J Public Health Manag Pract 1996;2:11–5.
5. Gunn RA, White MC, Miller GB Jr, Conrad JL, Tyler CW Jr. Stateepidemiology programs and state epidemiologists: results of a nationalsurvey. Public Health Rep 1989;104:170–7.
FIGURE. Proportion of state and territorial health departmentsreporting “full/almost full” or “substantial” capacity inepidemiology and surveillance programs, by program area —United States, 2001
0
20
40
60
80
100
Per
cent
age
Infectiousdisease
Chronicdisease
Bio-terrorism
Environ-mentalhealth
Maternalandchild
health
Injury Occupa-tionalhealth
Oralhealth

Vol. 52 / No. 43 MMWR 1051
Online
know what matters.
e xplore.Trekking through medical and scientific literature on the Web can
sometimes be a long journey – but not at MMWR Online.
Whether you're researching past CDC reports or looking for the
latest updates on important medical topics, MMWR Online quickly
guides you to the information you need, free of charge.
Log on to cdc.gov/mmwr and boldly discover more.
6. Williams SJ, Tyler CW Jr, Clark L, Coleman L, Curran P. Epidemiolo-gists in the United States: an assessment of the current supply and theanticipated need. Am J Prev Med 1988;4:231–8.
7. Council of State and Territorial Epidemiologists. National Assessmentof Epidemiologic Capacity in Public Health: Findings and Recom-mendations. Available at http://www.cste.org/pdffiles/ecacover1.pdf.
8. Moore K. The CSTE/CDC Applied Epidemiology Fellowship Pro-gram: Implementation Plan. Atlanta, Georgia: Council of State andTerritorial Epidemiologists, 2003. Available at http://www.cste.org/pdffiles/WFImplementation%20coverstairs2.pdf.
9. CDC. Terrorism preparedness in state health departments—UnitedStates, 2001–2003. MMWR 2003;52:1051–3.
10. Gewin V. With the United States on high alert over the possibility ofbioterror attacks, epidemiologists are in huge demand. Nature2003;423:784–5.
Terrorism Preparednessin State Health Departments —
United States, 2001–2003The anthrax attacks in fall 2001 highlighted the role of
infectious disease (ID) epidemiologists in terrorism prepared-ness and response. Beginning in 2002, state health depart-ments (SHDs) received approximately $1 billion in new federalfunding to prepare for and respond to terrorism, infectiousdisease outbreaks, and other public health threats and emer-
gencies (1). This funding is being used in part to improveepidemiologic and surveillance capabilities. To determine howstates have used a portion of their new funding to increase IDepidemiology capacity, the Iowa Department of Public Health’sCenter for Acute Disease Epidemiology and the Iowa StateUniversity Department of Microbiology conducted two sur-veys of U.S. state epidemiologists during September 2000–August 2001 and October 2002–June 2003. This reportsummarizes the results of these surveys, which determined thatalthough the number of SHD epidemiology workers assignedto ID and terrorism preparedness increased by 132%, con-cerns remained regarding the ability of SHDs to hire quali-fied personnel. These findings underscore the need to developadditional and more diverse training venues for current andfuture ID epidemiologists.
All 50 SHDs responded to both surveys. A total of 47 SHDsreported adding or expecting to add ID epidemiologists, whowere assigned various responsibilities (e.g., terrorism prepared-ness, ID and terrorist agent surveillance, outbreak and pos-sible terrorist threat investigation, public health worker andhealth-care provider training, and grant writing) (Table 1).Overall, during 2001–2003, the number of epidemiologyworkers employed in ID and terrorism preparedness increasedby 132%, from 366 to 848 (Table 2).

1052 MMWR October 31, 2003
TABLE 1. Number and percentage of state health departmentshiring epidemiology workers, by planned activities — UnitedStates, 2001–2003Activity No.* (%)
Develop surveillance activities for possibleterrorist agents and infectious diseases 47/47 (100)
Investigate outbreaks and possibleterrorist threats 46/47 (98)
Train public health workers 44/47 (94)Develop and test epidemiologic plans forterrorism preparedness 43/46 (93)
Train health-care providers 43/47 (91)Write grants for funding 29/47 (62)Perform other duties† 23/47 (49)
* Number who responded “yes” versus all respondents who answered thequestion.
†Including community education and collaborating with other agencies.
TABLE 2. Number* and percentage increase of state healthdepartment epidemiology workers employed in infectious dis-ease (ID) and terrorism preparedness — United States, 2001–2003
New Expected Expected %No. in hires in new hires total increase
State 2001 2002 2003 2003 2001–2003
Alabama 3 0 2 5 67Alaska 3 0 1 4 33Arizona 7 6 1 14 100Arkansas 4 2 0 6 50California 8 4 4 16 100Colorado 16 0 14 30 88Connecticut 1 11 6 18 1,700Delaware 6 2 1 9 50Florida 20 5 11 36 80Georgia 30 12 2 44 47Hawaii 3 2 0 5 66Idaho 2 2 0 4 100Illinois 45 5 4 54 20Indiana 7 0 11 18 157Iowa 4 0 6 10 150Kansas 4 5 2 11 175Kentucky 5 6 10 21 320Louisiana 18 14 9 41 128Maine 7 2 3 12 71Maryland 1 16 4 21 2,000Massachusetts 30 0 0 30 0Michigan 3 7 5 15 400Minnesota 4 0 7 11 175Mississippi 9 3 2 14 55Missouri 7 35 6 48 586Montana 1 1 0 2 100Nebraska 2 3 1 6 200Nevada 4 0 2 6 50New Hampshire 2 1 4 7 250New Jersey 11 6 8 25 127New Mexico 3 12 5 20 566New York 14 9 4 27 93North Carolina 2 1 10 13 400North Dakota 2 0 0 2 0Ohio 2 4 0 6 200Oklahoma 4 0 4 8 100Oregon 10 5 0 15 50Pennsylvania 1 17 0 18 1,700Rhode Island 1 0 0 1 0South Carolina 4 12 5 21 425South Dakota 1 1 4 6 500Tennessee 3 11 3 17 466Texas 7 19 4 30 429Utah 10 8 6 24 140Vermont 7 1 2 10 43Virginia 7 23 15 45 543Washington 6 4 3 13 117West Virginia 6 5 1 12 100Wisconsin 6 2 0 8 33Wyoming 3 5 1 9 200
Totals 366 289 193 848 132
* The numbers of ID epidemiologists employed by certain states (e.g.,Vermont) are disproportionately high for the states populations becauseno local or regional health departments exist. Other states have acquirednew ID epidemiologists primarily at the regional or local level, and thosehirings are not indicated.
Despite these hiring increases, the surveys identified mul-tiple challenges, including problems 1) allocating time for plan-ning (66% of responding SHDs), 2) establishing diseasesurveillance systems (55%), and 3) hiring qualified ID epide-miologists (57%). Other challenges to preparedness includedthe complexity of food-security issues, state hiring freezes andbudget deficits, political and public policy considerations, anddifficulty allocating the necessary time and resources for thepre-event smallpox vaccination program.Reported by: G Shipp, MPA, J Dickson, PhD, Iowa State Univ, Ames;P Quinlisk, MD, C Lohff, MD, Iowa Dept of Public Health, Des Moines,Iowa. N Franklin, 2002 Knight Public Health Journalism FellowshipProgram, CDC Foundation, CDC.
Editorial Note: Long before the terrorist attacks of Septem-ber 11, 2001, and the subsequent anthrax attacks, public healthofficials recognized that the U.S. public health infrastructurewas not equipped to respond adequately to events of biologicterrorism and other national public health emergencies (2).In 2003, the number of qualified persons employed in micro-bial threat preparedness remains dangerously low (3). Since2001, Congress has appropriated increased amounts of fund-ing to improve the overall capacity of state public healthdepartments for terrorism preparedness (1). This funding waskey to increasing the number of ID epidemiologists and thesurveillance and response capabilities of SHDs. However, bar-riers to preparedness remain, and continued public, political,and financial support are essential to removing these barriers.
The findings in this report are subject to at least two limita-tions. First, the surveys were conducted during a period whenthe responsibilities of ID epidemiologists were in rapid tran-sition, making consistent categorizing by utilization difficult.Second, although all SHD workers described in the surveysperformed duties related to epidemiology, because of broaddifferences in academic background and experience, thenature of their roles and abilities were highly variable.

Vol. 52 / No. 43 MMWR 1053
The findings in this report reflect concerns expressed byrespondents to the national Epidemiology Capacity Assess-ment (ECA) regarding inadequate epidemiology staff andresources to conduct the 10 essential public health services(4). In the ECA survey, as of November 2001, approximately42% of epidemiology workers were reported to have had noformal training in epidemiology, underscoring the need forincreased curricula and training programs to improve thecapabilities of current and future state and locally based IDepidemiologists.References1. U.S. Department of Health and Human Services. Bioterrorism prepared-
ness grants (fact sheet 2002.06.06). Available at http://www.hhs.gov/news/press/2002pres/20020606b.html.
2. Lederberg J, Shope RE, Oaks SC Jr, eds. Emerging Infections: Micro-bial Threats to Health in the United States. Washington, DC: Instituteof Medicine, National Academy Press, 1992:137. Available at http://www.nap.edu/books/0309047412/html/index.html.
3. Smolinski MS, Hamburg MA, Lederberg J, eds. Microbial Threats toHealth: Emergence, Detection and Response. Washington, DC: Insti-tute of Medicine, National Academy Press, 2003:181. Available athttp://www.nap.edu/books/030908864X/html.
4. CDC. Assessment of the epidemiologic capacity in state and territorialhealth departments—United States, 2001. MMWR 2003;52:1049–51.
West Nile Virus Activity — UnitedStates, October 23–29, 2003
This report summarizes West Nile virus (WNV) surveil-lance data reported to CDC through ArboNET as of 3 a.m.,Mountain Standard Time, October 29, 2003.
During the reporting week of October 23–29, a total of332 human cases of WNV infection were reported from 22states (Arizona, Georgia, Illinois, Iowa, Kansas, Kentucky, Mas-sachusetts, Minnesota, Montana, Nebraska, New Mexico, NewYork, North Carolina, North Dakota, Ohio, Oklahoma, Penn-sylvania, South Dakota, Tennessee, Texas, Vermont, and Vir-ginia), including 11 fatal cases from three states (Kansas,Nebraska, and South Dakota). During the same period, WNVinfections were reported in 330 dead birds, 450 mosquitopools, 147 horses, and one unidentified animal species.
During 2003, a total of 7,718 human cases of WNV infec-tion have been reported from Colorado (n = 2,170), Nebraska(n = 1,540), South Dakota (n = 964), Texas (n = 470), NorthDakota (n = 422), Wyoming (n = 320), Montana (n = 218),Pennsylvania (n = 212), New Mexico (n = 196), Iowa (n = 141),Minnesota (n = 137), Ohio (n = 95), Kansas (n = 85), Louisi-ana (n = 84), Oklahoma (n = 68), New York (n = 67), Missis-sippi (n = 56), Illinois (n = 48), Maryland (n = 45), Missouri(n = 43), Georgia (n = 36), Florida (n = 32), Alabama (n = 30),Indiana (n = 30), New Jersey (n = 26), North Carolina (n = 23),
Arkansas (n = 21), Virginia (n = 21), Tennessee (n = 20),Massachusetts (n = 17), Kentucky (n = 14), Delaware (n = 13),Wisconsin (n = 13), Connecticut (n = 12), Michigan (n = six),Rhode Island (n = five), Arizona (n = three), District ofColumbia (n = three), Vermont (n = three), California(n = two), Nevada (n = two), New Hampshire (n = two),South Carolina (n = one), Utah (n = one), and West Virginia(n = one) (Figure). Of 7,588 (98%) cases for which demo-graphic data were available, 4,012 (53%) occurred amongmales; the median age was 47 years (range: 1 month–99 years),and the dates of illness onset ranged from March 28 to Octo-ber 21. Of the 7,588 cases, 166 fatal cases were reported fromColorado (n = 44), Nebraska (n = 20), Texas (n = 17), SouthDakota (n = 12), New York (n = eight), Wyoming (n = eight),Pennsylvania (n = six), Maryland (n = five), Georgia (n = four),Iowa (n = four), Kansas (n = four), Minnesota (n = four),New Mexico (n = four), North Dakota (n = four), Alabama(n = three), Ohio (n = three), Indiana (n = two), Missouri(n = two), Montana (n = two), New Jersey (n = two), Dela-ware (n = one), Illinois (n = one), Kentucky (n = one), Loui-siana (n = one), Michigan (n = one), Mississippi (n = one),Tennessee (n = one), and Virginia (n = one). A total of 709presumptive West Nile viremic blood donors have beenreported to ArboNET, including 619 (87%) from the follow-ing nine western and midwestern states: Colorado, Kansas,Nebraska, New Mexico, North Dakota, Oklahoma, SouthDakota, Texas, and Wyoming. Of the 534 donors for whomdata are reported completely, six (1%) subsequentlyhad neuroinvasive disease (median age: 45 years [range:28–76 years]), and 79 (15%) had West Nile fever.
FIGURE. Areas reporting West Nile virus (WNV) activity —United States, 2003*
* As of 3 a.m., Mountain Standard Time, October 29, 2003.
Human WNV disease and animal WNV activity
Animal WNV activity only

1054 MMWR October 31, 2003
In addition, 10,783 dead birds with WNV infection havebeen reported from 42 states, the District of Columbia, andNew York City; 3,471 WNV infections in horses, 16 WNVinfections in dogs, 14 infections in squirrels, and 25 infec-tions in unidentified animal species have been reported from40 states. During 2003, WNV seroconversions have beenreported in 1,287 sentinel chicken flocks from 15 states. Ofthe 52 seropositive sentinel horses reported, Illinois reported41, Minnesota, seven; South Dakota, three; and West Vir-ginia, one. In addition, seropositivity was reported from oneother unidentified animal species. A total of 7,117 WNV-positive mosquito pools have been reported from 38 states,the District of Columbia, and New York City.
Additional information about WNV activity is availablefrom CDC at http://www.cdc.gov/ncidod/dvbid/westnile/index.htm and http://westnilemaps.usgs.gov.
Notice to Readers
Epidemiology in Action:Intermediate Methods
CDC and Emory University’s Rollins School of PublicHealth will co-sponsor a course, “Epidemiology in Action:Intermediate Methods” on February 23–27, 2004, at EmoryUniversity, Rollins School of Public Health. The course isdesigned for practicing public health professionals who havehad training and experience in basic applied epidemiologyand now would like training in additional quantitative skillsrelated to analysis and interpretation of epidemiologic data.
The course includes a review of the fundamentals ofdescriptive epidemiology and biostatistics, measures of asso-ciation, normal and binomial distributions, confounding, sta-tistical tests, stratification, logistic regression, models, andcomputers as used in epidemiology. Prerequisite is an intro-
ductory course in epidemiology, such as Epidemiology inAction, International Course in Applied Epidemiology, or anyother introductory class. Tuition will be charged.
The application deadline is January 15, 2004. Additionalinformation and applications are available from Emory Uni-versity, International Health Department (Pia), 1518 CliftonRoad N.E., Room 746, Atlanta, Georgia 30322; telephone,404-727-3485; fax, 404-727-4590; or e-mail, [email protected].
Notice to Readers
Vaccine Delivery TechnologiesThe U.S. Department of Health and Human Services
(DHHS) is sponsoring the Conference on Innovative Admin-istration Systems for Vaccines, to be held December 18–19,2003, in Rockville, Maryland. The conference will featurerecent scientific and clinical developments in existing andinvestigational methods to administer vaccines by routes thatavoid the dangers and drawbacks of needle and syringe andthat facilitate rapid implementation of mass vaccination pro-grams. Sessions will include presentations on vaccination bythe transcutaneous and mucosal (nasal, oral, and pulmonary)routes and by needle-free jet injection. The conference iscoordinated by the Office of the Assistant Secretary for PublicHealth Preparedness of DHHS and sponsored by five DHHSagencies: National Vaccine Program Office, Food and DrugAdministration, National Institutes of Health, the StrategicNational Stockpile, and CDC. Exhibition facilities will beavailable. Additional information about the conference,including registration and hotel reservations, is available fromScience Applications International Corporation at telephone,301-228-3124; e-mail, [email protected], and from CDCat http://www.cdc.gov/nip/dev#administration.

Vol. 52 / No. 43 MMWR 1055
* No measles or rubella cases were reported for the current 4-week period yielding a ratio for week 43 of zero (0).† Ratio of current 4-week total to mean of 15 4-week totals (from previous, comparable, and subsequent 4-week periods for the past 5 years). The point where the hatched area
begins is based on the mean and two standard deviations of these 4-week totals.
FIGURE I. Selected notifiable disease reports, United States, comparison of provisional 4-week totals October 25, 2003, with historicaldata
DISEASE DECREASE INCREASECASES CURRENT
4 WEEKS
Ratio (Log Scale)†
*
4210.50.250.125
544
334
64
126
0
54
5
420
0
Hepatitis A, Acute
Hepatitis B, Acute
Hepatitis C, Acute
Legionellosis
Measles, Total
Mumps
Pertussis
Rubella
Meningococcal Infections
0.06250.03125
*
-: No reported cases.* Incidence data for reporting years 2002 and 2003 are provisional and cumulative (year-to-date).†
Not notifiable in all states.§
Updated monthly from reports to the Division of HIV/AIDS Prevention — Surveillance and Epidemiology, National Center for HIV, STD, and TB Prevention.Last update September 28, 2003.
¶Of 39 cases reported, 31 were indigenous, and eight were imported from another country.
** Of 26 cases reported, 13 were indigenous, and 13 were imported from another country.
TABLE I. Summary of provisional cases of selected notifiable diseases, United States, cumulative, week ending October 25, 2003 (43rd Week)*
Cum. Cum. Cum. Cum.2003 2002 2003 2002
Anthrax - 2 Hansen disease (leprosy)† 46 69Botulism: - - Hantavirus pulmonary syndrome† 15 16
foodborne 11 24 Hemolytic uremic syndrome, postdiarrheal† 123 169infant 52 57 HIV infection, pediatric†§ 174 129other (wound & unspecified) 23 15 Measles, total 39¶ 26**
Brucellosis† 68 99 Mumps 153 227Chancroid 39 58 Plague 1 -Cholera 1 1 Poliomyelitis, paralytic - -Cyclosporiasis† 54 150 Psittacosis† 14 13Diphtheria - 1 Q fever† 60 48Ehrlichiosis: - - Rabies, human 2 3
human granulocytic (HGE)† 275 264 Rubella 6 16human monocytic (HME)† 151 175 Rubella, congenital - 1other and unspecified 35 18 Streptococcal toxic-shock syndrome† 127 94
Encephalitis/Meningitis: - - Tetanus 12 19California serogroup viral† 65 133 Toxic-shock syndrome 105 87eastern equine† 8 5 Trichinosis 1 13Powassan† - 1 Tularemia† 67 68St. Louis† 20 20 Yellow fever - -western equine† 2 -
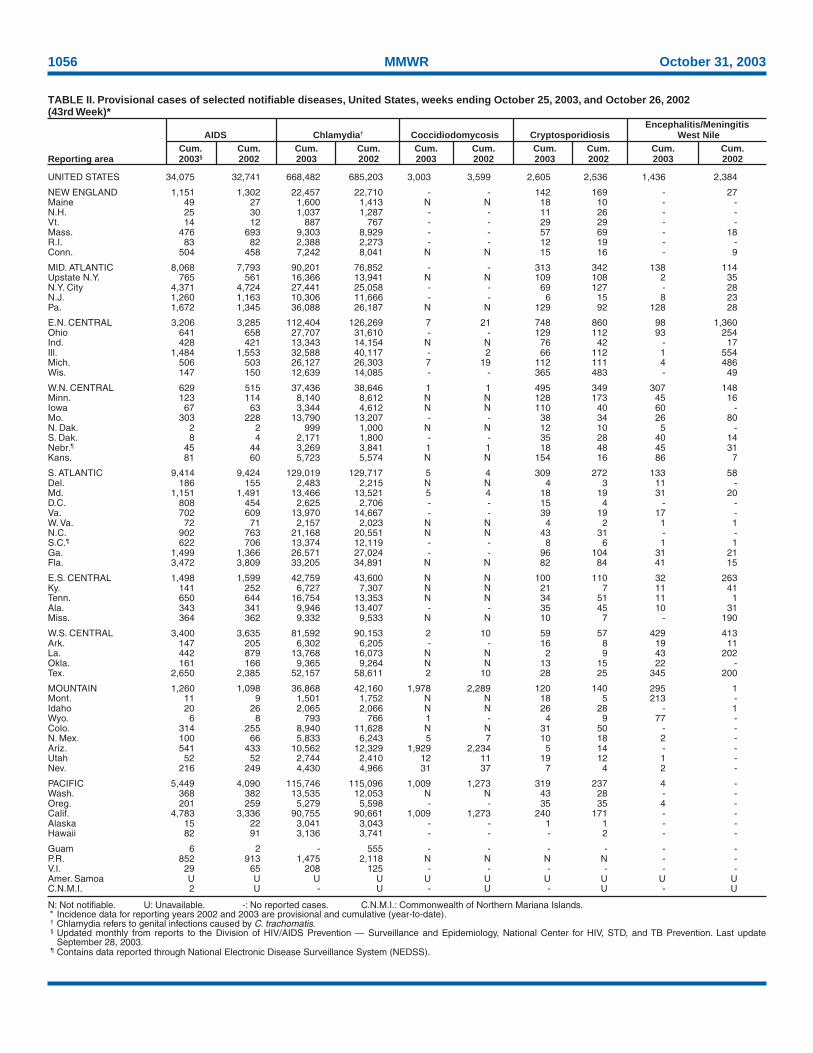
1056 MMWR October 31, 2003
N: Not notifiable. U: Unavailable. -: No reported cases. C.N.M.I.: Commonwealth of Northern Mariana Islands.* Incidence data for reporting years 2002 and 2003 are provisional and cumulative (year-to-date).† Chlamydia refers to genital infections caused by C. trachomatis.§ Updated monthly from reports to the Division of HIV/AIDS Prevention — Surveillance and Epidemiology, National Center for HIV, STD, and TB Prevention. Last update
September 28, 2003.¶ Contains data reported through National Electronic Disease Surveillance System (NEDSS).
TABLE II. Provisional cases of selected notifiable diseases, United States, weeks ending October 25, 2003, and October 26, 2002(43rd Week)*
Encephalitis/MeningitisAIDS Chlamydia† Coccidiodomycosis Cryptosporidiosis West Nile
Cum. Cum. Cum. Cum. Cum. Cum. Cum. Cum. Cum. Cum.Reporting area 2003§ 2002 2003 2002 2003 2002 2003 2002 2003 2002
UNITED STATES 34,075 32,741 668,482 685,203 3,003 3,599 2,605 2,536 1,436 2,384
NEW ENGLAND 1,151 1,302 22,457 22,710 - - 142 169 - 27Maine 49 27 1,600 1,413 N N 18 10 - -N.H. 25 30 1,037 1,287 - - 11 26 - -Vt. 14 12 887 767 - - 29 29 - -Mass. 476 693 9,303 8,929 - - 57 69 - 18R.I. 83 82 2,388 2,273 - - 12 19 - -Conn. 504 458 7,242 8,041 N N 15 16 - 9
MID. ATLANTIC 8,068 7,793 90,201 76,852 - - 313 342 138 114Upstate N.Y. 765 561 16,366 13,941 N N 109 108 2 35N.Y. City 4,371 4,724 27,441 25,058 - - 69 127 - 28N.J. 1,260 1,163 10,306 11,666 - - 6 15 8 23Pa. 1,672 1,345 36,088 26,187 N N 129 92 128 28
E.N. CENTRAL 3,206 3,285 112,404 126,269 7 21 748 860 98 1,360Ohio 641 658 27,707 31,610 - - 129 112 93 254Ind. 428 421 13,343 14,154 N N 76 42 - 17Ill. 1,484 1,553 32,588 40,117 - 2 66 112 1 554Mich. 506 503 26,127 26,303 7 19 112 111 4 486Wis. 147 150 12,639 14,085 - - 365 483 - 49
W.N. CENTRAL 629 515 37,436 38,646 1 1 495 349 307 148Minn. 123 114 8,140 8,612 N N 128 173 45 16Iowa 67 63 3,344 4,612 N N 110 40 60 -Mo. 303 228 13,790 13,207 - - 38 34 26 80N. Dak. 2 2 999 1,000 N N 12 10 5 -S. Dak. 8 4 2,171 1,800 - - 35 28 40 14Nebr.¶ 45 44 3,269 3,841 1 1 18 48 45 31Kans. 81 60 5,723 5,574 N N 154 16 86 7
S. ATLANTIC 9,414 9,424 129,019 129,717 5 4 309 272 133 58Del. 186 155 2,483 2,215 N N 4 3 11 -Md. 1,151 1,491 13,466 13,521 5 4 18 19 31 20D.C. 808 454 2,625 2,706 - - 15 4 - -Va. 702 609 13,970 14,667 - - 39 19 17 -W. Va. 72 71 2,157 2,023 N N 4 2 1 1N.C. 902 763 21,168 20,551 N N 43 31 - -S.C.¶ 622 706 13,374 12,119 - - 8 6 1 1Ga. 1,499 1,366 26,571 27,024 - - 96 104 31 21Fla. 3,472 3,809 33,205 34,891 N N 82 84 41 15
E.S. CENTRAL 1,498 1,599 42,759 43,600 N N 100 110 32 263Ky. 141 252 6,727 7,307 N N 21 7 11 41Tenn. 650 644 16,754 13,353 N N 34 51 11 1Ala. 343 341 9,946 13,407 - - 35 45 10 31Miss. 364 362 9,332 9,533 N N 10 7 - 190
W.S. CENTRAL 3,400 3,635 81,592 90,153 2 10 59 57 429 413Ark. 147 205 6,302 6,205 - - 16 8 19 11La. 442 879 13,768 16,073 N N 2 9 43 202Okla. 161 166 9,365 9,264 N N 13 15 22 -Tex. 2,650 2,385 52,157 58,611 2 10 28 25 345 200
MOUNTAIN 1,260 1,098 36,868 42,160 1,978 2,289 120 140 295 1Mont. 11 9 1,501 1,752 N N 18 5 213 -Idaho 20 26 2,065 2,066 N N 26 28 - 1Wyo. 6 8 793 766 1 - 4 9 77 -Colo. 314 255 8,940 11,628 N N 31 50 - -N. Mex. 100 66 5,833 6,243 5 7 10 18 2 -Ariz. 541 433 10,562 12,329 1,929 2,234 5 14 - -Utah 52 52 2,744 2,410 12 11 19 12 1 -Nev. 216 249 4,430 4,966 31 37 7 4 2 -
PACIFIC 5,449 4,090 115,746 115,096 1,009 1,273 319 237 4 -Wash. 368 382 13,535 12,053 N N 43 28 - -Oreg. 201 259 5,279 5,598 - - 35 35 4 -Calif. 4,783 3,336 90,755 90,661 1,009 1,273 240 171 - -Alaska 15 22 3,041 3,043 - - 1 1 - -Hawaii 82 91 3,136 3,741 - - - 2 - -
Guam 6 2 - 555 - - - - - -P.R. 852 913 1,475 2,118 N N N N - -V.I. 29 65 208 125 - - - - - -Amer. Samoa U U U U U U U U U UC.N.M.I. 2 U - U - U - U - U

Vol. 52 / No. 43 MMWR 1057
N: Not notifiable. U: Unavailable. - : No reported cases.* Incidence data for reporting years 2002 and 2003 are provisional and cumulative (year-to-date).
TABLE II. (Continued) Provisional cases of selected notifiable diseases, United States, weeks ending October 25, 2003, and October 26, 2002(43rd Week)*
Escherichia coli, Enterohemorrhagic (EHEC)Shiga toxin positive, Shiga toxin positive,
O157:H7 serogroup non-O157 not serogrouped Giardiasis GonorrheaCum. Cum. Cum. Cum. Cum. Cum. Cum. Cum. Cum. Cum.
Reporting area 2003 2002 2003 2002 2003 2002 2003 2002 2003 2002
UNITED STATES 2,080 3,116 213 165 123 40 14,637 17,050 254,879 291,915
NEW ENGLAND 138 238 46 45 14 5 1,077 1,521 5,941 6,414Maine 10 32 1 8 1 - 154 174 162 110N.H. 12 30 2 - - - 22 38 76 106Vt. 15 12 - 1 - 1 104 119 67 81Mass. 55 110 7 19 13 4 515 818 2,489 2,709R.I. 1 11 - 1 - - 90 129 793 745Conn. 45 43 36 16 - - 192 243 2,354 2,663
MID. ATLANTIC 202 343 14 1 36 7 2,850 3,501 34,541 35,213Upstate N.Y. 82 146 9 - 19 - 843 1,011 6,375 7,188N.Y. City 5 14 - - - - 936 1,235 10,856 10,509N.J. 14 56 - - - 1 268 401 6,031 6,429Pa. 101 127 5 1 17 6 803 854 11,279 11,087
E.N. CENTRAL 458 757 22 30 21 4 2,441 2,997 50,756 61,634Ohio 93 135 16 10 20 3 756 766 15,243 18,125Ind. 75 59 - 1 - - - - 5,254 6,120Ill. 101 172 - 6 - - 625 848 14,722 20,252Mich. 74 128 - 3 - 1 610 792 11,322 12,016Wis. 115 263 6 10 1 - 450 591 4,215 5,121
W.N. CENTRAL 378 446 43 28 20 4 1,639 1,692 13,014 14,893Minn. 118 146 18 23 1 - 600 632 2,281 2,611Iowa 90 109 - - - - 231 269 775 1,078Mo. 79 66 12 - 1 - 423 414 6,557 7,430N. Dak. 10 4 4 - 8 - 28 14 45 62S. Dak. 25 37 4 2 - - 70 64 188 219Nebr. 29 55 4 3 - - 105 140 1,083 1,228Kans. 27 29 1 - 10 4 182 159 2,085 2,265
S. ATLANTIC 128 246 59 30 8 1 2,252 2,437 64,066 74,278Del. 8 8 N N N N 38 47 951 1,337Md. 10 26 - - - - 97 102 6,452 7,583D.C. 1 - - - - - 41 33 2,065 2,216Va. 33 59 9 9 - - 288 254 6,481 8,597W. Va. 4 8 - - - 1 35 48 726 799N.C. 4 41 25 - - - N N 12,123 13,307S.C. 2 5 - - - - 123 114 7,276 7,731Ga. 25 40 3 7 - - 751 776 13,332 14,861Fla. 41 59 22 14 8 - 879 1,063 14,660 17,847
E.S. CENTRAL 73 97 2 - 7 9 283 316 20,970 25,263Ky. 24 30 2 - 7 9 N N 3,002 3,125Tenn. 30 40 - - - - 147 148 6,975 7,849Ala. 13 17 - - - - 136 168 6,285 8,595Miss. 6 10 - - - - - - 4,708 5,694
W.S. CENTRAL 80 101 2 1 12 6 247 208 33,770 40,465Ark. 9 10 - - - - 124 143 3,223 3,916La. 3 4 - - - - 9 4 8,368 9,898Okla. 25 21 - - - - 114 59 3,845 3,981Tex. 43 66 2 1 12 6 - 2 18,334 22,670
MOUNTAIN 276 306 22 23 5 4 1,322 1,366 8,052 9,221Mont. 16 27 - - - - 94 77 81 77Idaho 68 41 15 13 - - 167 104 62 76Wyo. 2 13 - 2 - - 20 27 35 54Colo. 65 91 3 5 5 4 373 449 2,169 2,874N. Mex. 12 10 3 3 - - 41 130 945 1,260Ariz. 28 32 N N N N 212 176 2,881 3,034Utah 63 66 - - - - 300 272 280 245Nev. 22 26 1 - - - 115 131 1,599 1,601
PACIFIC 347 582 3 7 - - 2,526 3,012 23,769 24,534Wash. 94 127 1 - - - 288 357 2,242 2,378Oreg. 90 196 2 7 - - 335 369 715 712Calif. 150 218 - - - - 1,761 2,111 19,627 20,340Alaska 4 7 - - - - 73 98 440 513Hawaii 9 34 - - - - 69 77 745 591
Guam N N - - - - - 7 - 40P.R. - 1 - - - - 36 78 156 302V.I. - - - - - - - - 55 31Amer. Samoa U U U U U U U U U UC.N.M.I. - U - U - U - U - U

1058 MMWR October 31, 2003
N: Not notifiable. U: Unavailable. -: No reported cases.* Incidence data for reporting years 2002 and 2003 are provisional and cumulative (year-to-date).† Non-serotype b: nontypeable and type other than b; Unknown serotype: type unknown or not reported. Previously, cases reported without type information were counted as non-
serotype b.
TABLE II. (Continued) Provisional cases of selected notifiable diseases, United States, weeks ending October 25, 2003, and October 26, 2002(43rd Week)*
Haemophilus influenzae, invasive† Hepatitis
All ages Age <5 years (viral, acute), by type
All serotypes Serotype b Non-serotype b Unknown serotype ACum. Cum. Cum. Cum. Cum. Cum. Cum. Cum. Cum. Cum.
Reporting area 2003 2002 2003 2002 2003 2002 2003 2002 2003 2002
UNITED STATES 1,400 1,356 17 26 77 104 161 126 5,263 7,550
NEW ENGLAND 104 88 1 - 6 8 5 2 264 263Maine 4 1 - - - - 1 - 12 8N.H. 11 8 1 - - - - - 11 11Vt. 8 7 - - - - - - 6 1Mass. 46 41 - - 6 4 3 2 159 125R.I. 6 10 - - - - 1 - 12 30Conn. 29 21 - - - 4 - - 64 88
MID. ATLANTIC 313 255 - 2 1 14 44 21 997 966Upstate N.Y. 118 98 - 2 1 4 12 7 117 158N.Y. City 51 58 - - - - 10 9 362 382N.J. 54 50 - - - - 7 5 111 163Pa. 90 49 - - - 10 15 - 407 263
E.N. CENTRAL 201 268 4 3 8 10 31 38 546 929Ohio 62 69 - - - 1 11 8 100 260Ind. 40 36 1 1 4 7 - - 60 40Ill. 62 106 - - - - 15 19 169 243Mich. 21 12 3 2 4 2 1 - 176 206Wis. 16 45 - - - - 4 11 41 180
W.N. CENTRAL 102 59 2 1 7 2 14 5 156 256Minn. 40 39 2 1 7 2 2 3 37 37Iowa - 1 - - - - - - 25 58Mo. 40 11 - - - - 12 2 56 75N. Dak. 1 4 - - - - - - 1 1S. Dak. 1 1 - - - - - - - 3Nebr. 3 - - - - - - - 11 16Kans. 17 3 - - - - - - 26 66
S. ATLANTIC 324 303 1 5 12 15 20 23 1,377 2,072Del. - - - - - - - - 7 13Md. 73 76 - 2 5 3 2 1 140 269D.C. - - - - - - - - 33 67Va. 45 27 - - - - 5 4 86 121W. Va. 14 17 - - - 1 - 1 14 17N.C. 36 30 - - 3 3 2 - 81 192S.C. 4 12 - - - - 1 2 35 54Ga. 56 65 - - - - 5 10 610 404Fla. 96 76 1 3 4 8 5 5 371 935
E.S. CENTRAL 69 60 1 1 1 4 10 11 196 235Ky. 5 5 - - 1 1 - 1 28 41Tenn. 42 30 - - - - 6 7 140 106Ala. 20 16 1 1 - 3 3 1 14 32Miss. 2 9 - - - - 1 2 14 56
W.S. CENTRAL 63 51 1 2 8 8 5 2 306 905Ark. 7 1 - - 1 - - - 19 51La. 12 7 - - - - 5 2 51 76Okla. 41 41 - - 7 8 - - 17 46Tex. 3 2 1 2 - - - - 219 732
MOUNTAIN 139 146 4 4 19 25 21 13 395 475Mont. - - - - - - - - 8 13Idaho 4 2 - - - - 1 1 - 25Wyo. 1 2 - - - - - - 1 3Colo. 33 29 - - - - 7 2 63 71N. Mex. 14 24 - - 4 6 1 1 17 27Ariz. 64 62 4 2 6 14 8 6 222 249Utah 13 15 - 1 5 3 4 - 39 41Nev. 10 12 - 1 4 2 - 3 45 46
PACIFIC 85 126 3 8 15 18 11 11 1,026 1,449Wash. 11 3 - 2 7 1 3 - 51 139Oreg. 39 47 - - - - 3 3 48 54Calif. 20 42 3 6 8 17 4 4 910 1,224Alaska - 1 - - - - - 1 8 9Hawaii 15 33 - - - - 1 3 9 23
Guam - - - - - - - - - 1P.R. - 1 - - - - - - 26 197V.I. - - - - - - - - - -Amer. Samoa U U U U U U U U U UC.N.M.I. - U - U - U - U - U
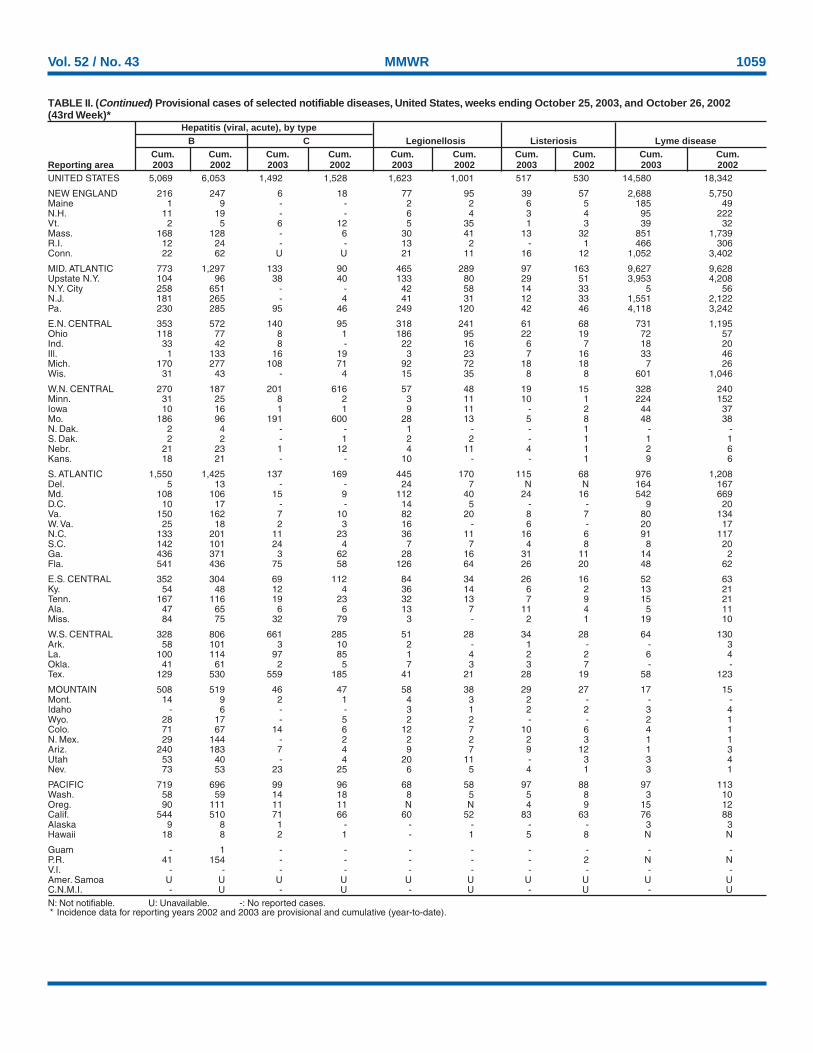
Vol. 52 / No. 43 MMWR 1059
N: Not notifiable. U: Unavailable. -: No reported cases.* Incidence data for reporting years 2002 and 2003 are provisional and cumulative (year-to-date).
TABLE II. (Continued) Provisional cases of selected notifiable diseases, United States, weeks ending October 25, 2003, and October 26, 2002(43rd Week)*
Hepatitis (viral, acute), by typeB C Legionellosis Listeriosis Lyme disease
Cum. Cum. Cum. Cum. Cum. Cum. Cum. Cum. Cum. Cum.Reporting area 2003 2002 2003 2002 2003 2002 2003 2002 2003 2002UNITED STATES 5,069 6,053 1,492 1,528 1,623 1,001 517 530 14,580 18,342
NEW ENGLAND 216 247 6 18 77 95 39 57 2,688 5,750Maine 1 9 - - 2 2 6 5 185 49N.H. 11 19 - - 6 4 3 4 95 222Vt. 2 5 6 12 5 35 1 3 39 32Mass. 168 128 - 6 30 41 13 32 851 1,739R.I. 12 24 - - 13 2 - 1 466 306Conn. 22 62 U U 21 11 16 12 1,052 3,402
MID. ATLANTIC 773 1,297 133 90 465 289 97 163 9,627 9,628Upstate N.Y. 104 96 38 40 133 80 29 51 3,953 4,208N.Y. City 258 651 - - 42 58 14 33 5 56N.J. 181 265 - 4 41 31 12 33 1,551 2,122Pa. 230 285 95 46 249 120 42 46 4,118 3,242
E.N. CENTRAL 353 572 140 95 318 241 61 68 731 1,195Ohio 118 77 8 1 186 95 22 19 72 57Ind. 33 42 8 - 22 16 6 7 18 20Ill. 1 133 16 19 3 23 7 16 33 46Mich. 170 277 108 71 92 72 18 18 7 26Wis. 31 43 - 4 15 35 8 8 601 1,046
W.N. CENTRAL 270 187 201 616 57 48 19 15 328 240Minn. 31 25 8 2 3 11 10 1 224 152Iowa 10 16 1 1 9 11 - 2 44 37Mo. 186 96 191 600 28 13 5 8 48 38N. Dak. 2 4 - - 1 - - 1 - -S. Dak. 2 2 - 1 2 2 - 1 1 1Nebr. 21 23 1 12 4 11 4 1 2 6Kans. 18 21 - - 10 - - 1 9 6
S. ATLANTIC 1,550 1,425 137 169 445 170 115 68 976 1,208Del. 5 13 - - 24 7 N N 164 167Md. 108 106 15 9 112 40 24 16 542 669D.C. 10 17 - - 14 5 - - 9 20Va. 150 162 7 10 82 20 8 7 80 134W. Va. 25 18 2 3 16 - 6 - 20 17N.C. 133 201 11 23 36 11 16 6 91 117S.C. 142 101 24 4 7 7 4 8 8 20Ga. 436 371 3 62 28 16 31 11 14 2Fla. 541 436 75 58 126 64 26 20 48 62
E.S. CENTRAL 352 304 69 112 84 34 26 16 52 63Ky. 54 48 12 4 36 14 6 2 13 21Tenn. 167 116 19 23 32 13 7 9 15 21Ala. 47 65 6 6 13 7 11 4 5 11Miss. 84 75 32 79 3 - 2 1 19 10
W.S. CENTRAL 328 806 661 285 51 28 34 28 64 130Ark. 58 101 3 10 2 - 1 - - 3La. 100 114 97 85 1 4 2 2 6 4Okla. 41 61 2 5 7 3 3 7 - -Tex. 129 530 559 185 41 21 28 19 58 123
MOUNTAIN 508 519 46 47 58 38 29 27 17 15Mont. 14 9 2 1 4 3 2 - - -Idaho - 6 - - 3 1 2 2 3 4Wyo. 28 17 - 5 2 2 - - 2 1Colo. 71 67 14 6 12 7 10 6 4 1N. Mex. 29 144 - 2 2 2 2 3 1 1Ariz. 240 183 7 4 9 7 9 12 1 3Utah 53 40 - 4 20 11 - 3 3 4Nev. 73 53 23 25 6 5 4 1 3 1
PACIFIC 719 696 99 96 68 58 97 88 97 113Wash. 58 59 14 18 8 5 5 8 3 10Oreg. 90 111 11 11 N N 4 9 15 12Calif. 544 510 71 66 60 52 83 63 76 88Alaska 9 8 1 - - - - - 3 3Hawaii 18 8 2 1 - 1 5 8 N N
Guam - 1 - - - - - - - -P.R. 41 154 - - - - - 2 N NV.I. - - - - - - - - - -Amer. Samoa U U U U U U U U U UC.N.M.I. - U - U - U - U - U

1060 MMWR October 31, 2003
N: Not notifiable. U: Unavailable. - : No reported cases.* Incidence data for reporting years 2002 and 2003 are provisional and cumulative (year-to-date).
TABLE II. (Continued) Provisional cases of selected notifiable diseases, United States, weeks ending October 25, 2003, and October 26, 2002(43rd Week)*
Meningococcal Rocky MountainMalaria disease Pertussis Rabies, animal spotted fever
Cum. Cum. Cum. Cum. Cum. Cum. Cum. Cum. Cum. Cum.Reporting area 2003 2002 2003 2002 2003 2002 2003 2002 2003 2002
UNITED STATES 915 1,206 1,338 1,498 5,877 6,807 4,845 6,513 686 921
NEW ENGLAND 39 68 62 81 715 637 489 789 - 6Maine 3 5 6 4 12 12 59 53 - -N.H. 4 7 3 11 60 18 13 41 - -Vt. 2 4 3 4 60 120 30 86 - -Mass. 10 29 38 43 554 447 180 253 - 3R.I. 2 5 2 5 16 13 54 68 - 3Conn. 18 18 10 14 13 27 153 288 - -
MID. ATLANTIC 221 328 152 180 643 418 827 1,105 33 51Upstate N.Y. 49 38 39 42 381 284 358 610 2 -N.Y. City 106 210 29 32 - 17 6 13 11 9N.J. 33 39 19 27 42 - 62 157 10 16Pa. 33 41 65 79 220 117 401 325 10 26
E.N. CENTRAL 77 150 187 226 498 793 147 156 15 29Ohio 17 21 51 70 229 370 50 36 9 10Ind. 2 12 40 29 56 104 26 31 1 4Ill. 25 60 41 47 - 142 23 31 - 12Mich. 23 44 38 38 89 47 41 44 5 3Wis. 10 13 17 42 124 130 7 14 - -
W.N. CENTRAL 43 55 131 126 347 623 502 411 65 103Minn. 21 16 25 31 141 319 31 37 1 -Iowa 5 4 23 19 86 109 95 67 2 3Mo. 5 14 63 43 73 124 50 49 49 95N. Dak. 1 1 1 - 5 5 48 34 - -S. Dak. 2 2 1 2 3 6 67 81 5 1Nebr. - 5 7 23 5 8 58 - 3 4Kans. 9 13 11 8 34 52 153 143 5 -
S. ATLANTIC 263 288 232 247 520 369 2,186 2,275 423 427Del. 3 5 8 7 1 3 43 24 1 1Md. 62 99 24 8 68 59 246 345 95 36D.C. 13 18 - - 2 2 - - 1 1Va. 34 29 23 37 86 124 443 504 27 32W. Va. 4 3 5 4 16 31 77 157 5 2N.C. 20 20 30 30 109 38 676 610 207 260S.C. 3 7 20 27 107 41 206 123 32 65Ga. 52 47 30 28 30 25 334 355 45 19Fla. 72 60 92 106 101 46 161 157 10 11
E.S. CENTRAL 18 19 71 82 122 223 156 202 89 118Ky. 7 7 16 13 41 87 33 24 1 5Tenn. 5 3 21 33 60 95 96 108 58 72Ala. 3 4 15 19 15 32 26 66 12 14Miss. 3 5 19 17 6 9 1 4 18 27
W.S. CENTRAL 53 66 167 185 502 1,480 198 1,014 49 170Ark. 4 2 12 23 37 483 25 3 - 96La. 4 4 32 38 6 7 - - - -Okla. 4 8 14 19 14 35 173 104 42 61Tex. 41 52 109 105 445 955 - 907 7 13
MOUNTAIN 42 42 64 79 801 824 155 291 10 14Mont. - 2 4 2 5 5 20 18 1 1Idaho 1 - 6 3 68 62 15 37 2 -Wyo. 1 - 2 - 123 11 6 18 2 5Colo. 21 22 20 23 275 330 38 59 2 2N. Mex. 2 3 7 4 57 172 5 10 - 1Ariz. 12 7 15 23 126 109 54 129 1 -Utah 4 5 2 4 114 89 14 12 2 -Nev. 1 3 8 20 33 46 3 8 - 5
PACIFIC 159 190 272 292 1,729 1,440 185 270 2 3Wash. 23 22 27 54 588 381 - - - -Oreg. 10 9 49 42 392 168 6 14 - 2Calif. 118 150 183 185 735 859 172 230 2 1Alaska 1 2 3 4 5 4 7 26 - -Hawaii 7 7 10 7 9 28 - - - -
Guam - - - 1 - 2 - - - -P.R. 1 1 2 7 - 2 62 75 N NV.I. - - - - - - - - - -Amer. Samoa U U U U U U U U U UC.N.M.I. - U - U - U - U - U

Vol. 52 / No. 43 MMWR 1061
N: Not notifiable. U: Unavailable. - : No reported cases.* Incidence data for reporting years 2002 and 2003 are provisional and cumulative (year-to-date).
TABLE II. (Continued) Provisional cases of selected notifiable diseases, United States, weeks ending October 25, 2003, and October 26, 2002(43rd Week)*
Streptococcus pneumoniae, invasiveStreptococcal disease, Drug resistant,
Salmonellosis Shigellosis invasive, group A all ages Age <5 yearsCum. Cum. Cum. Cum. Cum. Cum. Cum. Cum. Cum. Cum.
Reporting area 2003 2002 2003 2002 2003 2002 2003 2002 2003 2002
UNITED STATES 33,883 36,014 17,953 16,981 4,441 3,902 1,730 2,049 354 286
NEW ENGLAND 1,772 1,908 262 288 341 283 40 94 8 3Maine 113 126 6 8 23 20 - - - -N.H. 100 119 5 11 21 33 - - N NVt. 62 68 7 1 19 9 6 5 4 2Mass. 1,043 1,082 170 180 165 96 N N N NR.I. 112 135 14 16 11 15 10 12 4 1Conn. 342 378 60 72 102 110 24 77 U U
MID. ATLANTIC 3,775 4,846 1,866 1,477 788 614 104 92 82 65Upstate N.Y. 967 1,263 389 243 315 245 56 77 64 54N.Y. City 1,066 1,201 324 415 106 138 U U U UN.J. 426 919 228 522 131 133 N N N NPa. 1,316 1,463 925 297 236 98 48 15 18 11
E.N. CENTRAL 4,509 4,796 1,448 1,829 923 831 366 186 141 112Ohio 1,182 1,168 265 537 264 182 236 49 79 13Ind. 486 473 132 93 95 46 130 135 39 51Ill. 1,442 1,594 729 879 182 238 - 2 - -Mich. 668 774 217 154 315 261 N N N NWis. 731 787 105 166 67 104 N N 23 48
W.N. CENTRAL 2,175 2,212 696 899 290 212 138 413 48 50Minn. 473 476 89 185 143 108 - 292 41 46Iowa 325 426 65 111 N N N N N NMo. 871 722 333 157 65 41 11 5 2 1N. Dak. 31 24 3 16 13 - 3 1 5 3S. Dak. 100 105 16 151 20 12 1 1 - -Nebr. 131 150 100 199 23 19 - 25 N NKans. 244 309 90 80 26 32 123 89 N N
S. ATLANTIC 8,924 9,213 6,163 5,527 774 645 885 937 18 30Del. 85 79 154 227 6 2 1 3 N NMd. 723 793 531 957 230 102 - - - 21D.C. 38 66 64 51 13 7 2 - 7 3Va. 915 1,011 384 809 91 68 N N N NW. Va. 113 124 - 9 31 19 59 37 11 6N.C. 1,126 1,252 837 368 93 111 N N U US.C. 646 683 412 102 35 35 124 165 N NGa. 1,722 1,683 1,435 1,350 104 118 209 234 N NFla. 3,556 3,522 2,346 1,654 171 183 490 498 N N
E.S. CENTRAL 2,216 2,743 732 1,218 175 100 119 117 - -Ky. 343 317 114 144 40 19 16 15 N NTenn. 638 677 268 96 135 81 103 102 N NAla. 406 713 198 661 - - - - N NMiss. 829 1,036 152 317 - - - - - -
W.S. CENTRAL 4,368 3,978 3,695 2,615 256 255 53 165 52 22Ark. 682 915 91 164 5 6 8 6 - -La. 420 674 226 409 1 1 45 159 8 7Okla. 413 432 716 497 75 39 N N 29 3Tex. 2,853 1,957 2,662 1,545 175 209 N N 15 12
MOUNTAIN 1,860 1,836 1,002 741 379 467 22 45 5 4Mont. 93 77 2 3 2 - - - - -Idaho 155 118 28 12 18 9 N N N NWyo. 71 60 6 8 2 7 5 13 - -Colo. 416 513 252 166 115 104 - - - -N. Mex. 217 259 197 183 95 94 17 32 - -Ariz. 560 469 416 300 136 223 - - N NUtah 192 154 43 24 9 30 - - 5 4Nev. 156 186 58 45 2 - - - - -
PACIFIC 4,284 4,482 2,089 2,387 515 495 3 - - -Wash. 466 441 135 140 53 56 - - N NOreg. 354 303 199 89 N N N N N NCalif. 3,223 3,438 1,709 2,099 366 360 N N N NAlaska 61 71 8 5 - - - - N NHawaii 180 229 38 54 96 79 3 - - -
Guam - 38 - 30 - - - 4 - -P.R. 183 447 3 29 N N N N N NV.I. - - - - - - - - - -Amer. Samoa U U U U U U U U U UC.N.M.I. - U - U - U - U - U

1062 MMWR October 31, 2003
N: Not notifiable. U: Unavailable. - : No reported cases.* Incidence data for reporting years 2002 and 2003 are provisional and cumulative (year-to-date).
TABLE II. (Continued) Provisional cases of selected notifiable diseases, United States, weeks ending October 25, 2003, and October 26, 2002(43rd Week)*
Syphilis VaricellaPrimary & secondary Congenital Tuberculosis Typhoid fever (Chickenpox)Cum. Cum. Cum. Cum. Cum. Cum. Cum. Cum. Cum.
Reporting area 2003 2002 2003 2002 2003 2002 2003 2002 2003UNITED STATES 5,489 5,539 299 350 9,135 10,501 250 268 10,346
NEW ENGLAND 167 119 1 1 272 340 23 13 1,500Maine 7 2 1 - 5 20 - - 753N.H. 14 6 - - 7 12 2 - -Vt. 1 1 - - 7 4 - - 595Mass. 111 81 - 1 178 176 12 7 147R.I. 16 6 - - 28 44 2 - 5Conn. 18 23 - - 47 84 7 6 -
MID. ATLANTIC 688 596 51 55 1,730 1,812 42 69 32Upstate N.Y. 36 27 9 3 229 258 10 7 NN.Y. City 394 348 31 23 943 869 16 37 -N.J. 128 133 11 28 317 417 13 17 -Pa. 130 88 - 1 241 268 3 8 32
E.N. CENTRAL 713 1,018 58 53 914 1,060 17 30 4,403Ohio 177 130 3 3 167 173 2 6 1,007Ind. 40 51 10 3 109 102 4 2 -Ill. 268 398 17 34 437 505 1 14 -Mich. 217 416 28 13 161 224 10 4 2,761Wis. 11 23 - - 40 56 - 4 635
W.N. CENTRAL 110 100 4 2 381 438 4 9 45Minn. 34 49 - 1 155 189 - 3 NIowa 7 2 - - 17 24 2 - NMo. 39 27 4 1 99 115 1 2 -N. Dak. 2 - - - - 4 - - 45S. Dak. 2 - - - 16 10 - - -Nebr. 4 5 - - 10 23 1 4 -Kans. 22 17 - - 84 73 - - -
S. ATLANTIC 1,465 1,415 55 78 1,874 2,194 43 34 1,799Del. 6 10 - - 23 13 - - 25Md. 245 165 10 15 197 238 8 7 -D.C. 47 48 - 1 - - - - 26Va. 65 59 1 1 218 219 12 4 473W. Va. 2 2 - - 19 28 - - 1,061N.C. 128 241 16 18 258 284 7 1 NS.C. 83 114 4 10 144 140 - - 214Ga. 365 308 6 13 299 436 7 5 -Fla. 524 468 18 20 716 836 9 17 N
E.S. CENTRAL 258 411 10 25 545 625 4 4 1Ky. 31 83 1 3 97 106 - 4 NTenn. 112 150 3 7 179 245 2 - NAla. 96 137 4 9 185 171 2 - -Miss. 19 41 2 6 84 103 - - 1
W.S. CENTRAL 774 692 55 76 1,226 1,556 25 27 2,075Ark. 42 30 - 8 74 109 - - -La. 133 129 - - - - - - 11Okla. 54 51 1 2 119 136 1 1 NTex. 545 482 54 66 1,033 1,311 24 26 2,064
MOUNTAIN 251 262 22 13 311 339 5 9 491Mont. - - - - 5 6 - - NIdaho 11 1 - - 8 13 - - NWyo. - - - - 4 3 - - 43Colo. 23 55 3 2 62 73 3 4 -N. Mex. 52 30 1 - 6 31 - 1 2Ariz. 152 161 18 11 174 174 2 - 4Utah 3 5 - - 30 25 - 2 442Nev. 10 10 - - 22 14 - 2 -
PACIFIC 1,063 926 43 47 1,882 2,137 87 73 -Wash. 64 51 - 1 199 197 3 4 -Oreg. 34 17 - - 88 97 4 2 -Calif. 963 850 43 45 1,494 1,682 79 63 -Alaska - - - - 46 40 - - -Hawaii 2 8 - 1 55 121 1 4 -
Guam - 6 - - - 61 - - -P.R. 156 236 1 21 75 90 - - 288V.I. 1 1 - - - - - - -Amer. Samoa U U U U U U U U UC.N.M.I. - U - U - U - U -
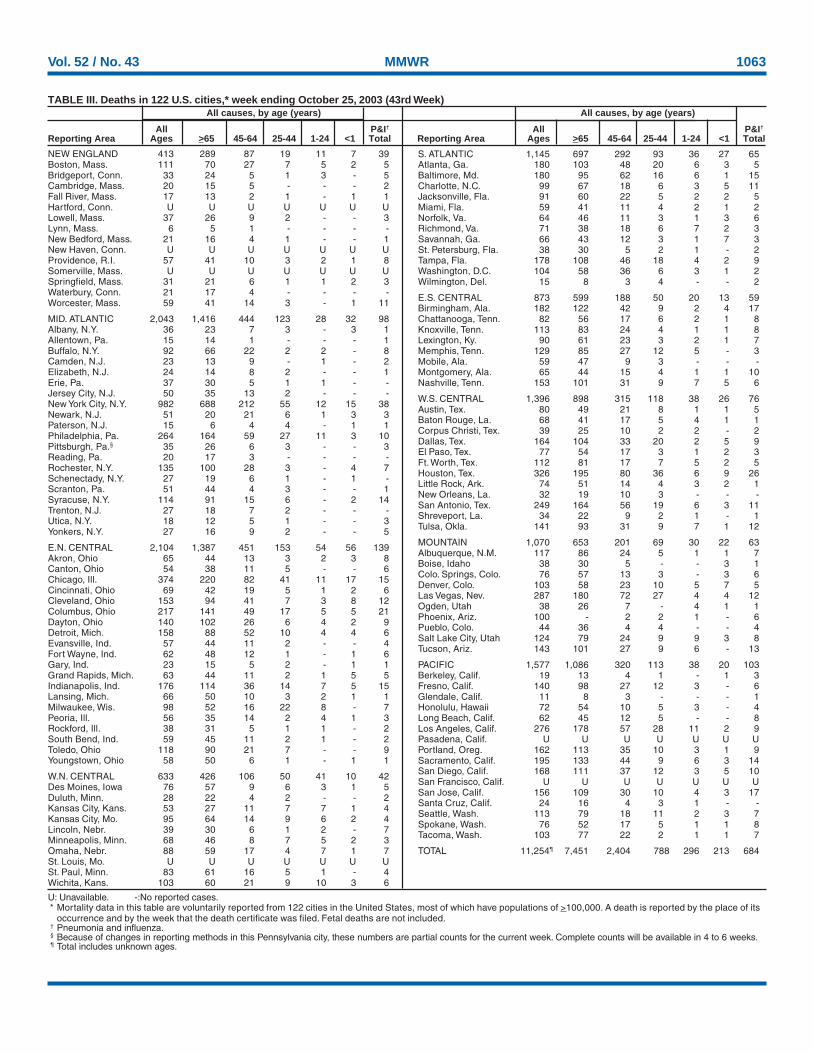
Vol. 52 / No. 43 MMWR 1063
U: Unavailable. -:No reported cases.* Mortality data in this table are voluntarily reported from 122 cities in the United States, most of which have populations of >100,000. A death is reported by the place of its
occurrence and by the week that the death certificate was filed. Fetal deaths are not included.† Pneumonia and influenza.§ Because of changes in reporting methods in this Pennsylvania city, these numbers are partial counts for the current week. Complete counts will be available in 4 to 6 weeks.¶ Total includes unknown ages.
TABLE III. Deaths in 122 U.S. cities,* week ending October 25, 2003 (43rd Week)All causes, by age (years) All causes, by age (years)
All P&I† All P&I†
Reporting Area Ages >65 45-64 25-44 1-24 <1 Total Reporting Area Ages >65 45-64 25-44 1-24 <1 Total
NEW ENGLAND 413 289 87 19 11 7 39Boston, Mass. 111 70 27 7 5 2 5Bridgeport, Conn. 33 24 5 1 3 - 5Cambridge, Mass. 20 15 5 - - - 2Fall River, Mass. 17 13 2 1 - 1 1Hartford, Conn. U U U U U U ULowell, Mass. 37 26 9 2 - - 3Lynn, Mass. 6 5 1 - - - -New Bedford, Mass. 21 16 4 1 - - 1New Haven, Conn. U U U U U U UProvidence, R.I. 57 41 10 3 2 1 8Somerville, Mass. U U U U U U USpringfield, Mass. 31 21 6 1 1 2 3Waterbury, Conn. 21 17 4 - - - -Worcester, Mass. 59 41 14 3 - 1 11
MID. ATLANTIC 2,043 1,416 444 123 28 32 98Albany, N.Y. 36 23 7 3 - 3 1Allentown, Pa. 15 14 1 - - - 1Buffalo, N.Y. 92 66 22 2 2 - 8Camden, N.J. 23 13 9 - 1 - 2Elizabeth, N.J. 24 14 8 2 - - 1Erie, Pa. 37 30 5 1 1 - -Jersey City, N.J. 50 35 13 2 - - -New York City, N.Y. 982 688 212 55 12 15 38Newark, N.J. 51 20 21 6 1 3 3Paterson, N.J. 15 6 4 4 - 1 1Philadelphia, Pa. 264 164 59 27 11 3 10Pittsburgh, Pa.§ 35 26 6 3 - - 3Reading, Pa. 20 17 3 - - - -Rochester, N.Y. 135 100 28 3 - 4 7Schenectady, N.Y. 27 19 6 1 - 1 -Scranton, Pa. 51 44 4 3 - - 1Syracuse, N.Y. 114 91 15 6 - 2 14Trenton, N.J. 27 18 7 2 - - -Utica, N.Y. 18 12 5 1 - - 3Yonkers, N.Y. 27 16 9 2 - - 5
E.N. CENTRAL 2,104 1,387 451 153 54 56 139Akron, Ohio 65 44 13 3 2 3 8Canton, Ohio 54 38 11 5 - - 6Chicago, Ill. 374 220 82 41 11 17 15Cincinnati, Ohio 69 42 19 5 1 2 6Cleveland, Ohio 153 94 41 7 3 8 12Columbus, Ohio 217 141 49 17 5 5 21Dayton, Ohio 140 102 26 6 4 2 9Detroit, Mich. 158 88 52 10 4 4 6Evansville, Ind. 57 44 11 2 - - 4Fort Wayne, Ind. 62 48 12 1 - 1 6Gary, Ind. 23 15 5 2 - 1 1Grand Rapids, Mich. 63 44 11 2 1 5 5Indianapolis, Ind. 176 114 36 14 7 5 15Lansing, Mich. 66 50 10 3 2 1 1Milwaukee, Wis. 98 52 16 22 8 - 7Peoria, Ill. 56 35 14 2 4 1 3Rockford, Ill. 38 31 5 1 1 - 2South Bend, Ind. 59 45 11 2 1 - 2Toledo, Ohio 118 90 21 7 - - 9Youngstown, Ohio 58 50 6 1 - 1 1
W.N. CENTRAL 633 426 106 50 41 10 42Des Moines, Iowa 76 57 9 6 3 1 5Duluth, Minn. 28 22 4 2 - - 2Kansas City, Kans. 53 27 11 7 7 1 4Kansas City, Mo. 95 64 14 9 6 2 4Lincoln, Nebr. 39 30 6 1 2 - 7Minneapolis, Minn. 68 46 8 7 5 2 3Omaha, Nebr. 88 59 17 4 7 1 7St. Louis, Mo. U U U U U U USt. Paul, Minn. 83 61 16 5 1 - 4Wichita, Kans. 103 60 21 9 10 3 6
S. ATLANTIC 1,145 697 292 93 36 27 65Atlanta, Ga. 180 103 48 20 6 3 5Baltimore, Md. 180 95 62 16 6 1 15Charlotte, N.C. 99 67 18 6 3 5 11Jacksonville, Fla. 91 60 22 5 2 2 5Miami, Fla. 59 41 11 4 2 1 2Norfolk, Va. 64 46 11 3 1 3 6Richmond, Va. 71 38 18 6 7 2 3Savannah, Ga. 66 43 12 3 1 7 3St. Petersburg, Fla. 38 30 5 2 1 - 2Tampa, Fla. 178 108 46 18 4 2 9Washington, D.C. 104 58 36 6 3 1 2Wilmington, Del. 15 8 3 4 - - 2
E.S. CENTRAL 873 599 188 50 20 13 59Birmingham, Ala. 182 122 42 9 2 4 17Chattanooga, Tenn. 82 56 17 6 2 1 8Knoxville, Tenn. 113 83 24 4 1 1 8Lexington, Ky. 90 61 23 3 2 1 7Memphis, Tenn. 129 85 27 12 5 - 3Mobile, Ala. 59 47 9 3 - - -Montgomery, Ala. 65 44 15 4 1 1 10Nashville, Tenn. 153 101 31 9 7 5 6
W.S. CENTRAL 1,396 898 315 118 38 26 76Austin, Tex. 80 49 21 8 1 1 5Baton Rouge, La. 68 41 17 5 4 1 1Corpus Christi, Tex. 39 25 10 2 2 - 2Dallas, Tex. 164 104 33 20 2 5 9El Paso, Tex. 77 54 17 3 1 2 3Ft. Worth, Tex. 112 81 17 7 5 2 5Houston, Tex. 326 195 80 36 6 9 26Little Rock, Ark. 74 51 14 4 3 2 1New Orleans, La. 32 19 10 3 - - -San Antonio, Tex. 249 164 56 19 6 3 11Shreveport, La. 34 22 9 2 1 - 1Tulsa, Okla. 141 93 31 9 7 1 12
MOUNTAIN 1,070 653 201 69 30 22 63Albuquerque, N.M. 117 86 24 5 1 1 7Boise, Idaho 38 30 5 - - 3 1Colo. Springs, Colo. 76 57 13 3 - 3 6Denver, Colo. 103 58 23 10 5 7 5Las Vegas, Nev. 287 180 72 27 4 4 12Ogden, Utah 38 26 7 - 4 1 1Phoenix, Ariz. 100 - 2 2 1 - 6Pueblo, Colo. 44 36 4 4 - - 4Salt Lake City, Utah 124 79 24 9 9 3 8Tucson, Ariz. 143 101 27 9 6 - 13
PACIFIC 1,577 1,086 320 113 38 20 103Berkeley, Calif. 19 13 4 1 - 1 3Fresno, Calif. 140 98 27 12 3 - 6Glendale, Calif. 11 8 3 - - - 1Honolulu, Hawaii 72 54 10 5 3 - 4Long Beach, Calif. 62 45 12 5 - - 8Los Angeles, Calif. 276 178 57 28 11 2 9Pasadena, Calif. U U U U U U UPortland, Oreg. 162 113 35 10 3 1 9Sacramento, Calif. 195 133 44 9 6 3 14San Diego, Calif. 168 111 37 12 3 5 10San Francisco, Calif. U U U U U U USan Jose, Calif. 156 109 30 10 4 3 17Santa Cruz, Calif. 24 16 4 3 1 - -Seattle, Wash. 113 79 18 11 2 3 7Spokane, Wash. 76 52 17 5 1 1 8Tacoma, Wash. 103 77 22 2 1 1 7
TOTAL 11,254¶ 7,451 2,404 788 296 213 684

MMWR
The Morbidity and Mortality Weekly Report (MMWR) Series is prepared by the Centers for Disease Control and Prevention (CDC) and is available free of chargein electronic format and on a paid subscription basis for paper copy. To receive an electronic copy each week, send an e-mail message to [email protected]. Thebody content should read SUBscribe mmwr-toc. Electronic copy also is available from CDC’s World-Wide Web server at http://www.cdc.gov/mmwr or from CDC’sfile transfer protocol server at ftp://ftp.cdc.gov/pub/publications/mmwr. To subscribe for paper copy, contact Superintendent of Documents, U.S. GovernmentPrinting Office, Washington, DC 20402; telephone 202-512-1800.
Data in the weekly MMWR are provisional, based on weekly reports to CDC by state health departments. The reporting week concludes at close of business onFriday; compiled data on a national basis are officially released to the public on the following Friday. Address inquiries about the MMWR Series, including materialto be considered for publication, to Editor, MMWR Series, Mailstop C-08, CDC, 1600 Clifton Rd., N.E., Atlanta, GA 30333; telephone 888-232-3228.
All material in the MMWR Series is in the public domain and may be used and reprinted without permission; citation as to source, however, is appreciated.
All MMWR references are available on the Internet at http://www.cdc.gov/mmwr. Use the search function to find specific articles.
Use of trade names and commercial sources is for identification only and does not imply endorsement by the U.S. Department of Health and Human Services.
References to non-CDC sites on the Internet are provided as a service to MMWR readers and do not constitute or imply endorsement of these organizations ortheir programs by CDC or the U.S. Department of Health and Human Services. CDC is not responsible for the content of these sites. URL addresses listed inMMWR were current as of the date of publication.
✩ U.S. Government Printing Office: 2004-633-140/69153 Region IV ISSN: 0149-2195
1064 Octobre 31, 2003