monthly statistics package calgary region · pdf file05/04/2016 · new listings:...
TRANSCRIPT

creb.com
MONTHLY STATISTICS PACKAGE
Calgary RegionApril 2016

MONTHLY STATISTICS PACKAGE
CREB® Region Report
CREB® Calgary Regional Housing Market Statistics 1
78%
6%
6%
5% 2% 1%
2%
SHARE OF SALES April 2016
Calgary
Airdrie
Rocky View Region
Foothills Region
Mountain View Region
Wheatland Region
Other Active Areas
Source: CREB®
REGIONAL HIGHLIGHTS
May 2, 2016
• Year-to-date sales in Airdrie eased over last year’s levels, but remained higher than long-term averages. While detached price have decreased, overall prices remain only 2.4 per cent below recent highs recorded in 2015.
• Sales activity improved in Cochrane last month, mostly due to gains in the $300,000 - $400,000 detached segment. Detached price declines neared six per cent, likely encouraging some of the sales growth.
• Okotoks year-to-date sales activity continued to remain well below long-term averages for this time of year. However, improving detached sales in the higher end of the market continued, preventing any significant year-over-year price changes.
Apr 2016
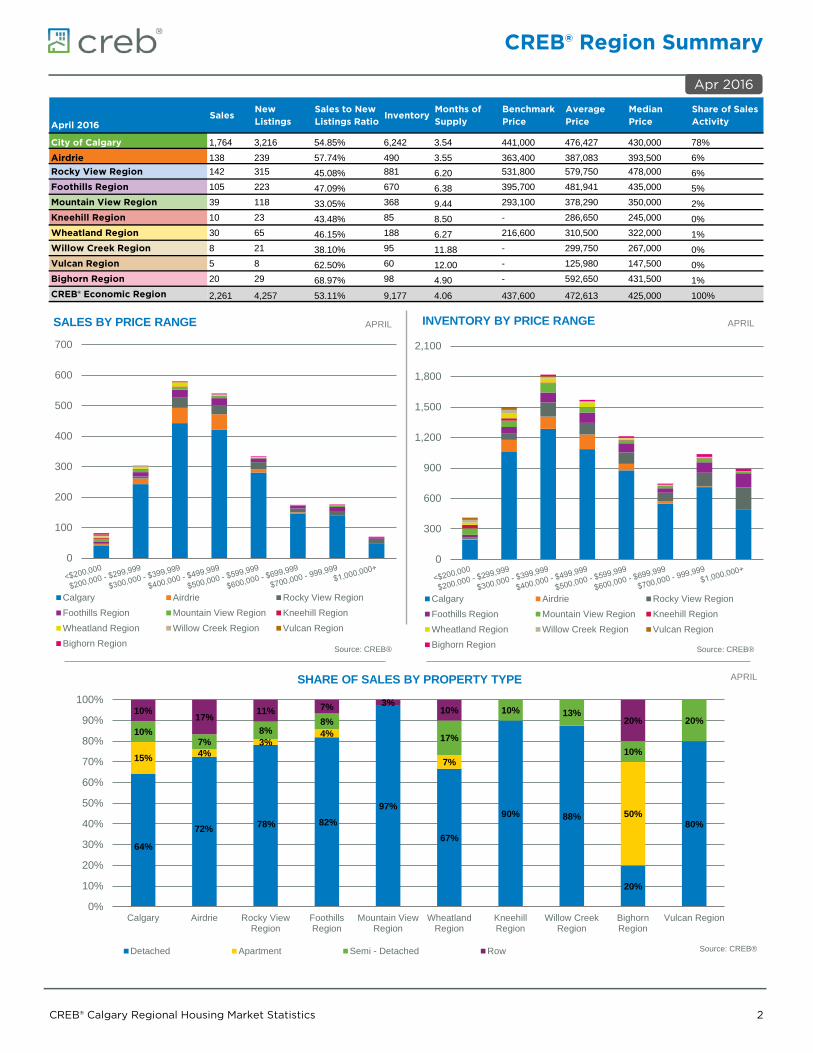
CREB® Region Summary
CREB® Calgary Regional Housing Market Statistics 2
April 2016Sales
New Listings
Sales to New Listings Ratio
InventoryMonths of Supply
Benchmark Price
Average Price
Median Price
Share of Sales Activity
City of Calgary 1,764 3,216 54.85% 6,242 3.54 441,000 476,427 430,000 78%Airdrie 138 239 57.74% 490 3.55 363,400 387,083 393,500 6%Rocky View Region 142 315 45.08% 881 6.20 531,800 579,750 478,000 6%Foothills Region 105 223 47.09% 670 6.38 395,700 481,941 435,000 5%Mountain View Region 39 118 33.05% 368 9.44 293,100 378,290 350,000 2%Kneehill Region 10 23 43.48% 85 8.50 - 286,650 245,000 0%Wheatland Region 30 65 46.15% 188 6.27 216,600 310,500 322,000 1%Willow Creek Region 8 21 38.10% 95 11.88 - 299,750 267,000 0%Vulcan Region 5 8 62.50% 60 12.00 - 125,980 147,500 0%Bighorn Region 20 29 68.97% 98 4.90 - 592,650 431,500 1%CREB® Economic Region 2,261 4,257 53.11% 9,177 4.06 437,600 472,613 425,000 100%
0
300
600
900
1,200
1,500
1,800
2,100
INVENTORY BY PRICE RANGE
Calgary Airdrie Rocky View RegionFoothills Region Mountain View Region Kneehill RegionWheatland Region Willow Creek Region Vulcan RegionBighorn Region Source: CREB®
APRIL
64%
72% 78% 82% 97%
67%
90% 88%
20%
80%
15% 4% 3%
4%
7%
50%
10% 7%
8% 8%
17%
10% 13%
10%
20% 10% 17% 11% 7% 3%
10% 20%
0%
10%
20%
30%
40%
50%
60%
70%
80%
90%
100%
Calgary Airdrie Rocky ViewRegion
FoothillsRegion
Mountain ViewRegion
WheatlandRegion
KneehillRegion
Willow CreekRegion
BighornRegion
Vulcan Region
SHARE OF SALES BY PROPERTY TYPE
Detached Apartment Semi - Detached Row Source: CREB®
APRIL
Apr 2016
0
100
200
300
400
500
600
700
SALES BY PRICE RANGE
Calgary Airdrie Rocky View RegionFoothills Region Mountain View Region Kneehill RegionWheatland Region Willow Creek Region Vulcan RegionBighorn Region
Source: CREB®
APRIL

CREB® Region
CREB® Calgary Regional Housing Market Statistics 3
0
2,000
4,000
6,000
8,000
10,000
12,000
14,000
16,000
YTD2006
YTD2007
YTD2008
YTD2009
YTD2010
YTD2011
YTD2012
YTD2013
YTD2014
YTD2015
YTD2016
YTD APRIL
Detached Apartment Semi - Detached
Row 10 Year AverageSource: CREB®
CREB® ECONOMIC REGION TOTAL SALES
425,000
430,000
435,000
440,000
445,000
450,000
455,000
460,000
-
1,000
2,000
3,000
4,000
5,000
6,000
7,000
8,000
9,000
10,000
Feb.'15
Mar.'15
Apr.'15
May.'15
Jun.'15
Jul.'15
Aug.'15
Sep.'15
Oct.'15
Nov.'15
Dec.'15
Jan.'16
Feb.'16
Mar.'16
Apr.'16
Inventory Sales Benchmark Price Source: CREB®
CREB® ECONOMIC REGION INVENTORY AND SALES
-
1
2
3
4
5
6
7
8
2011 2012 2013 2014 2015 2016
Months of Supply TrendedSource: CREB®
12 month moving average
CREB® ECONOMIC REGION MONTHS OF INVENTORY
-10%
-5%
0%
5%
10%
15%
2011 2012 2013 2014 2015 2016
Semi Y/Y%change Row Y/Y% changeApartment Y/Y% change Detached Y/Y% Change
Source: CREB®
CREB® ECONOMIC REGION PRICE CHANGE
100,000
150,000
200,000
250,000
300,000
350,000
400,000
450,000
500,000
550,000
2011 2012 2013 2014 2015 2016Detached Price Apartment Price
Row Price Semi PriceSource: CREB®
CREB® ECONOMIC REGION PRICES
0
500
1,000
1,500
2,000
2,500
3,000 YTD APRIL
YTD 2013 YTD 2014 YTD 2015 YTD 2016 Source: CREB®
CREB® ECONOMIC REGION TOTAL SALES BY PRICE RANGE
Apr 2016

CREB® Region
CREB® Calgary Regional Housing Market Statistics 4
TYPICAL HOME ATTRIBUTES - DETACHED HOMES
Gross Living Area (Above Ground) Lot Size
Above Ground Bedrooms Year Built
Full Bathrooms
Half Bathrooms
City of Calgary 1,307 4,854 3 1984 2 1Airdrie 1,463 4,651 3 1998 2 1Rural Rocky View 2,130 87,120 3 1991 3 1Cochrane 1,456 5,740 3 1996 2 1Chestermere 1,884 5,593 3 2001 2 1Rural Foothills 1,723 176,418 3 1987 2 0High River 1,287 5,629 3 1985 2 0Okotoks 1,454 5,038 3 1997 2 1Turner Valley 1,215 6,335 3 1981 2 0Rural Mountain View 1,256 7,393 3 1980 2 0Carstairs 1,266 6,668 3 1987 2 0Didsbury 1,189 6,384 3 1978 2 0Rural Wheatland 1,206 11,335 3 1970 2 0Strathmore 1,255 5,606 3 1996 2 0
0100,000200,000300,000400,000500,000600,000700,000800,000900,000
1,000,000
Calgary Airdrie RuralRocky View
Chester-mere
Cochrane RuralFoothills
HighRiver
Okotoks TurnerValley
RuralMtn. View
Carstairs Didsbury RuralWheatland
Strathmore
DETACHED BENCHMARK PRICE
Source: CREB®
APRIL
Apr 2016
-14%
-12%
-10%
-8%
-6%
-4%
-2%
0%
2%
Calgary Airdrie RuralRocky View
Chester-mere
Cochrane RuralFoothills
HighRiver
Okotoks TurnerValley
RuralMtn. View
Carstairs Didsbury RuralWheatland
Strathmore
DETACHED BENCHMARK PRICE
Source: CREB®
APRIL

Calgary CMA
CREB® Calgary Regional Housing Market Statistics 5
April 2016Sales
New Listings
Sales to New Listings Ratio
InventoryMonths of Supply
Benchmark Price
Average Price
Median Price
Share of Sales Activity
City of Calgary 1,764 3,216 54.85% 6,242 3.54 441,000 476,427 430,000 86%Airdrie 138 239 57.74% 490 3.55 363,400 387,083 393,500 7%Rocky View Region 142 315 45.08% 881 6.20 531,800 579,750 478,000 7%Calgary CMA 2,044 3,770 54.22% 7,613 3.72 441,400 477,573 427,700 100%
0
200
400
600
800
1,000
1,200
1,400
1,600
1,800
INVENTORY BY PRICE RANGE
Calgary Airdrie Rocky View Region
Source: CREB®
APRIL
66% 64%
78% 72%
14% 15%
3% 4%
10% 10% 8% 7%
11% 10% 11% 17%
0%
10%
20%
30%
40%
50%
60%
70%
80%
90%
100%
CMA Calgary Total Rocky View Airdrie
SHARE OF SALES BY PROPERTY TYPE
Detached Apartment Semi - Detached Row Source: CREB®
APRIL
Apr 2016
0
100
200
300
400
500
600
SALES BY PRICE RANGE
Calgary Airdrie Rocky View Region
Source: CREB®
APRIL

Calgary CMA
CREB® Calgary Regional Housing Market Statistics 6
0
2,000
4,000
6,000
8,000
10,000
12,000
14,000
YTD2006
YTD2007
YTD2008
YTD2009
YTD2010
YTD2011
YTD2012
YTD2013
YTD2014
YTD2015
YTD2016
YTD APRIL
Detached Apartment Semi - Detached
Row 10 Year AverageSource: CREB®
CALGARY CMA TOTAL SALES
430,000
435,000
440,000
445,000
450,000
455,000
460,000
465,000
-
1,000
2,000
3,000
4,000
5,000
6,000
7,000
8,000
Feb.'15
Mar.'15
Apr.'15
May.'15
Jun.'15
Jul.'15
Aug.'15
Sep.'15
Oct.'15
Nov.'15
Dec.'15
Jan.'16
Feb.'16
Mar.'16
Apr.'16
Inventory Sales Benchmark Price Source: CREB®
CALGARY CMA INVENTORY AND SALES
-
1
2
3
4
5
6
7
8
2011 2012 2013 2014 2015 2016
Months of Supply TrendedSource: CREB®
12 month moving average
CALGARY CMA MONTHS OF INVENTORY
-10%
-5%
0%
5%
10%
15%
2011 2012 2013 2014 2015 2016
Semi Y/Y%change Row Y/Y% changeApartment Y/Y% change Detached Y/Y% Change
Source: CREB®
CALGARY CMA PRICE CHANGE
100,000
150,000
200,000
250,000
300,000
350,000
400,000
450,000
500,000
550,000
2011 2012 2013 2014 2015 2016Detached Price Apartment Price
Row Price Semi PriceSource: CREB®
CALGARY CMA PRICES
0
500
1,000
1,500
2,000
2,500
3,000 YTD APRIL
YTD 2013 YTD 2014 YTD 2015 YTD 2016Source: CREB®
CALGARY CMA TOTAL SALES BY PRICE RANGE
Apr 2016

Airdrie
CREB® Calgary Regional Housing Market Statistics 7
0
100
200
300
400
500
600
700
YTD2006
YTD2007
YTD2008
YTD2009
YTD2010
YTD2011
YTD2012
YTD2013
YTD2014
YTD2015
YTD2016
YTD APRIL
Detached Apartment Semi - Detached
Row 10 Year AverageSource: CREB®
AIRDRIE TOTAL SALES
355,000
360,000
365,000
370,000
375,000
380,000
-
100
200
300
400
500
600
Feb.'15
Mar.'15
Apr.'15
May.'15
Jun.'15
Jul.'15
Aug.'15
Sep.'15
Oct.'15
Nov.'15
Dec.'15
Jan.'16
Feb.'16
Mar.'16
Apr.'16
Inventory Sales Benchmark Price Source: CREB®
AIRDRIE INVENTORY AND SALES
-
1
2
3
4
5
6
7
8
2011 2012 2013 2014 2015 2016
Months of Supply TrendedSource: CREB®
12 month moving average
AIRDRIE MONTHS OF INVENTORY
-20%
-15%
-10%
-5%
0%
5%
10%
15%
20%
25%
30%
2011 2012 2013 2014 2015 2016
Semi Y/Y%change Row Y/Y% changeApartment Y/Y% change Detached Y/Y% Change
Source: CREB®
AIRDRIE PRICE CHANGE
100,000
150,000
200,000
250,000
300,000
350,000
400,000
450,000
2011 2012 2013 2014 2015 2016Detached Price Apartment Price
Row Price Semi PriceSource: CREB®
AIRDRIE PRICES
0
20
40
60
80
100
120
140
160
180 YTD APRIL
YTD 2013 YTD 2014 YTD 2015 YTD 2016Source: CREB®
AIRDRIE TOTAL SALES BY PRICE RANGE
Apr 2016
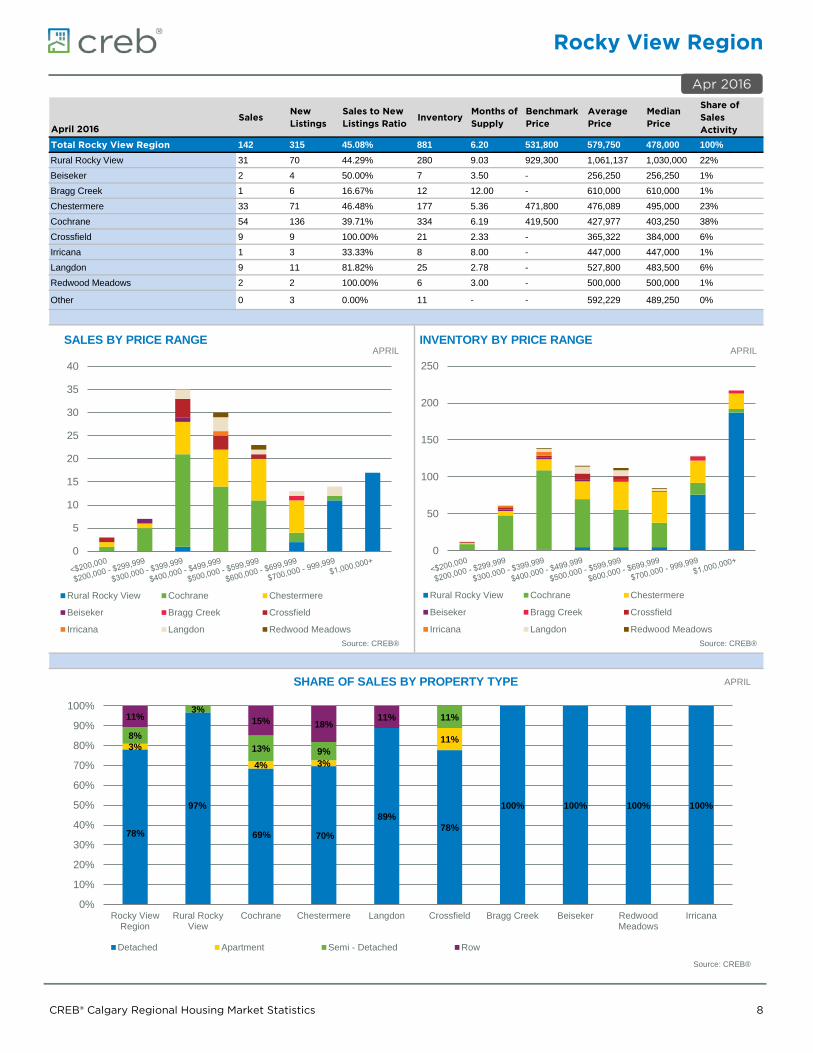
Rocky View Region
CREB® Calgary Regional Housing Market Statistics 8
April 2016Sales
New Listings
Sales to New Listings Ratio
InventoryMonths of Supply
Benchmark Price
Average Price
Median Price
Share of Sales Activity
Total Rocky View Region 142 315 45.08% 881 6.20 531,800 579,750 478,000 100%Rural Rocky View 31 70 44.29% 280 9.03 929,300 1,061,137 1,030,000 22%Beiseker 2 4 50.00% 7 3.50 - 256,250 256,250 1%Bragg Creek 1 6 16.67% 12 12.00 - 610,000 610,000 1%Chestermere 33 71 46.48% 177 5.36 471,800 476,089 495,000 23%Cochrane 54 136 39.71% 334 6.19 419,500 427,977 403,250 38%Crossfield 9 9 100.00% 21 2.33 - 365,322 384,000 6%Irricana 1 3 33.33% 8 8.00 - 447,000 447,000 1%Langdon 9 11 81.82% 25 2.78 - 527,800 483,500 6%Redwood Meadows 2 2 100.00% 6 3.00 - 500,000 500,000 1%
Other 0 3 0.00% 11 - - 592,229 489,250 0%
0
50
100
150
200
250
INVENTORY BY PRICE RANGE
Rural Rocky View Cochrane Chestermere
Beiseker Bragg Creek Crossfield
Irricana Langdon Redwood MeadowsSource: CREB®
APRIL
0
5
10
15
20
25
30
35
40
SALES BY PRICE RANGE
Rural Rocky View Cochrane Chestermere
Beiseker Bragg Creek Crossfield
Irricana Langdon Redwood MeadowsSource: CREB®
APRIL
78%
97%
69% 70%
89% 78%
100% 100% 100% 100%
3%
4% 3%
11% 8%
3%
13% 9%
11% 11% 15% 18% 11%
0%
10%
20%
30%
40%
50%
60%
70%
80%
90%
100%
Rocky ViewRegion
Rural RockyView
Cochrane Chestermere Langdon Crossfield Bragg Creek Beiseker RedwoodMeadows
Irricana
SHARE OF SALES BY PROPERTY TYPE
Detached Apartment Semi - Detached Row
Source: CREB®
APRIL
Apr 2016

Cochrane
CREB® Calgary Regional Housing Market Statistics 9
0
50
100
150
200
250
300
YTD2006
YTD2007
YTD2008
YTD2009
YTD2010
YTD2011
YTD2012
YTD2013
YTD2014
YTD2015
YTD2016
YTD APRIL
Detached Apartment Semi - Detached
Row 10 Year AverageSource: CREB®
COCHRANE TOTAL SALES
380,000
390,000
400,000
410,000
420,000
430,000
440,000
450,000
460,000
-
50
100
150
200
250
300
350
400
Feb.'15
Mar.'15
Apr.'15
May.'15
Jun.'15
Jul.'15
Aug.'15
Sep.'15
Oct.'15
Nov.'15
Dec.'15
Jan.'16
Feb.'16
Mar.'16
Apr.'16
Inventory Sales Benchmark Price Source: CREB®
COCHRANE INVENTORY AND SALES
-
2
4
6
8
10
12
14
16
2011 2012 2013 2014 2015 2016
Months of Supply TrendedSource: CREB®
12 month moving average
COCHRANE MONTHS OF INVENTORY
-25%
-20%
-15%
-10%
-5%
0%
5%
10%
15%
20%
2011 2012 2013 2014 2015 2016
Semi Y/Y%change Row Y/Y% changeApartment Y/Y% change Detached Y/Y% Change
Source: CREB®
COCHRANE PRICE CHANGE
100,000
150,000
200,000
250,000
300,000
350,000
400,000
450,000
500,000
2011 2012 2013 2014 2015 2016Detached Price Apartment Price
Row Price Semi PriceSource: CREB®
COCHRANE PRICES
0
10
20
30
40
50
60
70
80 YTD APRIL
YTD 2013 YTD 2014 YTD 2015 YTD 2016Source: CREB®
COCHRANE TOTAL SALES BY PRICE RANGE
Apr 2016

Chestermere
CREB® Calgary Regional Housing Market Statistics 10
0
20
40
60
80
100
120
140
160
180
YTD2006
YTD2007
YTD2008
YTD2009
YTD2010
YTD2011
YTD2012
YTD2013
YTD2014
YTD2015
YTD2016
YTD APRIL
Detached Apartment Semi - Detached
Row 10 Year AverageSource: CREB®
CHESTERMERE TOTAL SALES
430,000
440,000
450,000
460,000
470,000
480,000
490,000
500,000
510,000
-
20
40
60
80
100
120
140
160
180
200
Feb.'15
Mar.'15
Apr.'15
May.'15
Jun.'15
Jul.'15
Aug.'15
Sep.'15
Oct.'15
Nov.'15
Dec.'15
Jan.'16
Feb.'16
Mar.'16
Apr.'16
Inventory Sales Benchmark Price Source: CREB®
CHESTERMERE INVENTORY AND SALES
-
2
4
6
8
10
12
14
16
2011 2012 2013 2014 2015 2016
Months of Supply TrendedSource: CREB®
12 month moving average
CHESTERMERE MONTHS OF INVENTORY
-25%
-20%
-15%
-10%
-5%
0%
5%
10%
15%
20%
25%
2011 2012 2013 2014 2015 2016
Semi Y/Y%change Row Y/Y% changeApartment Y/Y% change Detached Y/Y% Change
Source: CREB®
CHESTERMERE PRICE CHANGE
100,000
150,000
200,000
250,000
300,000
350,000
400,000
450,000
500,000
550,000
600,000
2011 2012 2013 2014 2015 2016Detached Price Apartment Price
Row Price Semi PriceSource: CREB®
CHESTERMERE PRICES
0
10
20
30
40
50
60 YTD APRIL
YTD 2013 YTD 2014 YTD 2015 YTD 2016Source: CREB®
CHESTERMERE TOTAL SALES BY PRICE RANGE
Apr 2016

Rural Rocky View
CREB® Calgary Regional Housing Market Statistics 11
0
20
40
60
80
100
120
140
160
180
200
YTD2006
YTD2007
YTD2008
YTD2009
YTD2010
YTD2011
YTD2012
YTD2013
YTD2014
YTD2015
YTD2016
YTD APRIL
Detached Apartment Semi - Detached
Row 10 Year AverageSource: CREB®
RURAL ROCKY VIEW TOTAL SALES
800,000
850,000
900,000
950,000
1,000,000
1,050,000
1,100,000
-
50
100
150
200
250
300
350
400
Feb.'15
Mar.'15
Apr.'15
May.'15
Jun.'15
Jul.'15
Aug.'15
Sep.'15
Oct.'15
Nov.'15
Dec.'15
Jan.'16
Feb.'16
Mar.'16
Apr.'16
Inventory Sales Benchmark Price Source: CREB®
RURAL ROCKY VIEW INVENTORY AND SALES
-
10
20
30
40
50
60
2011 2012 2013 2014 2015 2016
Months of Supply TrendedSource: CREB®
12 month moving average
RURAL ROCKY VIEW MONTHS OF INVENTORY
-40%
-30%
-20%
-10%
0%
10%
20%
30%
40%
50%
2011 2012 2013 2014 2015 2016
Semi Y/Y%change Row Y/Y% changeApartment Y/Y% change Detached Y/Y% Change
Source: CREB®
RURAL ROCKY VIEW PRICE CHANGE
100,000
300,000
500,000
700,000
900,000
1,100,000
1,300,000
2011 2012 2013 2014 2015 2016Detached Price Apartment Price
Row Price Semi PriceSource: CREB®
RURAL ROCKY VIEW PRICES
0
10
20
30
40
50
60
70 YTD APRIL
YTD 2013 YTD 2014 YTD 2015 YTD 2016Source: CREB®
RURAL ROCKY VIEW TOTAL SALES BY PRICE RANGE
Apr 2016

Foothills Region
CREB® Calgary Regional Housing Market Statistics 12
April 2016Sales
New Listings
Sales to New Listings Ratio
InventoryMonths of Supply
Benchmark Price
Average Price
Median Price
Share of Sales Activity
Total Foothills Region 105 223 47.09% 674 6.42 395,700 481,941 435,000 100%Rural Foothills 11 48 22.92% 160 14.55 682,700 846,000 890,000 10%Black Diamond 2 9 22.22% 27 13.50 - 337,500 337,500 2%Blackie 0 1 0.00% 2 - - - - 0%Cayley 1 2 50.00% 3 3.00 - 593,750 593,750 1%De Winton 0 2 0.00% 7 - - - - 0%Heritate Pointe 4 14 28.57% 58 14.50 - 913,125 795,000 4%High River 20 38 52.63% 118 5.90 342,800 316,640 332,500 19%Okotoks 57 101 56.44% 249 4.37 433,800 465,279 450,000 54%Turner Valley 9 6 150.00% 24 2.67 295,800 285,870 300,000 9%Priddis Greens 0 1 0.00% 15 - - - - 0%
Longview 0 0 - 4 - - - - 0%
Other 1 1 100.00% 7 7.00 - 950,000 950,000 1%
0
20
40
60
80
100
120
140INVENTORY BY PRICE RANGE
Okotoks High River Rural FoothillsHeritage Pointe Black Diamond BlackieCayley Longview Turner ValleyDe Winton Priddis Greens Other Source: CREB®
APRIL
0
5
10
15
20
25
30SALES BY PRICE RANGE
Okotoks High River Rural FoothillsHeritage Pointe Black Diamond BlackieCayley Longview Turner ValleyDe Winton Priddis Greens Other Source: CREB®
APRIL
82%
100% 100% 100%
60%
86%
67%
4%
5%
5% 8%
20%
4%
22%
7% 15%
5% 11%
0%
10%
20%
30%
40%
50%
60%
70%
80%
90%
100%
FoothillsRegion
RuralFoothills
BlackDiamond
Blackie Cayley HeritagePointe
High River Longview Okotoks TurnerValley
De Winton PriddisGreens
SHARE OF SALES BY PROPERTY TYPE
Detached Apartment Semi - Detached RowSource: CREB®
APRIL
Apr 2016

Okotoks
CREB® Calgary Regional Housing Market Statistics 13
0
50
100
150
200
250
300
YTD2006
YTD2007
YTD2008
YTD2009
YTD2010
YTD2011
YTD2012
YTD2013
YTD2014
YTD2015
YTD2016
YTD APRIL
Detached Apartment Semi - Detached
Row 10 Year AverageSource: CREB®
OKOTOKS TOTAL SALES
415,000
420,000
425,000
430,000
435,000
440,000
445,000
450,000
-
50
100
150
200
250
300
Feb.'15
Mar.'15
Apr.'15
May.'15
Jun.'15
Jul.'15
Aug.'15
Sep.'15
Oct.'15
Nov.'15
Dec.'15
Jan.'16
Feb.'16
Mar.'16
Apr.'16
Inventory Sales Benchmark Price Source: CREB®
OKOTOKS INVENTORY AND SALES
-
1
2
3
4
5
6
7
8
2011 2012 2013 2014 2015 2016
Months of Supply TrendedSource: CREB®
12 month moving average
OKOTOKS MONTHS OF INVENTORY
-40%
-30%
-20%
-10%
0%
10%
20%
30%
40%
2011 2012 2013 2014 2015 2016
Semi Y/Y%change Row Y/Y% changeApartment Y/Y% change Detached Y/Y% Change
Source: CREB®
OKOTOKS PRICE CHANGE
100,000
150,000
200,000
250,000
300,000
350,000
400,000
450,000
500,000
2011 2012 2013 2014 2015 2016Detached Price Apartment Price
Row Price Semi PriceSource: CREB®
OKOTOKS PRICES
0
10
20
30
40
50
60
70
80 YTD APRIL
YTD 2013 YTD 2014 YTD 2015 YTD 2016Source: CREB®
OKOTOKS TOTAL SALES BY PRICE RANGE
Apr 2016

Rural Foothills
CREB® Calgary Regional Housing Market Statistics 14
0
10
20
30
40
50
60
70
80
90
100
YTD2006
YTD2007
YTD2008
YTD2009
YTD2010
YTD2011
YTD2012
YTD2013
YTD2014
YTD2015
YTD2016
YTD APRIL
Detached Apartment Semi - Detached
Row 10 Year AverageSource: CREB®
RURAL FOOTHILLS TOTAL SALES
630,000
640,000
650,000
660,000
670,000
680,000
690,000
700,000
710,000
720,000
730,000
740,000
-
50
100
150
200
250
Feb.'15
Mar.'15
Apr.'15
May.'15
Jun.'15
Jul.'15
Aug.'15
Sep.'15
Oct.'15
Nov.'15
Dec.'15
Jan.'16
Feb.'16
Mar.'16
Apr.'16
Inventory Sales Benchmark Price Source: CREB®
RURAL FOOTHILLS INVENTORY AND SALES
-
5
10
15
20
25
30
2011 2012 2013 2014 2015 2016
Months of Supply TrendedSource: CREB®
12 month moving average
RURAL FOOTHILLS MONTHS OF INVENTORY
-8%
-6%
-4%
-2%
0%
2%
4%
6%
8%
10%
12%
2011 2012 2013 2014 2015 2016
Semi Y/Y%change Row Y/Y% changeApartment Y/Y% change Detached Y/Y% Change
Source: CREB®
RURAL FOOTHILLS PRICE CHANGE
100,000
200,000
300,000
400,000
500,000
600,000
700,000
800,000
2011 2012 2013 2014 2015 2016Detached Price Apartment Price
Row Price Semi PriceSource: CREB®
RURAL FOOTHILLS PRICES
0
5
10
15
20
25
30
35
40 YTD APRIL
YTD 2013 YTD 2014 YTD 2015 YTD 2016Source: CREB®
RURAL FOOTHILLS TOTAL SALES BY PRICE RANGE
Apr 2016

Wheatland Region
CREB® Calgary Regional Housing Market Statistics 15
April 2016Sales
New Listings
Sales to New Listings Ratio
InventoryMonths of Supply
Benchmark Price
Average Price
Median Price
Share of Sales Activity
Total Wheatland Region* 30 65 46.15% 188 6.27 216,600 310,500 322,000 100%Rural Wheatland* 2 11 18.18% 25 12.50 216,500 432,500 432,500 7%Carseland* 1 2 50.00% 3 3.00 - 160,000 160,000 3%Lyalta* 0 0 - 4 - - - - 0%Rockyford* 0 2 0.00% 4 - - - - 0%Strathmore 25 47 53.19% 130 5.20 367,800 312,600 324,000 83%
Other* 2 3 66.67% 22 11.00 - 237,500 237,500 7%
*Data within these areaa many not accurately reflect total resale activity and trends
0
5
10
15
20
25
30
35
40
45
50
INVENTORY BY PRICE RANGE
Strathmore Rural Wheatland Carseland
Lyalta Rockyford Other
Source: CREB®
APRIL
0123456789
101112131415
SALES BY PRICE RANGE
Strathmore Rural Wheatland Carseland
Lyalta Rockyford Other
Source: CREB®
APRIL
67%
100%
65%
100%
67%
7%
33% 17% 22%
10% 13%
0%
10%
20%
30%
40%
50%
60%
70%
80%
90%
100%
Wheatland Region Rural Wheatland Strathmore Carseland Lyalta Rockyford Other
SHARE OF SALES BY PROPERTY TYPE
Detached Apartment Semi - Detached Row
Source: CREB®
APRIL
Apr 2016

Strathmore
CREB® Calgary Regional Housing Market Statistics 16
0
50
100
150
200
250
YTD2006
YTD2007
YTD2008
YTD2009
YTD2010
YTD2011
YTD2012
YTD2013
YTD2014
YTD2015
YTD2016
YTD APRIL
Detached Apartment Semi - Detached
Row 10 Year AverageSource: CREB®
STRATHMORE TOTAL SALES
345,000
350,000
355,000
360,000
365,000
370,000
375,000
-
20
40
60
80
100
120
140
Feb.'15
Mar.'15
Apr.'15
May.'15
Jun.'15
Jul.'15
Aug.'15
Sep.'15
Oct.'15
Nov.'15
Dec.'15
Jan.'16
Feb.'16
Mar.'16
Apr.'16
Inventory Sales Benchmark Price Source: CREB®
STRATHMORE INVENTORY AND SALES
-
2
4
6
8
10
12
14
16
18
20
2011 2012 2013 2014 2015 2016
Months of Supply TrendedSource: CREB®
12 month moving average
STRATHMORE MONTHS OF INVENTORY
-8%-6%-4%-2%0%2%4%6%8%
10%12%14%
2011 2012 2013 2014 2015 2016
Semi Y/Y%change Row Y/Y% changeApartment Y/Y% change Detached Y/Y% Change
Source: CREB®
STRATHMORE PRICE CHANGE
100,000
150,000
200,000
250,000
300,000
350,000
400,000
2011 2012 2013 2014 2015 2016Detached Price Apartment Price
Row Price Semi PriceSource: CREB®
STRATHMORE PRICES
0
10
20
30
40
50
60 YTD APRIL
YTD 2013 YTD 2014 YTD 2015 YTD 2016Source: CREB®
STRATHMORE TOTAL SALES BY PRICE RANGE
Apr 2016

Mountain View Region
CREB® Calgary Regional Housing Market Statistics 17
April 2016Sales
New Listings
Sales to New Listings Ratio
InventoryMonths of Supply
Benchmark Price
Average Price
Median Price
Share of Sales Activity
Total Mountain View Region* 39 118 33.05% 368 9.44 293,100 378,290 350,000 100%Rural Mountain View* 12 27 44.44% 90 7.50 389,900 529,908 514,000 31%Carstairs 10 24 41.67% 53 5.30 319,500 337,000 332,500 26%Cremona 1 2 50.00% 2 2.00 - 193,000 193,000 3%Didsbury 5 21 23.81% 55 11.00 252,500 358,900 272,500 13%Olds* 5 30 16.67% 89 17.80 292,300 360,800 237,000 13%Sundre* 6 12 50.00% 74 12.33 271,200 205,483 171,500 15%
Other* 0 2 0.00% 5 - - 433,841 423,000 0%
*Data within these areaa many not accurately reflect total resale activity and trends
0
10
20
30
40
50
60
70
80
90
100
INVENTORY BY PRICE RANGE
Rural Mountain View Didsbury Olds
Sundre Carstairs Cremona
OtherSource: CREB®
APRIL
0
1
2
3
4
5
6
7
8
9
10
SALES BY PRICE RANGE
Rural Mountain View Didsbury Olds
Sundre Carstairs Cremona
OtherSource: CREB®
APRIL
97% 100% 100%
80%
100% 100% 100%
3%
20%
0%
10%
20%
30%
40%
50%
60%
70%
80%
90%
100%
Mountain ViewRegion
Rural Mountain View Didsbury Olds Sundre Carstairs Cremona
SHARE OF SALES BY PROPERTY TYPE
Detached Apartment Semi - Detached RowSource: CREB®
APRIL
Apr 2016

Kneehill Region
CREB® Calgary Regional Housing Market Statistics 18
April 2016Sales
New Listings
Sales to New Listings Ratio
InventoryMonths of Supply
Benchmark Price
Average Price
Median Price
Share of Sales Activity
Total Kneehill Region* 10 23 43.48% 85 8.50 - 286,650 245,000 100%Rural Kneehill* 3 3 100.00% 18 6.00 - 395,833 402,500 30%Acme* 1 2 50.00% 6 6.00 - 195,000 195,000 10%Linden* 0 2 0.00% 5 - - - - 0%Three Hills* 6 6 100.00% 24 4.00 - 247,333 245,000 60%Trochu* 0 5 0.00% 21 - - - - 0%
Other* 0 5 0.00% 11 - - 321,500 302,500 0%
*Data within these areaa many not accurately reflect total resale activity and trends
0
5
10
15
20
25
30
35
40
INVENTORY BY PRICE RANGE
Rural Kneehill Three Hills Acme
Linden Trochu Other
Source: CREB®
APRIL
0
1
2
3
4
5
SALES BY PRICE RANGE
Rural Kneehill Three Hills Acme
Linden Trochu Other
Source: CREB®
APRIL
90%
100%
83%
100%
10%
17%
75%
80%
85%
90%
95%
100%
Kneehill Region Rural Kneehill Three Hills Acme Linden Trochu
SHARE OF SALES BY PROPERTY TYPE
Detached Apartment Semi - Detached RowSource: CREB®
APRIL
Apr 2016

Willow Creek Region
CREB® Calgary Regional Housing Market Statistics 19
April 2016Sales
New Listings
Sales to New Listings Ratio
InventoryMonths of Supply
Benchmark Price
Average Price
Median Price
Share of Sales Activity
Total Willow Creek Region* 8 21 38.10% 95 11.88 - 299,750 267,000 100%Rural Willow Creek* 2 2 100.00% 13 6.50 - 520,000 520,000 25%Claresholm* 2 9 22.22% 43 21.50 - 254,000 254,000 25%Nanton* 4 5 80.00% 22 5.50 - 212,500 179,500 50%Stavely* 0 3 0.00% 12 - - - - 0%
Other* 0 2 0.00% 5 - - 314,000 347,500 0%
*Data within these areaa many not accurately reflect total resale activity and trends
0
5
10
15
20
25
30
35
40
INVENTORY BY PRICE RANGE
Rural Willow Creek Claresholm Nanton Stavely Other
Source: CREB®
APRIL
0
1
1
2
2
3
3
4
SALES BY PRICE RANGE
Rural Willow Creek Claresholm Nanton Stavely Other
Source: CREB®
APRIL
88%
100%
50%
100%
13%
50%
0%
10%
20%
30%
40%
50%
60%
70%
80%
90%
100%
Willow Creek Region Rural Willow Creek Claresholm Nanton Stavely
SHARE OF SALES BY PROPERTY TYPE
Detached Apartment Semi - Detached RowSource: CREB®
APRIL
Apr 2016

Vulcan Region
CREB® Calgary Regional Housing Market Statistics 20
April 2016Sales
New Listings
Sales to New Listings Ratio
InventoryMonths of Supply
Benchmark Price
Average Price
Median Price
Share of Sales Activity
Total Vulcan Region* 5 8 62.50% 60 12.00 - 125,980 147,500 100%Rural Vulcan* 0 3 0.00% 19 - - - - 0%Vulcan* 2 1 200.00% 18 9.00 - 176,250 176,250 40%Carmangay* 0 1 0.00% 5 - - - - 0%Champion* 2 0 - 5 2.50 - 64,950 64,950 40%
Other* 1 3 33.33% 13 13.00 - 147,500 147,500 20%
*Data within these areaa many not accurately reflect total resale activity and trends
0
10
20
30
40
INVENTORY BY PRICE RANGE
Rural Vulcan Vulcan Carmangay
Champion Other
Source: CREB®
APRIL
0
1
2
3
4
5
6
SALES BY PRICE RANGE
Rural Vulcan Vulcan Carmangay
Champion Other
Source: CREB®
APRIL
80%
100%
20%
50%
0%
10%
20%
30%
40%
50%
60%
70%
80%
90%
100%
Vulcan Region Rural Vulcan Vulcan Carmangay Champion
SHARE OF SALES BY PROPERTY TYPE
Detached Apartment Semi - Detached RowSource: CREB®
APRIL
Apr 2016

Bighorn Region
CREB® Calgary Regional Housing Market Statistics 21
April 2016Sales
New Listings
Sales to New Listings Ratio
InventoryMonths of Supply
Benchmark Price
Average Price
Median Price
Share of Sales Activity
Total Bighorn Region* 20 29 68.97% 98 4.90 - 592,650 431,500 100%Rural Bighorn* 2 0 - 6 3.00 - 32,000 32,000 10%Canmore* 17 27 62.96% 87 5.12 - 670,235 540,000 85%
Other* 1 2 50.00% 5 5.00 - 395,000 395,000 5%
*Data within these areaa many not accurately reflect total resale activity and trends
0
10
20
30
INVENTORY BY PRICE RANGE
Canmore Other Rural Bighorn
Source: CREB®
APRIL
0
1
2
3
4
5
SALES BY PRICE RANGE
Canmore Other Rural Bighorn
Source: CREB®
APRIL
20% 18%
50% 47%
100%
10% 12%
20% 24%
0%
10%
20%
30%
40%
50%
60%
70%
80%
90%
100%
Bighorn Region Canmore Rural Bighorn
SHARE OF SALES BY PROPERTY TYPE
Detached Apartment Semi - Detached RowSource: CREB®
APRIL
Apr 2016

CREB® Definitions
CREB® Calgary Regional Housing Market Statistics 22
CREB® REPORTING REGIONS * Data within these areas may not accurately reflect total resale activity and trends. CREB® resale data only includes activity occurring within our membership. For the identified areas, the data could be missing a signification portion of transactions as not all active Realtors® in the area are a member of the CREB® board. ** Resale activity in these areas does not meet the minimum reporting standard. DEFINITIONS Benchmark Price - Represents the monthly price of the typical home based on its attributes, such as size, location and number of bedrooms. MLS® Home Price Index – changes in home prices by comparing current price levels relative to January 2005 price level. Absorption Rate – refers to the ratio between the amounts of sales occurring in the market relative to the amount of active listings / Inventory. Months of Supply – refers to the ratio between inventory and sales and represents at the current pace of sales how long it would take to sell existing inventory and the current rate of sales. Detached - A unit that is not attached to any other unit. Semi-detached - A single dwelling built as one of a pair that shares one common wall. Row - A single dwelling attached to each other by a common wall with more than two properties in the complex. Attached - Both row and semi-detached properties. Apartment - High-rise and low-rise condominium properties with access through an interior hallway. Total Residential - Includes detached, attached and apartment style properties. Exclusions – Data included in this package do not include activity related to multiple-unit sales, rental, land or leased properties. Rural – Data represents activity occurring within the broader region but not in any specific town/hamlet/village within the
ABOUT CREB® CREB® is a professional body of more than 5,100 licensed brokers and registered associates, representing 245 member offices. CREB® is dedicated to enhancing the value, integrity and expertise of its REALTOR® members. Our REALTORS® are committed to a high standard of professional conduct, ongoing education, and a strict Code of Ethics and standards of business practice. Any use or reference to CREB® data and statistics must acknowledge CREB® as the source. The board does not generate statistics or analysis of any individual member or company’s market share. All MLS® active listings for Calgary and area may be found on the board’s website at ww.creb.com. CREB® is a registered trademark of the Calgary Real Estate Board Cooperative. The trademarks MLS® and Multiple Listing Service® are owned by the Canadian Real Estate Association (CREA) and identify the quality of services provided by real estate professionals who are members of CREA. The trademarks REALTOR® and REALTORS® are controlled by CREA and identify real estate professionals who are members of CREA, and subsequently the Alberta Real Estate Association and CREB®, used under licence.
WILLOW CREEK* Rural Willow Creek County* Claresholm* Fort Macleod** Granum** Nanton* Parkland**
BIGHORN* Rural Bighorn M.D. Benchlands** Canmore* Exshaw** Ghost Lake** Harvie Heights** Lac des Arcs** Seebe** Waiparous**
FOOTHILLS Rural Foothills M.D. Aldersyde** Black Diamond Blackie Cayley De Winton Heritage Pointe High River Longview** Millarville** Okotoks Priddis** Priddis Greens Turner Valley
KNEEHILL* Rural Kneehill County Acme Carbon** Huxley** Linden Swalwell** Three Hills Torrington** Trochu Wimborne**
MOUNTAIN VIEW* Rural Mountain View County Bearberry** Bergen** Carstairs Cremona Didsbury Eagle Hill** Elkton** Olds* Sundre* Water Valley** Westward Ho**
ROCKY VIEW Rural Rocky View County Balzac** Beiseker Bottrel** Bragg Creek Chestermere Cochrane Cochrane Lake** Conrich** Crossfield Dalemead** Dalroy** Delacour** Indus** Irricana Janet** Kathyrn** Keoma** Langdon Madden** Redwood Meadows
VULCAN* Rural Vulcan County* Arrowwood** Brand** Carmangay* Champion* Ensign** Herronton** Kirkcaldy** Lomond** Milo** Mossleigh** Queenstown** Shouldice** Travers**
WHEATLAND* Rural Wheatland County* Ardenode** Carseland* Chancellow** Cheadle** Cluny** Dalum** Gleichen** Hussar** Lyalta* Namaka** Rockyford* Rosebud** Standard**
Apr 2016