monthly economic and financial developments report
TRANSCRIPT
Release Date: 30th March, 2020
Monthly Economic and Financial Developments
February 2020
In an effort to provide the public with more frequent information on its economic surveillance activities, the Central Bank has decided to release monthly reports on economic and financial sector developments in The Bahamas. The Bank monitors these conditions as part of its monetary policy mandate, to assess whether money and credit trends are sustainable relative to levels of external reserves required to protect the value of the Bahamian dollar and, if not, the degree to which credit policies ought to be adjusted. The main data source for this surveillance is financial institutions’ daily reports on foreign exchange transactions and weekly balance sheet statements. Therefore, monthly approximations may not coincide with calendar estimates reported in the Central Bank’s quarterly reports. The Central Bank will release its “Monthly Economic and Financial Developments” report on the Monday following its monthly Monetary Policy Committee Meeting.
Future Release Dates:
2020: May 4, June 1, June 29, August 4, August 31, September 28, November 2, November 30, December 21,
Monthly Economic and Financial Developments (MEFD)
February 2020
1. Domestic Economic Developments
Overview
Preliminary indications are that the domestic economy exhibited moderated, but slightly positive performance during February, in line with tourism output constraints. Sustained growth in the sea segment contrasted with reaction in the high value-added air component which contracted, as some capacity remained offline in hurricane damage areas. The effects of travel restrictions related to COVID-19 began to take an accelerated toll in March. Nevertheless, ongoing foreign investment projects provided stimulus to the construction sector, and to a lesser extent post-hurricane rebuilding works. Monetary sector developments featured an expansion in bank liquidity, amid a build-up in total deposits and a reduction in domestic credit. Similarly, during the review month external reserves registered growth, on account of foreign currency inflows from re-insurance and real sector activities.
Real Sector
Tourism
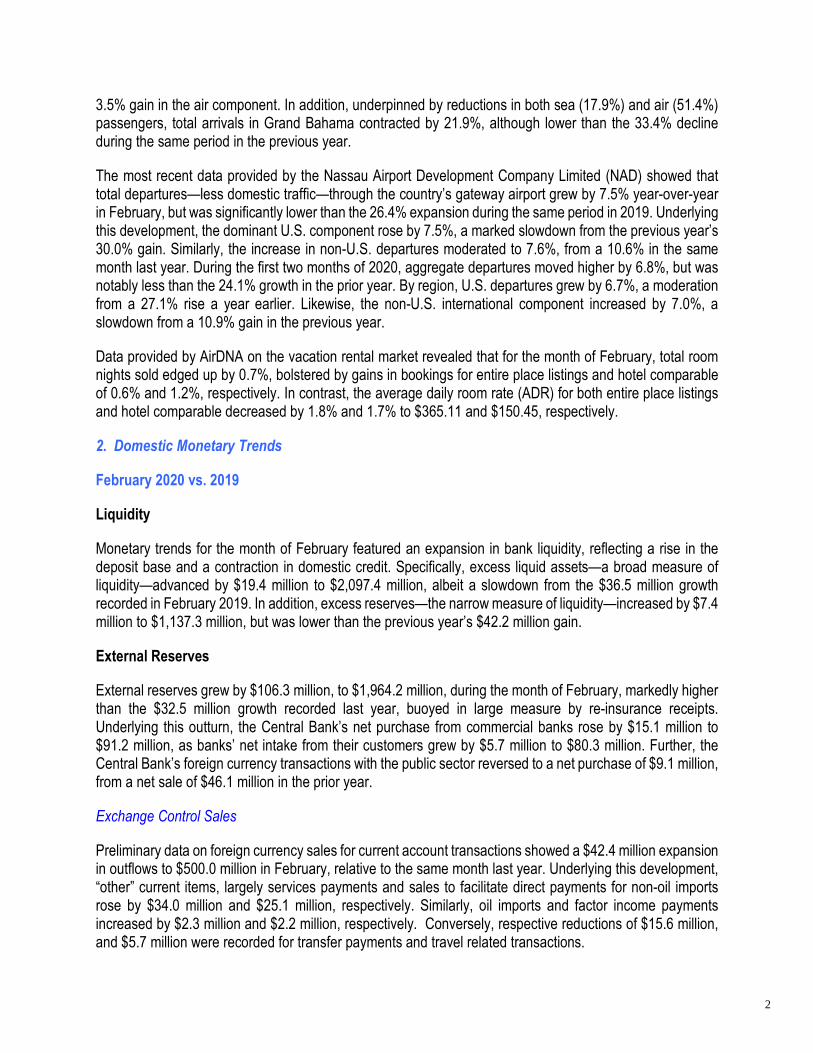
Tourism metrics for the month of January revealed that the sector performed under potential, as the rise in sea arrivals overshadowed the fallof in the high value-added air segment.
Preliminary data provided by the Ministry of Tourism (MOT), revealed that total visitor arrivals for the month of January grew by 7.9%, albeit a sharp moderation from the 19.3% growth recorded in the same period last year. Specifically, the sea segment rose by 10.8%, following a 17.1% expansion a year earlier. Further, the high value added air segment decreased by 3.5%, vis-à-vis a 28.8% increase last year.
Disaggregated by major ports of entry, arrivals to the Family Islands surged by 63.8%, exceeding the 23.1% growth in the previous year, as the 76.0% rise in sea passengers, outstripped the 23.2% decrease in air traffic. Conversely, visitors to New Providence reduced by 14.2%, contrasting with the 30.0% increase in 2019, with the 20.3% falloff in the sea segment, overshadowing the
Chart 1: Tourism Indicators at a Glance
Sources: Ministry of Tourism & Nassau Airport Development Co.
• Total arrivals up 7.9%
• Air down 3.5%
• Sea up 10.8%
• Departures up 6.8%
• United States up 6.7%
• Non-US International up 7.0%
Arrivals
YTD
January 2020
Departures
YTD
February 2020
1
3.5% gain in the air component. In addition, underpinned by reductions in both sea (17.9%) and air (51.4%) passengers, total arrivals in Grand Bahama contracted by 21.9%, although lower than the 33.4% decline during the same period in the previous year.
The most recent data provided by the Nassau Airport Development Company Limited (NAD) showed that total departures—less domestic traffic—through the country’s gateway airport grew by 7.5% year-over-year in February, but was significantly lower than the 26.4% expansion during the same period in 2019. Underlying this development, the dominant U.S. component rose by 7.5%, a marked slowdown from the previous year’s 30.0% gain. Similarly, the increase in non-U.S. departures moderated to 7.6%, from a 10.6% in the same month last year. During the first two months of 2020, aggregate departures moved higher by 6.8%, but was notably less than the 24.1% growth in the prior year. By region, U.S. departures grew by 6.7%, a moderation from a 27.1% rise a year earlier. Likewise, the non-U.S. international component increased by 7.0%, a slowdown from a 10.9% gain in the previous year.
Data provided by AirDNA on the vacation rental market revealed that for the month of February, total room nights sold edged up by 0.7%, bolstered by gains in bookings for entire place listings and hotel comparable of 0.6% and 1.2%, respectively. In contrast, the average daily room rate (ADR) for both entire place listings and hotel comparable decreased by 1.8% and 1.7% to $365.11 and $150.45, respectively.
2. Domestic Monetary Trends
February 2020 vs. 2019
Liquidity
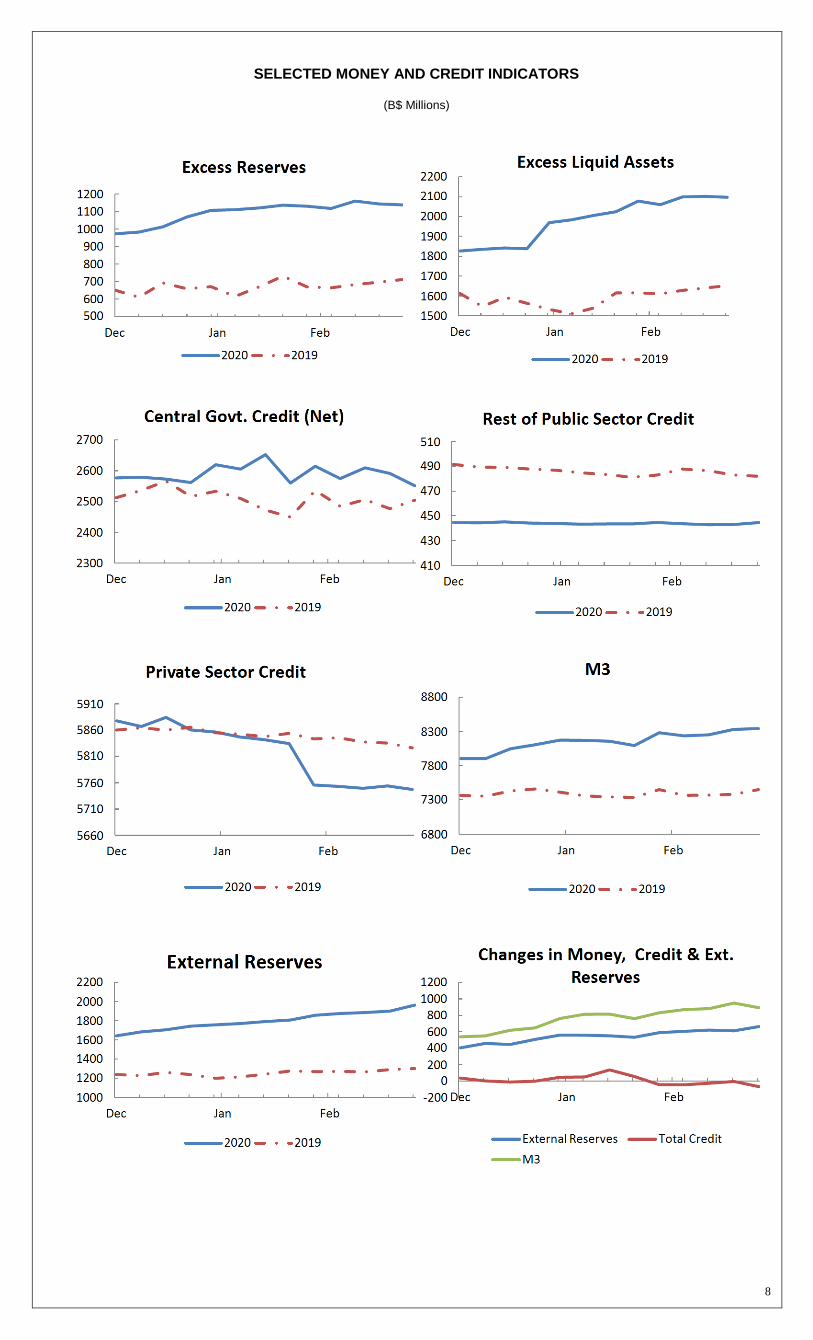
Monetary trends for the month of February featured an expansion in bank liquidity, reflecting a rise in the deposit base and a contraction in domestic credit. Specifically, excess liquid assets—a broad measure of liquidity—advanced by $19.4 million to $2,097.4 million, albeit a slowdown from the $36.5 million growth recorded in February 2019. In addition, excess reserves—the narrow measure of liquidity—increased by $7.4 million to $1,137.3 million, but was lower than the previous year’s $42.2 million gain.
External Reserves
External reserves grew by $106.3 million, to $1,964.2 million, during the month of February, markedly higher than the $32.5 million growth recorded last year, buoyed in large measure by re-insurance receipts. Underlying this outturn, the Central Bank’s net purchase from commercial banks rose by $15.1 million to $91.2 million, as banks’ net intake from their customers grew by $5.7 million to $80.3 million. Further, the Central Bank’s foreign currency transactions with the public sector reversed to a net purchase of $9.1 million, from a net sale of $46.1 million in the prior year.
Exchange Control Sales
Preliminary data on foreign currency sales for current account transactions showed a $42.4 million expansion in outflows to $500.0 million in February, relative to the same month last year. Underlying this development, “other” current items, largely services payments and sales to facilitate direct payments for non-oil imports rose by $34.0 million and $25.1 million, respectively. Similarly, oil imports and factor income payments increased by $2.3 million and $2.2 million, respectively. Conversely, respective reductions of $15.6 million, and $5.7 million were recorded for transfer payments and travel related transactions.
2

Domestic Credit
Bahamian Dollar Credit
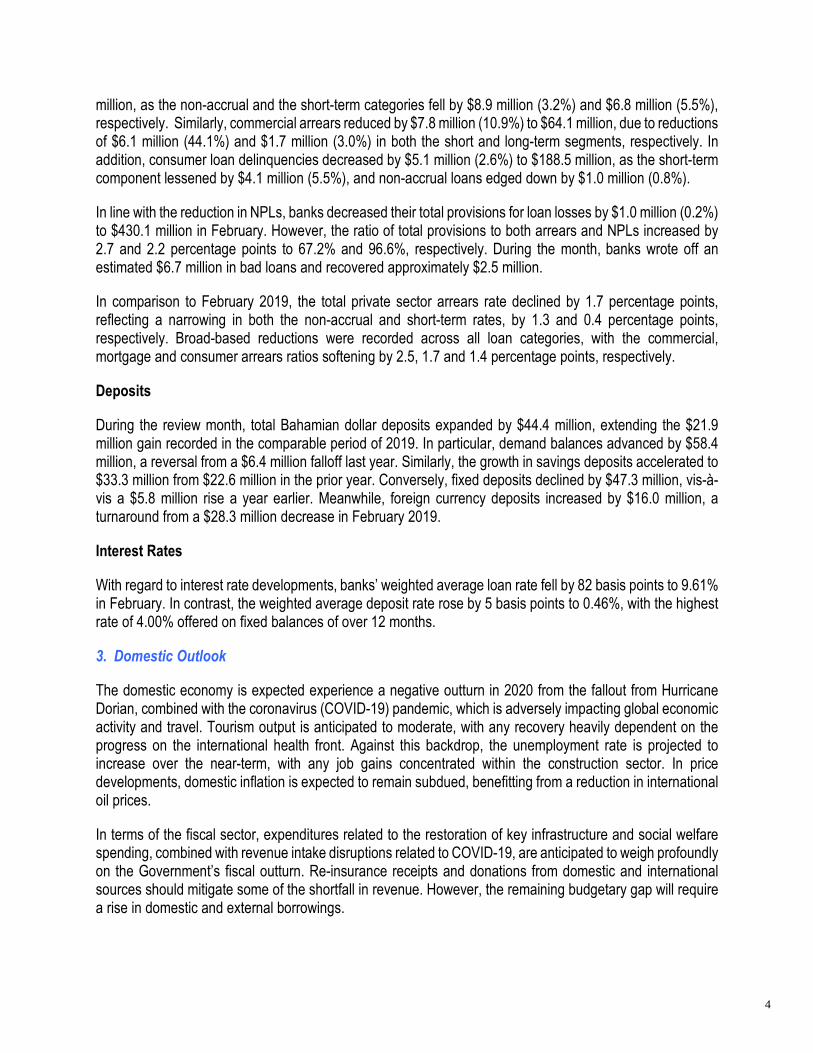
Total Bahamian dollar credit contracted by $68.4 million in February, extending the $49.2 million decline in the same period last year. The outcome was led by a $67.8 million reduction in net claims on the Government, notably higher than the $33.6 million decrease in the preceding year. In addition, credit to the private sector fell by a muted $0.6 million, following a $15.5 million retrenchment in 2019. In this regard, the decline in commercial credit and mortgages extended to $6.5 million and $3.8 million, respectively, from $1.3 million and $2.7 million in the prior year. In contrast, consumer credit grew by $9.8 million, vis-à-vis an $11.5 million falloff a year earlier. Further, the decrease in credit to public corporations stabilized at $0.1 million during the review month.
Foreign Currency Credit
Domestic foreign currency credit reduced by $3.7 million in February, exceeding the muted $0.2 million decline in 2019. Falloff in private sector credit accelerated to $7.9 million from $1.6 million in the previous year. Underlying this outturn, commercial loans decreased by $8.3 million, extending the $2.0 million reduction a year earlier, while the increase in mortgages held steady at $0.4 million, vis-à-vis the same period last year. In contrast, the growth in net claims on the Government broadened to $4.2 million from $2.3 million in the prior year. Further, credit to the public corporations was flat, following a $0.9 million decrease in the previous year.
Credit Quality
During the review month, total private sector arrears contracted by $28.5 million (4.3%) to $640.2 million, with the accompanying ratio decreasing by 50 basis points to 11.4%. An analysis by the average age of delinquency showed that short-term arrears (31-90 days) reduced by $17.0 million (8.0%) to $194.9 million, lowering the attendant ratio by 29 basis points to 3.5%. Similarly, non-performing loans (NPLs) fell by $11.6 million (2.5%) to $445.3 million, resulting in the relevant ratio declining by 20 basis points to 7.9% of total private sector loans.
Disaggregated by loan type, the decline in total arrears was led by a $15.6 million (3.9%) contraction in mortgage delinquencies to $387.7
Mortgages down by
$3.8 million
Consumer credit up by $9.8 million
Commercial credit down
by $6.5 million
Private Sector Credit down
by $0.6 million
0
5
10
15
20
25
0
200
400
600
800
1000
1200
1400
Graph 1: B$ Credit Quality Indicators
Total Arrears (left axis) NPLs (left axis)
Arrears/Total Loans (right axis) NPL/Total Loans (right axis)
%
Source: Central Bank of The Bahamas
Chart 2: B$ Private Sector Credit
Source: Central Bank of The Bahamas
3
million, as the non-accrual and the short-term categories fell by $8.9 million (3.2%) and $6.8 million (5.5%), respectively. Similarly, commercial arrears reduced by $7.8 million (10.9%) to $64.1 million, due to reductions of $6.1 million (44.1%) and $1.7 million (3.0%) in both the short and long-term segments, respectively. In addition, consumer loan delinquencies decreased by $5.1 million (2.6%) to $188.5 million, as the short-term component lessened by $4.1 million (5.5%), and non-accrual loans edged down by $1.0 million (0.8%).
In line with the reduction in NPLs, banks decreased their total provisions for loan losses by $1.0 million (0.2%) to $430.1 million in February. However, the ratio of total provisions to both arrears and NPLs increased by 2.7 and 2.2 percentage points to 67.2% and 96.6%, respectively. During the month, banks wrote off an estimated $6.7 million in bad loans and recovered approximately $2.5 million.
In comparison to February 2019, the total private sector arrears rate declined by 1.7 percentage points, reflecting a narrowing in both the non-accrual and short-term rates, by 1.3 and 0.4 percentage points, respectively. Broad-based reductions were recorded across all loan categories, with the commercial, mortgage and consumer arrears ratios softening by 2.5, 1.7 and 1.4 percentage points, respectively.
Deposits
During the review month, total Bahamian dollar deposits expanded by $44.4 million, extending the $21.9 million gain recorded in the comparable period of 2019. In particular, demand balances advanced by $58.4 million, a reversal from a $6.4 million falloff last year. Similarly, the growth in savings deposits accelerated to $33.3 million from $22.6 million in the prior year. Conversely, fixed deposits declined by $47.3 million, vis-à-vis a $5.8 million rise a year earlier. Meanwhile, foreign currency deposits increased by $16.0 million, a turnaround from a $28.3 million decrease in February 2019.
Interest Rates
With regard to interest rate developments, banks’ weighted average loan rate fell by 82 basis points to 9.61% in February. In contrast, the weighted average deposit rate rose by 5 basis points to 0.46%, with the highest rate of 4.00% offered on fixed balances of over 12 months.
3. Domestic Outlook
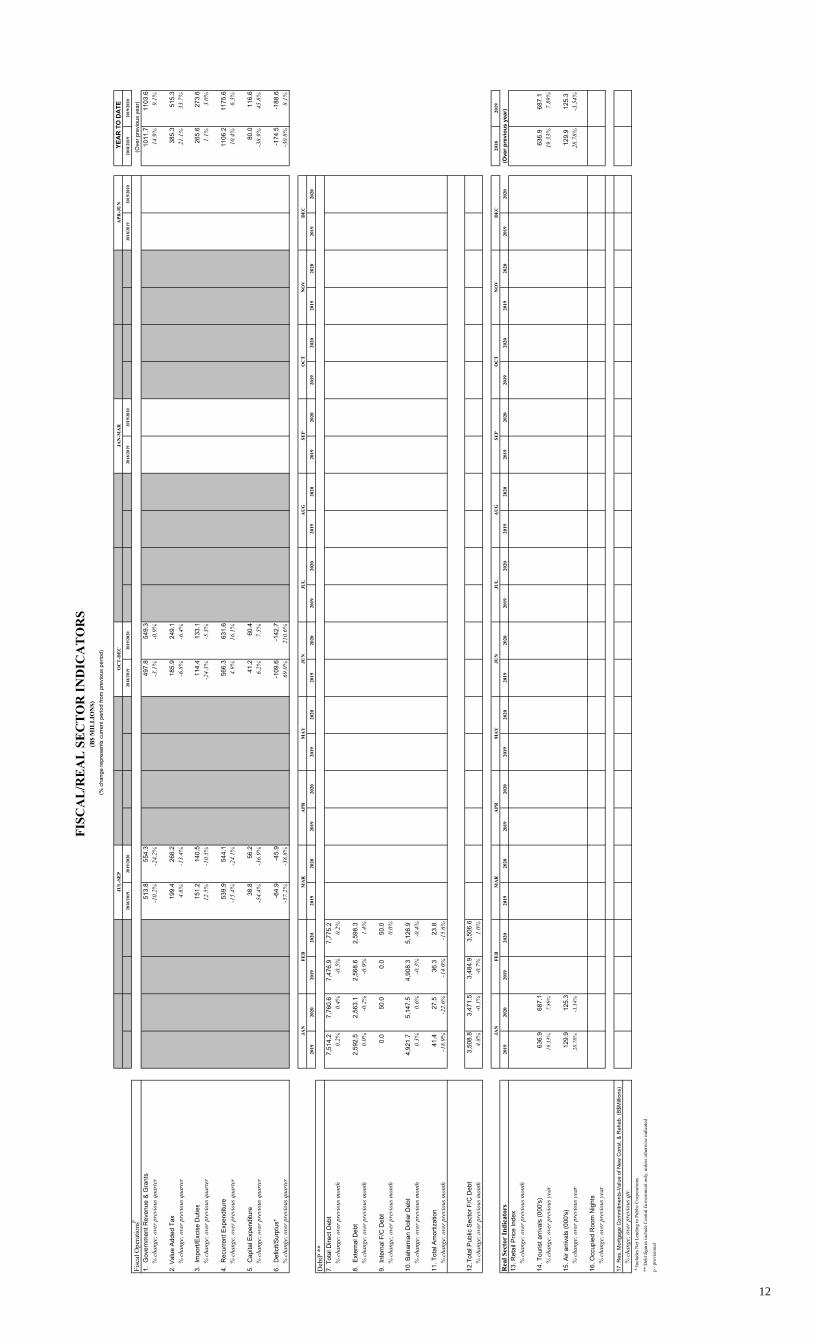
The domestic economy is expected experience a negative outturn in 2020 from the fallout from Hurricane Dorian, combined with the coronavirus (COVID-19) pandemic, which is adversely impacting global economic activity and travel. Tourism output is anticipated to moderate, with any recovery heavily dependent on the progress on the international health front. Against this backdrop, the unemployment rate is projected to increase over the near-term, with any job gains concentrated within the construction sector. In price developments, domestic inflation is expected to remain subdued, benefitting from a reduction in international oil prices.
In terms of the fiscal sector, expenditures related to the restoration of key infrastructure and social welfare spending, combined with revenue intake disruptions related to COVID-19, are anticipated to weigh profoundly on the Government’s fiscal outturn. Re-insurance receipts and donations from domestic and international sources should mitigate some of the shortfall in revenue. However, the remaining budgetary gap will require a rise in domestic and external borrowings.
4

Developments in the monetary sector will continue be underpinned by elevated banking sector liquidity, as commercial banks sustain their cautious lending posture. External reserve balances are projected to decline during the year, owing to a falloff in foreign currency receipts related to tourism activity and increased spending on imports for reconstruction work. However, external balances are poised to remain well above international benchmarks, amid reinsurance inflows and proceeds from external financing.
4. Monetary Policy Implications
Given the current outlook, the Central Bank will maintain an accommodative policy stance and continue to pursue policies that support economic growth and the overall recovery. In addition, the Bank will continue to monitor international and domestic developments, with a view to sustaining financial stability.
5
APPENDIX
International Developments
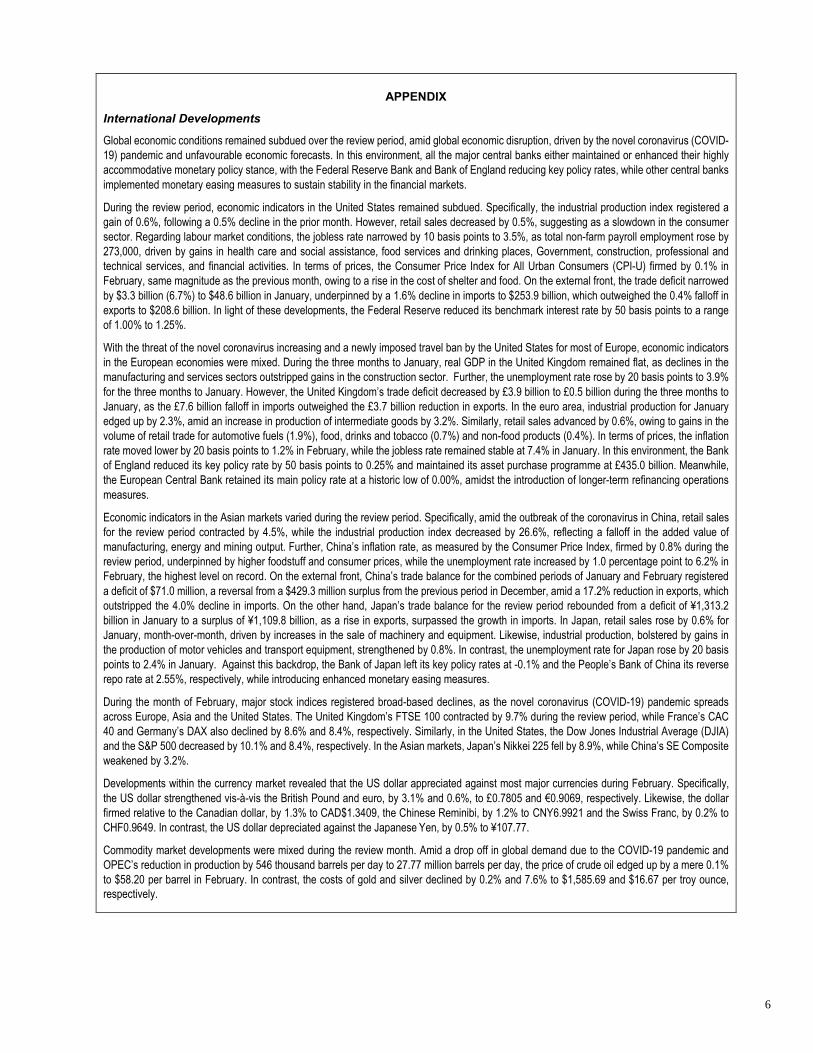
Global economic conditions remained subdued over the review period, amid global economic disruption, driven by the novel coronavirus (COVID-19) pandemic and unfavourable economic forecasts. In this environment, all the major central banks either maintained or enhanced their highly accommodative monetary policy stance, with the Federal Reserve Bank and Bank of England reducing key policy rates, while other central banks
implemented monetary easing measures to sustain stability in the financial markets.
During the review period, economic indicators in the United States remained subdued. Specifically, the industrial production index registered a gain of 0.6%, following a 0.5% decline in the prior month. However, retail sales decreased by 0.5%, suggesting as a slowdown in the consumer sector. Regarding labour market conditions, the jobless rate narrowed by 10 basis points to 3.5%, as total non-farm payroll employment rose by 273,000, driven by gains in health care and social assistance, food services and drinking places, Government, construction, professional and technical services, and financial activities. In terms of prices, the Consumer Price Index for All Urban Consumers (CPI-U) firmed by 0.1% in February, same magnitude as the previous month, owing to a rise in the cost of shelter and food. On the external front, the trade deficit narrowed
by $3.3 billion (6.7%) to $48.6 billion in January, underpinned by a 1.6% decline in imports to $253.9 billion, which outweighed the 0.4% falloff in exports to $208.6 billion. In light of these developments, the Federal Reserve reduced its benchmark interest rate by 50 basis points to a range of 1.00% to 1.25%.
With the threat of the novel coronavirus increasing and a newly imposed travel ban by the United States for most of Europe, economic indicators in the European economies were mixed. During the three months to January, real GDP in the United Kingdom remained flat, as declines in the manufacturing and services sectors outstripped gains in the construction sector. Further, the unemployment rate rose by 20 basis points to 3.9%
for the three months to January. However, the United Kingdom’s trade deficit decreased by £3.9 billion to £0.5 billion during the three months to January, as the £7.6 billion falloff in imports outweighed the £3.7 billion reduction in exports. In the euro area, industrial production for January edged up by 2.3%, amid an increase in production of intermediate goods by 3.2%. Similarly, retail sales advanced by 0.6%, owing to gains in the volume of retail trade for automotive fuels (1.9%), food, drinks and tobacco (0.7%) and non-food products (0.4%). In terms of prices, the inflation rate moved lower by 20 basis points to 1.2% in February, while the jobless rate remained stable at 7.4% in January. In this environment, the Bank of England reduced its key policy rate by 50 basis points to 0.25% and maintained its asset purchase programme at £435.0 billion. Meanwhile, the European Central Bank retained its main policy rate at a historic low of 0.00%, amidst the introduction of longer-term refinancing operations
measures.
Economic indicators in the Asian markets varied during the review period. Specifically, amid the outbreak of the coronavirus in China, retail sales for the review period contracted by 4.5%, while the industrial production index decreased by 26.6%, reflecting a falloff in the added value of manufacturing, energy and mining output. Further, China’s inflation rate, as measured by the Consumer Price Index, firmed by 0.8% during the review period, underpinned by higher foodstuff and consumer prices, while the unemployment rate increased by 1.0 percentage point to 6.2% in February, the highest level on record. On the external front, China’s trade balance for the combined periods of January and February registered
a deficit of $71.0 million, a reversal from a $429.3 million surplus from the previous period in December, amid a 17.2% reduction in exports, which outstripped the 4.0% decline in imports. On the other hand, Japan’s trade balance for the review period rebounded from a deficit of ¥1,313.2 billion in January to a surplus of ¥1,109.8 billion, as a rise in exports, surpassed the growth in imports. In Japan, retail sales rose by 0.6% for January, month-over-month, driven by increases in the sale of machinery and equipment. Likewise, industrial production, bolstered by gains in the production of motor vehicles and transport equipment, strengthened by 0.8%. In contrast, the unemployment rate for Japan rose by 20 basis points to 2.4% in January. Against this backdrop, the Bank of Japan left its key policy rates at -0.1% and the People’s Bank of China its reverse repo rate at 2.55%, respectively, while introducing enhanced monetary easing measures.
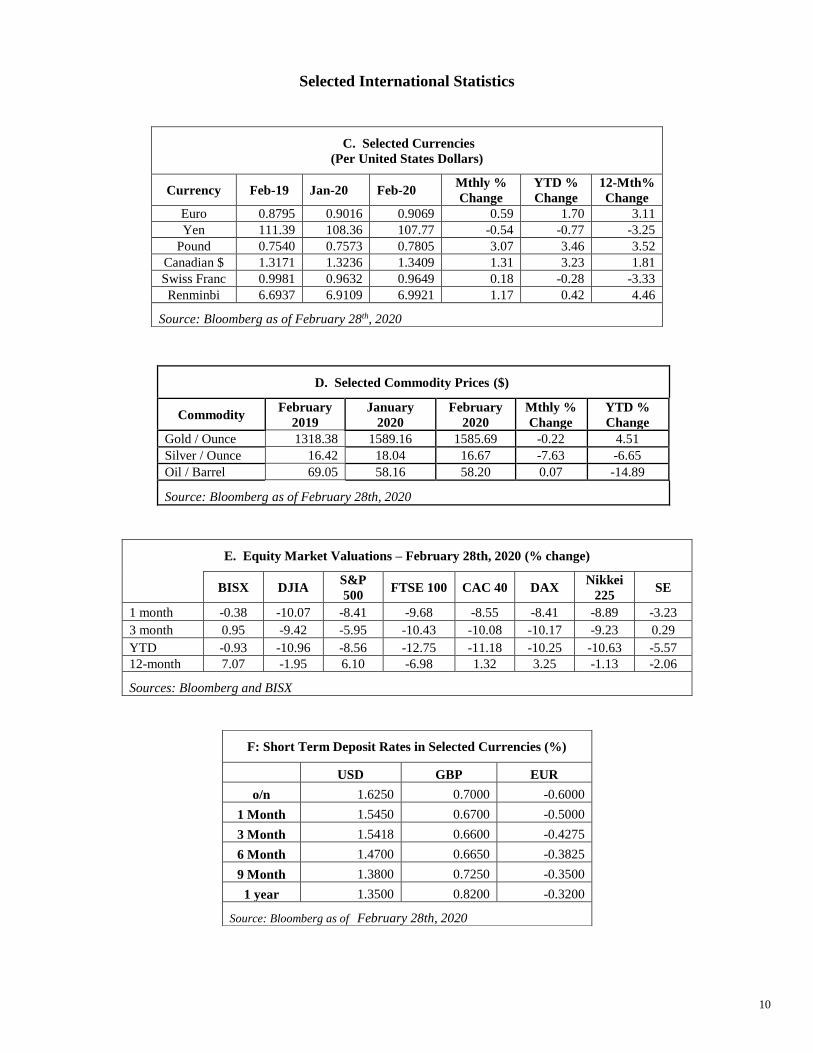
During the month of February, major stock indices registered broad-based declines, as the novel coronavirus (COVID-19) pandemic spreads across Europe, Asia and the United States. The United Kingdom’s FTSE 100 contracted by 9.7% during the review period, while France’s CAC 40 and Germany’s DAX also declined by 8.6% and 8.4%, respectively. Similarly, in the United States, the Dow Jones Industrial Average (DJIA) and the S&P 500 decreased by 10.1% and 8.4%, respectively. In the Asian markets, Japan’s Nikkei 225 fell by 8.9%, while China’s SE Composite weakened by 3.2%.
Developments within the currency market revealed that the US dollar appreciated against most major currencies during February. Specifically,
the US dollar strengthened vis-à-vis the British Pound and euro, by 3.1% and 0.6%, to £0.7805 and €0.9069, respectively. Likewise, the dollar firmed relative to the Canadian dollar, by 1.3% to CAD$1.3409, the Chinese Reminibi, by 1.2% to CNY6.9921 and the Swiss Franc, by 0.2% to CHF0.9649. In contrast, the US dollar depreciated against the Japanese Yen, by 0.5% to ¥107.77.
Commodity market developments were mixed during the review month. Amid a drop off in global demand due to the COVID-19 pandemic and OPEC’s reduction in production by 546 thousand barrels per day to 27.77 million barrels per day, the price of crude oil edged up by a mere 0.1% to $58.20 per barrel in February. In contrast, the costs of gold and silver declined by 0.2% and 7.6% to $1,585.69 and $16.67 per troy ounce, respectively.
6

Recent Monetary and Credit Statistics (B$ Millions)
February Value Change Change YTD
2019 2020 2019 2020 2019 2020
1.0 LIQUIDITY & FOREIGN ASSETS1.1 Excess Reserves 712.26 1,137.27 42.21 7.37 40.91 31.051.2 Excess Liquid Assets 1,651.76 2,097.44 36.45 19.38 119.97 127.941.3 External Reserves 1,301.12 1,964.23 32.49 106.30 101.95 206.021.4 Bank's Net Foreign Assets 102.91 371.28 -22.44 523.35 45.80 657.681.5 Usable Reserves 623.81 1,003.84 35.25 79.04 99.57 168.48
2.0 DOMESTIC CREDIT2.1 Private Sector 5,826.32 5,747.32 -17.06 -8.48 -28.74 -109.14
a. B$ Credit 5,629.01 5,614.63 -15.49 -0.57 -18.29 -40.94of which: Consumer Credit 2,094.78 2,077.42 -11.50 9.75 -23.12 -0.81
Mortgages 2,867.26 2,821.95 -2.71 -3.80 1.04 -16.64Commercial and Other Loans B$ 666.96 715.27 -1.28 -6.53 3.79 -23.49
b. F/C Credit 197.31 132.68 -1.57 -7.91 -10.44 -68.20of which: Mortgages 58.35 62.45 0.39 0.38 0.24 4.41
Commercial and Other Loans F/C 138.97 70.23 -1.96 -8.29 -10.68 -72.612.2 Central Government (net) 2,504.33 2,551.45 -31.31 -63.55 -29.20 -68.47
a. B$ Loans & Securities 2,709.35 2,823.57 -72.75 -29.38 -36.15 -25.63Less Deposits 208.39 326.79 -39.15 38.39 -1.50 42.02
b. F/C Loans & Securities 7.00 57.00 0.00 0.00 0.00 0.00Less Deposits 3.63 2.33 -2.29 -4.22 -5.46 0.82
2.3 Rest of Public Sector 481.95 444.53 -1.01 -0.06 -4.94 0.73a. B$ Credit 293.89 279.22 -0.09 -0.06 -3.22 0.73b. F/C Credit 188.06 165.31 -0.92 0.00 -1.72 0.00
2.4 Total Domestic Credit 8,812.59 8,743.30 -49.38 -72.09 -62.87 -176.88a. B$ Domestic Credit 8,423.85 8,390.64 -49.18 -68.40 -56.16 -107.86b. F/C Domestic Credit 388.75 352.66 -0.20 -3.69 -6.71 -69.02
3.0 DEPOSIT BASE3.1 Demand Deposits 2,465.53 3,051.26 -6.42 58.43 8.37 97.56
a. Central Bank 49.96 49.70 0.12 -2.03 -24.89 0.06b. Banks 2,415.56 3,001.55 -6.54 60.46 33.26 97.50
3.2 Savings Deposits 1,469.30 1,688.99 22.55 33.26 48.57 52.543.3 Fixed Deposits 2,535.04 2,371.15 5.80 -47.25 -27.21 -53.793.4 Total B$ Deposits 6,469.87 7,111.39 21.93 44.44 29.72 96.303.5 F/C Deposits of Residents 559.00 784.02 -28.32 15.98 40.93 114.033.6 M2 6,766.35 7,438.63 19.39 51.75 22.59 86.443.7 External Reserves/M2 (%) 19.23 26.41 0.43 1.25 1.45 2.493.8 External Reserves/Base Money (%) 101.40 111.36 1.32 4.81 5.60 9.813.9 External Reserves/Demand Liabilities (%) 96.05 102.26 2.78 2.71 7.21 7.00
Value Year To Date Change2019 2020 2019 2020 Month YTD
4.0 FOREIGN EXCHANGE TRANSACTIONS4.1 Central Bank Net Purchase/(Sale) 29.98 100.31 99.28 201.21 70.33 101.93
a. Net Purchase/(Sale) from/to Banks 76.11 91.23 171.85 214.45 15.12 42.59i. Sales to Banks 4.35 11.52 4.35 30.98 7.17 26.63ii. Purchase from Banks 80.46 102.75 176.20 245.43 22.29 69.22
b. Net Purchase/(Sale) from/to Others -46.13 9.08 -72.57 -13.24 55.21 59.34i. Sales to Others 78.48 57.36 148.49 131.71 -21.12 -16.78ii. Purchase from Others 32.35 66.44 75.92 118.47 34.09 42.55
4.2 Banks Net Purchase/(Sale) 74.61 80.26 178.89 213.18 5.66 34.29a. Sales to Customers 388.55 391.00 819.15 809.63 2.46 -9.52b. Purchase from Customers 463.15 471.27 998.04 1022.81 8.11 24.77
5.0 EXCHANGE CONTROL SALES5.1 Current Items 457.55 499.90 994.80 1,033.47 42.36 38.67
of which Public Sector 56.75 68.41 122.46 141.67 11.66 19.21a. Nonoil Imports 106.68 131.87 217.62 259.56 25.19 41.94 b. Oil Imports 46.05 48.38 101.26 96.48 2.32 -4.78 c. Travel 22.65 16.91 49.06 37.13 -5.74 -11.93 d. Factor Income 15.85 18.06 44.84 48.54 2.21 3.71 e. Transfers 27.21 11.59 45.05 27.33 -15.62 -17.73 f. Other Current Items 239.10 273.09 536.98 564.43 33.99 27.45
5.2 Capital Items 45.47 14.23 60.52 19.35 -31.24 -41.17 of which Public Sector 23.72 6.66 31.19 7.46 -17.06 -23.73
7
SELECTED MONEY AND CREDIT INDICATORS
(B$ Millions)
8

Selected International Statistics
A: Selected Macroeconomic Projections
(Annual % Change and % of labor force)
Real GDP Inflation Rate Unemployment 2018 2019 2018 2019 2018 2019
Bahamas 1.6 0.9 2.2 1.8 10.7 9.5*
United States 2.9 2.4 2.4 1.8 3.9 3.7
Euro-Area 1.9 1.2 1.8 1.2 8.2 7.7
Germany 1.5 0.5 1.9 1.5 3.4 3.2
Japan 0.8 0.9 1.0 1.0 2.4 2.4
China 6.6 6.1 2.1 2.3 3.8 3.8
United Kingdom 1.4 1.2 2.5 1.8 4.1 3.8
Canada 1.9 1.5 2.2 2.0 5.8 5.8
Source: IMF World Economic Outlook October 2019, Department of Statistics
May 2019*
B: Official Interest Rates – Selected Countries (%)
With effect CBOB ECB (EU) Federal Reserve (US)
Bank of
England
from Bank
Rate
Refinancing
Rate
Primary Target
Credit Funds Repo Rate
Rate Rate
September 2017 4.00 0.00 1.75 1.00-1.25 0.25
October 2017 4.00 0.00 1.75 1.00-1.25 0.25
November 2017 4.00 0.00 1.75 1.00-1.25 0.25
December 2017 4.00 0.00 1.75 1.00-1.25 0.50
January 2018 4.00 0.00 2.00 1.25-1.50 0.50
February 2018 4.00 0.00 2.00 1.25-1.50 0.50
March 2018 4.00 0.00 2.00 1.25-1.50 0.50
April 2018 4.00 0.00 2.25 1.50-1.75 0.50
May 2018 4.00 0.00 2.25 1.50-1.75 0.50
June 2018 4.00 0.00 2.50 1.75-2.00 0.50
July 2018 4.00 0.00 2.50 1.75-2.00 0.50
August 2018 4.00 0.00 2.50 1.75-2.00 0.50
September 2018 4.00 0.00 2.50 1.75-2.00 0.75
October 2018 4.00 0.00 2.75 2.00-2.25 0.75
November 2018 4.00 0.00 2.75 2.00-2.25 0.75
December 2018 4.00 0.00 2.75 2.00-2.25 0.75
January 2019 4.00 0.00 3.00 2.25-2.50 0.75
February 2019 4.00 0.00 3.00 2.25-2.50 0.75
March 2019 4.00 0.00 3.00 2.25-2.50 0.75
April 2019 4.00 0.00 3.00 2.25-2.50 0.75
May 2019 4.00 0.00 3.00 2.25-2.50 0.75
June 2019 4.00 0.00 3.00 2.25-2.50 0.75
July 2019 4.00 0.00 3.00 2.00-2.25 0.75
August 2019 4.00 0.00 2.75 2.00-2.25 0.75
September 2019 4.00 0.00 2.50 1.75-2.00 0.75
October 2019 4.00 0.00 2.25 1.50-1.75 0.75
November 2019 4.00 0.00 2.25 1.50-1.75 0.75
December 2019 4.00 0.00 2.25 1.50-1.75 0.75
January 2020 4.00 0.00 2.25 1.50-1.75 0.75
February 2020 4.00 0.00 2.25 0.00-0.25 0.25
9
Selected International Statistics
D. Selected Commodity Prices ($)
Commodity February
2019
January
2020
February
2020
Mthly %
Change YTD %
Change
Gold / Ounce 1318.38 1589.16 1585.69 -0.22 4.51
Silver / Ounce 16.42 18.04 16.67 -7.63 -6.65
Oil / Barrel 69.05 58.16 58.20 0.07 -14.89
Source: Bloomberg as of February 28th, 2020
E. Equity Market Valuations – February 28th, 2020 (% change)
BISX DJIA
S&P
500 FTSE 100 CAC 40 DAX
Nikkei
225 SE
1 month -0.38 -10.07 -8.41 -9.68 -8.55 -8.41 -8.89 -3.23
3 month 0.95 -9.42 -5.95 -10.43 -10.08 -10.17 -9.23 0.29
YTD -0.93 -10.96 -8.56 -12.75 -11.18 -10.25 -10.63 -5.57
12-month 7.07 -1.95 6.10 -6.98 1.32 3.25 -1.13 -2.06
Sources: Bloomberg and BISX
C. Selected Currencies
(Per United States Dollars)
Currency Feb-19 Jan-20 Feb-20 Mthly %
Change
YTD %
Change
12-Mth%
Change
Euro 0.8795 0.9016 0.9069 0.59 1.70 3.11
Yen 111.39 108.36 107.77 -0.54 -0.77 -3.25
Pound 0.7540 0.7573 0.7805 3.07 3.46 3.52
Canadian $ 1.3171 1.3236 1.3409 1.31 3.23 1.81
Swiss Franc 0.9981 0.9632 0.9649 0.18 -0.28 -3.33
Renminbi 6.6937 6.9109 6.9921 1.17 0.42 4.46
Source: Bloomberg as of February 28th, 2020
F: Short Term Deposit Rates in Selected Currencies (%)
USD GBP EUR
o/n 1.6250 0.7000 -0.6000
1 Month 1.5450 0.6700 -0.5000
3 Month 1.5418 0.6600 -0.4275
6 Month 1.4700 0.6650 -0.3825
9 Month 1.3800 0.7250 -0.3500
1 year 1.3500 0.8200 -0.3200
Source: Bloomberg as of February 28th, 2020
10

Sum
mar
y Ac
coun
ts o
f the
Cen
tral
Ban
k(B
$ M
illio
ns)
VALU
ECH
ANG
EJa
n. 0
1Ja
n. 0
8Ja
n. 1
5Ja
n. 2
2Ja
n. 2
9Fe
b. 0
5Fe
b. 1
2Fe
b. 1
9Fe
b. 2
6Ja
n. 0
1Ja
n. 0
8Ja
n. 1
5Ja
n. 2
2Ja
n. 2
9Fe
b. 0
5Fe
b. 1
2Fe
b. 1
9Fe
b. 2
6
I. Ex
tern
al R
eser
ves
1,75
8.21
1,77
1.66
1,79
2.39
1,80
8.34
1,85
7.93
1,87
6.13
1,88
6.39
1,90
1.11
1,96
4.23
14.1
613
.45
20.7
315
.94
49.6
018
.20
10.2
614
.72
63.1
2
II. N
et D
omes
tic A
sset
s (A
+ B
+ C
+ D)
(26.
84)
(54.
80)
(62.
61)
(59.
63)
(114
.36)
(137
.78)
(125
.04)
(143
.58)
(200
.44)
(7.4
4)(2
7.96
)(7
.81)
2.98
(54.
72)
(23.
42)
12.7
3(1
8.53
)(5
6.87
)
A. N
et C
redi
t to
Gov
't (I
+ ii
+ iii
-iv)
392.
4638
7.08
398.
0435
9.13
303.
8328
8.03
306.
2228
0.71
219.
35(2
6.98
)(5
.37)
10.9
5(3
8.91
)(5
5.30
)(1
5.80
)18
.19
(25.
51)
(61.
36)
i) A
dvan
ces
74.9
074
.90
74.9
074
.90
74.9
074
.90
74.9
074
.90
74.9
0-
--
--
--
--
ii) R
egist
ered
Sto
ck24
7.04
247.
0725
2.86
252.
9023
9.96
239.
7925
0.20
246.
3124
0.32
0.23
0.03
5.79
0.04
(12.
94)
(0.1
6)10
.41
(3.9
0)(5
.99)
iii) T
reas
ury
Bills
134.
9412
9.96
135.
0411
0.05
59.6
743
.58
43.5
814
.18
11.1
7(2
8.42
)(4
.98)
5.07
(24.
99)
(50.
38)
(16.
09)
0.00
(29.
40)
(3.0
1)
iv)
Depo
sits
64.4
264
.85
64.7
678
.72
70.7
070
.24
62.4
654
.67
107.
04(1
.21)
0.43
(0.0
9)13
.96
(8.0
2)(0
.46)
(7.7
8)(7
.79)
52.3
7
B. R
est o
f Pub
lic se
ctor
(Net
) (i+
ii-iii
)(4
2.72
)(6
3.68
)(5
6.60
)(4
0.20
)(4
4.81
)(5
0.50
)(5
2.46
)(4
5.98
)(4
2.77
)(2
.47)
(20.
97)
7.08
16.4
0(4
.60)
(5.6
9)(1
.97)
6.48
3.21
i) L
oans
2.25
2.25
2.25
2.25
2.25
2.25
2.25
2.25
2.25
--
--
--
--
-
ii) B
onds
/Sec
uriti
es4.
684.
684.
684.
684.
684.
684.
684.
684.
68-
--
--
--
--
iii) D
epos
its49
.65
70.6
263
.53
47.1
351
.74
57.4
359
.39
52.9
149
.70
2.47
20.9
7(7
.08)
(16.
40)
4.60
5.69
1.97
(6.4
8)(3
.21)
C. L
oans
to/D
epos
its w
ith B
anks
--
--
--
--
--
--
--
--
--
D. O
ther
Item
s (N
et)*
(376
.58)
(378
.20)
(404
.04)
(378
.56)
(373
.37)
(375
.31)
(378
.80)
(378
.31)
(377
.02)
22.0
0(1
.62)
(25.
84)
25.4
95.
18(1
.94)
(3.4
9)0.
491.
29
III. M
onet
ary
Base
1,73
1.38
1,71
6.86
1,72
9.78
1,74
8.70
1,74
3.58
1,73
8.36
1,76
1.35
1,75
7.54
1,76
3.79
6.71
(14.
51)
12.9
218
.92
(5.1
3)(5
.22)
22.9
9(3
.81)
6.25
A. C
urre
ncy
in C
ircul
atio
n48
8.50
460.
3044
4.96
434.
0844
1.53
453.
1544
5.15
438.
9644
6.13
(5.1
2)(2
8.21
)(1
5.34
)(1
0.88
)7.
4511
.62
(8.0
1)(6
.19)
7.18
B. B
ank
Bala
nces
with
CBO
B1,
242.
871,
256.
561,
284.
821,
314.
631,
302.
051,
285.
211,
316.
201,
318.
581,
317.
6511
.83
13.6
928
.25
29.8
1(1
2.58
)(1
6.84
)31
.00
2.38
(0.9
3)
11
20
18
/20
19
20
19
/20
20
20
18
/20
19
20
19
/20
20
20
18
/20
19
20
19
/20
20
20
18
/20
19
20
19
/20
20
20
18
/20
19
20
19
/20
20
Fis
cal
Op
erat
ion
sP
1.
Go
ve
rnm
en
t R
eve
nu
e &
Gra
nts
51
3.8
55
4.3
49
7.8
54
9.3
67
7.4
73
1.0
10
11
.71
10
3.6
%
change;
ove
r pre
vious
quart
er-1
0.2
%-2
4.2
%-3
.1%
-0.9
%36.1
%-1
00.0
%7.9
0%
#D
IV/0
!14.9
%9.1
%
2.
Va
lue
Ad
de
d T
ax
19
9.4
26
6.2
18
5.9
24
9.1
20
3.6
30
7.3
38
5.3
51
5.3
%
change;
ove
r pre
vious
quart
er4.6
%-1
3.4
%-6
.8%
-6.4
%9.5
%-1
00.0
%50.9
3%
#D
IV/0
!21.1
%33.7
%
3.
Im
po
rt/E
xcis
e D
utie
s1
51
.21
40
.51
14
.41
33
.11
03
.71
57
.12
65
.62
73
.6
%
change;
ove
r pre
vious
quart
er12.5
%-1
0.5
%-2
4.3
%-5
.3%
-9.4
%-1
00.0
%51.5
0%
#D
IV/0
!1.1
%3.0
%
4.
Re
cu
rre
nt
Exp
en
ditu
re5
39
.95
44
.15
66
.36
31
.65
94
.97
17
.01
10
6.2
11
75
.6
%
change;
ove
r pre
vious
quart
er-1
5.4
%-2
4.1
%4.9
%16.1
%5.1
%-1
00.0
%20.5
2%
#D
IV/0
!10.4
%6.3
%
5.
Ca
pita
l E
xp
en
ditu
re3
8.8
56
.24
1.2
60
.44
8.1
89
.18
0.0
11
6.6
%
change;
ove
r pre
vious
quart
er-5
4.4
%-3
6.9
%6.2
%7.5
%16.6
%-1
00.0
%85.4
0%
#D
IV/0
!-3
8.9
%45.8
%
6.
De
ficit/S
urp
lus*
-64
.9-4
5.9
-10
9.6
-14
2.7
34
.5-7
5.1
-17
4.5
-18
8.6
%
change;
ove
r pre
vious
quart
er-5
7.2
%-3
8.8
%69.0
%210.6
%-1
31.4
%-1
00.0
%-3
17.8
7%
#D
IV/0
!-3
0.8
%8.1
%
2
01
92
02
02
01
92
02
02
01
92
02
02
01
92
02
02
01
92
02
02
01
92
02
02
01
92
02
02
01
92
02
02
01
92
02
02
01
92
02
02
01
92
02
02
01
92
02
02
01
8
Deb
tP *
*
7.
To
tal D
ire
ct
De
bt
7,5
14
.27
,76
0.6
7,4
76
.97
,77
5.2
7,4
76
.97
,47
3.4
7,4
65
.27
,52
7.0
7,5
13
.87
,54
8.9
7,5
85
.77
,63
8.7
7,6
62
.97
,73
3.2
7,4
97
.3
%
change;
ove
r pre
vious
month
0.2
%0.4
%-0
.5%
0.2
%0.0
%-1
00.0
%0.0
%#D
IV/0
!-0
.1%
#D
IV/0
!0.8
%#D
IV/0
!-0
.2%
#D
IV/0
!0.5
%#D
IV/0
!0.5
%#D
IV/0
!0.7
%#D
IV/0
!0.3
%#D
IV/0
!0.9
%#D
IV/0
!0.9
%
8.
Exte
rna
l D
eb
t2
,59
2.5
2,5
63
.1
2,5
68
.62
,59
8.3
2,5
57
.12
,55
2.1
2,5
52
.42
,55
3.2
2,5
49
.92
,54
3.1
2,5
59
.82
,55
9.8
2,5
60
.22
,55
8.1
2,5
67
.72
,59
2.2
%
change;
ove
r pre
vious
month
0.0
%-0
.2%
-0.9
%1.4
%-0
.4%
-100.0
%-0
.2%
#D
IV/0
!0.0
%#D
IV/0
!0.0
%#D
IV/0
!-0
.1%
#D
IV/0
!-0
.3%
#D
IV/0
!0.7
%#D
IV/0
!0.0
%-1
00.0
%-0
.1%
#D
IV/0
!0.4
%#D
IV/0
!0.2
%
9.
In
tern
al F
/C D
eb
t0
.05
0.0
0.0
50
.00
.00
.00
.00
.00
.00
.00
.00
.01
5.0
50
.05
0.0
0
%
change;
ove
r pre
vious
month
#D
IV/0
!#D
IV/0
!#D
IV/0
!0.0
%#D
IV/0
!-1
00.0
%#D
IV/0
!#D
IV/0
!#D
IV/0
!#D
IV/0
!#D
IV/0
!#D
IV/0
!#D
IV/0
!#D
IV/0
!#D
IV/0
!#D
IV/0
!#D
IV/0
!#D
IV/0
!#D
IV/0
!#D
IV/0
!233.3
%#D
IV/0
!0.0
%#D
IV/0
!#D
IV/0
!
10
. B
ah
am
ian
Do
llar
De
bt
4,9
21
.75
,14
7.5
4,9
08
.35
,12
6.9
4,9
19
.74
,92
1.3
4,9
12
.84
,97
3.9
4,9
63
.95
,00
5.8
5,0
25
.95
,06
3.5
5,0
54
.85
,11
5.6
4,9
05
.1
%
change;
ove
r pre
vious
month
0.3
%0.6
%-0
.3%
-0.4
%0.2
%-1
00.0
%0.0
%#D
IV/0
!-0
.2%
#D
IV/0
!1.2
%#D
IV/0
!-0
.2%
#D
IV/0
!0.8
%#D
IV/0
!0.4
%#D
IV/0
!0.7
%#D
IV/0
!-0
.2%
#D
IV/0
!1.2
%#D
IV/0
!1.2
%
11
. T
ota
l A
mo
rtiz
atio
n4
1.4
27
.53
6.3
23
.81
12
.51
33
.53
3.8
27
.73
6.9
11
.84
9.5
17
3.1
18
.83
5.5
51
.0
%
change;
ove
r pre
vious
month
-18.9
%-2
2.6
%-1
4.0
%-1
5.6
%209.9
%-1
00.0
%18.7
%#D
IV/0
!-7
4.7
%#D
IV/0
!-1
8.0
%#D
IV/0
!33.1
%#D
IV/0
!-6
7.9
%#D
IV/0
!318.0
%#D
IV/0
!249.6
%#D
IV/0
!-8
9.1
%#D
IV/0
!88.9
%#D
IV/0
!34.1
%
(0.0
)(0
.0)
(0.0
)(0
.0)
(0.0
)0.0
(0.0
)0.0
(0.0
)0.0
(0.0
)0.0
(0.0
)0.0
(0.0
)0.0
(0.0
)(2
,559.8
)(0
.0)
0.0
(0.0
)0.0
(0.0
)0.0
(0.0
)
Public
Corp
F/C
Debt
916.3
3
858.3
3
916.3
3
858.3
2
904.8
3
904.9
0
904.9
0
887.4
3
887.4
3
887.4
1
865.8
1
865.8
1
865.8
1
858.3
3
756.3
8
12
.To
tal P
ub
lic S
ecto
r F
/C D
eb
t3
,50
8.8
3,4
71
.53
,48
4.9
3,5
06
.63
,46
2.0
0.0
3,4
57
.00
.03
,45
7.3
0.0
3,4
40
.60
.03
,43
7.3
0.0
3,4
30
.50
.03
,42
5.6
2,5
59
.83
,44
1.0
0.0
3,4
73
.90
.03
,47
6.0
0.0
3,3
48
.6
%
change;
ove
r pre
vious
month
4.8
%-0
.1%
-0.7
%1.0
%-0
.7%
-100.0
%-0
.1%
#D
IV/0
!0.0
1%
#D
IV/0
!-0
.48%
#D
IV/0
!-0
.1%
#D
IV/0
!-0
.2%
#D
IV/0
!-0
.1%
#D
IV/0
!0.5
%-1
00.0
%1.0
%#D
IV/0
!0.1
%#D
IV/0
!-0
.2%
20
18
20
19
Rea
l S
ecto
r I
nd
ica
tors
20
19
20
20
20
19
20
20
20
19
20
20
20
19
20
20
20
19
20
20
20
19
20
20
20
19
20
20
20
19
20
20
20
19
20
20
20
19
20
20
20
19
20
20
20
19
20
20
(O
ver
pre
vio
us y
ear)
13
. R
eta
il P
rice
In
de
x1
06
.71
08
.11
08
.21
08
.41
08
.21
08
.11
08
.91
08
.51
08
.81
08
.31
06
.70
.0
%
change;
ove
r pre
vious
month
0.7
0%
#D
IV/0
!1.2
6%
#D
IV/0
!0.1
2%
#D
IV/0
!0.1
5%
#D
IV/0
!-0
.2%
#D
IV/0
!-0
.1%
#D
IV/0
!0.7
%#D
IV/0
!-0
.4%
#D
IV/0
!0.3
%#D
IV/0
!-0
.5%
#D
IV/0
!-1
00.0
%#D
IV/0
!#D
IV/0
!#D
IV/0
!2.6
7%
-100.0
0%
14
. T
ou
rist
arr
iva
ls (
00
0's
)6
36
.96
87
.16
08
.47
49
.06
57
.65
89
.16
41
.4
65
0.4
55
3.5
34
9.4
48
2.7
61
8.8
70
6.3
63
6.9
6
87
.1
%
change;
ove
r pre
vious
year
19.3
3%
7.8
9%
13.8
9%
-100.0
0%
5.8
7%
-100.0
0%
11.8
8%
-100.0
0%
17.8
3%
-100.0
0%
18.8
3%
-100.0
0%
7.9
4%
-100.0
%7.2
7%
-100.0
%-1
2.7
6%
-100.0
%6.5
8%
-100.0
%7.2
9%
-100.0
%#D
IV/0
!-1
00.0
%19.3
3%
7.8
9%
15
. A
ir a
rriv
als
(0
00
's)
12
9.9
12
5.3
15
1.1
20
1.6
17
1.2
15
8.7
16
8.4
17
6.0
13
1.1
54
.17
5.1
10
5.1
14
0.1
12
9.9
1
25
.3
%
change;
ove
r pre
vious
year
28.7
8%
-3.5
4%
19.6
5%
-100.0
0%
9.4
8%
-100.0
0%
18.8
3%
-100.0
0%
16.6
1%
-100.0
0%
8.7
1%
-100.0
0%
7.6
9%
-100.0
%1.2
0%
-100.0
%-1
4.7
4%
-100.0
%-1
1.3
5%
-100.0
%-1
2.4
8%
-100.0
%#D
IV/0
!-1
00.0
%28.7
8%
-3.5
4%
16
. O
ccu
pie
d R
oo
m N
igh
ts0
.00
.0
%
change;
ove
r pre
vious
year
#D
IV/0
!#D
IV/0
!#D
IV/0
!#D
IV/0
!#D
IV/0
!#D
IV/0
!#D
IV/0
!#D
IV/0
!#D
IV/0
!#D
IV/0
!#D
IV/0
!#D
IV/0
!#D
IV/0
!#D
IV/0
!#D
IV/0
!#D
IV/0
!#D
IV/0
!#D
IV/0
!#D
IV/0
!#D
IV/0
!#D
IV/0
!#D
IV/0
!#D
IV/0
!#D
IV/0
!#D
IV/0
!#D
IV/0
!
17
. R
es.
Mo
rtg
ag
e C
om
mitm
en
ts-V
alu
e o
f N
ew
Co
nst.
& R
eh
ab
. (B
$M
illio
ns)
7.8
224.5
516.9
88
.37
.82
0.0
0
%
change;
ove
r pre
vious
qtr
.-5
.88%
-100.0
0%
213.8
%#D
IV/0
!-3
0.8
%#D
IV/0
!-5
1.0
%#D
IV/0
!#D
IV/0
!-1
00.0
0%
* I
ncl
ud
es N
et L
end
ing
to
Pu
bli
c C
orp
ora
tio
ns
**
Deb
t fi
gu
res
incl
ud
e C
entr
al G
ov
ern
men
t o
nly
, u
nle
ss o
ther
wis
e in
dic
ated
p -
pro
vis
ion
al
NO
VD
EC
JU
NJ
UL
AU
GS
EP
OC
TJ
AN
FE
BM
AR
AP
RM
AY
(Over
pre
vio
us y
ear)
JA
NF
EB
MA
RA
PR
MA
YJ
UN
JU
LA
UG
SE
PO
CT
NO
VD
EC
Y
EA
R T
O D
AT
E
FIS
CA
L/R
EA
L S
EC
TO
R I
ND
ICA
TO
RS
(B$ M
ILL
ION
S)
(% c
hange r
epre
sents
curr
ent period fro
m p
revio
us p
eriod)
JU
L-S
EP
OC
T-D
EC
JA
N-M
AR
AP
R-J
UN
12