montenegro statistical office u brojkama... · sasko 3,6 1,4 7,8 ulcinj source: real estate...
TRANSCRIPT

MONTENEGROSTATISTICAL OFFICE
MONTENEGRO IN FIGURES2012
PODGORICA, 2012.
For publisher: Gordana Radojevic,MSc, DirectorPodgorica IV Proleterske 2Phone + 382 20 230-811E-mail: [email protected] Website: www.monstat.org
Editorial board: Bozidar Popovic, PhDJelena Zvizdojevic, MScBranka Susic-Radovanovic, MScErnad Kolic, MScBojana Radevic
Translation: Irena Mihailovic Design: Marko Mihailovic
Preparation for printing: Ilija MugosaPrinting: OBOD AD, CetinjePrint run: 200
All users should indicate the sourceWhen using data from this publication

CONTENTS
GEOGRAPHY .................................................................................................. 1
CLIMATE AND ENVIRONMENT ................................................................ 4
POPULATION ................................................................................................. 5
VITAL EVENTS ................................................................................................ 9
EMPLOYMENTS ..........................................................................................11
WAGES ...........................................................................................................13
GROSS DOMESTIC PRODUCTS ..............................................................14
HOSEHOLD CONSUMPTION EXPENDITURE .....................................18
PRICES ............................................................................................................20
AGRICULTURE..............................................................................................22
FORESTRY .....................................................................................................23
INDUSTRY .....................................................................................................24
DWELLINGS .................................................................................................26
EXTERNAL TRADE ......................................................................................27
TOURISM .......................................................................................................28
TRANSPORT, STORAGE AND COMMUNICATIONS ..........................29
EDUCATION .................................................................................................30
CULTURE AND INFORMATION ...............................................................31
HEALTH ..........................................................................................................32
PENSION INSURANCE ...............................................................................33
CRIME .............................................................................................................34
SymbOlS
No appearance -
Data not available …
Data is less than 0,5 from given measurement unit 0
Average Ø
Corrected data *
Preliminary data (p)
Incomplete or insufficiently checked data ( )


1
Montenegro in Figures 2012
Population of Montenegro 1st January 2011 620 029
Area of Montenegro, km² 13 812
Capital Podgorica
Metropolis Cetinje
Number of municipalities 21
Number of settlements 1 307
Population density by municipalities, Census 2011
GEOGRAPHY 1
Plav 27
Andrijevica
13
Podgorica 129
Ulcinj 78
Bar 70
Cetinje 18
Budva 153
Danilovgrad 37
Rožaje 53
Kolašin 9
Berene 47
Bijelo Polje 50
Pljevlja 23
Mojkovac 23Šavnik 4
Žabljak 8Plužine 4
HercegNovi 131
Kotor 67
Tivat 305 Population per km²
4-910-3738-7879-158159-305

2
Montenegro in Figures 2012
Geographical coordinates of the extreme points
Place MunicipalityNorth
geographical latitude
East geographical
longitude
North Mocevići Pljevlja ׳ 32 ˚43 ׳ 58 ˚18
South Ada Ulcinj ׳ 52 ˚41 ׳ 22 ˚19
East Jablanica Rozaje ׳ 53 ˚42 ׳ 21 ˚20
West Sutorina– Prijevor H. Novi ׳ 29 ˚42 ׳26 ˚18
land boundaries, km km
Total 614
With:
Croatia 14
Bosnia and Herzegovina 225
Serbia 203
Albania 172
Coastline, km 293,5
Source: Real Estate Directorate
Rivers length in km,total In montenegro
Tara 146,4 141
Lim 220,0 123
Cehotina 125,0 100
Moraca 99,5 99
Source: Real Estate Directorate
1 GEOGRAPHY

3
Montenegro in Figures 2012
Planinski vrhovi preko 2 400 m Height in m
Bobotov kuk ( Durmitor ) 2 522
Maja Rozit ( Prokletije ) 2 522
Kom Kucki (Komovi) 2 487
Kom Vasojevicki (Komovi) 2 460
Sljeme (Durmitor) 2 445
Hajla (Hajla) 2 403
lakes, area in km²
Natural Areain km²
Altitude in m
maximum depth in m municipality
Biogradsko 0,23 1 094 12,1 Kolasin
Plavsko 1,99 906 9,1 Plav
Skadarsko1) 369,7 6 44 Bar, Podgorica,Cetinje
Crno 0,52 1 418 49,1 Zabljak
Sasko 3,6 1,4 7,8 Ulcinj
Source: Real Estate Directorate 1) 147,9 km² belongs to Albania
National parks
Area in ha Altitude in m municipality
Durmitor 33 400 500 – 2 525Zabljak, Mojkovac, Plužine, Savnik, Pljevlja
Lovcen 6 220 939 – 1 749 Cetinje
Biogradska Gora 5 650 832 – 2 139 Andrijevica, Berane,
Kolašin, Mojkovac
Skadarsko jezero 40 000 5 Podgorica, Bar, Cetinje
Prokletije 16 630 > 2 000 PlavSource: National parks of Montenegro web page: http://www.nparkovi.me
GEOGRAPHY 11 GEOGRAPHY

4
Montenegro in Figures 2012
CLIMATE, 2011
Weather stations
Annual average
temperature, Cº
Average amount of
precipitationl/m2
Number of days
with rain≥ 0,1mm clearness
With wind
6 i 7 bof.
Podgorica 17,0 896,9 92 112 132
Bar 17,2 758,0 90 153 -
Herceg Novi 16,9 1 148,6 95 155 86
Pljevlja 8,7 783,4 133 55 56
Kolasin 8,1 1 263,3 142 70 123
Niksic 12,1 1 130,7 100 104 -
Source: Hidro-meteorological Institute of the Republic of Montenegro
Factors influencing environment 2010 2011
1 Used water quantities in industry (thous.m3) 2 971 438 3 199 011
From own water supply system 2 970 344 3 197 835
From public water supply system 1 094 1 176
2. Water discharge( thous. m3 ) 15 369 15 798
Purified quantities wastewater 1 592 1 522
Non-purified quantities wastewater 13 777 14 276
2 CLIMATE ANd ENvIRONMENT

5
Montenegro in Figures 2012
POPULATION 32 CLIMATE ANd ENvIRONMENT
POPULATIONPopulation by age group and sex, Census 2011
25,000 15,000 5,000 5,000 15,000 25,000
0-4
5-9
10-14
15-19
20-24
25-29
30-34
35-39
40-44
45-49
50-54
55-59
60-64
65-69
70-74
75-79
80-84
85+
female
male

6
Montenegro in Figures 2012
3 POPULATION
Population by age group, Censuses
0
20
40
60
80
100
120
1953 1961 1981 2003 2011
male, %
65+
15-64
0-14
0
20
40
60
80
100
120
1953 1961 1981 2003 2011
female, %
65+
15-64
0-14

7
Montenegro in Figures 2012
POPULATION 33 POPULATION
The most frequen names, Census 2011.
Rang Female name Male name
1 Jelena Nikola
2 Milica Marko
3 Marija Dragan
4 Ivana Milos
5 Milena Zoran
6 Ana Milan
7 Dragana Aleksandar
8 Radmila Ivan
9 Vesna Petar
10 Ljiljana Luka
Population aged 15 and over by marital status,
Census 2011.
female male
60000 40000 20000 0
žene
Never married MarriedDivorced widowed
0 20000 40000 60000
15-19
20-29
30-39
40-49
50-59
60-69
70-79
80+
muškarci
Never married Married
Divorced Widowed

8
Montenegro in Figures 2012
3 STANOvNIŠTvO
Census 1971 1981 1991 2003 2011
Average age of population
Male 27,4 29,6 31,4 34,8 36,0
Female 29,8 32,0 33,7 37,0 38,4
Index of aging
Male 22,2 23,4 31,8 49,7 58,6
Female 29,6 34,0 44,8 67,8 81,7
Coeficient of Age
Male 10,0 9,1 11,0 14,9 16,2
Female 12,0 12,2 14,6 18,4 20,4
Ethnic structure, Census 2011.
Religion structure, Census 2011.
45%
29%
9%
5%
3%
5%
4%
Montenegrins
Serbs
Bosniaks
Albanians
Muslims
Does not want to declare
Other
72%19%
3%1%
3%2%
OrthodoxIslam
CatholicsAtheist
Does not want to declareOther religions

9
Montenegro in Figures 2012
vITAL STATISTICS 43 STANOvNIŠTvO
Natural movements of population 2008 2009 2010 2011
Population 616 969 618 294 619 428 620 556
Births
Lifebirths 8 258 8 642 7 418 7 215
Stillbirths 34 43 ... ...
Deaths
Total 5 708 5 862 5 633 5 847
Infants 62 49 50 32
Natural increase 2 550 2 780 1 785 1 368
Marriages and divorces
Divorces 460 456 520 471
Marriages 3 445 3 829 3 676 3528
Rate of natural movments of population 2008 2009 2010 2011
Rate on 1 000 inhabitans
Lifebirths 13,4 14,0 12,0 11,6
Deaths 9,3 9,5 9,1 9,4
Natural increase 4,1 4,5 2,9 2,2
Marriage 5,6 6,2 5,9 5,7
Divorces 0,7 0,7 0,8 0,7

10
Montenegro in Figures 2012
Lifebirths and deaths, 1951 - 2011
4 vITAL STATISTICS
-1,0001,0003,0005,0007,0009,000
11,00013,00015,000
1951
1954
1957
1960
1963
1966
1969
1972
1975
1978
1981
1984
1987
1990
1993
1996
1999
2002
2005
2008
2011
lifebirths deaths

11
Montenegro in Figures 2012
Labour force and activity rate, 2011
monte-negro
Costal region
Central region NorthernregionTotal there of
Podgorica
in thousandsActive population 244,1 59,0 129,1 86,1 55,9
Men 136,1 32,3 69,8 45,5 34,0
Women 108,0 26,7 59,3 40,6 22,0
%
Activity rate 48,7 48,3 54,6 58,2 39,3
Employment rate 39,1 42,8 44,9 49,8 26,4
Unemployment rate 19,7 11,4 17,9 14,4 32,7
in thousands
Employed 196,0 52,3 106,1 73,7 37,6
Men 109,6 28,2 57,4 38,8 24,0
Women 86,4 24,1 48,7 34,9 13,6
%
Men (employment rate) 44,8 48,0 50,1 54,7 33,7
Women(employment rate) 33,7 38,0 39,9 45,3 19,1
in thousands
Unemployed 48,1 6,7 23,1 12,4 18,3
Men 26,5 (4,1) 12,4 (6,7) 9,9
Women 21,6 2,6 10,6 5,7 8,4
%
Men (unemployment rate) 19,5 12,7 17,8 (14,7) 29,1
Women (unemployment rate) 20,0 9,7 17,9 14,0 38,2
Source: Labour force survey
EMPLOYMENTS 54 vITAL STATISTICS

12
Montenegro in Figures 2012
Unemployed persons by claim job duration and sex, montenegro 2010
in thousands % %WomenTotal Men Women Total Men Women
Total 51,3 27,8 23,5 100,0 100,0 100,0 45,7
Less than 1 month (1,6) 1,1 . (3,1) 3,8 . .
one to 5 months 4,8 2,5 (2,3) 9,3 9,0 (9,6) (47,3)
6 to 11 months 4,6 (2,4) 2,1 (8,9) (8,7) 9,1 47,0
12 to 23 months 7,1 4,3 (2,8) 13,8 15,3 (12,0) 39,8
2 years and longer 33,3 17,6 15,7 64,9 63,1 67,1 47,2
Source: Labour force survey
Unemployed persons by claim job duration and sex, montenegro 2011
in thousands % %WomenTotal Men Women Total Men Women
Ukupno 48,1 26,5 21,6 100,0 100,0 100,0 44,9
Less than 1 month . . . . . . .
one to 5 months 5,0 3,3 (1,6) 10,4 12,6 (7,6) (33,1)
6 to 11 months 3,9 2,0 (1,8) 8,1 7,7 (8,6) 47,6
12 to 23 months 6,4 3,5 2,9 13,3 13,1 13,6 45,7
2 years and longer 31,9 17,0 14,9 66,3 64,1 69,1 46,7
Source: Labour force survey
5 EMPLOYMENTS

13
Montenegro in Figures 2012
Wages and wages without taxes and contributions, in EUR
Ø 2009 Ø 2010 Ø 2011
Wages 643 715 722
Wages without taxes and constributions
463 479 484
Wages without taxes and constributions
WAGES 65 EMPLOYMENTS
643715 722
463 479 484
Ø 2009 Ø 2010 Ø 2011
Wages Wages without taxes and constributions

14
Montenegro in Figures 2012
Indicators of GdP 2010 2011
Gross domestic product, current prices (in mil. EUR) 3 104 3 234
Gross domestic product, constant prices (in mil. EUR) … 3 204
Gross domestic product per capita (in EUR) 5 011 5 211
Real growth rate of GDP-a, (%) … 3,2
Nominal growth rate of GDP-a, (%) 4,1 4,2
Deflator ( %) … 0,9
Gross value added at current prices, 2010 - 2011
in thous EUR
Nace Rev.2Gross value
added
2010 2011
Agriculture, forestry and fishing 239 495 256 726
Mining and quarrying 37 702 35 725
Manufacturing 144 512 162 535
Electricity, gas, steam and air conditioning supply 143 115 103 148
Water supply; sewerage, waste management and remediation activities 56 721 67 229
Construction 151 904 158 080
Wholesale and retail trade; repair of motor vehicles and motorcycles 348 770 391 686
Transportation and storage 144 915 150 880
Accommodation and food service activities 154 425 161 170
Information and communication 176 614 164 957
Financial and insurance activities 124 515 131 839
Real estate activities 183 605 219 875
7 GROSS dOMESTIC PROdUCT

15
Montenegro in Figures 2012
/extension/
Administrative and support service activities 72 737 88 175
Administrativne i pomoćne djelatnosti 25 059 26 755
Public administration and defence, compulsory social security 255 073 255 517
Education 138 877 139 271
Human health and social work activities 135 589 131 653
Arts, entertainment and recreation 39 710 39 810
Other service activities 13 899 19 637
Activities of households as employers; undifferentiated goods and services producing activities of households for own use
... ...
Activities of extraterritorial organisations and bodies ... ...
Total Gross Value Added 2 587 237 2 704 668Taxes on products less subsidies on products 516 618 529 392
GROSS DOmESTIC PRODUCT 3 103 855 3 234 060
Gross domestic product by type of expenditure at current prices, 2010 – 2011
Expenditure categories Value (in thous. EUR)2010 2011
Final consumption 3 277 932 3 443 141
Personal household consumption 2 550 717 2 728 471
Government consumption 727 215 714 670
Individual 334 317 326 048
collective 392 898 388 622
Gross fixed capital formation 655 139 596 453
Change in inventories 52 333 35 265Balance of import and export of goods and services -881 549 - 840 799
Export of goods and services 1 077 391 1 299 326
export of goods 330 367 454 381
export of services 747 024 844 945
Import of goods and services 1 958 940 2 140 125
import of goods 1 657 329 1 823 337
Import of services 301 611 316 788
GROSS DOmESTIC PRODUCT 3 103 855 3 234 060
GROSS dOMESTIC PROdUCT 77 GROSS dOMESTIC PROdUCT

16
Montenegro in Figures 2012
Structure of GdP by activities at current prices, 2010 – 2011 (%)
Nace Rev.2 2010 2011
Agriculture, forestry and fishing 7,7 7,9
Wholesale and retail trade 11,2 12,1
Accommodation and food service activities 5,0 5,0
Information and communication 5,7 5,1
Real estate activities 5,9 6,8
Public administration and defence, compulsory social security 8,2 7,9
Other 56,3 55,2
7 GROSS dOMESTIC PROdUCT
7,7
11,2
5,0
5,7
5,9
8,2
56,3
7,9
12,1
5,0
5,1
6,8
7,9
55,2
Agriculture, forestry and fishing
Wholesale and retail trade
Accommodation and food serviceactivities
Information and communication
Real estate activities
Public administration and defence,compulsory social security
Other
2011
2010

17
Montenegro in Figures 2012
7 GROSS dOMESTIC PROdUCT GROSS dOMESTIC PROdUCT 7
106.5
18.4
1.1-26.0
105.6
21.1
1.7-28.4
Final consumptionexpenditure
Gross fixed capitalformation (GFCF )
Changes ininventories
Net export / import
2011 2010
Structure of GdP by tipe of expenditure at current prices, 2010-2011
Expenditure categoriesGDP structure (%)
2010 2011
Final consumption expenditure 105,6 106,5
Households final consumption expenditure (HFCE) 82,2 84,4
Government final consumption expenditure (GFCF) 23,4 22,1
Gross fixed capital formation (GFCF) 21,1 18,4
Ghanges in inventories 1,7 1,1
Net export / import -28,4 -26,0
Export of goods and services 34,7 40,2
Import of goods and services 63,1 66,2

18
Montenegro in Figures 2012
Household budget Survey
2010 2011
Number of surveyed households 1 250 1 287
Estimated number of households 183 162 183 330
Estimated population 621 848 623 520
Average number of membres 3,4 3,4
Available assets - Ø per household (monthly average in EUR)
2010 2011
monte-negro Structure monte-
negro Structure
Wages and salaries 347 58,9 328 54,2
Incomes from pensions 165 28,0 180 29,8
Incomes from social insurance 7 1,3 8 1,3
Incomes from agriculture 28 4,8 33 5,5
Incomes from small business 9 1,5 19 3,1
Other incomes 32 5,5 38 6,1
Wges in kind 0 0,0 0 0,0
Donations in cash and in kind - - - -
TOTAl 588 100,0 606 100,0
8 HOUSEHOLd CONSUMPTION EXPENdITURE

19
Montenegro in Figures 2012
HOUSEHOLd CONSUMPTION EXPENdITURE 8
Used assets Ø per household (monthly average in EUR)
2010 2011
montenegro Structure montenegro Structure
Food 191 33,8 187 33,6
Alcoholic beverages and tobacco 18 3,3 20 3,6
Footwear and clothes 42 7,4 39 7,0
Dwelling 81 14,4 79 14,1
Furniture 22 3,9 26 4,6
Health 19 3,3 21 3,8
Transport 49 8,7 56 10,0
Communication 29 5,1 31 5,6
Recreation and culture 21 3,7 18 3,2
Education 10 1,8 9 1,5
Restaurants 13 2,3 13 2,3
Other goods and services 28 4,9 27 4,8
Self-production 41 7,3 32 5,8
TOTAl 564 100,0 557 100,0
8 HOUSEHOLd CONSUMPTION EXPENdITURE
33.6%3.6%
7.0%
14.1%4.6%3.8%
10.0%5.6%
3.2%1.5%
2.3%4.8%
5.8%
FoodAlcoholic beverages and…
Footwear and clothesDwellingFurniture
HealthTransport
CommunicationRecreation and culture
EducationRestaurants
Other goods and servicesSelf-production

20
Montenegro in Figures 2012
Average annual prices of some products
Name of product Quantity 2010 2011
Butter kg. 7,46 8,56
Milk litar 0,63 0,62
Milk in pack litar 0,93 0,93
Domestic cheese kg. 4,80 4,60
Trappist cheese kg. 6,90 7,43
Chicken eggs 10 kom 0,14 0,13
Pork meat kg. 5,11 5,04
Beef meat kg. 6,50 6,65
Potato kg. 0,55 0,64
Wheat flour kg. 0,63 0,71
White bread kg. 0,95 1,06
Sugar kg. 0,68 0,91
Coffee kg. 5,52 6,37
Grape brendy litar 10,01 10,36
Beer litar 0,87 0,96
Cigarettes of B quality 20 kom 0,56 0,80
Oil litar 1,17 1,46
9 PRICES

21
Montenegro in Figures 2012
PRICES 9
Changes of price index compared to the previous year
2010 2011
Consumer Price Index (CPI) 100,7 102,8
Food and non-alcoholic beverages 102,0 100,5
Alcoholic beverages, tobacco 99,0 126,3
Clothing and footwear 100,3 98,2
Housing, water, electricity, gas and other fuels 92,5 102,2
Furnishings, household equipment and routine maintenance of the house 101,0 99,1
Health 105,0 115,0
Transport 106,0 107,7
Communication 100,0 101,1
Recreation and culture 97,8 96,1
Education 100,1 99,4
Restaurants and hotels 102,1 103,0
Miscellaneous goods and services 100,7 103,1
Producer industrial products index 100,4 101,0
Mining and quarrying 84,7 102,1
Manufacturing industry 105,3 102,2
Production of electrity 91,4 97,4
9 PRICES

22
Montenegro in Figures 2012
Number of agricultural holdings, Census of Agriculture 2010
Number of agricultural holdings
Total agricultural holdings 48 870
Family agricultural holdings 48 824
Business entities 46
Utilised agricultural land, ha – Census of Agriculture 2010
Total Family
agricultural holdings
business entities
Kitchen gardens and/or gardens 2 412,8 2 412,8 -
Arable land 4 048,3 3 656,4 391,9Vineyards 2 535,7 340,4 2 195,3Orchards 1 529,2 1 393,6 135,6Nusereries 589,6 561,8 27,8Perennial meadows and pastures 210 182,0 204 359,4 5 822,6
Total agricultural utilised land 221 297,6 212 724,4 8 573,2
Number of livestock, Census of Agriculture 2010
TotalFamily
agricultural holdings
Family agricultural
holdings
Bovine 80 209 78 633 1 576Sheep 229 037 226 752 2 285Goats 35 756 35 001 755Pigs 47 673 41 118 6 555Poultry 620 802 411 086 209 716Horses, donkey, mules 4 397 4 397 -
10 AGRYCULTURE
23
Montenegro in Figures 2012
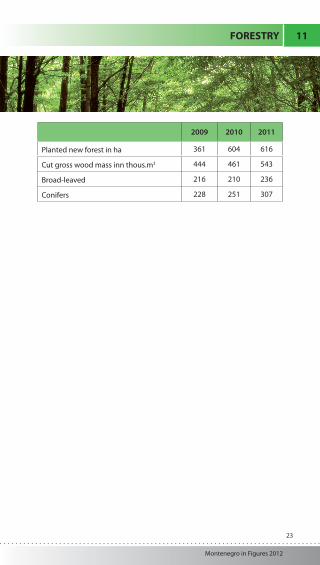
2009 2010 2011
Planted new forest in ha 361 604 616
Cut gross wood mass inn thous.m3 444 461 543
Broad-leaved 216 210 236
Conifers 228 251 307
FORESTRY 11

24
Montenegro in Figures 2012
Indices of industrial production, previous year = 100 2009 2010 2011
INDUSTRy TOTAl 67,8 117,5 89,8
Mining and quarrying 34,5 158,7 106,5
Mining of coal and lignite 57,0 196,1 101,3
Mining of metal ores 6,8 133,7 259,1
Other mining and quarrying 52,1 101,4 73,4
Manufacturing 61,3 97,1 106,9
Manufacture of food products 90,3 89,7 95,6
Manufacture of beverages 85,3 94,2 101,5
Manufacture of tobacco products 89,5 70,6 131,5
Manufacture of wearing apparel 13,7 87,8 117,4Manufacture of wood and of products of wood and cork 65,7 104,5 135,4
Manufacture of paper and paper products 92,7 103,3 78,1
Printing and reproduction of recorded media 93,0 99,4 107,3
Manufacture of chemical and chemical products 70,2 52,1 83,4
Manufacture of basic pharmaceutical products 149,0 111,9 76,4
Manufacture of rubber and plastic products 57,6 59,6 103,3Manufacture of other non-metallic mineral products 58,0 131,2 109,4
Manufacture of basic metals 46,0 86,0 113,1
Manufacture of fabricated metal products 57,1 72,7 200,4
Manufacture of machinery and equipment 109,1 153,0 126,4
Manufacture of furniture 51,4 77,0 48,9Repair and installation of machinery and equipment 88,0 79,7 110,2
Electricity, gas, steam and air cond. supply 97,6 151,1 67,3Electricity, gas, steam and air conditioning supply 97,6 151,1 67,3
12 INdUSTRIJA

25
Montenegro in Figures 2012
INdUSTRIJA 12
Production and use of electrical energy
PRODUCTION 2009 2010 2011
Bruto 2 760 4 689 3 307
Net 2 679 4 022 2 656
Received from other countries 1 184 1 204 1 240
Import 1 151 732 1 383
Used 3 017 3 211 3 414
Delivered to other republic 1 108 1 451 630
Losses 717 667 651
Export 172 483 431
12 INdUSTRIJA

26
Montenegro in Figures 2012
Dwellings 2009 2010 2011
Dwellings 227 803 231 883* 236 206
Area, m² 15 070 086 15 352 028* 15 716 507
Average area per dwelling, m² 66,2 66,2 66,5
Price in EUR of new-bulit dwellings per 1m² for montenegro and selected cities
2009 2010 2011
Montenegro 1 250 1 272 1 307
Podgorica 1 168 1 137 1 118
Bar 1 516 1 479 1 735
Budva 1 334 1 714 1 702
Niksic 802 752 757
Other 1 537 1 296 1 255
13 CONSTRUCTION

27
Montenegro in Figures 2012
13 CONSTRUCTION
Countries with the higest turnover from external trade in montenegro
ImPORT 2010 2011
in mil. EUR u % in mil. EUR u %
TOTAL 1 657,33 100,00 1 823,34 100,00
Serbia 432,63 26,10 541,46 29,70
Germany 117,12 7,07 110,81 6,08
Italy 99,12 5,98 117,52 6,45
Greece 115,32 6,96 144,70 7,94
China 88,86 5,36 103,08 5,65
Bosnia and Herzegovina 123,52 7,45 142,51 7,82
Switzerland 17,33 1,05 19,77 1,08
Croatia 80,15 4,84 92,78 5,09
Slovenia 60,24 3,63 81,08 4,45
Austria 49,53 2,99 41,41 2,27
France 26,90 1,62 31,62 1,73
EXPORT 2010 2011
in mil. EUR u % in mil. EUR u %
TOTAL 330,37 100,00 454,38 100,00
Italy 48,83 14,78 31,06 6,84
Srbia 74,93 22,68 79,82 17,57
Greece 56,39 17,07 39,29 8,65
Slovenia 20,57 6,23 30,29 6,67
Bosnia and Herzegovina 24,11 7,30 22,41 4,93
Kosovo 18,11 5,48 23,69 5,21
Germany 3,12 0,95 20,51 4,51
Hungary 28,96 8,77 76,86 16,92
Albanija 8,24 2,50 10,36 2,28
Croatia 4,04 1,22 45,89 10,10
Czech Republic 5,13 1,55 5,57 1,23
EXTERNALL TRAdE 14

28
Montenegro in Figures 2012
domestic tourism—nights 2009 2010 2011
Montenegro — total 7 552 006 7 964 893 8 775 171Domestic tourism 856 332 987 033 956 368International tourism - nights
TOTAL 6 695 674 6 977 860 7 818 803Albania 192 145 189 071 162 323Bosnia and Herzegovina 778 455 731 638 750 341Italy 225 976 199 620 143 938Germany 109 893 151 843 182 724Republic of Macedonia 154 530 163 963 144 084Russian Federation 1 060 510 1 217 967 1 791 616Slovakia 61 841 52 353 71 168Slovenia 84 578 106 019 79 738France 193 983 233 959 152 395Serbia 2 298 720 2 097 030 2 165 529Czech Republic 171 643 165 054 171 107USA 22 645 33 825 45 286Other countries 1 340 755 1 635 518 1 958 554
domestic tourism - arrivals 2009 2010 2011
Montenegro - total 1 207 694 1 262 985 1 373 454Domestic tourism 163 680 175 191 172 355International tourism - arrivalsTotal 1 044 014 1 087 794 1 201 099Albania 39 263 37 598 27 388Bosnia and Herzegovima 101 882 103 030 97 497Italy 42 549 39 992 34 403Germany 18 329 25 379 33 427Republic of Macedonia 19 911 24 419 22 605Russian Federation 145 559 150 187 244 924Slovakia 8 908 7 699 10 729Slovenia 18 891 22 475 18 550Serbia 338 894 314 819 301 094France 33 080 42 099 28 336Czech Republic 25 928 24 087 24 702USA 6 698 8 772 10 574Other countries 244 122 287 238 346 870
15 TURISM

29
Montenegro in Figures 2012
15 TURISM
length of categorized roads in km 2009 2010 2011
Length of categorized roads total 7 624 7 763 7 835Modern roads 5 097 5 365 5 436Gravel 1 797 1 684 1 680Earth road 730 714 719
length of railroads 2009 2010 2011Effective length of tracks,km 250 250 250Number of stations 47 47 47
Passenger transport, thousands 2009 2010 2011Road transport 5 536 6 209 6 240Local transport 544 590 728Railway transport 852 755 692Air transport 956 1 205 1 259
Transport of goods 2009 2010 2011Road transport ( in 000 tons ) 1 724 1 839 1 247Railway transport ( in 000 tons ) 854 1 213 1 050Air transport ( in tons ) 1 477 2 159 1 074
Cars 2009 2010 2011Passenger cars total 178 919 164 653 171 973per 1000 inhabitants 283 266 277
Traffic accidents 2009 2010 2011Traffic accidents with dead and injured persons 1 683 1 494 1 425
with dead persons 52 54 52with injured persons 1 631 1 440 1 373
Telephone services 2009 2010 2011
Subscribers of stationary telephony 166 805 167 720 170 856
per 1000 inhabitants 265 271 275
Subscribers of mobile telephony 1 573 151 1 393 297 1 159 112
per 1000 inhabitants 2 491 2 252 1 868
TRANSPORT, STORAGE ANd COMMUNICATIONS 16

30
Montenegro in Figures 2012
2010/2011 2011/2012
PRIMARY EdUCATION
number of school 1) 437 432
NUMBER OF PUPILS 72 993 69 461
girls 34 990 33 433
boys 38 003 36 028
NUMBER OF TEACHERS 4 950 5 048
Women 3 566 3 729
Men 1 384 1 319
SECONDARY EDUCATION
number of school 49 49
NUMBER OF SCHOOLBOY 31 643 31 914
girls 15 626 15 633
boys 16 017 16 281
NUMBER OF TEACHERS 2 366 2 396
Women 1 407 1 486
Men 959 910
UNIVERSITY EDUCATION
INROLED STUDENTS NUMBER
Basic studies 22 163 22 227Women 11 748 11 956
Men 10 415 10 271
Postgraduate studies 2 941 2 995Women 1 788 1 844
Men 1 153 1 151
PhD Studies 65 91Women 32 48
Men 33 43
NUMBER OF TEACHERS 1 531 1 547
Women 720 742
Men 811 805
1) Number of school included: forhtgrade, eightgrade and i ninegrade schools
17 EdUCATION

31
Montenegro in Figures 2012
17 EdUCATION
2009 2010 2011TheatresProfessional theatres 7 7 7
number of performances 198 260 222visitors in thousands 43 57 43
Childre’s theatres 2 2 2number of plays 263 287 208visitors in thousands 49 53 34
Amateur theatres 1 1 1number of plays 26 34 30visitors in thousands 35 39 5
Radio and televisionradio stations 49 40 40television stations 22 20 19
Cinemas 9 9 8number of performances 694 10 563 7 951visitors in thousands 242 256 158
MUSEUMSNumber 24 - -Visitors in thousands 169 - -
ARCHIVESNumber - - 1Visitors - - 3 000
LIBRARIESNumber - 15 -Audience in thousands - 40 -
PUBLICATIONNewspapers 86 76 89Magazines 129 99 106Books and brochures 1 328 1 104 1 097
Museums, libraries and archives are three-year surveys.
CULTURE ANd INFORMATION 18

32
Montenegro in Figures 2012
2010 2011
Doctors-total 1 276 1 297
Specialists 959 999
Dentists 30 29
Pharmacist 91 92
Number of Doctors per 10 000 inhabitants 20,4 20,9
Number of Dentists per 10 000 inhabitants 0,5 0,5
Number of Pharmacists per 10 000 inhabitants 1,5 1,5
Hospital beds 3 951 3 951
Number of hospital beds per 10 000 inhabitants 63,2 63,7
Dismissed patients 95 191 97 569
Data also include ihe Institute “DR Simo Milošević”, IgaloSource: Institute for Public Health of Montenegro
19 HEALTH

33
Montenegro in Figures 2012
19 HEALTH
Pensioners1) 2010 2011
Total 99 196 103 439
Old-age pensions 46 889 51 204
Disability pensions 24 104 23 866
Family pensions 28 203 28 369
Ratio of pensioners in total population, % 15,9 16,7
1) Source: Fund of Pension and Disability Insurance of the Republic of Montenegro
PENSION INSURANSE 20

34
Montenegro in Figures 2012
Convicted adults and minors by crime
2010 2011
Homicides 32 58
Rape 8 5
Stealing 744 675
Burglary 32 36
Stealing the vehicles 19 17
Fraud 93 86
Falsification 29 74
Public transport safety 543 386
Other criminal acts 2 414 2 156
Total 3 914 3 493
21 CRIME