monsoon regimes in the ccsm3 - cesm€¦ · monsoon regimes in the ccsm3 ... broad northward shift...
TRANSCRIPT
J. Climate CCSM3 special issue
Monsoon regimes in the CCSM3 Gerald A Meehl1, Julie M. Arblaster1, David M. Lawrence1 , Anji Seth2, Edwin K. Schneider3, Ben P. Kirtman3,4, and Dughong Min3 1. National Center for Atmospheric Research PO Box 3000 Boulder CO 80307
2. International Research Institute for Climate Prediction, Palisades, NY 3. Center for Ocean Land Atmosphere Studies, Calverton, MD 4. George Mason University, Fairfax, VA
Corresponding author email: [email protected] Fax: 303-497-1333 December 30, 2004
1
Abstract: Simulations of regional monsoon regimes, including the Indian, Australian,
West African, South American and North American monsoons, are described for the T85
version of CCSM3, and compared to observations and AMIP-type SST-forced
simulations with CAM3 at T42 and T85. There are notable improvements in the regional
aspects of the precipitation simulations in going to the higher resolution T85 compared to
T42 where topography is important (i.e., Ethiopian Highlands, South American Andes,
Tibetan Plateau). For the T85 coupled version of CCSM3, systematic SST errors are
associated with regional precipitation errors in the monsoon regimes of South America
and West Africa, though some aspects of the monsoon simulations, particularly in Asia,
improve in the coupled model compared to the SST-forced simulations. There is very
little realistic intraseasonal monsoon variability in the CCSM3 consistent with earlier
versions of the model. Teleconnections to the tropical Pacific are well-simulated for the
south Asian monsoon.
2
1. Introduction
Most recent climate model simulations of monsoon regimes usually include the relevant
regional precipitation features, in addition to aspects of interannual variability and
teleconnections (e.g. Chandrasekar and Kitoh, 1998; Meehl and Arblaster, 1998; Lau
and Bua, 1998; Soman and Slingo, 1997, Ju and Slingo, 1995; Yang et al., 1996;
Loschnigg et al., 2003; Arritt et al., 2000 ; Cavalcanti et al., 2002; Marengo et al., 2003;
Taylor and Clark, 2001; Douville et al., 2001, Céron and Guérémy, 1999 ). However,
shortcomings remain in most climate model simulations of monsoon regimes (Gadgil and
Sajani, 1998; Kang et al., 2002).
The purpose of this paper is to document aspects of regional monsoon regimes in the
CCSM3. At a horizontal resolution of T85, this global coupled ocean-atmosphere model
is compared with the atmosphere alone (uncoupled) model forced with observed sea
surface temperatures (SSTs) to examine the influence of coupling on the regional
monsoons. A comparison of the T85 and T42 atmosphere only model demonstrates the
influence of improved resolution on the monsoon simulations.
Section 2 provides a description of the model and the experiments. The South Asian
monsoon mean features are depicted in Section 3, while Section 4 addresses intraseasonal
South Asian monsoon variability, and Section 5 takes a look at interannual
3
teleconnections to the Pacific. Section 6 describes the simulation of the Australian
monsoon, Section 7 the West African monsoon, Section 8 the North American monsoon,
and Section 9 the South American monsoon. Section 10 follows with conclusions.
2. Model description and experiments
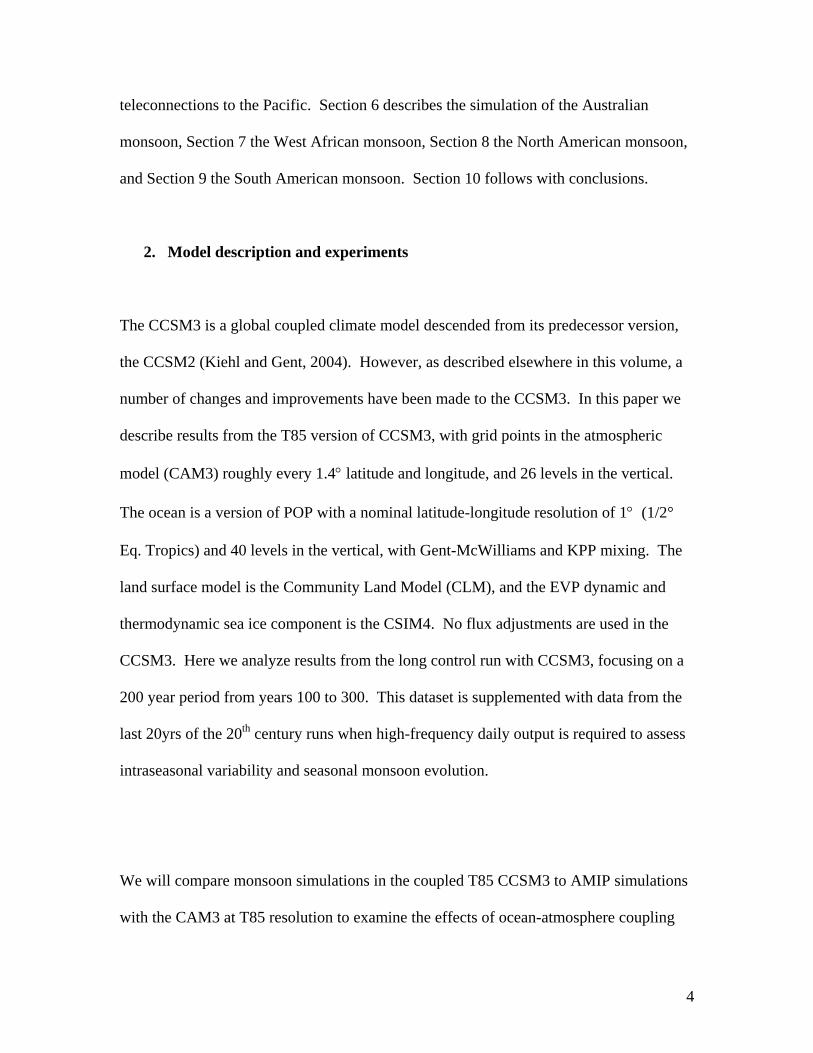
The CCSM3 is a global coupled climate model descended from its predecessor version,
the CCSM2 (Kiehl and Gent, 2004). However, as described elsewhere in this volume, a
number of changes and improvements have been made to the CCSM3. In this paper we
describe results from the T85 version of CCSM3, with grid points in the atmospheric
model (CAM3) roughly every 1.4° latitude and longitude, and 26 levels in the vertical.
The ocean is a version of POP with a nominal latitude-longitude resolution of 1° (1/2°
Eq. Tropics) and 40 levels in the vertical, with Gent-McWilliams and KPP mixing. The
land surface model is the Community Land Model (CLM), and the EVP dynamic and
thermodynamic sea ice component is the CSIM4. No flux adjustments are used in the
CCSM3. Here we analyze results from the long control run with CCSM3, focusing on a
200 year period from years 100 to 300. This dataset is supplemented with data from the
last 20yrs of the 20th century runs when high-frequency daily output is required to assess
intraseasonal variability and seasonal monsoon evolution.
We will compare monsoon simulations in the coupled T85 CCSM3 to AMIP simulations
with the CAM3 at T85 resolution to examine the effects of ocean-atmosphere coupling
4
on the monsoon regimes, and also with the AMIP T42 resolution model (gridpoints
roughly every 2.8°) to document the changes in monsoon simulations with the increase in
resolution.
Observed data used in comparing to the model simulations include 850 hPa winds from
the NCEP-NCAR reanalyses and gridded CMAP precipitation from Xie-Arkin (1996),
both for the period 1979-2000 to be consistent with the duration of the AMIP
simulations.
3. South Asian monsoon
Fig. 1 shows the observed climatological seasonal mean precipitation and 850 hPa winds
for the south Asian monsoon (Fig. 1a) compared to the CAM3 T42, CAM3 T85 and the
T85 CCSM3. The major features, such as the Somali Jet and strong cross-equatorial flow
in the western Indian Ocean, the southern ITCZ, and a precipitation maximum over Bay
of Bengal extending north over India and across Southeast Asia, are represented in all the
model versions. However, the details of the regional simulations are model dependent.
In particular, the CAM3 at both T42 and T85 simulates excessive precipitation in the
eastern Arabian Sea, and a Bay of Bengal precipitation maximum that is shifted to the
west of the observed maximum. The southern ITCZ precipitation maximum near 5S is
present in both the T42 and T85 versions, but is about 30% too strong. The CAM3
versions at both T42 and T85 also simulate excessive precipitation over the Arabian
Peninsula. Additionally, the precipitation maximum in the South China Sea is not well-
simulated at either T42 or T85 in the CAM3 runs.
5
Comparing the T42 and T85 CAM3 simulations, the rain maximum over the Western
Ghats is better-represented at T85, as is the rain shadow in their lee and the precipitation
minimum over Sri Lanka. This is a direct consequence of the higher resolution at T85
being better able to resolve the Western Ghats and their associated effects on circulation
(e.g. Xie et al., 2005). The excessive precipitation over China near 30-35N is also
reduced at T85 due to the better resolved topography of the Tibetan Plateau. The
anomalous precipitation over the Arabian Peninsula is also somewhat reduced (but still
present) at T85 compared to T42.
Comparing the T85 CAM3 simulation in Fig. 1c to the T85 CCSM3 in Fig. 1d, a number
of improvements are readily apparent. The anomalous precipitation over the Arabian
Peninsula in the CAM3 has now disappeared for the most part in CCSM3, and the
excessive precipitation over the Arabian Sea in CAM3 has also been greatly reduced in
CCSM3. As a partial consequence of this latter effect, the rain shadow in the lee of the
Western Ghats over southeastern India is much closer to observed in CCSM3, and the
Bay of Bengal rainfall maximum has shifted to the northeast in closer agreement with the
observations. Additionally, the CCSM3 now shows a precipitation maximum in the
South China Sea where none was apparent in the CAM3 simulations. Some of these
improvements occur directly a consequence of the thermodynamic air-sea coupling in the
Arabian Sea, Bay of Bengal, and South China Sea which is not present in the AMIP runs
(KrishnaKumar and Hoerling, 2004).
6

There are some features that are not well-simulated in CCSM3. For example, the
southern ITCZ near 5S is not well-represented in CCSM3 compared to observations,
though the T42 and T85 AMIP versions both overestimate precipitation in this region.
In CCSM3, a contributing factor to the reduction of precipitation there is the
anomalously cold SSTs there in the coupled model (see paper by Large and Danabasoglu
in this volume).
Time-latitude sections of the climatological annual cycle of precipitation in the South
Asian monsoon region (70o – 100o E) are shown in Fig. 2 for observations from CMAP
pentad data as well as the CAM3 T85 AMIP experiment and T85 CCSM3. While the
broad northward shift of convection from boreal winter to boreal summer is captured,
considerable systematic errors remain in both the SST-forced and fully coupled versions
of the model. Observations in Fig. 2a show a well-defined seasonal cycle that varies with
latitude, with the 6 mm day-1 contour crossing 10N in early June. The JJA precipitation
maximum resides near 15N, with a southern ITCZ near 5S at that time of year and the
northward extent of the 4 mm day-1 limited to near 30N. In the T85 CAM3 simulation,
the northward excursion of the 6 mm day-1 contour across 10N is about two months
early, and the northward extent of the 4 mm day-1 contour reaches too far north to nearly
40N. The precipitation maximum at 15N is at about the right latitude and exhibits
essentially the correct seasonal timing, but is too strong by about 20% due primarily to
overly heavy precipitation upstream of the Western Ghats. As was apparent in the
seasonal mean maps in Fig. 1, the southern ITCZ is also too strong by about 40% during
midsummer.
7
For the T85 CCSM3 coupled model, the northward progression of the monsoon rainfall is
better-simulated, with the 6 mm day-1 contour crossing 10N in May (still a month early
compared to observations but a month later than in CAM3). The maximum northward
extent of monsoon rainfall is close to observations near 30N. The mid-monsoon season
precipitation maximum near 15N is underestimated about 20% compared to observations
(as opposed to overestimated by 20% in CAM3). The southern ITCZ, well-simulated in
the cold weather months in the CCSM3, is not well-represented during the monsoon
season as noted in Fig. 1.
To illustrate the timescales of south Asian monsoon season rainfall, spectra for an area-
averaged precipitation index for the JJAS season from 5-40N, 60-100E (Meehl and
Arblaster, 2002) are shown in Fig. 3. For the relatively short time series shown for the
CMAP data in Fig. 3a, there is a peak between 2-3 years at the timescale of the
tropospheric biennial oscillation (TBO, Meehl, 1994). Meehl and Arblaster (2002)
showed that if monthly data are used to compute the spectra, a more significant TBO
peak appears for the observations during the 1979-1999 time period, though the relative
strength of the TBO and ENSO signatures in south Asian monsoon precipitation can vary
over time (Webster et al., 1998). For the CAM3 simulations at both T42 and T85, there
are TBO and ENSO maxima that range from about 2 to 4 years for T42 and 2 to 8 years
in T85. Though this is a short time series, the fact that the variance spectra are different
in going from T42 to T85 (both use the same SSTs to force the model) suggests that there
are resolution-dependent aspects of the timescales of monsoon precipitation variability.
8
A similar result was seen for resolution-dependence in climate sensitivity (see Kiehl et al.
in this volume).
For the T85 CCSM3 in Fig. 3d, the longer time series of 200 years provides a better
resolution of timescales and shows significant TBO maxima in the 2-3 year time scale, as
well as at ENSO timescales in the model of 3 to 6 years. There is also a significant multi-
decadal peak near 13-15 years that is likely associated with Indo-Pacific decadal
variability (Meehl and Hu, 2005).
4. South Asian monsoon intraseasonal variability
Intraseasonal variability of the south Asian monsoon is not well-simulated in CCSM3,
consistent with similar problems at this timescale in previous versions of the model (e.g.
Sperber et al., 2004). Wavenumber-frequency variance spectra from observed data
exhibit maxima at the 30-60 day Intraseasonal Oscillation (ISO) timescale with eastward
propagating zonal wavenumbers 1-3 for both outgoing longwave radiation (OLR) and
850 hPa winds (Fig. 4a and 4b, respectively). This timescale of variability is thought to
be the primary driver of observed active/break periods of the monsoon (Lawrence and
Webster, 2002). In the CCSM3, wavenumber-frequency variance spectra of precipitation
and 850 hPa wind fields do not exhibit any prominent peaks in the ISO timescale (Fig.
4c,d).
9

The absence of a reasonable ISO in the CCSM3 is not surprising. Analyses of the ISO in
previous versions of the model demonstrated that the Zhang and McFarlane convection
scheme generates intraseasonal variability amplitude much lower than observed. When
the default convection scheme is replaced with either the relaxed Arakawa-Schubert
convection scheme (Maloney and Hartmann, 2001) or a modified Tiedtke convection
scheme (Liu et al 2004), a more realistic ISO is simulated, though there are still
unresolved issues regarding how best to represent the mechanisms of ISO variability in
state-of-the-art convection schemes.
5. South Asian monsoon teleconnections
It has been well-established in observations that the south Asian monsoon is negatively
correlated with SSTs and precipitation in the tropical Pacific (e.g. Rasmusson and
Carpenter, 1983; Meehl, 1987). This relationship has been simulated in previous model
versions (e.g. Meehl and Arblaster, 1998) and several studies have indicated the
importance maintaining coupled feedbacks in order to reproduce this relationship (e.g.,
Kirtman and Shukla, 2000; Wu and Kirtman, 2003). The correlation in the T85 CCSM3
of the south Asian area-averaged precipitation index (defined above) with precipitation
(Fig. 5a) and surface temperature (Fig. 5b) shows that positive values of monsoon
precipitation are negatively correlated with SST and precipitation in the tropical Pacific.
Negative correlations in the equatorial western Pacific exceed –0.5 which is significant at
greater than the 5% level after taking into account autocorrelation effects.
10

Over the monsoon region, correlations with precipitation are positive as defined, with
negative correlations over the western Indian Ocean as is seen in observations such that
during a strong monsoon the winds over the Indian Ocean are stronger, there is greater
sensible and latent heat flux, and SSTs cool. The negative correlations in the tropical
Pacific are associated with an intensified Walker Circulation, stronger Pacific trade winds
and greater upwelling, all of which lead to anomalously cold tropical Pacific SSTs during
a strong monsoon. In the CCSM3 there is evidence of the beginning of the Indian Ocean
Dipole or Indian Ocean Zonal Mode (Webster et al., 1999; Saji et al., 1999) with negative
correlations in the western Indian Ocean, and opposite-sign correlations in the eastern
Indian Ocean. This is also considered to be an inherent part of the TBO (Meehl and
Arblaster, 2002; Loschnigg et al., 2003) that grows to maximum amplitude in November
(not shown).
It also has been documented in the observations of the TBO that a strong south Asian
monsoon tends to be followed by a strong Australian monsoon during the subsequent
DJF (termed DJF+1 here) as shown by Meehl (1987; 1997), Ogasawara et al. (1999), and
others. Fig. 5c shows the observed correlation between Indian monsoon rainfall and the
DJF+1 surface temperature. In Fig. 5c, the Indian Ocean Dipole of October-November
has given way to correlations of all negative sign, with negative sign correlations still
remaining in the tropical Pacific. The CCSM3 in Fig. 5d shows similar patterns, with
only the remains of the Indian Ocean Dipole (almost all the Indian Ocean with negative
values and only a small area of positive correlations just northwest of Australia). As in
the observations, negative correlations remain in the tropical Pacific.
11
6. The Australian monsoon
Fig. 6a shows the DJF climatological mean 850 hPa winds and precipitation for the
Australian monsoon. Comparing Fig. 6a to the three model simulations, all show
evidence of westerly winds extending across southern Indonesia and across northern
Australia in association with regional monsoon precipitation maxima. All three model
simulations show greater than observed precipitation off the northwest coast of Australia
and in the western Pacific warm pool north of Papua New Guinea. In association with
the over extensive equatorial Pacific cold tongue (see Large and Danabasoglu in this
issue), the western equatorial Pacific precipitation maximum in the T85 CCSM3 is
shifted west (Fig. 6d) compared to the other model versions. The T85 CCSM3 does
show some improvements over the other model versions, particularly in the reduction of
the excessive precipitation northwest of Australia, and in a better regional simulation of
the precipitation maximum in western Borneo.
7. The West African monsoon
The regional precipitation and 850 hPa wind vectors for the West African monsoon are
shown in Fig. 7 for the observations, the T42 and T85 AMIP runs, and the T85 CCSM3.
All the model versions reproduce the observed surface westerlies extending from the
tropical Atlantic across to central Africa between about 5-10N, with associated regional
monsoon precipitation maxima. The AMIP versions of CAM3 at T42 and T85 both
12
simulate the Atlantic ITCZ precipitation maximum that extends somewhat into west
Africa, though all the model versions simulate a precipitation maximum near 10-15N and
the Greenwich meridian that is not present in the observations. This is a product of the
northward-shifted extent of monsoon rainfall, and the formation of a stronger-than-
observed surface cyclonic circulation in that region. The regional rainfall maximum over
Nigeria tends to be shifted eastward into central Africa in all the model versions.
A typical shortcoming in simulations of African precipitation during the time of the west
African monsoon is the inability to reproduce the regional rainfall maximum over the
Ethiopian highlands in the eastern part of the continent. This is seen in Fig. 7b for the
T42 AMIP version. For both the T85 AMIP and T85 CCSM3, the rainfall maximum
extends much farther east than in the T42 version, thus indicating the better-resolved
topography at T85 contributes to an improved rainfall simulation in this region, though
the rainfall maximum still does not extend far enough east compared to observations.
Evidence of simulated warmer-than-observed SSTs in the Gulf of Guinea is shown in the
T85 CCSM3 with greater-than-observed rainfall occurring over the ocean (Fig. 7d). This
systematic error in model of not being able to adequately represent the Atlantic equatorial
cold tongue has been shown to have significant consequences due to its importance in
simulations of the West African monsoon (Okumura and Xie, 2004).
Time-latitude sections of the precipitation annual cycle in the West African monsoon
region (10o W – 20o E) are shown in Fig. 8. As with the Asian monsoon, the onset of
monsoonal convection over land occurs 1-2 months earlier than observed in both the
13
coupled and AMIP runs. The 10-day mean maps of the annual cycle show that as soon
as the northward moving ITCZ encounters the southern coast of West Africa in spring,
rainfall spreads rapidly northwards across the Sahel. By August, the convection has
extended about 5o latitude too far north into what should be the southern reaches of the
Saharan desert, thereby obscuring the sharp boundary between wet and dry conditions
seen in observations. In the CCSM3 run, as noted above, SST is too warm in the Gulf of
Guinea which generates anomalously heavy precipitation in May and June just north of
the equator.
As with the South Asian monsoon, observed features of West African monsoon
intraseasonal variability are not accurately simulated by the model. Synoptic-scale
African easterly waves (AEW) appear as a prominent 3--5 day period peak in variance
spectra of observed 850hPa meridional wind (Albignot and Reed, 1980). In CCSM3,
there is a spectral peak in the 850hPa meridional winds but it is at 5-9 day periods rather
than 3-5 day periods (not shown) and is not accompanied by a corresponding spectral
peak in precipitation, even near the Gulf of Guinea coast where observations suggest that
the link between AEWs and precipitation is strongest.
8. The North American monsoon
There has been some debate over the years as to whether the summertime precipitation
maximum over northern Mexico and the southwestern U.S. can be classified as
monsoonal, with studies performed to document the monsoon characteristics of that
14
region (e.g. Meehl, 1992; Douglas et al., 1993). More recent work has established the
North American monsoon as a regional monsoon regime with characteristics in common
with other monsoons around the globe (e.g. Adams et al., 1997; Higgins et al., 1999),
with adequate simulations in global coupled models (Arritt et al., 2000) and mesoscale
models (Xu et al., 2004).
For the CAM3 T42 and T85 mean seasonal simulations (JJA) compared to observations
in Fig. 9, both model simulations show low level inflow from the Gulf of Mexico and the
Pacific, and convergence over southwestern North America as in the observations with
associated precipitation maxima occurring over northern Mexico and extending farther
northward. All of the model versions simulate less than observed precipitation over the
Arizona-New Mexico region, though the low level wind convergence is comparable to
observed.
There is a clear improvement in the model simulations going from T42 to T85 (Figs.
9b,c). At T42 the precipitation maxima are too extensive, with large precipitation
amounts spread over most of Mexico and into the central U.S. For the AMIP version at
T85 (Fig. 9c), the precipitation maximum is confined to western Mexico and more clearly
tied to the topography of the Sierra Madre, while precipitation amounts over the central
U.S. are closer to the observed. For the T85 CCSM3 (Fig. 9d), there are even more
improvements, with the western Mexico precipitation maximum reduced from the T85
AMIP run in Fig. 9c to bring it in closer agreement with observations, and monsoon
rainfall that extends farther north along the Gulf of California than in the AMIP runs.
15

9. South American monsoon
Warm season rains in South America have been shown to have a number of monsoon-
like features including low level cross equatorial flow with associated moisture transport
and a poleward extension of rainfall into sub-tropical regions (Zhou and Lau, 1998; Chou
and Neelin, 2001; Barros et al., 2002). The observed features of the South American
monsoon during DJF (Fig. 9a), namely low level onshore easterlies over northeastern
South America shifting to northwesterlies to the east of the Andes, and precipitation
maxima in the southern Amazon Basin with an extension of rainfall into southeastern
Brazil, are represented in all the model versions in Fig. 9. The effects of the better-
resolved topography at T85 versus T42 are readily apparent in comparing Fig. 9b and 9c.
The low level northwesterlies extend further to the southeast and improve the simulation
in the monsoon region in the higher resolution model.
All the model simulations underestimate precipitation in northern coastal Brazil and
French Guiana, and produce too much precipitation in the northeast of Brazil. These
errors are seen in many GCMs (e.g., Cavalcanti et al., 2002; Zhou and Lau, 2002), which
suggest that common features of the models such as resolution or observed SST may be
important factors. The errors appear to be reduced in the T85 AMIP simulation. For
example, the intensity of the Atlantic ITCZ is improved, though still weak compared with
observations. Yet in the coupled model, the SST systematic error noted earlier for the
West African monsoon (tropical Atlantic SSTs warmer than observed) affects the
CCSM3 coupled simulation in Fig. 9d as well. The Atlantic ITCZ precipitation
16
maximum lies mostly south of the equator in Fig. 9d (as opposed to north of the equator
in the observations in Fig. 9a), with corresponding anomalously heavy rainfall over the
northeast of Brazil.
10. Conclusions
A number of monsoon regimes from around the world are examined in several climate
model versions and compared to observations to identify factors contributing to the T85
CCSM3 simulation of those monsoon regimes. Nearly all the monsoon regimes benefit
from the improved spatial resolution afforded by T85 compared to T42, with better
regional definition of precipitation maxima particularly where topography plays a
significant role (e.g. the Western Ghats in the Indian monsoon, the Sierra Madre in
Mexico, the Ethiopian highlands in Africa, and the Andes in South America). Most of
the major 850 hPa wind characteristics in the monsoon regimes are well-represented in
the models, with associated regional monsoon precipitation maxima. However,
systematic errors in the SST simulation in the CCSM3 contribute to comparable errors in
the monsoon simulations. In particular, anomalously cool SSTs in the southern Indian
Ocean contribute to a reduced southern ITCZ during the south Asian monsoon, and
anomalously warm SSTs in the tropical Atlantic produce excessive precipitation over the
Gulf of Guinea in the west African monsoon, and greater-than-observed precipitation
over the northeast of Brazil in the South American monsoon. Features of the observed
teleconnections from the south Asian monsoon to tropical Pacific SSTs and precipitation
are simulated in the CCSM3, as are features of interannual variability associated with the
17

TBO. These include continuity of monsoon strength and SST anomaly patterns that carry
from the south Asian monsoon to the Australian monsoon, and the Indian Ocean Dipole
that emerges as a natural consequence of the TBO.
Acknowledgments
Portions of this study were supported by the Office of Biological and Environmental
Research, U.S. Department of Energy, as part of its Climate Change Prediction Program,
and the National Center for Atmospheric Research. This work was also supported in part
by the Weather and Climate Impact Assessment Initiative at the National Center for
Atmospheric Research. The National Center for Atmospheric Research is sponsored by
the National Science Foundation.
18
References
Adams, D.K., and A.C. Comrie, 1997: The North American Monsoon. Bull. Amer.
Meteor. Soc., 78, 2197-2213.
Albignot, J.P. and J.R. Reed, 1980: The origin of African wave disturbances during phase
III of GATE. Mon. Weather Rev., 108, 1827—1839.
Arritt, R.W., D.C. Goerling, and C.J. Anderson, 2000: The North American monsoon
system in the Hadley Centre coupled ocean- atmosphere GCM. Geophys. Res. Lett., 27,
565-568.
Barros, V., M. Doyle, M. Gonzáles, I. Camilloni, R. Bejarán and R. M. Caffera, 2002:
Climate variability over subtropical South America and the South American Monsoon: A
Review. Meteorologica, 27, 33-57.
Cavalcanti, I, J. Marengo, P. Satyamurty, C.A. Nobre, I. Trosnikov, J. P. Bonatti, A. O.
Manzi, T. Tarasova, L.P. Pezzi, C. D’Almeida, G. Sampaio, C.C. Castro, M.B. Sanches,
and H. Camargo, 2002: Global climatological features in a simulation using the CPTEC-
COLA AGCM. J. Climate, 15, 2965-2988.
19

Céron, J.P. and J.F. Guérémy, 1999: Validation of the space-time variability of African
easterly waves simulated by the CNRM GCM. J. Clim., 12, 2831—2855.
Chandrasekar, A., and A. Kitoh, 1998: Impact of localized sea surface temperature
anomalies over the equatorial Indian Ocean on the Indian summer monsoon. J. Meteorol.
Soc. Japan, 76, 841--853.
Chou, C. and J. D. Neelin, 2001: Mechanisms limiting the southward extent of the South
American summer monsoon. Geophys. Res. Lett., 28, no.12, 2433-2436.
Douglas, M.W., R.A. Maddox, K. Howard and S. Reyes, 1993: The Mexican Monsoon.
J. Climate, 6, 1665-1677.
Douville, H., F.Chauvin, and H. Broqua, 2001: Influence of soil moisture on the Asian
and African monsoons. Part I: Mean monsoon and daily precipitation. J. Climate, 14,
2381—2403.
Gadgil, S., S. Sajani and participating AMIP modelling groups, 1998: Monsoon
precipitation in AMIP runs: Results from an AMIP diagnostic subproject. World
Climate Research Programme, WCRP-100, WMO/TD-No. 837. Available from: WCRP,
c/o World Meteorological Organization, Case Postale No. 2300, CH-1211 Geneva 2,
20
Switzerland, 28 pp and 17 figs.
Higgins, R.W., Y. Chen, and A. Douglas, 1999: Interannual variability of the North
American warm season precipitation regime. J. Climate, 12, 653-680.
Ju, J. and J. Slingo, 1995: The Asian summer monsoon and ENSO. Q. J. Roy. Meteorol.
Soc., 121, 1133--1168.
Kang, I.-S., K. Jin, B. Wang, K.-M. Lau, J. Shukla, V. Krishnamurthy, S.D. Schubert,
D.E. Waliser W.F. Stern, A. Kitoh, G.A. Meehl, M. Kanamitsu, V.Y. Galin, V. Satyan,
C.K. Park and Q. Liu, 2002: Intercomparison of the climatological variations of Asian
summer monsoon precipitation simulated by 10 GCMs. Clim. Dyn., 19, 383--395.
Kiehl, J.T., and P.R. Gent, 2004: The Community Climate System Model, Version 2.
J. Climate, 17, 3666—3682.
Kirtman, B. P., and J. Shukla, 2000: On the influence of the Indian summer Monsoon on
ENSO. Quart. J. Roy. Meteor. Soc., 126, 213-239.
Krishnamurthy, V., and J. Shukla, 2000: Intraseasonal and interannaul variability of
rainfall over India. J. Climate, 13, 4366-4377.
21
Lau, K.-M., and W. Bua, 1998: Mechanisms of monsoon-Southern Oscillation coupling:
Insights from GCM experiments. Clim. Dyn., 14, 759--779.
Lawrence, D.M., and P. J. Webster, 2002: The Boreal Summer Intraseasonal
Oscillation: Relationship between Northward and Eastward Movement of Convection.
J. Atmos. Sci., 59, 1593-1606.
Liu, P., B. Wang, K. Sperber, T. Li, and G.A. Meehl, 2004: MJO in the NCAR CAM2
with the Tiedtke Convective Scheme. J. Climate, accepted.
Loschnigg, J., G.A. Meehl, P.J. Webster, J.M. Arblaster, and G.P. Compo, 2003: The
Asian monsoon, the tropospheric biennial oscillation and the Indian Ocean Dipole in the
NCAR CSM. J. Climate, 16, 2138--2158.
Maloney, E.D. and D.L. Hartmann, 2001: Then sensitivity of intraseasonal variability in
the NCAR CCM3 to changes in convective parameterization. J. Clim., 14, 2015-2034.
Marengo, J., I.F.A. Cavalcanti, P. Satyamurty, I. Trosnikov, C.A. Nobre, J.P. Bonatti, H.
Camargo, G. Sampaio, M.B. Sanches, A. O. Manzi, C. A. C. Castro, C. D’almeida, L. P.
Pezzi, L. Candido, 2003: Assessment of regional seasonal rainfall predictability using the
CPTEC/COLA atmospheric GCM. Climate Dynamics, 21, 459-475.
22
Meehl, G.A., 1987: The annual cycle and interannual variability in the tropical Pacific
and Indian Ocean regions. Mon. Wea. Rev., 115, 27--50.
Meehl, G.A., 1992: Effect of tropical topography on global climate. Ann. Rev. Earth and
Planetary Sci., 20, 85--112.
Meehl, G.A., 1994: Coupled land--ocean--atmosphere processes and south Asian
monsoon variability. Science, 266, 263--267.
Meehl, G.A., 1997: The south Asian monsoon and the tropospheric biennial oscillation.
J. Climate, 10, 1921-1943.
Meehl, G.A., and J. Arblaster, 1998: The Asian-Australian monsoon and El Nino--
Southern Oscillation in the NCAR Climate System Model. J. Climate, 11, 1357--1387.
Meehl, G.A., and J.M. Arblaster, 2002: The tropospheric biennial oscillation and Asian-
Australian monsoon rainfall. J. Climate, 15, 722--744.
Meehl, G.A., and A. Hu, 2005: Megadroughts in the Indian monsoon region and
southwest North America and a mechanism for associated multi-decadal sea surface
temperature anomalies. J. Climate, submitted.
23
Okumura, Y. and S.-P. Xie, 2004: Interaction of the Atlantic equatorial cold tongue and
the African monsoon. J. Climate, 17, 3589—3602.
Rasmusson, E.M., and T.H. Carpenter, 1983: The relationship between eastern equatorial
Pacific sea surface temperatures and rainfall over India and Sri Lanka. Mon. Wea. Rev.,
111, 517-528.
Saji, N.H., B.N. Goswami, P.N. Vinayachandran, and T. Yamagata, 1999: A dipole
mode in the tropical Indian Ocean. Nature, 401, 360--363.
Soman, M.K., and J. Slingo, 1997: Sensitivity of Asian summer monsoon to aspects of
sea surface temperature anomalies in the tropical Pacific Ocean. Q. J. Roy. Meteorol.
Soc., 123, 309--336.
Sperber, K.R., 2004: Madden-Julian variability in the NCAR CAM2.0 and CCSM2.0.
Clim. Dyn., 23, 259—278.
Taylor, C.M. and D.B. Clark, 2001: The diurnal cycle and African easterly waves: A land
surface perspective. Q. J. R. Meteorol. Soc., 127, 845—867.
24
Webster, P.J., V.O. Magana, T.N. Palmer, J. Shukla, R.A. Tomas, M. Yanai, and T.
Yasunari, 1998: Monsoons: Processes, predictability, and the prospects for prediction.
J. Geophys. Res., 103, 14,451--14,510.
Webster, P.J., A.M. Moore, J.P. Loschnigg, and R.R. Leben, 1999: Coupled ocean-
atmosphere dynamics in the Indian Ocean during 1997-98. Nature, 401, 356--360.
Wu, R., and B. P. Kirtman, 2003: On the impacts of the Indian summer monsoon on
ENSO in a coupled GCM. Quart. J. Roy. Meteor. Soc., 129B, 3439--3468.
Xie, P. and P.A. Arkin, 1996: Analyses of global monthly precipitation using gauge
observations, satellite estimates, and numerical model predictions. J. Climate, 9,
840--858.
Xie, S.-P., H. Xu, N.H. Saji and W.T. Liu, 2005: Narrow mountains anchor Asian
monsoon convection. Nature, submitted.
Xu, J., X. Gao, J. Shuttleworth, S. Sorooshian, and E. Small, 2004: Model climatology of
the North American monsoon onset period during 1980-2001. J. Climate, 17, 3892—
3906.
Yang, S., K.-M. Lau, and M. Sankar-Rao, 1996: Precursory signals associated with the
interannual variability of the Asian summer monsoon. J. Climate, 9, 949--964.
25

Zhou, J., and K-M. Lau, 1998: Does a monsoon climate exist over South America? J.
Climate, 11, 1020-1040.
Zhou, J., and K-M. Lau, 2002: Intercomparison of model simulations of the impact of
1997/98 El Niño on South American monsoon. Meteorologica, 27, 99-116.
26
Figure captions:
Fig. 1: South Asian monsoon precipitation (mm day-1) and 850 hPa wind vectors for
JJAS, a) observed, 1979-2000 b) CAM3 T42 AMIP, 1979-2000, c) CAM3 T85 AMIP,
1979-2000, d) CCSM3 T85 coupled, 200 year average from control run.
Fig. 2: Seasonal cycle of precipitation (mm day-1) for Indian monsoon sector (70-100E),
a) observed (1980-1999), b) CAM3 T85 AMIP, c) CCSM3 T85 coupled.
Fig. 3: Spectra of Indian monsoon index for JJAS (5-40N, 60-100E) for a) observations
from 1979-2000, b) T42 CAM3 AMIP simulation, 1979-1999, c) T85 CAM3 AMIP
simulation, 1979-1999, d) 200 years of T85 CCSM3 coupled control run.
Fig. 4: Average zonal wavenumber-frequency variance spectra, MJJASO, 10-20N, for a)
observed OLR, b) observed 850 hPa zonal wind, c) T85 CCSM3 precipitation, d) T85
CCSM3 850 hPa zonal wind. Individual variance spectra are calculated from 182 day
summer anomaly time series for MJJASO for each year (1980-1999) and for each latitude
within the 10-20N latitude band. Individual spectra are then averaged to generate the
final variance spectra shown here.
Fig. 5: Correlations of Indian monsoon index (5-40N, 60-100E) with global a)
contemporaneous precipitation, and b) contemporaneous SST , c) observed correlation
27

of Indian monsoon index with subsequent DJF surface temperature, and d) same as (c)
except for the CCSM3.
Fig. 6: Same as Fig. 1 except for Australian monsoon precipitation and surface wind
vectors for DJF (5N-25S, 100E-160E).
Fig. 7: Same as Fig. 1 except for West African monsoon precipitation and surface wind
vectors for JJA (Eq-30N, 20W-40E).
Fig. 8: Same as Fig. 2 except for West African monsoon sector (10W-20E).
Fig. 9: Same as Fig. 1 except for North American monsoon, JJA (20N-45N, 125W-
95W).
Fig. 10: Same as Fig. 1 except for South American monsoon, DJF (25S-10N, 80W-
30W).
28
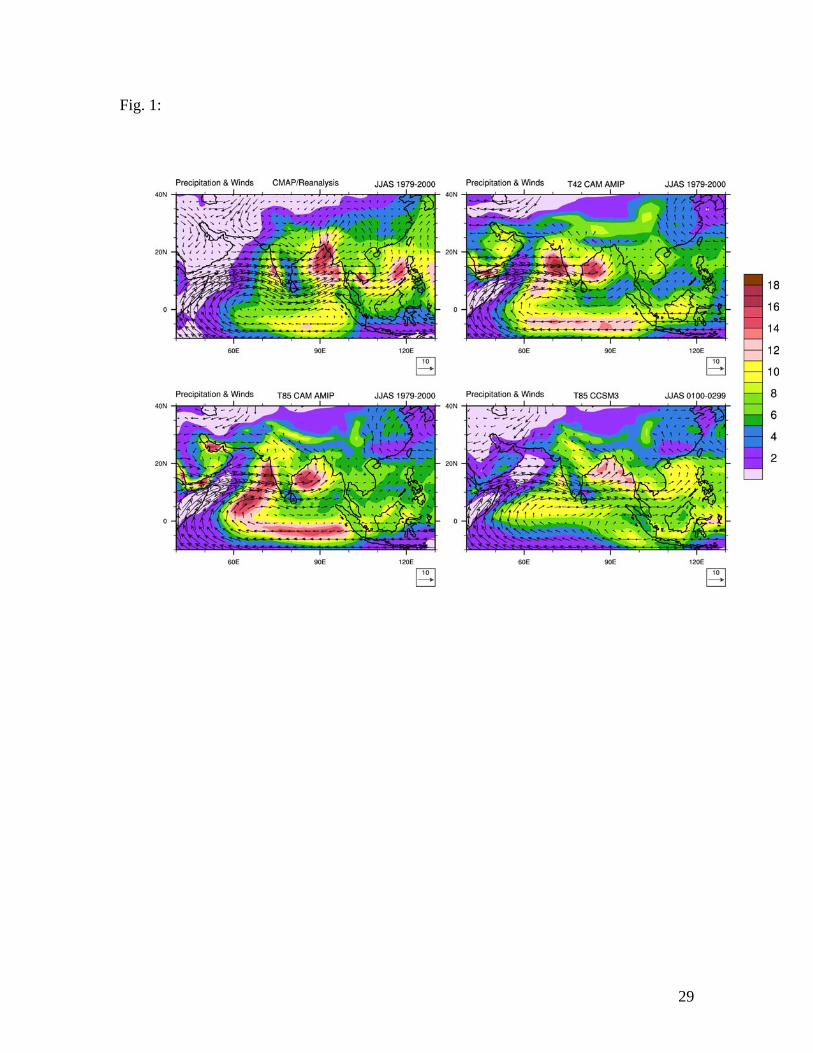
Fig. 1:
29
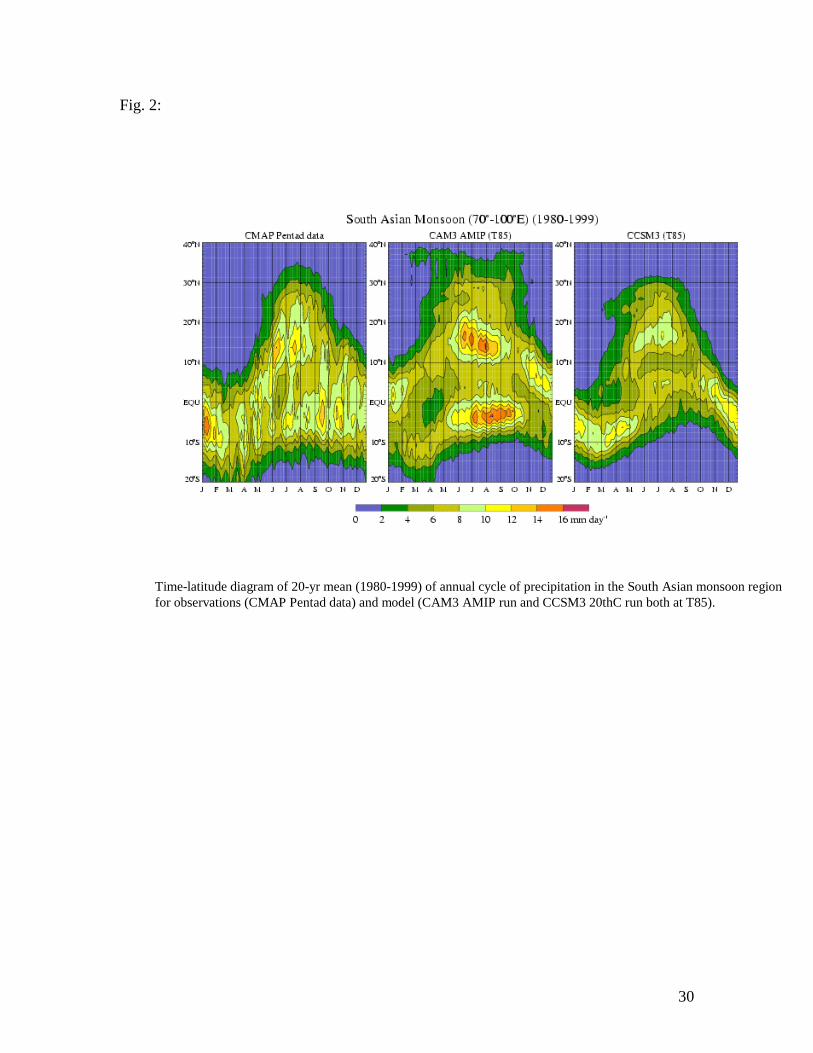
Fig. 2:
Time-latitude diagram of 20-yr mean (1980-1999) of annual cycle of precipitation in the South Asian monsoon region for observations (CMAP Pentad data) and model (CAM3 AMIP run and CCSM3 20thC run both at T85).
30
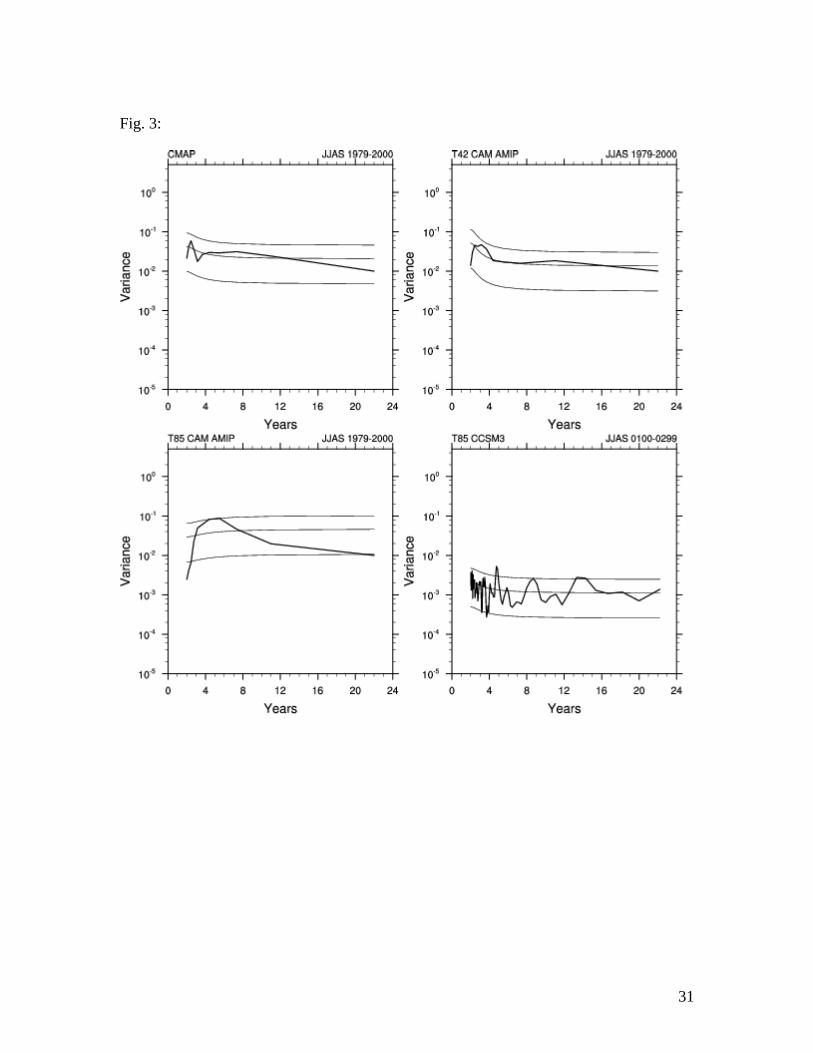
Fig. 3:
31
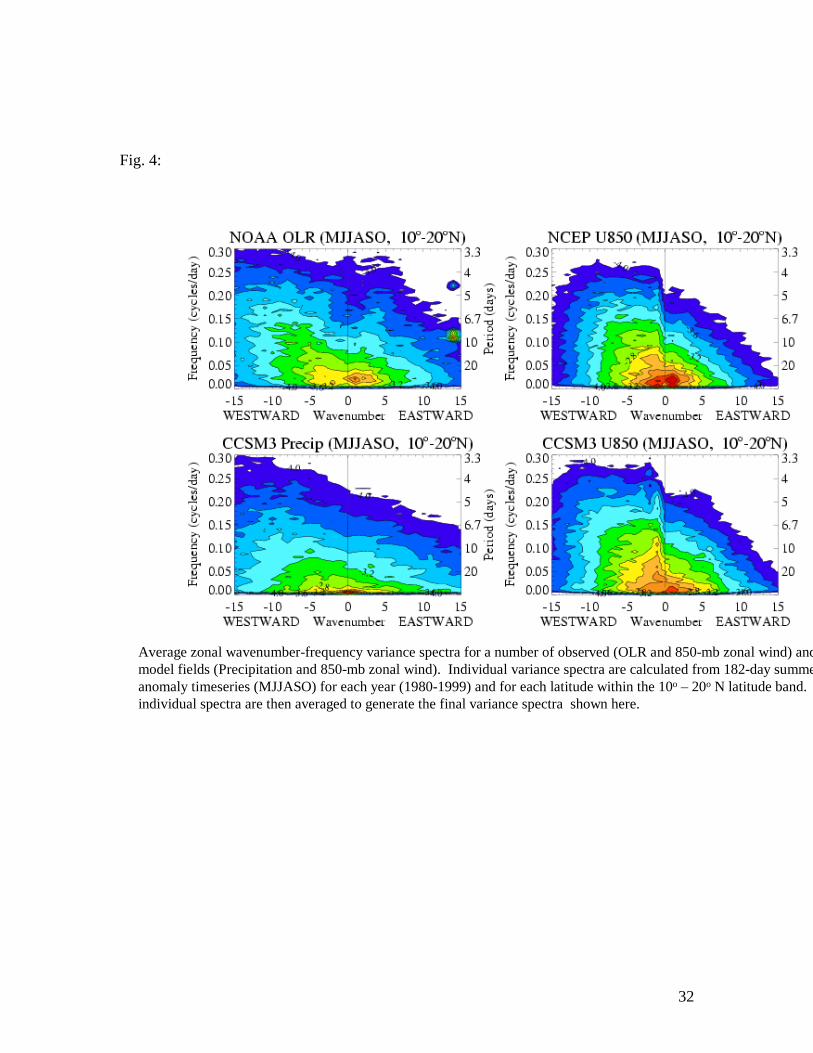
Fig. 4:
Average zonal wavenumber-frequency variance spectra for a number of observed (OLR and 850-mb zonal wind) andmodel fields (Precipitation and 850-mb zonal wind). Individual variance spectra are calculated from 182-day summeanomaly timeseries (MJJASO) for each year (1980-1999) and for each latitude within the 10o – 20o N latitude band. individual spectra are then averaged to generate the final variance spectra shown here.
32
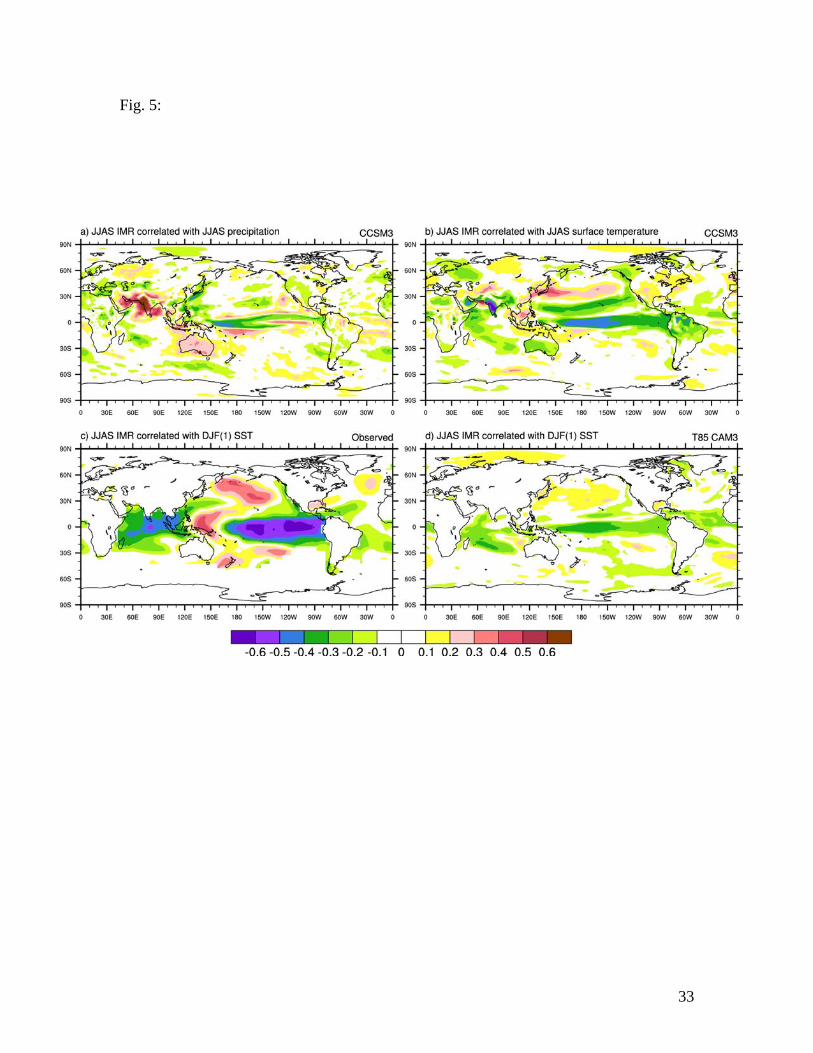
Fig. 5:
33
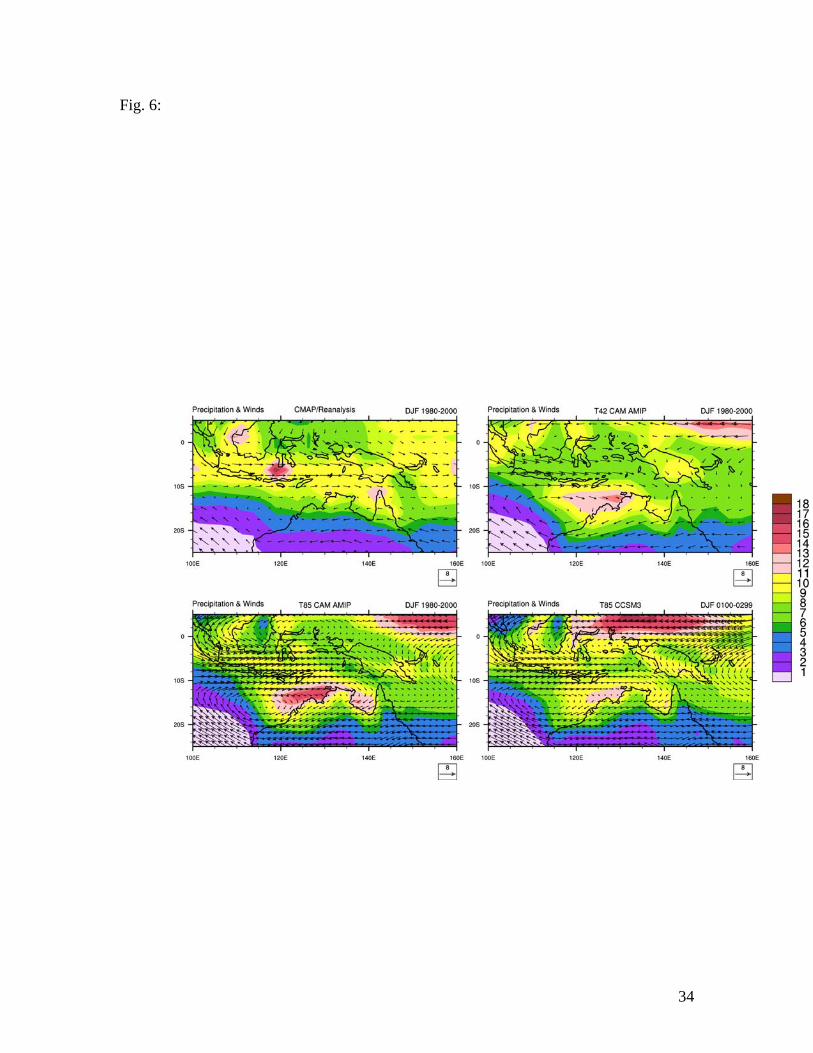
Fig. 6:
34
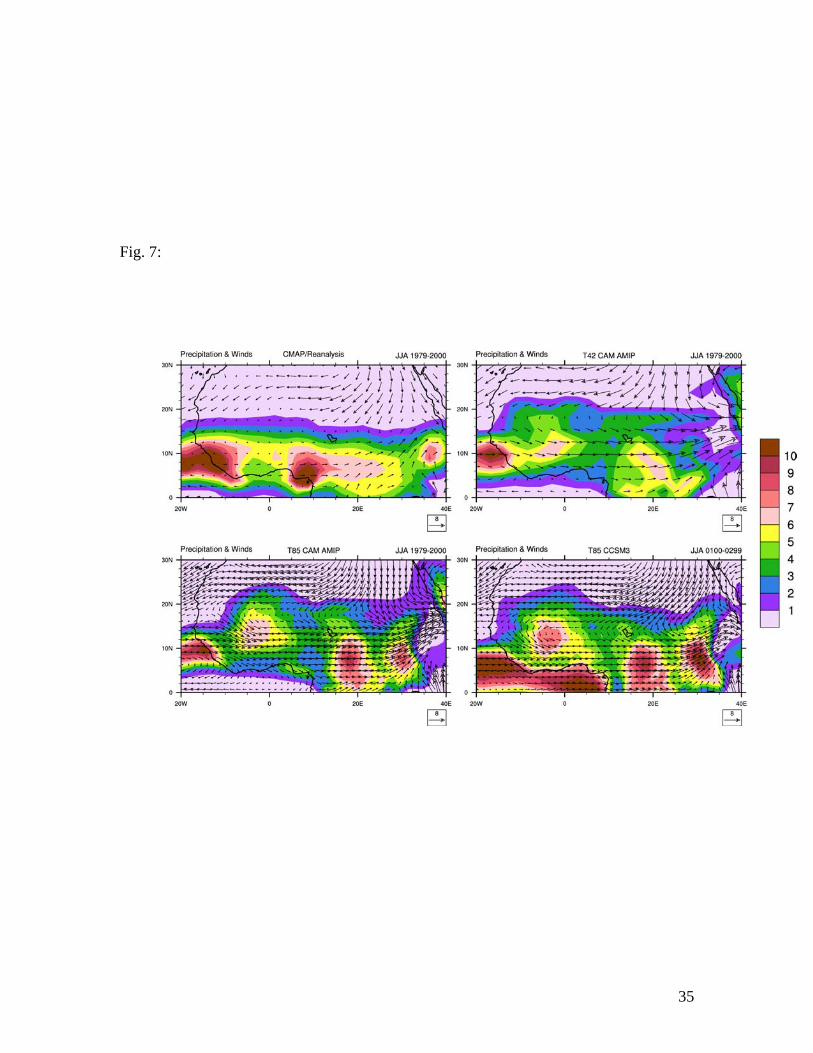
Fig. 7:
35
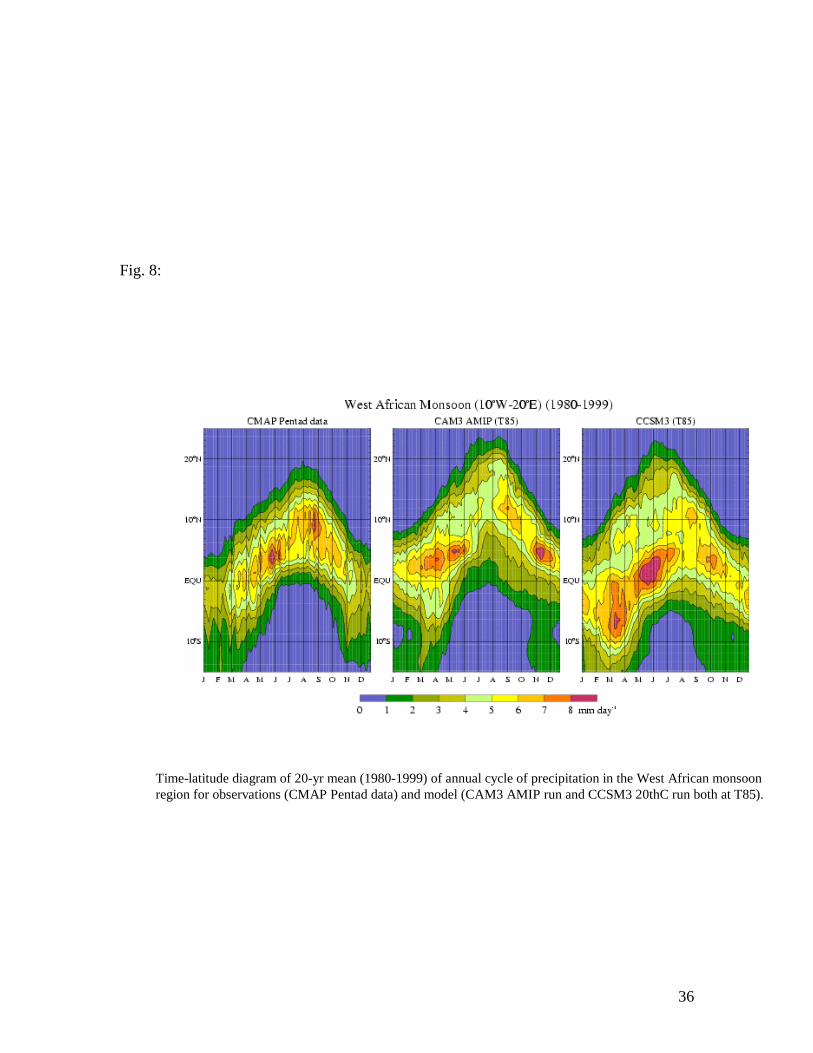
Fig. 8:
Time-latitude diagram of 20-yr mean (1980-1999) of annual cycle of precipitation in the West African monsoon region for observations (CMAP Pentad data) and model (CAM3 AMIP run and CCSM3 20thC run both at T85).
36
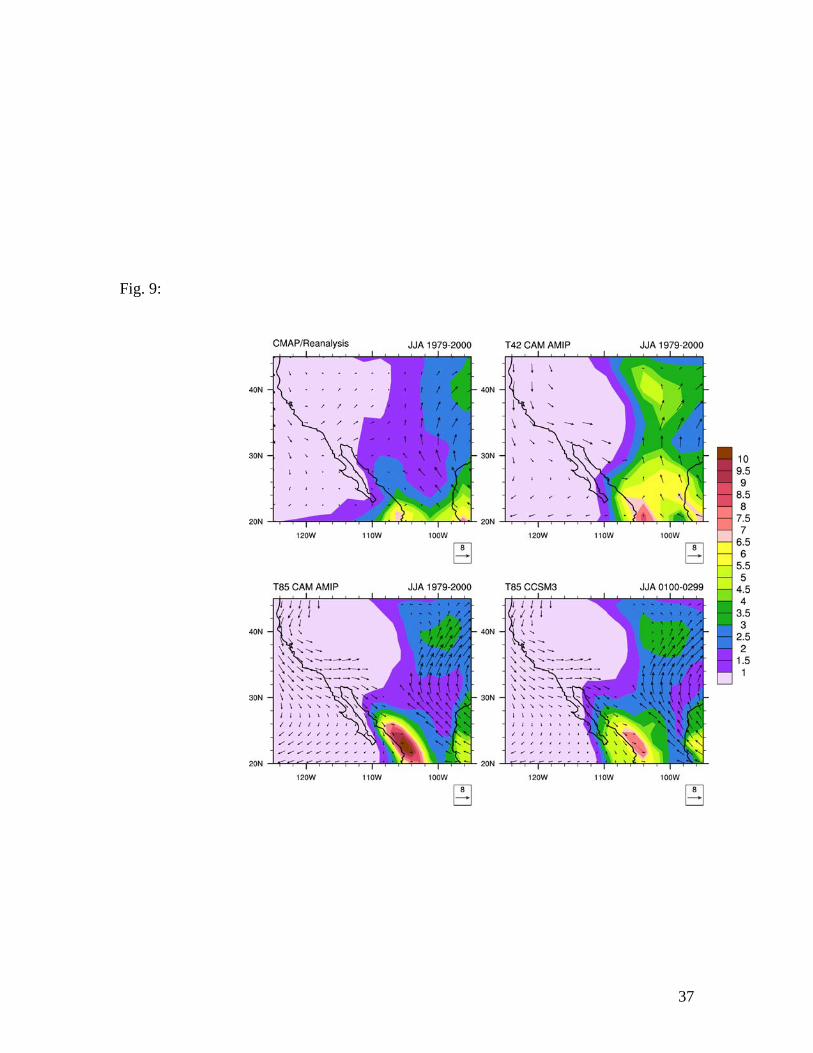
Fig. 9:
37
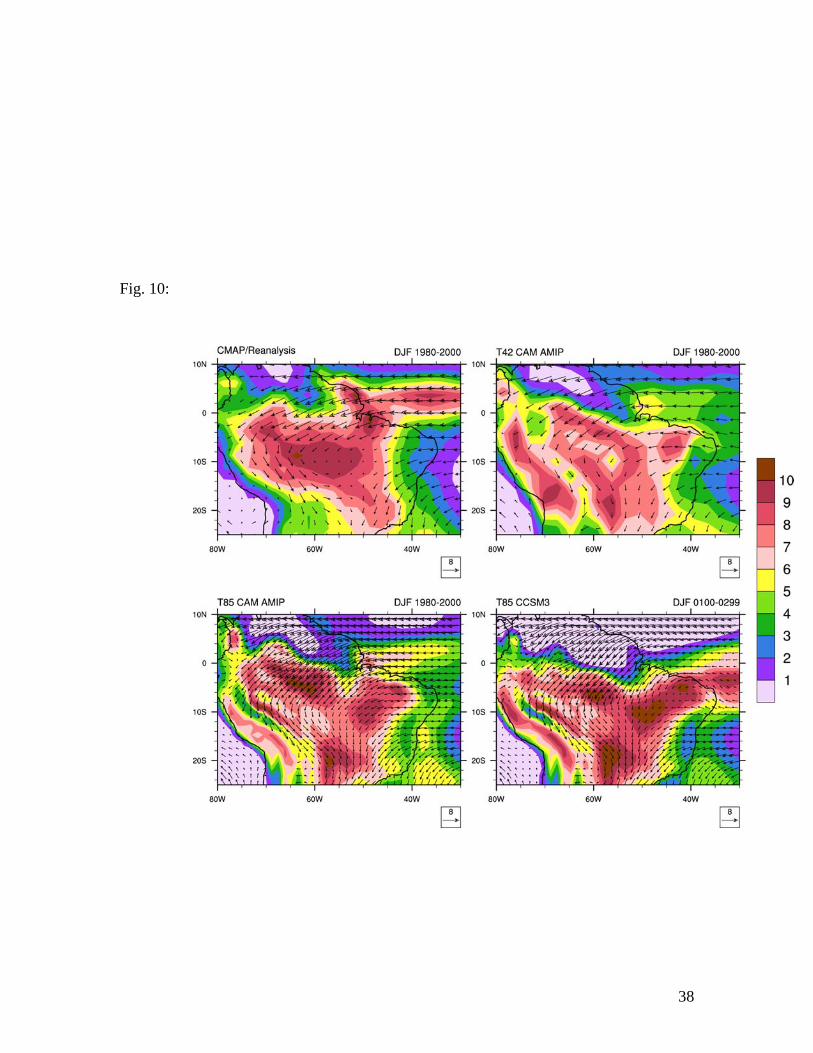
Fig. 10:
38