monocular visual-imu odometry a comparative evaluation of
TRANSCRIPT

The University of Manchester Research
Monocular Visual-IMU Odometry: A ComparativeEvaluation of the Detector-Descriptor Based MethodsDOI:10.1007/978-3-319-46604-0_6
Document VersionAccepted author manuscript
Link to publication record in Manchester Research Explorer
Citation for published version (APA):Dong, X., Dong, X., & Dong, J. (2016). Monocular Visual-IMU Odometry: A Comparative Evaluation of theDetector-Descriptor Based Methods. In G. Hua, & H. Jegou (Eds.), Computer vision - ECCV 2016 workshops :Amsterdam, The Netherlands, October 8-10 and 15-16, 2016, proceedings (Vol. Part 1, pp. 81-95). (Lecture Notesin Computer Science; Vol. 9913). Springer Nature. https://doi.org/10.1007/978-3-319-46604-0_6Published in: Computer vision - ECCV 2016 workshops
Citing this paperPlease note that where the full-text provided on Manchester Research Explorer is the Author Accepted Manuscriptor Proof version this may differ from the final Published version. If citing, it is advised that you check and use thepublisher's definitive version.
General rightsCopyright and moral rights for the publications made accessible in the Research Explorer are retained by theauthors and/or other copyright owners and it is a condition of accessing publications that users recognise andabide by the legal requirements associated with these rights.
Takedown policyIf you believe that this document breaches copyright please refer to the University of Manchester’s TakedownProcedures [http://man.ac.uk/04Y6Bo] or contact [email protected] providingrelevant details, so we can investigate your claim.
Download date:21. Feb. 2022

*Corresponding author: Xinghui Dong. Email: [email protected].
Supplementary Material for ECCV 2016 Workshop
Paper: Monocular Visual-IMU Odometry: A
Comparative Evaluation of the Detector-Descriptor
Based Methods
Xingshuai Dong a, Xinghui Dong
b*, and Junyu Dong
a
a
Ocean University of China, Qingdao, 266071, China b Centre for Imaging Sciences, University of Manchester, Manchester, M13 9PT, UK
Abstract. In Sections 1 to 5, we provide the figures of all the trajectories that
are obtained in the five experiments introduced in the main paper. Each of these
sections corresponds to a subsection of Section 5 in the main paper, i.e., an in-
dividual experiment. It should be noted that the figures shown here is not neces-
sary for understanding the content of the main paper. In addition, we give the
details of the five salient point detectors and eight local descriptors tested in this
study and the configurations of five routes in Sections 6 and 7 respectively.
1 Route 1: Straight Line
In this section, five figures are displayed in terms of five different salient point detec-
tors respectively. In each figure, the ground-truth trajectory (in black) and the esti-
mated trajectories (in different colors) obtained using the IMU method and eight dif-
ferent local descriptors on the Straight Line route are shown together.
Fig. 1. The ground-truth motion trajectory and the trajectories obtained using IMU and the
combinations of the Blob&Corner salient point detector and different local descriptors on the
Straight Line route (express way, ≈780m, ≈60km/h). (Map source: GoogleEarth).
8.445 8.446 8.447 8.448 8.449 8.45 8.451 8.452 8.453 8.454 8.455
49.001
49.002
49.003
49.004
49.005
49.006
49.007
Longitude
Latit
ude
Motion Trajectory
Ground−TruthIMUVIO BLOB&CORNER+ICIMGPVIO BLOB&CORNER+IMGPVIO BLOB&CORNER+LIOPVIO BLOB&CORNER+LMVIO BLOB&CORNER+LSSDVIO BLOB&CORNER+SIFTVIO BLOB&CORNER+SURFVIO BLOB&CORNER+HOG
8.445 8.4455 8.446 8.4465 8.44749.003
49.0035
49.004
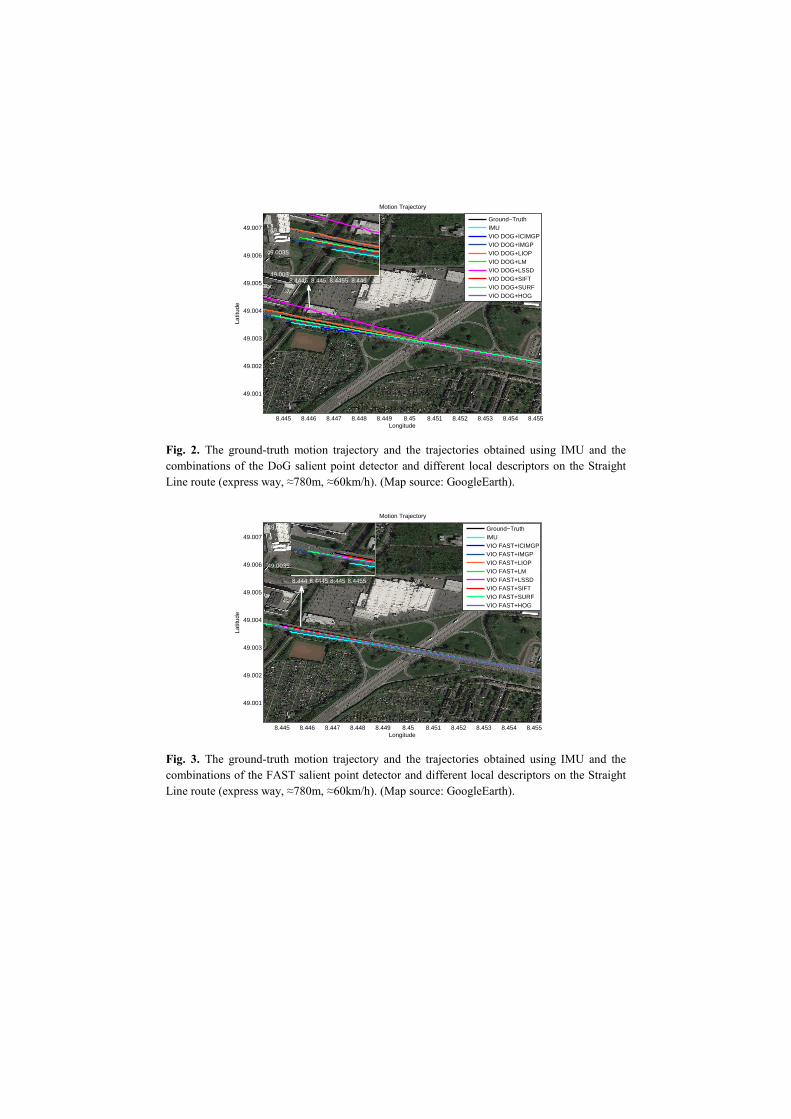
Fig. 2. The ground-truth motion trajectory and the trajectories obtained using IMU and the
combinations of the DoG salient point detector and different local descriptors on the Straight
Line route (express way, ≈780m, ≈60km/h). (Map source: GoogleEarth).
Fig. 3. The ground-truth motion trajectory and the trajectories obtained using IMU and the
combinations of the FAST salient point detector and different local descriptors on the Straight
Line route (express way, ≈780m, ≈60km/h). (Map source: GoogleEarth).
8.445 8.446 8.447 8.448 8.449 8.45 8.451 8.452 8.453 8.454 8.455
49.001
49.002
49.003
49.004
49.005
49.006
49.007
Longitude
Latit
ude
Motion Trajectory
Ground−TruthIMUVIO DOG+ICIMGPVIO DOG+IMGPVIO DOG+LIOPVIO DOG+LMVIO DOG+LSSDVIO DOG+SIFTVIO DOG+SURFVIO DOG+HOG
8.4445 8.445 8.4455 8.44649.003
49.0035
49.004
8.445 8.446 8.447 8.448 8.449 8.45 8.451 8.452 8.453 8.454 8.455
49.001
49.002
49.003
49.004
49.005
49.006
49.007
Longitude
Latit
ude
Motion Trajectory
Ground−TruthIMUVIO FAST+ICIMGPVIO FAST+IMGPVIO FAST+LIOPVIO FAST+LMVIO FAST+LSSDVIO FAST+SIFTVIO FAST+SURFVIO FAST+HOG
8.444 8.4445 8.445 8.4455
49.0035
49.004
49.0045

Fig. 4. The ground-truth motion trajectory and the trajectories obtained using IMU and the
combinations of the Fast Hessian salient point detector and different local descriptors on the
Straight Line route (express way, ≈780m, ≈60km/h). (Map source: GoogleEarth).
Fig. 5. The ground-truth motion trajectory and the trajectories obtained using IMU and the
combinations of the Harris Laplace salient point detector and different local descriptors on the
Straight Line route (express way, ≈780m, ≈60km/h). (Map source: GoogleEarth).
2 Route 2: Quarter Turn
This section shows five figures in terms of five different salient point detectors re-
spectively. In each figure, the ground-truth trajectory (in black) and the estimated
trajectories (in different colors) obtained using the IMU method and eight different
local descriptors on the Quarter Turn route are shown together.
8.445 8.446 8.447 8.448 8.449 8.45 8.451 8.452 8.453 8.454 8.455
49.001
49.002
49.003
49.004
49.005
49.006
49.007
Longitude
Latit
ude
Motion Trajectory
Ground−TruthIMUVIO FASTHESSIAN+ICIMGPVIO FASTHESSIAN+IMGPVIO FASTHESSIAN+LIOPVIO FASTHESSIAN+LMVIO FASTHESSIAN+LSSDVIO FASTHESSIAN+SIFTVIO FASTHESSIAN+SURFVIO FASTHESSIAN+HOG
8.444 8.4445 8.445 8.4455 8.446
49.0035
49.004
49.0045
8.445 8.446 8.447 8.448 8.449 8.45 8.451 8.452 8.453 8.454 8.455
49.001
49.002
49.003
49.004
49.005
49.006
49.007
Longitude
Latit
ude
Motion Trajectory
Ground−TruthIMUVIO HARRISLAPLACE+ICIMGPVIO HARRISLAPLACE+IMGPVIO HARRISLAPLACE+LIOPVIO HARRISLAPLACE+LMVIO HARRISLAPLACE+LSSDVIO HARRISLAPLACE+SIFTVIO HARRISLAPLACE+SURFVIO HARRISLAPLACE+HOG
8.4445 8.445 8.4455 8.446 8.4465
49.003249.003449.003649.0038
49.00449.0042

Fig. 6. The ground-truth motion trajectory and the trajectories obtained using IMU and the
combinations of the Blob&Corner salient point detector and different local descriptors on the
Quarter Turn route (urban road, ≈330m, ≈28km/h). (Map source: GoogleEarth).
Fig. 7. The ground-truth motion trajectory and the trajectories obtained using IMU and the
combinations of the DoG salient point detector and different local descriptors on the Quarter
Turn route (urban road, ≈330m, ≈28km/h). (Map source: GoogleEarth).
8.4375 8.438 8.4385 8.439 8.4395 8.44 8.4405 8.441
49.009
49.0095
49.01
49.0105
49.011
Longitude
Latit
ude
Motion Trajectory
Ground−TruthIMUVIO BLOB&CORNER+ICIMGPVIO BLOB&CORNER+IMGPVIO BLOB&CORNER+LIOPVIO BLOB&CORNER+LMVIO BLOB&CORNER+LSSDVIO BLOB&CORNER+SIFTVIO BLOB&CORNER+SURFVIO BLOB&CORNER+HOG
8.4402 8.4404 8.4406 8.4408
49.0098
49.0099
49.01
49.0101
49.0102
8.4375 8.438 8.4385 8.439 8.4395 8.44 8.4405 8.441
49.009
49.0095
49.01
49.0105
49.011
Longitude
Latit
ude
Motion Trajectory
Ground−TruthIMUVIO DOG+ICIMGPVIO DOG+IMGPVIO DOG+LIOPVIO DOG+LMVIO DOG+LSSDVIO DOG+SIFTVIO DOG+SURFVIO DOG+HOG
8.4402 8.4404 8.4406 8.440849.0097
49.0098
49.0099
49.01
49.0101

Fig. 8. The ground-truth motion trajectory and the trajectories obtained using IMU and the
combinations of the FAST salient point detector and different local descriptors on the Quarter
Turn route (urban road, ≈330m, ≈28km/h). (Map source: GoogleEarth).
Fig. 9. The ground-truth motion trajectory and the trajectories obtained using IMU and the
combinations of the Fast Hessian salient point detector and different local descriptors on the
Quarter Turn route (urban road, ≈330m, ≈28km/h). (Map source: GoogleEarth).
8.437 8.4375 8.438 8.4385 8.439 8.4395 8.44 8.4405
49.009
49.0095
49.01
49.0105
49.011
Longitude
Latit
ude
Motion Trajectory
Ground−TruthIMUVIO FAST+ICIMGPVIO FAST+IMGPVIO FAST+LIOPVIO FAST+LMVIO FAST+LSSDVIO FAST+SIFTVIO FAST+SURFVIO FAST+HOG
8.4402 8.4404 8.4406 8.4408
49.0097
49.0098
49.0099
49.01
49.0101
8.4375 8.438 8.4385 8.439 8.4395 8.44 8.4405 8.441
49.009
49.0095
49.01
49.0105
49.011
Longitude
Latit
ude
Motion Trajectory
Ground−TruthIMUVIO FASTHESSIAN+ICIMGPVIO FASTHESSIAN+IMGPVIO FASTHESSIAN+LIOPVIO FASTHESSIAN+LMVIO FASTHESSIAN+LSSDVIO FASTHESSIAN+SIFTVIO FASTHESSIAN+SURFVIO FASTHESSIAN+HOG
8.44 8.4402 8.4404 8.4406
49.0097
49.0098
49.0099
49.01
49.0101

Fig. 10. The ground-truth motion trajectory and the trajectories obtained using IMU and the
combinations of the Harris Laplace salient point detector and different local descriptors on the
Quarter Turn route (urban road, ≈330m, ≈28km/h). (Map source: GoogleEarth).
3 Route 3: Multiple Quarter Turns
This section shows five figures in terms of five different salient point detectors re-
spectively. In each figure, the ground-truth trajectory (in black) and the estimated
trajectories (in different colors) obtained using the IMU method and eight different
local descriptors on the Multiple Quarter Turns route are shown together.
Fig. 11. The ground-truth motion trajectory and the trajectories obtained using IMU and the
combinations of the Blob&Corner salient point detector and different local descriptors on the
Multiple Quarter Turns route (residential area, ≈ 960m, ≈ 26km/h). (Map source:
GoogleEarth).
8.4375 8.438 8.4385 8.439 8.4395 8.44 8.4405 8.441
49.009
49.0095
49.01
49.0105
49.011
Longitude
Latit
ude
Motion Trajectory
Ground−TruthIMUVIO HARRISLAPLACE+ICIMGPVIO HARRISLAPLACE+IMGPVIO HARRISLAPLACE+LIOPVIO HARRISLAPLACE+LMVIO HARRISLAPLACE+LSSDVIO HARRISLAPLACE+SIFTVIO HARRISLAPLACE+SURFVIO HARRISLAPLACE+HOG
8.4404 8.4406 8.4408 8.441
49.0098
49.0099
49.01
49.0101
49.0102
8.39 8.391 8.392 8.393 8.394 8.395 8.396
48.9825
48.983
48.9835
48.984
48.9845
48.985
48.9855
48.986
48.9865
48.987
Longitude
Latit
ude
Motion Trajectory
Ground−TruthIMUVIO BLOB&CORNER+ICIMGPVIO BLOB&CORNER+IMGPVIO BLOB&CORNER+LIOPVIO BLOB&CORNER+LMVIO BLOB&CORNER+LSSDVIO BLOB&CORNER+SIFTVIO BLOB&CORNER+SURFVIO BLOB&CORNER+HOG
8.391 8.3915 8.392
48.983
48.9832
48.9834
48.9836

Fig. 12. The ground-truth motion trajectory and the trajectories obtained using IMU and the
combinations of the DoG salient point detector and different local descriptors on the Multiple
Quarter Turns route (residential area, ≈960m, ≈26km/h). (Map source: GoogleEarth).
Fig. 13. The ground-truth motion trajectory and the trajectories obtained using IMU and the
combinations of the FAST salient point detector and different local descriptors on the Multiple
Quarter Turns route (residential area, ≈960m, ≈26km/h). (Map source: GoogleEarth).
8.389 8.39 8.391 8.392 8.393 8.394 8.395 8.396
48.9825
48.983
48.9835
48.984
48.9845
48.985
48.9855
48.986
48.9865
48.987
Longitude
Latit
ude
Motion Trajectory
Ground−TruthIMUVIO DOG+ICIMGPVIO DOG+IMGPVIO DOG+LIOPVIO DOG+LMVIO DOG+LSSDVIO DOG+SIFTVIO DOG+SURFVIO DOG+HOG
8.391 8.3915 8.392
48.9828
48.983
48.9832
48.9834
48.9836
8.39 8.391 8.392 8.393 8.394 8.395 8.396
48.9825
48.983
48.9835
48.984
48.9845
48.985
48.9855
48.986
48.9865
48.987
Longitude
Latit
ude
Motion Trajectory
Ground−TruthIMUVIO FAST+ICIMGPVIO FAST+IMGPVIO FAST+LIOPVIO FAST+LMVIO FAST+LSSDVIO FAST+SIFTVIO FAST+SURFVIO FAST+HOG
8.391 8.3915 8.392
48.983
48.9832
48.9834
48.9836
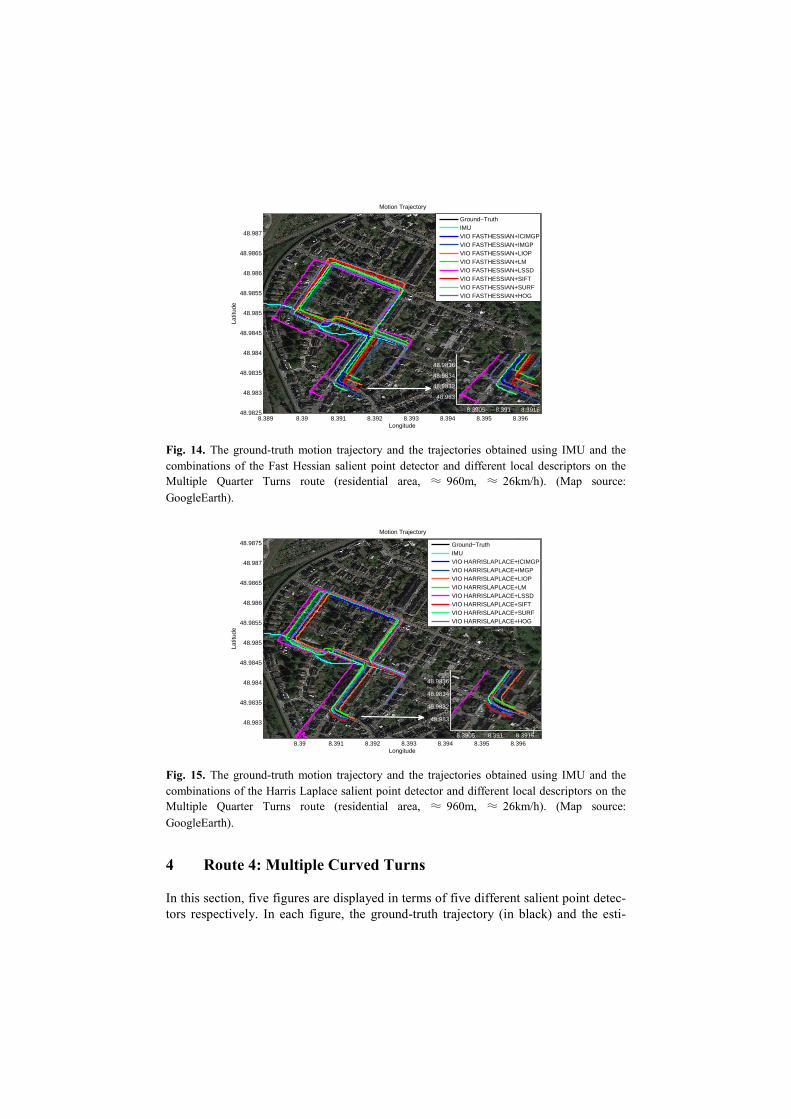
Fig. 14. The ground-truth motion trajectory and the trajectories obtained using IMU and the
combinations of the Fast Hessian salient point detector and different local descriptors on the
Multiple Quarter Turns route (residential area, ≈ 960m, ≈ 26km/h). (Map source:
GoogleEarth).
Fig. 15. The ground-truth motion trajectory and the trajectories obtained using IMU and the
combinations of the Harris Laplace salient point detector and different local descriptors on the
Multiple Quarter Turns route (residential area, ≈ 960m, ≈ 26km/h). (Map source:
GoogleEarth).
4 Route 4: Multiple Curved Turns
In this section, five figures are displayed in terms of five different salient point detec-
tors respectively. In each figure, the ground-truth trajectory (in black) and the esti-
8.389 8.39 8.391 8.392 8.393 8.394 8.395 8.39648.9825
48.983
48.9835
48.984
48.9845
48.985
48.9855
48.986
48.9865
48.987
Longitude
Latit
ude
Motion Trajectory
Ground−TruthIMUVIO FASTHESSIAN+ICIMGPVIO FASTHESSIAN+IMGPVIO FASTHESSIAN+LIOPVIO FASTHESSIAN+LMVIO FASTHESSIAN+LSSDVIO FASTHESSIAN+SIFTVIO FASTHESSIAN+SURFVIO FASTHESSIAN+HOG
8.3905 8.391 8.3915
48.983
48.9832
48.9834
48.9836
8.39 8.391 8.392 8.393 8.394 8.395 8.396
48.983
48.9835
48.984
48.9845
48.985
48.9855
48.986
48.9865
48.987
48.9875
Longitude
Latit
ude
Motion Trajectory
Ground−TruthIMUVIO HARRISLAPLACE+ICIMGPVIO HARRISLAPLACE+IMGPVIO HARRISLAPLACE+LIOPVIO HARRISLAPLACE+LMVIO HARRISLAPLACE+LSSDVIO HARRISLAPLACE+SIFTVIO HARRISLAPLACE+SURFVIO HARRISLAPLACE+HOG
8.3905 8.391 8.3915
48.983
48.9832
48.9834
48.9836

mated trajectories (in different colors) obtained using the IMU method and eight dif-
ferent local descriptors on the Multiple Curved Turns route are shown together.
Fig. 16. The ground-truth motion trajectory and the trajectories obtained using IMU and the
combinations of the Blob&Corner salient point detector and different local descriptors on the
Multiple Curved Turns route (residential area, ≈ 1050m, ≈ 40km/h). (Map source:
GoogleEarth).
Fig. 17. The ground-truth motion trajectory and the trajectories obtained using IMU and the
combinations of the DoG salient point detector and different local descriptors on the Multiple
Curved Turns route (residential area, ≈1050m, ≈40km/h). (Map source: GoogleEarth).
8.47 8.472 8.474 8.476 8.478 8.48 8.482
48.984
48.985
48.986
48.987
48.988
48.989
48.99
48.991
48.992
Longitude
Latit
ude
Motion Trajectory
Ground−Truth
IMU
VIO BLOB&CORNER+ICIMGP
VIO BLOB&CORNER+IMGP
VIO BLOB&CORNER+LIOP
VIO BLOB&CORNER+LM
VIO BLOB&CORNER+LSSD
VIO BLOB&CORNER+SIFT
VIO BLOB&CORNER+SURF
VIO BLOB&CORNER+HOG
8.4735 8.474 8.4745 8.475 8.4755
48.986
48.9865
48.987
8.4788.47858.4798.4795 8.4848.987
48.9875
48.988
48.9885
8.47 8.472 8.474 8.476 8.478 8.48 8.48248.983
48.984
48.985
48.986
48.987
48.988
48.989
48.99
48.991
48.992
Longitude
Latit
ude
Motion Trajectory
Ground−Truth
IMU
VIO DOG+ICIMGP
VIO DOG+IMGP
VIO DOG+LIOP
VIO DOG+LM
VIO DOG+LSSD
VIO DOG+SIFT
VIO DOG+SURF
VIO DOG+HOG
8.4735 8.474 8.4745 8.475 8.4755
48.986
48.9865
48.987
8.478 8.479 8.48
48.9875
48.988
48.9885
48.989

Fig. 18. The ground-truth motion trajectory and the trajectories obtained using IMU and the
combinations of the FAST salient point detector and different local descriptors on the Multiple
Curved Turns route (residential area, ≈1050m, ≈40km/h). (Map source: GoogleEarth).
Fig. 19. The ground-truth motion trajectory and the trajectories obtained using IMU and the
combinations of the Fast Hessian salient point detector and different local descriptors on the
Multiple Curved Turns route (residential area, ≈ 1050m, ≈ 40km/h). (Map source:
GoogleEarth).
8.47 8.472 8.474 8.476 8.478 8.48 8.482
48.984
48.985
48.986
48.987
48.988
48.989
48.99
48.991
48.992
Longitude
Latit
ude
Motion Trajectory
Ground−Truth
IMU
VIO FAST+ICIMGP
VIO FAST+IMGP
VIO FAST+LIOP
VIO FAST+LM
VIO FAST+LSSD
VIO FAST+SIFT
VIO FAST+SURF
VIO FAST+HOG
8.4735 8.474 8.4745 8.475 8.475548.9855
48.986
48.9865
48.987
8.4775 8.478 8.4785 8.479 8.4795 8.48
48.9875
48.988
48.9885
8.47 8.472 8.474 8.476 8.478 8.48 8.482
48.983
48.984
48.985
48.986
48.987
48.988
48.989
48.99
48.991
48.992
Longitude
Latit
ude
Motion Trajectory
Ground−Truth
IMU
VIO FASTHESSIAN+ICIMGP
VIO FASTHESSIAN+IMGP
VIO FASTHESSIAN+LIOP
VIO FASTHESSIAN+LM
VIO FASTHESSIAN+LSSD
VIO FASTHESSIAN+SIFT
VIO FASTHESSIAN+SURF
VIO FASTHESSIAN+HOG
8.473 8.474 8.47548.9855
48.986
48.9865
48.987
8.4788.47858.4798.4795 8.48
48.9875
48.988
48.9885
48.989

Fig. 20. The ground-truth motion trajectory and the trajectories obtained using IMU and the
combinations of the Harris Laplace salient point detector and different local descriptors on the
Multiple Curved Turns route (residential area, ≈ 1050m, ≈ 40km/h). (Map source:
GoogleEarth).
5 Route 5: Loop Line
This section displays five figures in terms of five different salient point detectors re-
spectively. In each figure, the ground-truth trajectory (in black) and the estimated
trajectories (in different colors) obtained using the IMU method and eight different
local descriptors on the Loop Line route are shown together.
Fig. 21. The ground-truth motion trajectory and the trajectories obtained using IMU and the
combinations of the Blob&Corner salient point detector and different local descriptors on the
Loop Line route (residential area, ≈930m, ≈38km/h). (Map source: GoogleEarth).
8.47 8.472 8.474 8.476 8.478 8.48 8.482
48.984
48.985
48.986
48.987
48.988
48.989
48.99
48.991
48.992
Longitude
Latit
ude
Motion Trajectory
Ground−Truth
IMU
VIO HARRISLAPLACE+ICIMGP
VIO HARRISLAPLACE+IMGP
VIO HARRISLAPLACE+LIOP
VIO HARRISLAPLACE+LM
VIO HARRISLAPLACE+LSSD
VIO HARRISLAPLACE+SIFT
VIO HARRISLAPLACE+SURF
VIO HARRISLAPLACE+HOG
8.4735 8.474 8.4745 8.475 8.4755
48.9855
48.986
48.9865
48.987
8.4785 8.479 8.4795 8.48 8.4805
48.9875
48.988
48.9885
48.989
8.393 8.394 8.395 8.396 8.397 8.398 8.399 8.4
49.0515
49.052
49.0525
49.053
49.0535
49.054
49.0545
49.055
49.0555
49.056
Longitude
Latit
ude
Motion Trajectory
Ground−Truth
IMU
VIO BLOB&CORNER+ICIMGP
VIO BLOB&CORNER+IMGP
VIO BLOB&CORNER+LIOP
VIO BLOB&CORNER+LM
VIO BLOB&CORNER+LSSD
VIO BLOB&CORNER+SIFT
VIO BLOB&CORNER+SURF
VIO BLOB&CORNER+HOG
8.39268.3928 8.393 8.393249.0529
49.053
49.0531
49.0532
49.0533
8.399 8.39928.39948.399649.0533
49.0534
49.0535
49.0536
49.0537

Fig. 22. The ground-truth motion trajectory and the trajectories obtained using IMU and the
combinations of the DoG salient point detector and different local descriptors on the Loop Line
route (residential area, ≈930m, ≈38km/h). (Map source: GoogleEarth).
Fig. 23. The ground-truth motion trajectory and the trajectories obtained using IMU and the
combinations of the FAST salient point detector and different local descriptors on the Loop
Line route (residential area, ≈930m, ≈38km/h). (Map source: GoogleEarth).
8.393 8.394 8.395 8.396 8.397 8.398 8.399 8.4
49.0515
49.052
49.0525
49.053
49.0535
49.054
49.0545
49.055
49.0555
49.056
Longitude
Latit
ude
Motion Trajectory
Ground−Truth
IMU
VIO DOG+ICIMGP
VIO DOG+IMGP
VIO DOG+LIOP
VIO DOG+LM
VIO DOG+LSSD
VIO DOG+SIFT
VIO DOG+SURF
VIO DOG+HOG
8.393 8.3935 8.39449.0528
49.053
49.0532
49.0534
49.0536
8.3985 8.399 8.3995
49.0532
49.0534
49.0536
49.0538
49.054
8.393 8.394 8.395 8.396 8.397 8.398 8.399 8.4
49.0515
49.052
49.0525
49.053
49.0535
49.054
49.0545
49.055
49.0555
49.056
Longitude
Latit
ude
Motion Trajectory
Ground−Truth
IMU
VIO FAST+ICIMGP
VIO FAST+IMGP
VIO FAST+LIOP
VIO FAST+LM
VIO FAST+LSSD
VIO FAST+SIFT
VIO FAST+SURF
VIO FAST+HOG
8.39268.3928 8.393 8.3932
49.053
49.0531
49.0532
49.0533
49.0534
8.399 8.3992 8.3994 8.3996
49.0533
49.0534
49.0535
49.0536
49.0537

Fig. 24. The ground-truth motion trajectory and the trajectories obtained using IMU and the
combinations of the Fast Hessian salient point detector and different local descriptors on the
Loop Line route (residential area, ≈930m, ≈38km/h). (Map source: GoogleEarth).
Fig. 25. The ground-truth motion trajectory and the trajectories obtained using IMU and the
combinations of the Harris Laplace salient point detector and different local descriptors on the
Loop Line route (residential area, ≈930m, ≈38km/h). (Map source: GoogleEarth).
6 Parameter Values of the Salient Point Detectors and Local
Descriptors
In this section, we list the parameters used for the five salient point detectors and
eight local descriptors in detail.
8.393 8.394 8.395 8.396 8.397 8.398 8.399 8.4
49.0515
49.052
49.0525
49.053
49.0535
49.054
49.0545
49.055
49.0555
49.056
Longitude
Latit
ude
Motion Trajectory
Ground−Truth
IMU
VIO FASTHESSIAN+ICIMGP
VIO FASTHESSIAN+IMGP
VIO FASTHESSIAN+LIOP
VIO FASTHESSIAN+LM
VIO FASTHESSIAN+LSSD
VIO FASTHESSIAN+SIFT
VIO FASTHESSIAN+SURF
VIO FASTHESSIAN+HOG
8.3925 8.393 8.393549.0526
49.0528
49.053
49.0532
49.0534
8.399 8.3995 8.4
49.0534
49.0536
49.0538
49.054
8.393 8.394 8.395 8.396 8.397 8.398 8.399 8.4
49.0515
49.052
49.0525
49.053
49.0535
49.054
49.0545
49.055
49.0555
49.056
Longitude
Latit
ude
Motion Trajectory
Ground−Truth
IMU
VIO HARRISLAPLACE+ICIMGP
VIO HARRISLAPLACE+IMGP
VIO HARRISLAPLACE+LIOP
VIO HARRISLAPLACE+LM
VIO HARRISLAPLACE+LSSD
VIO HARRISLAPLACE+SIFT
VIO HARRISLAPLACE+SURF
VIO HARRISLAPLACE+HOG
8.3928 8.393 8.39328.3934
49.053
49.0531
49.0532
49.0533
49.0534
8.399 8.39928.39948.3996
49.0534
49.0535
49.0536
49.0537
49.0538

6.1 Parameter Values of the Salient Point Detectors
Detector Parameter Value
Blob&Corner Window Size 13×13
DoG Octaves 4
Levels Per Octave 3
�� 1.6
Fast Hessian Octaves 4
Threshold � 0.2
Sampling Step � 2
FAST Threshold � 30
Harris-Laplace Peak Threshold 0.000002
Edge Threshold 10
6.2 Parameter Values of the Local Descriptors
Detector Parameter Value
HOG Block Size 15×15
Cell Size 5×5
Number of Orientations 9
IMGP Patch Size 11×11
ICIMGP Number of Channels 8
Patch Size 11×11
LM �� √2, 2, 2√2
LIOP Number of Spatial Bins 6
Number of Neighbors 4
Sampling Radius 6
LSSD Patch Size 5×5
Region Radius 40
� 12
�� 3
SIFT Sub-window Size 4×4
Number of Bins Per Window 3
SURF Window Size 4×4
7 Configurations of the Five Routes
We describe the details of each route used in this study in terms of the information
provided with the KITTI dataset in the table below.

Route
No.
Sequence No. in the KITTI
Dataset
No. of the Start
Point Image (The
Left Color Cam-
era Image)
No. of the End
Point Image (The
Left Color Cam-
era Image)
1 2011_09_26_drive_0101_sync 0000000361 0000000816
2 2011_09_26_drive_0009_sync
0000000000
0000000405
3 2011_10_03_drive_0027_sync 0000000301
0000001610
4 2011_10_03_drive_0034_sync 0000000000
0000000899
5 2011_09_30_drive_0020_sync 0000000000
0000000834