momentum - investors.inmarsat.com · momentum inmarsat plc annual report and accounts 2016 inmarsat...
TRANSCRIPT

BUILDING
MO
MEN
TUM
INM
AR
SAT PLC AN
NU
AL REPORT AN
D ACCOU
NTS 2016
INM
AR
SAT PLC
ANN
UAL REPO
RT AND ACCO
UN
TS 2016

STRATEGIC REPORT
OVERVIEW
01 Investor proposition
01 Financial highlights
01 Business highlights
02 Group at a glance
04 Chairman’s statement
STRATEGY
06 Chief Executive’s strategic review
12 Our key performance indicators
14 Our markets
18 Our strategy
20 Our business model
22 Resources and relationships
Business reviews
28 Maritime
32 Enterprise
36 Aviation
40 Government
44 Central services
46 Chief Financial Officer’s review
50 Risk management
GOVERNANCE56 Corporate governance introduction
58 Board of Directors
61 Report of the Directors
65 Corporate governance report
78 Relations with shareholders
79 Directors’ Remuneration Report
103 Directors’ responsibility statement
FINANCIAL STATEMENTS104 Financial statements index
105 Independent Auditor’s report
112 Consolidated income statement
113 Consolidated statement of comprehensive income
114 Consolidated balance sheet
115 Consolidated statement of changes in equity
116 Consolidated cash flow statement
117 Notes to the consolidated financial statements
159 Company financial statements
161 Notes to the Company financial statements
162 Glossary
164 Additional information
INMARSAT IS THE LEADING PROVIDER OF GLOBAL, MOBILE SATELLITE COMMUNICATIONS SOLUTIONS.Our communications services are utilised by governments, commercial enterprises, particularly in the Maritime and Aviation industries, and humanitarian organisations across the world. Inmarsat’s wholly-owned and operated satellite constellations deliver unparalleled reliability to support mission-critical communications, ensure safety on land, at sea and in the air, drive innovation and bring new economic and social benefits to even the most isolated communities.
BUSINESS HIGHLIGHTS
Revenue and EBITDA growth driven by strong performances in Government and Aviation
Further foundations laid to maximise the opportunity in in-flight connectivity
Global Xpress gaining market traction, generating $78.5m of revenue in 2016
Tenure of the Group’s debt profile further lengthened
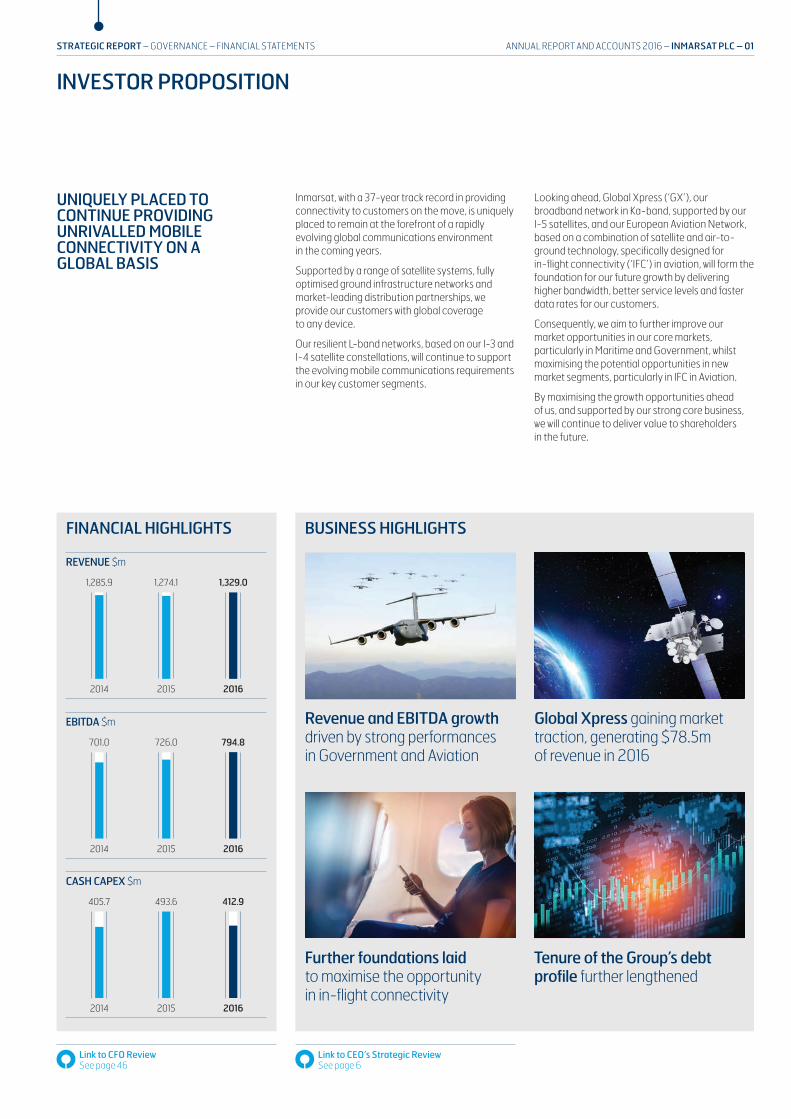
FINANCIAL HIGHLIGHTS
REVENUE $m
2014 2015 2016
1,285.9 1,274.1 1,329.0
EBITDA $m
2014 2015 2016
701.0 726.0 794.8
CASH CAPEX $m
2014 2015 2016
405.7 493.6 412.9
UNIQUELY PLACED TO CONTINUE PROVIDING UNRIVALLED MOBILE CONNECTIVITY ON A GLOBAL BASIS
Inmarsat, with a 37-year track record in providing connectivity to customers on the move, is uniquely placed to remain at the forefront of a rapidly evolving global communications environment in the coming years.
Supported by a range of satellite systems, fully optimised ground infrastructure networks and market-leading distribution partnerships, we provide our customers with global coverage to any device.
Our resilient L-band networks, based on our I-3 and I-4 satellite constellations, will continue to support the evolving mobile communications requirements in our key customer segments.
Looking ahead, Global Xpress (‘GX’), our broadband network in Ka-band, supported by our I-5 satellites, and our European Aviation Network, based on a combination of satellite and air-to-ground technology, specifically designed for in-flight connectivity (‘IFC’) in aviation, will form the foundation for our future growth by delivering higher bandwidth, better service levels and faster data rates for our customers.
Consequently, we aim to further improve our market opportunities in our core markets, particularly in Maritime and Government, whilst maximising the potential opportunities in new market segments, particularly in IFC in Aviation.
By maximising the growth opportunities ahead of us, and supported by our strong core business, we will continue to deliver value to shareholders in the future.
ANNUAL REPORT AND ACCOUNTS 2016 – INMARSAT PLC – 01STRATEGIC REPORT – GOVERNANCE – FINANCIAL STATEMENTS
INVESTOR PROPOSITION
Link to CFO Review See page 46
Link to CEO’s Strategic Review See page 6
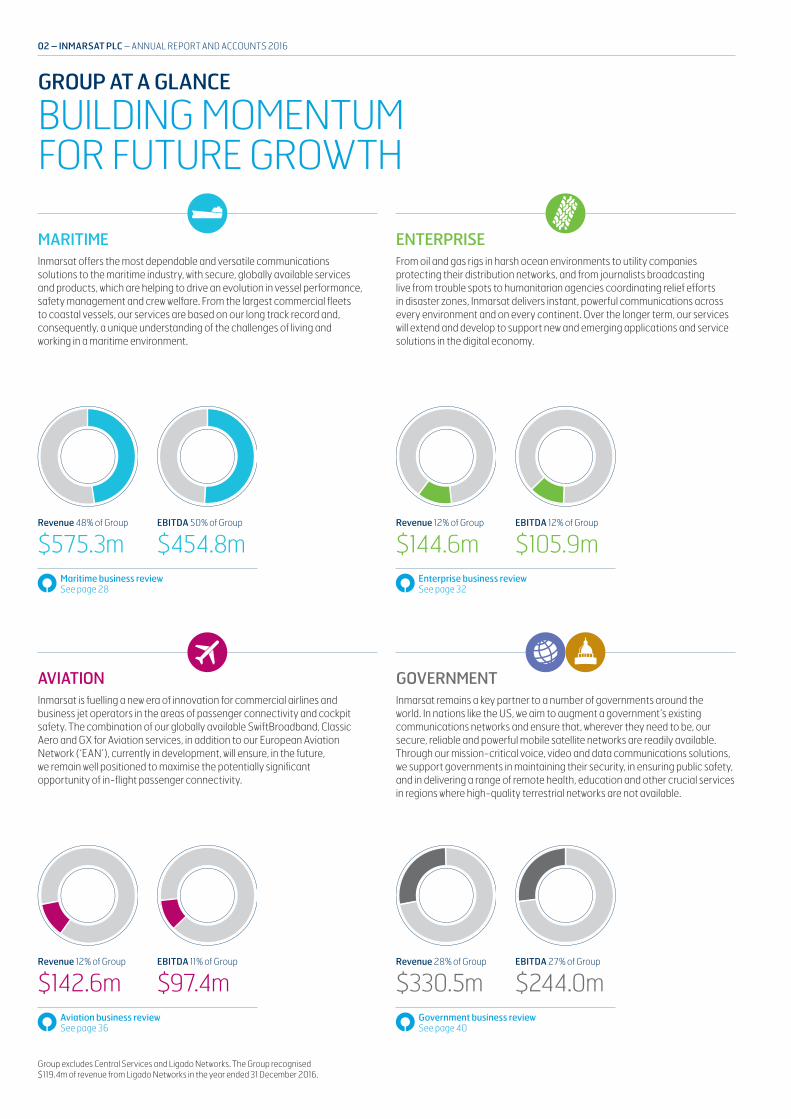
GROUP AT A GLANCE
BUILDING MOMENTUM FOR FUTURE GROWTH
MARITIMEInmarsat offers the most dependable and versatile communications solutions to the maritime industry, with secure, globally available services and products, which are helping to drive an evolution in vessel performance, safety management and crew welfare. From the largest commercial fleets to coastal vessels, our services are based on our long track record and, consequently, a unique understanding of the challenges of living and working in a maritime environment.
AVIATIONInmarsat is fuelling a new era of innovation for commercial airlines and business jet operators in the areas of passenger connectivity and cockpit safety. The combination of our globally available SwiftBroadband, Classic Aero and GX for Aviation services, in addition to our European Aviation Network (‘EAN’), currently in development, will ensure, in the future, we remain well positioned to maximise the potentially significant opportunity of in-flight passenger connectivity.
ENTERPRISEFrom oil and gas rigs in harsh ocean environments to utility companies protecting their distribution networks, and from journalists broadcasting live from trouble spots to humanitarian agencies coordinating relief efforts in disaster zones, Inmarsat delivers instant, powerful communications across every environment and on every continent. Over the longer term, our services will extend and develop to support new and emerging applications and service solutions in the digital economy.
GOVERNMENTInmarsat remains a key partner to a number of governments around the world. In nations like the US, we aim to augment a government’s existing communications networks and ensure that, wherever they need to be, our secure, reliable and powerful mobile satellite networks are readily available. Through our mission-critical voice, video and data communications solutions, we support governments in maintaining their security, in ensuring public safety, and in delivering a range of remote health, education and other crucial services in regions where high-quality terrestrial networks are not available.
Revenue 48% of Group
$575.3m
Revenue 12% of Group
$142.6m
Revenue 12% of Group
$144.6m
Revenue 28% of Group
$330.5m
EBITDA 50% of Group
$454.8m
EBITDA 11% of Group
$97.4m
EBITDA 12% of Group
$105.9m
EBITDA 27% of Group
$244.0m
Group excludes Central Services and Ligado Networks. The Group recognised $119.4m of revenue from Ligado Networks in the year ended 31 December 2016.
02 – INMARSAT PLC – ANNUAL REPORT AND ACCOUNTS 2016
Maritime business review See page 28
Aviation business review See page 36
Enterprise business review See page 32
Government business review See page 40

BUILDING MOMENTUM2016 was a crucial year for Inmarsat; one in which each of our businesses launched their market-specific Global Xpress services to the eager anticipation of our partners and end-user communities.
By the close of the year, the impact of Global Xpress was clear to see in the sectors we serve - on land, at sea and in the air.
Thousands of vessels, hundreds of aircraft and a broad spectrum of government users had committed to the Global Xpress revolution; true recognition of the game-changing impact that reliable, global, mobile, high-speed connectivity will have on the reach, operational efficiency and capabilities of their individual sectors.
Yet, as the promise of high-speed broadband has become a reality, we have continued to focus and invest in our future L-band franchise; a spectrum that holds strong promise in the rapidly expanding world of IoT and M2M.
Testament to this is the design of the Inmarsat-6 constellation, our first dual payload, covering both L-band and Ka-band spectrum. This underlines our long-term commitment to developing a new generation of advanced L-band services while the Ka-band co-payload adds depth to the capacity of the existing Global Xpress constellation.
2016 saw strong progress made in the development of Inmarsat’s European Aviation Network, a hybrid high-capacity S-band satellite and LTE-based ground network across Europe, which is set to be the most advanced, dedicated aviation passenger connectivity service in the world.
2016 was truly a year of building momentum for our future.
L-bandInmarsat-3
S-bandEAN
L-bandInmarsat-4
Ka-bandInmarsat-5
L and Ka-bandInmarsat-6
ANNUAL REPORT AND ACCOUNTS 2016 – INMARSAT PLC – 03STRATEGIC REPORT – GOVERNANCE – FINANCIAL STATEMENTS

2016 OVERVIEWAs I look back at our performance in 2016, we have seen further progress in many areas of our business as we put in place the building blocks needed to support our growth ambitions. At the same time we have experienced a more volatile share price, primarily driven by a derating of the satellite sector during the course of the year. We remain committed to delivering the best value over time for our shareholders and other stakeholders, as we invest to achieve growth in the future.
In my 2015 Chairman’s Statement, I referred to that year as being one of transition, preparation and investment in the next phase of our growth and that our diversified business model provided an important equilibrium in our overall financial performance. I am pleased that the plans laid out in 2015 have come through in 2016 with our Global Xpress high-speed Ka-band broadband service being introduced globally, steady progress in the IFC market, a significant step up in the payments from Ligado and the continued build out of our European Aviation Network and Inmarsat-6 satellite constellations. We remain confident that the growth potential for these services present a strong opportunity to grow our overall profits.
In our CEO, Rupert Pearce’s section, he describes how we are evolving our strategy towards becoming a digital services enabler. Our purpose is changing. We were created to save lives at sea, and later to support aviation safety, and that is still a fundamentally important part of what we do today. In both of these areas we have continued
to invest in enhanced and new services to ensure that seafarers and aircraft, flying over oceans and remote areas globally, have the benefit of the latest technologies to keep them safe. Every day we also connect millions of people around the world on land, at sea, and increasingly, in the air. Our current investments in satellite and infrastructure platforms will enable us to make a real contribution to digital society across the world. This will allow us to ride the wave of these developments in a way that mobile satellite services can uniquely serve.
Our focus remains on serving customers in remote environments with uniform global mobile or portable connectivity that is highly reliable. These customers want to enjoy the same connectivity experience wherever they are – whether these are for mission critical activities or for business as usual corporate operations – and we can deliver this for them.
The nature of our business requires us to carefully invest in new satellite constellations, products and services. As our portfolio has grown, these multi-million dollar investments have been overlapping more and becoming more spread out over time, leading to less volatility in our capital expenditure. All of our investments are subject to a rigorous review process to ensure that we have sound expectations concerning future financial returns for these investments.
CHAIRMAN’S STATEMENT
MAINTAINING CONFIDENCE IN THE FUTURE
“WE ARE WELL POSITIONED TO GROW PROFITABLY IN THE YEARS AHEAD.”
HIGHLIGHTS
> Dividend increases for 11th consecutive year
> New Board members contributing well
> Our thanks to two long-serving Board members as they retire
> Our strategy is evolving to being a digital services enabler
> Safety services on the sea and in the air remain part of our core purpose
Andrew SukawatyChairman
04 – INMARSAT PLC – ANNUAL REPORT AND ACCOUNTS 2016
Governance See page 56

My 2015 Chairman’s statement referenced our achievement in increasing dividend payments in each year since we listed in 2005. We increased our interim 2016 dividend paid in October 2016 and have recommended a 5% increase in the final dividend to be paid in May 2017. We have determined that this is the right level of dividend having regard to the medium-term outlook for the business.
BOARD ACTIVITIESDuring 2016, we have seen the two Board members who joined in 2015 – Mr Robert Ruijter and Dr Hamadoun Touré – settle into the rhythm of meetings and discussions. We are also pleased to have added a new Board member – Philippa McCrostie – in September 2016. Pip, who was previously Global Vice Chair of Transaction Advisory Services, one of EY’s four global businesses, has joined our Audit Committee and her biography can be found on page 60.
Our thanks go to two long-standing Board members who retired from the Board in 2017. Stephen Davidson, who joined the Board when we became a public company in 2005 and was our Remuneration Committee Chairman for the majority of that time, retired in January 2017. Kathleen Flaherty, who joined the Board in 2006, retired on 2 March 2017. They were both supportive members of our Board and challenged management thinking which contributed greatly to our strategic discussions and decisions. We are grateful for their contributions.
Our Board is diverse in experience, gender and nationality. This diversity contributes to creating a Board which materially adds to the development of our strategy. For a global company in a high tech business, we believe this is essential. More details about the mix of our Board can be found on page 60.
We completed an external Board evaluation in 2015, so our review in 2016 was carried out internally. More detail about this is provided in the Corporate Governance Report on page 71. In summary, we have responded to some of the areas raised in 2015 and the overarching view is that the Board continues to operate extremely well. The newer Board members are contributing strongly and the continuity of maintaining some longer- serving Directors alongside the appointment of new ones has served the Company and the Board well.
PERFORMANCEIn 2016, both of our government businesses grew, mainly reflecting the take up of our new Global Xpress services. This was achieved despite a difficult market in which governments have generally reduced their budgets. Our maritime business introduced the maritime variant of Global Xpress – Fleet Xpress – to the market, enabling its customers to benefit from higher-broadband speeds and the market-leading reliability of our L-band service. Aviation continues to be our highest growth segment supported by strong performance from our business and general aviation and safety services and an area we are investing in. Aviation opportunities for IFC continue to develop, with airline customers committing to our Ka-band Global Xpress service and/or our soon to be launched European Aviation Network, a world-leading innovation providing broadband Wi Fi to passengers across Europe.
Progress in 2016 was, however, slower than expected with Aviation customers taking longer than expected to close their negotiations for new long-term cabin connectivity deals and GX requiring a longer period of on-the-ground operational introduction. Consequently, our revenues were lower than expected in 2016. We countered these headwinds with ongoing tight control of our costs and capital expenditure and a successful outcome on our US cooperation agreement with Ligado, leading to improved revenues, EBITDA and free cash flow over 2015. Currency movements were also favourable.
The Board and I continue to believe that we are well positioned as a Company to grow profitably in the years ahead. We are fully funded for our immediate investment needs, partly because of two successful bond offerings we completed in 2016 which raised over $1bn. We have a strategy which drives our business forward over the coming years to position us as a digital services enabler. We are committed to achieving our ambitions which will create a strong and attractive business for our staff; improved financial results and value for our shareholders several of whom have been invested with us since our IPO and to whom we are grateful for their support and loyalty; and an eco-system who will want to work with us to provide innovative platforms and solutions for the future, and our partners who work with us to deliver these services across the globe to customers who need reliable, cost-effective communications. We would also like to thank our global staff who continue to be committed to delivering highly reliable innovative services to serve mission critical needs that our customers depend on from Inmarsat.
ANDREW SUKAWATYChairman
8 March 2017
GOVERNANCE AT WORKWe have had a larger Board to allow new Directors to benefit from the experience of longer-serving colleagues. This has been of help to the Board’s performance and commented on positively by the Directors as part of the 2016 Board evaluation process.
ANNUAL REPORT AND ACCOUNTS 2016 – INMARSAT PLC – 05STRATEGIC REPORT – GOVERNANCE – FINANCIAL STATEMENTS
Governance See page 56

CHIEF EXECUTIVE’S STRATEGIC REVIEW
STRONG CORE BUSINESS EXCITING FUTURE
Rupert PearceChief Executive Officer
EXECUTIVE MANAGEMENT BOARDChaired by Rupert Pearce, the Executive Management Board focuses on managing Inmarsat’s business affairs as a whole, which includes the delivery of a competitive strategy, developing our financial structure and operational planning, driving financial performance and successful business outcomes as well as harnessing the talent of our global workforce.
Leo MondalePresident, Aviation Business Unit
Jason SmithChief Operations Officer
Ronald SpithoutPresident, Maritime Business Unit
Andy StartPresident, Global Government Business Unit
Tony BatesChief Financial Officer
Paul GudonisPresident, Enterprise Business Unit
Michele FranciChief Technology Officer
Peter HadingerPresident, US Government Business Unit
Rupert PearceChief Executive Officer
Alison HorrocksChief Corporate Affairs Officer and Company Secretary
Natasha DillonChief People Officer
Philip BalaamChief Strategy and Marketing Officer
2016 has been a year where we have continued to lay the foundations for future growth. I look forward to 2017 being a year of transformation. We have continued to build upon the roll-out of our Global Xpress services and put in place building blocks for the expansion of future services across all our business sectors. These actions will support our strategy to become a digital services enabler over the coming years.
OVERVIEWA slow finish to the end of 2015 meant a lack of momentum entering 2016 and consequently a disappointing first quarter in terms of financial performance. By the second quarter, we were performing better and finished the year well. This was overall an encouraging performance in a market environment that continues to be attritional, with negligible sector growth and downwards pressure on service pricing.
We have started to generate revenues from our Global Xpress broadband services and have made continued progress in the positioning of our L-band services for complementary revenue growth, and alongside this we are continuing to invest in our support for innovative solutions and products. Our diversified business model continues to be one of our strengths, allowing us to benefit from opportunities in one area if another is affected by a business downturn and to stay the course through business downcycles in our core sectors.
The anticipation of additional satellite capacity in adjacent markets may affect our own global mobility markets. We therefore regularly review how we respond to this new market dynamic and make our services relevant to our partners and customers as they consider their buying patterns and needs.
The geo-political environment also provides uncertainty as to the performance of global markets. We are globally dispersed and the majority of our revenues are denominated in USD which provided us with some financial benefit in 2016; this protected us from some of the issues other UK companies had following the Brexit decision. We are watchful as to how we may be affected as geo-political activities occur.
2016 saw several changes in our executive management board, with Debbie Jones, Ruy Pinto, Pat McDougal and Chris McLaughlin – after long and illustrious careers at Inmarsat – all retiring or moving on at the year end or shortly afterwards. We thank them for their contributions and for the foundations for growth that each has helped Inmarsat establish. We are also delighted to welcome Natasha Dillon (Chief People Officer), Jason Smith (Chief Operations Officer) and Phil Balaam (Chief Strategy and Marketing Officer) as their replacements. We intend shortly to add a Chief Digital Officer to lead our digital strategy.
06 – INMARSAT PLC – ANNUAL REPORT AND ACCOUNTS 2016
Governance See page 67
I was delighted with the successful capital raising last year – we raised over $1bn through convertible bond and high-yield bond offerings – as new and replacement capital. We repaid some more expensive debt and the new funding allows us to continue to invest for growth. Our access to capital remains strong and our current financial position is well structured.
BUSINESS ACTIVITYDuring the first quarter we took the difficult decision to delay the launch of Fleet Xpress (‘FX’), which is our maritime GX variant, to the maritime industry, because we felt that certain aspects of the service needed further time to bed down (which is not uncommon for the launch of a new service). We also experienced a slowdown in our maritime XpressLink (‘XL’) service which had been offered as a ‘bridge-to-GX’ during the year, as customers opted to wait for FX instead of installing XL, which caused a loss of momentum in our maritime business in Q2 and Q3. Despite ongoing pricing pressures and recession in the global shipping industry, with the launch of FX in April, we had recovered a lot of that momentum by the end of the year. We remain confident in the growth prospects of FX, especially as we signed three major FX strategic partnerships in the year, with Marlink, Speedcast and Navarino. We are also excited about the long-term prospects of Fleet One, which stimulates the reorientation of our L-band business towards smaller vessels.
Unaffected by the delay in the launch of FX commercial services, our Government business units delivered a strong performance in the year, demonstrating a welcome return to year-on-year growth, with a particularly strong performance in the fourth quarter as a result of a short-term one-off bandwidth contract. Despite ongoing budget constraints globally, our strategy to internationalise, diversify and innovate continues to bear fruit. We believe we are well placed to benefit from the likely desire of governments around the world to enlarge their relationship with commercial providers to deliver next generation satellite communications services.
2016 was a year in which we made significant investment in in-flight connectivity or IFC, a rapidly emerging new market adjacent to our legacy aviation markets. Recognising the fact that we are in an intense market capture period of potentially short duration, we have been building our own downstream sales, marketing and service delivery capability to ensure that we cover the emerging global marketplace alongside those of our legacy channel partners whose capabilities can extend from our legacy aviation businesses to IFC. While this has impacted EBITDA in the short term, we believe it will deliver sustained enhanced revenue and EBITDA growth in the years to come. Although it is complex and time-consuming to win IFC
tenders and progress them into contract, we believe we are competing well for new business and we were thrilled to win several new Deutsche Lufthansa (‘DLH’) group airlines, as well as Norwegian Air Shuttle and Air New Zealand in 2016. As we move into 2017 DLH is now active in installing their planes with GX for Aviation, the aviation variant of our Ka-band GX service.
Our core L-band aviation business, covering business aviation and safety and operations services performed very creditably and both segments have growth potential in the years to come.
Our Enterprise business did not show revenue growth in 2016, as some of our longer-serving products became less competitive and pricing pressures grew in some of our key markets. We responded by restructuring our business unit to focus on emerging market verticals, accelerating our innovation and business development activities, and looking to extend our international footprint by moving into new geographies. We believe those initiatives will start to bear fruit in 2017. We are also looking at opportunities in the transportation market, particularly as regards the ‘connected car’.
Elsewhere, we restructured our commercial relationship with Ligado, putting this long-enduring and important partnership onto a sound footing in support of Ligado’s emergence from bankruptcy protection. We have a cooperation agreement with Ligado for them to use some of our satellite spectrum over North America. We believe the restructuring will be beneficial to both parties,
with Ligado benefiting from significant deferred payments and Inmarsat benefiting from enhanced spectrum usage and a delayed transition timetable.
We remain very busy delivering our future networks. In 2016 we continued to advance our European Aviation Network which is a ground-breaking hybrid satellite/air-to-ground network serving the European short haul IFC market. We have completed our fourth Inmarsat-5 and are building the first two Inmarsat-6 satellites (which we plan to launch in 2020 and beyond). It was disappointing that neither our S-band satellite (which will support the EAN) nor Inmarsat-5 F4 were launched in the year, but delays are endemic in the satellite launch industry and we are advised that each are on schedule for launch in the first half of 2017. I was proud of the agility with which my team moved to another launch provider, Arianespace at the end of the year, to protect the launch timetable for our S-band satellite.
At the same time, we continue to progress the creation of our digital services platform, which is designed to augment our L-band and broadband communication services with an array of value-added solutions, applications and other digital products targeted at our end user communities. We hope these will open up the prospect of enabling innovative big data analytics and services creating enhanced value for users. We remain on track to introduce this platform in late 2017 and some first generation services are already beginning to be brought to market.
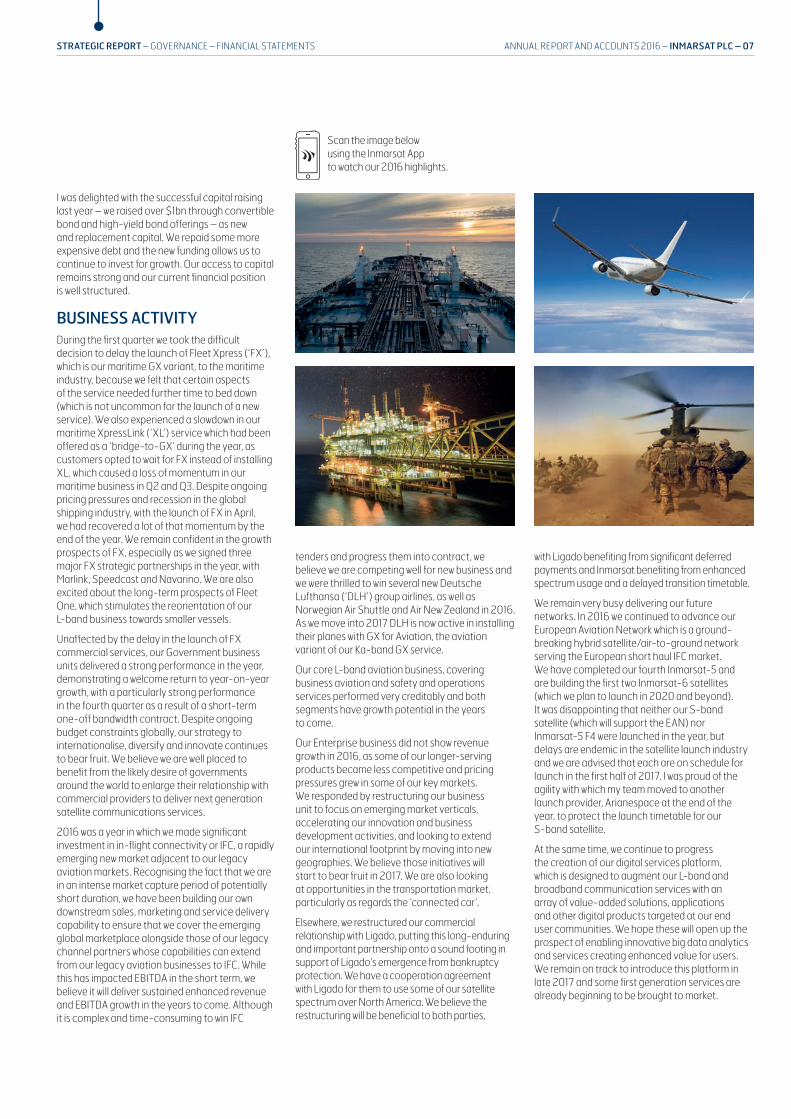
Scan the image below using the Inmarsat App to watch our 2016 highlights.
ANNUAL REPORT AND ACCOUNTS 2016 – INMARSAT PLC – 07STRATEGIC REPORT – GOVERNANCE – FINANCIAL STATEMENTS
INMARSAT 2016 AWARDS
DECEMBER
USG wins 2016 Homeland Security Award for Best Satellite Based Broadband Communications Solution for Global Xpress
NOVEMBER
Maritime shortlisted for SMART4SEA Excellence Award for Fleet Xpress with confirmation of winning the award received in January 2017
Vladimir Maksimov wins posthumous H.E.R.O. Lifetime Achievement Award for maritime safety at the inaugural International Maritime Rescue Federation (‘IMRF’) H.E.R.O. (Honouring Excellence in Rescue Operations) Awards 2016
SEPTEMBER
Inmarsat is named Global Satellite Operator of the Year at Euroconsult’s 13th Annual Awards for Excellence in Satellite Communications
JULY
The Inmarsat team that worked on the search for the missing Malaysian airliner MH370 was awarded the prestigious Michael Richey Medal by the Royal Institute of Navigation
MARCH
Joseph Teixeira, Inmarsat’s Vice President of Aviation Safety and Cybersecurity, was awarded one of the highest accolades in aviation safety at the National Air Traffic Controllers Association (‘NATCA’)’s Communicating for Safety conference – the James L. Oberstar Sentinel of Safety Award
Global Xpress wins Government Mobility Satcom Innovation award at the Mobile Satellite Users Association (‘MSUA’) Mobility Satellite Innovation Awards at SATELLITE 2016
STRATEGYFive years ago we articulated a clear strategy based on our need to:
> drive into broadband services with GX by transitioning core customers, adding new ones in our core markets and diversifying into new broadband markets
> reorient the use of our L-band capacity to target new growth opportunities by leveraging off the differentiated strengths of our L-band networks and
> fuel both of the above with the introduction of a new solutions platform and ecosystem
We have now added three elements:
> A vision that explains what we’re doing on strategy in its wider societal setting. The emerging digital world (‘the gigabit society’) is important as we see our current and future services are of increasing relevance to the world and we can play an important role in the foundations and functioning of a new digital world
> Greater expansion on the areas of strategic relevance to us in deploying our strategic vision and plan under the headings of Best Networks, Best Solutions, Best Distribution and Best Workplace. These elements enable us to create a more developed roadmap for the implementation of the strategy
> An evolution of our strategy since 2012 because we now position the journey as one from having been a mobile satellite operator to becoming a digital services enabler. We recognise that steps along the strategic roadmap have changed our business and they have created new opportunities, some of which are already in focus such as GX and EAN
The emerging digital society is a global society founded on ultra-connectivity. The extraordinary proliferation of smart mobile devices is expected to grow materially over the next few years from more than 5 billion globally today to more than 20 billion in only a few years.
This growth is substantially fuelled by smart machines or sensors, driving the emerging ‘Internet of Things’ or IoT, in which machines communicate autonomously with each other to run our world. This generates enormous quantities of data which is captured, analysed and turned into actionable intelligence and then acted upon, delivering the so-called ‘big data revolution’.
In this fast changing ultra-connected world of smart machines, connectivity is becoming a crucial enabler and not just a cost. Mobile satellite services are becoming more and more relevant as a connectivity medium for this emerging gigabit society. The global coverage, high levels of reliability and security, mobility, precision navigation and broadcast services that Inmarsat can offer our end customers, especially in a form readily integrable with terrestrial technologies, means that we are well-placed to play a powerful and important role in supporting and empowering this emerging digital society.
The roadmap for supporting our strategy focuses on four complementary pillars:
BEST NETWORKS TO HAVE THE HIGHEST QUALITY, CUTTING-EDGE INTEGRATED GLOBAL NETWORKS.
BEST SOLUTIONS TO HAVE THE HIGHEST QUALITY UNIQUE SOLUTIONS PLATFORM.
BEST DISTRIBUTION TO HAVE GLOBAL REACH TO DELIVER VALUE-ADDED CUSTOMER OUTCOMES VIA MARKET INTIMACY.
BEST WORKPLACE TO BE PASSIONATE, OPEN, ENTERPRISING AND EASY TO DO BUSINESS WITH.
The next sections reflect what each of these means, and how they support our ambitions.
CHIEF EXECUTIVE’S STRATEGIC REVIEW CONTINUED
Awards inmarsat.com/awards
08 – INMARSAT PLC – ANNUAL REPORT AND ACCOUNTS 2016

BEST NETWORKS
WHAT DOES THIS MEAN?
> Deliver on the promise of the first version of Global Xpress through our first four Ka-band satellites. We are already planning through the Inmarsat-6 satellite programme what can be provided which will allow us to serve our customers well. We want to future-proof our GX services
> Reinvigorate our L-band network. We want to see in use very small, highly resilient, cheap devices, passing small amounts of data at reasonable data speeds. We are going to re-invigorate and re-orientate our L- band networks through Inmarsat-6 and other programmes
> Deliver the European Aviation Network which uses the S-band satellite for the satellite component of this service, and working with Deutsche Telekom to deliver the complementary ground network. We are already looking at extending the European Aviation Network inside the greater European landmass so that countries on the edges of the European Community can benefit from this new service
> Enhance the openness of our networks through network architecture and provide rich capabilities in edge devices which provide an entry point into our networks. We have done that already with the BGAN Radio Module and also the Network Service Device for the Global Xpress service and its successor which is the software version of that device
BEST SOLUTIONS
WHAT DOES THIS MEAN?
> We want to deliver a high-quality, reliable, value added Inmarsat Gateway platform delivering multiples of cutting-edge solutions and services in a very tailored way to all of the communities we serve
> We also want to develop a powerful, diverse, global, innovative and relevant Inmarsat solutions ecosystem. We will support certified application partners, digital service providers, original equipment manufacturers (‘OEMs’) who want to invest in solutions development, services enablement and other digital tools and capabilities
> We may develop our own value added digital services and solutions if the market is not served and where we cannot find the partners to work with us to do so
> We are going to digitise Inmarsat’s core business and operations as well which will improve the interface with our partners and broader ecosystem
BEST DISTRIBUTION
WHAT DOES THIS MEAN?
> We want to deliver core capabilities in rich value added ways for our customers and to offer something more than the provision of airtime
> We want to be proactive to solve customer problems, working with partners and customers to understand issues and how we can provide a way to work together
> We will focus on indirect distribution to market for all of our target markets. We want to reinvigorate our channel ecosystem for new growth. We may have additional partners such as application partners or OEMs
> We want to drive enhanced value to our channel which means we are focusing in the years to come on strategic relationships. We are keen to encourage partners to create and accelerate new ideas which can be worked on collaboratively leading to success for them and Inmarsat
BEST WORKPLACE
WHAT DOES THIS MEAN?
> We need to hire talented individuals
> We must train, inspire and empower our global workforce and do this by having appropriate learning and development opportunities
> We need to deliver first-class systems, processes and working practices to support our employees which in turn will improve efficiencies for our partners. Our Streamline Programme, with a simplified legal agreement, the creation of a product and price master file and improved customer portals, will make it easier for our partners to do business with us
> We are also investing in modern, agile and collaborative working environments. In 2016 we successfully transformed several of our offices located in key hubs. Some key offices will undergo the same treatment in 2017 and we are also investing in our London HQ building in what will be a multi-year programme to create a modern working environment befitting all who work in or visit the building
ANNUAL REPORT AND ACCOUNTS 2016 – INMARSAT PLC – 09STRATEGIC REPORT – GOVERNANCE – FINANCIAL STATEMENTS

KEY PRIORITIES FOR 2017With a diversified business, we have multiple priorities which run across all aspects of our business activities and I’ve highlighted a few below. Some relate to how we target our markets and revenue opportunities; others are about how we can improve our business activities to the benefit of multiple stakeholders and also recognise the investment in our staff and their contribution.
> GX ramp up: demonstrate strong revenue growth across all markets with particular focus on success in our Maritime markets
> In-flight connectivity: demonstrate we can be a leading player by winning new orders, moving current orders into installation and delivering the EAN into commercial service
> Digital transformation: put in place the key building blocks to deliver our digital strategy
> China: accelerate our activities in this key market; particularly the emerging in-flight connectivity opportunity
> Connected car: look at how we can participate in this market to serve the transport industry
> Enterprise Business Unit: re-energised with the critical identified market sub-sectors starting to deliver profitable growth
> Operational systems: with a significant project called ‘OneIT’ moving into its second year, we need to continue to deliver on the multiple projects to improve our operational activities within OneIT to benefit our partners, customers and staff
> Process excellence: we need to improve the quality and visibility of our core business processes to simplify the way we work and make it easier for our customers to work with us
> Workplace improvement: our focus will be on new offices in important hubs and the start of the re-development of our global HQ in London
> Our people: are integral to the success of our strategy and during 2017 we will be redefining and updating our employee value proposition
CHIEF EXECUTIVE’S STRATEGIC REVIEW CONTINUED
OUTLOOK FOR 2017I believe Inmarsat has multiple opportunities to further develop its business in 2017 and we remain confident about the medium to long-term outlook for our business.
We see there is long-term growth in the demand for satellite communications services which can be met through our multiple service offerings. The market-leading global broadband capabilities of GX, our unique position within Aviation, the resilience and differentiation of our L-band franchise, the power of our global distribution channels and our full-service global mobile offer together strongly position Inmarsat in our chosen markets.
We have identified our priorities, we are making improvements in how we deliver our services and upgrading our processes and systems. Our employees are talented and are committed to supporting our future ambitions. We work with an innovative and creative ecosystem and look forward to developing these relationships.
I would like to thank our staff and partners for their support, engagement and enthusiasm during 2016. We are committed to delivering value to our shareholders and all stakeholders.
RUPERT PEARCEChief Executive Officer
8 March 2017
MARITIME CASE STUDY:FISHING IN FUJIAN PROVINCEFishing in Fujian Province, on China’s southeastern coast, accounts for around 30% of the province’s agricultural GDP, while more than 420,000 fishermen and their families depend on fishing and aquaculture for a living. Over the years, extreme weather and competition with nearby countries for fish has led to substantial falls in viable stocks.
As such, the Chinese Government has sought to significantly improve the fisheries management of the region. It turned to Inmarsat and its Chinese manufacturing partner Chengdu Spaceon to develop a satellite terminal that not only can track and monitor the fishing vessels to prevent overfishing but provides a constant line of communication so that any boat in distress can seek help.
Scan the image above using the Inmarsat App to view Maritime content
10 – INMARSAT PLC – ANNUAL REPORT AND ACCOUNTS 2016

ENTERPRISE CASE STUDY:DELIVERING HEALTHCARE TO THE REMOTEST COMMUNITIESThe charity SOS Children launched a community health project to identify chronic diseases amongst isolated villagers in Benin, West Africa. Inmarsat’s BGAN Link service was used to transmit medical data for immediate diagnosis by urban hospital doctors, meaning patients could begin treatment straightaway.
In the first three months alone, the telemedicine initiative saw more than 850 men, women and children visit the two temporary clinics. Doctors were able to remotely diagnose instances of diabetes, hypoglycemia, hypertension and other conditions, with 70 individuals receiving immediate treatment due to the serious nature of their condition. Due to its success, the project is still in operation today.
Scan the image above using the Inmarsat App to view Enterprise content
AVIATION CASE STUDY:A NEW GENERATION OF AVIATION SAFETY SERVICESHawaiian Airlines is the first commercial airline to install Inmarsat’s next generation SwiftBroadband-Safety system. The service provides ‘always on’ high-speed broadband connectivity directly to the cockpit. This means the plane and air traffic control are in constant contact leading to vastly improved aircraft position reporting and tracking.
SwiftBroadband-Safety’s connectivity also gives pilots access to real-time weather updates, so they can better avoid storms and turbulence, as well as receive the latest data on the aircraft’s performance, helping them plot more efficient routes and save fuel.
Scan the image above using the Inmarsat App to view Aviation content
GOVERNMENT CASE STUDY:ELECTIONS IN BRAZILBrazil has been a pioneer in electronic voting systems since the 1990s as it sought to address the huge problems facing its electoral process, including endemic fraud in the paper ballot, electoral inaccessibility and a lengthy counting process.
In recent elections, the country worked with Inmarsat to make sure that voters in even its most remote regions were able to cast their vote. Inmarsat BGAN terminals were set up in over 1,000 polling stations in some of the most inaccessible parts of the country so that the ballot results could be rapidly transmitted to the Brazilian Superior Electoral Court via a secure private network.
It meant the time to count all the votes was cut by two-thirds, enabling the result to be announced on the same day for the first time.
Scan the image above using the Inmarsat App to view Government content.
ANNUAL REPORT AND ACCOUNTS 2016 – INMARSAT PLC – 11STRATEGIC REPORT – GOVERNANCE – FINANCIAL STATEMENTS

KEY PERFORMANCE INDICATORS
CONTINUED PROGRESS
KPI WHY IT IS IMPORTANT PERFORMANCE LINK TO RISKS AND REMUNERATION
FINANCIAL KPIs
REVENUEDefinition: Total Group revenue generated from operations including Ligado Networks
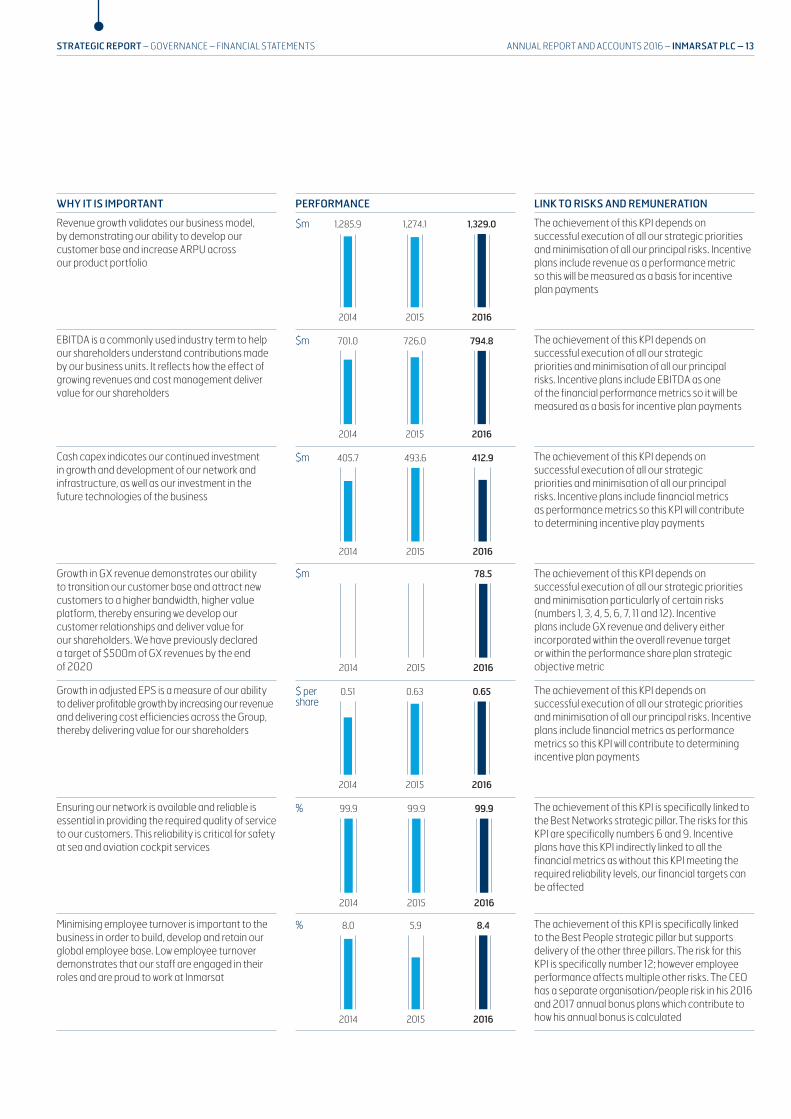
Revenue growth validates our business model, by demonstrating our ability to develop our customer base and increase ARPU across our product portfolio
$m
2014 2015 2016
1,285.9 1,274.1 1,329.0 The achievement of this KPI depends on successful execution of all our strategic priorities and minimisation of all our principal risks. Incentive plans include revenue as a performance metric so this will be measured as a basis for incentive plan payments
EBITDA1
Definition: Total Group profit before net financing costs, taxation, depreciation and amortisation, gains/losses on disposal of assets, impairment losses and share of profit of associates
EBITDA is a commonly used industry term to help our shareholders understand contributions made by our business units. It reflects how the effect of growing revenues and cost management deliver value for our shareholders
$m
2014 2015 2016
701.0 726.0 794.8 The achievement of this KPI depends on successful execution of all our strategic priorities and minimisation of all our principal risks. Incentive plans include EBITDA as one of the financial performance metrics so it will be measured as a basis for incentive plan payments
CASH CAPEX1
Definition: Cash capital expenditure is the cash flow relating to tangible and intangible asset additions; it includes capitalised labour costs and excludes capitalised interest
Cash capex indicates our continued investment in growth and development of our network and infrastructure, as well as our investment in the future technologies of the business
$m
2014 2015 2016
405.7 493.6 412.9 The achievement of this KPI depends on successful execution of all our strategic priorities and minimisation of all our principal risks. Incentive plans include financial metrics as performance metrics so this KPI will contribute to determining incentive play payments
GX REVENUEDefinition: Revenue generated from the sale of airtime and other related services on the Global Xpress network
Growth in GX revenue demonstrates our ability to transition our customer base and attract new customers to a higher bandwidth, higher value platform, thereby ensuring we develop our customer relationships and deliver value for our shareholders. We have previously declared a target of $500m of GX revenues by the end of 2020
$m
2014 2015 2016
78.5 The achievement of this KPI depends on successful execution of all our strategic priorities and minimisation particularly of certain risks (numbers 1, 3, 4, 5, 6, 7, 11 and 12). Incentive plans include GX revenue and delivery either incorporated within the overall revenue target or within the performance share plan strategic objective metric
ADJUSTED EPSDefinition: Adjusted Group profit after tax attributable to equity holders of the Company divided by the weighted average number of shares in issue (excluding shares held by the employee trust)
Growth in adjusted EPS is a measure of our ability to deliver profitable growth by increasing our revenue and delivering cost efficiencies across the Group, thereby delivering value for our shareholders
$ pershare
2014 2015 2016
0.51 0.63 0.65 The achievement of this KPI depends on successful execution of all our strategic priorities and minimisation of all our principal risks. Incentive plans include financial metrics as performance metrics so this KPI will contribute to determining incentive plan payments
NON-FINANCIAL KPIs
SATELLITE NETWORK AVAILABILITYDefinition: Ongoing investment in our space and ground infrastructure ensures that customers are supported by an overall 99.9% L-band network availability which meets the GMDSS requirements set by the International Maritime Organization
Ensuring our network is available and reliable is essential in providing the required quality of service to our customers. This reliability is critical for safety at sea and aviation cockpit services
%
2014 2015 2016
99.9 99.9 99.9 The achievement of this KPI is specifically linked to the Best Networks strategic pillar. The risks for this KPI are specifically numbers 6 and 9. Incentive plans have this KPI indirectly linked to all the financial metrics as without this KPI meeting the required reliability levels, our financial targets can be affected
EMPLOYEE TURNOVERDefinition: Employee turnover is calculated as the number of leavers in a year (excluding redundancies and contingency workers) divided by the average headcount during the year
Minimising employee turnover is important to the business in order to build, develop and retain our global employee base. Low employee turnover demonstrates that our staff are engaged in their roles and are proud to work at Inmarsat
%
2014 2015 2016
8.0 5.9 8.4 The achievement of this KPI is specifically linked to the Best People strategic pillar but supports delivery of the other three pillars. The risk for this KPI is specifically number 12; however employee performance affects multiple other risks. The CEO has a separate organisation/people risk in his 2016 and 2017 annual bonus plans which contribute to how his annual bonus is calculated
Our KPIs are fundamentally connected with our key strategic priorities, and therefore help us to measure our success in delivering these priorities, which are:
BEST NETWORKS TO HAVE THE HIGHEST QUALITY, CUTTING-EDGE INTEGRATED GLOBAL NETWORKS.
BEST SOLUTIONS TO HAVE THE HIGHEST QUALITY UNIQUE SOLUTIONS PLATFORM.
BEST DISTRIBUTION TO HAVE GLOBAL REACH TO DELIVER VALUE-ADDED CUSTOMER OUTCOMES VIA MARKET INTIMACY.
BEST WORKPLACE TO BE PASSIONATE, OPEN, ENTERPRISING AND EASY TO DO BUSINESS WITH.
1 These non-statutory measures have been reconciled to statutory measures of profit after tax and balance sheet additions in note 5 on page 125
12 – INMARSAT PLC – ANNUAL REPORT AND ACCOUNTS 2016
KPI WHY IT IS IMPORTANT PERFORMANCE LINK TO RISKS AND REMUNERATION
FINANCIAL KPIs
REVENUEDefinition: Total Group revenue generated from operations including Ligado Networks
Revenue growth validates our business model, by demonstrating our ability to develop our customer base and increase ARPU across our product portfolio
$m
2014 2015 2016
1,285.9 1,274.1 1,329.0 The achievement of this KPI depends on successful execution of all our strategic priorities and minimisation of all our principal risks. Incentive plans include revenue as a performance metric so this will be measured as a basis for incentive plan payments
EBITDA1
Definition: Total Group profit before net financing costs, taxation, depreciation and amortisation, gains/losses on disposal of assets, impairment losses and share of profit of associates
EBITDA is a commonly used industry term to help our shareholders understand contributions made by our business units. It reflects how the effect of growing revenues and cost management deliver value for our shareholders
$m
2014 2015 2016
701.0 726.0 794.8 The achievement of this KPI depends on successful execution of all our strategic priorities and minimisation of all our principal risks. Incentive plans include EBITDA as one of the financial performance metrics so it will be measured as a basis for incentive plan payments
CASH CAPEX1
Definition: Cash capital expenditure is the cash flow relating to tangible and intangible asset additions; it includes capitalised labour costs and excludes capitalised interest
Cash capex indicates our continued investment in growth and development of our network and infrastructure, as well as our investment in the future technologies of the business
$m
2014 2015 2016
405.7 493.6 412.9 The achievement of this KPI depends on successful execution of all our strategic priorities and minimisation of all our principal risks. Incentive plans include financial metrics as performance metrics so this KPI will contribute to determining incentive play payments
GX REVENUEDefinition: Revenue generated from the sale of airtime and other related services on the Global Xpress network
Growth in GX revenue demonstrates our ability to transition our customer base and attract new customers to a higher bandwidth, higher value platform, thereby ensuring we develop our customer relationships and deliver value for our shareholders. We have previously declared a target of $500m of GX revenues by the end of 2020
$m
2014 2015 2016
78.5 The achievement of this KPI depends on successful execution of all our strategic priorities and minimisation particularly of certain risks (numbers 1, 3, 4, 5, 6, 7, 11 and 12). Incentive plans include GX revenue and delivery either incorporated within the overall revenue target or within the performance share plan strategic objective metric
ADJUSTED EPSDefinition: Adjusted Group profit after tax attributable to equity holders of the Company divided by the weighted average number of shares in issue (excluding shares held by the employee trust)
Growth in adjusted EPS is a measure of our ability to deliver profitable growth by increasing our revenue and delivering cost efficiencies across the Group, thereby delivering value for our shareholders
$ pershare
2014 2015 2016
0.51 0.63 0.65 The achievement of this KPI depends on successful execution of all our strategic priorities and minimisation of all our principal risks. Incentive plans include financial metrics as performance metrics so this KPI will contribute to determining incentive plan payments
NON-FINANCIAL KPIs
SATELLITE NETWORK AVAILABILITYDefinition: Ongoing investment in our space and ground infrastructure ensures that customers are supported by an overall 99.9% L-band network availability which meets the GMDSS requirements set by the International Maritime Organization
Ensuring our network is available and reliable is essential in providing the required quality of service to our customers. This reliability is critical for safety at sea and aviation cockpit services
%
2014 2015 2016
99.9 99.9 99.9 The achievement of this KPI is specifically linked to the Best Networks strategic pillar. The risks for this KPI are specifically numbers 6 and 9. Incentive plans have this KPI indirectly linked to all the financial metrics as without this KPI meeting the required reliability levels, our financial targets can be affected
EMPLOYEE TURNOVERDefinition: Employee turnover is calculated as the number of leavers in a year (excluding redundancies and contingency workers) divided by the average headcount during the year
Minimising employee turnover is important to the business in order to build, develop and retain our global employee base. Low employee turnover demonstrates that our staff are engaged in their roles and are proud to work at Inmarsat
%
2014 2015 2016
8.0 5.9 8.4 The achievement of this KPI is specifically linked to the Best People strategic pillar but supports delivery of the other three pillars. The risk for this KPI is specifically number 12; however employee performance affects multiple other risks. The CEO has a separate organisation/people risk in his 2016 and 2017 annual bonus plans which contribute to how his annual bonus is calculated
ANNUAL REPORT AND ACCOUNTS 2016 – INMARSAT PLC – 13STRATEGIC REPORT – GOVERNANCE – FINANCIAL STATEMENTS

OUR MARKETS
THE DIGITAL WORLD NEEDS SATELLITES
THE COMMERCIAL SATELLITE SERVICE INDUSTRYInmarsat operates in the global commercial satellite communication services industry, as a satellite operator.
Satellite communication operators typically own a fleet of satellites, operate them as a communications network, and commercialise network capacity and services, mainly to satellite communication service providers, as well as directly to end users on certain occasions, worldwide.
There are essentially two main categories of satellite operators:
> Mobile satellite services (‘MSS’) operators, of which Inmarsat is one, which typically operate in L, S or Ka frequency bands, and focus on data and voice communications for mobility, particularly in the Maritime and Aviation sectors, corporate and governmental markets
> Fixed satellite services (‘FSS’) operators, which typically operate in Ku- and C-bands, and focus on video and data communications for media, telecoms, corporate and governmental markets
There is an increasing overlap between MSS and FSS providers through the progressive adoption by both types of operator of high throughput satellite (‘HTS’) technology, particularly suited for broadband data communications across markets. Inmarsat has adopted this technology for its Global Xpress constellation.
The fast-growing proliferation and utilisation of data globally, especially for broadband applications, is a key driver of commercial satellite services revenue growth.
According to a 2016 Euroconsult report (www.euroconsult.eu.com), satellite operators generated $12.45bn wholesale revenues globally in 2015. North America, Europe and Asia & Oceania each represent circa a quarter of the global industry’s revenues.
COMPETITIVE ENVIRONMENTInmarsat is one of the world’s leading satellite operators.
Inmarsat is estimated to hold a 7% share of the global operators’ market, according to Euroconsult’s market analysis from 2015. With a history of providing safety services at sea, our key differentiators are our global coverage and our expertise in delivering mobile applications. Our ability to deliver seamless, reliable, resilient and secure communications on the move remains crucial to our customers. Inmarsat also has a fully integrated operating and business model, with both ownership and control of dedicated infrastructure assets: mainly satellites, ground infrastructure, services and distribution capabilities and a hybrid terrestrial/satellite network, the European Aviation Network (S-band), to be launched in the near term.
Around 50% of the industry’s revenues are made up by the three leading fixed satellite services (‘FSS’) operators: SES, Intelsat and Eutelsat, with 35% of the industry’s revenues held by an increasing number of regional or national operators, focusing on specific geographies or vertical markets.
SATELLITE OPERATORS’ MARKET BY REGIONBASED ON WHOLESALE REVENUE, GLOBALLY, 2015
Asia & Oceania22%
Latin America12% Europe
25%
Middle East& Africa
18%
North America23%
Source: Euroconsult 2016
SATELLITE OPERATORS’ MARKET SHARESBASED ON WHOLESALE REVENUE, GLOBALLY, 2015
Telesat6% Inmarsat
7%
Other37%
Intelsat18%
Iridium2%
SES17%
Eutelsat13%
Source: Euroconsult 2016
WHAT ARE THE IMPLICATIONS OF THE EMERGENCE OF THE DIGITAL SOCIETY ON THE SATELLITE INDUSTRY?
WHAT ARE THE IMPLICATIONS OF TECHNOLOGICAL DIVERSIFICATION AND DEVELOPMENT IN THE SATELLITE INDUSTRY?
14 – INMARSAT PLC – ANNUAL REPORT AND ACCOUNTS 2016
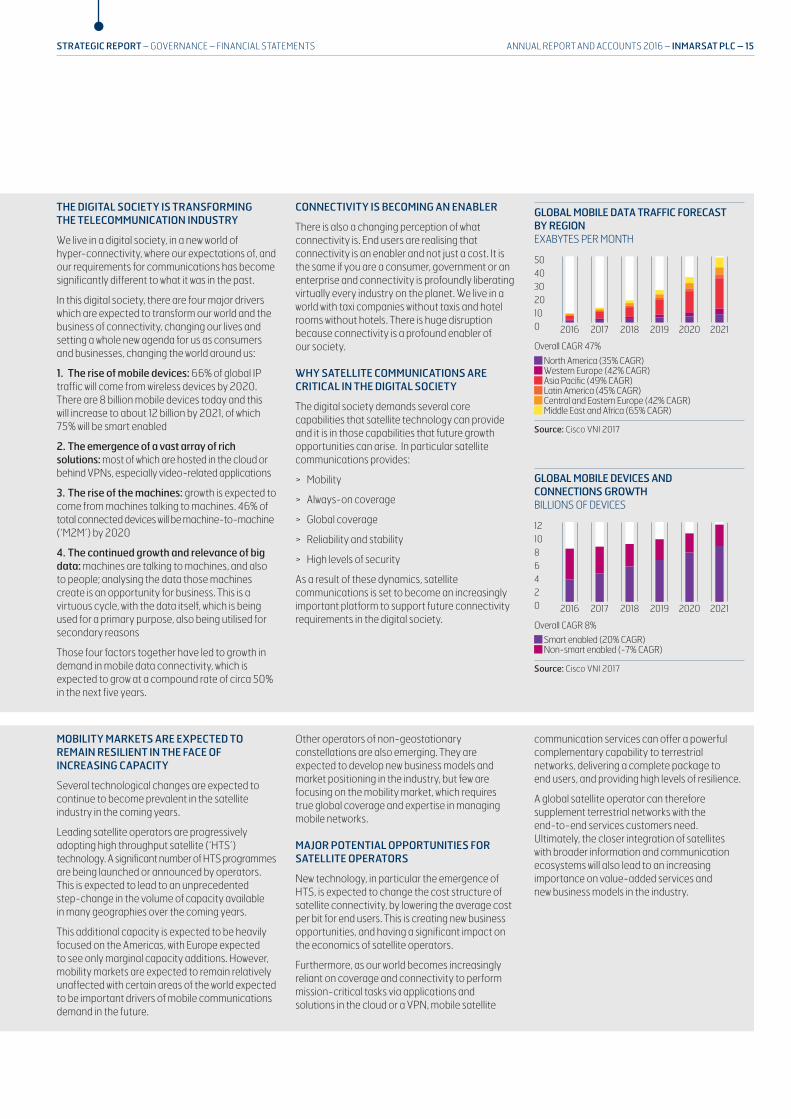
THE DIGITAL SOCIETY IS TRANSFORMING THE TELECOMMUNICATION INDUSTRY
We live in a digital society, in a new world of hyper-connectivity, where our expectations of, and our requirements for communications has become significantly different to what it was in the past.
In this digital society, there are four major drivers which are expected to transform our world and the business of connectivity, changing our lives and setting a whole new agenda for us as consumers and businesses, changing the world around us:
1. The rise of mobile devices: 66% of global IP traffic will come from wireless devices by 2020. There are 8 billion mobile devices today and this will increase to about 12 billion by 2021, of which 75% will be smart enabled
2. The emergence of a vast array of rich solutions: most of which are hosted in the cloud or behind VPNs, especially video-related applications
3. The rise of the machines: growth is expected to come from machines talking to machines. 46% of total connected devices will be machine-to-machine (‘M2M’) by 2020
4. The continued growth and relevance of big data: machines are talking to machines, and also to people; analysing the data those machines create is an opportunity for business. This is a virtuous cycle, with the data itself, which is being used for a primary purpose, also being utilised for secondary reasons
Those four factors together have led to growth in demand in mobile data connectivity, which is expected to grow at a compound rate of circa 50% in the next five years.
MOBILITY MARKETS ARE EXPECTED TO REMAIN RESILIENT IN THE FACE OF INCREASING CAPACITY
Several technological changes are expected to continue to become prevalent in the satellite industry in the coming years.
Leading satellite operators are progressively adopting high throughput satellite (‘HTS’) technology. A significant number of HTS programmes are being launched or announced by operators. This is expected to lead to an unprecedented step-change in the volume of capacity available in many geographies over the coming years.
This additional capacity is expected to be heavily focused on the Americas, with Europe expected to see only marginal capacity additions. However, mobility markets are expected to remain relatively unaffected with certain areas of the world expected to be important drivers of mobile communications demand in the future.
CONNECTIVITY IS BECOMING AN ENABLER
There is also a changing perception of what connectivity is. End users are realising that connectivity is an enabler and not just a cost. It is the same if you are a consumer, government or an enterprise and connectivity is profoundly liberating virtually every industry on the planet. We live in a world with taxi companies without taxis and hotel rooms without hotels. There is huge disruption because connectivity is a profound enabler of our society.
WHY SATELLITE COMMUNICATIONS ARE CRITICAL IN THE DIGITAL SOCIETY
The digital society demands several core capabilities that satellite technology can provide and it is in those capabilities that future growth opportunities can arise. In particular satellite communications provides:
> Mobility
> Always-on coverage
> Global coverage
> Reliability and stability
> High levels of security
As a result of these dynamics, satellite communications is set to become an increasingly important platform to support future connectivity requirements in the digital society.
Other operators of non-geostationary constellations are also emerging. They are expected to develop new business models and market positioning in the industry, but few are focusing on the mobility market, which requires true global coverage and expertise in managing mobile networks.
MAJOR POTENTIAL OPPORTUNITIES FOR SATELLITE OPERATORS
New technology, in particular the emergence of HTS, is expected to change the cost structure of satellite connectivity, by lowering the average cost per bit for end users. This is creating new business opportunities, and having a significant impact on the economics of satellite operators.
Furthermore, as our world becomes increasingly reliant on coverage and connectivity to perform mission-critical tasks via applications and solutions in the cloud or a VPN, mobile satellite
communication services can offer a powerful complementary capability to terrestrial networks, delivering a complete package to end users, and providing high levels of resilience.
A global satellite operator can therefore supplement terrestrial networks with the end-to-end services customers need. Ultimately, the closer integration of satellites with broader information and communication ecosystems will also lead to an increasing importance on value-added services and new business models in the industry.
GLOBAL MOBILE DATA TRAFFIC FORECASTBY REGIONEXABYTES PER MONTH
2016 2017 2018 2019 2020 2021
504030
1020
0
North America (35% CAGR)
Overall CAGR 47%
Western Europe (42% CAGR)Asia Pacific (49% CAGR)Latin America (45% CAGR)
Middle East and Africa (65% CAGR)Central and Eastern Europe (42% CAGR)
Source: Cisco VNI 2017
GLOBAL MOBILE DEVICES AND CONNECTIONS GROWTH BILLIONS OF DEVICES
2016 2017 2018 2019 2020 2021
12108
20
Smart enabled (20% CAGR)Non-smart enabled (-7% CAGR)
Source: Cisco VNI 2017
Overall CAGR 8%
ANNUAL REPORT AND ACCOUNTS 2016 – INMARSAT PLC – 15STRATEGIC REPORT – GOVERNANCE – FINANCIAL STATEMENTS

MARKET VERTICALS
MARITIME
PROVISION OF VOICE, BROADBAND DATA AND SAFETY COMMUNICATIONS FOR ALL VESSEL SIZES
ENTERPRISE
PROVISION OF LOW DATA-RATE, VOICE AND BROADBAND COMMUNICATIONS FOR A RANGE OF CORPORATE VERTICAL MARKETS
AVIATION
PROVISION OF DATA, VOICE, SAFETY AND BROADBAND COMMUNICATIONS FOR ALL AIRCRAFT TYPES
GOVERNMENT
PROVISION OF COMMUNICATIONS SERVICES FOR GOVERNMENTAL, MILITARY AND CIVIL APPLICATIONS
MAIN ADDRESSABLE MARKET SEGMENTS
> Merchant shipping: 68,300 vessels
> Large fishing: 46,000 vessels
> Offshore supply: 10,900 vessels
> Small fishing: 324,000 boats
> Leisure: 233,000 boats
Source: Euroconsult 2016
> Resources: Energy, mining and utilities companies
> Transportation and logistics: Mostly for machine-to-machine communications
> Media and aid: Specific, occasional, limited-duration communications
> Connected infrastructure and carrier: Extension and back-up of terrestrial networks
> Commercial aviation transport: 15,000 aircraft by 2020
> Safety and operations: Commercial aircraft mainly, for air-to-ground cockpit communications
Source: Euroconsult 2016
> Military applications for the US Government (still the single largest driver of global demand) and other governments worldwide
> Civil government applications: Inter-governmental organisations, emergency services, coast guard, border security, state-owned utilities, election delivery and monitoring
MARKET DYNAMICS > In the short term, the merchant shipping market remains depressed, with sluggish demand, low prices, over-supply and an ongoing focus on costs and efficiencies, compounded by continued volatility in the oil and gas sector
> In this market environment, there was a relatively high rate of scrappages and lay-offs in 2016, with fewer new vessels being commissioned and built
> Long-term opportunity with ‘smart ships’
> Within Enterprise, a number of key markets remain challenging, in particular oil and gas, with many of our legacy products facing increasing competition
> Long-term growth in mission-critical ‘Internet of Things’ applications is driving demand for connectivity, with unprecedented reach, range and reliability on a global basis
> Business and general aviation (‘BGA’) is a market which is expected to see compound growth of 14% over the next nine years
> In IFC, the number of connected aircraft is expected to grow from around 6,000 in 2016 to around 15,000 by 2020
> Ongoing budget and programme reductions in recent years
> However, government agencies continue to look for more cost-efficient and high-quality solutions in remote and mobile connectivity
OUTLOOK FOR INMARSAT
> The medium-term market opportunity for Inmarsat remains robust, with the addressable market for high bandwidth VSAT expected to significantly increase over the coming years
> With our large user base, global distribution and maintenance network and unique product range, Inmarsat remains in a very strong position to be able to address this market opportunity
> A number of projects and initiatives are underway to take advantage of other potentially significant opportunities around the ‘Internet of Things’, including connected transport and smart agriculture, which are expected to develop over the next decade
> Our strong track record in BGA and safety services has put us in a good position from which to maximise the potentially significant IFC opportunity in the coming years
> Inmarsat is well-placed to capitalise on the IFC opportunity, as the combination of our new and unique broadband networks, GX and EAN, is expected to provide us with an excellent value proposition offering global coverage and high bandwidth to ensure we remain competitive in this fast-emerging market
> Support customers with our offering of reliability, affordability and seamless interoperability with military satellite resources
> Our ability to augment existing military satellite systems through the global availability of end-to-end L-band and Ka-band networks will enable us to continue to deliver highly resilient communication capabilities with increased flexibility in support of our customers’ mission-critical programmes
PERFORMANCE ACTIVITY IN 2016
> 38,000 FleetBroadband vessels (excluding VSAT with FleetBroadband backup)
> 3,000 XpressLink/VSAT vessels
> 333,000 M2M devices
> 158,000 IsatPhones
> 8,000 SwiftBroadband sims
> 20 installed GX terminals on commercial airlines
> Inmarsat remains the largest provider of mobile satellite services to the US Government
> Inmarsat provides services to over 70 countries for government and military applications
RETAIL REVENUE GLOBALLY, 2015 US$1.9bn
of which Inmarsat 2015 revenues reflect a market share of:
32%
US$1.2bnof which Inmarsat 2015 revenues reflect a market share of:
13%
US$1.2bnof which Inmarsat 2015 revenues reflect a market share of:
11%
US$4.8bnof which Inmarsat 2015 revenues reflect a market share of:
6%Source: Northern Sky Research 2016 Source: Northern Sky Research 2016 Source: Northern Sky Research 2016 Source: Northern Sky Research 2016
OUR MARKETS CONTINUED
16 – INMARSAT PLC – ANNUAL REPORT AND ACCOUNTS 2016
Maritime business review See page 28
Enterprise business review See page 32

MARKET VERTICALS
MARITIME
PROVISION OF VOICE, BROADBAND DATA AND SAFETY COMMUNICATIONS FOR ALL VESSEL SIZES
ENTERPRISE
PROVISION OF LOW DATA-RATE, VOICE AND BROADBAND COMMUNICATIONS FOR A RANGE OF CORPORATE VERTICAL MARKETS
AVIATION
PROVISION OF DATA, VOICE, SAFETY AND BROADBAND COMMUNICATIONS FOR ALL AIRCRAFT TYPES
GOVERNMENT
PROVISION OF COMMUNICATIONS SERVICES FOR GOVERNMENTAL, MILITARY AND CIVIL APPLICATIONS
MAIN ADDRESSABLE MARKET SEGMENTS
> Merchant shipping: 68,300 vessels
> Large fishing: 46,000 vessels
> Offshore supply: 10,900 vessels
> Small fishing: 324,000 boats
> Leisure: 233,000 boats
Source: Euroconsult 2016
> Resources: Energy, mining and utilities companies
> Transportation and logistics: Mostly for machine-to-machine communications
> Media and aid: Specific, occasional, limited-duration communications
> Connected infrastructure and carrier: Extension and back-up of terrestrial networks
> Commercial aviation transport: 15,000 aircraft by 2020
> Safety and operations: Commercial aircraft mainly, for air-to-ground cockpit communications
Source: Euroconsult 2016
> Military applications for the US Government (still the single largest driver of global demand) and other governments worldwide
> Civil government applications: Inter-governmental organisations, emergency services, coast guard, border security, state-owned utilities, election delivery and monitoring
MARKET DYNAMICS > In the short term, the merchant shipping market remains depressed, with sluggish demand, low prices, over-supply and an ongoing focus on costs and efficiencies, compounded by continued volatility in the oil and gas sector
> In this market environment, there was a relatively high rate of scrappages and lay-offs in 2016, with fewer new vessels being commissioned and built
> Long-term opportunity with ‘smart ships’
> Within Enterprise, a number of key markets remain challenging, in particular oil and gas, with many of our legacy products facing increasing competition
> Long-term growth in mission-critical ‘Internet of Things’ applications is driving demand for connectivity, with unprecedented reach, range and reliability on a global basis
> Business and general aviation (‘BGA’) is a market which is expected to see compound growth of 14% over the next nine years
> In IFC, the number of connected aircraft is expected to grow from around 6,000 in 2016 to around 15,000 by 2020
> Ongoing budget and programme reductions in recent years
> However, government agencies continue to look for more cost-efficient and high-quality solutions in remote and mobile connectivity
OUTLOOK FOR INMARSAT
> The medium-term market opportunity for Inmarsat remains robust, with the addressable market for high bandwidth VSAT expected to significantly increase over the coming years
> With our large user base, global distribution and maintenance network and unique product range, Inmarsat remains in a very strong position to be able to address this market opportunity
> A number of projects and initiatives are underway to take advantage of other potentially significant opportunities around the ‘Internet of Things’, including connected transport and smart agriculture, which are expected to develop over the next decade
> Our strong track record in BGA and safety services has put us in a good position from which to maximise the potentially significant IFC opportunity in the coming years
> Inmarsat is well-placed to capitalise on the IFC opportunity, as the combination of our new and unique broadband networks, GX and EAN, is expected to provide us with an excellent value proposition offering global coverage and high bandwidth to ensure we remain competitive in this fast-emerging market
> Support customers with our offering of reliability, affordability and seamless interoperability with military satellite resources
> Our ability to augment existing military satellite systems through the global availability of end-to-end L-band and Ka-band networks will enable us to continue to deliver highly resilient communication capabilities with increased flexibility in support of our customers’ mission-critical programmes
PERFORMANCE ACTIVITY IN 2016
> 38,000 FleetBroadband vessels (excluding VSAT with FleetBroadband backup)
> 3,000 XpressLink/VSAT vessels
> 333,000 M2M devices
> 158,000 IsatPhones
> 8,000 SwiftBroadband sims
> 20 installed GX terminals on commercial airlines
> Inmarsat remains the largest provider of mobile satellite services to the US Government
> Inmarsat provides services to over 70 countries for government and military applications
RETAIL REVENUE GLOBALLY, 2015 US$1.9bn
of which Inmarsat 2015 revenues reflect a market share of:
32%
US$1.2bnof which Inmarsat 2015 revenues reflect a market share of:
13%
US$1.2bnof which Inmarsat 2015 revenues reflect a market share of:
11%
US$4.8bnof which Inmarsat 2015 revenues reflect a market share of:
6%Source: Northern Sky Research 2016 Source: Northern Sky Research 2016 Source: Northern Sky Research 2016 Source: Northern Sky Research 2016
ANNUAL REPORT AND ACCOUNTS 2016 – INMARSAT PLC – 17STRATEGIC REPORT – GOVERNANCE – FINANCIAL STATEMENTS
Aviation business review See page 36
Government business review See page 40

NETWORKS Inmarsat-4, Inmarsat-5, Inmarsat-6 and EAN
L-band satellite networks
Broadband satellite networks
Air-to-Ground networks
SOLUTIONSINMARSAT GATEWAY
Digital Enablement Foundry
PEOPLE AND WORKPLACE
Engaged, enabled and empowered
DISTRIBUTIONECOSYSTEMS
VARs, VAMs, CAPs, innovators and customers
OUR STRATEGY
HELPING US BUILD MOMENTUM
Inmarsat’s strategic vision is to be a key enabler in the developing digital society. This vision will be accelerated by driving the growth and diversification of our business.
Our vision will be achieved by focusing on service delivery excellence and sustainable commercial differentiation. We aim to be a leader in our key markets to ensure it provides a critical platform in the digital society going forward.
In order to realise this vision, we are transforming ourselves. We will transition from a mobile satellite services operator, providing satellite bandwidth and services, to a global digital services enabler, delivering high-quality communication services and solutions.
This means moving beyond connectivity to embrace four development pillars:
BEST NETWORKS TO HAVE THE HIGHEST QUALITY, CUTTING-EDGE INTEGRATED GLOBAL NETWORKS.
BEST SOLUTIONS TO HAVE THE HIGHEST QUALITY UNIQUE SOLUTIONS PLATFORM.
BEST DISTRIBUTION TO HAVE GLOBAL REACH TO DELIVER VALUE-ADDED CUSTOMER OUTCOMES VIA MARKET INTIMACY.
BEST WORKPLACE TO BE PASSIONATE, OPEN, ENTERPRISING AND EASY TO DO BUSINESS WITH.
By driving excellence in these four inter-connected areas, we will ensure that we remain agile and innovative.
Inmarsat remains well-positioned to take advantage of a number of significant growth opportunities in the coming years, supported by our unique skills and experience in global, mobile, broadband services, our solutions-based offerings, our strong global networks and our market-leading distribution channels.
OUR STRATEGIC VISION
BEST NETWORKS
BEST SOLUTIONS
BEST DISTRIBUTION
BEST WORKPLACE
STRATEGY OBJECTIVES STRATEGY OBJECTIVES STRATEGY OBJECTIVES STRATEGY OBJECTIVES
> Deliver GX 1.0 and future-proof GX 2.0
> Reinvigorate our L-band network with Inmarsat-6 and other satellite developments
> Deliver the European Aviation Network
> Enhance open architecture and edge device capabilities
> Deliver value-add Inmarsat Gateway platform
> Create digital foundry and solutions ecosystem
> Digitise Inmarsat’s internal systems and operations
> Enhance indirect distribution to target markets
> Maintain our direct distribution capability
> Maximise value from/to reinvigorated L-band channels
> Provide clarity on our purpose and strategy to our employees
> Strengthen leadership capability and delegate accountability
> Refresh our values and redefine our culture
> Create a compelling employee value proposition and dynamic workplace
> Enable the best systems and processes through OneIT
PROGRESS PROGRESS PROGRESS PROGRESS
> GX global commercial service introduction in December 2015
> L-band market expansion through product-specific initiatives, country-specific development, innovation and new value propositions
> EAN’s core infrastructure all under contract, including a partnership with Deutsche Telekom to supply and manage the ground network component. All 28 EU territory MSS authorisations plus Norway and Switzerland secured. In addition, 27 countries have provided authorisations or in-principle approvals for the CGC
> Inmarsat Gateway plans progressed for commercial launch to offer value-added services via a network-agnostic platform developed in partnership with Cisco
> Certified applications partner (‘CAP’) programme launched
> Digital Office created internally
> Appointment of a Chief Digital Officer
> Value-added reseller agreements for GX signed with key distribution partners
> GX long-term commitments signed with key Maritime service providers (Marlink, Speedcast, Navarino and Satlink in early 2017)
> Introduction of Streamline programme to simplify contractual agreements and provide master lists for pricing and product descriptions for our partners
> Reorganisation leading to a simplification and improved collaboration
> New appointments within the Executive Management Team
> OneIT programme underway
> Streamline programme will make Inmarsat easier to do business with
> Modernised office spaces in Palm Bay (US), Rotterdam, Singapore, St. John’s (Canada) and West Virginia (US)
FUTURE PRIORITIES FUTURE PRIORITIES FUTURE PRIORITIES FUTURE PRIORITIES
> Launch Inmarsat-5 F4 in 2017
> Prepare Inmarsat-6, with the first satellite planned for launch in 2020, to enable L-band and Ka-band growth
> Launch the S-band satellite in 2017, and complete all regulatory approvals
> Continue to develop a large and diverse community of certified applications partners
> Offer applications, solutions and services across our network platforms
> Strengthen our cyber security capabilities
> Digitise Inmarsat core business services
> Focus GX offering on broadband and VSAT demand across maritime, aviation, government and enterprise markets
> Refocus L-band offering on markets and service areas providing a sustainable business opportunities
> Develop new channel partners, eg OEMs, CAPs
> Modernised office spaces in London, Ålesund (Norway) and Dubai
> Introduce new employee value proposition
> Increased focus on learning and development across the Company
18 – INMARSAT PLC – ANNUAL REPORT AND ACCOUNTS 2016

BEST NETWORKS
BEST SOLUTIONS
BEST DISTRIBUTION
BEST WORKPLACE
STRATEGY OBJECTIVES STRATEGY OBJECTIVES STRATEGY OBJECTIVES STRATEGY OBJECTIVES
> Deliver GX 1.0 and future-proof GX 2.0
> Reinvigorate our L-band network with Inmarsat-6 and other satellite developments
> Deliver the European Aviation Network
> Enhance open architecture and edge device capabilities
> Deliver value-add Inmarsat Gateway platform
> Create digital foundry and solutions ecosystem
> Digitise Inmarsat’s internal systems and operations
> Enhance indirect distribution to target markets
> Maintain our direct distribution capability
> Maximise value from/to reinvigorated L-band channels
> Provide clarity on our purpose and strategy to our employees
> Strengthen leadership capability and delegate accountability
> Refresh our values and redefine our culture
> Create a compelling employee value proposition and dynamic workplace
> Enable the best systems and processes through OneIT
PROGRESS PROGRESS PROGRESS PROGRESS
> GX global commercial service introduction in December 2015
> L-band market expansion through product-specific initiatives, country-specific development, innovation and new value propositions
> EAN’s core infrastructure all under contract, including a partnership with Deutsche Telekom to supply and manage the ground network component. All 28 EU territory MSS authorisations plus Norway and Switzerland secured. In addition, 27 countries have provided authorisations or in-principle approvals for the CGC
> Inmarsat Gateway plans progressed for commercial launch to offer value-added services via a network-agnostic platform developed in partnership with Cisco
> Certified applications partner (‘CAP’) programme launched
> Digital Office created internally
> Appointment of a Chief Digital Officer
> Value-added reseller agreements for GX signed with key distribution partners
> GX long-term commitments signed with key Maritime service providers (Marlink, Speedcast, Navarino and Satlink in early 2017)
> Introduction of Streamline programme to simplify contractual agreements and provide master lists for pricing and product descriptions for our partners
> Reorganisation leading to a simplification and improved collaboration
> New appointments within the Executive Management Team
> OneIT programme underway
> Streamline programme will make Inmarsat easier to do business with
> Modernised office spaces in Palm Bay (US), Rotterdam, Singapore, St. John’s (Canada) and West Virginia (US)
FUTURE PRIORITIES FUTURE PRIORITIES FUTURE PRIORITIES FUTURE PRIORITIES
> Launch Inmarsat-5 F4 in 2017
> Prepare Inmarsat-6, with the first satellite planned for launch in 2020, to enable L-band and Ka-band growth
> Launch the S-band satellite in 2017, and complete all regulatory approvals
> Continue to develop a large and diverse community of certified applications partners
> Offer applications, solutions and services across our network platforms
> Strengthen our cyber security capabilities
> Digitise Inmarsat core business services
> Focus GX offering on broadband and VSAT demand across maritime, aviation, government and enterprise markets
> Refocus L-band offering on markets and service areas providing a sustainable business opportunities
> Develop new channel partners, eg OEMs, CAPs
> Modernised office spaces in London, Ålesund (Norway) and Dubai
> Introduce new employee value proposition
> Increased focus on learning and development across the Company
We measure progress towards our strategic vision using both financial and non-financial key performance indicators and robust risk management. These measures help us maintain a regular check against major milestones within each of our strategic priorities allowing us to flex and adjust as required to improve delivery and execution.
Key performance indicators See page 12
Our principal risks and uncertainties See page 50
ANNUAL REPORT AND ACCOUNTS 2016 – INMARSAT PLC – 19STRATEGIC REPORT – GOVERNANCE – FINANCIAL STATEMENTS

OUR BUSINESS MODEL
SUPPORTING OUR STRATEGY
HOW OUR BUSINESS MODEL SUPPORTS OUR STRATEGIC IMPERATIVES
BEST NETWORKS TO HAVE THE HIGHEST QUALITY, CUTTING-EDGE INTEGRATED GLOBAL NETWORKS.
BEST SOLUTIONS TO HAVE THE HIGHEST QUALITY UNIQUE SOLUTIONS PLATFORM.
BEST DISTRIBUTION TO HAVE GLOBAL REACH TO DELIVER VALUE-ADDED CUSTOMER OUTCOMES VIA MARKET INTIMACY.
BEST WORKPLACE TO BE PASSIONATE, OPEN, ENTERPRISING AND EASY TO DO BUSINESS WITH.
Our four strategic imperatives, which are inter-connected, have been designed and developed to ensure we continue to leverage our knowledge and experience in mobile satellite communications to deliver value for our stakeholders.
Our L-band networks, based on our I-3 and I-4 satellite constellations, continue to support the mobility requirements of our customers, and from now and in the future, Global Xpress, our broadband network in Ka-band, based on our I-5 satellites, and our European Aviation Network, will be the foundation for our future growth.
Supported by these networks, we will continue to deliver high-quality, reliable, value added solutions. These will be based on a diverse, global, innovative and relevant solutions ecosystem, based on our partnerships with market-leading digital service providers.
We also have major strategic partnerships in distribution, to ensure we maximise our channels to market, in tandem with our own internal efforts to service and support our customers.
To ensure Inmarsat is the best place to work, we will continue to invest in talent, through our programmes and initiatives in leadership training, and learning and development activities.
RESOURCES AND RELATIONSHIPS
OUR FINANCIAL RESOURCESWe will continue to use our balance sheet to support the necessary and appropriate organic and inorganic investment to deliver our strategic imperatives
Our business model has been developed to ensure we maximise the impact of our resources and relationships to support our strategic imperatives, thereby delivering value for all of our stakeholders.
A CUSTOMER-CENTRIC APPROACH The business model is based on a business unit structure, which places our customers at the centre of everything we do. This structure ensures we remain focused on the needs of our maritime, government, enterprise and aviation customers. We continue to innovate to deliver communications products, services and solutions that meet their evolving remote and mobile connectivity needs.
This customer-centric approach is critical in an operating environment that is developing at pace, driven by the evolving communications requirements of our customers.
OUR CORE VALUESThese are the foundations for how we aspire to behave in every aspect of our working life at Inmarsat:
> Market-driven
> Enterprising
> Open
> Passionate
Link to Resources and Relationships See page 22
20 – INMARSAT PLC – ANNUAL REPORT AND ACCOUNTS 2016
Link to Strategy See page 18

DELIVERING VALUE FOR OUR STAKEHOLDERS
COMMUNICATIONS PRODUCTS, SERVICES AND SOLUTIONS FOR OUR CUSTOMERS IN THE KEY BUSINESS SEGMENTS
RESOURCES AND RELATIONSHIPS
OUR PARTNERSWe have strong relationships with all our partners, from suppliers to distributors, and work with them to strengthen our service offering
OUR TECHNOLOGYWe continue to invest in innovation to deliver market-winning solutions to our customers, and we offer much more than capacity and connectivity. We continue to invest to differentiate our propositions from those of our peers
OUR SATELLITE AND GROUND NETWORKSWe have the world’s first global mobile broadband network from one operator in the form of our Global Xpress (Ka-band) constellation. We are developing a unique European Aviation Network to deliver the world’s best passenger broadband experience in Europe. These new networks supplement our market-leading position in the highly resilient lower bandwidth (‘L-band’) global mobile satellite communication services
OUR PEOPLE We continue to ensure we have the right people with the individual skills, competencies and experience who can create value and deliver our business objectives. Our corporate values are embedded such that all our employees understand that much of our success as a business depends on how they interpret these values. These are being passionate, open, enterprising and market-driven
MARITIMEWe offer the most dependable and versatile communications solutions to the maritime industry
ENTERPRISEWe deliver instant, powerful communications across every environment and on every continent
AVIATIONWe are fuelling a new era of innovation for commercial airlines and business jet operators, in the areas of IFC and cockpit safety
GOVERNMENTWe remain a key partner to a number of governments in nations around the world
SHAREHOLDERS AND BONDHOLDERS We aim to drive profitable growth to help deliver value for our shareholders and bondholders
PARTNERS AND CUSTOMERSWe focus on the key drivers of value for our partners and customers such as security, reliability and seamless delivery with global coverage and mobility
COMMUNITIESWe have a responsibility around public service and safety which has been part of our heritage and which we remain proud to continue to pursue, particularly in Maritime, where we have a 37-year heritage in supporting mariners and the wider maritime community
EMPLOYEESWe are committed to ensuring diversity among our employees. We have well established values and qualities which operate throughout the business and we have a policy of promoting employees internally where possible
Our business model has been designed to deliver value to all stakeholders, helping us to drive the business for success in the future
ANNUAL REPORT AND ACCOUNTS 2016 – INMARSAT PLC – 21STRATEGIC REPORT – GOVERNANCE – FINANCIAL STATEMENTS
Link to Resources and Relationships See page 22
Link to Business Unit sections See pages 28-43

RESOURCES AND RELATIONSHIPS
DELIVERING A POSITIVE IMPACT
The Board believes corporate and social responsibility is an important part of the Group’s culture and the adoption of good practice will have a positive impact on the business.Ensuring we act in an ethical manner, taking account of our responsibilities – socially and environmentally – is important in the way we operate and interact with our stakeholders, including investors, employees, suppliers and business partners. This way of working contributes to how we create value for all our shareholders.
OUR PEOPLE Building our culture at Inmarsat continues to be a priority and, over the last three years we have focused on aspects of that: 2014 was our Year of Engagement, 2015 our Year of Enablement and 2016 our Year of Effectiveness.
The Year of Effectiveness theme drove a number of key activities during the year, including enhancing our learning and development offer to employees, developing a roadmap to ensure consistency of job levels and compensation across the business, and implementing an organisational restructure to improve collaboration and accountability. Finally, we began the process of developing a new People Strategy with the objective of further enhancing business performance and making Inmarsat an even better place to work. This will continue to be developed and implemented in 2017.
The following sections cover some key areas of focus in building our culture.
ORGANISATIONAL RESTRUCTURE
2016 saw significant changes to our organisational structure: bringing people who perform similar roles across Inmarsat into the same function, team or group to improve collaboration and accountability. As a result, Business Units are focused on customers and markets, while engineering, IT and other non-customer facing functions have been moved to our Engineering, Operations and support divisions. We also established a new Cyber and Digital function to ensure that we are well equipped for future challenges.
EMPLOYEE ENGAGEMENT SURVEY
Employee feedback from the corporate shorter-format ‘Pulse Survey’ in 2015, and detailed in our 2015 Annual Report, supported our continued focus in 2016 on learning and development, career development, reward systems and introducing work processes and work flows. We maintained investment in learning and development, governed by an active Steering Group of a cross-section of people from around the globe, and we tailored our bonus programme to meet the needs of our business. In addition, we set up a process excellence team dedicated to creating processes and structures, including six-sigma training for project owners. We have already seen the benefit in the efficiency of projects following training attendance.
In parallel, the Maritime Business Unit pioneered a short monthly ‘Compass’ survey for its employees, achieving a response rate of 83% which was a consistently high level of participation. The Maritime team also implemented a cultural change programme that monitors staff feedback on key strategic areas, such as leadership, environment, vision and direction in real time.
Building on the success of the Maritime survey, Inmarsat will launch a global quarterly engagement survey in 2017, utilising the latest survey technology which provides instant results, thereby enabling us to take action quickly at an organisational and business unit level. In addition, managers will have immediate data analytics and insights about their teams to help them take local actions.
CODE OF CONDUCT
Our Code of Ethics requires Directors, officers, employees and contractors to conduct business with the highest standards of personal and professional integrity. A copy of our Code is published on our website.
We comply with local laws where we operate, and across our Group we ensure our employees comply with the UK Bribery Act and the US Foreign & Corrupt Practices Act. A summary of our anti-bribery policy can be found on our website. As part of our commitment to preventing bribery and establishing a culture that does not tolerate corruption wherever and in whatever form it takes, we ask our Directors, employees and contractors to confirm annually that they understand the restrictions outlined in the policy and the implications for breaching the policy for the business and them as individuals. Our anti-bribery policy operates in line with current legislation. The policy also incorporates guidelines on dealing with gifts and accepting and giving hospitality.
We have separate policies in place dealing with ethics, fraud, the use of inside information and whistleblowing. We ask Directors, employees and contractors to confirm they understand these policies and how they are applied, once a year.
We have a worldwide anonymous telephone service for employees to use if they have any concerns. No calls were received by the external provider in 2016.
VALUES
During 2016, we initiated ‘Inmarsat 2020’ to help shape our vision, united by a common set of values and a clear purpose to help us succeed in a disruptive digital world. We looked at what sort of organisation we want to be, what we need to change to get there and how to do it. We invited a cross section of people of all levels, across the business to create focus groups to help build ideas and themes about Inmarsat’s future.
An invitation group of more than 10% of our employees participated and the output from these workshops formed the basis of a Global Leadership Team ‘Create the Future’ meeting comprising the top 50 leaders in the organisation. The outcome of this meeting enabled us to embark on a number of ‘Quests’ in service of our vision. As a result, whilst our current Values (Passionate, Open, Enterprising, Market-Driven) and the Inmarsat Qualities have served us well, we will refresh them during 2017 to keep pace with the changes around us.
DIVERSITY OF EMPLOYEE BASE AND NON-DISCRIMINATION
We do not tolerate discrimination in any form – race, gender, age, culture and disability – against our employees, either from other employees or third parties. Anonymous helplines and email addresses are available for employees to use if they experience or see discrimination, and employees are also encouraged to speak directly to their manager should they feel comfortable doing so.
When recruiting, we value diversity in its broadest definition and work to provide opportunities for all, including for disabled employees reviewing the requirements of their working environment to accommodate practical changes as far as possible to allow them to continue in their daily work routine. If such changes were unrealistic to implement, we would review alternative employment options for the individual within the Group.
We are very proud that we have 65 different nationalities within the Inmarsat Group. This breadth of employee culture and experience supports our Best Workplace theme as everyone contributes to our business operations.
22 – INMARSAT PLC – ANNUAL REPORT AND ACCOUNTS 2016

We recognise the importance of diversity amongst our employees and are committed to ensuring that employees are selected and promoted on the basis of merit and ability, regardless of age, gender, race, religion, sexual orientation or disability. The gender split across the Group (excluding contingency workers) as at February 2017 is illustrated in the table below.
February 2017 gender split across the Group
Male Female
Diversity of plc Board 9 3
Diversity of Executive Management Board 10 2
Diversity of senior managers 164 28
Diversity of all employees (excluding contingency workers) 1,216 527
The detail of females on the Executive Management Board and wider number of senior managers represent the definition as set out in the Department for Business, Innovation and Skills (‘BIS’) requirements. The data points set out above are in line with those disclosed last year.
STAFF FORUMS
We have elected employee forums in the UK and Batam in Indonesia, a Works Council in the Netherlands and an Enterprise Agreement in Perth, Australia.
During 2016, we held quarterly UK Staff Forum meetings with our UK Executive Management Team and UK Representatives and on two of those occasions, representatives from global offices participated to discuss feedback and questions from colleagues across our global offices.
These groups enable two-way open communications between employees and the Executive Management Team, in a trust based environment listening and taking into consideration the views of employees. In the UK, the Staff Forum is an elected body constituted in accordance with prevailing legislation to provide the formal means of consultation on contractual matters, as and when required. An example of their involvement in 2016 related to consultation about the closure of the UK Defined Benefit pension arrangement to future accrual where the Staff Forum was instrumental in bringing about an improvement in the proposal from the employer for the affected employees. In other countries, these bodies are constituted according to local requirements.
LEARNING AND DEVELOPMENT
2016 was a formative year for learning and development activity. We continued to take advantage of our considerable internal talent pool by encouraging employees to apply for internal promotion opportunities and seek development opportunities to extend their skills and experience. Several senior leadership roles were filled internally, including the appointment of the President of our Enterprise business unit.
In addition, we piloted a new all-employee programme to improve the frequency and quality of career development and performance conversations between managers and team members, and to encourage creative thinking on development opportunities. The programme will roll out globally in 2017.
Our new joiner induction programme was also improved and reformatted for global accessibility. Our flagship in-house global leadership development programme completed its second successful year in 2016, and added a second module. We continued to focus on leadership development with three targeted programmes for our Global Leadership Team, who are our 50 most senior leaders.
Our internal bite-size, live business education programme began in 2016, and we plan to build on this in 2017, to inform our people about significant technological initiatives.
During 2016, one third of our total spend on learning and development was on technical and job-specific training, with around the same again spent on leadership development. The remaining third was distributed among localised education sponsorship and behavioural/cultural development programmes.
HEALTH AND SAFETY
The Inmarsat plc Board receives an annual update on health and safety activity across the Group. Rupert Pearce, CEO, has been identified as having responsibility for health and safety issues within the Group. We have a dedicated Health and Safety Manager who is located in our headquarters office and our subsidiary operations have identified managers responsible for health and safety.
Our goal is to encourage strong leadership in championing the importance of, and a common-sense approach to health and safety in the workplace. We recognise the need to provide a safe working environment for our employees, contractors and any visitors. Regular health and safety audits are undertaken at operating sites across the Group. During the year we introduced one Employee Assistance Programme globally using the same service provider. Across the Group, we had 18 (2015:13) accidents or near misses reported, and again we had no fatalities.
Inmarsat had the opportunity to engage with over 100 students to introduce Inmarsat’s maritime solutions, GMDSS service and address current maritime industry issues at the World Maritime University in Sweden.
ANNUAL REPORT AND ACCOUNTS 2016 – INMARSAT PLC – 23STRATEGIC REPORT – GOVERNANCE – FINANCIAL STATEMENTS
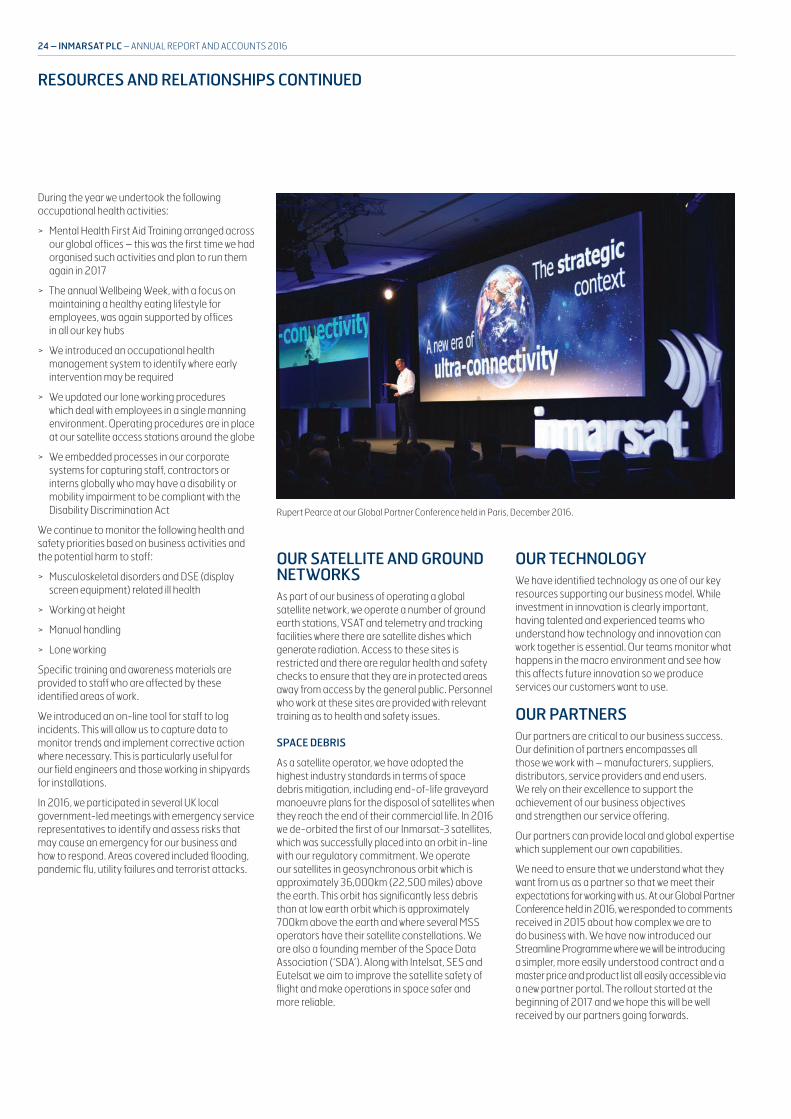
RESOURCES AND RELATIONSHIPS CONTINUED
During the year we undertook the following occupational health activities:
> Mental Health First Aid Training arranged across our global offices – this was the first time we had organised such activities and plan to run them again in 2017
> The annual Wellbeing Week, with a focus on maintaining a healthy eating lifestyle for employees, was again supported by offices in all our key hubs
> We introduced an occupational health management system to identify where early intervention may be required
> We updated our lone working procedures which deal with employees in a single manning environment. Operating procedures are in place at our satellite access stations around the globe
> We embedded processes in our corporate systems for capturing staff, contractors or interns globally who may have a disability or mobility impairment to be compliant with the Disability Discrimination Act
We continue to monitor the following health and safety priorities based on business activities and the potential harm to staff:
> Musculoskeletal disorders and DSE (display screen equipment) related ill health
> Working at height
> Manual handling
> Lone working
Specific training and awareness materials are provided to staff who are affected by these identified areas of work.
We introduced an on-line tool for staff to log incidents. This will allow us to capture data to monitor trends and implement corrective action where necessary. This is particularly useful for our field engineers and those working in shipyards for installations.
In 2016, we participated in several UK local government-led meetings with emergency service representatives to identify and assess risks that may cause an emergency for our business and how to respond. Areas covered included flooding, pandemic flu, utility failures and terrorist attacks.
OUR SATELLITE AND GROUND NETWORKSAs part of our business of operating a global satellite network, we operate a number of ground earth stations, VSAT and telemetry and tracking facilities where there are satellite dishes which generate radiation. Access to these sites is restricted and there are regular health and safety checks to ensure that they are in protected areas away from access by the general public. Personnel who work at these sites are provided with relevant training as to health and safety issues.
SPACE DEBRIS
As a satellite operator, we have adopted the highest industry standards in terms of space debris mitigation, including end-of-life graveyard manoeuvre plans for the disposal of satellites when they reach the end of their commercial life. In 2016 we de-orbited the first of our Inmarsat-3 satellites, which was successfully placed into an orbit in-line with our regulatory commitment. We operate our satellites in geosynchronous orbit which is approximately 36,000km (22,500 miles) above the earth. This orbit has significantly less debris than at low earth orbit which is approximately 700km above the earth and where several MSS operators have their satellite constellations. We are also a founding member of the Space Data Association (‘SDA’). Along with Intelsat, SES and Eutelsat we aim to improve the satellite safety of flight and make operations in space safer and more reliable.
OUR TECHNOLOGYWe have identified technology as one of our key resources supporting our business model. While investment in innovation is clearly important, having talented and experienced teams who understand how technology and innovation can work together is essential. Our teams monitor what happens in the macro environment and see how this affects future innovation so we produce services our customers want to use.
OUR PARTNERSOur partners are critical to our business success. Our definition of partners encompasses all those we work with – manufacturers, suppliers, distributors, service providers and end users. We rely on their excellence to support the achievement of our business objectives and strengthen our service offering.
Our partners can provide local and global expertise which supplement our own capabilities.
We need to ensure that we understand what they want from us as a partner so that we meet their expectations for working with us. At our Global Partner Conference held in 2016, we responded to comments received in 2015 about how complex we are to do business with. We have now introduced our Streamline Programme where we will be introducing a simpler, more easily understood contract and a master price and product list all easily accessible via a new partner portal. The rollout started at the beginning of 2017 and we hope this will be well received by our partners going forwards.
Rupert Pearce at our Global Partner Conference held in Paris, December 2016.
24 – INMARSAT PLC – ANNUAL REPORT AND ACCOUNTS 2016

Our Group-led category management approach to procurement and supply chain management is maturing and is delivering significant financial contribution to the Group both in the year and throughout the contract life. Another key priority for the Global Procurement team this year has been to better understand our current supplier base. We undertake a robust due diligence process for new suppliers through a pre-qualification process; this includes reviewing financial stability, compliance with relevant current legislation and customer references for similar goods and services. Additionally, we reduced the number of suppliers we trade with to allow us to establish better relationships and to enable greater leverage of our global spend. We will continue to do this through a well-managed preferred supplier list which will include group-wide corporate deals where appropriate.
We will focus further in 2017 on developing our procurement function including several process simplification initiatives across the Procure to Pay function including standard contractual frameworks, low-cost transaction methods such as using purchasing cards (‘P-card’) and invoice reduction initiatives. This ‘procurement as a service’ model will help improve efficiency and reduce our overall cost of doing business which will make us more effective as a business and easier for our suppliers to do business with.
We will also progressively work to ensure that all our suppliers, new and existing, adhere to our standards of ethical behaviour, environmental awareness, health and safety and other relevant working practises. This includes compliance with current legislative or regulatory requirements, for example the Modern Slavery Act 2015.
As such we are also committed to ensuring there is transparency in our own business and in our approach to tackling modern slavery throughout our supply chains, consistent with our disclosure obligations under the Modern Slavery Act 2015. We expect the same high standards from all of our
contractors, suppliers and other business partners, and as part of our contracting processes, we include specific prohibitions against the use of forced, compulsory or trafficked labour, or anyone held in slavery or servitude, whether adults or children, and we expect that our suppliers will hold their own suppliers to the same high standards.
We will do this through specific policies and a Supplier Code of Conduct, copies of which are available on our website.
MEETING OUR PUBLIC RESPONSIBILITYOur website provides considerable information about how we connect with organisations, individuals and our different partners to extend the reach of our services to support those who may need assistance either for humanitarian needs or charitable endeavours. You can find out more on www.inmarsat.com and review case studies and updates in our CSR section.
Our maritime heritage is a key reminder to us of how we have supported mariners and the wider maritime community for over 37 years and remain focused on doing so in the future. We remain the only approved provider of satellite communications services for the Global Maritime Distress and Safety System (‘GMDSS’) and we continue to invest in the development of maritime safety services. Our Inmarsat C SafetyNET service is being updated and continues to be used to provide vital updates on reported pirate activity. The service enables ship masters to access reports of pirate movements, giving them information to know which regions to avoid with high pirate activity and allowing them to re-route if necessary.
The 2017-18 Volvo Round the World Ocean Race, of which Inmarsat is the official satellite communications provider, relies on Inmarsat safety services for the crews to maintain communication at all times, wherever they are. FleetBroadband, Inmarsat C and our handheld phone are all standard equipment for each of the yachts. Our IsatPhone was used in the last Race to
provide emergency communications when one of the ships ran aground, with the yacht captain praising it for saving the crew’s lives.
In addition to maritime safety services, we also promote safety services to the aviation industry for use in the cockpit. We remain committed to the provision of International Civil Aviation Organisation (‘ICAO’) approved satellite safety services, and are expanding our safety offerings with our SwiftBroadband-Safety service being trialled successfully and expected to be rolled out on aircraft during 2017.
In 2016, we continued to support the telecommunications relief aid organisation, Télécoms Sans Frontières (‘TSF’) totalling $220,000 and paid $115,000 to the World Maritime University as part of our support for the education of maritime specialists. These two payments are our most significant charitable payments. The total charitable donation amount paid in 2016 was approximately $390,000. This amount excludes the free airtime and terminals we offer to multiple charities as we support their endeavours throughout the year.
Our core charitable support remains focused on the work carried out by TSF. We are very proud to have supported this wonderful charity for over 15 years. TSF runs programmes on disaster relief and preparedness, training other relief organisations and regional and national disaster response agencies about the available capabilities for emergency telecommunications. We have also continued our support for the International Telecommunications Union (‘ITU’). This was enhanced in 2015 with our signing of an MoU with ITU-D in the framework of the Smart Sustainable Development Model (‘SSDM’) to develop policies and action for governments to implement, aimed at fostering telecommunications and economic growth.
Our CEO, Rupert Pearce serves as Commissioner to the Broadband Commission for Digital Development. Set up by the ITU and UNESCO with the aim of boosting the importance of broadband on the international policy agenda and expanding broadband access to accelerate progress towards national and international development targets, as proposed by the UN. He also chairs the Broadband Commission’s Working Group on Technologies in Space and the Upper Atmosphere that will advise on how these technologies will enable new digital platforms to connect the unconnected.
FOR OVER 25 YEARS
We’re extremely proud to support Team Rubicon UK, the disaster relief and humanitarian charity that utilises the skills and expertise of military veterans, with essential satcoms for emergency deployments around the world.
Scan the image above using the Inmarsat App to watch the video.
ANNUAL REPORT AND ACCOUNTS 2016 – INMARSAT PLC – 25STRATEGIC REPORT – GOVERNANCE – FINANCIAL STATEMENTS

RESOURCES AND RELATIONSHIPS CONTINUED
In addition, Mr Pearce serves as Chairman of the Board of the EMEA Satellite Operators Association (‘ESOA’). In this role he leads his fellow CEOs in a coordinated response to the global challenges and opportunities faced by the commercial satellite communications sector. These include positioning the satellite industry to provide 5G and strategic services, advising the European Commission and national governments in Europe, the Middle East, and Africa on key matters of communications policy, and driving a strategy to grow key space industry assets such as spectrum, orbital positions, and market access rights.
Our Universal Service Obligations seek to support the use of our services, normally payphones, in rural villages in remote regions of the world, where terrestrial voice services are poor or non-existent.
Our global offices support local causes at a corporate and employee level and we encourage staff to get involved in local community initiatives. Employees across our offices are encouraged to support individual charities of their choice, and for employees in our principal UK office, this is encouraged through the UK Government’s tax approved contributions scheme.
This year we completed the African innovation pilots reported on in last year’s Annual Report and the setup of STARHub, which is now hosted at the Satellite Applications Catapult in the UK. STARHub is the only research oriented platform dedicated to fostering relationships between the satellite applications industry and emerging economy users. STARHub’s ambition is to leverage satellites in order to deliver sustainable growth in line with the UN Sustainable Development Goals.
In December 2016 we were notified that Inmarsat had won a UK Space Agency funding competition (publicly announced January 2017), which will fund three further emerging markets projects, each of which addresses a fundamental global challenge that Inmarsat is uniquely placed to contribute – each project is scheduled to run for two years. The projects are:
> Indonesia fisheries: Designing and implementing innovative solutions for smart satellite technology to promote inclusive and sustainable fishing practices in Indonesia
> Philippines: Reducing the impact of natural disasters by using satellite communications
> Nigeria eHealth: Raise the standard of Nigerian healthcare outcomes in areas with poor communications through the application of satellite connectivity
EDUCATION We continued with our funding of the Inmarsat Chair of Maritime Education and Training at the World Maritime University. Our President, Inmarsat Maritime sits on their Board of Governors. As part of this partnership we conduct a three-day Inmarsat Seminar providing information on the Inmarsat satellite systems, our maritime safety services, what being a GMDSS provider means, how accident investigations are handled and how Inmarsat supports the welfare of seafarers through its services.
We encourage internships with schools and universities to provide students with the opportunity to experience first-hand the engineering and technical aspects of satellite operations. As part of some UK Space Association funded projects, we are working with the University of Leeds on an eHealth project in Nigeria, and work with a number of universities and research centres on some of our future satellite development projects.
Now into its fourth year, this year’s award-winning Inmarsat Summer Strategy Challenge concluded well. We work with a London exemplar STEM focused college to make opportunities available to a number of their talented students to complete a challenging programme, addressing critical real world issues, such as the digital divide in Africa, the future of aero safety post MH370 and forest governance in south east Asia. We are seeking to pioneer a new model of industry-college engagement. Increasingly, experience that goes beyond the norm is essential in the route to work and Inmarsat’s programme is targeted to support deserving students, who would otherwise be disenfranchised. Additionally, the programme with the London-based school forms part of Inmarsat’s promotion of STEM education to encourage young people to be inspired by space-enabled communications and to follow careers in the satellite world.
We are also investing in the careers of future engineers with a new Technology Development Programme (‘TDP’), designed to provide newly qualified STEM-based graduates with a platform to develop a career in satellite communications. The graduate scheme confirms Inmarsat’s commitment to supporting and enabling the next generation of world-class engineers. Graduates join Inmarsat as permanent employees and for two years are exposed to four different areas of the business through formal rotations. This exposure helps to broaden their skill set and knowledge base, which they will then apply in their permanent jobs within a technology focused team once the programme finishes. It also includes a two-year tailored programme of continuous learning and development at Inmarsat. In 2016 we recruited the second generation of TDP employees and 2017 will see the third intake of graduates and the graduation of the first group into their permanent roles.
British ESA astronaut Tim Peake meets graduates from Inmarsat’s Technology Development Programme (‘TDP’) at New Scientist Live.
26 – INMARSAT PLC – ANNUAL REPORT AND ACCOUNTS 2016

Our website contains more information on the areas of education we support, including, for example our continued support for World Space Week, an initiative started by the United Nations in 1999.
ENVIRONMENTIn 2016 Inmarsat achieved a CDP (formerly known as the Carbon Disclosure Project) score of B, demonstrating that we are managing our environmental impact as well as climate change related business risks and opportunities.
Although the direct activities of the Group are judged to have a low environmental impact, we understand that, unless urgent action is taken to limit global temperatures to 2˚C above pre-industrial levels, climate change presents significant and systemic risks. By 2018, Inmarsat intends to have set a science-based emission reduction target in line with the UK’s commitment under the UN Paris Agreement thereby contributing to the global effort to prevent the worst consequences of climate change.
We have approximately 1,900 staff who work in over 50 locations around the world. Of those offices, warehouses and earth stations, over 80% of our staff operate from eight locations.
The business continues to review its location strategy with an objective to reduce the number of small locations whilst consolidating activities into the larger sites. The consolidation of our Global Logistics operations was completed in 2016. This was a two-year programme where 10 warehouses were consolidated into three warehouse hubs in Rotterdam, Houston and
Singapore. The net effect of reducing the number of offices and warehouses will be to reduce our global greenhouse gas emissions and energy consumption. We plan to continue a review of our office location strategy in 2017.
Our mission is to adopt and support the following principles:
> provide first-class energy and environmental management practices
> comply with all relevant global environmental legislation and regulatory controls
> identify significant environmental and social impacts and establish objectives and targets for improvement
> in our main UK site, to recycle a minimum of 90% of generated waste and to constantly review the opportunity to use recycled products
> to actively encourage the conservation of energy, water and natural resources through the increased efficiency and introduction of new and modern technology
> to encourage all employees to be proactive in their daily activities by separating their waste into dry and wet waste receptacles
> ensuring that printer cartridges are recycled
> switching off lights, computers, phone chargers and any other electrical items when not in use
> reducing business travel and using more site-based technology such as video and audio conferencing and
> to replace inefficient building lighting with LED technology
We continue to monitor our energy consumption and comply with our social and legal responsibilities in terms of carbon emissions. Please see our summary of carbon emissions within the Report of the Directors on page 62. Energy efficiency is one of the key considerations when replacing obsolete and inefficient machinery.
In 2016, we implemented a number of energy-saving initiatives to support our compliance efforts. We continue to review new technologies and control building operational strategies and our waste management and recycling schemes. Video conferencing and other collaboration tools allowing visual connectivity are being used to reduce the dependency on air transport and are a popular means of communication with staff working in different locations and across different time zones.
We have agreed to refurbish our HQ office in London and the enabling and installation works will focus on reducing energy consumption for the remaining 12 years of the lease.
COMMERCIAL WASTE
In the London office and at our major sites, we continue a progressive approach to waste management. Recycling is managed locally in the larger sites with the separation of plastics, paper and non-recyclable materials. In the head office in London, which is the single largest office for the Group, 100% of waste is diverted from landfill and this policy has been in place since 2009. We separate our waste into four streams: recyclable, non-recyclable, glass and confidential waste. Confidential waste is shredded and pulped to be reused in paper products. In 2016 we reduced total waste from the London head office by 10%, and 36% of this waste was recycled compared to 34% in 2015. We continue to work with our London office caterers to reduce Inmarsat’s impact on the environment. Cooking oils are now collected and converted to sustainable biofuels.
The Strategic Report, as set out on pages 1 to 55, has been approved by the Board.
On behalf of the Board
ALISON HORROCKSChief Corporate Affairs Officer and Company Secretary
8 March 2017
Inmarsat Satellite Access Station, Fucino, Italy.
ANNUAL REPORT AND ACCOUNTS 2016 – INMARSAT PLC – 27STRATEGIC REPORT – GOVERNANCE – FINANCIAL STATEMENTS

2016 was an important year for Inmarsat’s Maritime business as it introduced the next generation maritime connectivity solution, Fleet Xpress, which is setting a new standard for maritime global communications.
With crew welfare, regulatory and operational efficiency at its heart, Fleet Xpress swiftly secured commitments for thousands of vessels from the world’s leading maritime connectivity providers and major shipping lines.
Revenue
$575.3m2015: $593.2m
EBITDA
$454.8m2015: $459.4m
FleetBroadband (standalone) installed vessels
38,0882015: 39,712
VSAT installed vessels
3,0282015: 2,484
MARITIMEBUSINESS OVERVIEW
28 – INMARSAT PLC – ANNUAL REPORT AND ACCOUNTS 2016
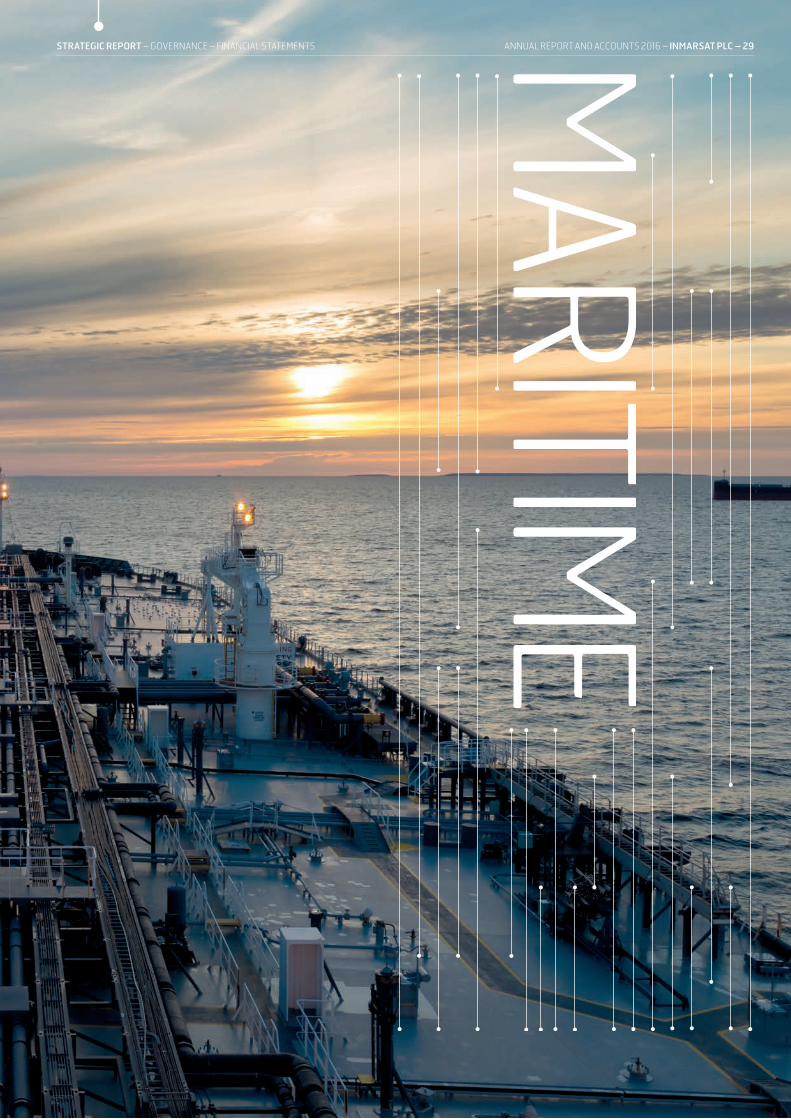
ANNUAL REPORT AND ACCOUNTS 2016 – INMARSAT PLC – 29STRATEGIC REPORT – GOVERNANCE – FINANCIAL STATEMENTS
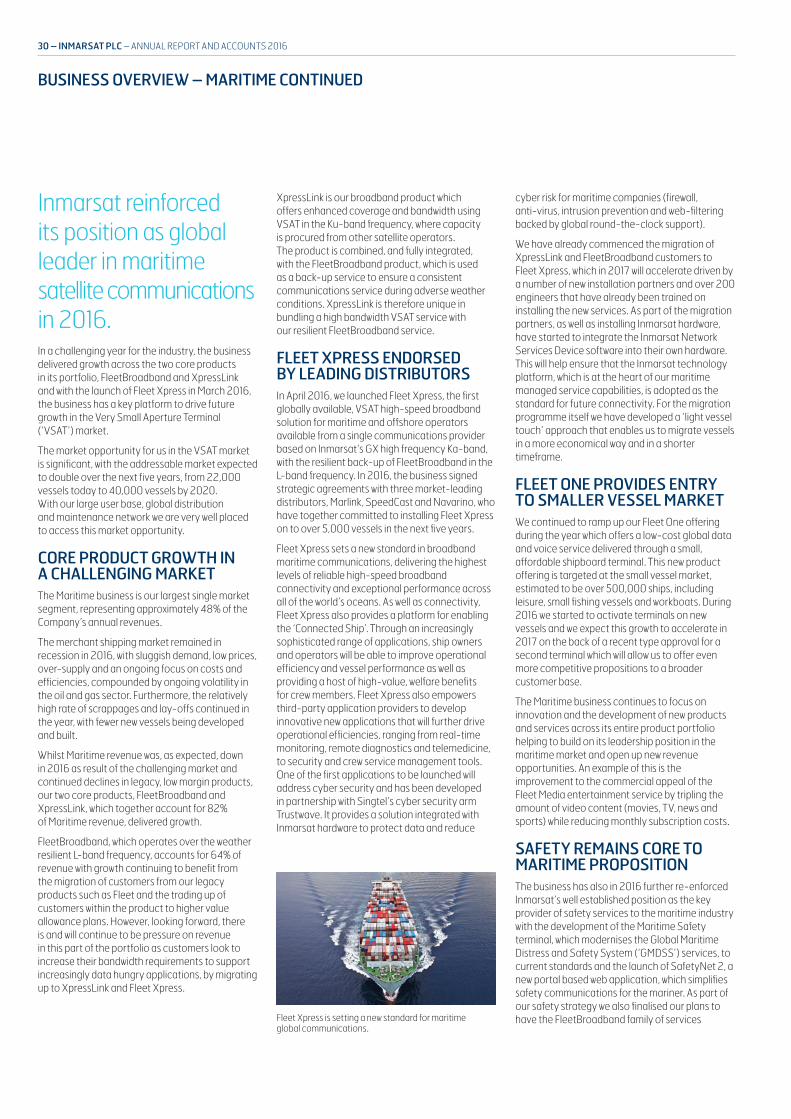
Inmarsat reinforced its position as global leader in maritime satellite communications in 2016. In a challenging year for the industry, the business delivered growth across the two core products in its portfolio, FleetBroadband and XpressLink and with the launch of Fleet Xpress in March 2016, the business has a key platform to drive future growth in the Very Small Aperture Terminal (‘VSAT’) market.
The market opportunity for us in the VSAT market is significant, with the addressable market expected to double over the next five years, from 22,000 vessels today to 40,000 vessels by 2020. With our large user base, global distribution and maintenance network we are very well placed to access this market opportunity.
CORE PRODUCT GROWTH IN A CHALLENGING MARKETThe Maritime business is our largest single market segment, representing approximately 48% of the Company’s annual revenues.
The merchant shipping market remained in recession in 2016, with sluggish demand, low prices, over-supply and an ongoing focus on costs and efficiencies, compounded by ongoing volatility in the oil and gas sector. Furthermore, the relatively high rate of scrappages and lay-offs continued in the year, with fewer new vessels being developed and built.
Whilst Maritime revenue was, as expected, down in 2016 as result of the challenging market and continued declines in legacy, low margin products, our two core products, FleetBroadband and XpressLink, which together account for 82% of Maritime revenue, delivered growth.
FleetBroadband, which operates over the weather resilient L-band frequency, accounts for 64% of revenue with growth continuing to benefit from the migration of customers from our legacy products such as Fleet and the trading up of customers within the product to higher value allowance plans. However, looking forward, there is and will continue to be pressure on revenue in this part of the portfolio as customers look to increase their bandwidth requirements to support increasingly data hungry applications, by migrating up to XpressLink and Fleet Xpress.
XpressLink is our broadband product which offers enhanced coverage and bandwidth using VSAT in the Ku-band frequency, where capacity is procured from other satellite operators. The product is combined, and fully integrated, with the FleetBroadband product, which is used as a back-up service to ensure a consistent communications service during adverse weather conditions. XpressLink is therefore unique in bundling a high bandwidth VSAT service with our resilient FleetBroadband service.
FLEET XPRESS ENDORSED BY LEADING DISTRIBUTORS In April 2016, we launched Fleet Xpress, the first globally available, VSAT high-speed broadband solution for maritime and offshore operators available from a single communications provider based on Inmarsat’s GX high frequency Ka-band, with the resilient back-up of FleetBroadband in the L-band frequency. In 2016, the business signed strategic agreements with three market-leading distributors, Marlink, SpeedCast and Navarino, who have together committed to installing Fleet Xpress on to over 5,000 vessels in the next five years.
Fleet Xpress sets a new standard in broadband maritime communications, delivering the highest levels of reliable high-speed broadband connectivity and exceptional performance across all of the world’s oceans. As well as connectivity, Fleet Xpress also provides a platform for enabling the ‘Connected Ship’. Through an increasingly sophisticated range of applications, ship owners and operators will be able to improve operational efficiency and vessel performance as well as providing a host of high-value, welfare benefits for crew members. Fleet Xpress also empowers third-party application providers to develop innovative new applications that will further drive operational efficiencies, ranging from real-time monitoring, remote diagnostics and telemedicine, to security and crew service management tools. One of the first applications to be launched will address cyber security and has been developed in partnership with Singtel’s cyber security arm Trustwave. It provides a solution integrated with Inmarsat hardware to protect data and reduce
cyber risk for maritime companies (firewall, anti-virus, intrusion prevention and web-filtering backed by global round-the-clock support).
We have already commenced the migration of XpressLink and FleetBroadband customers to Fleet Xpress, which in 2017 will accelerate driven by a number of new installation partners and over 200 engineers that have already been trained on installing the new services. As part of the migration partners, as well as installing Inmarsat hardware, have started to integrate the Inmarsat Network Services Device software into their own hardware. This will help ensure that the Inmarsat technology platform, which is at the heart of our maritime managed service capabilities, is adopted as the standard for future connectivity. For the migration programme itself we have developed a ‘light vessel touch’ approach that enables us to migrate vessels in a more economical way and in a shorter timeframe.
FLEET ONE PROVIDES ENTRY TO SMALLER VESSEL MARKETWe continued to ramp up our Fleet One offering during the year which offers a low-cost global data and voice service delivered through a small, affordable shipboard terminal. This new product offering is targeted at the small vessel market, estimated to be over 500,000 ships, including leisure, small fishing vessels and workboats. During 2016 we started to activate terminals on new vessels and we expect this growth to accelerate in 2017 on the back of a recent type approval for a second terminal which will allow us to offer even more competitive propositions to a broader customer base.
The Maritime business continues to focus on innovation and the development of new products and services across its entire product portfolio helping to build on its leadership position in the maritime market and open up new revenue opportunities. An example of this is the improvement to the commercial appeal of the Fleet Media entertainment service by tripling the amount of video content (movies, TV, news and sports) while reducing monthly subscription costs.
SAFETY REMAINS CORE TO MARITIME PROPOSITIONThe business has also in 2016 further re-enforced Inmarsat’s well established position as the key provider of safety services to the maritime industry with the development of the Maritime Safety terminal, which modernises the Global Maritime Distress and Safety System (‘GMDSS’) services, to current standards and the launch of SafetyNet 2, a new portal based web application, which simplifies safety communications for the mariner. As part of our safety strategy we also finalised our plans to have the FleetBroadband family of services Fleet Xpress is setting a new standard for maritime
global communications.
30 – INMARSAT PLC – ANNUAL REPORT AND ACCOUNTS 2016
BUSINESS OVERVIEW – MARITIME CONTINUED
approved for GMDSS; these plans are now with the International Maritime Organization (‘IMO’). This will allow voice and data safety services to operate across multiple satellite platforms for connecting vessels anywhere in the world with a Rescue Coordination Centre allowing Search and Rescue services better communication with vessels in distress.
RETURN TO MEANINGFUL GROWTH DEPENDENT ON BROADER MACRO FACTORS IN GLOBAL SHIPPING MARKET Though the business is dependent upon the overall health of the global shipping industry for a return to meaningful growth, our Maritime business enters 2017 in an increasingly strong position with a market-leading portfolio of products in Fleet Xpress and FleetBroadband for the commercial shipping market. And in Fleet One the business is poised to grow its share in the smaller vessels market.
2016 PERFORMANCE REVIEWMaritime revenues in 2016 decreased by $17.9m (3.0%) to $575.3m (2015: $593.2m). Within these overall totals we saw strong revenue growth from both our market-leading FleetBroadband (‘FB’) product and in our newer VSAT offerings (XpressLink ‘XL’ and FleetXpress ‘FX’) which together accounted for 82% of 2016 Maritime revenues (2015: 76%). This growth was however, as anticipated, more than offset by the continued decline in our other, mainly lower margin, legacy products, including Fleet. Changes in the key elements of our product portfolio during the year are outlined in the table at the foot of this page.
FB revenue grew by $8.5m, or 2.4%, to $368.2m. Average revenue per user (‘ARPU’) increased in 2016, incorporating the impact of price changes in H1 2016 and the migration of users to higher rate plans during the year. The number of vessels generating FB revenue fell, reflecting ongoing market softness, particularly in lower ARPU vessels, migration to our new Fleet One product and the generally ARPU accretive migration of 533 ships up to VSAT.
VSAT revenue (including XL and FX) grew by $11.1m, or 12.1%, to $102.9m, with the number of installations rising 21.9% from 2015. There were 205 ships migrated to FX from other VSAT products and 130 new FX installations were completed, bringing the total FX installations to 335 vessels by the end of the year.
VSAT ARPU was 9.3% lower than 2015, driven mainly by the renewal of old contracts at current prices, more ships being laid up (on reduced charges) and the start of a change in mix towards wholesale distribution agreements. The VSAT installation order book remained material at over 500 vessels.
Revenue from our other mainly lower margin and legacy products continued to decline, as expected, falling by $37.5m, or 26.5%, to $104.2m in 2016 (the level of decline in 2015 was 32.0%). Within these totals, Fleet revenue continued to decline in line with past trends, falling by $19.4m, or 55.1%, to $15.9m in 2016.
Fleet One has continued to grow strongly with 245 new Fleet One users installed during the fourth quarter. This takes the Fleet One customer base to over 1,250 vessels, with an annualised revenue run rate of around $1.4m.
Operating costs for the year decreased by $13.3m (9.9%), mainly reflecting the impact of an internal reorganisation in July which has moved approximately $4m of costs from Maritime into Central Services and the weakness of Sterling versus the US Dollar.
Maritime EBITDA decreased by $4.6m (1.0%) compared with the full year 2015 and the EBITDA margin for the year improved to 79.1% from 77.4%.
ANNUAL REPORT AND ACCOUNTS 2016 – INMARSAT PLC – 31STRATEGIC REPORT – GOVERNANCE – FINANCIAL STATEMENTS
MARITIME BUSINESS RESULTS
($ in millions)
Year ended 31 December
2016
Year ended 31 December
2015Increase/
(decrease)
Revenue 575.3 593.2 (3.0%)
Operating costs (120.5) (133.8) (9.9%)
EBITDA 454.8 459.4 (1.0%)
EBITDA margin % 79.1% 77.4%
Cash capex 43.8 30.1 45.5%
PRODUCT PORTFOLIO
Revenue Number of vesselsAverage revenueper user (‘ARPU’)
2016 2015 2016 2015 2016 2015
FB – Standalone $368.2m $359.7m
38,088 39,712 $787 $756
FB – Inc. VSAT back-up 41,032 41,942 $736 $724
VSAT (XL and FX) $102.9m $91.8m 3,028 2,484 $3,112 $3,433
Other products $104.2m $141.7m

2016 saw Inmarsat’s Enterprise business beginning an important transformation; moving away from a simple product focus strategy and towards delivering added value solutions into specific market sectors will help the business differentiate itself in the market and drive sustainable long term growth.
The Enterprise business laid the foundations for growth in the rapidly emerging Internet of Things (‘IoT’), reflecting the growing recognition that highly reliable, secure, mobile and globally available connectivity services delivered via satellite will be crucial in supporting and empowering the emerging digital society.
Revenue
$144.6m2015: $159.5m
EBITDA
$105.9m2015: $113.1m
Number of connected M2M terminals
333,0002015: 326,000
Number of connected GSPS terminals
158,0002015: 141,000
ENTERPRISEBUSINESS OVERVIEW
32 – INMARSAT PLC – ANNUAL REPORT AND ACCOUNTS 2016

ANNUAL REPORT AND ACCOUNTS 2016 – INMARSAT PLC – 33STRATEGIC REPORT – GOVERNANCE – FINANCIAL STATEMENTS
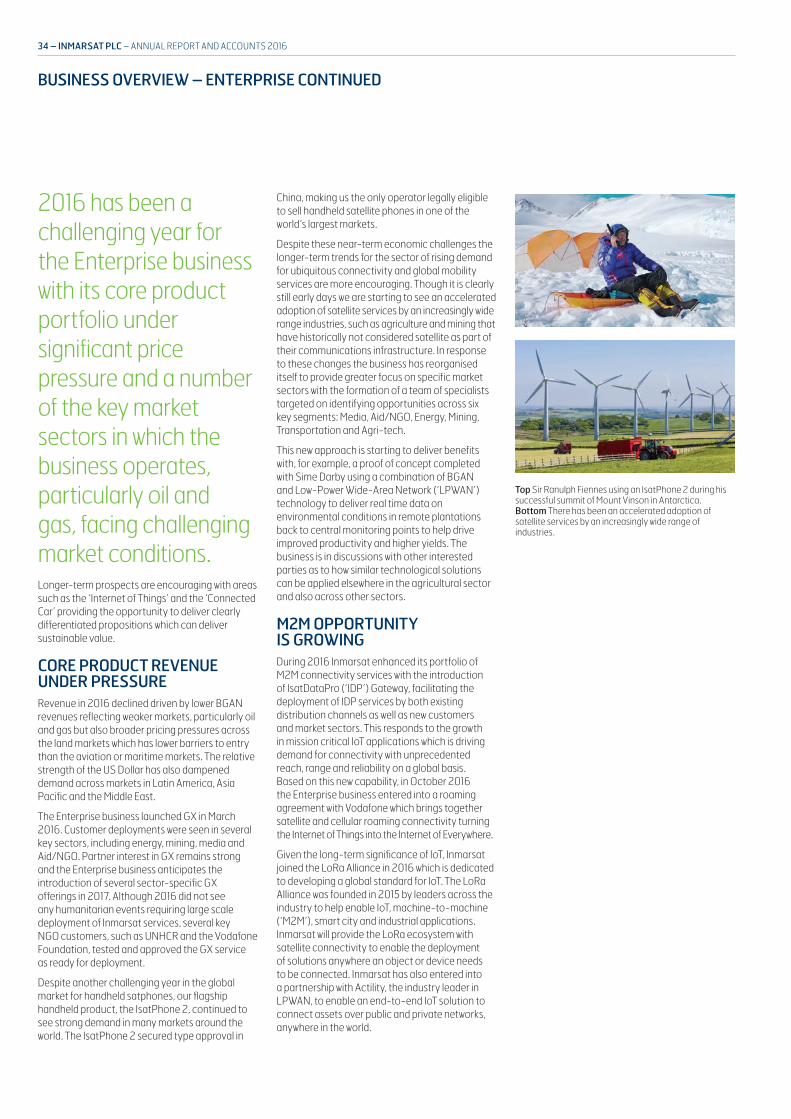
2016 has been a challenging year for the Enterprise business with its core product portfolio under significant price pressure and a number of the key market sectors in which the business operates, particularly oil and gas, facing challenging market conditions.Longer-term prospects are encouraging with areas such as the ‘Internet of Things’ and the ‘Connected Car’ providing the opportunity to deliver clearly differentiated propositions which can deliver sustainable value.
CORE PRODUCT REVENUE UNDER PRESSURE Revenue in 2016 declined driven by lower BGAN revenues reflecting weaker markets, particularly oil and gas but also broader pricing pressures across the land markets which has lower barriers to entry than the aviation or maritime markets. The relative strength of the US Dollar has also dampened demand across markets in Latin America, Asia Pacific and the Middle East.
The Enterprise business launched GX in March 2016. Customer deployments were seen in several key sectors, including energy, mining, media and Aid/NGO. Partner interest in GX remains strong and the Enterprise business anticipates the introduction of several sector-specific GX offerings in 2017. Although 2016 did not see any humanitarian events requiring large scale deployment of Inmarsat services, several key NGO customers, such as UNHCR and the Vodafone Foundation, tested and approved the GX service as ready for deployment.
Despite another challenging year in the global market for handheld satphones, our flagship handheld product, the IsatPhone 2, continued to see strong demand in many markets around the world. The IsatPhone 2 secured type approval in
China, making us the only operator legally eligible to sell handheld satellite phones in one of the world’s largest markets.
Despite these near-term economic challenges the longer-term trends for the sector of rising demand for ubiquitous connectivity and global mobility services are more encouraging. Though it is clearly still early days we are starting to see an accelerated adoption of satellite services by an increasingly wide range industries, such as agriculture and mining that have historically not considered satellite as part of their communications infrastructure. In response to these changes the business has reorganised itself to provide greater focus on specific market sectors with the formation of a team of specialists targeted on identifying opportunities across six key segments: Media, Aid/NGO, Energy, Mining, Transportation and Agri-tech.
This new approach is starting to deliver benefits with, for example, a proof of concept completed with Sime Darby using a combination of BGAN and Low-Power Wide-Area Network (‘LPWAN’) technology to deliver real time data on environmental conditions in remote plantations back to central monitoring points to help drive improved productivity and higher yields. The business is in discussions with other interested parties as to how similar technological solutions can be applied elsewhere in the agricultural sector and also across other sectors.
M2M OPPORTUNITY IS GROWINGDuring 2016 Inmarsat enhanced its portfolio of M2M connectivity services with the introduction of IsatDataPro (‘IDP’) Gateway, facilitating the deployment of IDP services by both existing distribution channels as well as new customers and market sectors. This responds to the growth in mission critical IoT applications which is driving demand for connectivity with unprecedented reach, range and reliability on a global basis. Based on this new capability, in October 2016 the Enterprise business entered into a roaming agreement with Vodafone which brings together satellite and cellular roaming connectivity turning the Internet of Things into the Internet of Everywhere.
Given the long-term significance of IoT, Inmarsat joined the LoRa Alliance in 2016 which is dedicated to developing a global standard for IoT. The LoRa Alliance was founded in 2015 by leaders across the industry to help enable IoT, machine-to-machine (‘M2M’), smart city and industrial applications. Inmarsat will provide the LoRa ecosystem with satellite connectivity to enable the deployment of solutions anywhere an object or device needs to be connected. Inmarsat has also entered into a partnership with Actility, the industry leader in LPWAN, to enable an end-to-end IoT solution to connect assets over public and private networks, anywhere in the world.
Top Sir Ranulph Fiennes using an IsatPhone 2 during his successful summit of Mount Vinson in Antarctica.Bottom There has been an accelerated adoption of satellite services by an increasingly wide range of industries.
34 – INMARSAT PLC – ANNUAL REPORT AND ACCOUNTS 2016
BUSINESS OVERVIEW – ENTERPRISE CONTINUED

SUPPORTING ECONOMIC DEVELOPMENT IN EMERGING COUNTRIESIn 2016 we completed a two-year UK Space Agency (‘UKSA’) funded programme that assessed the benefits derived from the availability of Inmarsat communications systems in improving economic development in emerging countries in Africa, Asia and South America. As part of the programme, trials were conducted in Kenya, Nigeria and the Philippines targeting essential services such as remote banking, e-learning, agriculture market access and e-health provision. Results from the trials were used to identify and target high potential use cases for mobile satellite as an enabler of inclusive development in often resource poor countries.
SOLUTION-BASED REVENUE WILL DRIVE LONG-TERM GROWTHThe reorganisation of the business away from a simple product focus towards delivering added value solutions into specific market sectors will help us differentiate ourselves in the market and help to drive sustainable long-term growth.
However, in the short term, as the business goes through this transition, the growth in solution-based revenue will be more than offset by the decline in legacy revenue, particularly in the land segment where there is intense competition from low-cost operators.
2016 PERFORMANCE REVIEWEnterprise revenues fell by $14.9m (9.3%) to $144.6m (2015: $159.5m).
BGAN revenues were 21.2% lower, including a decline of 11.3% in Q4 2016, reflecting weaker markets, particularly Oil and Gas. The overall number of terminals increased in this sector, but customers are optimising their price plans and usage profiles, resulting in lower revenues.
GSPS revenues, comprising both terminals and airtime, were 8.4% ahead of the prior year, which was heavily impacted by third-party manufacturing issues. The number of connected GSPS terminals was around 158,000 at the end of the year (2015: 141,000).
Fixed to mobile revenues grew by $4.7m in 2016 following price rises in February, to align with market prices, despite underlying volume decreases as voice moves to VOIP.
M2M revenue was 3.1% higher than the prior year. The number of connected M2M terminals was around 333,000 at the end of the year (2015: 326,000).
Operating costs for the year decreased by $7.7m, or 16.6%, to $38.7m (2015: $46.4m), with higher costs from the increased supply of GSPS terminals being offset by reductions in other direct costs during the year.
Consequently, Enterprise EBITDA was $7.2m or 6.4% lower at $105.9m (2015: $113.1m), with the EBITDA margin slightly higher at 73.2% (2015: 70.9%).
ANNUAL REPORT AND ACCOUNTS 2016 – INMARSAT PLC – 35STRATEGIC REPORT – GOVERNANCE – FINANCIAL STATEMENTS
ENTERPRISE BUSINESS RESULTS
($ in millions)
Year ended 31 December
2016
Year ended 31 December
2015Increase/
(decrease)
Revenue 144.6 159.5 9.3%
Operating costs (38.7) (46.4) (16.6%)
EBITDA 105.9 133.1 (6.4%)
EBITDA margin % 73.2% 70.9%
Cash capex 0.4 0.3 33.3%
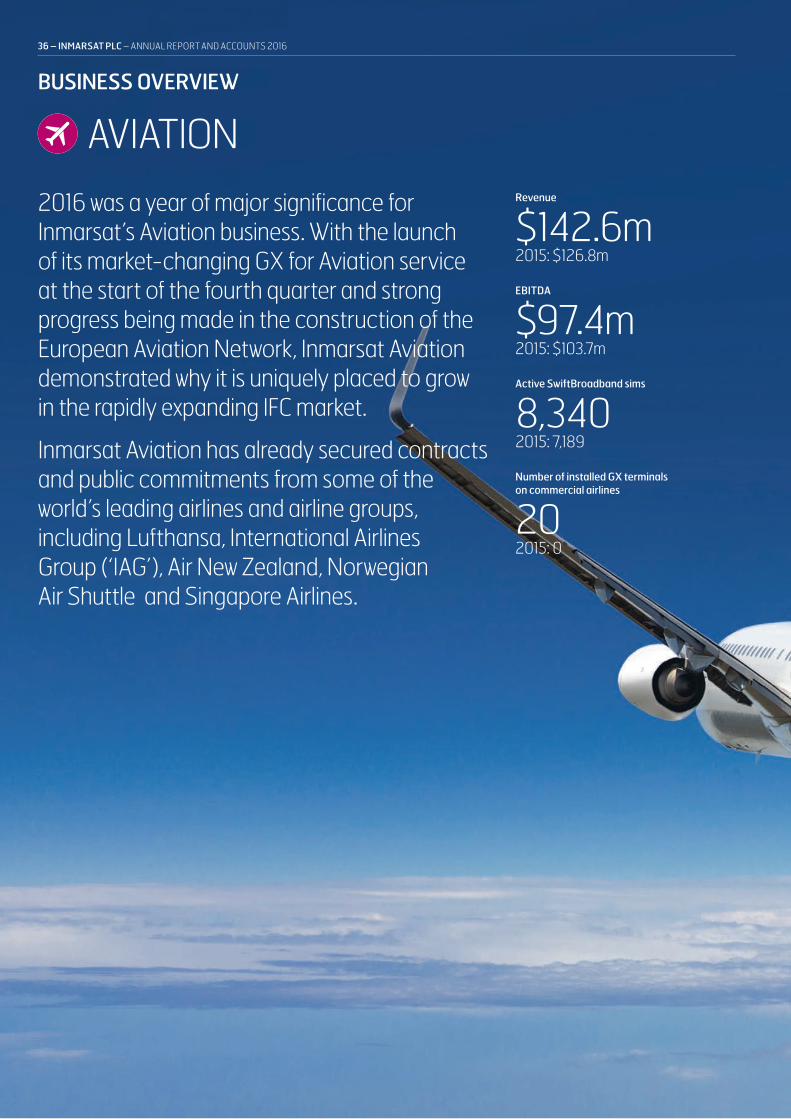
2016 was a year of major significance for Inmarsat’s Aviation business. With the launch of its market-changing GX for Aviation service at the start of the fourth quarter and strong progress being made in the construction of the European Aviation Network, Inmarsat Aviation demonstrated why it is uniquely placed to grow in the rapidly expanding IFC market.
Inmarsat Aviation has already secured contracts and public commitments from some of the world’s leading airlines and airline groups, including Lufthansa, International Airlines Group (‘IAG’), Air New Zealand, Norwegian Air Shuttle and Singapore Airlines.
Revenue
$142.6m2015: $126.8m
EBITDA
$97.4m2015: $103.7m
Active SwiftBroadband sims
8,3402015: 7,189
Number of installed GX terminals on commercial airlines
202015: 0
AVIATIONBUSINESS OVERVIEW
36 – INMARSAT PLC – ANNUAL REPORT AND ACCOUNTS 2016

Revenue
$142.6m2015: $126.8m
EBITDA
$97.4m2015: $103.7m
Active SwiftBroadband sims
8,3402015: 7,189
Number of installed GX terminals on commercial airlines
202015: 0
ANNUAL REPORT AND ACCOUNTS 2016 – INMARSAT PLC – 37STRATEGIC REPORT – GOVERNANCE – FINANCIAL STATEMENTS

Aviation is a major growth opportunity for Inmarsat, particularly IFC, where the number of connected commercial aircraft is expected to grow from 6,000 in 2016 to 15,000 by 2020. Our background in managing connectivity for the Business and General Aviation (‘BGA’) sectors means Inmarsat is uniquely well placed to capitalise on this opportunity and the combination of our GX and European Aviation Networks (‘EAN’) provides us with an unrivalled combination of global coverage and high bandwidth across Europe to ensure that the business remains competitive in a fast-evolving market.
Following Lufthansa in 2015, Norwegian Air Services, Singapore Airlines and Air New Zealand have announced to be GX for Aviation customers. In addition, IAG, which houses the British Airways, Vueling, Iberia and Aer Lingus brands, confirmed in early 2017 that it will be the launch customer for the EAN. Consequently, we have 950 expected aircraft under signed contracts.
STRONG GROWTH FROM CORE BUSINESS Our Aviation business continued to both grow its existing core business of SwiftBroadband (‘SB’) and Classic Aero (‘CA’), strongly in 2016 whilst at the same time making significant progress in establishing a platform for building a global position for delivering IFC on commercial airlines.
Aviation’s revenue growth was driven by strong year-on-year growth in the number of SB installed aircraft and a higher Average Revenue Per User (‘ARPU’) on CA.
EARLY TRACTION FOR GX FOR AVIATIONThe GX for Aviation development programme focused on delivering high-quality passenger connectivity services, successfully passed a number critical milestones during the year with Federal Aviation Authority (‘FAA’) certification of the GX-exclusive Jetwave terminal for the Boeing 757 in January and European Air Safety (‘EASA’)
SAFETY REMAINS A KEY ELEMENT OF OUR AVIATION OFFERINGAviation safety services continue to be an important area of focus for the industry. SwiftBroadband Safety (‘SB-S’) is our next generation communications platform offering global, high-speed, secure IP connectivity for the flight deck, an evolution of our Classic Aero product. It enhances airline safety and operations through more powerful and flexible communications and the availability of real-time, in-air information for pilots, crew and air traffic management. It represents a paradigm shift in aviation safety services, delivering always on, always secure applications such as flight data streaming (‘Black Box in the Cloud’) and real-time Electronic Flight Bag applications, including networked graphical weather. SB-S has received a high level of industry support, including the selection by Airbus of the solution for its A320 and A330 aircraft families. In addition, memoranda of understanding for the introduction and distribution of SB-S have been signed with four major distributors, and the service is expected to be launched in the coming year.
Europe’s programme to create the world’s most advanced and secure air traffic management (‘ATM’) system took another step forward in 2016, with us being awarded a contract to lead the IRIS Service Evolution programme which is the next phase of the project. The programme is focused on using advanced satellite technology to improve aeronautical data link services, enabling flight plans to be updated continuously, even while aircraft are on route to their destination. This will lead to the optimisation of European airspace and airport capacity as well as reductions in flight times, fuel burn and CO2 emissions. While the programme will initially focus on Europe, the services developed will also benefit ATM in other regions where the growth of air traffic is placing a strain on ground-based networks. The services being developed are supported by our next-generation SB-S system.
PACE OF MARKET GROWTH SET TO ACCELERATE Aviation continues to be a major growth market, with IFC into the cockpit and the cabin, in both large commercial aircraft and smaller business jets, expected to see strong growth over the coming years. Whilst IFC into commercial aircraft in particular is still very much in its infancy, particularly in Europe, Asia and the Middle East, this sector of the industry is expected to develop at pace over the short term as airlines continue to seek to offer their customers high-quality service in all aspects of the aviation experience. Growth in the industry will be driven by the increasing number of aircraft in the sky, the need for more capable and sophisticated operational and safety services in the cockpit and the increasing demand from passengers to remain online when they are flying.
certification for the Airbus A320-family in June 2016. During the summer, GX for Aviation was rigorously tested and demonstrated to distribution partners in collaboration with Honeywell, our exclusive terminal partner for GX, on a Boeing 757 aircraft. This involved flying over 80,000km across five continents giving executives from over 40 airlines the opportunity to validate and test the GX for Aviation functionality including streaming video calls, live radio, browsing, emailing and downloading files.
GX for Aviation was successfully launched at the Airline Passenger Experience Expo (‘APEX’) in Singapore in October 2016. The commercial service introduction of Jet ConneX (‘JX’), the next-generation broadband aviation service running over the GX network aimed specifically at the business jet market, was announced in November 2016. Both services will be offered as a line-fit or a retrofit on an expanding number of commercial and business aircraft.
Following on from the 10-year IFC contract signed with the Lufthansa Group in 2015, GX for Aviation was installed on 20 aircraft in the final quarter of 2016 as part of the soft-launch phase. Commercial launch of the service is expected in the first half of 2017. Our installation partner Lufthansa Technik has set-up 10 parallel production lines, taking just four days to complete a GX aircraft installation, supporting an expectation of a relatively fast service roll-out. The original 2015 contract has since been expanded to include Austrian Airlines’ European fleet and low-cost carrier Eurowings.
We are in advanced stages of negotiation with other major commercial airlines around the world to provide IFC solutions for their passengers. Within two months of launching GX for Aviation, the backlog grew to approximately 600 aircraft, which includes amongst others Singapore Airlines, Norwegian Air Shuttle and Air New Zealand.
DEVELOPMENT OF EAN REMAINS ON TRACKThe EAN is a strategic partnership with Deutsche Telekom (‘DT’) for delivering a hybrid high- capacity S-band satellite and LTE-based ground network across 30 countries in Europe and some neighbouring countries. We will supply and manage the satellite service component of the network, and will lead the marketing and sales of the integrated connectivity service to airlines, whilst DT will build and manage the complementary ground network. The planned deployment of the EAN remains on track for the second half of 2017 despite some delays in the S-band satellite launch, primarily due to a SpaceX rocket failure. The satellite has been rescheduled for a mid-2017 launch on an Ariane 5 rocket which will support the planned EAN operational introduction by the end of 2017.
38 – INMARSAT PLC – ANNUAL REPORT AND ACCOUNTS 2016
BUSINESS OVERVIEW – AVIATION CONTINUED

2016 PERFORMANCE REVIEWIn Aviation, our strong track record in connectivity services in BGA has put us in a good position from which to maximise the potentially significant opportunity in the area of IFC in Commercial Aviation in the coming years.
In 2016, Aviation revenue grew by $15.8m, or 12.5%, to $142.6m (2015: $126.8m), including growth of $5.8m, or 16.0%, to $42.1m in Q4 2016 (Q4 2015: $36.3m). Changes in the key elements of our two existing L-band based products, SwiftBroadband and Classic Aero, during the year are outlined in the table at the foot of this page.
SwiftBroadband revenues grew by 8.7%, supported by strong year-on-year growth in the number of installed aircraft. This was offset by the ongoing overall market reduction in usage, particularly in Europe and the Middle East, which impacted ARPU.
Classic Aero services revenues grew strongly in the year. Revenue grew by 24.3%, with an increase in both the number of installed aircraft and ARPU.
In IFC in Commercial Aviation, the first 20 Deutsche Lufthansa Group aircraft were installed with GX terminals in the fourth quarter, resulting in $1.6m of relatively low margin pass-through installation revenues.
Total operating costs in Aviation increased by $22.1m, or 95.7%, to $45.2m (2015: $23.1), due primarily to increased headcount and other overhead costs associated with the pursuit and delivery of the major growth opportunities in IFC. We will continue to invest in these areas in order to maximise significant longer-term growth opportunities and further overhead cost increases are consequently expected. In addition, further increases in direct costs should be expected as additional lower margin installation revenues are added to the revenue mix.
Aviation EBITDA in 2016 decreased by $6.3m, or 6.1%, to $97.4m (2015: $103.7m) and the EBITDA margin in the year decreased to 68.3% (2015: 81.8%) mainly due to increased business development and delivery costs and the generation of lower margin installation revenues.
Top The European Aviation Network will deliver a hybrid high-capacity S-band satellite and LTE-based ground network across Europe. Bottom In collaboration with Honeywell, 40 airlines were given the opportunity to test GX Aviation on a Boeing 757.
ANNUAL REPORT AND ACCOUNTS 2016 – INMARSAT PLC – 39STRATEGIC REPORT – GOVERNANCE – FINANCIAL STATEMENTS
AVIATION BUSINESS RESULTS
($ in millions)
Year ended 31 December
2016
Year ended 31 December
2015Increase/
(decrease)
Revenue 142.6 126.8 12.5%
Operating costs (45.2) (23.1) 95.7%
EBITDA 97.4 103.7 (6.1%)
EBITDA margin % 68.3% 81.8%
Cash capex 153.0 64.4 137.6%
PRODUCT PORTFOLIO - CORE AVIATION BUSINESS
RevenueNumber of
installed aircraftAverage revenueper user (‘ARPU’)
2016 2015 2016 2015 2016 2015
SwiftBroadband $92.0m $84.6m 8,340 7,189 $979 $1,098
Classic Aero $36.3m $29.2m 8,097 7,744 $393 $327

The government market remains challenging on a global scale but Inmarsat saw strong growth in 2016 driven by both its new Global Xpress wideband platform and unique innovations in its L-band services. During the year, Inmarsat’s government business and its subsidiaries secured major contracts to support the US Navy’s Commercial Broadband Satellite Program (‘CBSP’) Satellite Services Contract (‘CSSC’); a new five-year contract with the Canadian Government for the supply of satellite and associated services; and a five-year contract with Australia’s Department of Immigration and Border Protection (‘DIBP’).
Revenue
$330.5m2015: $286.6m
EBITDA
$244.0m2015: $191.0m
GOVERNMENTBUSINESS OVERVIEW
40 – INMARSAT PLC – ANNUAL REPORT AND ACCOUNTS 2016

ANNUAL REPORT AND ACCOUNTS 2016 – INMARSAT PLC – 41STRATEGIC REPORT – GOVERNANCE – FINANCIAL STATEMENTS
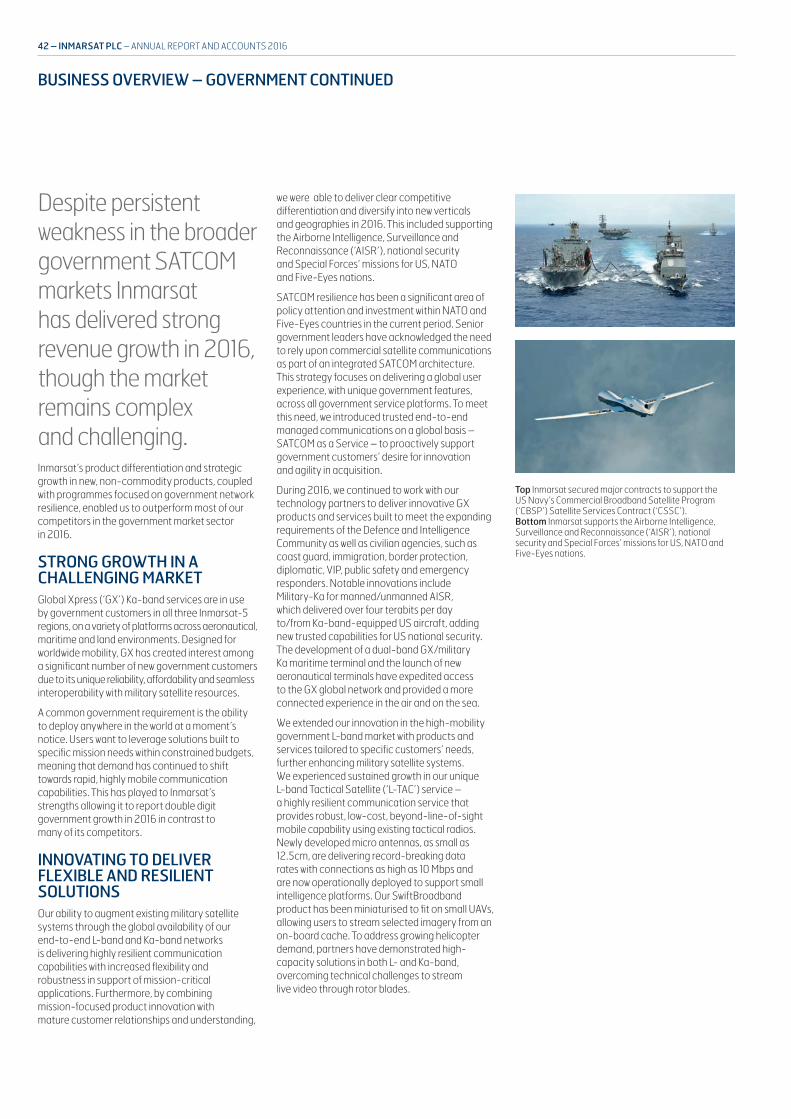
Despite persistent weakness in the broader government SATCOM markets Inmarsat has delivered strong revenue growth in 2016, though the market remains complex and challenging. Inmarsat’s product differentiation and strategic growth in new, non-commodity products, coupled with programmes focused on government network resilience, enabled us to outperform most of our competitors in the government market sector in 2016.
STRONG GROWTH IN A CHALLENGING MARKETGlobal Xpress (‘GX’) Ka-band services are in use by government customers in all three Inmarsat-5 regions, on a variety of platforms across aeronautical, maritime and land environments. Designed for worldwide mobility, GX has created interest among a significant number of new government customers due to its unique reliability, affordability and seamless interoperability with military satellite resources.
A common government requirement is the ability to deploy anywhere in the world at a moment’s notice. Users want to leverage solutions built to specific mission needs within constrained budgets, meaning that demand has continued to shift towards rapid, highly mobile communication capabilities. This has played to Inmarsat’s strengths allowing it to report double digit government growth in 2016 in contrast to many of its competitors.
INNOVATING TO DELIVER FLEXIBLE AND RESILIENT SOLUTIONSOur ability to augment existing military satellite systems through the global availability of our end-to-end L-band and Ka-band networks is delivering highly resilient communication capabilities with increased flexibility and robustness in support of mission-critical applications. Furthermore, by combining mission-focused product innovation with mature customer relationships and understanding,
we were able to deliver clear competitive differentiation and diversify into new verticals and geographies in 2016. This included supporting the Airborne Intelligence, Surveillance and Reconnaissance (‘AISR’), national security and Special Forces’ missions for US, NATO and Five-Eyes nations.
SATCOM resilience has been a significant area of policy attention and investment within NATO and Five-Eyes countries in the current period. Senior government leaders have acknowledged the need to rely upon commercial satellite communications as part of an integrated SATCOM architecture. This strategy focuses on delivering a global user experience, with unique government features, across all government service platforms. To meet this need, we introduced trusted end-to-end managed communications on a global basis – SATCOM as a Service – to proactively support government customers’ desire for innovation and agility in acquisition.
During 2016, we continued to work with our technology partners to deliver innovative GX products and services built to meet the expanding requirements of the Defence and Intelligence Community as well as civilian agencies, such as coast guard, immigration, border protection, diplomatic, VIP, public safety and emergency responders. Notable innovations include Military-Ka for manned/unmanned AISR, which delivered over four terabits per day to/from Ka-band-equipped US aircraft, adding new trusted capabilities for US national security. The development of a dual-band GX/military Ka maritime terminal and the launch of new aeronautical terminals have expedited access to the GX global network and provided a more connected experience in the air and on the sea.
We extended our innovation in the high-mobility government L-band market with products and services tailored to specific customers’ needs, further enhancing military satellite systems. We experienced sustained growth in our unique L-band Tactical Satellite (‘L-TAC’) service – a highly resilient communication service that provides robust, low-cost, beyond-line-of-sight mobile capability using existing tactical radios. Newly developed micro antennas, as small as 12.5cm, are delivering record-breaking data rates with connections as high as 10 Mbps and are now operationally deployed to support small intelligence platforms. Our SwiftBroadband product has been miniaturised to fit on small UAVs, allowing users to stream selected imagery from an on-board cache. To address growing helicopter demand, partners have demonstrated high- capacity solutions in both L- and Ka-band, overcoming technical challenges to stream live video through rotor blades.
Top Inmarsat secured major contracts to support the US Navy’s Commercial Broadband Satellite Program (‘CBSP’) Satellite Services Contract (‘CSSC’).Bottom Inmarsat supports the Airborne Intelligence, Surveillance and Reconnaissance (‘AISR’), national security and Special Forces’ missions for US, NATO and Five-Eyes nations.
42 – INMARSAT PLC – ANNUAL REPORT AND ACCOUNTS 2016
BUSINESS OVERVIEW – GOVERNMENT CONTINUED

SIGNIFICANT CONTRACT WINS ACROSS MULTIPLE MARKETSIn the US Government market, Inmarsat Government, a wholly-owned Inmarsat subsidiary, was awarded a contract to support the US Navy’s Commercial Broadband Satellite Program (‘CBSP’) Satellite Services Contract (‘CSSC’). Under the contract, Inmarsat Government will support the US Navy’s requirement to acquire worldwide commercial telecommunication services – to include satellite capacity for maritime, airborne and ground platforms – that augment government-owned and operated telecommunication systems.
We further strengthened our existing relationship with the Canadian Government through the signing of a new five-year contract for the supply of satellite and associated services. The new contract ensures the continued supply of MSS and L-band services to all Canadian Government departments while also filling a large regional MSS/FSS technology gap through the introduction of the entire GX Ka-band portfolio.
In Australia, we signed a five-year contract with the Department of Immigration and Border Protection (‘DIBP’). The agreement is for the provision of broadband connectivity and support services, including SATCOM terminals to DIBP’s fleet of eight Cape Class vessels, as well as to additional support vessels and surveillance aircraft. The GX/FleetBroadband/SwiftBroadband solution includes the provision of a custom-built terminal that allows for switching between military and commercial satellite networks ensuring that this mission critical department is connected across all assets, at all times.
In 2016, Inmarsat GX won the Mobile Satellite Users Association award for government mobility and the Government Security News’ Homeland Security Award for best satellite-based broadband communication solution. These prestigious awards further validate GX as an industry game changer, with unmatched mobile capabilities and benefits. It is the first and only end-to-end commercial Ka-band network from a single operator that delivers worldwide service, bringing the benefits of seamless, consistent, high-throughput wideband connectivity to government users worldwide.
Our government customers are dedicated to service and national security and safety, protecting borders, saving lives at sea, fighting crime, illness and fire. In 2016, government rescuers pulled thousands of migrants out of rough seas in the Mediterranean, using Inmarsat’s FleetBroadband from their ships and SwiftBroadband in their aircraft to manage the operation. They deployed Inmarsat services to Haiti after the hurricanes, and to the Middle East protecting civilians during intense conflict.
UNIQUELY WELL PLACED TO SERVE CUSTOMERS’ EVOLVING NEEDSInmarsat is uniquely positioned with its trusted capabilities and technology innovation well matched to government customers’ evolving needs and demand for resilience. We are committed to investing into next-generation commercial satellite networks and technologies built with government users in mind, enabling cost-effective worldwide augmentation of military narrowband and wideband networks that deliver optimal reliability and ubiquitous global coverage providing the ultimate resilience approach.
2016 PERFORMANCE REVIEWDespite underlying downward pressure in the government satellite communications sector in 2016, government revenues increased by $43.9m, or 15.3%, to $330.5m (2015: $286.6m).
In the US, government revenues grew by 19.5% in 2016 primarily due to the growth in higher margin GX-related revenues under the take or pay agreement with our partner, and a short-term, one-off bandwidth contract in Q4.
Outside the US, Government revenues rose by 9.5% during the year, as we benefited from operational tempo in one particular region, which initially started in Q3 2015.
Operating costs for the year decreased by 9.5%, mainly reflecting improved revenue mix in our US business, with lower third-party Ku-band revenue being replaced with high-margin GX revenue.
Government EBITDA in the year increased by $53.0m (27.7%) to $244.0m (2015: $191.0), reflecting improved revenue mix. The EBITDA margin similarly increased to 73.8% (2015: 66.6%).
ANNUAL REPORT AND ACCOUNTS 2016 – INMARSAT PLC – 43STRATEGIC REPORT – GOVERNANCE – FINANCIAL STATEMENTS
GOVERNMENT BUSINESS RESULTS
($ in millions)
Year ended 31 December
2016
Year ended 31 December
2015Increase/
(decrease)
Revenue 330.5 286.6 15.3%
Operating costs (86.5) (95.6) (9.5%)
EBITDA 244.0 191.0 27.7%
EBITDA margin % 73.8% 66.6%
Cash capex 6.1 4.4 38.6%

The Central Services team are responsible for developing new products, satellites, terminals and networks that will meet our customers’ needs well into the 21st century as well as ensuring that our satellites, ground stations and core network are available 24/7.
In addition, the Central Services team provide corporate, financial, legal, governance, customer services, regulatory, IT and HR services to the broader business.
BUSINESS OVERVIEW
CENTRAL SERVICES
44 – INMARSAT PLC – ANNUAL REPORT AND ACCOUNTS 2016
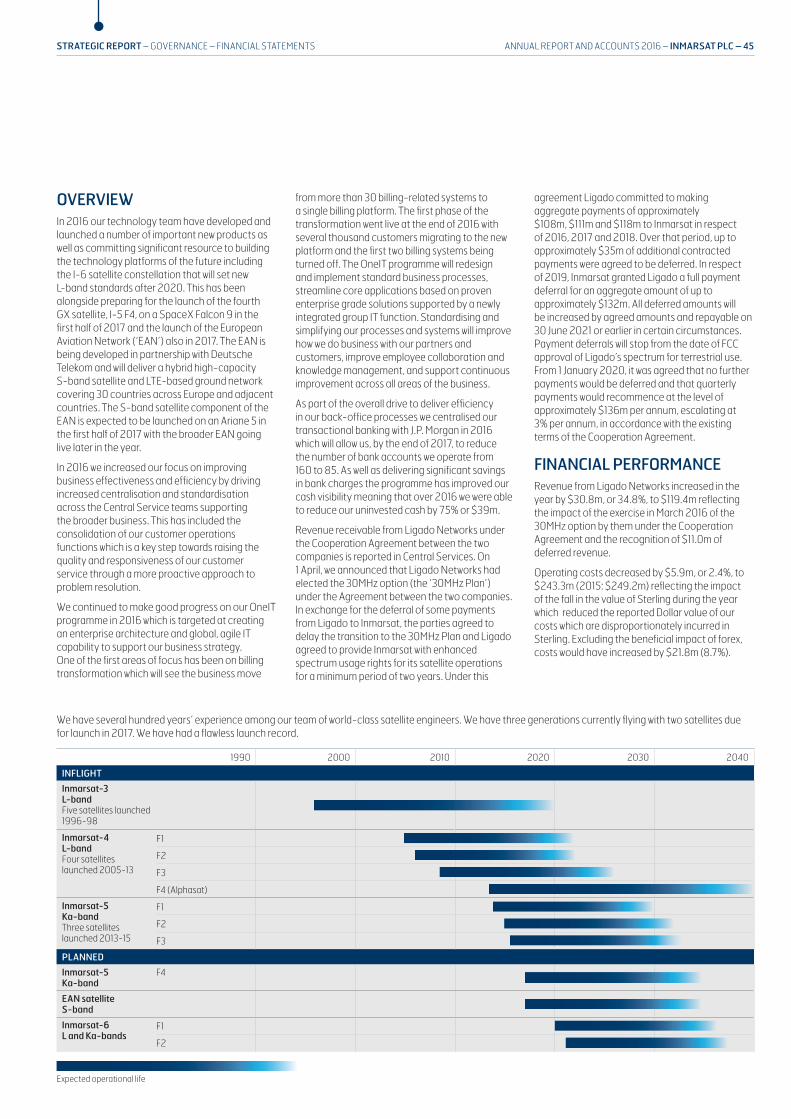
OVERVIEWIn 2016 our technology team have developed and launched a number of important new products as well as committing significant resource to building the technology platforms of the future including the I-6 satellite constellation that will set new L-band standards after 2020. This has been alongside preparing for the launch of the fourth GX satellite, I-5 F4, on a SpaceX Falcon 9 in the first half of 2017 and the launch of the European Aviation Network (‘EAN’) also in 2017. The EAN is being developed in partnership with Deutsche Telekom and will deliver a hybrid high-capacity S-band satellite and LTE-based ground network covering 30 countries across Europe and adjacent countries. The S-band satellite component of the EAN is expected to be launched on an Ariane 5 in the first half of 2017 with the broader EAN going live later in the year.
In 2016 we increased our focus on improving business effectiveness and efficiency by driving increased centralisation and standardisation across the Central Service teams supporting the broader business. This has included the consolidation of our customer operations functions which is a key step towards raising the quality and responsiveness of our customer service through a more proactive approach to problem resolution.
We continued to make good progress on our OneIT programme in 2016 which is targeted at creating an enterprise architecture and global, agile IT capability to support our business strategy. One of the first areas of focus has been on billing transformation which will see the business move
from more than 30 billing-related systems to a single billing platform. The first phase of the transformation went live at the end of 2016 with several thousand customers migrating to the new platform and the first two billing systems being turned off. The OneIT programme will redesign and implement standard business processes, streamline core applications based on proven enterprise grade solutions supported by a newly integrated group IT function. Standardising and simplifying our processes and systems will improve how we do business with our partners and customers, improve employee collaboration and knowledge management, and support continuous improvement across all areas of the business.
As part of the overall drive to deliver efficiency in our back-office processes we centralised our transactional banking with J.P. Morgan in 2016 which will allow us, by the end of 2017, to reduce the number of bank accounts we operate from 160 to 85. As well as delivering significant savings in bank charges the programme has improved our cash visibility meaning that over 2016 we were able to reduce our uninvested cash by 75% or $39m.
Revenue receivable from Ligado Networks under the Cooperation Agreement between the two companies is reported in Central Services. On 1 April, we announced that Ligado Networks had elected the 30MHz option (the ‘30MHz Plan’) under the Agreement between the two companies. In exchange for the deferral of some payments from Ligado to Inmarsat, the parties agreed to delay the transition to the 30MHz Plan and Ligado agreed to provide Inmarsat with enhanced spectrum usage rights for its satellite operations for a minimum period of two years. Under this
agreement Ligado committed to making aggregate payments of approximately $108m, $111m and $118m to Inmarsat in respect of 2016, 2017 and 2018. Over that period, up to approximately $35m of additional contracted payments were agreed to be deferred. In respect of 2019, Inmarsat granted Ligado a full payment deferral for an aggregate amount of up to approximately $132m. All deferred amounts will be increased by agreed amounts and repayable on 30 June 2021 or earlier in certain circumstances. Payment deferrals will stop from the date of FCC approval of Ligado’s spectrum for terrestrial use. From 1 January 2020, it was agreed that no further payments would be deferred and that quarterly payments would recommence at the level of approximately $136m per annum, escalating at 3% per annum, in accordance with the existing terms of the Cooperation Agreement.
FINANCIAL PERFORMANCERevenue from Ligado Networks increased in the year by $30.8m, or 34.8%, to $119.4m reflecting the impact of the exercise in March 2016 of the 30MHz option by them under the Cooperation Agreement and the recognition of $11.0m of deferred revenue.
Operating costs decreased by $5.9m, or 2.4%, to $243.3m (2015: $249.2m) reflecting the impact of the fall in the value of Sterling during the year which reduced the reported Dollar value of our costs which are disproportionately incurred in Sterling. Excluding the beneficial impact of forex, costs would have increased by $21.8m (8.7%).
We have several hundred years’ experience among our team of world-class satellite engineers. We have three generations currently flying with two satellites due for launch in 2017. We have had a flawless launch record.
1990 2000 2010 2020 2030 2040
INFLIGHT
Inmarsat-3 L-bandFive satellites launched 1996-98
Inmarsat-4 L-bandFour satellites launched 2005-13
F1
F2
F3
F4 (Alphasat)
Inmarsat-5 Ka-bandThree satellites launched 2013-15
F1
F2
F3
PLANNED
Inmarsat-5 Ka-band
F4
EAN satellite S-band
Inmarsat-6 L and Ka-bands
F1
F2
Expected operational life
ANNUAL REPORT AND ACCOUNTS 2016 – INMARSAT PLC – 45STRATEGIC REPORT – GOVERNANCE – FINANCIAL STATEMENTS

CHIEF FINANCIAL OFFICER’S REVIEW
BUILDING A STRONG FOUNDATION
Tony Bates Chief Financial Officer
($ in millions)Maritime
2016Government
2016Enterprise
2016Aviation
2016Central Services
2016Total 2016
Total 2015
Revenue
Revenue 575.3 330.5 144.6 142.6 16.6 1,209.6 1,185.5
Ligado revenue – – – – 119.4 119.4 88.6
Total revenue 575.3 330.5 144.6 142.6 136.0 1,329.0 1,274.1
Operating costs (120.5) (86.5) (38.7) (45.2) (243.3) (534.2) (548.1)
EBITDA 454.8 244.0 105.9 97.4 (107.3) 794.8 726.0
Depreciation and amortisation – – – – (349.4) (349.4) (311.2)
Other1 – – – – 1.7 1.7 11.6
Operating profit 454.8 244.0 105.9 97.4 (455.0) 447.1 426.4
Net financing cost (147.9) (88.4)
Profit before tax 299.2 338.0
Taxation (55.8) (56.0)
Profit for the year 243.4 282.0
1 Other includes $2.4m of share of profit from associates (2015: $2.5m) and in 2015 included a $9.3m gain on disposal of assets that related primarily to the disposal of the SkyWave investment
HIGHLIGHTS
> 2016 Group Revenue grew 4.3%
> EBITDA and Operating Profit up by 9.5% and 4.9% respectively
> Adjusted EPS of 65 cents
> Free cash flow $274.5m
> $1.05bn of new capital raised in H2 2016
> Net debt to EBITDA of 2.4x
> Final dividend increased by 5% to 33.37 cents per share
Financial statements See page 104
46 – INMARSAT PLC – ANNUAL REPORT AND ACCOUNTS 2016

GROUP RESULTSDuring the year ended 31 December 2016 Group revenues increased by $54.9m (4.3%) to $1,329.0m (2015: $1,274.1m) with growth in Aviation ($15.8m), Government ($43.9m) and Ligado income ($30.8m), partially offset by lower contributions from Maritime ($17.9m) and Enterprise ($14.9m) driven by stress in the core markets for these Business Units.
Total Group revenues for the year included Wholesale MSS revenue of $904.5m, 8.6% higher than last year (2015: $832.8m) largely driven by growth in Government and Aviation MSS revenue.
The majority of Group revenues are US Dollar denominated and so the relative strength of the Dollar has had a small negative impact on reported revenues in 2016 but some markets, for example Russia and Brazil, have weakened as our Dollar denominated revenues become more expensive locally.
Net operating costs decreased by $13.9m to $534.2m for the year (2015: $548.1m) reflecting mainly an improved product mix (around $19m) and foreign exchange gains (approximately $33m) which more than offset increased investment in our IFC capability (around $22m) and an expected increase in GX operations costs (around $6m).
EBITDA for the year ended 31 December 2016 increased by $68.8m (9.5%) to $794.8m (2015: $726.0m) and the Group’s EBITDA margin increased to 59.8%, from 57.0%, reflecting the growth in revenue and decline in operating costs described above.
OPERATING PROFIT
Depreciation and amortisation for the year ended 31 December 2016 increased by $38.2m to $349.4m as the I-5 satellites entered commercial service during 2015.
Other includes $2.4m of share of profit of associates (2015: $2.5m) partially offset by a $1.2m impairment loss on the disposal of fixed assets (2015: $0.2m). In 2015 there was a gain of $9.3m from the disposal of the SkyWave investment in the first quarter.
As a result of the factors discussed above, operating profit for the year was $447.1m, an increase of $20.7m (4.9%), compared with 2015.
NET FINANCING COST
Net financing costs for the year increased by $59.5m to $147.9m (2015: $88.4m). The increase was primarily due to a one-off cost of $32.8m on the early repurchase of the Group’s existing convertible bonds due 2017, a charge of $28.8m due to an unrealised increase in the fair value of the conversion liability component of the new convertible bonds and $7.1m interest on the new senior notes due 2024. These increases were partially offset by a $5.9m reduction in the interest due on uncertain tax provisions and a $1.3m reduction in commitment fees payable on the senior credit facility due to the revised terms of the agreement in May 2015.
The early redemption of the existing convertible bonds also led to an $8.8m charge (including a 1.5% premium paid on redemption) against the equity reserve created on the issuance of these bonds. Following redemption, the $48.1m closing balance of this equity reserve was transferred to retained earnings.
The combination of the one-off cost of $32.8m and the $48.1m release in respect of the convertible bond issue and redemption have led to a net increase of $15.3m in closing retained earnings.
TAXATION
The tax charge for 2016 was $55.8m, a decrease of $0.2m compared with 2015. The effective tax rate for 2016 was 18.6% (2015: 16.6%) compared to an average statutory rate for the UK for 2016 of 20% (2015: 20.25%).
The difference between the effective and statutory rates is mainly due to the cost of the change in the fair value of the conversion liability component (a non-taxable amount included in pre-tax earnings) and a credit of $10.3m arising on the revaluation of the Group’s deferred tax liabilities, arising as a result of the reduction in the UK corporation tax rate from 18% to 17% in 2020, which was substantively enacted in Q3 2016.
The Group maintains tax provisions in respect of ongoing enquiries with tax authorities. In the event that all such enquiries were settled as currently provided for, we estimate that the Group would incur a cash tax outflow of approximately $90m over 2017 or 2018. The enquiries remain ongoing at this time.
EARNINGS PER SHARE
Basic and diluted earnings per share for profit attributable to the equity holders of the Company were 54 cents and 53 cents, respectively, compared with 63 cents and 62 cents respectively in 2015.
Basic and diluted earnings per share adjusted to exclude the post-tax impact of the early repurchase of the 2017 Convertible Bonds and the change in the fair value of the conversion liability component of the new 2023 Convertible Bonds were 65 cents and 64 cents respectively, compared with 63 cents and 62 cents respectively in 2015.
DIVIDENDS
The Board is recommending a final dividend of 33.37 cents per share in respect of the year ended 31 December 2016 (2015: 31.78 cents), to be paid on 26 May 2017 to ordinary shareholders on the share register at the close of business on 21 April 2017.
Inmarsat currently provides shareholders with the option of a scrip dividend alternative for dividend payments. At the interim stage, this option was taken up by shareholders holding a total of 43m shares, representing 9.54% of our issued share capital. The scrip dividend resulted in the issue of 946,283 new shares (0.21% of the then issued share capital) with an issue value of $8.9m. These shares were issued on 21 October 2016. Inmarsat plc has 452,062,811 shares in issue as at the date of this Report.
Shareholders will be asked to approve the final dividend payment at the Annual General Meeting on 4 May 2017. Dividend payments will be made in Pounds Sterling based on the exchange rate prevailing in the London market four business days prior to the date of announcement of the scrip reference price.
The 2016 final dividend is not recorded as a liability in the financial statements at 31 December 2016. The total dividends paid and proposed in respect of the year ended 31 December 2016 total 53.96 cents per ordinary share, an increase of 5% over 2015.
ANNUAL REPORT AND ACCOUNTS 2016 – INMARSAT PLC – 47STRATEGIC REPORT – GOVERNANCE – FINANCIAL STATEMENTS
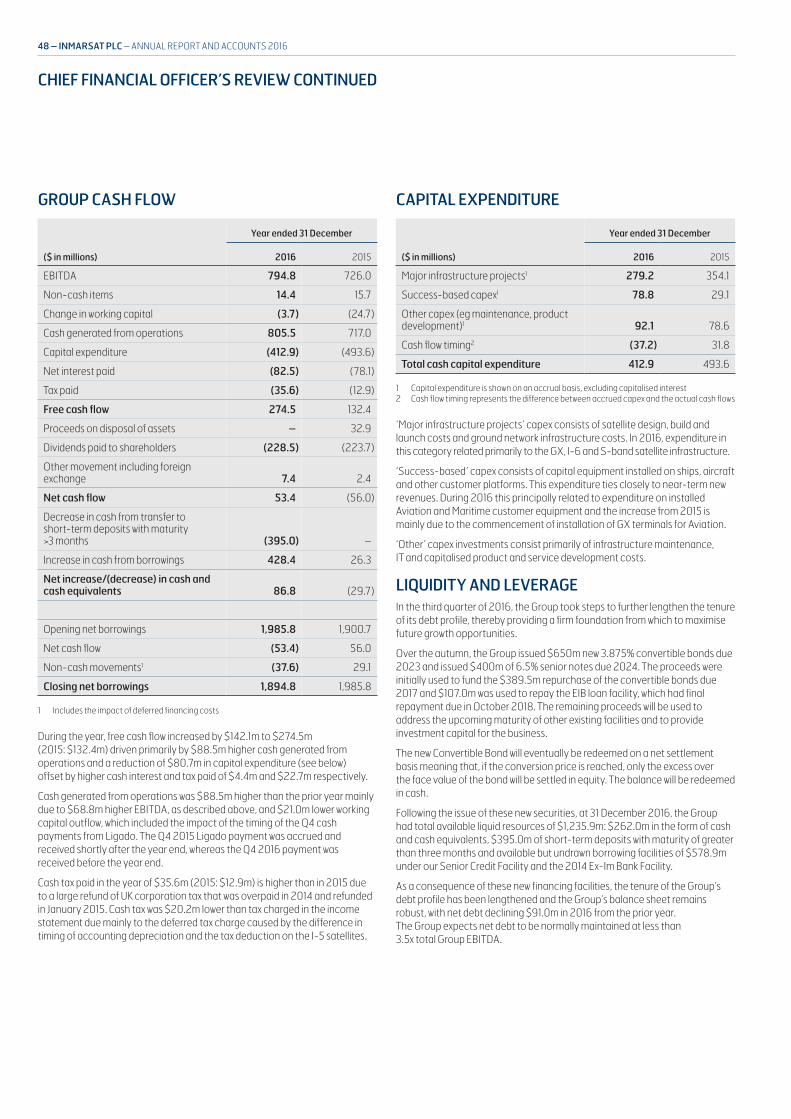
GROUP CASH FLOW
($ in millions)
Year ended 31 December
2016 2015
EBITDA 794.8 726.0
Non-cash items 14.4 15.7
Change in working capital (3.7) (24.7)
Cash generated from operations 805.5 717.0
Capital expenditure (412.9) (493.6)
Net interest paid (82.5) (78.1)
Tax paid (35.6) (12.9)
Free cash flow 274.5 132.4
Proceeds on disposal of assets – 32.9
Dividends paid to shareholders (228.5) (223.7)
Other movement including foreign exchange 7.4 2.4
Net cash flow 53.4 (56.0)
Decrease in cash from transfer to short-term deposits with maturity >3 months (395.0) –
Increase in cash from borrowings 428.4 26.3
Net increase/(decrease) in cash and cash equivalents 86.8 (29.7)
Opening net borrowings 1,985.8 1,900.7
Net cash flow (53.4) 56.0
Non-cash movements1 (37.6) 29.1
Closing net borrowings 1,894.8 1,985.8
1 Includes the impact of deferred financing costs
During the year, free cash flow increased by $142.1m to $274.5m (2015: $132.4m) driven primarily by $88.5m higher cash generated from operations and a reduction of $80.7m in capital expenditure (see below) offset by higher cash interest and tax paid of $4.4m and $22.7m respectively.
Cash generated from operations was $88.5m higher than the prior year mainly due to $68.8m higher EBITDA, as described above, and $21.0m lower working capital outflow, which included the impact of the timing of the Q4 cash payments from Ligado. The Q4 2015 Ligado payment was accrued and received shortly after the year end, whereas the Q4 2016 payment was received before the year end.
Cash tax paid in the year of $35.6m (2015: $12.9m) is higher than in 2015 due to a large refund of UK corporation tax that was overpaid in 2014 and refunded in January 2015. Cash tax was $20.2m lower than tax charged in the income statement due mainly to the deferred tax charge caused by the difference in timing of accounting depreciation and the tax deduction on the I-5 satellites.
CAPITAL EXPENDITURE
($ in millions)
Year ended 31 December
2016 2015
Major infrastructure projects1 279.2 354.1
Success-based capex1 78.8 29.1
Other capex (eg maintenance, product development)1 92.1 78.6
Cash flow timing2 (37.2) 31.8
Total cash capital expenditure 412.9 493.6
1 Capital expenditure is shown on an accrual basis, excluding capitalised interest2 Cash flow timing represents the difference between accrued capex and the actual cash flows
‘Major infrastructure projects’ capex consists of satellite design, build and launch costs and ground network infrastructure costs. In 2016, expenditure in this category related primarily to the GX, I-6 and S-band satellite infrastructure.
‘Success-based’ capex consists of capital equipment installed on ships, aircraft and other customer platforms. This expenditure ties closely to near-term new revenues. During 2016 this principally related to expenditure on installed Aviation and Maritime customer equipment and the increase from 2015 is mainly due to the commencement of installation of GX terminals for Aviation.
‘Other’ capex investments consist primarily of infrastructure maintenance, IT and capitalised product and service development costs.
LIQUIDITY AND LEVERAGEIn the third quarter of 2016, the Group took steps to further lengthen the tenure of its debt profile, thereby providing a firm foundation from which to maximise future growth opportunities.
Over the autumn, the Group issued $650m new 3.875% convertible bonds due 2023 and issued $400m of 6.5% senior notes due 2024. The proceeds were initially used to fund the $389.5m repurchase of the convertible bonds due 2017 and $107.0m was used to repay the EIB loan facility, which had final repayment due in October 2018. The remaining proceeds will be used to address the upcoming maturity of other existing facilities and to provide investment capital for the business.
The new Convertible Bond will eventually be redeemed on a net settlement basis meaning that, if the conversion price is reached, only the excess over the face value of the bond will be settled in equity. The balance will be redeemed in cash.
Following the issue of these new securities, at 31 December 2016, the Group had total available liquid resources of $1,235.9m: $262.0m in the form of cash and cash equivalents, $395.0m of short-term deposits with maturity of greater than three months and available but undrawn borrowing facilities of $578.9m under our Senior Credit Facility and the 2014 Ex-Im Bank Facility.
As a consequence of these new financing facilities, the tenure of the Group’s debt profile has been lengthened and the Group’s balance sheet remains robust, with net debt declining $91.0m in 2016 from the prior year. The Group expects net debt to be normally maintained at less than 3.5x total Group EBITDA.
CHIEF FINANCIAL OFFICER’S REVIEW CONTINUED
48 – INMARSAT PLC – ANNUAL REPORT AND ACCOUNTS 2016
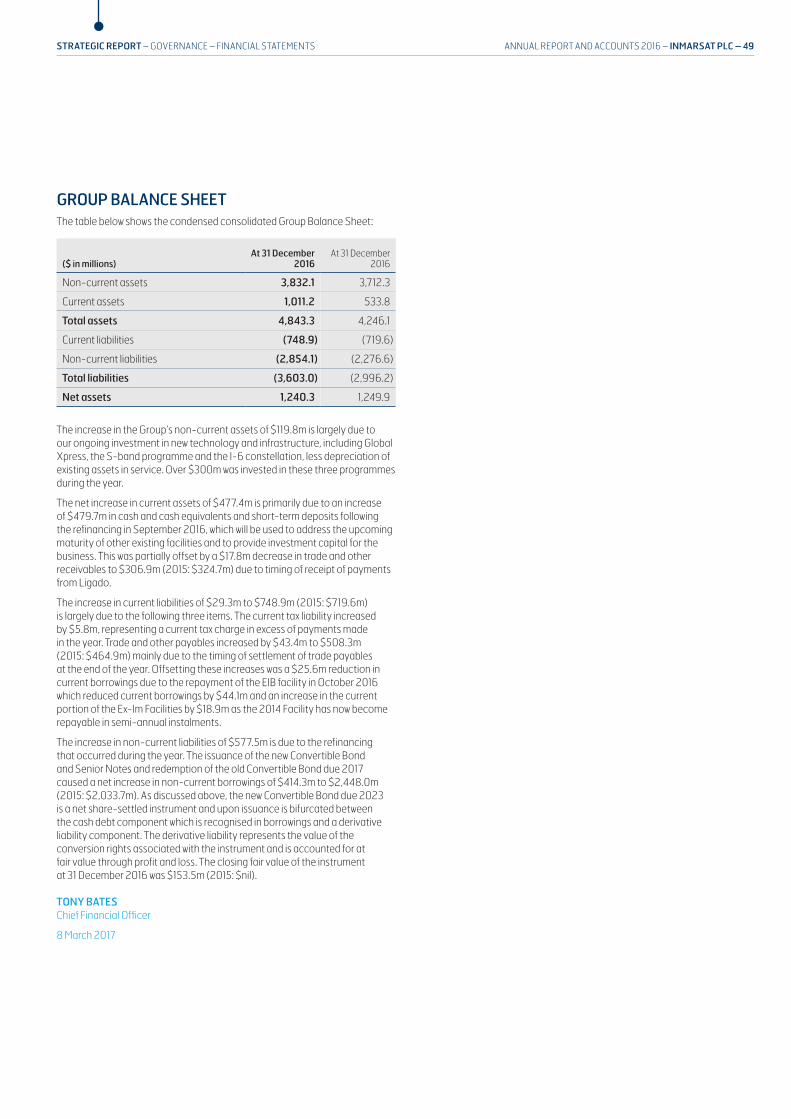
GROUP BALANCE SHEETThe table below shows the condensed consolidated Group Balance Sheet:
($ in millions)At 31 December
2016At 31 December
2016
Non-current assets 3,832.1 3,712.3
Current assets 1,011.2 533.8
Total assets 4,843.3 4,246.1
Current liabilities (748.9) (719.6)
Non-current liabilities (2,854.1) (2,276.6)
Total liabilities (3,603.0) (2,996.2)
Net assets 1,240.3 1,249.9
The increase in the Group’s non-current assets of $119.8m is largely due to our ongoing investment in new technology and infrastructure, including Global Xpress, the S-band programme and the I-6 constellation, less depreciation of existing assets in service. Over $300m was invested in these three programmes during the year.
The net increase in current assets of $477.4m is primarily due to an increase of $479.7m in cash and cash equivalents and short-term deposits following the refinancing in September 2016, which will be used to address the upcoming maturity of other existing facilities and to provide investment capital for the business. This was partially offset by a $17.8m decrease in trade and other receivables to $306.9m (2015: $324.7m) due to timing of receipt of payments from Ligado.
The increase in current liabilities of $29.3m to $748.9m (2015: $719.6m) is largely due to the following three items. The current tax liability increased by $5.8m, representing a current tax charge in excess of payments made in the year. Trade and other payables increased by $43.4m to $508.3m (2015: $464.9m) mainly due to the timing of settlement of trade payables at the end of the year. Offsetting these increases was a $25.6m reduction in current borrowings due to the repayment of the EIB facility in October 2016 which reduced current borrowings by $44.1m and an increase in the current portion of the Ex-Im Facilities by $18.9m as the 2014 Facility has now become repayable in semi-annual instalments.
The increase in non-current liabilities of $577.5m is due to the refinancing that occurred during the year. The issuance of the new Convertible Bond and Senior Notes and redemption of the old Convertible Bond due 2017 caused a net increase in non-current borrowings of $414.3m to $2,448.0m (2015: $2,033.7m). As discussed above, the new Convertible Bond due 2023 is a net share-settled instrument and upon issuance is bifurcated between the cash debt component which is recognised in borrowings and a derivative liability component. The derivative liability represents the value of the conversion rights associated with the instrument and is accounted for at fair value through profit and loss. The closing fair value of the instrument at 31 December 2016 was $153.5m (2015: $nil).
TONY BATESChief Financial Officer
8 March 2017
ANNUAL REPORT AND ACCOUNTS 2016 – INMARSAT PLC – 49STRATEGIC REPORT – GOVERNANCE – FINANCIAL STATEMENTS
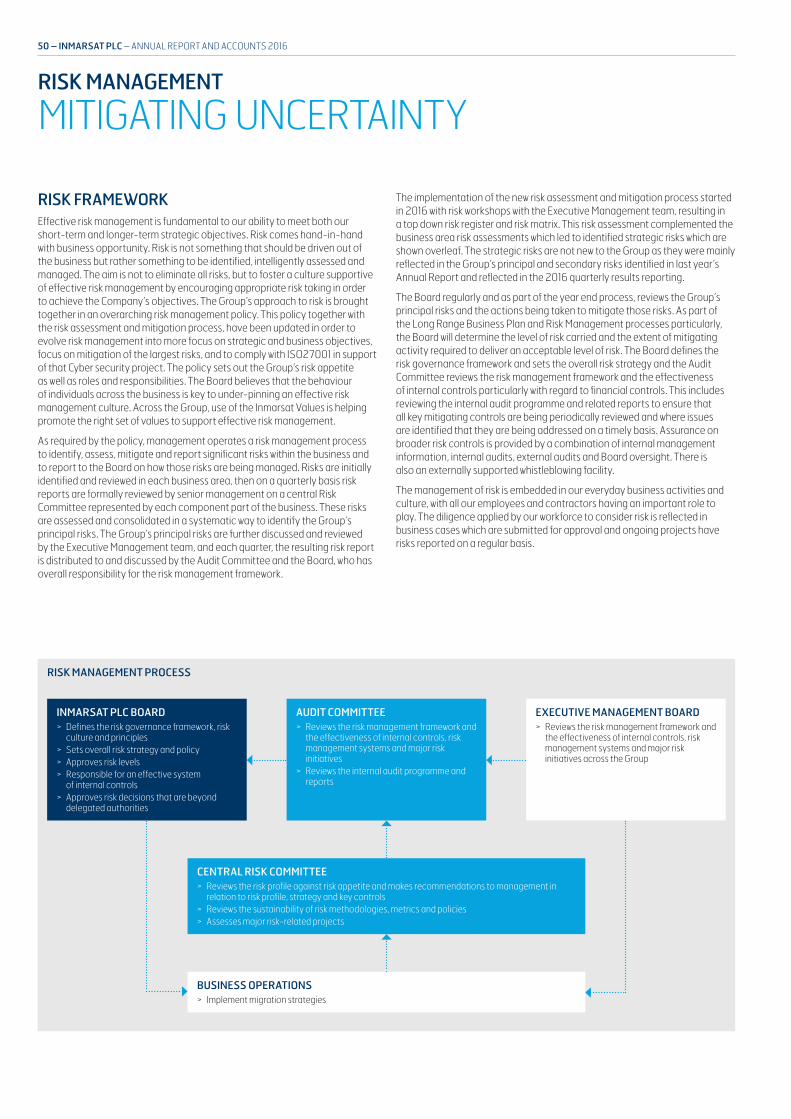
RISK FRAMEWORKEffective risk management is fundamental to our ability to meet both our short-term and longer-term strategic objectives. Risk comes hand-in-hand with business opportunity. Risk is not something that should be driven out of the business but rather something to be identified, intelligently assessed and managed. The aim is not to eliminate all risks, but to foster a culture supportive of effective risk management by encouraging appropriate risk taking in order to achieve the Company’s objectives. The Group’s approach to risk is brought together in an overarching risk management policy. This policy together with the risk assessment and mitigation process, have been updated in order to evolve risk management into more focus on strategic and business objectives, focus on mitigation of the largest risks, and to comply with ISO27001 in support of that Cyber security project. The policy sets out the Group’s risk appetite as well as roles and responsibilities. The Board believes that the behaviour of individuals across the business is key to under-pinning an effective risk management culture. Across the Group, use of the Inmarsat Values is helping promote the right set of values to support effective risk management.
As required by the policy, management operates a risk management process to identify, assess, mitigate and report significant risks within the business and to report to the Board on how those risks are being managed. Risks are initially identified and reviewed in each business area, then on a quarterly basis risk reports are formally reviewed by senior management on a central Risk Committee represented by each component part of the business. These risks are assessed and consolidated in a systematic way to identify the Group’s principal risks. The Group’s principal risks are further discussed and reviewed by the Executive Management team, and each quarter, the resulting risk report is distributed to and discussed by the Audit Committee and the Board, who has overall responsibility for the risk management framework.
The implementation of the new risk assessment and mitigation process started in 2016 with risk workshops with the Executive Management team, resulting in a top down risk register and risk matrix. This risk assessment complemented the business area risk assessments which led to identified strategic risks which are shown overleaf. The strategic risks are not new to the Group as they were mainly reflected in the Group’s principal and secondary risks identified in last year’s Annual Report and reflected in the 2016 quarterly results reporting.
The Board regularly and as part of the year end process, reviews the Group’s principal risks and the actions being taken to mitigate those risks. As part of the Long Range Business Plan and Risk Management processes particularly, the Board will determine the level of risk carried and the extent of mitigating activity required to deliver an acceptable level of risk. The Board defines the risk governance framework and sets the overall risk strategy and the Audit Committee reviews the risk management framework and the effectiveness of internal controls particularly with regard to financial controls. This includes reviewing the internal audit programme and related reports to ensure that all key mitigating controls are being periodically reviewed and where issues are identified that they are being addressed on a timely basis. Assurance on broader risk controls is provided by a combination of internal management information, internal audits, external audits and Board oversight. There is also an externally supported whistleblowing facility.
The management of risk is embedded in our everyday business activities and culture, with all our employees and contractors having an important role to play. The diligence applied by our workforce to consider risk is reflected in business cases which are submitted for approval and ongoing projects have risks reported on a regular basis.
RISK MANAGEMENT PROCESS
INMARSAT PLC BOARD > Defines the risk governance framework, risk
culture and principles > Sets overall risk strategy and policy > Approves risk levels > Responsible for an effective system
of internal controls > Approves risk decisions that are beyond
delegated authorities
AUDIT COMMITTEE > Reviews the risk management framework and
the effectiveness of internal controls, risk management systems and major risk initiatives
> Reviews the internal audit programme and reports
CENTRAL RISK COMMITTEE > Reviews the risk profile against risk appetite and makes recommendations to management in
relation to risk profile, strategy and key controls > Reviews the sustainability of risk methodologies, metrics and policies > Assesses major risk-related projects
EXECUTIVE MANAGEMENT BOARD > Reviews the risk management framework and
the effectiveness of internal controls, risk management systems and major risk initiatives across the Group
BUSINESS OPERATIONS > Implement migration strategies
50 – INMARSAT PLC – ANNUAL REPORT AND ACCOUNTS 2016
RISK MANAGEMENT
MITIGATING UNCERTAINTY

PRINCIPAL RISKSThe Group faces a number of risks that may adversely affect our strategic and business objectives, operations, liquidity, financial position, reputation or future performance, not all of which are wholly within our control or known to us. Some such risks may currently be regarded as immaterial and could turn out to be material. We accept risk is an inherent part of doing business. We manage the risks based on a balance of risk and reward determined through careful assessment of both the potential probability and impact as well as risk appetite. Risk appetite is considered as part of the compilation of business cases, annual business plan and budget and long range business plan. There will be a balance of risk and opportunity considered as we take our investment decisions. We consider reputational as well as financial impact, recognising the value attributable to our brand. The Group faces a number of ongoing operational risks including litigation, credit and foreign exchange risk and the risks associated with dealing with tax authorities in multiple jurisdictions. The importance of these risks will vary over time and will be kept under constant review. Although many of the risks influencing our performance are macroeconomic and likely to affect the performance of businesses generally, others are particular to our operations in mobile satellite services.
In accordance with the provisions of the UK Corporate Governance Code 2014, the Board has taken into consideration the principal risks in the context of determining whether to adopt the going concern basis of accounting and when assessing the prospects of the Company for the purpose of preparing the Viability Statement which can be found on page 55. The Going Concern statement is provided on page 61 in the Directors’ Report.
Our principal risks are discussed on the next few pages and are as summarised in the Preliminary Results Statement distributed on 8 March 2017. These have been subject to robust assessment and review. This summary, however, is not intended to be an exhaustive analysis of all risks and uncertainties affecting our business and are not listed in any order of priority.
In identifying the principal risks set out below we have disclosed those risks that we currently consider to be the most significant to the Group at the date of this Annual Report. Compared to last year, we decided to have a single list of principal risks rather than divide the largest risks of the Group into principal and secondary risks.
The risk trend for each principal risk at the date of this Annual Report has been assessed as either stable, increasing or reducing in size, measured in both net impact and net probability. The principal risks are identified below and we have indicated against each risk how it principally relates to our strategy, noting that all risks will impact the strategy to some extent.
PRINCIPAL RISKS AND UNCERTAINTIESWe show against each risk how it links to our strategy (see page 18) and the movement of each risk during the year.
STRATEGIC PILLARS:
BEST NETWORKS
BEST SOLUTIONS
BEST DISTRIBUTION
BEST WORKPLACE
MOVEMENT DURING YEAR:
INCREASED RISK IN 2016
NO CHANGE IN 2016
DECREASED RISK IN 2016
Risk Background and impact Mitigation Movement
1. Failure to expand into the broadband market by attracting new customers and successfully migrating existing L-band customers
Link to strategy:
We may fail to critically assess our market, technological changes, customer requirements and competitors’ strategy and to exploit market opportunities. We may fail to effectively address the significant changes going on in the industry, eg price and capacity, plus a greater focus on digital enablement. We may develop next generation broadband services that will not meet these market opportunities, or these developments could have delays or cost overruns impacting on our market position, revenue or returns on investment.
We have professional, experienced teams who focus on large scale programmes and develop close relationships with third parties we use to deliver them. We critically review our detailed business cases before we proceed and regularly assess our progress against the original business cases. We thoroughly review and approve major development of new services or technology. We work closely with our partners to ensure our services, technology and capacity meet the demand from our customers. We seek to identify new customers and to migrate existing customers who would benefit from our new services.
We establish the necessary focused sales and marketing capability to effectively deliver a good business opportunity for Inmarsat and its partners. We have started to focus on digital offerings as an additional value add to customers.
ANNUAL REPORT AND ACCOUNTS 2016 – INMARSAT PLC – 51STRATEGIC REPORT – GOVERNANCE – FINANCIAL STATEMENTS
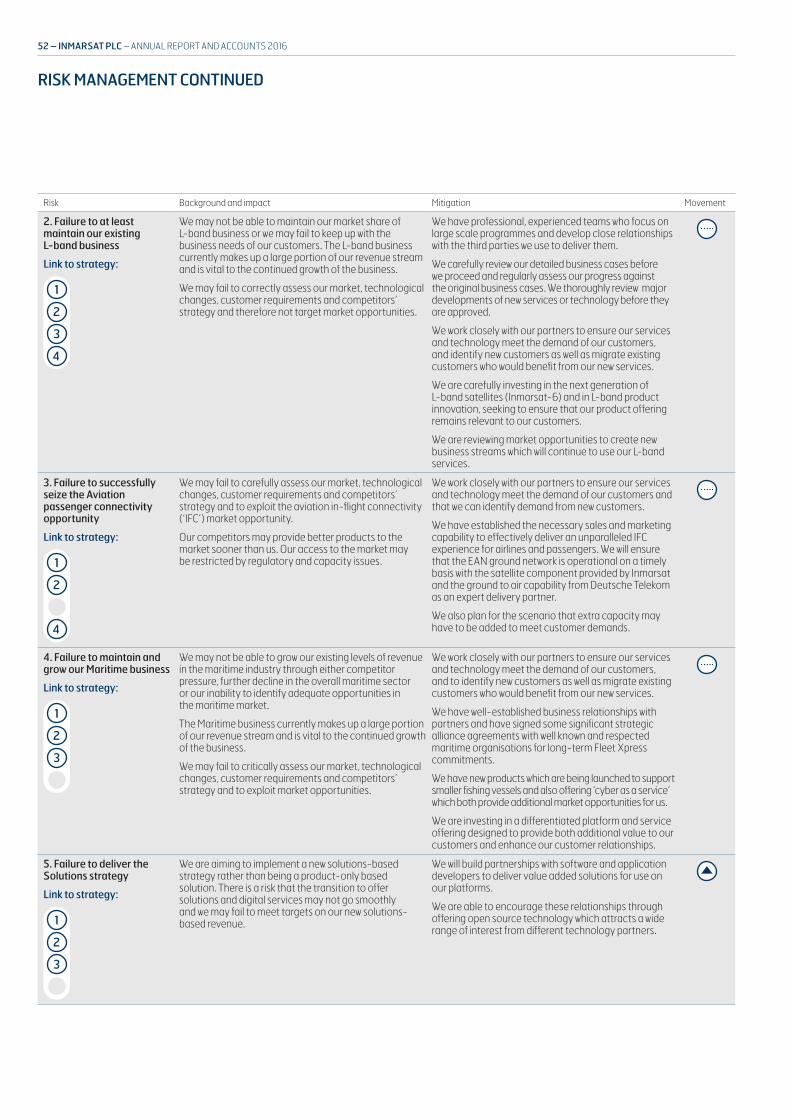
RISK MANAGEMENT CONTINUED
Risk Background and impact Mitigation Movement
2. Failure to at least maintain our existing L-band business
Link to strategy:
We may not be able to maintain our market share of L-band business or we may fail to keep up with the business needs of our customers. The L-band business currently makes up a large portion of our revenue stream and is vital to the continued growth of the business.
We may fail to correctly assess our market, technological changes, customer requirements and competitors’ strategy and therefore not target market opportunities.
We have professional, experienced teams who focus on large scale programmes and develop close relationships with the third parties we use to deliver them.
We carefully review our detailed business cases before we proceed and regularly assess our progress against the original business cases. We thoroughly review major developments of new services or technology before they are approved.
We work closely with our partners to ensure our services and technology meet the demand of our customers, and identify new customers as well as migrate existing customers who would benefit from our new services.
We are carefully investing in the next generation of L-band satellites (Inmarsat-6) and in L-band product innovation, seeking to ensure that our product offering remains relevant to our customers.
We are reviewing market opportunities to create new business streams which will continue to use our L-band services.
3. Failure to successfully seize the Aviation passenger connectivity opportunity
Link to strategy:
We may fail to carefully assess our market, technological changes, customer requirements and competitors’ strategy and to exploit the aviation in-flight connectivity (‘IFC’) market opportunity.
Our competitors may provide better products to the market sooner than us. Our access to the market may be restricted by regulatory and capacity issues.
We work closely with our partners to ensure our services and technology meet the demand of our customers and that we can identify demand from new customers.
We have established the necessary sales and marketing capability to effectively deliver an unparalleled IFC experience for airlines and passengers. We will ensure that the EAN ground network is operational on a timely basis with the satellite component provided by Inmarsat and the ground to air capability from Deutsche Telekom as an expert delivery partner.
We also plan for the scenario that extra capacity may have to be added to meet customer demands.
4. Failure to maintain and grow our Maritime business
Link to strategy:
We may not be able to grow our existing levels of revenue in the maritime industry through either competitor pressure, further decline in the overall maritime sector or our inability to identify adequate opportunities in the maritime market.
The Maritime business currently makes up a large portion of our revenue stream and is vital to the continued growth of the business.
We may fail to critically assess our market, technological changes, customer requirements and competitors’ strategy and to exploit market opportunities.
We work closely with our partners to ensure our services and technology meet the demand of our customers, and to identify new customers as well as migrate existing customers who would benefit from our new services.
We have well-established business relationships with partners and have signed some significant strategic alliance agreements with well known and respected maritime organisations for long-term Fleet Xpress commitments.
We have new products which are being launched to support smaller fishing vessels and also offering ‘cyber as a service’ which both provide additional market opportunities for us.
We are investing in a differentiated platform and service offering designed to provide both additional value to our customers and enhance our customer relationships.
5. Failure to deliver the Solutions strategy
Link to strategy:
We are aiming to implement a new solutions-based strategy rather than being a product-only based solution. There is a risk that the transition to offer solutions and digital services may not go smoothly and we may fail to meet targets on our new solutions-based revenue.
We will build partnerships with software and application developers to deliver value added solutions for use on our platforms.
We are able to encourage these relationships through offering open source technology which attracts a wide range of interest from different technology partners.
52 – INMARSAT PLC – ANNUAL REPORT AND ACCOUNTS 2016
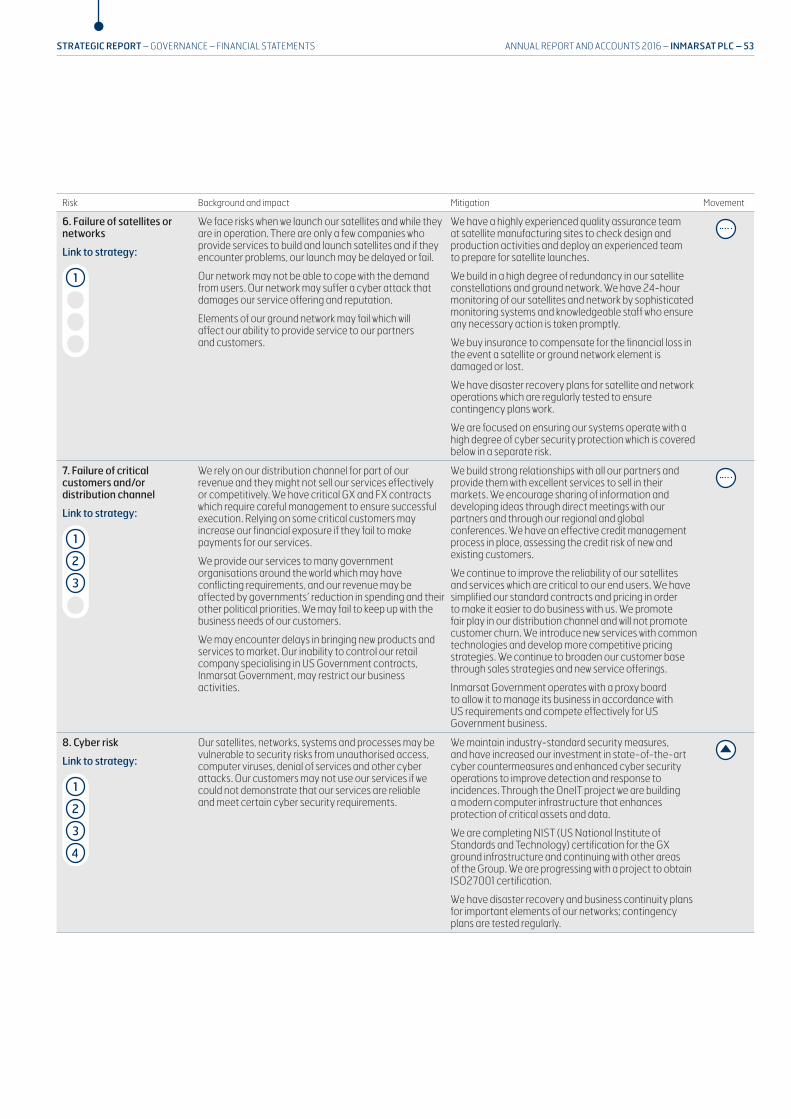
Risk Background and impact Mitigation Movement
6. Failure of satellites or networks
Link to strategy:
We face risks when we launch our satellites and while they are in operation. There are only a few companies who provide services to build and launch satellites and if they encounter problems, our launch may be delayed or fail.
Our network may not be able to cope with the demand from users. Our network may suffer a cyber attack that damages our service offering and reputation.
Elements of our ground network may fail which will affect our ability to provide service to our partners and customers.
We have a highly experienced quality assurance team at satellite manufacturing sites to check design and production activities and deploy an experienced team to prepare for satellite launches.
We build in a high degree of redundancy in our satellite constellations and ground network. We have 24-hour monitoring of our satellites and network by sophisticated monitoring systems and knowledgeable staff who ensure any necessary action is taken promptly.
We buy insurance to compensate for the financial loss in the event a satellite or ground network element is damaged or lost.
We have disaster recovery plans for satellite and network operations which are regularly tested to ensure contingency plans work.
We are focused on ensuring our systems operate with a high degree of cyber security protection which is covered below in a separate risk.
7. Failure of critical customers and/or distribution channel
Link to strategy:
We rely on our distribution channel for part of our revenue and they might not sell our services effectively or competitively. We have critical GX and FX contracts which require careful management to ensure successful execution. Relying on some critical customers may increase our financial exposure if they fail to make payments for our services.
We provide our services to many government organisations around the world which may have conflicting requirements, and our revenue may be affected by governments’ reduction in spending and their other political priorities. We may fail to keep up with the business needs of our customers.
We may encounter delays in bringing new products and services to market. Our inability to control our retail company specialising in US Government contracts, Inmarsat Government, may restrict our business activities.
We build strong relationships with all our partners and provide them with excellent services to sell in their markets. We encourage sharing of information and developing ideas through direct meetings with our partners and through our regional and global conferences. We have an effective credit management process in place, assessing the credit risk of new and existing customers.
We continue to improve the reliability of our satellites and services which are critical to our end users. We have simplified our standard contracts and pricing in order to make it easier to do business with us. We promote fair play in our distribution channel and will not promote customer churn. We introduce new services with common technologies and develop more competitive pricing strategies. We continue to broaden our customer base through sales strategies and new service offerings.
Inmarsat Government operates with a proxy board to allow it to manage its business in accordance with US requirements and compete effectively for US Government business.
8. Cyber risk
Link to strategy:
Our satellites, networks, systems and processes may be vulnerable to security risks from unauthorised access, computer viruses, denial of services and other cyber attacks. Our customers may not use our services if we could not demonstrate that our services are reliable and meet certain cyber security requirements.
We maintain industry-standard security measures, and have increased our investment in state-of-the-art cyber countermeasures and enhanced cyber security operations to improve detection and response to incidences. Through the OneIT project we are building a modern computer infrastructure that enhances protection of critical assets and data.
We are completing NIST (US National Institute of Standards and Technology) certification for the GX ground infrastructure and continuing with other areas of the Group. We are progressing with a project to obtain ISO27001 certification.
We have disaster recovery and business continuity plans for important elements of our networks; contingency plans are tested regularly.
ANNUAL REPORT AND ACCOUNTS 2016 – INMARSAT PLC – 53STRATEGIC REPORT – GOVERNANCE – FINANCIAL STATEMENTS

Risk Background and impact Mitigation Movement
9. Spectrum, orbital slots and market access risk
Link to strategy:
We rely on radio spectrum, which has historically been allocated without charge, to provide our services. We must agree how it is used in coordination with other satellite operators and need to coordinate its ongoing availability. We may not be able to coordinate usage in the future and/or may be charged for the spectrum which could affect our ability to provide services.
We require orbital slots to place our satellites in the correct position to provide adequate coverage and deliver our services. We may not be able to obtain adequate orbital slots or we may miss deadlines to bring orbital slots into use.
Given the nature of the satellite business it is important to have access to all areas of the globe and provide coverage world-wide. This requires licensing from multiple national authorities. We may not be able to gain these licenses for various reasons. Market access may not be allowed in certain countries which restricts our services being offered.
We regularly improve the efficiency of our spectrum usage through innovation and system enhancement. We also educate and inform regulators and governments as to the unique socio-economic contribution of our mobile satellite services. We work on various World Radio Conference preparatory groups to brief them on the ongoing need for our frequency allocations.
We negotiate with other companies on orbital slots and the ability to achieve better spectrum usage and allocation. We monitor spectrum usage and assess whether there are benefits to our partners, customers and ourselves to migrate higher volume users to GX services.
We obtain in-country market access for our distribution channel as far as possible and make any licensing requirements as straightforward as possible for our partners.
10. Failure of critical suppliers
Link to strategy:
We rely on a limited number of third party suppliers and partners in the production of our satellites, launch providers’ systems, terminals and products and we may have limited control over availability, quality and delivery of these goods.
A satellite manufacturer or a supplier to the satellite manufacturer, may fail or have serious damage to a production facility that delays the delivery of our satellite.
A satellite launch provider may additionally have a launch failure which affects the timing of our planned launches.
We work closely with our suppliers to review programme plans, delivery quality and timing to ensure that they meet our requirements. We have a highly experienced quality assurance team at satellite manufacturing sites to check design and production activities and also at launch sites ahead of our satellite launches.
The Group Procurement department’s reviews and actions reduce the risk, for example exploring dual sourcing and assessing suppliers’ quality, technical know-how and financial viability.
We can operate in an agile way to seek new satellite launch providers if required as we did to secure an alternative provider for the S-band satellite launch which had been delayed.
11. Failure to effectively deliver products and services
Link to strategy:
We may fail to keep up with the developing business needs of our customers. We may fail in developing products and services that match their needs or encounter delays in bringing new products and services to market.
We may not be able to take to market our products and services for various reasons such as competitor pressure, network/satellite issues and/or technological difficulties which would impact our ability to generate revenues.
In developing products and services, we have processes which we continuously evolve and seek to improve to meet the expectations of customers.
We liaise closely with third parties across our ecosystem to review requirements and then plan our delivery against these.
Our systems need to be agile to be able to respond to any changing needs and having open network systems enables this agility by us and our wider partners.
All significant product and service developments are subject to approval and regular programme reviews to identify critical issues, changes, delivery delays and resolutions, and projected cost against budget. We are able to prioritise investment activity to focus on new requirements if this is felt appropriate.
We rely on a close relationship between our customer-facing BUs, our operations team who deal directly with operating new products and services and the engineering and product teams.
12. People and skills risk
Link to strategy:
We may fail to hire skilled people or adequately improve skills to maintain and grow our business, or to deliver our strategy.
Given the highly technical and specialist nature of the satellite industry, there are certain employees in our company who have very specific skill sets that are vital to the business. Further it is vital for the future of the business to keep hiring talented individuals and training existing staff across the business.
We identify key employees, skills and skills gaps to manage the human resource effectively and enable delivery of the strategy of the Company. We develop and implement recruitment strategies to hire people with the new skills needed. We are in the process of reviewing and enhancing our employee proposition which focuses on career development, training and reward to improve people’s experience of Inmarsat.
RISK MANAGEMENT CONTINUED
54 – INMARSAT PLC – ANNUAL REPORT AND ACCOUNTS 2016
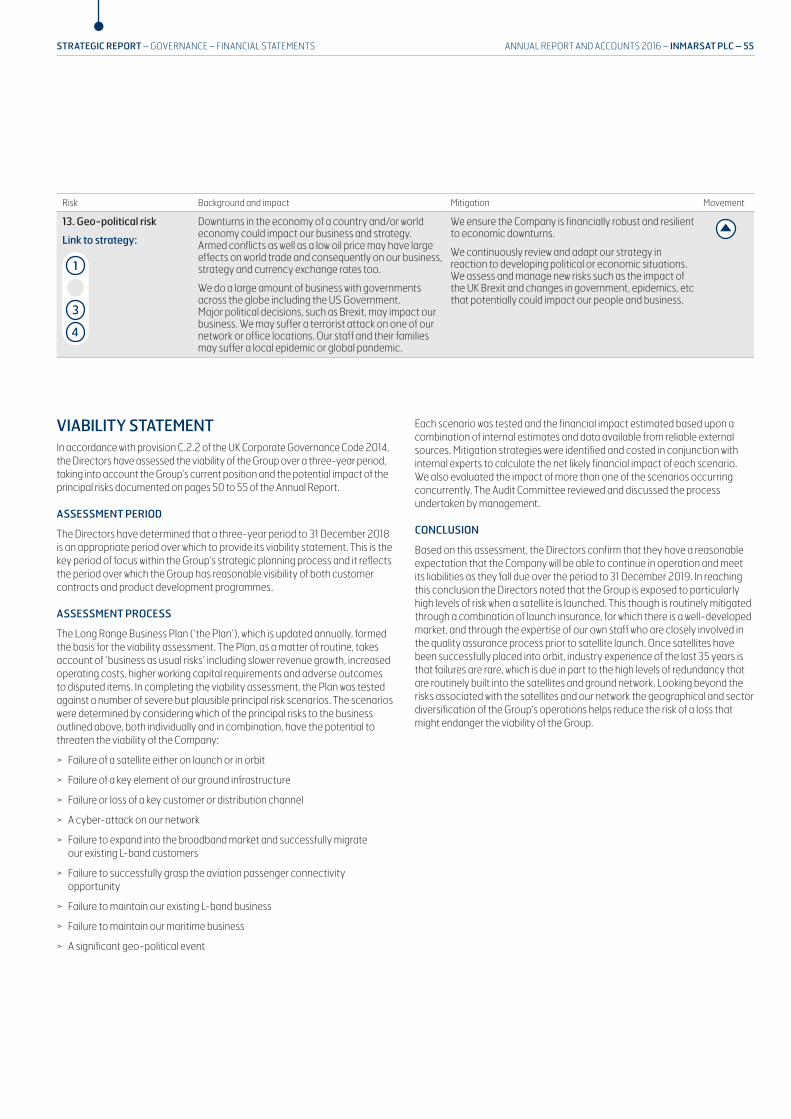
VIABILITY STATEMENTIn accordance with provision C.2.2 of the UK Corporate Governance Code 2014, the Directors have assessed the viability of the Group over a three-year period, taking into account the Group’s current position and the potential impact of the principal risks documented on pages 50 to 55 of the Annual Report.
ASSESSMENT PERIOD
The Directors have determined that a three-year period to 31 December 2018 is an appropriate period over which to provide its viability statement. This is the key period of focus within the Group’s strategic planning process and it reflects the period over which the Group has reasonable visibility of both customer contracts and product development programmes.
ASSESSMENT PROCESS
The Long Range Business Plan (‘the Plan’), which is updated annually, formed the basis for the viability assessment. The Plan, as a matter of routine, takes account of ‘business as usual risks’ including slower revenue growth, increased operating costs, higher working capital requirements and adverse outcomes to disputed items. In completing the viability assessment, the Plan was tested against a number of severe but plausible principal risk scenarios. The scenarios were determined by considering which of the principal risks to the business outlined above, both individually and in combination, have the potential to threaten the viability of the Company:
> Failure of a satellite either on launch or in orbit
> Failure of a key element of our ground infrastructure
> Failure or loss of a key customer or distribution channel
> A cyber-attack on our network
> Failure to expand into the broadband market and successfully migrate our existing L-band customers
> Failure to successfully grasp the aviation passenger connectivity opportunity
> Failure to maintain our existing L-band business
> Failure to maintain our maritime business
> A significant geo-political event
Each scenario was tested and the financial impact estimated based upon a combination of internal estimates and data available from reliable external sources. Mitigation strategies were identified and costed in conjunction with internal experts to calculate the net likely financial impact of each scenario. We also evaluated the impact of more than one of the scenarios occurring concurrently. The Audit Committee reviewed and discussed the process undertaken by management.
CONCLUSION
Based on this assessment, the Directors confirm that they have a reasonable expectation that the Company will be able to continue in operation and meet its liabilities as they fall due over the period to 31 December 2019. In reaching this conclusion the Directors noted that the Group is exposed to particularly high levels of risk when a satellite is launched. This though is routinely mitigated through a combination of launch insurance, for which there is a well-developed market, and through the expertise of our own staff who are closely involved in the quality assurance process prior to satellite launch. Once satellites have been successfully placed into orbit, industry experience of the last 35 years is that failures are rare, which is due in part to the high levels of redundancy that are routinely built into the satellites and ground network. Looking beyond the risks associated with the satellites and our network the geographical and sector diversification of the Group’s operations helps reduce the risk of a loss that might endanger the viability of the Group.
Risk Background and impact Mitigation Movement
13. Geo-political risk
Link to strategy:
Downturns in the economy of a country and/or world economy could impact our business and strategy. Armed conflicts as well as a low oil price may have large effects on world trade and consequently on our business, strategy and currency exchange rates too.
We do a large amount of business with governments across the globe including the US Government. Major political decisions, such as Brexit, may impact our business. We may suffer a terrorist attack on one of our network or office locations. Our staff and their families may suffer a local epidemic or global pandemic.
We ensure the Company is financially robust and resilient to economic downturns.
We continuously review and adapt our strategy in reaction to developing political or economic situations. We assess and manage new risks such as the impact of the UK Brexit and changes in government, epidemics, etc that potentially could impact our people and business.
ANNUAL REPORT AND ACCOUNTS 2016 – INMARSAT PLC – 55STRATEGIC REPORT – GOVERNANCE – FINANCIAL STATEMENTS
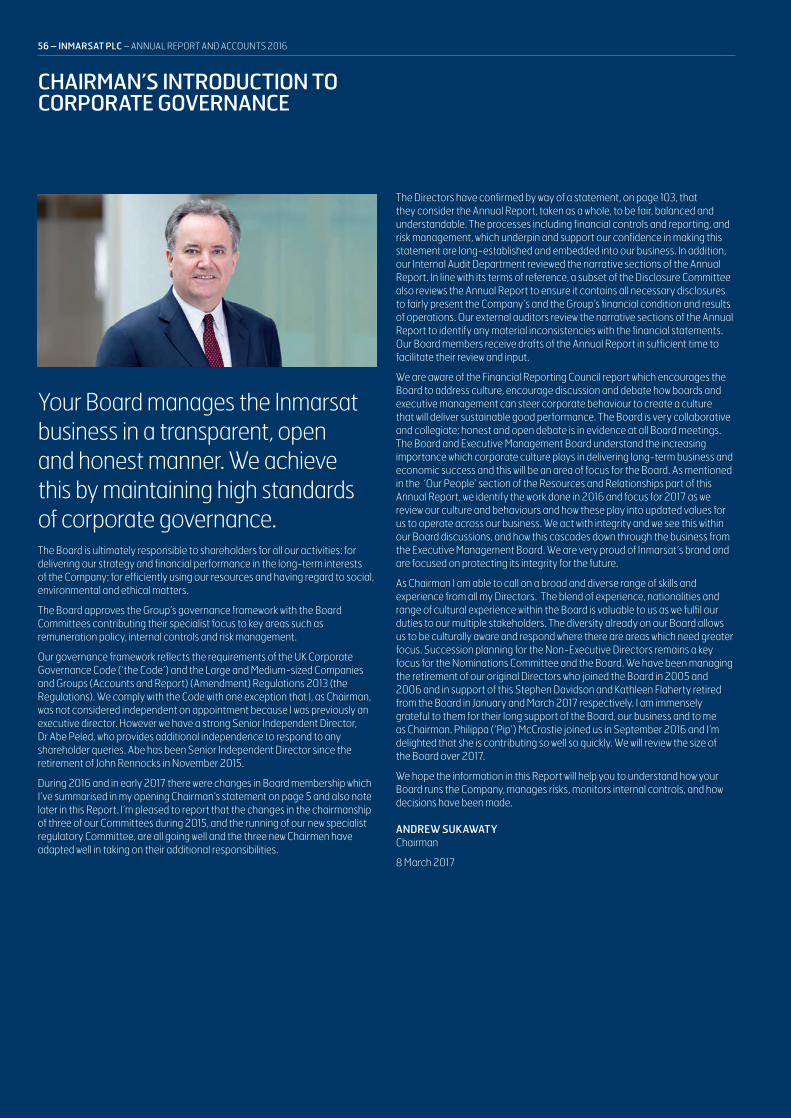
CHAIRMAN’S INTRODUCTION TO CORPORATE GOVERNANCE
Your Board manages the Inmarsat business in a transparent, open and honest manner. We achieve this by maintaining high standards of corporate governance.The Board is ultimately responsible to shareholders for all our activities: for delivering our strategy and financial performance in the long-term interests of the Company; for efficiently using our resources and having regard to social, environmental and ethical matters.
The Board approves the Group’s governance framework with the Board Committees contributing their specialist focus to key areas such as remuneration policy, internal controls and risk management.
Our governance framework reflects the requirements of the UK Corporate Governance Code (‘the Code’) and the Large and Medium-sized Companies and Groups (Accounts and Report) (Amendment) Regulations 2013 (the Regulations). We comply with the Code with one exception that I, as Chairman, was not considered independent on appointment because I was previously an executive director. However we have a strong Senior Independent Director, Dr Abe Peled, who provides additional independence to respond to any shareholder queries. Abe has been Senior Independent Director since the retirement of John Rennocks in November 2015.
During 2016 and in early 2017 there were changes in Board membership which I’ve summarised in my opening Chairman’s statement on page 5 and also note later in this Report. I’m pleased to report that the changes in the chairmanship of three of our Committees during 2015, and the running of our new specialist regulatory Committee, are all going well and the three new Chairmen have adapted well in taking on their additional responsibilities.
The Directors have confirmed by way of a statement, on page 103, that they consider the Annual Report, taken as a whole, to be fair, balanced and understandable. The processes including financial controls and reporting, and risk management, which underpin and support our confidence in making this statement are long-established and embedded into our business. In addition, our Internal Audit Department reviewed the narrative sections of the Annual Report. In line with its terms of reference, a subset of the Disclosure Committee also reviews the Annual Report to ensure it contains all necessary disclosures to fairly present the Company’s and the Group’s financial condition and results of operations. Our external auditors review the narrative sections of the Annual Report to identify any material inconsistencies with the financial statements. Our Board members receive drafts of the Annual Report in sufficient time to facilitate their review and input.
We are aware of the Financial Reporting Council report which encourages the Board to address culture, encourage discussion and debate how boards and executive management can steer corporate behaviour to create a culture that will deliver sustainable good performance. The Board is very collaborative and collegiate; honest and open debate is in evidence at all Board meetings. The Board and Executive Management Board understand the increasing importance which corporate culture plays in delivering long-term business and economic success and this will be an area of focus for the Board. As mentioned in the ‘Our People’ section of the Resources and Relationships part of this Annual Report, we identify the work done in 2016 and focus for 2017 as we review our culture and behaviours and how these play into updated values for us to operate across our business. We act with integrity and we see this within our Board discussions, and how this cascades down through the business from the Executive Management Board. We are very proud of Inmarsat’s brand and are focused on protecting its integrity for the future.
As Chairman I am able to call on a broad and diverse range of skills and experience from all my Directors. The blend of experience, nationalities and range of cultural experience within the Board is valuable to us as we fulfil our duties to our multiple stakeholders. The diversity already on our Board allows us to be culturally aware and respond where there are areas which need greater focus. Succession planning for the Non-Executive Directors remains a key focus for the Nominations Committee and the Board. We have been managing the retirement of our original Directors who joined the Board in 2005 and 2006 and in support of this Stephen Davidson and Kathleen Flaherty retired from the Board in January and March 2017 respectively. I am immensely grateful to them for their long support of the Board, our business and to me as Chairman. Philippa (‘Pip’) McCrostie joined us in September 2016 and I’m delighted that she is contributing so well so quickly. We will review the size of the Board over 2017.
We hope the information in this Report will help you to understand how your Board runs the Company, manages risks, monitors internal controls, and how decisions have been made.
ANDREW SUKAWATYChairman
8 March 2017
56 – INMARSAT PLC – ANNUAL REPORT AND ACCOUNTS 2016

This section of the Annual Report shares with you how we operate as a Board and explains the responsibilities we have as Directors to all our stakeholders. We describe the different Board Committees and how they are accountable for clearly defined responsibilities, each headed by a Non-Executive Director.
The Board is committed to the highest standards of corporate governance and it does this whilst being responsible for the overall conduct of the Group's business and by providing leadership and guidance.
BOARD ACTIVITIES IN 2016
> Managed the transition of longer-serving Directors with a new addition to the Board
> Reviewed the Group's strategy to support the change in strategic focus to becoming a digital enabler
> Approval of 2016 dividend planning and payments with the introduction of a scrip dividend arrangement
> Contributed to the Company's direction on cyber security activities and planning for successful take-up of in-flight passenger connectivity services
LEADERSHIP SEE PAGES 65 TO 69
This section provides an overview of the Board and how it and its Committees interlink.
Details of the type of activity considered by the Board and also some of the core responsibilities for certain Directors are also explained.
As you review the report, the variation of what the Board has to consider is wide-ranging and reflects the scope of discussions which occur throughout the year.
WHY THIS IS IMPORTANT?
It is important to have strong leadership from the Board as a whole to support the executive directors and management in their day-to-day running of the business.
We want all our stakeholders to understand the commitment and passion the Directors have to making the Company a success.
EFFECTIVENESS SEE PAGES 70 TO 72
In the Report from the Nominations Committee Chairman, we reflect on the elements of how the Board is made up, how we plan to ensure success in the future and how do we make sure on an annual basis that we are being held accountable to each other as Board members and also to our stakeholders.
WHY THIS IS IMPORTANT?
Having an effective and contributing Board, with the right skills, experience and willingness to contribute to the Company's culture, is very important to our success as a company and therefore to our stakeholders.
It is incumbent on the Board to make sure that it is diligent in its succession planning - at Board level and also contributing to what happens at the Executive Management Board level and understanding succession planning across the Company.
ACCOUNTABILITY SEE PAGES 73 TO 78
Our Audit Committee Chairman has now gone through a full annual cycle and we have a new Committee member who joined in September 2016.
The work of the Audit Committee extends and expands as the number of new auditing and governance requirements grows.
WHY THIS IS IMPORTANT?
Two of our Board Committees have responsibility for oversight of our telecoms regulatory requirements and audit reporting.
These are significant areas of focus for our business and it is important for stakeholders to know that this is recognised at the highest level in the Company.
It is critical to know that there is a process of accountability running throughout the Company with good processes in place and defined levels of responsibility.
REMUNERATION SEE PAGES 79 TO 102
This section of the corporate governance report provides a review of what remuneration has been paid to Executive Directors in 2016 and what is intended to be paid in 2017 and how we operate within an agreed remuneration policy.
WHY THIS IS IMPORTANT?
Our Remuneration Committee carries the responsibility to deliver a clear articulation of our remuneration policy and consider this alongside pay increases compared to other employees as well as considering other comparators. It is important for stakeholders to understand how remuneration is determined and that the appropriate links between remuneration, strategy, risk and KPIs are made.
GOVERNANCE AT WORK
ANNUAL REPORT AND ACCOUNTS 2016 – INMARSAT PLC – 57STRATEGIC REPORT – GOVERNANCE – FINANCIAL STATEMENTS
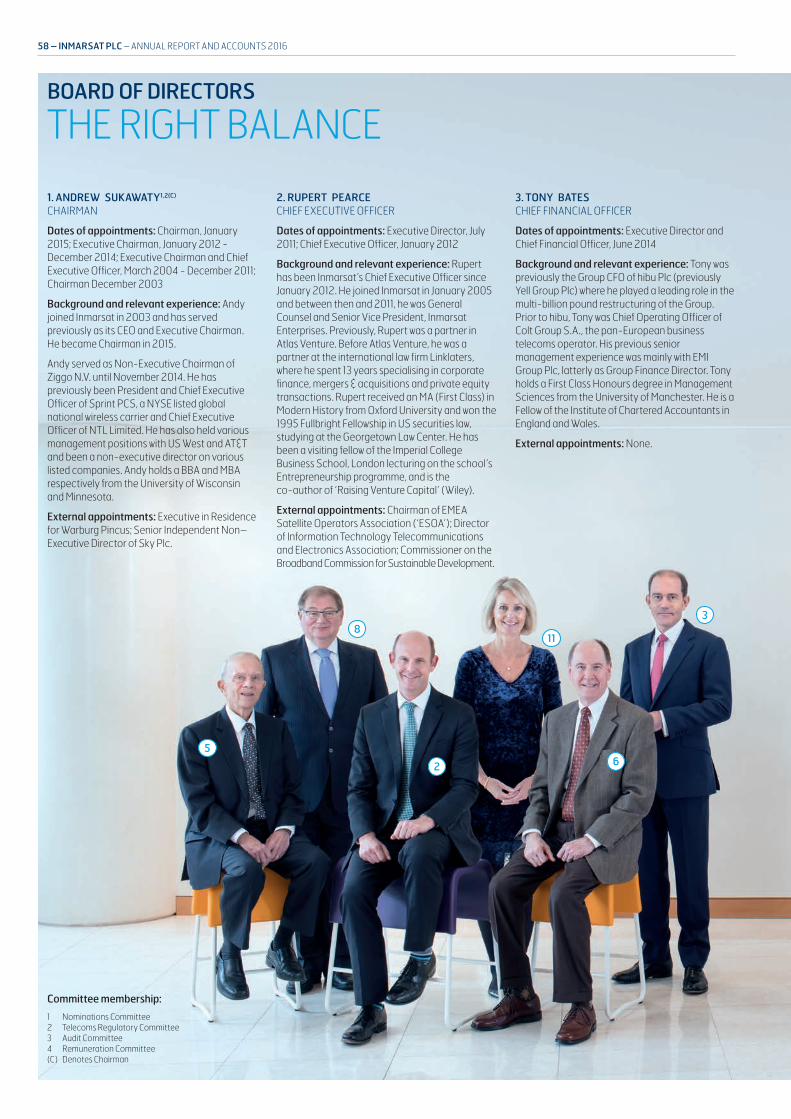
BOARD OF DIRECTORS
THE RIGHT BALANCE
1. ANDREW SUKAWATY1,2(C) CHAIRMAN
Dates of appointments: Chairman, January 2015; Executive Chairman, January 2012 - December 2014; Executive Chairman and Chief Executive Officer, March 2004 - December 2011; Chairman December 2003
Background and relevant experience: Andy joined Inmarsat in 2003 and has served previously as its CEO and Executive Chairman. He became Chairman in 2015.
Andy served as Non-Executive Chairman of Ziggo N.V. until November 2014. He has previously been President and Chief Executive Officer of Sprint PCS, a NYSE listed global national wireless carrier and Chief Executive Officer of NTL Limited. He has also held various management positions with US West and AT&T and been a non-executive director on various listed companies. Andy holds a BBA and MBA respectively from the University of Wisconsin and Minnesota.
External appointments: Executive in Residence for Warburg Pincus; Senior Independent Non–Executive Director of Sky Plc.
3. TONY BATES CHIEF FINANCIAL OFFICER
Dates of appointments: Executive Director and Chief Financial Officer, June 2014
Background and relevant experience: Tony was previously the Group CFO of hibu Plc (previously Yell Group Plc) where he played a leading role in the multi-billion pound restructuring of the Group. Prior to hibu, Tony was Chief Operating Officer of Colt Group S.A., the pan-European business telecoms operator. His previous senior management experience was mainly with EMI Group Plc, latterly as Group Finance Director. Tony holds a First Class Honours degree in Management Sciences from the University of Manchester. He is a Fellow of the Institute of Chartered Accountants in England and Wales.
External appointments: None.
2. RUPERT PEARCE CHIEF EXECUTIVE OFFICER
Dates of appointments: Executive Director, July 2011; Chief Executive Officer, January 2012
Background and relevant experience: Rupert has been Inmarsat’s Chief Executive Officer since January 2012. He joined Inmarsat in January 2005 and between then and 2011, he was General Counsel and Senior Vice President, Inmarsat Enterprises. Previously, Rupert was a partner in Atlas Venture. Before Atlas Venture, he was a partner at the international law firm Linklaters, where he spent 13 years specialising in corporate finance, mergers & acquisitions and private equity transactions. Rupert received an MA (First Class) in Modern History from Oxford University and won the 1995 Fullbright Fellowship in US securities law, studying at the Georgetown Law Center. He has been a visiting fellow of the Imperial College Business School, London lecturing on the school’s Entrepreneurship programme, and is the co-author of ‘Raising Venture Capital’ (Wiley).
External appointments: Chairman of EMEA Satellite Operators Association (‘ESOA’); Director of Information Technology Telecommunications and Electronics Association; Commissioner on the Broadband Commission for Sustainable Development.
5
8
2
11
3
6
Committee membership:
1 Nominations Committee2 Telecoms Regulatory Committee3 Audit Committee4 Remuneration Committee(C) Denotes Chairman
58 – INMARSAT PLC – ANNUAL REPORT AND ACCOUNTS 2016

5. SIR BRYAN CARSBERG2,3,4 INDEPENDENT NON-EXECUTIVE DIRECTOR
Date of appointment: June 2005
Background and relevant experience: Sir Bryan is a Chartered Accountant. He served eight years as Director General of Telecommunications (head of Oftel), and then served as Director General of Fair Trading and Secretary General of the International Accounting Standards Board. He has been previously Chairman of the Council of Loughborough University, a non-executive director of Cable and Wireless Communications plc and RM plc; and a non-executive Chairman of MLL Telecom Limited. He was knighted in January 1989. Sir Bryan is an Honorary Fellow of the Institute of Actuaries and holds an MSc (Econ) from the University of London.
External appointments: Non-executive director of Actual Experience plc.
6. GENERAL C. ROBERT KEHLER (RTD)4 INDEPENDENT NON-EXECUTIVE DIRECTOR
Date of appointment: May 2014
Background and relevant experience: General Kehler retired from the US Air Force in January 2014 with over 38 years of service. He oversaw a global network of satellite command and control, communications, missile warning and launch facilities, and ensured the combat readiness of America’s intercontinental ballistic missile force. Over his career, he served in a variety of important operational and staff assignments, and successfully led large organisations with global responsibilities.
External appointments: Chairman, proxy board of directors of BEI Precision Systems and Space Company; non-executive director of Macdonald Dettwiler and Associates; trustee of the Mitre Corporation; acts as Special Advisor to two US organisations.
4. SIMON BAX4(C) INDEPENDENT NON-EXECUTIVE DIRECTOR
Date of appointment: June 2013
Background and relevant experience: Simon was, from 2008 to 2013, CEO of Encompass Digital Media Inc, which provides technical services to broadcasters, cable networks and government agencies. He previously served as CFO and Executive Vice President of Pixar Animation and CFO and President of Studio Operations of Fox Filmed Entertainment. Simon holds an honours degree in History from Cambridge University and is a chartered accountant.
External appointments: Chairman of WiSpire Limited; Chairman of Archant Limited; director of the British Bobsleigh and Skeleton Association; non-executive director of Channel 4.
12
1
10
4
9
7
ANNUAL REPORT AND ACCOUNTS 2016 – INMARSAT PLC – 59STRATEGIC REPORT – GOVERNANCE – FINANCIAL STATEMENTS
Directors’ biographies Continued overleaf

7. AMBASSADOR JANICE OBUCHOWSKI3 INDEPENDENT NON-EXECUTIVE DIRECTOR
Date of appointment: May 2009
Background and relevant experience: Janice held several senior positions both in the US Government and in the private sector. She was formerly Head of Delegation and US Ambassador to the World Radiocommunications Conference, Assistant Secretary for Communications and information at the Department of Commerce and Senior Advisor to the Chairman at the Federal Communications Commission in the US.
External appointments: President of Freedom Technologies Inc.; non-executive director of Orbital ATK; non-executive director of CSG Systems, Inc.
8. DR ABE PELED1(C) SENIOR INDEPENDENT NON-EXECUTIVE DIRECTOR
Date of appointment: June 2013
Background and relevant experience: Abe was Chief Executive Officer of NDS Group plc from 1995 to 2012, a digital pay-TV technology company, and served as Chairman and Chief Executive Officer from 2004 to 2012. He was Senior Vice President of Cisco from August 2012 to January 2014 and has previous senior management experience with IBM and Elron. Abe has a BSc and MSc in Electrical Engineering and a PhD in Digital Signal Processing. In March 2013, he was awarded the Lifetime Achievement Award by Digital TV Europe.
External appointments: Principal to CyberCloud Ventures; senior advisor on technology businesses to Permira; Chairman of TeamViewer GmbH; member of the Operating Committee of Metalogix Inc.
External appointments: Executive director Smart Africa; member of the Board for Sustainable Development Goals Center for Africa (‘SDGC-A’); non-executive Board member, TELKOM South Africa; Chairman PMP on Cyber Security and Cyber Peace.
11. PHILLIPA McCROSTIE3 INDEPENDENT NON-EXECUTIVE DIRECTOR
Date of appointment: September 2016
Background and relevant experience: Phillipa (‘Pip’) was a member of EY’s Global Executive Board for eight years until her retirement in June 2016. Pip was also Global Head of Corporate Finance. She transformed Corporate Finance into a business with revenues exceeding $3bn during the global recession. Her responsibilities included P&L, strategy, investment, people development and risk. Pip led the acquisition and integration of Parthenon, a global strategy consulting business. Pip has deep experience of international M&A and tax and is a qualified lawyer.
External appointments: Member of the Board of Peterson Institute of International Economics and Chair of its Audit Committee; senior advisor to EY’s Global Executive and a regular contributor on business issues to CNBC, CNN, Bloomberg and Reuters.
12. ALISON HORROCKS CHIEF CORPORATE AFFAIRS OFFICER AND COMPANY SECRETARY
Date of appointment: February 1999
Background and relevant experience: Alison joined Inmarsat in 1999 and provides risk, compliance and corporate governance advice. She acts as Company Secretary to the Board and its Committees. She is a member of the Executive Management Board and Chairman of the Trustee Company responsible for the Inmarsat UK pension plans. She was Group Company Secretary of International Public Relations plc, a worldwide public relations company, for 11 years prior to joining Inmarsat. Alison is a Fellow of the Institute of Chartered Secretaries and Administrators.
9. ROBERT RUIJTER3(C) INDEPENDENT NON-EXECUTIVE DIRECTOR
Date of appointment: February 2015
Background and relevant experience: Rob served as Chief Financial Officer of VNU N.V., a publicly listed marketing and publishing company (now the Nielsen company) between 2004 and 2007. He previously served as the Chief Finance Officer of KLM Royal Dutch Airlines from 2001 until its merger with Air France in 2004, and as Chief Finance Officer of ASM International N.V., a publicly listed manufacturer of electronic components. Rob is a Certified Public Accountant in the United States and in The Netherlands and a member of the ACT in the UK.
External appointments: Member of the Supervisory Board of Wavin N.V.; member of the Supervisory Board of Ziggo N.V.; non-executive director of Interxion N.V. (NYSE); Chairman of the Supervisory Board of Delta Lloyd N.V.
10. DR HAMADOUN TOURÉ1,2 INDEPENDENT NON-EXECUTIVE DIRECTOR
Date of appointment: March 2015
Background and relevant experience: Hamadoun was Secretary General of the International Telecommunication Union ('ITU'), the specialised information and communication technologies agency of the United Nations from 2007 to 2014. He was a member of the UN Chief Executive Board (‘CEB’) and served as Chairman of the UN ICT Network. He was the founding member of the Broadband Commission for Digital Development and served as co-vice chair until his retirement from ITU. He was a member of the Advisory Board of the International Multilateral Partnership Against Cyber Threats (‘IMPACT’) until December 2014. He has also had a distinguished career in the satellite industry. Hamadoun holds a Masters Degree in Electrical Engineering from the Telecommunications Institute of St-Petersburg (Russian Federation) and a PhD in Electrical Engineering from the University of Informatics and Telecoms of Moscow (Russian Federation).
BOARD OF DIRECTORS CONTINUED
BOARD EXPERIENCE
> Regulatory > Corporate finance > Government > Telecommunications > Technology > Financial management > Developing economies > Manufacturing > Cyber security > Customer service
management
BOARD COMPOSITION at 31 December 2016
Non-Executive11
Executive2
Male10
Female3
BOARD TENURE
4-8 years2
0-3 years59+ years
6
BOARD NATIONALITY
Mali1
US5
UK5
TheNetherlands
1NewZealand
1
Committee membership:
1 Nominations Committee2 Telecoms Regulatory Committee3 Audit Committee4 Remuneration Committee(C) Denotes Chairman
60 – INMARSAT PLC – ANNUAL REPORT AND ACCOUNTS 2016
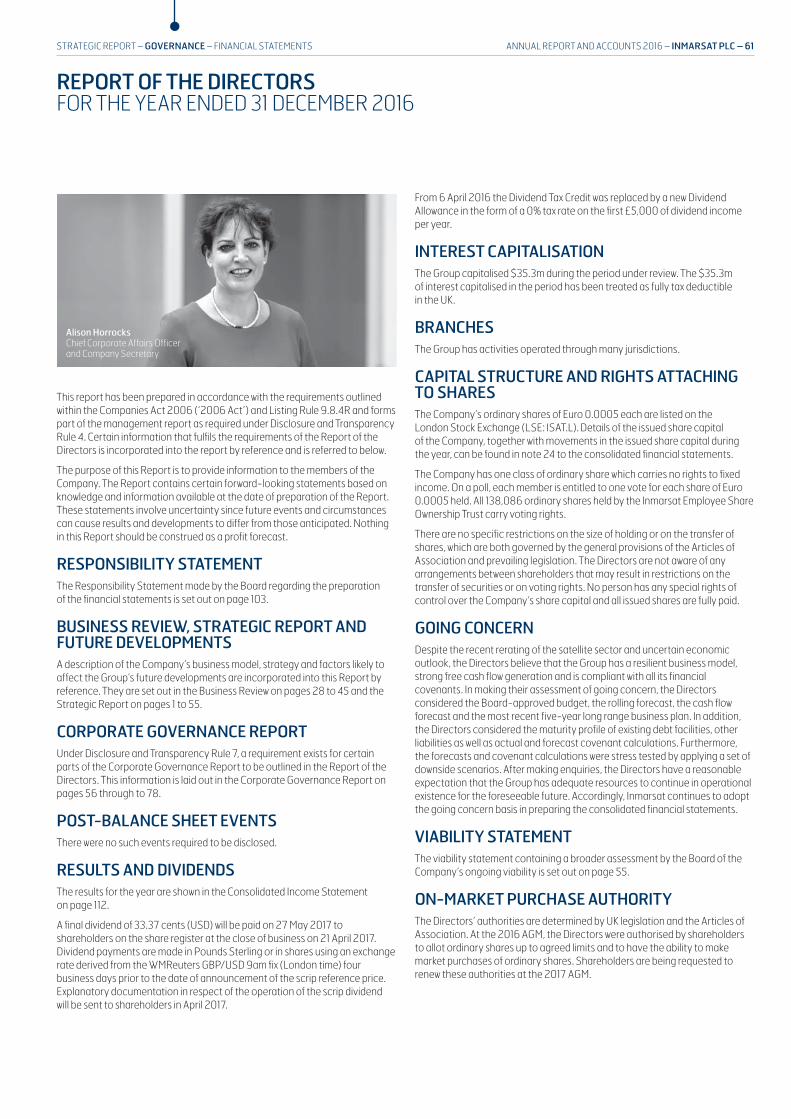
REPORT OF THE DIRECTORSFOR THE YEAR ENDED 31 DECEMBER 2016
Alison Horrocks Chief Corporate Affairs Officer and Company Secretary
This report has been prepared in accordance with the requirements outlined within the Companies Act 2006 (‘2006 Act’) and Listing Rule 9.8.4R and forms part of the management report as required under Disclosure and Transparency Rule 4. Certain information that fulfils the requirements of the Report of the Directors is incorporated into the report by reference and is referred to below.
The purpose of this Report is to provide information to the members of the Company. The Report contains certain forward-looking statements based on knowledge and information available at the date of preparation of the Report. These statements involve uncertainty since future events and circumstances can cause results and developments to differ from those anticipated. Nothing in this Report should be construed as a profit forecast.
RESPONSIBILITY STATEMENTThe Responsibility Statement made by the Board regarding the preparation of the financial statements is set out on page 103.
BUSINESS REVIEW, STRATEGIC REPORT AND FUTURE DEVELOPMENTSA description of the Company’s business model, strategy and factors likely to affect the Group’s future developments are incorporated into this Report by reference. They are set out in the Business Review on pages 28 to 45 and the Strategic Report on pages 1 to 55.
CORPORATE GOVERNANCE REPORTUnder Disclosure and Transparency Rule 7, a requirement exists for certain parts of the Corporate Governance Report to be outlined in the Report of the Directors. This information is laid out in the Corporate Governance Report on pages 56 through to 78.
POST-BALANCE SHEET EVENTSThere were no such events required to be disclosed.
RESULTS AND DIVIDENDSThe results for the year are shown in the Consolidated Income Statement on page 112.
A final dividend of 33.37 cents (USD) will be paid on 27 May 2017 to shareholders on the share register at the close of business on 21 April 2017. Dividend payments are made in Pounds Sterling or in shares using an exchange rate derived from the WMReuters GBP/USD 9am fix (London time) four business days prior to the date of announcement of the scrip reference price. Explanatory documentation in respect of the operation of the scrip dividend will be sent to shareholders in April 2017.
From 6 April 2016 the Dividend Tax Credit was replaced by a new Dividend Allowance in the form of a 0% tax rate on the first £5,000 of dividend income per year.
INTEREST CAPITALISATION The Group capitalised $35.3m during the period under review. The $35.3m of interest capitalised in the period has been treated as fully tax deductible in the UK.
BRANCHESThe Group has activities operated through many jurisdictions.
CAPITAL STRUCTURE AND RIGHTS ATTACHING TO SHARESThe Company’s ordinary shares of Euro 0.0005 each are listed on the London Stock Exchange (LSE: ISAT.L). Details of the issued share capital of the Company, together with movements in the issued share capital during the year, can be found in note 24 to the consolidated financial statements.
The Company has one class of ordinary share which carries no rights to fixed income. On a poll, each member is entitled to one vote for each share of Euro 0.0005 held. All 138,086 ordinary shares held by the Inmarsat Employee Share Ownership Trust carry voting rights.
There are no specific restrictions on the size of holding or on the transfer of shares, which are both governed by the general provisions of the Articles of Association and prevailing legislation. The Directors are not aware of any arrangements between shareholders that may result in restrictions on the transfer of securities or on voting rights. No person has any special rights of control over the Company’s share capital and all issued shares are fully paid.
GOING CONCERN Despite the recent rerating of the satellite sector and uncertain economic outlook, the Directors believe that the Group has a resilient business model, strong free cash flow generation and is compliant with all its financial covenants. In making their assessment of going concern, the Directors considered the Board-approved budget, the rolling forecast, the cash flow forecast and the most recent five-year long range business plan. In addition, the Directors considered the maturity profile of existing debt facilities, other liabilities as well as actual and forecast covenant calculations. Furthermore, the forecasts and covenant calculations were stress tested by applying a set of downside scenarios. After making enquiries, the Directors have a reasonable expectation that the Group has adequate resources to continue in operational existence for the foreseeable future. Accordingly, Inmarsat continues to adopt the going concern basis in preparing the consolidated financial statements.
VIABILITY STATEMENTThe viability statement containing a broader assessment by the Board of the Company’s ongoing viability is set out on page 55.
ON-MARKET PURCHASE AUTHORITYThe Directors’ authorities are determined by UK legislation and the Articles of Association. At the 2016 AGM, the Directors were authorised by shareholders to allot ordinary shares up to agreed limits and to have the ability to make market purchases of ordinary shares. Shareholders are being requested to renew these authorities at the 2017 AGM.
ANNUAL REPORT AND ACCOUNTS 2016 – INMARSAT PLC – 61STRATEGIC REPORT – GOVERNANCE – FINANCIAL STATEMENTS

REPORT OF THE DIRECTORS CONTINUED
GREENHOUSE GAS EMISSIONS
This section has been prepared in accordance with our regulatory obligation to report greenhouse gas (‘GHG’) emissions pursuant to Section 7 of the Companies Act 2006 (Strategic Report and Directors’ Report) Regulations 2013. The table below shows our greenhouse gas emissions for the years ended 31 December 2016 and 2015. The data reported for 2015 has been restated due to improved accuracy and removal of estimated data. Our emissions have been independently verified to the ISO 14064-3 standard to ensure continuous improvement of our GHG reporting.
Greenhouse gas emissions (tCO2e) 2016 2015
Combustion of fuel and operation of facilities (Scope 1) 1,164 978
Electricity, heat, steam and cooling purchased for our own use (Scope 2: location-based) 11,743 12,141
Electricity, heat, steam and cooling purchased for our own use (Scope 2: market-based) 10,559 14,010
Other indirect emissions (Scope 3) 15,411 15,681
Emissions from the consumption of electricity outside the UK and Scope 2 emissions calculated using the market-based approach using supplier specific emission factors are calculated and reported in tCO2
Methodology
We quantify and report our organisational GHG emissions according to the Greenhouse Gas Protocol. Consumption data has been collated by our energy consultant, Carbon Credentials, and has been converted into CO2 equivalent using the UK Government 2016 Conversion Factors for Company Reporting and the International Energy Agency international electricity conversion factors in order to calculate emissions from corresponding activity data.
This report has been prepared in accordance with the recent amendments to the GHG Protocol’s Scope 2 Guidance; we have therefore reported both a location-based and market-based Scope 2 emissions figure. The Scope 2 market-based figure reflects emissions from electricity purchasing decisions that Inmarsat has made. When quantifying emissions using the market-based approach we have used a supplier specific emissions factor where possible. If these factors were unavailable, a residual mix emissions factor was then used, and as a last option the location-based grid emissions factor was used. This approach is in line with the GHG Protocol Scope 2 Data Hierarchy.
The table below shows our total emissions and our emissions as a metric for the year ended 31 December 2016 using the two different Scope 2 accounting methodologies.
Greenhouse gas emissions (tCO2e)
Location-based approach
Market-based approach
2016 2015 2016 2015
Total Scope 1 and 2 12,907 13,118 11,724 14,988
tCO2e per full-time equivalent (‘FTE’) employee 6.8 7.0 6.2 8.0
Total Scope 1, 2 and 3 emissions 28,319 28,800 27,135 30,669
The emissions intensity calculation is based on a figure of 1,900 FTE in 2016 and 1,864 FTE in 2015
INDEMNITIES AND INSURANCEDetails of the Directors’ and Officers’ liability insurance and the indemnities provided to the Directors, Company Secretary and certain employees where they serve as directors of subsidiaries at the Group’s request are provided on page 68 in the Corporate Governance Report.
EMPLOYMENT POLICIES AND EMPLOYEE INVOLVEMENTDetails of the employment policies and employee involvement are provided in the Resources and Relationships Report and are also in the Corporate Governance Report.
LONG-TERM INCENTIVE SCHEMESDetails of the long-term incentive schemes can be found on pages 101 and 102 of the Directors' Remuneration Report.
HEALTH AND SAFETYThe Group is committed to maintaining high standards of health and safety for its employees, customers, visitors, contractors and anyone affected by its business activities. During 2016, we have continued to work closely with our subsidiary companies to harmonise health and safety best practice. Rupert Pearce, our CEO, is the Director designated for health and safety matters at Board level.
ENVIRONMENTAL PERFORMANCE AND STRATEGY We operate in over 50 locations with a combined workforce of approximately 1,900 staff. Due to our diversity of activities the Company recognises it has impacts affecting the local and global environment. However, it should be noted that the satellite industry and our own business is low on the scale of carbon generators. We have provided details of our objectives for how we manage our environmental activities on page 27. The following information summarises the report generated over the year regarding our actual performance.
Our environmental impacts include the use of natural resources, the consumption of energy and water, the production of a variety of waste, as well as staff and visitors who travel extensively.
All energy and waste management activities are controlled by the Business Environment team which is based in London.
62 – INMARSAT PLC – ANNUAL REPORT AND ACCOUNTS 2016

Improving performance
Since establishing our global environmental data programme in 2014 with Carbon Credentials, we have expanded the scope of this programme with quarterly reporting of energy consumption and emissions at several sites. The purpose of this is to continually monitor consumption in order to identify opportunities to improve energy performance. We have also begun to monitor additional environmental impacts, such as water and waste, where this data is available.
In 2016, we submitted a response to the CDP Climate Change programme gaining a score of B (Management). Within this disclosure, we reported the key business risks and opportunities that climate change presents to Inmarsat.
We have also committed to setting a science-based emission reduction target in line with global efforts to limit global temperatures to 2˚C above pre-industrial levels.
PRINCIPAL RISKS AND UNCERTAINTIESDetails of principal risks and uncertainties are provided on pages 50 to 55.
FINANCIAL RISK MANAGEMENTDetails of the financial risk management objectives and policies of the Group, including hedging policies and exposure of the entity to price risk, credit risk, liquidity risk and cash flow risk are given in notes 3 and 31 to the consolidated financial statements.
RESEARCH AND DEVELOPMENTThe Group continues to invest in new services and technology necessary to support its activities through research and development programmes.
POLITICAL DONATIONSDuring the year, no political donations were made. It remains the policy of the Company not to make political donations or incur political expenditure. However, the Directors recognise that occasions arise where it may be in the best interests of shareholders for the Company to be able, if appropriate, to participate in public debate and opinion-forming on matters which affect its business. To avoid inadvertent infringement of the requirements of the Companies Act 2006, shareholders are asked annually to give authority at the Annual General Meeting for the Company to make political donations and to incur political expenditure.
INTERESTS IN VOTING RIGHTSAs at 6 March 2017, the Company had been notified, in accordance with chapter 5 of the Financial Services Authority’s Disclosure and Transparency Rules, of the following significant interests:
ShareholderPercentage of voting rights over
ordinary shares of €0.0005 each
Lansdowne Partners Limited 11.72%
Blackrock 6.31%
Aberdeen Asset Managers 6.27%
Jupiter Asset Management Limited 6.19%
Artemis Investment Management 4.54%
MassMutal Life Insurance Company 3.77%
Capital Group Companies, Inc. 3.46%
Voting rights are based on the information we believe is a disclosable interest to the Company, adjusted for the issued share capital as at 6 March 2017
Since 2015 our absolute Scope 1 and 2 emissions have decreased by 22% using the market-based method. This decrease in emissions has occurred despite a large increase in the number of full time equivalent (‘FTE’) employees. Consequently, our emissions intensity has decreased 23% from 8.0 to 6.2 tCO2e per FTE employee.
We have also chosen to voluntarily disclose a selection of our Scope 3 emissions, including water, waste and business travel. Our Scope 3 emissions have decreased by 2% as a result of a reduction in business travel.
TOTAL EMISSIONS 2016 tCO2e
Scope 315,411
Scope 11,164
Scope 2(market-based)
10,559
EMISSIONS INTENSITY – SCOPE 1 AND 2 (MARKET-BASED) tCO2e/FTE
2015 2016
8.0 6.2
Reporting boundaries and limitations
We consolidate our organisational boundary according to the operational control approach and have adopted a materiality threshold of 5% for GHG reporting purposes. As a result, emissions from locations with fewer than 15 staff on-site have been reasonably estimated as immaterial and are thus excluded from our GHG disclosure. Emissions for all significant sites have been disclosed, which includes our top five highest consuming locations: London, Burum, Auckland, Paumalu and Perth. The GHG sources that constitute our operational boundary for the 2016 reporting period are:
> Scope 1: Natural gas combustion within boilers, gas oil combustion within generators, road fuel combustion within vehicles, and fugitive refrigerants from air-conditioning equipment
> Scope 2: Purchased electricity consumption for our own use
> Scope 3: Business travel, water, waste, and well-to-tank electricity emissions
Assumptions and estimations
In some cases, missing data has been estimated using either extrapolation of available data from the reporting period or data from 2015 as a proxy.
ANNUAL REPORT AND ACCOUNTS 2016 – INMARSAT PLC – 63STRATEGIC REPORT – GOVERNANCE – FINANCIAL STATEMENTS
REPORT OF THE DIRECTORS CONTINUED
AUDITOREach of the Directors has confirmed that:
> so far as the Director is aware, there is no relevant audit information of which the Company’s Auditor is unaware and
> the Director has taken all the steps that he/she ought to have taken as a Director to make him/herself aware of any relevant audit information and to establish that the Company’s Auditor is aware of that information
This confirmation is given and should be interpreted in accordance with the provisions of s418 of the Companies Act 2006.
A resolution to re-appoint Deloitte LLP as Auditor of the Company and to authorise the Audit Committee of the Board of Directors to determine its remuneration will be proposed at the 2017 AGM.
2017 ANNUAL GENERAL MEETINGThe Annual General Meeting will be held on 4 May 2017 at 10.00am at 99 City Road, London EC1Y 1AX. The Notice of Meeting, which sets out the resolutions to be proposed at the forthcoming AGM, is contained in a separate circular and is enclosed with this Annual Report.
By order of the Board
ALISON HORROCKS FCISChief Corporate Affairs Officer and Company Secretary
8 March 2017
RULES GOVERNING DIRECTORS’ APPOINTMENTSShareholders can appoint or remove Directors by an ordinary resolution in a general meeting but specific conditions on vacation of office apply where a Director becomes prohibited by law or regulation from holding office; or where a Director becomes bankrupt, mentally incapacitated or persistently absent from Directors’ meetings. Further information on Directors’ appointments are provided on page 72 of the Corporate Governance Report.
DIRECTORS’ POWERGeneral powers of the Directors are provided by the Company’s Articles of Association and the Companies Act 2006 (the ‘Act’). The powers are subject to limitations imposed by statute and directions given by special resolution of the shareholders applicable at a relevant time. Details of Directors’ powers are provided on pages 65 to 67 of the Corporate Governance Report.
DIRECTORS AND THEIR INTERESTSA full list of the individuals who were Directors of the Company during the financial year ended 31 December 2016 is set out below:
Andrew Sukawaty, Rupert Pearce, Tony Bates, Stephen Davidson, Janice Obuchowski, Kathleen Flaherty, General C. Robert Kehler (Rtd), Sir Bryan Carsberg, Dr Abe Peled, Robert Ruijter, Simon Bax , Dr Hamadoun Touré and Phillipa McCrostie.
Stephen Davidson and Kathleen Flaherty retired as Directors on 19 January 2017 and 2 March 2017 respectively.
Details of the interests of each Director and their connected persons in the Company’s ordinary shares and share awards held are set out in full in the Directors' Remuneration Report on page 100.
Details of the Directors’ conflicts of interest policy are provided on page 68.
ARTICLES OF ASSOCIATIONThe Articles of Association can only be amended by special resolution of the shareholders.
64 – INMARSAT PLC – ANNUAL REPORT AND ACCOUNTS 2016
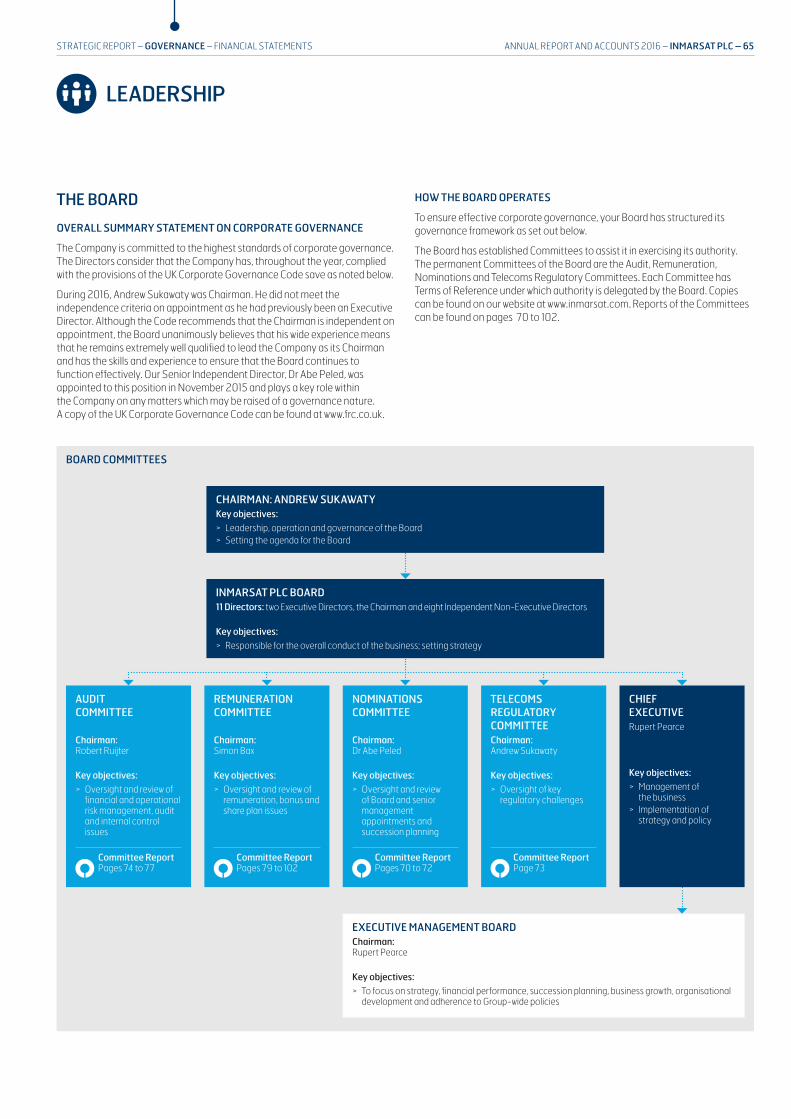
LEADERSHIP
HOW THE BOARD OPERATES
To ensure effective corporate governance, your Board has structured its governance framework as set out below.
The Board has established Committees to assist it in exercising its authority. The permanent Committees of the Board are the Audit, Remuneration, Nominations and Telecoms Regulatory Committees. Each Committee has Terms of Reference under which authority is delegated by the Board. Copies can be found on our website at www.inmarsat.com. Reports of the Committees can be found on pages 70 to 102.
THE BOARD
OVERALL SUMMARY STATEMENT ON CORPORATE GOVERNANCE
The Company is committed to the highest standards of corporate governance. The Directors consider that the Company has, throughout the year, complied with the provisions of the UK Corporate Governance Code save as noted below.
During 2016, Andrew Sukawaty was Chairman. He did not meet the independence criteria on appointment as he had previously been an Executive Director. Although the Code recommends that the Chairman is independent on appointment, the Board unanimously believes that his wide experience means that he remains extremely well qualified to lead the Company as its Chairman and has the skills and experience to ensure that the Board continues to function effectively. Our Senior Independent Director, Dr Abe Peled, was appointed to this position in November 2015 and plays a key role within the Company on any matters which may be raised of a governance nature. A copy of the UK Corporate Governance Code can be found at www.frc.co.uk.
BOARD COMMITTEES
AUDIT COMMITTEE
Chairman: Robert Ruijter
Key objectives: > Oversight and review of
financial and operational risk management, audit and internal control issues
NOMINATIONS COMMITTEE
Chairman: Dr Abe Peled
Key objectives: > Oversight and review
of Board and senior management appointments and succession planning
REMUNERATION COMMITTEE
Chairman: Simon Bax
Key objectives: > Oversight and review of
remuneration, bonus and share plan issues
TELECOMS REGULATORY COMMITTEE Chairman: Andrew Sukawaty
Key objectives: > Oversight of key
regulatory challenges
CHIEF EXECUTIVERupert Pearce
Key objectives: > Management of
the business > Implementation of
strategy and policy
CHAIRMAN: ANDREW SUKAWATYKey objectives:
> Leadership, operation and governance of the Board > Setting the agenda for the Board
INMARSAT PLC BOARD11 Directors: two Executive Directors, the Chairman and eight Independent Non-Executive Directors
Key objectives: > Responsible for the overall conduct of the business; setting strategy
EXECUTIVE MANAGEMENT BOARDChairman: Rupert Pearce
Key objectives: > To focus on strategy, financial performance, succession planning, business growth, organisational
development and adherence to Group-wide policies
ANNUAL REPORT AND ACCOUNTS 2016 – INMARSAT PLC – 65STRATEGIC REPORT – GOVERNANCE – FINANCIAL STATEMENTS
Committee Report Pages 74 to 77
Committee Report Pages 70 to 72
Committee Report Pages 79 to 102
Committee Report Page 73
LEADERSHIP CONTINUED
Ensuring appropriate financial and operational management:
> Received and discussed reports from the CEO on performance of the Group’s operations
> Received and discussed regular reports on the Group’s financial performance
> Approved financial announcements for publication
> Discussed the annual budget and long range business plan
> Approved dividend policy, recommendations and payments as appropriate, including the introduction of a scrip dividend scheme
> Reviewed reports from the Company’s corporate brokers
Implementing governance and ethics and monitoring risk:
> Assessed the risks faced by the Group and received updates on internal controls
> Reviewed regular reports on legal and compliance matters from the Company Secretary
> Received reports from the Board Committee Chairmen
> Received a report and presentation from the external evaluator for the 2015 Board evaluation
> Reviewed the Directors’ Conflicts of Interest procedures
> Received updates and reviewed procedures in connection with the implementation of the Market Abuse Regulations
Workplace reviews:
> Received a health and safety report covering activity across the Group
> Received regular updates from the CEO about reorganisation and restructuring activity taking place
> Received updates on senior management succession planning from the CEO
> Received updates on other HR matters
Special business:
> Received multiple presentations on the aviation business with a specific focus on in-flight passenger connectivity
> Reviewed and approved the Group’s capital funding for a new convertible bond and high yield bond
> Received several updates on the Company’s cyber security planning and future plans
ROLE OF THE BOARD
Our Board is responsible for the overall conduct of the Inmarsat Group’s (the ‘Group’) business. It is the primary decision-making body for all material matters affecting the Group. It provides leadership and guidance, and sets our strategic direction.
Our Board is ultimately accountable to the shareholders for:
> the performance and proper conduct of the business
> being responsible for the long-term success of the Company, having regard for the interests of all stakeholders and
> being responsible for ensuring the effectiveness and reporting on our system of corporate governance
Responsibility for implementing strategy within the Group’s operations and for day-to-day management of the business is delegated to the Chief Executive Officer who, as part of the Executive Management Board, cascades this responsibility through the Group. The CEO is empowered by the Board to handle all business activities up to a designated level of authorisation and to report to the Board for guidance, support and approval on other matters which require Board input. A list of the members of the Executive Management Board is provided on page 6.
A formal schedule of matters specifically reserved for decision or consideration by the Board as a whole has been agreed by the Directors. This schedule covers areas such as:
> the Group’s business strategy and long-term plans
> major capital projects
> investments and
> acquisitions and divestments
The Board has an annual rolling plan of items for discussion which is reviewed formally at Board meetings and adapted regularly to ensure all matters reserved for the Board, with other items as appropriate, are discussed. There is an established procedure for the review of the agenda between the Chairman, Executive Directors and Company Secretary in advance of each Board meeting. At each Board meeting there is a detailed report on current trading from the Chief Executive and Chief Financial Officer and detailed papers are provided on matters where the Board will be required to make a decision or give approval. Where appropriate, specific responsibilities are delegated to Board Committees or to committees convened for special purposes.
In 2016 we focused our attention on the following key areas:
Strategy review and development:
> Attended a Group strategy day, with members of the Management Board and other senior executives, to consider key strategic priorities and challenges faced across the business
> Approved the Group strategy
> Received regular strategy and business development reports from the CEO, Chief Strategy Officer and other senior management as part of regular meetings
> Reviewed strategy plans and received reports on the operational performance for the Group’s key business areas
> Received reports on technology and innovation and related industry developments
> Reviewed Group risk as part of the discussion on strategy
66 – INMARSAT PLC – ANNUAL REPORT AND ACCOUNTS 2016
Independent Non-Executive Directors
The diverse experience and backgrounds of the Non-Executive Directors ensures that they can provide a strong independent element on the Board, debate, and constructively challenge management both in relation to the development of strategy and review of the Group’s operational and financial performance.
To determine their independence, all Non-Executive Directors are reviewed by the Nominations Committee annually against any circumstances relevant to their current or ongoing independence as set out in the Code and recommendations are made to the Board. Following such review, the Board considers all the Non-Executive Directors to be independent and free of any circumstances that could materially interfere with their ability to provide a strong and valuable contribution to the Board’s deliberations, or which could interfere with the individual Director’s ability to also act in the best interests of the Group. The Nominations Committee additionally considers the independence carefully once a Non-Executive Director has served for nine years or more to assess whether their contribution to the Board remains valuable and valid to support the Company’s strategic objectives.
Executive Management Board
The Chief Executive chairs the Executive Management Board which now meets on a monthly basis for generally 1.5/2 days. As part of its remit, this team focuses on the Group’s strategy, financial reviews and long range business planning, the competitive landscape, operational updates from all areas of the business, risk reviews, learning and development and organisational development. The Executive Management Board includes the Executive Directors, the Business Unit Presidents and the key functional heads. The names of the Executive Management team are shown on page 6.
GOVERNANCE AND CONDUCT OF BOARD MEETINGS
Our Board meets as often as necessary to effectively conduct its business. During 2016, the Board met eight times, with one of those meetings being held over two days in Washington DC and its two-day strategy/Board meeting taking place at our existing and new offices in Ålesund, Norway. These meetings in local offices provide the Board with exposure to our staff and business operations outside the London headquarters.
Key management are invited to attend all Board meetings to present on specific business issues which will include an operations update for each of the Business Units and central services divisions, covering commercial, technology and operational matters. Unscheduled supplementary meetings also take place as and when necessary. At each meeting, the Chief Executive Officer and Chief Financial Officer provide reports to the Board and several senior executives, by invitation, present updates on strategy and focus on specific parts of the Group’s operations. This way the Board is given exposure to the next layer of management at the Executive Board level and often to their direct reports. This is helpful to the Board as it supplements the discussions it has regarding planning for management succession. Strategy sessions are attended by several senior executives who present on specific agenda items. Elements of the business strategy are reviewed regularly at Board meetings throughout the year ensuring that all Directors are kept up to date with discussions and activities. All Committee Chairmen report verbally on the proceedings of their Committees at the next Board meeting. Meeting proceedings and any unresolved concerns expressed by any Director are minuted by the Company Secretary.
KEY ROLES AND RESPONSIBILITIES
The Chairman – Andrew Sukawaty
The role of the Chairman is set out in writing and agreed by the Board. He is responsible for:
> effective leadership, operation and governance of the Board
> ensuring the effectiveness of the Board
> setting the agenda, style and tone of Board discussions and
> ensuring Directors receive accurate, timely and clear information
The Chief Executive Officer – Rupert Pearce
The role of the Chief Executive is set out in writing and agreed by the Board. He is responsible for:
> the day-to-day managing of Inmarsat’s operations and its financial results
> recommending the strategic objectives for the Inmarsat Group, for debate, challenge and approval by the Board
> responsibility for ensuring we meet the milestones for our key programmes with a priority to target revenue growth and deliver enhanced returns to shareholders and
> chairing the Executive Management Board
Mr Pearce is the Board sponsor for environmental and social governance, community investment, and other corporate social responsibility matters, as well as responsibility for Health and Safety.
The Senior Independent Director – Dr Abe Peled
The Senior Independent Director is responsible for:
> acting as a sounding board for the Chairman
> serving as an intermediary for the other Directors
> reviewing the Chairman’s performance with the Non-Executive Directors
> being available to discuss issues or concerns from our shareholders where they have been unable to resolve them through existing channels for investor communications and
> convening regular meetings of the Non-Executive Directors
The Company Secretary – Alison Horrocks
The Company Secretary acts as Secretary to the Board and its Committees and in doing so she:
> assists the Chairman in ensuring that all Directors have full and timely access to all relevant information
> assists the Chairman by organising induction and training programmes
> assists the Chairman with the annual Board evaluation procedure
> is responsible for ensuring that the correct Board procedures are followed and advises the Board on corporate governance matters and
> administers the procedure under which Directors can, where appropriate, obtain independent professional advice at the Company’s expense (no requests for external professional advice were received during the year)
ANNUAL REPORT AND ACCOUNTS 2016 – INMARSAT PLC – 67STRATEGIC REPORT – GOVERNANCE – FINANCIAL STATEMENTS

LEADERSHIP CONTINUED
Number of scheduled Board meetings held and meeting attendance in 2016
MeetingsPercentage attendance
Andrew Sukawaty (Chairman) 8/8 100%
Rupert Pearce 8/8 100%
Tony Bates 8/8 100%
Simon Bax 8/8 100%
Sir Bryan Carsberg 8/8 100%
Stephen Davidson 8/8 100%
Kathleen Flaherty 8/8 100%
General C. Robert Kehler (Rtd) 8/8 100%
Dr Abe Peled 8/8 100%
Janice Obuchowski 8/8 100%
Robert Ruijter 8/8 100%
Dr Hamadoun Touré 8/8 100%
Philippa McCrostie1 3/3 100%
1 Appointed on 1 September 2016
RISK MANAGEMENT PROCESS
An overview of the Group’s framework for identifying and managing risk, both at an operational and strategic level, is set out on pages 50 to 55 in the Strategic Report. The Board has responsibility for managing risk and although the Audit Committee has responsibility for the risk management process the Board does not delegate overall responsibility for risk to either the Audit Committee or management. There has been additional work undertaken in 2016 on risk processes and assessment and updates were noted in the changing content and presentation information presented to the Audit Committee and Board.
The Board have annual updates on the Company’s policies for compliance with the UK Bribery Act, and the US Foreign Corrupt Practices Act (‘FCPA’) requirements and health and safety. As part of our commitment to preventing bribery and establishing a culture that does not tolerate corruption wherever and in whatever form it may be encountered, we have a formal Board-approved anti-corruption policy and a summary of the anti-bribery policy is included on our website. We have appropriate procedures in place to ensure compliance with current legislation. An independently managed, confidential whistleblowing helpline (email and telephone) is available to employees to use. There was no use of it during 2016.
In instances where a Director is unable to attend Board or Committee meetings, any comments which he or she may have arising out of the papers to be considered at the meeting are relayed in advance to the relevant Chairman or the Company Secretary who would then report to the Board or Committee thereon.
The Senior Independent Director will convene meetings with the Non-Executive Directors at least annually and on an ad-hoc basis as required to discuss Board balance, monitor the powers of individual Executive Directors and raise any issues between themselves as appropriate. The Chairman will attend these meetings but will not be in attendance where there is discussion about his own performance.
INDEMNIFICATION OF DIRECTORS
Directors’ and Officers’ insurance cover has been established for all Directors and Officers to provide cover against their reasonable actions on behalf of the Company. In accordance with our Articles of Association and to the extent permitted by the laws of England and Wales, Directors, the Company Secretary and certain employees who serve as directors of subsidiaries at the Group’s request have been granted indemnities from the Company in respect of liabilities incurred as a result of their office. Neither our indemnity nor the insurance provides cover in the event that a Director is proven to have acted dishonestly or fraudulently. No amount has been paid under any of these indemnities during the year.
CONFLICTS OF INTEREST
The Company has in place procedures for managing conflicts of interest and is aware of any potential conflict through an annual review of the other commitments of its Directors. We are satisfied these commitments do not conflict with their duties as Directors of Inmarsat. During the year, where there were agenda items being raised for discussion which could have the perception of a conflict of interest for the individual Director, these were discussed at the relevant Board meeting and agreed in each case there were no conflicts of interest identified. The Company’s Articles of Association contain provisions to allow the Directors to authorise potential conflicts of interest so that a Director is not in breach of his/her duty under company law. As noted above, and happens in practice, should a Director become aware that they have an interest, directly or indirectly, in an existing or proposed transaction with the Company, they are required to notify this to the Company Secretary. Directors have a continuing duty to notify any changes to their conflicts of interest and to their external Board commitments to the Company Secretary and any changes are noted in the conflicts register.
BOARD MEETING ATTENDANCE
The attendance of the Directors at the Board meetings held in 2016 is shown in the next table. Pip McCrostie joined the Board in September 2016. Attendance at Committee meetings is shown in the relevant Committee reports.
68 – INMARSAT PLC – ANNUAL REPORT AND ACCOUNTS 2016
the actions being taken to manage the risk to the desired level. All the risk registers are reviewed by senior management and provided quarterly to the Board and to the Audit Committee. Details of the risk process and key risks are shown on pages 50 to 55 in the Strategic Report.
> Management structure: there is a clearly defined organisational structure throughout the Group with established lines of reporting and delegation of authority based on job responsibilities and experience. Within the business, senior management meetings occur regularly to allow prompt discussion of relevant business issues. A process of self-certification is used where Directors and senior managers are required to detail and certify controls in operation to mitigate risk in key process areas. The Presidents of the Business Units also confirm every quarter that they are not aware of any breach of key policies including our sensitive information policy (which relates to protection of partner data) and any anti-bribery activities.
> Financial reporting: monthly management accounts provide relevant, reliable and up-to-date financial and non-financial information to management and the Board. Analysis is undertaken of differences between actual results and the annual budget on a monthly basis. Annual plans, forecasts, performance targets and long range business plans allow management to monitor the key business and financial activities, and the progress towards achieving the financial objectives. The annual budget is approved by the Board, as is the long range business plan. The Group reports half-yearly based on a standardised reporting process, and in addition, also reports on a quarterly basis.
> Information systems: information systems are developed to support the Group’s long-term objectives and are managed by professionally staffed teams. Appropriate policies and procedures are in place covering all significant areas of the business.
> Contractual commitments: there are clearly defined policies and procedures for entering into contractual commitments. These include detailed requirements that must be completed prior to submitting proposals and/or tenders for work, both in respect of the commercial, control and risk management aspects of the obligations being entered into. Business plan approval and procurement process procedures also strengthen the review of contractual commitments before any such commitment is agreed to.
> Monitoring of controls: the Audit Committee receives regular reports from the internal and external auditors and assures itself that the internal control environment of the Group is operating effectively. There are formal policies and procedures in place to ensure the integrity and accuracy of the accounting records and to safeguard the Group’s assets. Significant capital projects and acquisitions and disposals require Board approval. There are formal procedures by which staff can, in confidence, raise concerns about possible improprieties in financial and pensions administration and other matters – often referred to as ‘whistleblowing’ procedures. There is a worldwide anonymous whistleblowing programme in place and monthly reports are issued by the external provider to the Company Secretary and Head of Internal Audit. No issues were reported in the year. Where there are any reports made, arrangements are in place for proportionate and independent investigation and appropriate follow-up action with the results being reported to the Audit Committee.
DIRECTORS’ REMUNERATION
Details of the Company’s remuneration policy and Directors’ remuneration are contained in the Directors’ Remuneration Report on pages 79 to 102.
The Company recognises the importance of electronic information, systems and network security (cyber security) and this area was one of keen interest and debate at Board meetings during the year. We are increasingly required to be compliant with, or align to, various legal, contractual and regulatory standards and codes of practice relative to information security governance and the preservation of the confidentiality, integrity and availability of customer or internal data and services. This is part of a broader programme supported by a dedicated cyber security team whose primary role is to safeguard the Company to meet its legal and regulatory obligations, maintain business continuity and limit damage to business interests by preventing and reducing the occurrence of security incidents and their impact upon business operations. In recognition of this importance, we have committed to seek certification to the ISO27001 standard which requires us to have an information management security procedure in place and also increased our investments on cyber during 2016 in terms of resources and on tools.
Internal controls
The Board acknowledges its responsibility for establishing and maintaining the Group’s system of internal controls and it receives regular reports from management identifying, evaluating and managing the risks within the business. The system of internal controls is designed to manage, rather than eliminate, the risk of failure to achieve business objectives and can provide only reasonable and not absolute assurance against material misstatement or loss. The Audit Committee reviews the system of internal controls through reports received from management, along with those from both internal and external auditors. Management continues to focus on how internal control and risk management can be further embedded into the operations of the business and to deal with areas of improvement which come to management’s and the Board’s attention.
The Company has an established Disclosure Committee with responsibility for reviewing and approving controls and procedures over the public disclosure of financial and related information and other procedures necessary to enable the Chairman, Chief Executive Officer and the Chief Financial Officer to provide their certifications in relation to publicly disclosed information. The Disclosure Committee comprises the Chairman, both Executive Directors, Company Secretary and other senior executives.
The Board and the Audit Committee have carried out a review of the effectiveness of the system of internal controls during the year ended 31 December 2016 and for the period up to the date of approval of the consolidated financial statements contained in the Annual Report. The review covered all material controls, including financial, operational and compliance controls and risk management systems. The Board confirms that the actions it considers necessary have been, or are being taken to remedy any significant failings or weaknesses identified from its review of the system of internal control. This has involved considering the matters reported to it and developing plans and programmes that it considers are reasonable in the circumstances. The Board also confirms that it has not been advised of material weaknesses in the part of the internal control system that relates to financial reporting.
The key elements of the Group’s system of internal controls, which have been in place throughout the year under review and up to the date of this Report, include:
> Risk management: an overarching risk management policy is in place which sets out the tolerance for risk within the Group and how this is measured across identified macro and business risks. As required by the policy, management operates a risk management process to identify, evaluate and report significant risks within the business and to report to the Board on how those risks are being managed and mitigated. Risks are highlighted through a number of different reviews and culminate in a risk register, monitored by Risk Committees across the Group, which identify the risk area, the probability of the risk occurring, the impact if it does occur and
ANNUAL REPORT AND ACCOUNTS 2016 – INMARSAT PLC – 69STRATEGIC REPORT – GOVERNANCE – FINANCIAL STATEMENTS
2016 ACTIVITIES INCLUDED: > We supported the appointment of a new Non-Executive Director who
joined the Board in September 2016
> We reviewed the composition of the Board and discussed the retirement of two longer-serving Directors and agreed that our other Directors continued to demonstrate the right qualities of independence and judgement
> We reviewed the senior management succession plan, and considered the talent available below the Executive Management Board level
MEMBERS IN 2016
Scheduled meetings attended
Dr Abe Peled (Chairman)
Stephen Davidson
Andrew Sukawaty
Dr Hamadoun Touré
AREA OF FOCUS FOR 2016
An area of focus for the Committee has been Non-Executive Director succession planning. We purposefully increased the size of the Board starting in 2014 to allow time for new Directors to come up to speed on our business activities and strategy before longer-serving Directors retired. We have found this has worked very well and the new Directors, including the most recent addition in September 2016, have brought an additional skill-set and breadth of experience to Board discussions. We believe we are now into a more normal retirement and appointment cycle for Non-Executive Directors.
Independent Non-Executive Directors make up a majority of members of the Committee. The Nominations Committee meets as and when necessary, generally at least twice a year. Dr Abe Peled became Chairman in November 2015. Other members of the Committee are Andrew Sukawaty, Stephen Davidson (up to his retirement in January 2017) and Dr Hamadoun Touré. During 2016 the Committee met twice.
The Committee has responsibility for nominating candidates for appointment as Directors to the Board, bearing in mind the need for diversity (including gender) and ensuring a broad representation of skills across the Board. In doing this, the Committee will give full consideration to succession planning and the leadership needs of the Company. The Committee also makes recommendations to the Board on the composition of the Board’s Committees and will review and make recommendations in relation to the structure, size and composition of the Board including the diversity and balance of skills, knowledge and experience, and the independence of the Non-Executive Directors, including the tenure of each Director.
The Nominations Committee will also make recommendations to the Board concerning the annual reappointment by shareholders of any Non-Executive Director as he or she reaches their sixth year of reappointment and separately with a view to assessing their continuing independence thereafter, particularly when Directors are seeking to be reappointed after serving nine years. The Committee also has responsibility for approving any changes to Executive Directors including senior management appointments. All currently appointed Directors will retire at the 2017 AGM and offer themselves for reappointment, or offer themselves for appointment as appropriate. As noted earlier in the Corporate Governance Report, the Committee has agreed that it was appropriate that although Sir Bryan Carsberg, who is the remaining Director appointed at the IPO in 2005, has exceeded his original term of office, he remains independent in his contribution, and should be invited to serve for a longer period and therefore he is considered independent. This independence is observed at Board meetings in the way Sir Bryan constructively challenges management and approaches meetings fully briefed and is fully engaged in the discussion. Sir Bryan’s length of service, resulting experience and knowledge of the Company is of great benefit to the Board. The subject of his independence will be kept under review.
COMPOSITIONOur Board comprises Directors drawn from a wide range of professional backgrounds. All our Directors bring strong judgement to the Board’s deliberations. The Non-Executive Directors we appointed in 2015 and more recently in 2016 have all contributed very effectively to Board discussions and have demonstrated their increasing knowledge of how the Company operates and its business. We took the decision to appoint these additional Directors while retaining the expertise of existing Directors thus enabling us to have an orderly retirement process of longer-serving Board Directors over the coming years. In 2015 we appointed Robert Ruijter and Dr Hamadoun Touré and in 2016 we appointed Philippa (‘Pip’) McCrostie. Stephen Davidson and Kathleen Flaherty both retired from the Board in January and March 2017 respectively.
As at 6 March 2017, the composition of the Board is two Executive Directors, eight Non-Executive Directors and a Non-Executive Chairman. With the exception of Pip McCrostie, all Directors served throughout the year. The names of the Directors on our Board, their relevant skills and experience are set out in their biographical details and can be found on pages 58 to 60.
The composition of the Board and its various Committees is regularly reviewed and evaluated so as to reflect the balance of skills, knowledge, diversity (of which gender is one component), experience and the ability of Directors to provide sufficient time to fulfil their Board responsibilities.
REPORT OF THE NOMINATIONS COMMITTEE
EFFECTIVENESS
Dr Abe Peled Chairman, Nominations Committee
70 – INMARSAT PLC – ANNUAL REPORT AND ACCOUNTS 2016

development needs, each Director is expected to ask about any specific training needs. They also take steps to ensure they are adequately informed about the Company and their responsibilities as a Director and attend external briefings and receive information updates. The Board is confident that its members have the knowledge, ability and experience to perform the functions required of a Director of a listed company.
BOARD EVALUATION In 2015 the Company undertook an external evaluation, facilitated by Duncan Reed of Condign Board Consulting. This was the second time Mr Reed had undertaken the external evaluation. Neither Mr Reed nor Condign Board Consulting have any other commercial relationships with Inmarsat.
We shared in last year’s Annual Report the summary of findings and highlighted potential areas for future review.
The evaluation exercise also reviewed the work of the Committees and their own effectiveness. Potential areas for future review were noted as follows:
> Improving the use of the Board’s time which may involve splitting more meetings over two days – we have meetings three times a year where the meetings are split over two days to improve the effectiveness and use of the Board’s time
> Ensuring that presentations to the Board include a comprehensive executive summary – we have made some progress on this and further focus is required as this has also been highlighted as something for action from the 2016 Board Evaluation exercise
> Request for the risk register to be focused on key risks faced by the Company and accountability for mitigating actions – the risk review process has been updated and refreshed with a focus on key risks
> Ensuring that the Board receives early updates on proposals from management on significant transactional issues to receive early support – this is happening with key strategic discussions which are being considered as they are brought to the Board at inception for review and discussion
> A review at each meeting of upcoming items for the subsequent meetings – this is now an agenda item in its own right reviewed regularly during the year
The 2016 Board evaluation was undertaken by the Company Secretary on behalf of the Chairman. This took the form of a questionnaire to all Directors and a meeting between the Company Secretary and each of the Directors.
The main outputs from the exercise confirmed that the new Non-Executive Directors had continued to perform well and had gained much more knowledge about the business and could therefore contribute more effectively to the strategy discussions and business issues. There continued to be full support for the Chairman and how he managed the Board, seeking to ensure that all Directors contributed to the discussion and managed the discussion effectively.
The items coming out as areas for further development related to using executive summaries for papers in order to focus the discussion at the strategic level and ensure the agenda is structured to allow the right level of discussion of topics.
SUCCESSION PLANNINGAppointments to the Board are made on merit, against objective criteria and with due regard to the benefits of diversity on the Board. This process is led by the Committee which, after evaluating the balance of skills, knowledge and experience of each Director, makes recommendations to the Board.
In appointing Non-Executive Directors, the Board’s practice is to use a combination of external recruitment consultants and personal referrals. The Non-Executive Director who was appointed in 2016 was through a personal recommendation made to a Director.
In considering the skills required for the new Non-Executive Director, there was focus on seeking an individual who had broad corporate, strategic and M&A knowledge as we felt that this would be additive to the current experience of the Board and provide a complementary overlay to other Board members’ experience. Mrs McCrostie’s experience in leading the Transaction Advisory Services for EY and her experience in corporate finance and tax met the requirements for the role. We are delighted that Pip decided to join Inmarsat as this was her first non-executive public company position. As part of the recruitment process, Pip met several people including the Chairman of the Board, the CEO, CFO and the Company Secretary and spoke with the Company’s auditors. Other members of the Board were also given the opportunity to meet her.
The Committee, when reviewing succession planning, considers diversity in its broadest sense and takes this into account in its recommendations to the Board. It takes into account the challenges and opportunities facing the Company; diversity, including gender; and what skills and expertise are needed on the Board and from senior management in the future. Gender is one element of the considerations made in appointing senior management and Board members and as part of general recruitment practices across the Group. The Committee has not set quotas for the percentage of women in the workforce but is supportive of the need generally to encourage diversity when employees and Directors (Executive and Non-Executive) are recruited. The Committee gives full consideration to succession planning in the course of its work and receives updated management succession plans which look at succession planning for the Executive Management Board and identifies the next layer of management below them who are identified as those with potential for promotion to senior management positions. This document is updated at least annually to reflect changes in senior management.
INDUCTION AND ONGOING PROFESSIONAL DEVELOPMENTTo ensure that each Director receives appropriate support on joining the Board, they are given a comprehensive, formal and tailored induction programme organised through the Company Secretary, including the provision of background material on the Company and briefings with each of the Executive Management Board. These meetings will ensure that the on-boarding process for a new Director provides a view of each area of the business with the opportunity for further discussion as appropriate. Each Director’s individual experience and background is taken into account in developing a programme tailored to his or her own requirements. The induction programme was reviewed and updated in 2016 for Mrs McCrostie and took place over a number of days to allow sufficient time for each meeting.
For professional ongoing development, the Board receives presentations relevant to the Company’s business and updates on any changes in legislation which may affect the Company’s operations. The Company Secretary supplies all Directors with information on relevant legal and best practice. For example the requirements of the Market Abuse Regulations were briefed to the Board. As part of their annual performance evaluation, Directors are given the opportunity to discuss training and development needs. Whilst the Chairman takes ultimate responsibility for overseeing the Directors’ training and
ANNUAL REPORT AND ACCOUNTS 2016 – INMARSAT PLC – 71STRATEGIC REPORT – GOVERNANCE – FINANCIAL STATEMENTS
EXTERNAL DIRECTORSHIPS The Board believes, in principle, in the benefit of Executive Directors accepting non-executive directorships of other companies in order to widen their skills and knowledge for the benefit of the Company. All such appointments require the prior approval of the Board and the number of public company appointments is generally limited to two. Details of external appointments for the CEO can be found in his biography on page 58. There were no fees paid to the CEO for these duties.
APPOINTMENT AND REAPPOINTMENTThe Directors may appoint additional members to join the Board during the year. Directors appointed in this way will, upon the recommendation of the Board, offer themselves for election by shareholders at the first AGM after their appointment. The reappointment of Directors is subject to their ongoing commitment to Board activities and satisfactory performance. All Directors will stand for reappointment annually in accordance with the provision of the Code. The Nominations Committee confirmed to the Board that the contributions made by the Directors offering themselves for reappointment at the 2017 AGM continue to benefit the Board and the Company should support their reappointment. Non-Executive Directors are appointed initially for three years and all Non-Executive Directors may not, unless agreed by the Board, remain in office for a period longer than six years, or two terms in office, whichever is the shorter.
As already set out earlier in this Report on page 70, one of our Non-Executive Directors, Sir Bryan Carsberg is being supported by the Board for reappointment as an independent Non-Executive Director even though he will have served for longer than nine years.
EFFECTIVENESS CONTINUED
72 – INMARSAT PLC – ANNUAL REPORT AND ACCOUNTS 2016
2016 ACTIVITIES INCLUDED: > We reviewed the regulations being proposed in key countries in which
we operate
> We reviewed the lessons learned from the last World Radio Conference
> We provided overview guidance on developing regulatory activities
MEMBERS IN 2016
Scheduled meetings attended
Andrew Sukawaty (Chairman)
Sir Bryan Carsberg
Janice Obuchowski
Dr Hamadoun Touré
AREA OF FOCUS FOR 2016
A key focus for the Committee during 2016 was to contribute oversight and guidance for the Company’s activities across the various working groups with which it is involved. The Committee was also presented with updates from senior regulatory experts about upcoming legislation and activities which could have an impact on the Company’s regulatory roadmap.
The Telecoms Regulatory Committee was created in May 2015, specifically to ensure there was focus from the Board on this key area which affected all parts of the Company’s business operations – both now and in the future. The Committee comprises a majority of independent Non-Executive Directors and meets as and when necessary, generally twice a year. Andrew Sukawaty is Chairman. During 2016 the Committee met twice.
The Telecoms Regulatory Committee is authorised by the Board to:
> review key regulatory challenges facing the business of the Company and the strategy and action plans proposed to meet such challenges
> discuss the Company’s strategy for acquisition of spectrum and frequency rights
> facilitate high level engagement with governments, regulatory bodies and international organisations as identified by the Company
> review upcoming key regulatory meetings, the proposed agendas and events and the Company’s plans to cover such events
> support the Company in various countries to secure authorisations for market access as identified by the Company
> obtain the advice and assistance of any of the Company’s executives having particular expertise in such matters and
> to review, and advise on, the ongoing appropriateness and relevance of the Company’s regulatory policy and strategy as presented by the Company’s executives and provide guidance on proactive measures proposed by the Company to maintain its leading position and competitiveness in the industry
A key focus for the Company during 2016 was a review of performance and outcome from the Company’s participation at the 2015 World Radio Conference, and looking forward to considering the planning requirements for the next such meeting. The Committee also discussed the regulatory situation regarding the S-band license and the discussions taking place with the regulators about this new spectrum and how it would be used by the Company. The inputs of the Committee members to provide guidance and share views with the management team who are representing the Company on regulatory matters is extremely valuable.
REPORT OF THE TELECOMS REGULATORY COMMITTEE
ACCOUNTABILITY
Andrew Sukawaty Chairman, Telecoms Regulatory Committee
ANNUAL REPORT AND ACCOUNTS 2016 – INMARSAT PLC – 73STRATEGIC REPORT – GOVERNANCE – FINANCIAL STATEMENTS
ACCOUNTABILITY CONTINUED
2016 ACTIVITIES INCLUDED: > We ensured the smooth running of the Committee following a change in
Chairmanship in November 2015
> We completed the retender process for the audit firm and reappointed Deloitte LLP
> The risk management process improved during the year incorporating feedback from the Committee
MEMBERS IN 2016
Scheduled meetings attended
Robert Ruijter (Chairman)
Sir Bryan Carsberg
Stephen Davidson
Janice Obuchowski
Philippa McCrostie1
1 Mrs McCrostie joined in September 2016
AREA OF FOCUS FOR 2016
The Committee had requested changes to the risk management process in 2016 to focus on principal risks and their mitigation which was reflected in updated and more effective principal risk disclosure documents being available for review. The Committee felt that based on all the assessments and sensitivity analysis made, the viability statement could be supported for Board approval. The Committee also supported the retender process for the audit firm and confirmed the reappointment of Deloitte LLP.
All members of the Audit Committee are independent Non-Executive Directors and the majority have significant, recent and relevant financial experience. The Board is confident that the collective experience of the Audit Committee members enables them, as a group, to act as an effective Committee.
The table to the left shows who makes up the Audit Committee and their attendance at meetings during 2016. Robert Ruijter became Chairman in November 2015. All members, apart from Dr Obuchowski, are considered financial experts. Mrs McCrostie joined the Board in September 2016 and became a member of the Committee from that date. Mr Davidson stepped down from the Committee in January 2017 when he retired from the Board.
By invitation, the meetings of the Audit Committee may be attended by the Chairman, Chief Executive Officer, Chief Financial Officer and the Head of Internal Audit. The Deloitte LLP (‘Deloitte’) audit engagement partner is present at all Audit Committee meetings to ensure full communication of matters relating to the audit. The Chairman of the Audit Committee meets regularly with the internal and external auditors and at the end of each Audit Committee meeting there is a short meeting of just the Committee, Company Chairman and auditors (which includes the internal auditor several times during the year) for an open discussion about the audit process and relationship with management. The Committee Chairman and Mr Davidson were part of a sub-committee of the Board charged with undertaking the review of the capital structuring and the decision to offer a new convertible bond and a new high yield bond. The Committee Chairman was also actively involved as part of the retender process for the auditor and in the decision making to reappoint Deloitte.
The Audit Committee has particular responsibility for:
> monitoring the financial reporting process
> the adequacy and effectiveness of the operation of internal controls and risk management
> the integrity of the financial statements. This includes a review of significant issues and judgements, policies, and disclosures
> keeping under review the scope and results of the audit and its cost effectiveness
> consideration of management’s response to any major external or internal audit recommendations
> being assured of the independence and objectivity of the internal and external auditor and
> in 2017 there will be particular focus on the new IFRS 15 and 16 accounting standards and their implementation
The Board requested that the Committee advise whether it believes the Annual Report and Accounts, taken as a whole, is fair, balanced and understandable and provides the information necessary for shareholders to assess the Company’s position, performance, business model and strategy. The financial results include those from Inmarsat Government Inc., a proxy company based in the US which is managed under a Proxy arrangement as required by the US Government to ensure it is insulated from foreign ownership, control or influence. This company was acquired in 2010 and has been operating under the Proxy arrangement since that time.
The Committee’s terms of reference have been updated to reflect best practice, and can be found on our website. Details about the Committee’s assessment are shown at the end of this Report.
REPORT OF THE AUDIT COMMITTEE
Robert Ruijter Chairman, Audit Committee
74 – INMARSAT PLC – ANNUAL REPORT AND ACCOUNTS 2016

> reviewing key accounting judgements relating to specific transactions as well as changes to any accounting policies affecting the Group’s financial position and
> review of the accounting impact of the refinancing undertaken in September 2016 and the regular monitoring of the global centralisation of the Group’s transactional banking with J.P. Morgan
Reviews by the Committee of audit plans and risk reports include all Group operations. Detailed risk reporting is used for all Group companies and business operations. One of our subsidiary companies, Inmarsat Group Ltd, is required to produce quarterly financial statements, as required by its loan agreements, which are reviewed and approved by the Committee. The quarterly review of the risk reports and the process adopted to manage risk is a key area of focus for the Committee.
Audit Committee meetings generally take place just prior to a Board meeting to maximise effectiveness and time planning efficiency of those attending. The Committee’s Chairman reports to the Board as part of a separate agenda item, on the activity of the Committee and matters of particular relevance to the Board in the conduct of their work. All members of the Board have access to Audit Committee papers and minutes of meetings, and may, on request to the Chairman, attend the meetings.
The Company Secretary, as Chairman of the Disclosure Committee (the role of which is detailed on page 69), reported on matters that affected the quality and timely disclosure of financial and other material information to the Board. This enabled the Audit Committee to review and clarify the completeness of financial reporting disclosures prior to their release by the Board.
SIGNIFICANT ACCOUNTING MATTERS During 2016, the Audit Committee considered the significant accounting matters described below. In addressing these issues the Committee considered the appropriateness of management’s accounting estimates and key judgements, outlined in note 4 to the consolidated financial statements. The Committee discussed these with the external auditor during the year and, where appropriate, details of how they have been addressed are provided in the Independent Auditors’ Report on pages 105 to 111.
REVENUE RECOGNITION
The timing of revenue recognition is a key area of judgement, especially in the telecommunications industry. The Group’s accounting policy on revenue recognition remains unchanged from the prior year, refer to note 2 for more details. The Group’s internal audit team have kept significant revenue systems, processes and recognition as a focus area during the year and the external auditor performed detailed audit procedures on revenue recognition, with the findings of both being reported to the Audit Committee. The Audit Committee have therefore concluded that the Group’s revenue recognition policies continue to be in line with IFRS requirements.
An in-depth review of revenue accounting is currently being undertaken as part of the IFRS 15 project. As part of this, management is outlining the Group’s approach to revenue recognition, particularly for more complex transactions in the Aviation business unit. Further details of the status of the IFRS 15 project are outlined in note 1.
There is a forward agenda used for the year’s activities which focus on:
> review of the annual financial statements and the results of the annual external audit and review of the external auditor’s quarterly and interim review work and relevant quarterly and interim financial reporting and the external audit plan
> review of risk management reports
> review of the preparation of the viability statement for use in the 2016 Preliminary Statement and Annual Report and
> review of internal audit plans and findings and recommendations
The Audit Committee ensures that the external audit process and audit quality are effective. It does this by:
> monitoring the engagement between the Audit Committee Chairman and the lead audit engagement partner which will generally be through face-to-face meetings
> monitoring the reports which are brought to the Committee by the lead audit engagement partner and other senior members of the audit team
> monitoring the quality of the management responses to audit queries
> monitoring meetings held by the CEO and the Chairman with the lead audit engagement partner which are reported to the Audit Chairman and Committee
> monitoring a review of independence and objectivity of the audit firm and also the quality of the formal audit report given by the Auditor to shareholders and
> seeking feedback from members of the finance team, the Company Secretary and the Head of Internal Audit. The Committee is considering the use of a formal auditor assessment tool for future review of audit effectiveness
During the reporting year to 31 December 2016, the activities of the Audit Committee were:
> to ensure a smooth running of the Audit Committee following the transition of Committee chairmanship
> for the Committee Chairman to be involved in the discussion, planning and decision for a retender of the audit firm in accordance with rotation requirements for external auditors as Deloitte has been Auditor to the Company for 10 years with updates reported to the Committee
> approving the appointment of a new reporting partner following the five-year rotation period of the previous partner
> confirming to the Board that the Annual Report and Accounts is fair, balanced and understandable
> review and endorsement, prior to submission to the Board, of half-year and full-year financial statements, interim management statements and results announcements
> review and approval of internal audit reports, and findings and recommendations arising from the reports
> review and approval of risk management updates and the annual risk management process
> agreement of external and internal annual audit plans
> receiving updates on management responses to audit recommendations
> monitor changes in the approach to assessing the carrying value of goodwill and intangibles for possible impairment and review the conclusions of the assessment
ANNUAL REPORT AND ACCOUNTS 2016 – INMARSAT PLC – 75STRATEGIC REPORT – GOVERNANCE – FINANCIAL STATEMENTS
ACCOUNTABILITY CONTINUED
verbal and written reports from the external auditor on these matters. Following these procedures, the Audit Committee deemed the income tax assets and liabilities balances for the year, as well as the Group’s disclosure in respect of income taxes and related liabilities, to be appropriate.
CAPITALISATION OF SPACE SEGMENT ASSETS AND ASSOCIATED BORROWING COSTS
Space segment assets comprise satellite construction, launch and other associated costs, including ground infrastructure. In addition, borrowing costs attributable to qualifying space segment assets are added to the cost of those assets. Given the nature of the Group’s business, significant capital expenditure is incurred on space segment assets. The key judgements involved in the capitalisation of space segment assets and associated borrowings costs are:
> whether the capitalisation criteria of the underlying IFRS have been met
> allocation of an appropriate asset class and associated useful economic life in accordance with Group policies
> whether an asset is deemed to be substantially complete and as a result capitalisation of borrowing costs should cease and
> whether an asset is ready for use and as a result further capitalisation of costs should cease and depreciation should commence
The external auditor examined the capitalisation of development costs in the year, particularly in relation to the Global Xpress and S-band satellite programmes and reported its findings to the Audit Committee. The Audit Committee is satisfied that space segment assets and associated borrowing costs have been capitalised correctly in the year.
VIABILITY STATEMENTThe Audit Committee received a detailed paper from management setting out both the Directors’ obligation to include a viability statement in the Annual Report and a detailed assessment of the Group’s viability. The Committee endorsed the selection of a three-year time horizon as a basis for the statement and reviewed the detailed viability assessment including the assumptions that had been made in conducting the assessment. Further detail on the assessment of viability and the viability statement are set out on page 55.
INTERNAL AUDITMonitoring and review of the scope, extent and effectiveness of the activity of the Internal Audit Department is an agenda item at each Committee meeting. The Internal Auditor presents reports at each meeting covering updates on Internal Audit activities, results of audits and follow up actions required and their annual audit plan. These may cover areas such as revenue assurance, accounting operations review following the implementation of a Group-wide financial accounting system, review of annual bonus calculations and IT security and systems reviews.
During 2016, there has been more linkage between the Internal Auditor’s reports and the key risks identified by the Company. The Committee can see clearly from the risk reports which risks have been reviewed by the Internal Auditor as part of their annual review. The Chairman of the Committee meets regularly with the Internal Auditor.
EXTERNAL AUDITORThe Financial Reporting Council issued a guide for Audit Committees to help them evaluate auditor effectiveness. There are several criteria included within the report and while the Committee did not undertake a formal review, it received inputs from different sources such as the Auditors themselves, as well as management and the input from the members of the Committee itself
REVENUE IN RESPECT OF THE LIGADO NETWORKS COOPERATION AGREEMENT
The Audit Committee continues to review the accounting treatment for the recognition of revenue and costs in respect of each phase of the Ligado Networks (formerly LightSquared) Cooperation Agreement.
In March 2016, Ligado Networks agreed to take the 30MHz option (the ‘30MHz Plan’) under the Cooperation Agreement between the companies. In exchange for the deferral of some payments from Ligado to Inmarsat, the parties agreed to delay the transition to the 30MHz Plan, with Ligado providing Inmarsat enhanced spectrum usage rights for its satellite operations for a minimum period of two years. With this in mind, Ligado made quarterly payments to Inmarsat of $108m during the course of 2016 and will make aggregate payments of approximately $111m and $118m in respect of 2017 and 2018 respectively, payable in quarterly instalments. This revenue is recognised on an accruals basis. Over the three-year period, up to approximately $35m of additional contracted payments will be deferred.
Deferred income in respect of Phase 1 from Ligado continues to be carried on the balance sheet. Although the cash has been received, the timing of the recognition of this deferred income, together with any related future costs and taxes, is dependent upon a number of factors that continue to be uncertain. The impact of the foregoing on the deferred revenue balance of $197.8m (at 31 December 2016) carried by Inmarsat in respect of the costs of implementation of this agreement is still to be determined. During 2016, Inmarsat recognised $11.0m of deferred income as revenue to reflect the impact of the revenue deferral arising under the revised transition agreement.
The Audit Committee has deemed the current accounting treatment of all phases of the Cooperation Agreement appropriate.
REFINANCING
In September three funding transactions were completed. These transactions reduce funding risk for the Company by both materially extending the maturity profile of the current capital structure and by bringing in substantial new funds, all at fixed interest rates.
> $391m convertible bond due for repayment in 2017 was redeemed (including accrued interest of $1.6m)
> $650m convertible bond due for repayment in 2023 was issued
> $400m high yield bond due for repayment in 2024 was issued
These three transactions total $659m which, after transactions costs of $14m, raised net cash of $645m.
A loss of $33m has been recognised on the redemption of the old convertible bond in the profit and loss account through the financing line which relates in part to the 1.5% premium paid on redemption. However, the majority of the loss relates to the acceleration of the unwind of the discount on the bond which would, had the bond not been redeemed early, have been accounted for over the 14 months.
TAXATION
The calculation of some of the Group’s potential tax assets and liabilities involves a degree of estimation and judgement in respect of certain items, whose tax treatment cannot be finalised until resolution has been reached with the relevant tax authority, or, as appropriate, through a formal legal process. Issues can, and often do, take a number of years to resolve.
The Committee addresses these matters through a range of reporting from senior management and a process of challenging the appropriateness of management’s views including the degree to which these are supported by professional advice from external legal and other advisory firms. This is also an area of higher audit risk and, accordingly, the Committee received detailed
76 – INMARSAT PLC – ANNUAL REPORT AND ACCOUNTS 2016

We receive advice from other firms for specific projects and other long-term projects. We have continued to use PwC, KPMG and EY for various projects – some are new projects and some have been continuing for several years. Areas where we have used other firms relate to the new IFRS 15 and IFRS 16 standards and undertaking a review of our current accounting standards manual. We also use different firms to support us on VAT and ad hoc PAYE issues.
FAIR, BALANCED AND UNDERSTANDABLEWe have included more focus this year on linking the various sections of the Annual Report to make it easier for shareholders to navigate to find the information they need, while not diluting the level of transparency in our disclosures. When forming its opinion as to whether the Annual Report and Accounts is fair, balanced and understandable, the Committee reflected on the information it had received and its discussions throughout the year.
In particular, the Committee considered:
IS THE REPORT FAIR?
> Is the whole story presented and has any sensitive material been omitted that should have been included?
> Is the reporting on the business segments in the narrative reporting consistent with those used for the financial reporting in the financial statements?
> Are the key messages in the narrative reflected in the financial reporting?
> Are the KPIs disclosed at an appropriate level based on the financial reporting?
IS THE REPORT BALANCED?
> Is there a good level of consistency between the narrative reporting in the front and the financial reporting in the back of the report, and does the messaging reflected in each remain consistent when read independently of each other?
> Is the Annual Report properly a document for shareholders?
> Are the statutory and adjusted measures explained clearly with appropriate prominence?
> Are the key judgements referred to in the narrative reporting and the significant issues reported in this Audit Committee Report consistent with the disclosures of key estimation uncertainties and critical judgements set out in the financial statements?
> How do these compare with the risks that Deloitte plan to include in their audit report?
IS THE REPORT UNDERSTANDABLE?
> Is there a clear and understandable framework to the report?
> Are the important messages highlighted appropriately throughout the document?
> Is the layout clear with good linkage throughout in a manner that reflects the whole story?
CONCLUSIONFollowing its review, the Committee was of the opinion that the 2016 Annual Report and Accounts is representative of the year and presents a fair, balanced and understandable overview, providing the necessary information for shareholders to assess the Group’s position, performance, business model and strategy.
which assisted it to determine that the Auditor and its work were effective. At each of the Audit Committee meetings, the Auditor would report on any issues it perceived regarding quality control and where it thought judgements had been applied by management and if it agreed with these, or offered an alternative view if appropriate. The findings and reports from the Auditor help the Audit Committee make any assessments about the need to update processes or undertake further review work on any particular issues.
In March 2016 and in accordance with the Competition and Markets Authority requirements regarding the Statutory Audit Services for Large Companies Market Investigation (Mandatory Use of Competitive Tender Processes and Audit Committee Responsibilities) Order 2014, we undertook a competitive tender process of our External Auditor. After a thorough tender process, the Committee’s recommendation to the Board was to reappoint Deloitte LLP as the Group’s External Auditor for 2016. Deloitte LLP were reappointed at the 2016 Annual General Meeting and will also be put forward for reappointment at the 2017 Annual General Meeting. Under the EU directive, Deloitte are now capable of being reappointed for a further 10 years after the retender, however shareholder approval will be required each year.
Auditor objectivity and independence is safeguarded through a variety of mechanisms. To ensure the Auditor’s independence, the Committee annually reviews the Company’s relationship with Deloitte and receives summaries at each Audit Committee meeting from the Auditor as to their independence. The Committee concluded that it continues to have an objective and professional relationship with Deloitte and that there are sufficient controls and processes in place to ensure the required level of independence. The External Auditor is required to change the audit partner responsible for the Group audit every five years. During the year a new audit partner was identified and took over as the lead for the 2016 reporting period after Deloitte’s successful reappointment. During the year, Deloitte charged the Group $1.1m (2015: $1.2m) for audit and audit-related services.
NON-AUDIT SERVICESThe Company’s Auditor may also be used to provide specialist advice where, as a result of their position as Auditor, they either must, or are best placed to, perform the work in question. A formal policy is in place in relation to the provision of non-audit services by the Auditor to ensure that there is adequate protection of their independence and objectivity. Inmarsat’s policy is to adopt a strict 70% cap for allowable non-audit services. To ensure the policy is adequately controlled, we adopt several processes, which were enforced during 2016. Fees charged by Deloitte in respect of non-audit services require the prior approval of the Audit Committee, except where the fee is less than £50,000. Any commitments above this amount will require the Audit Committee Chairman’s approval. A summary is supplied to the Audit Committee at each meeting where amounts have been committed below £50,000. Separate engagement letters are signed by our CFO for each audit and non-audit engagement with Deloitte.
Using 2015, 2014 and 2013 for calculating the average audit fees paid to Deloitte, the cap on non-audit services as it relates to 2016 will be $1m, and this amount in 2016 was $0.2m compared to $0.6m in 2015. A breakdown of the fees paid to Deloitte during the year is set out in note 6 to the consolidated financial statements.
It is the Company’s practice that it will seek quotes from several firms, which may include Deloitte, before work on non-audit projects is awarded. Contracts are awarded to our suppliers based on individual merits. The Committee and the Company’s management are aware that the level of fees paid to Deloitte for non-audit services compared to audit services was significantly higher several years ago due to work undertaken regarding specialist tax advice on certain transactions and has worked to ensure that the non-audit fee levels have reduced over the last few years.
ANNUAL REPORT AND ACCOUNTS 2016 – INMARSAT PLC – 77STRATEGIC REPORT – GOVERNANCE – FINANCIAL STATEMENTS
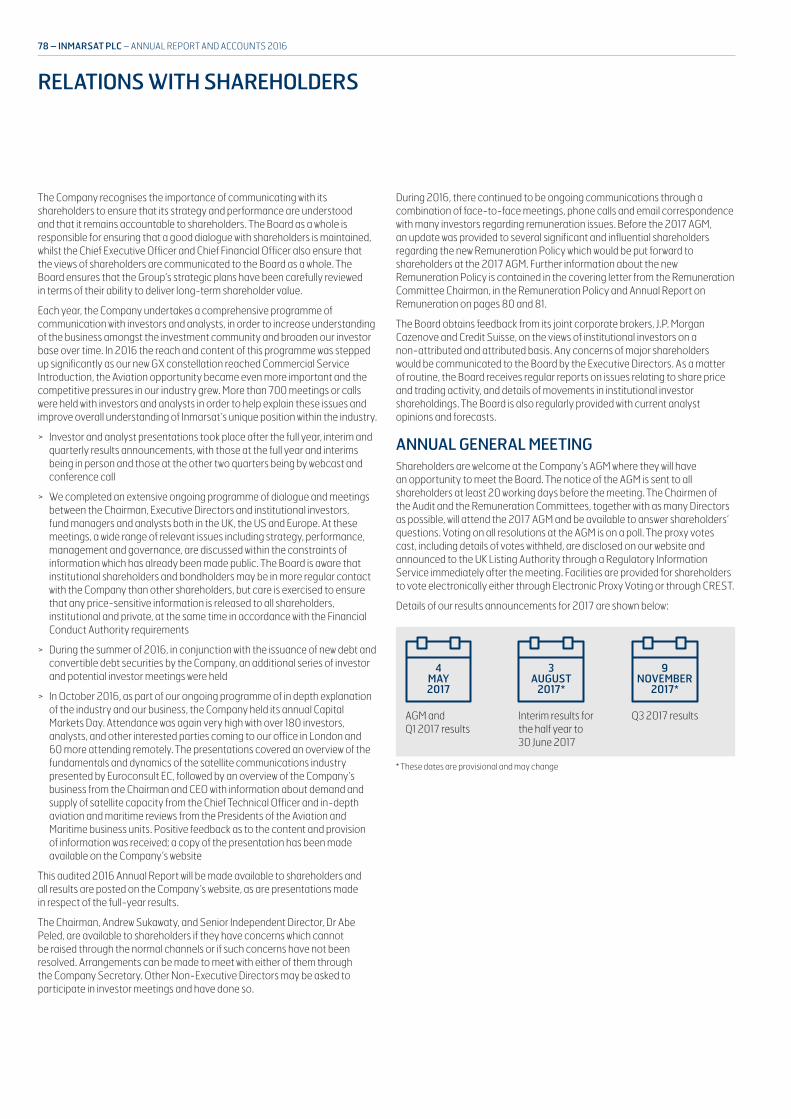
During 2016, there continued to be ongoing communications through a combination of face-to-face meetings, phone calls and email correspondence with many investors regarding remuneration issues. Before the 2017 AGM, an update was provided to several significant and influential shareholders regarding the new Remuneration Policy which would be put forward to shareholders at the 2017 AGM. Further information about the new Remuneration Policy is contained in the covering letter from the Remuneration Committee Chairman, in the Remuneration Policy and Annual Report on Remuneration on pages 80 and 81.
The Board obtains feedback from its joint corporate brokers, J.P. Morgan Cazenove and Credit Suisse, on the views of institutional investors on a non-attributed and attributed basis. Any concerns of major shareholders would be communicated to the Board by the Executive Directors. As a matter of routine, the Board receives regular reports on issues relating to share price and trading activity, and details of movements in institutional investor shareholdings. The Board is also regularly provided with current analyst opinions and forecasts.
ANNUAL GENERAL MEETING Shareholders are welcome at the Company’s AGM where they will have an opportunity to meet the Board. The notice of the AGM is sent to all shareholders at least 20 working days before the meeting. The Chairmen of the Audit and the Remuneration Committees, together with as many Directors as possible, will attend the 2017 AGM and be available to answer shareholders’ questions. Voting on all resolutions at the AGM is on a poll. The proxy votes cast, including details of votes withheld, are disclosed on our website and announced to the UK Listing Authority through a Regulatory Information Service immediately after the meeting. Facilities are provided for shareholders to vote electronically either through Electronic Proxy Voting or through CREST.
Details of our results announcements for 2017 are shown below:
AGM and Q1 2017 results
Interim results for the half year to 30 June 2017
Q3 2017 results
9NOVEMBER
2017*
3 AUGUST
2017*
4 MAY 2017
* These dates are provisional and may change
The Company recognises the importance of communicating with its shareholders to ensure that its strategy and performance are understood and that it remains accountable to shareholders. The Board as a whole is responsible for ensuring that a good dialogue with shareholders is maintained, whilst the Chief Executive Officer and Chief Financial Officer also ensure that the views of shareholders are communicated to the Board as a whole. The Board ensures that the Group’s strategic plans have been carefully reviewed in terms of their ability to deliver long-term shareholder value.
Each year, the Company undertakes a comprehensive programme of communication with investors and analysts, in order to increase understanding of the business amongst the investment community and broaden our investor base over time. In 2016 the reach and content of this programme was stepped up significantly as our new GX constellation reached Commercial Service Introduction, the Aviation opportunity became even more important and the competitive pressures in our industry grew. More than 700 meetings or calls were held with investors and analysts in order to help explain these issues and improve overall understanding of Inmarsat’s unique position within the industry.
> Investor and analyst presentations took place after the full year, interim and quarterly results announcements, with those at the full year and interims being in person and those at the other two quarters being by webcast and conference call
> We completed an extensive ongoing programme of dialogue and meetings between the Chairman, Executive Directors and institutional investors, fund managers and analysts both in the UK, the US and Europe. At these meetings, a wide range of relevant issues including strategy, performance, management and governance, are discussed within the constraints of information which has already been made public. The Board is aware that institutional shareholders and bondholders may be in more regular contact with the Company than other shareholders, but care is exercised to ensure that any price-sensitive information is released to all shareholders, institutional and private, at the same time in accordance with the Financial Conduct Authority requirements
> During the summer of 2016, in conjunction with the issuance of new debt and convertible debt securities by the Company, an additional series of investor and potential investor meetings were held
> In October 2016, as part of our ongoing programme of in depth explanation of the industry and our business, the Company held its annual Capital Markets Day. Attendance was again very high with over 180 investors, analysts, and other interested parties coming to our office in London and 60 more attending remotely. The presentations covered an overview of the fundamentals and dynamics of the satellite communications industry presented by Euroconsult EC, followed by an overview of the Company’s business from the Chairman and CEO with information about demand and supply of satellite capacity from the Chief Technical Officer and in-depth aviation and maritime reviews from the Presidents of the Aviation and Maritime business units. Positive feedback as to the content and provision of information was received; a copy of the presentation has been made available on the Company’s website
This audited 2016 Annual Report will be made available to shareholders and all results are posted on the Company’s website, as are presentations made in respect of the full-year results.
The Chairman, Andrew Sukawaty, and Senior Independent Director, Dr Abe Peled, are available to shareholders if they have concerns which cannot be raised through the normal channels or if such concerns have not been resolved. Arrangements can be made to meet with either of them through the Company Secretary. Other Non-Executive Directors may be asked to participate in investor meetings and have done so.
RELATIONS WITH SHAREHOLDERS
78 – INMARSAT PLC – ANNUAL REPORT AND ACCOUNTS 2016
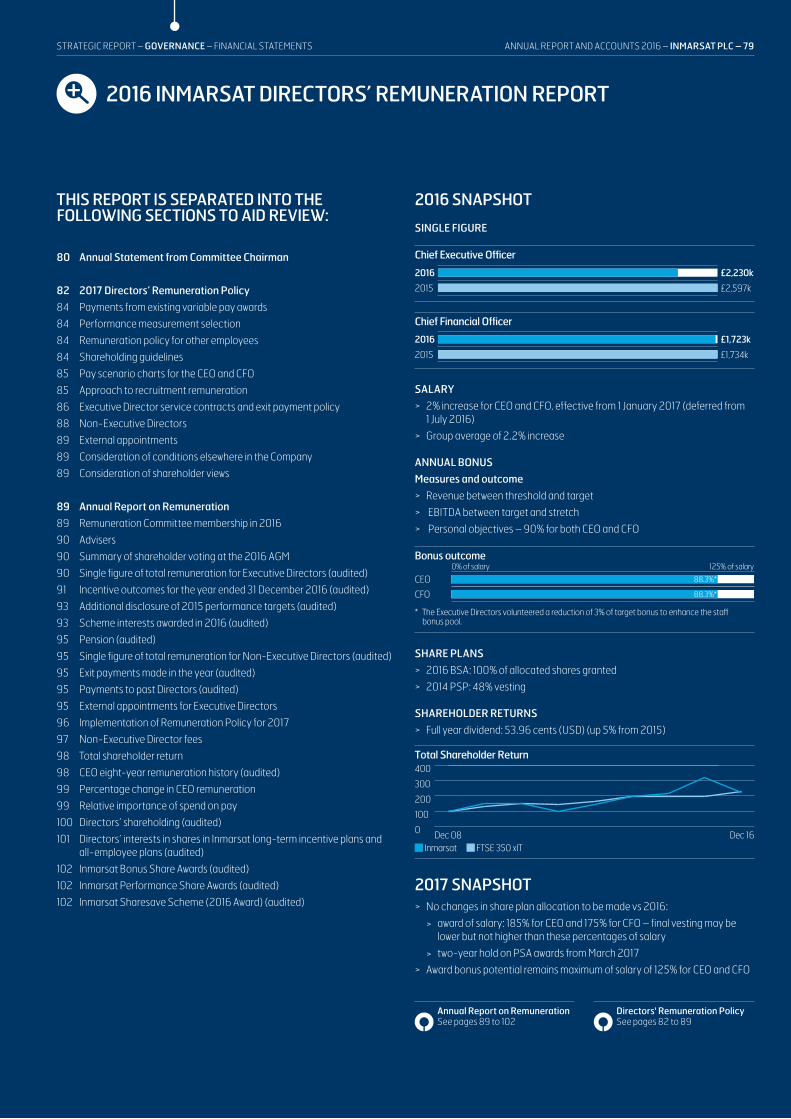
2016 SNAPSHOT
SINGLE FIGURE
Chief Executive Officer
2016
2015
Chief Financial Officer
£2,230k
£2,597k
2016
2015
£1,723k
£1,734k
SALARY > 2% increase for CEO and CFO, effective from 1 January 2017 (deferred from
1 July 2016) > Group average of 2.2% increase
ANNUAL BONUS
Measures and outcome > Revenue between threshold and target > EBITDA between target and stretch > Personal objectives – 90% for both CEO and CFO
CEO0% of salary 125% of salary
88.3%*
88.3%*CFO
* The Executive Directors volunteered a reduction of 3% of target bonus to enhance the staff bonus pool.
Bonus outcome
SHARE PLANS > 2016 BSA: 100% of allocated shares granted > 2014 PSP: 48% vesting
SHAREHOLDER RETURNS > Full year dividend: 53.96 cents (USD) (up 5% from 2015)
Dec 08 Dec 16Inmarsat FTSE 350 xIT
Total Shareholder Return400
300
200
100
0
2017 SNAPSHOT > No changes in share plan allocation to be made vs 2016:
> award of salary: 185% for CEO and 175% for CFO – final vesting may be lower but not higher than these percentages of salary
> two-year hold on PSA awards from March 2017 > Award bonus potential remains maximum of salary of 125% for CEO and CFO
THIS REPORT IS SEPARATED INTO THE FOLLOWING SECTIONS TO AID REVIEW:
80 Annual Statement from Committee Chairman
82 2017 Directors’ Remuneration Policy
84 Payments from existing variable pay awards
84 Performance measurement selection
84 Remuneration policy for other employees
84 Shareholding guidelines
85 Pay scenario charts for the CEO and CFO
85 Approach to recruitment remuneration
86 Executive Director service contracts and exit payment policy
88 Non-Executive Directors
89 External appointments
89 Consideration of conditions elsewhere in the Company
89 Consideration of shareholder views
89 Annual Report on Remuneration
89 Remuneration Committee membership in 2016
90 Advisers
90 Summary of shareholder voting at the 2016 AGM
90 Single figure of total remuneration for Executive Directors (audited)
91 Incentive outcomes for the year ended 31 December 2016 (audited)
93 Additional disclosure of 2015 performance targets (audited)
93 Scheme interests awarded in 2016 (audited)
95 Pension (audited)
95 Single figure of total remuneration for Non-Executive Directors (audited)
95 Exit payments made in the year (audited)
95 Payments to past Directors (audited)
95 External appointments for Executive Directors
96 Implementation of Remuneration Policy for 2017
97 Non-Executive Director fees
98 Total shareholder return
98 CEO eight-year remuneration history (audited)
99 Percentage change in CEO remuneration
99 Relative importance of spend on pay
100 Directors’ shareholding (audited)
101 Directors’ interests in shares in Inmarsat long-term incentive plans and all-employee plans (audited)
102 Inmarsat Bonus Share Awards (audited)
102 Inmarsat Performance Share Awards (audited)
102 Inmarsat Sharesave Scheme (2016 Award) (audited)
2016 INMARSAT DIRECTORS’ REMUNERATION REPORT
Annual Report on Remuneration See pages 89 to 102
Directors' Remuneration Policy See pages 82 to 89
ANNUAL REPORT AND ACCOUNTS 2016 – INMARSAT PLC – 79STRATEGIC REPORT – GOVERNANCE – FINANCIAL STATEMENTS

2016 INMARSAT DIRECTORS’ REMUNERATION REPORT CONTINUED
DEAR SHAREHOLDEROn behalf of the Board, I am pleased to present the Directors’ Remuneration Report for the year ended 31 December 2016.
FORWARD-LOOKING REMUNERATION POLICYThis year we will be asking shareholders to approve a new Remuneration Policy for Executive Directors at the 2017 Annual General Meeting.
Although the existing Remuneration Policy was approved by shareholders at the 2014 AGM, our executive remuneration programme has in fact remained broadly consistent since we became a public company in 2005, in terms of both structure (comprising three incentive plans: the annual cash bonus, Bonus Share Awards and Performance Share Awards) and quantum. In preparation for the 2017 AGM, the Remuneration Committee spent considerable time during 2016 reviewing the Policy and considering alternative remuneration structures. We believe, on the whole, the existing Policy has provided us with an appropriate set of incentive arrangements to motivate and reward senior executives. The phasing of how shares are delivered through our share plans and significant shareholding requirement have provided strong medium-term shareholder alignment, and the specific performance measures selected have supported the delivery of our strategy. Our new Policy will continue with our current remuneration structure of competitive levels of annual pay and low pension contributions.
We are aware of a number of recent developments in the external environment, and in particular the encouragement from some shareholders to consider alternative incentive structures and the broader desire for simplification. As shareholders are further developing their thinking in this area, the Committee’s intention is to continue our review of remuneration until a more definitive direction emerges from the ongoing debate.
Therefore, we will be putting forward for approval by shareholders a Policy, as set out in this Report, which remains largely unchanged from the 2014 Policy, with the exception of an extension to our long-term share plan, the PSA, time horizon for the Executive Directors. In this regard, the Committee has considered best practice and is introducing a two-year holding period for vested PSA shares in response to the general preference for longer holding periods. The performance and vesting period remain three years, in line with prevailing market practice. The extended holding period for the PSA shares, coupled with our current shareholding guideline of five times base salary, result in overall remuneration packages that we believe are aligned with the long-term delivery of shareholder value.
Subject to shareholder approval, the proposed Remuneration Policy will take effect from the date of the AGM, being 4 May 2017.
ANNUAL STATEMENTFROM THE REMUNERATION COMMITTEE CHAIRMAN, SIMON BAX
Simon Bax Chairman, Remuneration Committee
80 – INMARSAT PLC – ANNUAL REPORT AND ACCOUNTS 2016

IMPLEMENTATION OF THE REMUNERATION POLICY IN 2017For 2017, the maximum annual cash bonus opportunity will remain 125% of salary. The financial element of the annual bonus (representing 70% of the total bonus) will continue to be measured by reference to EBITDA and revenue. The element on individual performance and contribution will not be weighted more than 30% of the total bonus, as now.
For 2017, BSA opportunities will remain 185% and 175% of salary for the CEO and the CFO, respectively. The plan will operate on a similar basis to 2016: performance will relate to achievement of EBITDA (67% of total award) and revenue (33%) targets. No changes are proposed to award levels or performance measurement for the PSA for 2017. The CEO and the CFO will receive awards of 185% and 175% of salary, respectively. Vesting will continue to be based on relative TSR (30% of total award), EBITDA (30%) and the delivery of specific strategic objectives considered key drivers to our future success (40%). As mentioned earlier, we are introducing a two-year holding period to vested PSA shares for Executive Directors to align with best practice. No shares may be sold during the holding period except to cover taxes. This will become effective with the 2017 PSA award.
Further detail on the implementation of Policy for 2017 is included on page 96.
Resolutions to approve the proposed Remuneration Policy (subject to a binding vote) and the Annual Report on Remuneration (subject to an advisory vote) will be put to our shareholders at the AGM in May.
As always, I am available to meet and discuss our Remuneration Policy with shareholders.
SIMON BAXChairman, Remuneration Committee
8 March 2017
REMUNERATION DECISIONS IN 2016During 2016 we have continued the delivery of our strategic objectives which saw the start of a step up of Global Xpress revenues following the introduction of global service of our new Ka-band satellite constellation at the end of 2015. We have also seen positive progress for our aviation business with the European Aviation Network initiative and the planned aviation Ka-band service, with the announcement of multiple airline commitments. Our maritime and particularly US Government businesses have made good progress with customer take-up for the Global Xpress services. We have also delivered good financial results, with an increase in dividend levels.
In July 2016, the Company made the decision that due to business circumstances at the time, the annual salary review would be deferred for the Executive Directors and Executive Management Board members to January 2017. In December 2016, the Committee approved a salary increase of 2% for both Executive Directors, effective from 1 January 2017. This compares with an average salary increase of 2.2% across the Group.
For 2016, the CEO and the CFO are both entitled to bonuses of 88.3% of salary. The Executive Directors volunteered a reduction of 3% of target bonus to their bonuses in order to enhance the staff bonus pool to support retention and engagement. The bonuses reflect both the good financial performance of the Company, particularly in the second half of the financial year, and the exceptional individual contributions made by each of the Executive Directors over the last year. A summary of performance against targets is included on page 91.
In March 2016, the CEO and the CFO were granted Performance Share Awards (‘PSA’) of 185% and 175% of salary, respectively. Vesting will be based on performance over the three financial years to 31 December 2018. Consistent with our approach for 2015 awards, 2016 awards will vest to the extent that challenging EBITDA, relative TSR and specific strategic targets are achieved over the period.
Based on performance to 31 December 2016, 48% of the share award made under the 2014 PSP will vest in March 2017. In respect of the TSR element, performance is measured vs. the FTSE 50-150 excluding investment trusts; 30% vesting for this element (15% of total award) reflects the difficult market challenges faced by satellite companies generally shown by the rerating of the satellite sector by some analysts. The EBITDA target was partially achieved, vesting at 66% for the element (33% of total award); this reflects the contribution of events mentioned in last year’s report because they fall over a period greater than one year. Revenues were impacted because of US Government sequestration and its impact on our government business for the first year of the performance period, and delays outside our control impacting the timing of our Global Xpress satellites from their original launch dates which meant revenues from our new high-speed data services were lower than expected in 2015 and 2016.
ANNUAL REPORT AND ACCOUNTS 2016 – INMARSAT PLC – 81STRATEGIC REPORT – GOVERNANCE – FINANCIAL STATEMENTS
2016 INMARSAT DIRECTORS’ REMUNERATION REPORT CONTINUED
2017 DIRECTORS’ REMUNERATION POLICYAs required by legislation, the Directors’ Remuneration Policy will be put to a binding shareholder vote and, subject to shareholder approval, will become effective from the date of the 2017 Annual General Meeting. As mentioned in the Chairman’s Statement, the proposed Policy is broadly consistent with the approved 2014 Policy, save the introduction of a mandatory two-year holding period on vested PSA shares effective from the 2017 award to reflect emerging best practice.
The Group’s Remuneration Policy is designed to deliver rewards that enable it to attract, retain and motivate talent of the highest appropriate quality, linking rewards to the achievement of financial and strategic goals of the Group. When determining Remuneration Policy, we take into account all factors which we deem necessary, including the Group’s overall business strategy, business performance in the current year and expectations for future years as incorporated into our Long Range Business Plan (‘LRBP’), pay arrangements in the wider Inmarsat workforce, and the global economic situation. Where appropriate, we will consult with shareholders in advance of major changes in the Remuneration Policy or where we consider there are material changes to individual remuneration arrangements. The Committee is committed to the principle that the Company should pay at the appropriate level to recruit and retain executives, and incentivise them to achieve the Company’s objectives which will create value for shareholders.
How does this link to strategy What happens in practice What amounts can be paid How do we assess performance
BASIC SALARY
Paying market-competitive base salaries, commensurate with the individual’s role, responsibilities and experience, allows us to recruit and retain Executive Directors of the calibre required to implement our strategy.
Salaries are reviewed annually with any increase generally made in July or following a material change in responsibilities. The Committee will determine any increases to be made.Any increase is determined by a formal appraisal by the Committee, taking into account market pay levels, a review of salaries against companies of similar size, complexity and type, Group performance, as well as the remuneration arrangements operated throughout the Group, with reference to UK-based employees in particular for pay comparison levels.
Salary increases will be applied in line with the outcome of an annual salary review.The maximum annual salary increase will normally be in line with the average increase applied to the UK workforce. However, larger increases may be awarded in certain circumstances including, but not limited to, an increase in scope or responsibility of the role; to apply salary progression for a newly appointed Director; where the Director’s salary has fallen behind market positioning. Where increases are awarded in excess of that for the UK employee population, the Committee will provide the rationale in the relevant year’s Annual Report on Remuneration.
Based on Company performance and individual contribution.
BENEFITS IN KIND
We provide cost-effective benefits which support the wellbeing of employees.
Provision of death, long-term sickness and medical and dental insurance cover (which can include spouse and dependents cover). Life assurance of 4x salary, paid holiday and medical check-ups are also provided. If required, the Company would provide access to independent financial and legal advice on a case-by-case basis.Provision of other reasonable benefits in the event of relocation, eg temporary accommodation and other related costs will be considered on a case-by-case basis.These benefits are non-pensionable.
The benefits provided may vary by role and levels of cover provided will reflect market practice and the individual circumstances of the Executive Directors.It is not anticipated that the current cost of benefits (as set out in the Annual Report on Remuneration) would increase materially over the period for which this Policy will apply.The Committee retains the discretion to approve a higher cost in exceptional circumstances (eg relocation) or in circumstances where factors outside the Company’s control have changed materially.
Not applicable.
PENSION
We provide defined contribution pension arrangements, or cash in lieu of pension.
The Executive Directors are eligible to participate in the Company’s defined contribution pension plan arrangements or other similar pension plans as appropriate to the Executive Director’s nationality or location. The Company also operates an auto-enrolment pension scheme which an Executive Director could participate in instead of the main pension plan.Contributions are based on a percentage of salary which is currently limited to a pensions cap.
Maximum employer contributions are currently 12.5% of the capped salary under the terms of the UK pension plan. The Committee may review pension contribution levels in the future. Any increase in contributions would not result in a pension contribution in excess of 20% of the uncapped basic salary.
Not applicable.
82 – INMARSAT PLC – ANNUAL REPORT AND ACCOUNTS 2016
How does this link to strategy What happens in practice What amounts can be paid How do we assess performance
ANNUAL CASH BONUS
We provide an annual bonus to incentivise the achievement of annual financial and operational goals in line with Group strategy. Performance metrics are selected to support the annual business strategy which we believe also lead to enhancement of shareholder value.
Bonus payment levels are determined by the Committee annually by reference to performance against targets set at the start of the financial year. Personal objectives are set annually by the Committee.In exceptional circumstances, the Committee has the ability to exercise discretion to override the formulaic bonus outcome within the limits of the scheme where it believes the outcome is not truly reflective of performance, and to reflect the actual delivery of value to shareholders. Any discretionary adjustments will be detailed in the following year’s Annual Report on Remuneration.The Committee may exercise its discretion to claw back bonuses in certain exceptional circumstances which may include (but are not limited to) gross misconduct, fraud or a significant downward revision of the financial results of the Group.
Maximum opportunity: > 125% of salary.
Threshold and Target opportunity: > 0% and 75% of salary respectively.
Bonus is based on achievement of annual financial and personal objectives.The personal element will not be weighted more than 30% of the total in any year.Details of the measures and weightings applicable for the financial year under review are provided in the Annual Report on Remuneration. The Committee may change the measures used if other measures are deemed more suitable to allow delivery of the Company’s strategy.
BONUS SHARE AWARD (‘BSA’)
We provide the opportunity to participate in the BSA as it links the delivery of short-term financial and operational performance to sustained shareholder value creation. Participation in the BSA reinforces continued delivery of the LRBP as vesting of shares occurs over three years after performance has been tested.
We make annual allocations of conditional shares which are confirmed the following year, subject to achievement of agreed annual performance targets. The resulting shares vest over the subsequent three years, subject to continued employment.Additional shares in lieu of accrued dividends over the vesting period are awarded only on the number of shares that vest.Unvested awards and vested awards that have not yet been transferred to the Executive Director are subject to adjustment for malus and clawback, ie forfeiture or reduction in exceptional circumstances. Such circumstances may include (but are not limited to) gross misconduct, fraud or a significant downward revision of the previously reported financial results of the Group.
Maximum opportunity for all Executive Directors is up to 200% of salary (300% in exceptional circumstances, as permitted in the Executive Share Plan Rules).Threshold performance results in 60% conversion of the monetary award into shares.
The Committee sets annual performance measures (currently based on the same financial objectives as for the annual cash bonus plan) and may change these for future awards as it considers appropriate.
PERFORMANCE SHARE AWARD (‘PSA’)
We believe the PSA aligns executives’ interests with long-term shareholder value creation through rewarding the delivery of a mix of financial and strategic measures.The performance measures in the PSA reflect the value drivers in the LRBP.
We make annual awards of conditional shares, which vest after a minimum of three years subject to performance over a three-year period.A mandatory two-year holding period applies to vested awards commencing with the award to be made in 2017.Additional shares in lieu of accrued dividends over the vesting period are awarded only on the number of shares that vest.Unvested awards are subject to adjustment for malus and clawback, ie forfeiture or reduction in exceptional circumstances. Such circumstances may include (but are not limited to) gross misconduct, fraud or a significant downward revision of the previously reported financial results of the Group.
Maximum opportunity for all Executive Directors is up to 200% of salary (300% in exceptional circumstances, as permitted in the Executive Share Plan Rules).Threshold performance will result in the vesting of 30%/0%/0% of the maximum award under the TSR/EBITDA/strategic performance elements (which are the current performance measures being used).
The performance measures and respective weightings may vary year-on-year to reflect strategic priorities, and will include a financial measure. Strategic measures, if included, will not be weighted more than 40% of the total award in any year.Details of the measures and weightings applicable for the financial year under review are provided in the Annual Report on Remuneration. Changes to weightings and performance targets will be retrospectively explained to shareholders.
ANNUAL REPORT AND ACCOUNTS 2016 – INMARSAT PLC – 83STRATEGIC REPORT – GOVERNANCE – FINANCIAL STATEMENTS
2016 INMARSAT DIRECTORS’ REMUNERATION REPORT CONTINUED
How does this link to strategy What happens in practice What amounts can be paid How do we assess performance
EMPLOYEE SHARE PLANS
To encourage share ownership across all employees as allowed by HMRC and relevant local laws.
We operate employee share savings plans for our global workforce where, depending on location, savings periods of between two and three years operate. We will look at opportunities to offer other employee share plans in the future.
Participation levels set by HMRC or relevant local laws from time to time.
Not applicable.
PAYMENTS FROM EXISTING VARIABLE PAY AWARDSExecutive Directors are eligible to receive payment from any award made prior to the approval of the 2017 Remuneration Policy, eg awards made under the 2014 Policy. Any commitment made which is consistent with the Remuneration Policy in force at the time the commitment was made will be honoured, even when it is not consistent with the Policy prevailing at the time such commitment is fulfilled. Details of any such outstanding share awards to Executive Directors are provided in the Annual Report on Remuneration.
PERFORMANCE MEASUREMENT SELECTIONOur incentive plans (excluding restricted share awards and all-employee share plans) all include financial performance requirements. Performance targets are set to be stretching, taking into account the Company’s strategic priorities and the economic environment in which the Company operates. Targets are set taking into account a range of reference points including the Group’s LRBP, the market in which the Company operates, the expected performance of competitors in these same markets, broker forecasts and latest internal forecasts. Achievement of these targets delivers to shareholders the value inherent in the LRBP.
The annual cash bonus plan and BSA reflect the financial targets which the Board believes are key to driving the business. Revenue and EBITDA reflect the underlying financial success of the business and support the annual business strategy as well as value creation for Inmarsat’s shareholders.
The PSA currently has three performance requirements, which are EBITDA growth, the Company’s total shareholder return performance against the FTSE 50-150 excluding investment trusts, and strategic objectives. All three performance metrics are linked to our long-term business strategy, and support shareholder value creation.
The Committee retains the ability to adjust and/or set different performance measures following a corporate event (such as a change in strategy, a material acquisition and/or divestment of a Group business) or a significant change in prevailing market conditions either specific to the Company’s sector or macro-economic events which causes the Committee to determine that the measures are no longer appropriate and that amendment is required so that they achieve their original purpose.
REMUNERATION POLICY FOR OTHER EMPLOYEESRemuneration arrangements throughout the Inmarsat Group are determined on the same principle as for remunerating Executive Directors, in that reward should support our business strategy. It should be sufficient to attract and retain high-performing individuals.
As a global business we accept that there may be different local arrangements that are appropriate to apply but, overall, this principle applies across the different geographies in which we operate. Employees receive variable pay which gives them incentives appropriate to their role in the organisation and is reflective of how we deal with Executive Directors too.
In general, the remuneration policy and principles which apply to other senior executives is consistent with that set out in this report for Executive Directors. All employees participate in bonus schemes. Group senior executives are eligible to participate in the BSA and some also participate in the PSA. The BSA may operate with division-specific targets for some participants and the PSA may have slightly different performance measures in place than those used for the Executive Directors, as appropriate.
All employees are eligible to participate in employee share plans which are generally the UK Sharesave Scheme or an equivalent international plan. Participation is on generally the same terms subject to local regulations.
SHAREHOLDING GUIDELINESThe guideline for Executive Directors is that they hold Company shares equivalent to five times base salary. For the purpose of this guideline, shares owned includes beneficially owned shares and shares that are unvested and subject to continued employment only, under the BSA and PSA plans.
For new Executive Directors, we would expect the individual to build up a shareholding to the five times guideline over a period of time, generally within five to seven years.
84 – INMARSAT PLC – ANNUAL REPORT AND ACCOUNTS 2016

PAY SCENARIO CHARTS FOR THE CEO AND CFOThe following charts provide an estimate of the potential future reward opportunities for the two current Executive Directors (CEO and CFO), and the potential split between the different elements of pay under three different performance scenarios: ‘Minimum’, ‘Target’, and ‘Maximum’. Potential reward opportunities are based on Inmarsat’s current incentive opportunities, applied to salaries as at 1 January 2017. Note that the projected values exclude the impact of any share price movement.
Each element of remuneration reflects the following assumptions:
> Minimum: includes fixed remuneration only, ie base salary, taxable benefits and pension.
> Target: includes fixed remuneration plus the amounts for on-target performance under the annual cash bonus plan (60% of maximum) and BSA (60% of maximum opportunities of 185% and 175% of salary for the CEO and CFO respectively), and threshold performance under the PSA (30%/0%/0% of maximum under the TSR/EBITDA/strategic performance elements, based on maximum opportunities of 185% and 175% of salary for the CEO and CFO respectively).
> Maximum: includes fixed remuneration and maximum payment under all incentive plans.
PAY SCENARIOS £000
Chief Executive Officer
Maximum
On-target
Minimum
Chief Financial Officer
Maximum
On-target
Minimum
Fixed pay
17%
34%
21% 62%
24% 42%
100%
18%
35%
22%
25%
60%
40%
100%
£3,458
£1,771
£602
£2,741
£1,421
£496
Annual bonus Share Plans (BSA and PSA)
APPROACH TO RECRUITMENT REMUNERATION
EXTERNAL APPOINTMENTS
In the event of hiring a new Executive Director, the Committee will typically align the remuneration package with the approved Remuneration Policy.
In determining appropriate remuneration arrangements on hiring a new Executive Director, we will take into consideration all relevant factors (including but not limited to external market data, current remuneration, the type of remuneration arrangements for other Inmarsat executives and the jurisdiction the candidate was recruited from and may be based in) to ensure that arrangements are in the best interests of both our Company and its shareholders. The Remuneration Policy in place will apply to the new appointment unless there are variables to the appointment which are noted below and are agreed by the Committee as appropriate to offer.
The Committee may make awards on hiring an external candidate to ‘buy-out’ remuneration arrangements forfeited on leaving a previous employer. In doing so, we will take account of relevant factors including any performance conditions attached to these awards, the form in which they were granted (for example, cash or shares), the time over which they would have vested and the share price at the time of buy-out. Generally buy-out awards will be made on a comparable basis. The Committee has the discretion to determine whether such buy-outs shall be granted as Bonus Share Awards, Performance Share Awards or Restricted Share Awards under the ESP. The Committee may also avail itself of the provision in the Listing Rules (Chapter 9.4.2) regarding long-term incentive awards in relation to the buy-out of awards forfeited on leaving a previous employer.
ANNUAL REPORT AND ACCOUNTS 2016 – INMARSAT PLC – 85STRATEGIC REPORT – GOVERNANCE – FINANCIAL STATEMENTS
2016 INMARSAT DIRECTORS’ REMUNERATION REPORT CONTINUED
Component Approach Maximum annual value
Basic salary To be determined by reference to relevant market pay levels, experience and skills of the individual, internal relativities and the current salary of the incumbent in the role.
Pension and benefits To be eligible to receive benefits in line with the current policy, and as well as any expatriation allowances and any necessary expenses relating to an Executive Director’s relocation on appointment.
Sharesave Scheme To be entitled to participate on identical terms to other employees.
Annual cash bonus The scheme as described in the policy table will apply to new appointees. The Committee will determine on a case-by-case basis whether the executive on joining the Company will receive the full annual payment or a pro-rata amount.
125% of salary
Bonus Share Awards To participate in annual awards on the same terms as other Executive Directors, as described in the policy table.
The Committee will determine on a case-by-case basis whether the executive on joining the Company will receive the full annual allocation or a pro-rata amount.
Up to 200% of salary (300% in exceptional circumstances)
Performance Share Awards To participate in annual awards on the same terms as other Executive Directors, as described in the policy table.
The Committee will determine on a case-by-case basis whether the executive on joining the Company will receive the full annual award or a pro-rata amount.
Up to 200% of salary (300% in exceptional circumstances)
Restricted Share Awards To make awards of shares which vest in accordance with a schedule agreed by the Committee, subject to continued employment only. Awards will typically be made to facilitate the ‘buy-out’ of awards forfeited on leaving a previous employer, and the vesting schedule will typically match that of the awards forfeited. Additional shares in lieu of accrued dividends over the vesting period are awarded only on the number of shares that vest.
Up to 200% of salary (300% in exceptional circumstances)
INTERNAL APPOINTMENTS
Any individual who is promoted to become an Executive Director will be treated on the same basis as if they were an external hire in respect of the elements of remuneration and benefits. Where the new appointee has an initial salary set below market, any shortfall will be managed with phased increases over a period of several years, subject to the executive’s development in the role. Such individuals are also eligible to receive payment from any award made prior to their appointment to the Board.
EXECUTIVE DIRECTOR SERVICE CONTRACTS AND EXIT PAYMENT POLICY
Executive Director Date of service contract Term of office Notice period
Rupert Pearce 18 January 2012 Indefinite until termination by either party Twelve months’ written notice by Company or Director
Tony Bates 21 February 2014 Indefinite until termination by either party Twelve months’ written notice by Company and six months’ written notice by the Director
The Company in its absolute discretion may agree a shorter notice period with the departing Director. All Directors have a clause to allow a payment in lieu of notice to be made. For the Executive Directors, the Company may make such payments monthly (up to 12 months) and these payments shall be reduced if the executive finds alternative employment.
Severance payments in relation to the service contract are limited to no more than one year’s base salary plus other benefits, which may include annual bonus (subject to performance conditions being fulfilled and pro-rated for time and payable at the normal annual bonus payment date), unless the Committee believes this is unreasonable given the circumstances for departure or unless dictated by applicable law.
The Committee reserves the right to make additional exit payments where such payments are made in good faith:
> In discharge of an existing legal obligation (or by way of damages for breach of such an obligation) or
> By way of settlement or compromise of any claim arising in connection with the termination of a Director’s office or employment
The Committee retains discretion to determine appropriate bonus amounts and vesting of share-based awards, as well as the timing of vesting, taking into consideration the circumstances in which an Executive Director leaves. The rationale for any discretion exercised will be provided in the following year’s Annual Report on Remuneration.
86 – INMARSAT PLC – ANNUAL REPORT AND ACCOUNTS 2016
Reason for leaving Timing of vesting Treatment of awards
Annual bonus
Good leaver (see below for definition) Normal payment date. Performance against targets will be assessed at the end of the year in the normal way and any resulting bonus will be pro-rated for time served during the year.
All other reasons Awards lapse. Not applicable.
BSA
Good leaver (see below for definition) Normal vesting date, although the Committee has discretion to accelerate.
Any allocated but not yet granted shares will be granted at the Committee’s discretion. The treatment of unvested shares is at the Committee’s discretion.
All other reasons Awards lapse. Not applicable.
PSA
During the vesting period:
Good leaver (see below for definition) Normal vesting date, although the Committee has discretion to accelerate.
Any outstanding awards will be pro-rated for time and subject to performance conditions being met.
All other reasons Awards lapse. Not applicable.
During the post-vesting holding period:
All leavers Not applicable. Not applicable – awards, once vested (including those in any holding period), are treated as owned by the individual and are subject to clawback provisions.
RSA
Good leaver (see below for definition) Normal vesting date, although the Committee has discretion to accelerate.
Any outstanding awards will be pro-rated for time.
All other reasons Awards lapse. Not applicable.
Employee Share Plans
Good leaver (see below for definition) Share options can be exercised for a certain period of time after departure.
The individual will be entitled to exercise his share options in accordance with HMRC approved rules or local equivalent rules.
All other reasons Awards lapse. Not applicable.
A ‘good leaver’ is the departure of an Executive Director for reasons of ill health, redundancy, retirement, death or any other reason which the Committee in its absolute discretion permits. Termination for cause is regarded as a bad leaver and no awards shall vest.
Upon a change of control of the Company, share awards may be transferred to participants in accordance with the Executive Share Plan Rules, based on the extent to which the Committee determines that the performance conditions have been met. For the annual bonus, the Committee will assess performance against targets at the point of change of control and any resulting bonus will be pro-rated for time and paid immediately. The final treatment for the annual bonus remains subject to the Committee’s discretion.
In the event that the Company terminates an Executive Director’s service contract other than in accordance with the terms of his contract, the Committee will act in the best interests of the Company and ensure there is no reward for failure. When determining what compensation, if any, is to be paid to the departing Executive Director, the Committee will give full consideration to the circumstances of the termination, the Executive Director’s performance, the terms of the service contract relating to notice and payments in lieu of notice, and the obligation of the Executive Director (where it is in the service agreement) to mitigate any loss which he may suffer as a result.
Although the Company would seek to minimise termination costs, the Committee may in appropriate circumstances provide other elements in a leaving Executive Director’s termination package, including (without limitation) compensation for the waiver of statutory rights in exchange for him executing a settlement agreement, payment of the departing Executive Director’s legal fees in connection with his termination arrangements, and payment of outplacement fees. In addition, the Committee may determine that the Director should continue to be engaged by the Company on a consultancy arrangement or other terms following cessation of his directorship.
ANNUAL REPORT AND ACCOUNTS 2016 – INMARSAT PLC – 87STRATEGIC REPORT – GOVERNANCE – FINANCIAL STATEMENTS

2016 INMARSAT DIRECTORS’ REMUNERATION REPORT CONTINUED
NON-EXECUTIVE DIRECTORSFor the recruitment of a new Non-Executive Director (‘NED’), the individual will receive a letter of appointment which will summarise the time requirement expected of them and set out details of their fees (base fee and Committee membership fee). Fees will be the same level as for other NEDs, except where the Nominations Committee determines that a different level is appropriate based on individual contribution.
Element Purpose and link to strategy Operation Maximum
NED fees To attract and retain high-calibre NEDs by offering a market competitive fee level
The NEDs are paid a basic fee.
The Committee Chairmen and other members of the Board Committees (Audit, Remuneration, Nominations and Telecoms Regulatory Committees) and the Senior Independent Director are paid supplements to reflect their additional responsibilities.
The Chairman of the Board will be paid a single fee for all his responsibilities, and receive healthcare cover.
NED fee levels are reviewed periodically by the Chairman and Executive Directors with reference to market levels in comparably sized FTSE companies and a recommendation is then made to the Board. The Chairman’s fee is reviewed by the Committee taking into account fee levels at the same set of companies, and is then approved by the Board. If any changes are to be made, they are usually effective in July.
To avoid setting expectations, there is no maximum fee level.
The maximum annual aggregate fee for all Group NEDs is £1,000,000, as set out in the Company’s Articles of Association.
Appointments are initially for three years and unless agreed by the Board, NEDs may not remain in office for a period longer than six years, or two terms in office, whichever is the shorter. The UK Corporate Governance Code has special provisions regarding determination of the independence of Directors when they have served for more than nine years.
Non-Executive Directors do not have contracts of service and their appointment will normally terminate on:
> A Director choosing to resign voluntarily
> A Director being prohibited from serving by law, bankruptcy or illness
> If the Nominations Committee does not approve the extension of the appointment
> A Director is found guilty of misconduct or
> A Director is not re-elected by the shareholders following retirement at an AGM
Dates of NED appointment letters are as follows:
Name Date of appointment letter Date of appointment
Simon Bax 28 May 2013 18 June 2013
Sir Bryan Carsberg 18 April 2005 22 June 2005
Stephen Davidson1 16 June 2005 22 June 2005
Kathleen Flaherty2 9 May 2006 9 May 2006
General C. Robert Kehler (Rtd) 13 March 2014 6 May 2014
Janice Obuchowski 6 May 2009 5 May 2009
Dr Abe Peled 10 May 2013 18 June 2013
Robert Ruijter 16 December 2014 1 February 2015
Andrew Sukawaty 16 September 2014 1 January 2015
Dr Hamadoun Touré 16 December 2014 1 March 2015
Phillipa McCrostie 18 May 2016 1 September 2016
1 Mr Davidson retired from the Board with effect from 19 January 20172 Mrs Flaherty retired from the Board with effect from 2 March 2017
Non-Executive Directors do not receive an annual bonus and do not participate in any of the Company’s incentive plans. They receive no benefits, except that healthcare cover is provided for the Chairman, as a continuation of the cover provided to him previously. The Company reimburses the reasonable expenses the Non-Executive Directors incur in carrying out their duties as Directors.
88 – INMARSAT PLC – ANNUAL REPORT AND ACCOUNTS 2016

EXTERNAL APPOINTMENTSExecutive Directors serving as Non-Executive Directors on the Board of other companies are permitted to retain all remuneration and fees earned from outside directorships subject to a maximum of two external Board appointments. Directors accepting such positions shall take into account any guidelines for external directorships as contained in the Corporate Governance Code, subject at all times to pre-authorisation of the appointment by the Chairman. NEDs taking additional board positions are asked to speak to the Chairman in advance to ensure no conflict of interest and for the Chairman to speak to the SID for anything affecting him..
CONSIDERATION OF CONDITIONS ELSEWHERE IN THE COMPANYAlthough we do not consult directly with employees on executive Remuneration Policy, the Committee takes into consideration the remuneration arrangements for the wider employee population in making its decisions on remuneration for senior executives. This relates to our philosophy around levels of base salary, operating bonus plans for all employees, pension entitlement and provision of benefits also being available across the Group.
The Group consults with its employees on general employment policies in a range of ways, including formal consultation forums in some countries where it operates. Our staff are encouraged to provide feedback directly to their line managers or to the HR team or to a confidential email address which will receive queries on all issues including anti-bribery.
CONSIDERATION OF SHAREHOLDER VIEWSWhen determining remuneration, the Committee considers shareholder views and the guidelines of investor bodies. The Remuneration Committee Chairman, Senior Independent Director and Company Secretary engage proactively with major shareholders and shareholder representatives whenever appropriate. The Committee is always open to feedback from shareholders on its Remuneration Policy or individual arrangements, and is committed to consulting shareholders in advance of major changes. Details of votes cast for and against the resolution to approve last year’s Annual Report on Remuneration are provided in the Annual Report on Remuneration section of this Report.
ANNUAL REPORT ON REMUNERATIONThe following section provides details of how Inmarsat’s 2014 Remuneration Policy was implemented during the financial year ended 31 December 2016 and how the Committee intends to implement the proposed Policy in 2017.
The Regulations require our external auditors to report to shareholders on the audited information within this report and to state whether, in their opinion, the relevant sections have been prepared in accordance with the Act. The external auditors’ opinion is set out on pages 105 to 111 and we have clearly marked the audited sections of the report.
REMUNERATION COMMITTEE MEMBERSHIP IN 2016The Committee consists entirely of independent Non-Executive Directors. We had four scheduled meetings during the year to discharge our responsibilities. Committee membership and attendance are set out in the table below:
Committee members Attendance
Simon Bax (Committee Chairman) 4/4
Stephen Davidson1 4/4
Sir Bryan Carsberg 4/4
Kathleen Flaherty1 4/4
General C. Robert Kehler (Rtd) 4/4
1 Mr Davidson and Mrs Flaherty retired as Non-Executive Directors on 19 January and 2 March 2017, respectively
During the year, the Committee operated to a forward agenda which ensured that items were discussed at the appropriate time during the year. Its key activities included:
> Review and approval of the 2015 Directors’ Remuneration Report and preparation of the 2016 Report
> Preparation for the 2016 AGM
> Review of key shareholder themes, feedback and voting
> Review of Executive Director total remuneration
> Review and approval of incentive outcomes for the prior year
> Approval of opportunities/award levels and performance targets for the 2016 annual cash bonus, BSA and PSA awards
> Review of incentive plans across the Group and
> Considerable discussions and review of the structure of the 2017 Remuneration Policy, principally involving the Committee Chairman
ANNUAL REPORT AND ACCOUNTS 2016 – INMARSAT PLC – 89STRATEGIC REPORT – GOVERNANCE – FINANCIAL STATEMENTS
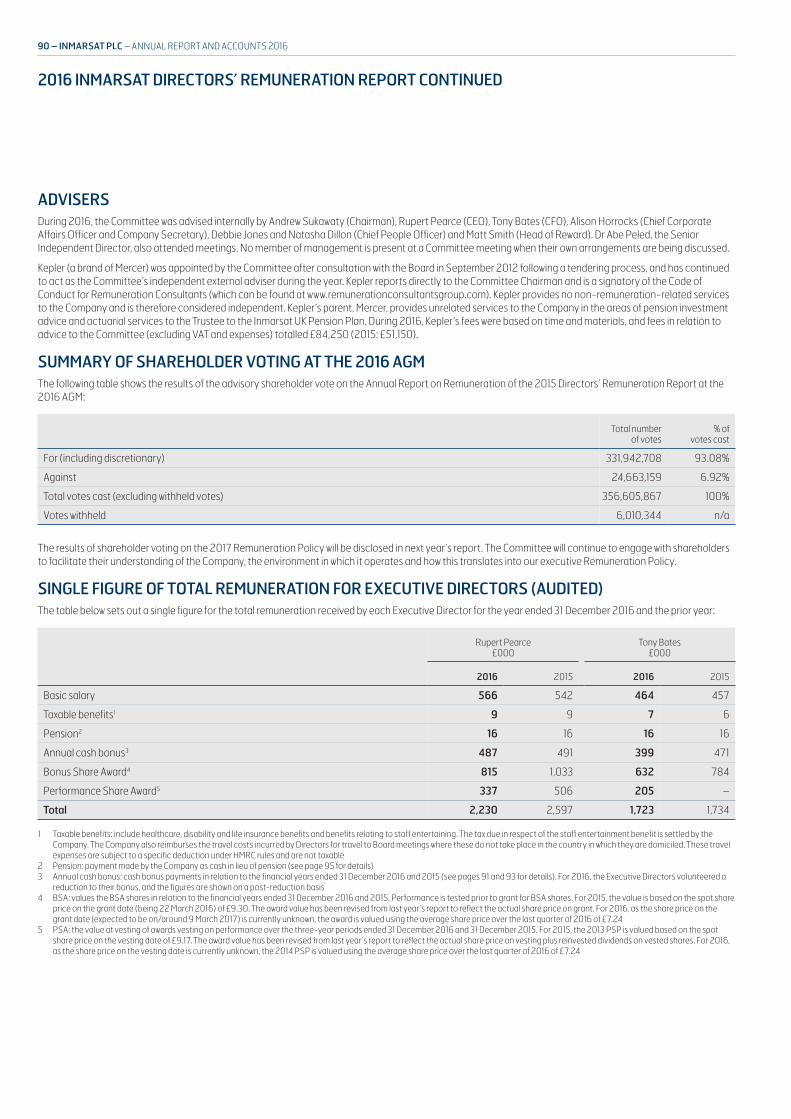
2016 INMARSAT DIRECTORS’ REMUNERATION REPORT CONTINUED
ADVISERSDuring 2016, the Committee was advised internally by Andrew Sukawaty (Chairman), Rupert Pearce (CEO), Tony Bates (CFO), Alison Horrocks (Chief Corporate Affairs Officer and Company Secretary), Debbie Jones and Natasha Dillon (Chief People Officer) and Matt Smith (Head of Reward). Dr Abe Peled, the Senior Independent Director, also attended meetings. No member of management is present at a Committee meeting when their own arrangements are being discussed.
Kepler (a brand of Mercer) was appointed by the Committee after consultation with the Board in September 2012 following a tendering process, and has continued to act as the Committee’s independent external adviser during the year. Kepler reports directly to the Committee Chairman and is a signatory of the Code of Conduct for Remuneration Consultants (which can be found at www.remunerationconsultantsgroup.com). Kepler provides no non-remuneration-related services to the Company and is therefore considered independent. Kepler’s parent, Mercer, provides unrelated services to the Company in the areas of pension investment advice and actuarial services to the Trustee to the Inmarsat UK Pension Plan. During 2016, Kepler’s fees were based on time and materials, and fees in relation to advice to the Committee (excluding VAT and expenses) totalled £84,250 (2015: £51,150).
SUMMARY OF SHAREHOLDER VOTING AT THE 2016 AGMThe following table shows the results of the advisory shareholder vote on the Annual Report on Remuneration of the 2015 Directors’ Remuneration Report at the 2016 AGM:
Total number of votes
% of votes cast
For (including discretionary) 331,942,708 93.08%
Against 24,663,159 6.92%
Total votes cast (excluding withheld votes) 356,605,867 100%
Votes withheld 6,010,344 n/a
The results of shareholder voting on the 2017 Remuneration Policy will be disclosed in next year’s report. The Committee will continue to engage with shareholders to facilitate their understanding of the Company, the environment in which it operates and how this translates into our executive Remuneration Policy.
SINGLE FIGURE OF TOTAL REMUNERATION FOR EXECUTIVE DIRECTORS (AUDITED)The table below sets out a single figure for the total remuneration received by each Executive Director for the year ended 31 December 2016 and the prior year:
Rupert Pearce£000
Tony Bates£000
2016 2015 2016 2015
Basic salary 566 542 464 457
Taxable benefits1 9 9 7 6
Pension2 16 16 16 16
Annual cash bonus3 487 491 399 471
Bonus Share Award4 815 1,033 632 784
Performance Share Award5 337 506 205 –
Total 2,230 2,597 1,723 1,734
1 Taxable benefits: include healthcare, disability and life insurance benefits and benefits relating to staff entertaining. The tax due in respect of the staff entertainment benefit is settled by the Company. The Company also reimburses the travel costs incurred by Directors for travel to Board meetings where these do not take place in the country in which they are domiciled. These travel expenses are subject to a specific deduction under HMRC rules and are not taxable
2 Pension: payment made by the Company as cash in lieu of pension (see page 95 for details)3 Annual cash bonus: cash bonus payments in relation to the financial years ended 31 December 2016 and 2015 (see pages 91 and 93 for details). For 2016, the Executive Directors volunteered a
reduction to their bonus, and the figures are shown on a post-reduction basis4 BSA: values the BSA shares in relation to the financial years ended 31 December 2016 and 2015. Performance is tested prior to grant for BSA shares. For 2015, the value is based on the spot share
price on the grant date (being 22 March 2016) of £9.30. The award value has been revised from last year’s report to reflect the actual share price on grant. For 2016, as the share price on the grant date (expected to be on/around 9 March 2017) is currently unknown, the award is valued using the average share price over the last quarter of 2016 of £7.24
5 PSA: the value at vesting of awards vesting on performance over the three-year periods ended 31 December 2016 and 31 December 2015. For 2015, the 2013 PSP is valued based on the spot share price on the vesting date of £9.17. The award value has been revised from last year’s report to reflect the actual share price on vesting plus reinvested dividends on vested shares. For 2016, as the share price on the vesting date is currently unknown, the 2014 PSP is valued using the average share price over the last quarter of 2016 of £7.24
90 – INMARSAT PLC – ANNUAL REPORT AND ACCOUNTS 2016
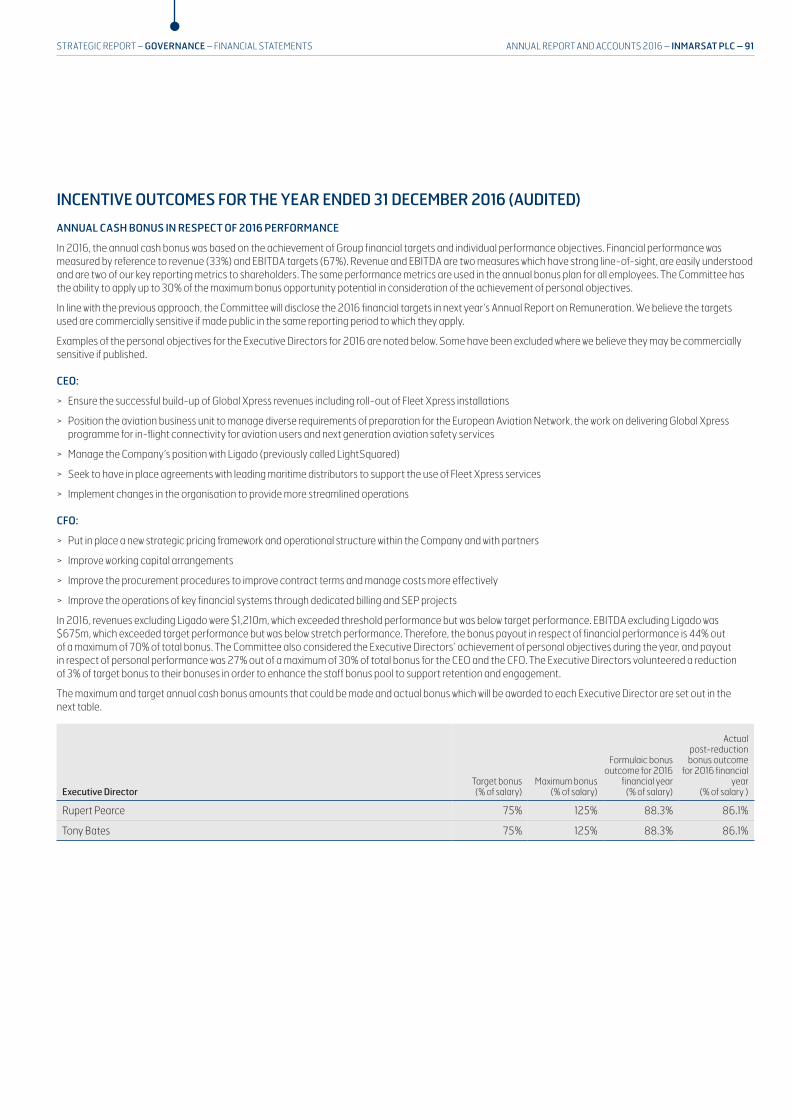
INCENTIVE OUTCOMES FOR THE YEAR ENDED 31 DECEMBER 2016 (AUDITED)
ANNUAL CASH BONUS IN RESPECT OF 2016 PERFORMANCE
In 2016, the annual cash bonus was based on the achievement of Group financial targets and individual performance objectives. Financial performance was measured by reference to revenue (33%) and EBITDA targets (67%). Revenue and EBITDA are two measures which have strong line-of-sight, are easily understood and are two of our key reporting metrics to shareholders. The same performance metrics are used in the annual bonus plan for all employees. The Committee has the ability to apply up to 30% of the maximum bonus opportunity potential in consideration of the achievement of personal objectives.
In line with the previous approach, the Committee will disclose the 2016 financial targets in next year’s Annual Report on Remuneration. We believe the targets used are commercially sensitive if made public in the same reporting period to which they apply.
Examples of the personal objectives for the Executive Directors for 2016 are noted below. Some have been excluded where we believe they may be commercially sensitive if published.
CEO:
> Ensure the successful build-up of Global Xpress revenues including roll-out of Fleet Xpress installations
> Position the aviation business unit to manage diverse requirements of preparation for the European Aviation Network, the work on delivering Global Xpress programme for in-flight connectivity for aviation users and next generation aviation safety services
> Manage the Company’s position with Ligado (previously called LightSquared)
> Seek to have in place agreements with leading maritime distributors to support the use of Fleet Xpress services
> Implement changes in the organisation to provide more streamlined operations
CFO:
> Put in place a new strategic pricing framework and operational structure within the Company and with partners
> Improve working capital arrangements
> Improve the procurement procedures to improve contract terms and manage costs more effectively
> Improve the operations of key financial systems through dedicated billing and SEP projects
In 2016, revenues excluding Ligado were $1,210m, which exceeded threshold performance but was below target performance. EBITDA excluding Ligado was $675m, which exceeded target performance but was below stretch performance. Therefore, the bonus payout in respect of financial performance is 44% out of a maximum of 70% of total bonus. The Committee also considered the Executive Directors’ achievement of personal objectives during the year, and payout in respect of personal performance was 27% out of a maximum of 30% of total bonus for the CEO and the CFO. The Executive Directors volunteered a reduction of 3% of target bonus to their bonuses in order to enhance the staff bonus pool to support retention and engagement.
The maximum and target annual cash bonus amounts that could be made and actual bonus which will be awarded to each Executive Director are set out in the next table.
Executive DirectorTarget bonus(% of salary)
Maximum bonus(% of salary)
Formulaic bonus outcome for 2016
financial year(% of salary)
Actual post-reduction bonus outcome
for 2016 financial year
(% of salary )
Rupert Pearce 75% 125% 88.3% 86.1%
Tony Bates 75% 125% 88.3% 86.1%
ANNUAL REPORT AND ACCOUNTS 2016 – INMARSAT PLC – 91STRATEGIC REPORT – GOVERNANCE – FINANCIAL STATEMENTS
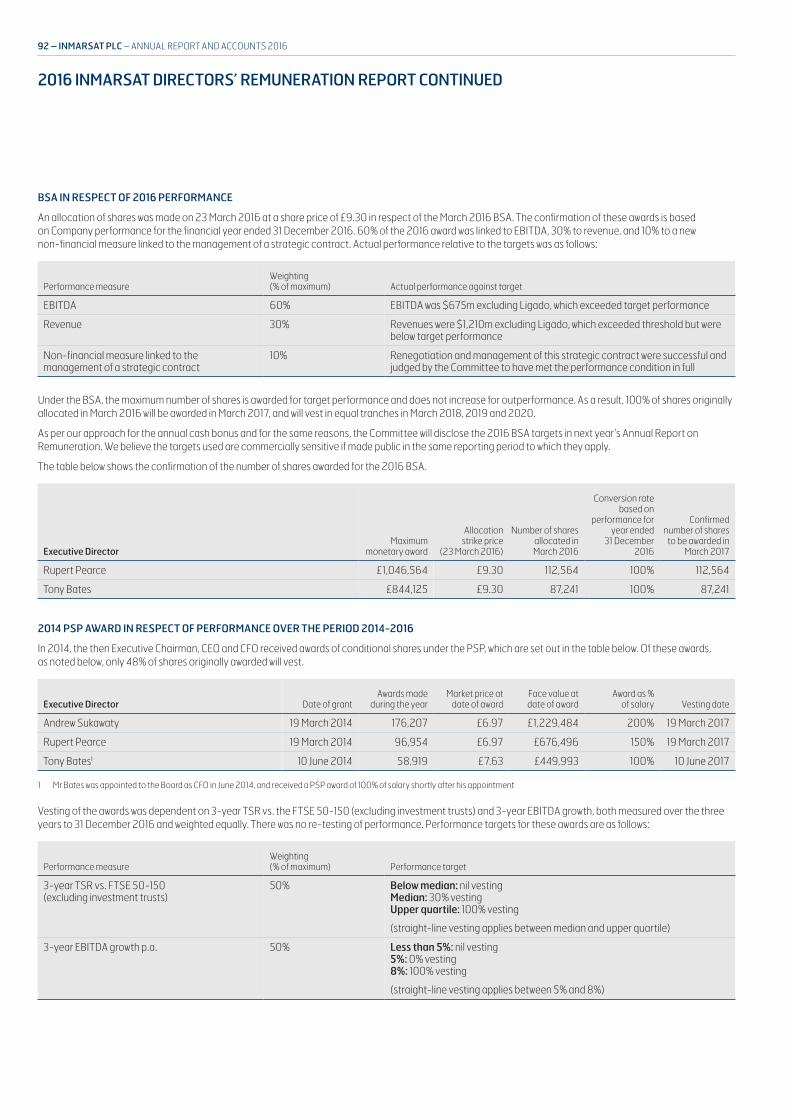
2016 INMARSAT DIRECTORS’ REMUNERATION REPORT CONTINUED
BSA IN RESPECT OF 2016 PERFORMANCE
An allocation of shares was made on 23 March 2016 at a share price of £9.30 in respect of the March 2016 BSA. The confirmation of these awards is based on Company performance for the financial year ended 31 December 2016. 60% of the 2016 award was linked to EBITDA, 30% to revenue, and 10% to a new non-financial measure linked to the management of a strategic contract. Actual performance relative to the targets was as follows:
Performance measureWeighting(% of maximum) Actual performance against target
EBITDA 60% EBITDA was $675m excluding Ligado, which exceeded target performance
Revenue 30% Revenues were $1,210m excluding Ligado, which exceeded threshold but were below target performance
Non-financial measure linked to the management of a strategic contract
10% Renegotiation and management of this strategic contract were successful and judged by the Committee to have met the performance condition in full
Under the BSA, the maximum number of shares is awarded for target performance and does not increase for outperformance. As a result, 100% of shares originally allocated in March 2016 will be awarded in March 2017, and will vest in equal tranches in March 2018, 2019 and 2020.
As per our approach for the annual cash bonus and for the same reasons, the Committee will disclose the 2016 BSA targets in next year’s Annual Report on Remuneration. We believe the targets used are commercially sensitive if made public in the same reporting period to which they apply.
The table below shows the confirmation of the number of shares awarded for the 2016 BSA.
Executive DirectorMaximum
monetary award
Allocation strike price
(23 March 2016)
Number of shares allocated in March 2016
Conversion rate based on
performance for year ended
31 December 2016
Confirmed number of shares
to be awarded in March 2017
Rupert Pearce £1,046,564 £9.30 112,564 100% 112,564
Tony Bates £844,125 £9.30 87,241 100% 87,241
2014 PSP AWARD IN RESPECT OF PERFORMANCE OVER THE PERIOD 2014-2016
In 2014, the then Executive Chairman, CEO and CFO received awards of conditional shares under the PSP, which are set out in the table below. Of these awards, as noted below, only 48% of shares originally awarded will vest.
Executive Director Date of grantAwards made
during the yearMarket price at
date of awardFace value at date of award
Award as % of salary Vesting date
Andrew Sukawaty 19 March 2014 176,207 £6.97 £1,229,484 200% 19 March 2017
Rupert Pearce 19 March 2014 96,954 £6.97 £676,496 150% 19 March 2017
Tony Bates1 10 June 2014 58,919 £7.63 £449,993 100% 10 June 2017
1 Mr Bates was appointed to the Board as CFO in June 2014, and received a PSP award of 100% of salary shortly after his appointment
Vesting of the awards was dependent on 3-year TSR vs. the FTSE 50-150 (excluding investment trusts) and 3-year EBITDA growth, both measured over the three years to 31 December 2016 and weighted equally. There was no re-testing of performance. Performance targets for these awards are as follows:
Performance measureWeighting(% of maximum) Performance target
3-year TSR vs. FTSE 50-150 (excluding investment trusts)
50% Below median: nil vesting Median: 30% vesting Upper quartile: 100% vesting
(straight-line vesting applies between median and upper quartile)
3-year EBITDA growth p.a. 50% Less than 5%: nil vesting 5%: 0% vesting 8%: 100% vesting
(straight-line vesting applies between 5% and 8%)
92 – INMARSAT PLC – ANNUAL REPORT AND ACCOUNTS 2016
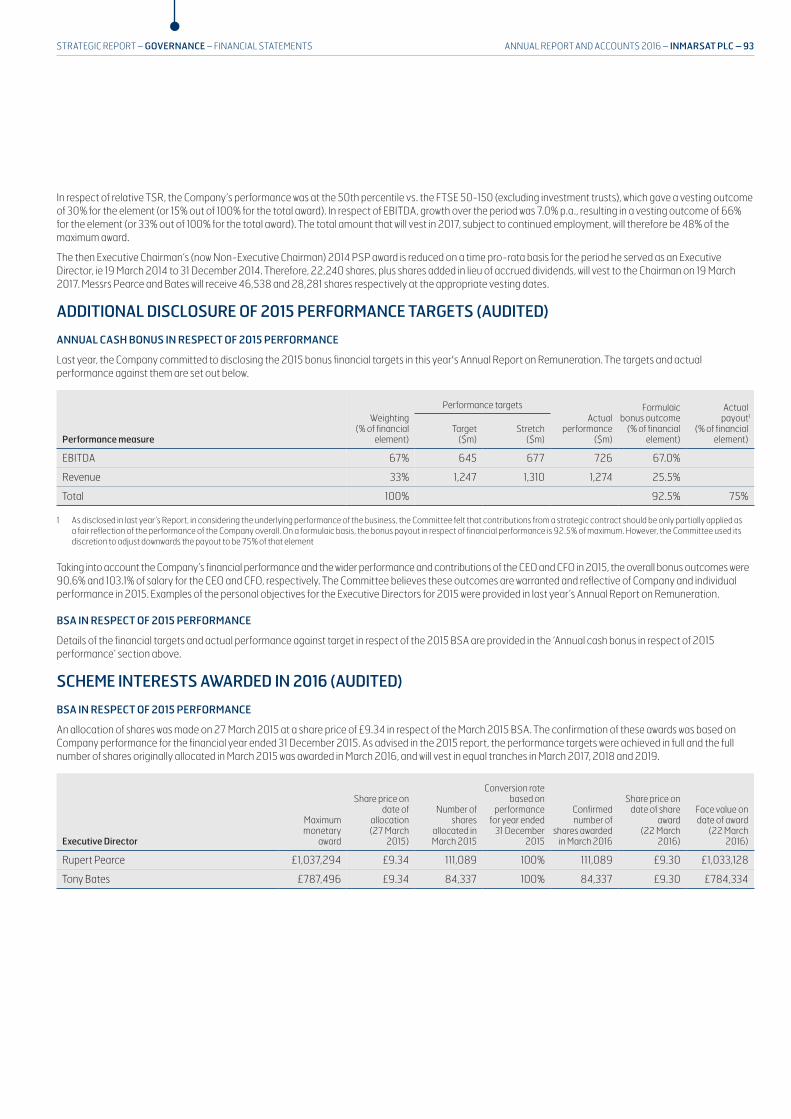
In respect of relative TSR, the Company’s performance was at the 50th percentile vs. the FTSE 50-150 (excluding investment trusts), which gave a vesting outcome of 30% for the element (or 15% out of 100% for the total award). In respect of EBITDA, growth over the period was 7.0% p.a., resulting in a vesting outcome of 66% for the element (or 33% out of 100% for the total award). The total amount that will vest in 2017, subject to continued employment, will therefore be 48% of the maximum award.
The then Executive Chairman’s (now Non-Executive Chairman) 2014 PSP award is reduced on a time pro-rata basis for the period he served as an Executive Director, ie 19 March 2014 to 31 December 2014. Therefore, 22,240 shares, plus shares added in lieu of accrued dividends, will vest to the Chairman on 19 March 2017. Messrs Pearce and Bates will receive 46,538 and 28,281 shares respectively at the appropriate vesting dates.
ADDITIONAL DISCLOSURE OF 2015 PERFORMANCE TARGETS (AUDITED)
ANNUAL CASH BONUS IN RESPECT OF 2015 PERFORMANCE
Last year, the Company committed to disclosing the 2015 bonus financial targets in this year's Annual Report on Remuneration. The targets and actual performance against them are set out below.
Performance measure
Weighting (% of financial
element)
Performance targets Actual
performance ($m)
Formulaic bonus outcome
(% of financial element)
Actualpayout1
(% of financial element)
Target($m)
Stretch($m)
EBITDA 67% 645 677 726 67.0%
Revenue 33% 1,247 1,310 1,274 25.5%
Total 100% 92.5% 75%
1 As disclosed in last year’s Report, in considering the underlying performance of the business, the Committee felt that contributions from a strategic contract should be only partially applied as a fair reflection of the performance of the Company overall. On a formulaic basis, the bonus payout in respect of financial performance is 92.5% of maximum. However, the Committee used its discretion to adjust downwards the payout to be 75% of that element
Taking into account the Company’s financial performance and the wider performance and contributions of the CEO and CFO in 2015, the overall bonus outcomes were 90.6% and 103.1% of salary for the CEO and CFO, respectively. The Committee believes these outcomes are warranted and reflective of Company and individual performance in 2015. Examples of the personal objectives for the Executive Directors for 2015 were provided in last year’s Annual Report on Remuneration.
BSA IN RESPECT OF 2015 PERFORMANCE
Details of the financial targets and actual performance against target in respect of the 2015 BSA are provided in the ‘Annual cash bonus in respect of 2015 performance’ section above.
SCHEME INTERESTS AWARDED IN 2016 (AUDITED)
BSA IN RESPECT OF 2015 PERFORMANCE
An allocation of shares was made on 27 March 2015 at a share price of £9.34 in respect of the March 2015 BSA. The confirmation of these awards was based on Company performance for the financial year ended 31 December 2015. As advised in the 2015 report, the performance targets were achieved in full and the full number of shares originally allocated in March 2015 was awarded in March 2016, and will vest in equal tranches in March 2017, 2018 and 2019.
Executive Director
Maximum monetary
award
Share price on date of
allocation (27 March
2015)
Number of shares
allocated in March 2015
Conversion rate based on
performance for year ended
31 December 2015
Confirmed number of
shares awarded in March 2016
Share price on date of share
award (22 March
2016)
Face value on date of award
(22 March 2016)
Rupert Pearce £1,037,294 £9.34 111,089 100% 111,089 £9.30 £1,033,128
Tony Bates £787,496 £9.34 84,337 100% 84,337 £9.30 £784,334
ANNUAL REPORT AND ACCOUNTS 2016 – INMARSAT PLC – 93STRATEGIC REPORT – GOVERNANCE – FINANCIAL STATEMENTS
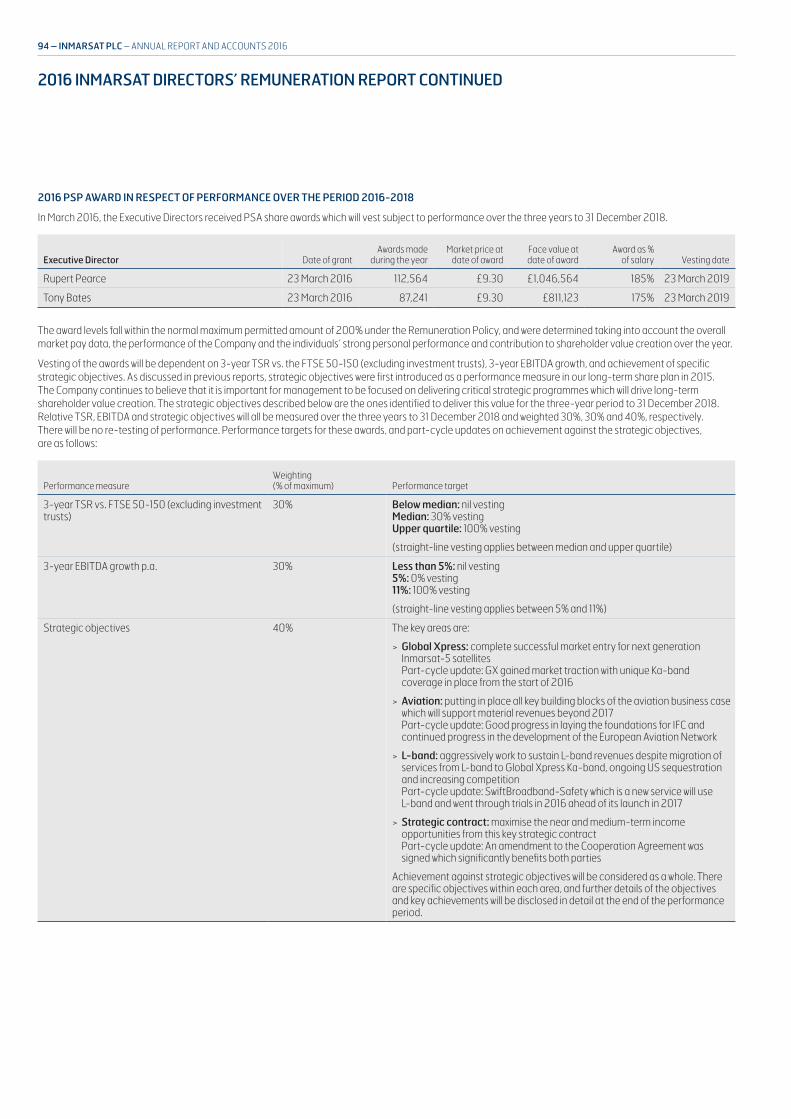
2016 INMARSAT DIRECTORS’ REMUNERATION REPORT CONTINUED
2016 PSP AWARD IN RESPECT OF PERFORMANCE OVER THE PERIOD 2016-2018
In March 2016, the Executive Directors received PSA share awards which will vest subject to performance over the three years to 31 December 2018.
Executive Director Date of grantAwards made
during the yearMarket price at
date of awardFace value at date of award
Award as % of salary Vesting date
Rupert Pearce 23 March 2016 112,564 £9.30 £1,046,564 185% 23 March 2019
Tony Bates 23 March 2016 87,241 £9.30 £811,123 175% 23 March 2019
The award levels fall within the normal maximum permitted amount of 200% under the Remuneration Policy, and were determined taking into account the overall market pay data, the performance of the Company and the individuals’ strong personal performance and contribution to shareholder value creation over the year.
Vesting of the awards will be dependent on 3-year TSR vs. the FTSE 50-150 (excluding investment trusts), 3-year EBITDA growth, and achievement of specific strategic objectives. As discussed in previous reports, strategic objectives were first introduced as a performance measure in our long-term share plan in 2015. The Company continues to believe that it is important for management to be focused on delivering critical strategic programmes which will drive long-term shareholder value creation. The strategic objectives described below are the ones identified to deliver this value for the three-year period to 31 December 2018. Relative TSR, EBITDA and strategic objectives will all be measured over the three years to 31 December 2018 and weighted 30%, 30% and 40%, respectively. There will be no re-testing of performance. Performance targets for these awards, and part-cycle updates on achievement against the strategic objectives, are as follows:
Performance measureWeighting(% of maximum) Performance target
3-year TSR vs. FTSE 50-150 (excluding investment trusts)
30% Below median: nil vesting Median: 30% vesting Upper quartile: 100% vesting
(straight-line vesting applies between median and upper quartile)
3-year EBITDA growth p.a. 30% Less than 5%: nil vesting 5%: 0% vesting 11%: 100% vesting
(straight-line vesting applies between 5% and 11%)
Strategic objectives 40% The key areas are:
> Global Xpress: complete successful market entry for next generation Inmarsat-5 satellites Part-cycle update: GX gained market traction with unique Ka-band coverage in place from the start of 2016
> Aviation: putting in place all key building blocks of the aviation business case which will support material revenues beyond 2017 Part-cycle update: Good progress in laying the foundations for IFC and continued progress in the development of the European Aviation Network
> L-band: aggressively work to sustain L-band revenues despite migration of services from L-band to Global Xpress Ka-band, ongoing US sequestration and increasing competition Part-cycle update: SwiftBroadband-Safety which is a new service will use L-band and went through trials in 2016 ahead of its launch in 2017
> Strategic contract: maximise the near and medium-term income opportunities from this key strategic contract Part-cycle update: An amendment to the Cooperation Agreement was signed which significantly benefits both parties
Achievement against strategic objectives will be considered as a whole. There are specific objectives within each area, and further details of the objectives and key achievements will be disclosed in detail at the end of the performance period.
94 – INMARSAT PLC – ANNUAL REPORT AND ACCOUNTS 2016
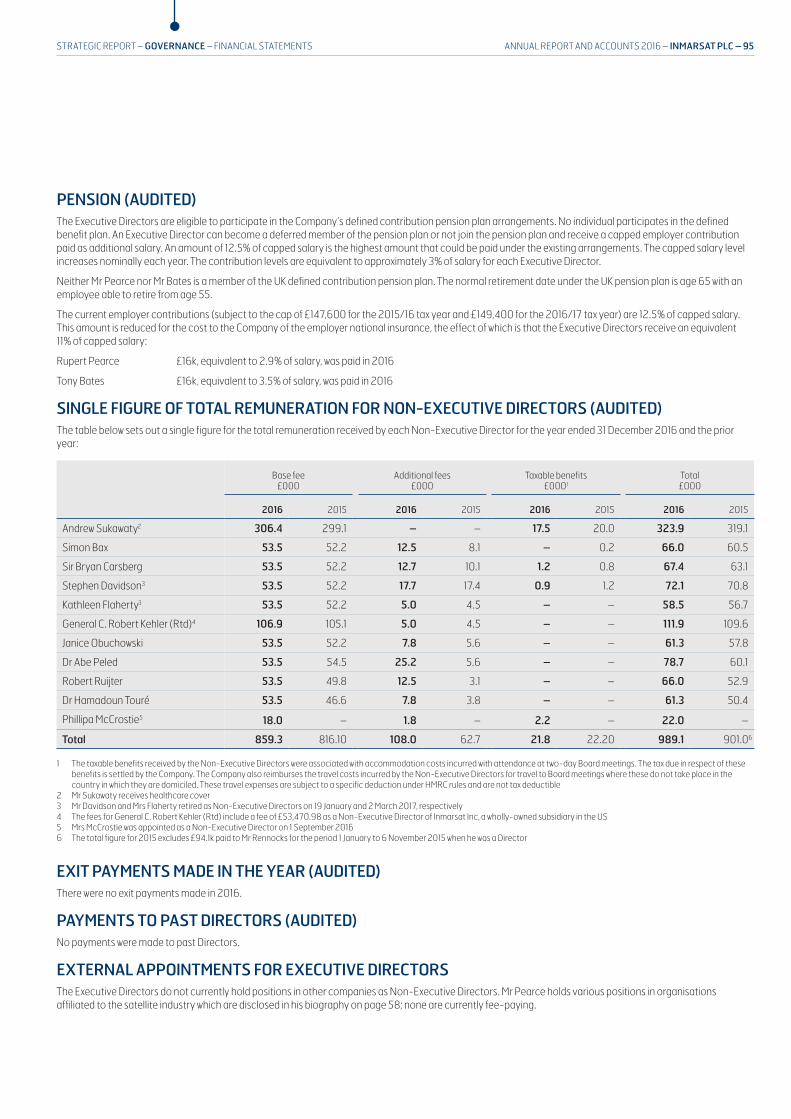
PENSION (AUDITED)The Executive Directors are eligible to participate in the Company’s defined contribution pension plan arrangements. No individual participates in the defined benefit plan. An Executive Director can become a deferred member of the pension plan or not join the pension plan and receive a capped employer contribution paid as additional salary. An amount of 12.5% of capped salary is the highest amount that could be paid under the existing arrangements. The capped salary level increases nominally each year. The contribution levels are equivalent to approximately 3% of salary for each Executive Director.
Neither Mr Pearce nor Mr Bates is a member of the UK defined contribution pension plan. The normal retirement date under the UK pension plan is age 65 with an employee able to retire from age 55.
The current employer contributions (subject to the cap of £147,600 for the 2015/16 tax year and £149,400 for the 2016/17 tax year) are 12.5% of capped salary. This amount is reduced for the cost to the Company of the employer national insurance, the effect of which is that the Executive Directors receive an equivalent 11% of capped salary:
Rupert Pearce £16k, equivalent to 2.9% of salary, was paid in 2016
Tony Bates £16k, equivalent to 3.5% of salary, was paid in 2016
SINGLE FIGURE OF TOTAL REMUNERATION FOR NON-EXECUTIVE DIRECTORS (AUDITED)The table below sets out a single figure for the total remuneration received by each Non-Executive Director for the year ended 31 December 2016 and the prior year:
Base fee£000
Additional fees£000
Taxable benefits£0001
Total£000
2016 2015 2016 2015 2016 2015 2016 2015
Andrew Sukawaty2 306.4 299.1 – – 17.5 20.0 323.9 319.1
Simon Bax 53.5 52.2 12.5 8.1 – 0.2 66.0 60.5
Sir Bryan Carsberg 53.5 52.2 12.7 10.1 1.2 0.8 67.4 63.1
Stephen Davidson3 53.5 52.2 17.7 17.4 0.9 1.2 72.1 70.8
Kathleen Flaherty3 53.5 52.2 5.0 4.5 – – 58.5 56.7
General C. Robert Kehler (Rtd)4 106.9 105.1 5.0 4.5 – – 111.9 109.6
Janice Obuchowski 53.5 52.2 7.8 5.6 – – 61.3 57.8
Dr Abe Peled 53.5 54.5 25.2 5.6 – – 78.7 60.1
Robert Ruijter 53.5 49.8 12.5 3.1 – – 66.0 52.9
Dr Hamadoun Touré 53.5 46.6 7.8 3.8 – – 61.3 50.4
Phillipa McCrostie5 18.0 – 1.8 – 2.2 – 22.0 –
Total 859.3 816.10 108.0 62.7 21.8 22.20 989.1 901.06
1 The taxable benefits received by the Non-Executive Directors were associated with accommodation costs incurred with attendance at two-day Board meetings. The tax due in respect of these benefits is settled by the Company. The Company also reimburses the travel costs incurred by the Non-Executive Directors for travel to Board meetings where these do not take place in the country in which they are domiciled. These travel expenses are subject to a specific deduction under HMRC rules and are not tax deductible
2 Mr Sukawaty receives healthcare cover3 Mr Davidson and Mrs Flaherty retired as Non-Executive Directors on 19 January and 2 March 2017, respectively4 The fees for General C. Robert Kehler (Rtd) include a fee of £53,470.98 as a Non-Executive Director of Inmarsat Inc, a wholly-owned subsidiary in the US5 Mrs McCrostie was appointed as a Non-Executive Director on 1 September 2016 6 The total figure for 2015 excludes £94.1k paid to Mr Rennocks for the period 1 January to 6 November 2015 when he was a Director
EXIT PAYMENTS MADE IN THE YEAR (AUDITED)There were no exit payments made in 2016.
PAYMENTS TO PAST DIRECTORS (AUDITED)No payments were made to past Directors.
EXTERNAL APPOINTMENTS FOR EXECUTIVE DIRECTORSThe Executive Directors do not currently hold positions in other companies as Non-Executive Directors. Mr Pearce holds various positions in organisations affiliated to the satellite industry which are disclosed in his biography on page 58; none are currently fee-paying.
ANNUAL REPORT AND ACCOUNTS 2016 – INMARSAT PLC – 95STRATEGIC REPORT – GOVERNANCE – FINANCIAL STATEMENTS

2016 INMARSAT DIRECTORS’ REMUNERATION REPORT CONTINUED
IMPLEMENTATION OF REMUNERATION POLICY FOR 2017
BASE SALARY
Salaries are typically reviewed annually in July for the Executive Directors and the general workforce. In 2016, the Company made the decision that due to business circumstances at the time, the annual salary review would be deferred for the Executive Directors and Executive Management Board to January 2017. Based on the subsequent review, the Committee approved a salary increase of 2% for both Executive Directors, effective from 1 January 2017. Salary increases across the Group averaged 2.2%, and averaged 1.94% for non-UK employees.
The Committee believes the new salaries are appropriate in the context of market pay data and continued strong individual performance. Salaries will next be reviewed in July 2017, which is the same time for the general workforce. The table below shows the Executive Directors’ salaries as at July 2015 and January 2017.
Executive DirectorSalary at
1 January 20171 % changeSalary at
1 July 2015
Rupert Pearce £577,024 2% £565,710
Tony Bates £472,770 2% £463,500
1 Annual salary review deferred from 1 July 2016 to 1 January 2017
PENSION
Cash payments in lieu of employer pension contributions for 2017 will be made in accordance with the Remuneration Policy table set out on page 82, and will be on the same basis as those made in 2016.
ANNUAL CASH BONUS
The maximum annual bonus opportunity for Executive Directors in 2017 will remain unchanged from the opportunity in 2016, and will be 125% of salary.
The annual bonus will continue to have a financial element and an element linked to personal performance. The financial element of the bonus, totalling 70% of maximum bonus opportunity, will continue to be measured by reference to EBITDA (67% of the maximum award) and revenue (33%). As in 2016, the Committee will have the ability to apply up to 30% of the maximum bonus opportunity potential in consideration of the achievement of personal objectives.
BSA SHARES
In March 2017, a monetary BSA award will be made and nominally converted to shares immediately as happened in 2016. As in previous years, the level of award will not be confirmed until the results for 2017 have been determined and may be lower (but not higher) than the initial award. There is no change to the vesting timetable: the shares will vest in equal tranches in March 2019, 2020 and 2021, subject to continued employment. With the nominal conversion of the shares at the outset, this more closely aligns the value delivered to participants under this award with the value created for shareholders over the same period. The number and value of the shares actually awarded will be determined in March 2018 after the performance conditions are known to be met or not.
The level of award in March 2017 will be 185% and 175% of salary for Mr Pearce and Mr Bates, respectively, the same levels as in 2016. The performance measures will be the same as the financial metrics used in the 2017 annual bonus. 67% of the award will be linked to EBITDA and 33% to revenue. As in previous years, the BSA performance targets relate to annual performance and will therefore be disclosed in full on a retrospective basis. The Remuneration Committee reviewed the award levels, and believe they are appropriate in the context of the Company’s ambitions for growth and how each of the Executive Directors will contribute personally towards overall Group performance. The award levels are in line with market benchmark levels for FTSE 50-150 companies (excluding investment trusts) when considered as part of a total package.
96 – INMARSAT PLC – ANNUAL REPORT AND ACCOUNTS 2016

PSA SHARES
A PSA award will be made in March 2017, and the level of award will be 185% of salary for Mr Pearce and 175% for Mr Bates, the same levels as in 2016. The Remuneration Committee reviewed the award levels, and believe they are appropriate in the context of Company’s ambitions for growth and how each of the Executive Directors will contribute personally towards overall Group performance. The award levels are in line with market benchmark levels for FTSE 50-150 companies (excluding investment trusts) when considered as part of a total package.
The PSA awards in 2017 will operate on the same basis as they did in 2016. Awards vest after three years based upon the same three performance conditions, measured over the three years to 31 December 2019. The targets are as follows.
Performance measureWeighting(% of maximum) Performance target
3-year TSR vs. FTSE 50-150 (excluding investment trusts)
30% Below median: nil vesting Median: 30% vesting Upper quartile: 100% vesting
(straight-line vesting applies between median and upper quartile)
3-year EBITDA growth p.a. 30% Less than 3%: nil vesting 3%: 0% vesting 7%: 100% vesting
(straight-line vesting applies between 3% and 7%)
Strategic objectives 40% The key areas are:
> Global Xpress: complete successful market entry to satellite broadband market through the next generations of Inmarsat satellites
> Aviation: put in place all key building blocks of Aviation business case (to support material revenues forecast over the LRBP period)
> L-band: Work assiduously to sustain L-band revenues despite GX migration and both ongoing tight budgets and strong competition in all markets
> Strategic contract: To maximise the overall net contribution of the contract to Inmarsat
Achievement against strategic objectives will be considered as a whole. There are specific objectives within each area, and further details of the objectives and key achievements will be disclosed in detail at the end of the performance period
The Committee considered the appropriateness of a five-year PSA horizon in 2016. The Committee noted shareholder preference for post-vesting holding periods for long-term incentive awards, and is therefore introducing a mandatory two-year holding period for vested awards, starting with the awards to be made in 2017 and future years under the PSA. No shares may be sold during the holding period except to cover tax liabilities. Vested but held shares are treated as owned by the individual, and count towards shareholding for the purpose of calculating achievement of shareholding guidelines.
NON-EXECUTIVE DIRECTOR FEESThe current NED fee levels are set out in the table below.
NED fees as at 31 December 2016 Amount
Basic fee £54,000
Senior Independent Director (inclusive of any additional Committee fees) £84, 000
Non-Executive Chairman (inclusive of any additional Committee fees) £309,500
Additional Committee fees:
Chairman of the Audit Committee £15,000
Chairman of the Remuneration Committee £15,000
Chairman of the Nominations Committee £10,000
Chairman of the Telecoms Regulatory Committee £10,000
Committee membership (per Committee) £5,500
Fees will next be reviewed in July 2017 and any increases will be for the decision of the Board, excluding the Non-Executive Directors. The Chairman also receives international healthcare cover (£15,795 in 2016).
ANNUAL REPORT AND ACCOUNTS 2016 – INMARSAT PLC – 97STRATEGIC REPORT – GOVERNANCE – FINANCIAL STATEMENTS
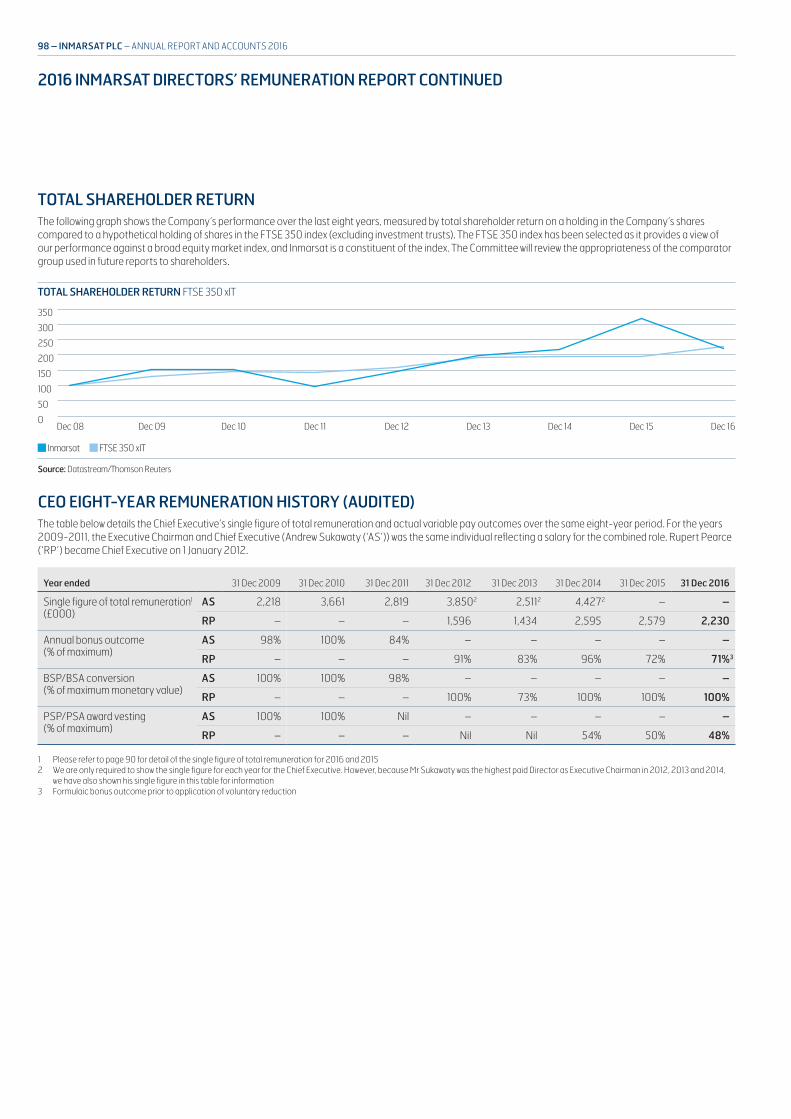
2016 INMARSAT DIRECTORS’ REMUNERATION REPORT CONTINUED
TOTAL SHAREHOLDER RETURN The following graph shows the Company’s performance over the last eight years, measured by total shareholder return on a holding in the Company’s shares compared to a hypothetical holding of shares in the FTSE 350 index (excluding investment trusts). The FTSE 350 index has been selected as it provides a view of our performance against a broad equity market index, and Inmarsat is a constituent of the index. The Committee will review the appropriateness of the comparator group used in future reports to shareholders.
TOTAL SHAREHOLDER RETURN FTSE 350 xIT
350
300
250
200
150
100
50
Dec 08 Dec 09 Dec 10 Dec 11 Dec 12 Dec 13 Dec 14 Dec 15 Dec 160
Inmarsat FTSE 350 xIT
Source: Datastream/Thomson Reuters
CEO EIGHT-YEAR REMUNERATION HISTORY (AUDITED)The table below details the Chief Executive’s single figure of total remuneration and actual variable pay outcomes over the same eight-year period. For the years 2009-2011, the Executive Chairman and Chief Executive (Andrew Sukawaty (‘AS’)) was the same individual reflecting a salary for the combined role. Rupert Pearce (‘RP’) became Chief Executive on 1 January 2012.
Year ended 31 Dec 2009 31 Dec 2010 31 Dec 2011 31 Dec 2012 31 Dec 2013 31 Dec 2014 31 Dec 2015 31 Dec 2016
Single figure of total remuneration1 (£000)
AS 2,218 3,661 2,819 3,8502 2,5112 4,4272 – –
RP – – – 1,596 1,434 2,595 2,579 2,230
Annual bonus outcome (% of maximum)
AS 98% 100% 84% – – – – –
RP – – – 91% 83% 96% 72% 71%3
BSP/BSA conversion (% of maximum monetary value)
AS 100% 100% 98% – – – – –
RP – – – 100% 73% 100% 100% 100%
PSP/PSA award vesting (% of maximum)
AS 100% 100% Nil – – – – –
RP – – – Nil Nil 54% 50% 48%
1 Please refer to page 90 for detail of the single figure of total remuneration for 2016 and 2015 2 We are only required to show the single figure for each year for the Chief Executive. However, because Mr Sukawaty was the highest paid Director as Executive Chairman in 2012, 2013 and 2014,
we have also shown his single figure in this table for information3 Formulaic bonus outcome prior to application of voluntary reduction
98 – INMARSAT PLC – ANNUAL REPORT AND ACCOUNTS 2016
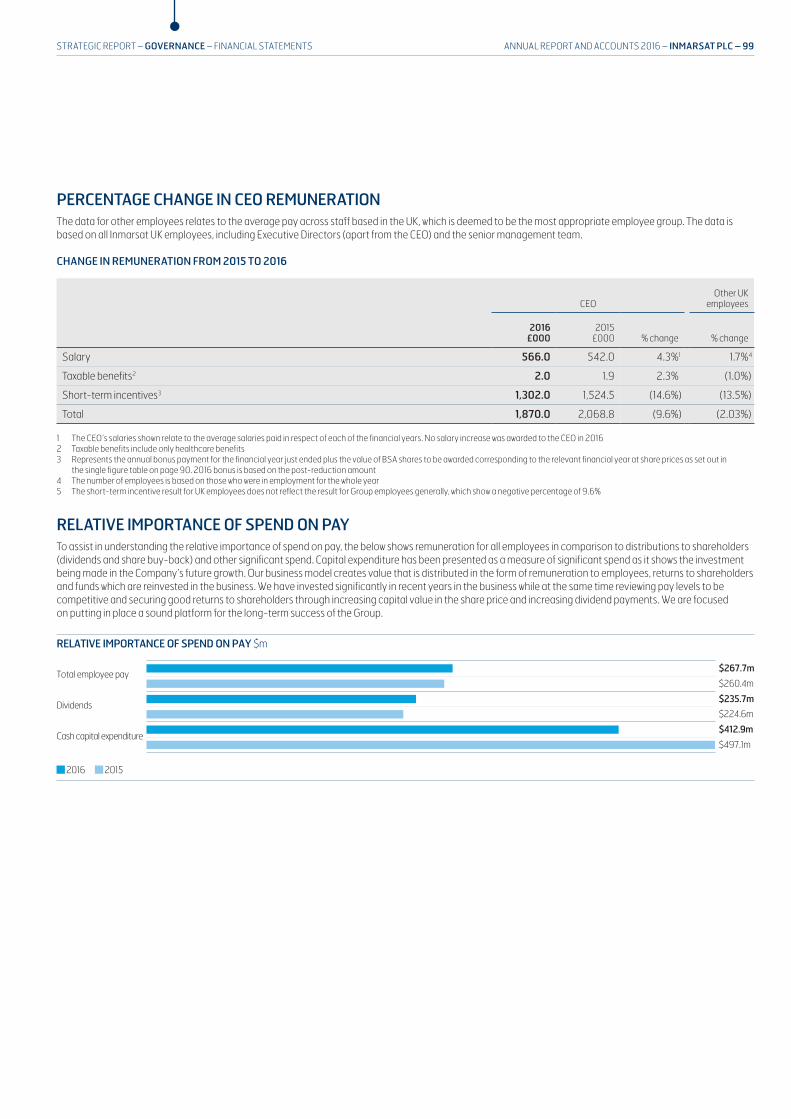
PERCENTAGE CHANGE IN CEO REMUNERATION The data for other employees relates to the average pay across staff based in the UK, which is deemed to be the most appropriate employee group. The data is based on all Inmarsat UK employees, including Executive Directors (apart from the CEO) and the senior management team.
CHANGE IN REMUNERATION FROM 2015 TO 2016
CEOOther UK
employees
2016 £000
2015 £000 % change % change
Salary 566.0 542.0 4.3%1 1.7%4
Taxable benefits2 2.0 1.9 2.3% (1.0%)
Short-term incentives3 1,302.0 1,524.5 (14.6%) (13.5%)
Total 1,870.0 2,068.8 (9.6%) (2.03%)
1 The CEO’s salaries shown relate to the average salaries paid in respect of each of the financial years. No salary increase was awarded to the CEO in 20162 Taxable benefits include only healthcare benefits3 Represents the annual bonus payment for the financial year just ended plus the value of BSA shares to be awarded corresponding to the relevant financial year at share prices as set out in
the single figure table on page 90. 2016 bonus is based on the post-reduction amount4 The number of employees is based on those who were in employment for the whole year 5 The short-term incentive result for UK employees does not reflect the result for Group employees generally, which show a negative percentage of 9.6%
RELATIVE IMPORTANCE OF SPEND ON PAYTo assist in understanding the relative importance of spend on pay, the below shows remuneration for all employees in comparison to distributions to shareholders (dividends and share buy-back) and other significant spend. Capital expenditure has been presented as a measure of significant spend as it shows the investment being made in the Company’s future growth. Our business model creates value that is distributed in the form of remuneration to employees, returns to shareholders and funds which are reinvested in the business. We have invested significantly in recent years in the business while at the same time reviewing pay levels to be competitive and securing good returns to shareholders through increasing capital value in the share price and increasing dividend payments. We are focused on putting in place a sound platform for the long-term success of the Group.
RELATIVE IMPORTANCE OF SPEND ON PAY $m
Total employee pay
Dividends
Cash capital expenditure
2016
$267.7m
$260.4m
$235.7m
$224.6m
$412.9m
$497.1m
2015
ANNUAL REPORT AND ACCOUNTS 2016 – INMARSAT PLC – 99STRATEGIC REPORT – GOVERNANCE – FINANCIAL STATEMENTS

2016 INMARSAT DIRECTORS’ REMUNERATION REPORT CONTINUED
DIRECTORS’ SHAREHOLDING (AUDITED) The table below shows the shareholding of each Director against their respective shareholding requirement as at 31 December 2016 based on a share price of £7.51 as at 31 December 2016:
Shares held as at 31 Dec 2015
Shares held as at 31 Dec 2016
Unvested and subject to
deferral1
Unvested and subject to
performanceconditions2
Shareholding guideline
(% salary)
Current3
shareholding (% salary)
Requirement met?
Rupert Pearce 747,046 824,254 249,884 223,653 500% 1,426% Yes
Tony Bates – 17,389 153,516 171,578 500% 277% No4
Andrew Sukawaty 937,228 1,076,825
Simon Bax 7,000 11,500
Sir Bryan Carsberg 16,327 16,327
Stephen Davidson 1,500 1,500
Kathleen Flaherty 3,073 3,073
General C. Robert Kehler (Rtd) 1,000 2,000
Janice Obuchowski 7,000 7,000
Dr Abe Peled 10,000 10,000
Robert Ruijter – –
Dr Hamadoun Touré – –
Phillipa McCrostie – –
1 The unvested and subject to deferral column includes BSA/BSP awards granted in 2014, 2015 and 2016 and 48% of the 2014 PSP as performance has been tested2 The unvested and subject to performance conditions column includes PSP/PSA awards made in 2015 and 20163 Includes the BSP/BSA conditional awards made in 2014, 2015 and 2016 and associated dividend shares, and 48% of the PSP awarded in 20144 Mr Bates joined the Company in June 2014. The shareholding guideline of five times salary is to be achieved over a five- to seven-year period
Several of our Non-Executive Directors have significant shareholdings. There were no changes in Directors’ interests from 31 December 2016 to 8 March 2017.
100 – INMARSAT PLC – ANNUAL REPORT AND ACCOUNTS 2016
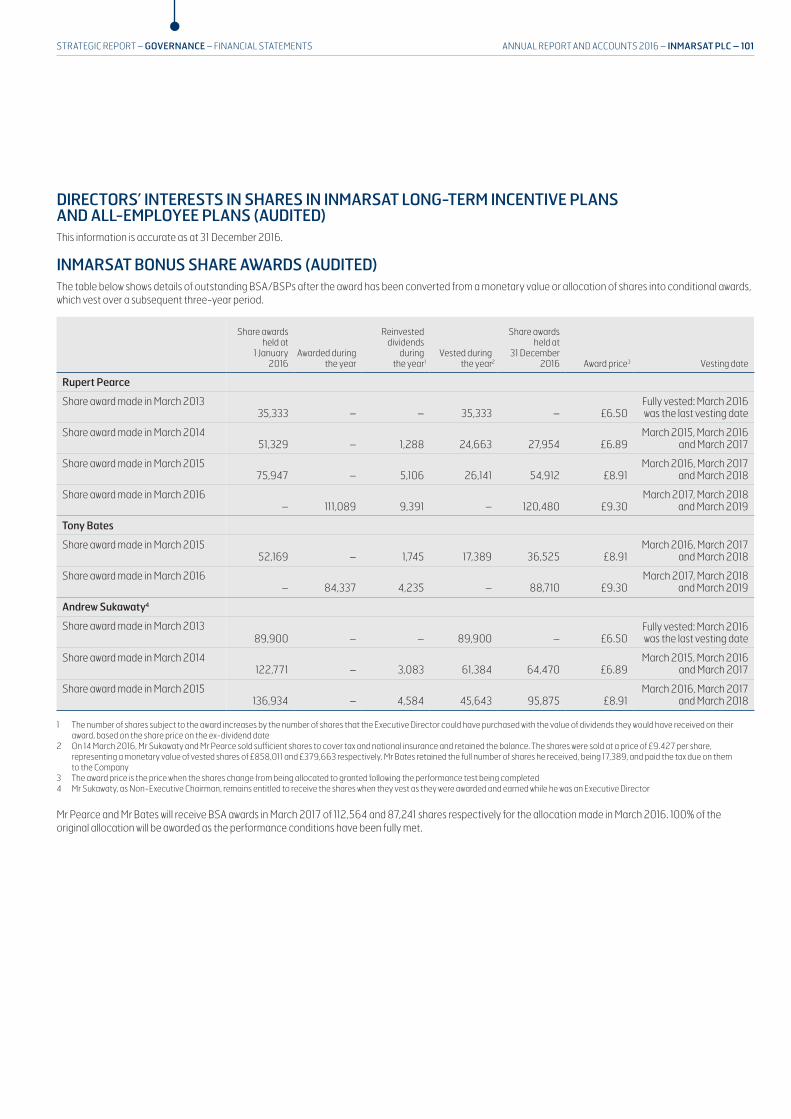
DIRECTORS’ INTERESTS IN SHARES IN INMARSAT LONG-TERM INCENTIVE PLANS AND ALL-EMPLOYEE PLANS (AUDITED)This information is accurate as at 31 December 2016.
INMARSAT BONUS SHARE AWARDS (AUDITED)The table below shows details of outstanding BSA/BSPs after the award has been converted from a monetary value or allocation of shares into conditional awards, which vest over a subsequent three-year period.
Share awards held at
1 January 2016
Awarded during the year
Reinvested dividends
duringthe year1
Vested during the year2
Share awards held at
31 December 2016 Award price3 Vesting date
Rupert Pearce
Share award made in March 201335,333 – – 35,333 – £6.50
Fully vested: March 2016 was the last vesting date
Share award made in March 201451,329 – 1,288 24,663 27,954 £6.89
March 2015, March 2016 and March 2017
Share award made in March 201575,947 – 5,106 26,141 54,912 £8.91
March 2016, March 2017 and March 2018
Share award made in March 2016– 111,089 9,391 – 120,480 £9.30
March 2017, March 2018 and March 2019
Tony Bates
Share award made in March 201552,169 – 1,745 17,389 36,525 £8.91
March 2016, March 2017 and March 2018
Share award made in March 2016– 84,337 4,235 – 88,710 £9.30
March 2017, March 2018 and March 2019
Andrew Sukawaty4
Share award made in March 201389,900 – – 89,900 – £6.50
Fully vested: March 2016 was the last vesting date
Share award made in March 2014122,771 – 3,083 61,384 64,470 £6.89
March 2015, March 2016 and March 2017
Share award made in March 2015136,934 – 4,584 45,643 95,875 £8.91
March 2016, March 2017 and March 2018
1 The number of shares subject to the award increases by the number of shares that the Executive Director could have purchased with the value of dividends they would have received on their award, based on the share price on the ex-dividend date
2 On 14 March 2016, Mr Sukawaty and Mr Pearce sold sufficient shares to cover tax and national insurance and retained the balance. The shares were sold at a price of £9.427 per share, representing a monetary value of vested shares of £858,011 and £379,663 respectively. Mr Bates retained the full number of shares he received, being 17,389, and paid the tax due on them to the Company
3 The award price is the price when the shares change from being allocated to granted following the performance test being completed4 Mr Sukawaty, as Non-Executive Chairman, remains entitled to receive the shares when they vest as they were awarded and earned while he was an Executive Director
Mr Pearce and Mr Bates will receive BSA awards in March 2017 of 112,564 and 87,241 shares respectively for the allocation made in March 2016. 100% of the original allocation will be awarded as the performance conditions have been fully met.
ANNUAL REPORT AND ACCOUNTS 2016 – INMARSAT PLC – 101STRATEGIC REPORT – GOVERNANCE – FINANCIAL STATEMENTS

INMARSAT PERFORMANCE SHARE AWARDS (AUDITED)The table below shows details of outstanding PSA/PSPs.
Share awards held at 1 January
2016Awarded during
the year
Reinvested dividends
duringthe year1
Vested during the year
Lapsed during the year
Share awards held at
31 December 2016 Award price Vesting date
Rupert Pearce
Award made in 20132 98,435 – 11,884 55,159 55,160 – £6.87 March 2016
Award made in 20143 96,954 – – – – 96,954 £6.98 March 2017
Award made in 2015 111,089 – – – – 111,089 £9.34 March 2018
Award made in 2016 – 112,564 – – – 112,564 £9.30 March 2019
Tony Bates
Award made in 20143 58,919 – – – – 58,919 £7.64 June 2017
Award made in 2015 84,337 – – – – 84,337 £9.34 March 2018
Award made in 2016 – 87,241 – – – 87,241 £9.30 March 2019
Andrew Sukawaty4
Award made in 20132 201,262 – 3,526 63,345 141,443 – £6.87 March 2016
Award made in 20143 176,207 – – – – 176,207 £6.98 March 2017
1 The number of shares subject to the award increases by the number of shares that the Executive Director could have purchased with the value of dividends they would have received on their award, based on the share price on the ex-dividend date
2 50% of the 2013 PSP vested in 2016 3 48% of the 2014 PSP will vest in March 20174 Mr Sukawaty’s outstanding PSA awards (made to him when he was Executive Chairman) will vest to him on a time pro-rata basis on their respective normal vesting dates for the period he was
an Executive Director, subject to performance and continued employment
INMARSAT SHARESAVE SCHEME (2016 AWARD) (AUDITED)The information below relates to the UK Sharesave plan which the Executive Directors can contribute monthly savings to over a three-year period.
Executive DirectorOptions held at 1 January 2016
Granted during the year
Exercised during the year
Options held at 31 December
2016Option price per
shareDate from which
exercisable Expiry date
Rupert Pearce 1,960 1,584 1,960 1,584 £5.68 August 2019 January 2020
Tony Bates – 1,584 – 1,584 £5.68 August 2019 January 2020
The then Executive Chairman, Mr Andrew Sukawaty, held 1,960 options over shares under the Inmarsat 2005 Sharesave scheme at an option price of £4.59. These options were exercised on 14 March 2016. The award was made when Mr Sukawaty was an executive. Mr Sukawaty and Mr Pearce both retained the full number of maturing SAYE shares, being 1,960 each on maturity.
APPROVALThis report was approved by the Board of Directors on 8 March and signed on its behalf by:
SIMON BAXChairman, Remuneration Committee
8 March 2017
2016 INMARSAT DIRECTORS’ REMUNERATION REPORT CONTINUED
102 – INMARSAT PLC – ANNUAL REPORT AND ACCOUNTS 2016
DIRECTORS’ RESPONSIBILITIES STATEMENT
The Directors are responsible for preparing the Annual Report and the financial statements in accordance with applicable law and regulations.
Company law requires the Directors to prepare such financial statements for each financial year. Under that law the Directors are required to prepare the Group financial statements in accordance with International Financial Reporting Standards (‘IFRS’) as adopted by the European Union and Article 4 of the IAS Regulation and have also chosen to prepare the Parent Company financial statements in accordance with Financial Reporting Standard 101 Reduced Disclosure Framework. Under company law the Directors must not approve the financial statements unless they are satisfied that they give a true and fair view of the state of affairs of the Company and of the profit or loss of the Company for that period.
In preparing the Parent Company financial statements, the Directors are required to:
> select suitable accounting policies and then apply them consistently
> make judgements and accounting estimates that are reasonable and prudent
> state whether Financial Reporting Standard 101 Reduced Disclosure Framework has been followed, subject to any material departures disclosed and explained in the financial statements and
> prepare the financial statements on the going concern basis unless it is inappropriate to presume that the Company will continue in business
In preparing the Group financial statements, International Accounting Standard 1 requires that Directors:
> properly select and apply accounting policies
> present information, including accounting policies, in a manner that provides relevant, reliable, comparable and understandable information
> provide additional disclosures when compliance with the specific requirements in IFRSs are insufficient to enable users to understand the impact of particular transactions, other events and conditions on the entity’s financial position and financial performance and
> make an assessment of the Company’s ability to continue as a going concern
The Directors are responsible for keeping adequate accounting records that are sufficient to show and explain the Company’s transactions and disclose with reasonable accuracy at any time the financial position of the Company and enable them to ensure that the financial statements comply with the Companies Act 2006. They are also responsible for safeguarding the assets of the Company and hence for taking reasonable steps for the prevention and detection of fraud and other irregularities.
The Directors are responsible for the maintenance and integrity of the corporate and financial information included on the Company’s website. Legislation in the United Kingdom governing the preparation and dissemination of financial statements may differ from legislation in other jurisdictions.
RESPONSIBILITY STATEMENTWe confirm that to the best of our knowledge:
> the financial statements, prepared in accordance with the relevant financial reporting framework, give a true and fair view of the assets, liabilities, financial position and profit or loss of the Company and the undertakings included in the consolidation taken as a whole
> the Strategic Report includes a fair review of the development and performance of the business and the position of the Company and the undertakings included in the consolidation taken as a whole, together with a description of the principal risks and uncertainties that they face and
> the Annual Report and financial statements, taken as a whole, are fair, balanced and understandable and provide the information necessary for shareholders to assess the Company’s performance, business model and strategy
By order of the Board
RUPERT PEARCEDirector
8 March 2017
ANNUAL REPORT AND ACCOUNTS 2016 – INMARSAT PLC – 103STRATEGIC REPORT – GOVERNANCE – FINANCIAL STATEMENTS
105 Independent Auditor’s Report to the Members of Inmarsat plc
112 Consolidated financial statements
112 Consolidated income statement
113 Consolidated statement of comprehensive income
114 Consolidated balance sheet
115 Consolidated statement of changes in equity
116 Consolidated cash flow statement
117 Notes to the consolidated financial statements
117 Note 1. General information
117 Note 2. Principal accounting policies
122 Note 3. Financial risk management
123 Note 4. Critical accounting estimates and key judgements
125 Note 5. Segmental information
127 Note 6. Operating profit
128 Note 7. Employee benefit costs
128 Note 8. Key management compensation
129 Note 9. Net financing costs
129 Note 10. Taxation
130 Note 11. Net foreign exchange loss/(gain)
130 Note 12. Dividends
131 Note 13. Property, plant and equipment
132 Note 14. Intangible assets
133 Note 15. Investments
133 Note 16. Cash and cash equivalents
134 Note 17. Trade and other receivables
134 Note 18. Inventories
135 Note 19. Net borrowings
137 Note 20. Trade and other payables
137 Note 21. Provisions
138 Note 22. Current deferred taxation
140 Note 23. Reconciliation of net cash from operations
140 Note 24. Share capital
FINANCIAL STATEMENTS
141 Note 25. Employee share options and awards
143 Note 26. Reserves
144 Note 27. Earnings per share
145 Note 28. Pensions and post-employment benefits
150 Note 29. Operating lease and other commitments
151 Note 30. Capital risk management
152 Note 31. Financial instruments
155 Note 32. Capital commitments
155 Note 33. Contingent liability
156 Note 34. Events after the balance sheet date
156 Note 35. Related party transactions
156 Note 36. Principal subsidiary undertakings
159 Company financial statements
159 Company balance sheet
160 Company statement of changes in equity
161 Notes to the Company financial statements
161 Note A) Principal accounting policies
161 Note B) Income statement
161 Note C) Financial instruments
162 Glossary
164 Additional information
THIS REPORT IS SEPARATED INTO THE FOLLOWING SECTIONS TO AID REVIEW:
104 – INMARSAT PLC – ANNUAL REPORT AND ACCOUNTS 2016

INDEPENDENT AUDITOR’S REPORT TO THE MEMBERS OF INMARSAT PLC
OPINION ON FINANCIAL STATEMENTS OF INMARSAT PLC
IN OUR OPINION:
> the financial statements give a true and fair view of the state of the Group’s and of the Parent Company’s affairs as at 31 December 2016 and of the Group’s profit for the year then ended
> the Group financial statements have been properly prepared in accordance with International Financial Reporting Standards ('IFRS') as adopted by the European Union
> the parent company financial statements have been properly prepared in accordance with United Kingdom Generally Accepted Accounting Practice, including FRS 101 ‘Reduced Disclosure Framework’ and
> the financial statements have been prepared in accordance with the requirements of the Companies Act 2006 and, as regards the Group financial statements, Article 4 of the IAS Regulation
The financial statements that we have audited comprise:
> the Group Income Statement
> the Group Statement of Comprehensive Income
> the Group and Parent Company Balance Sheets
> the Group Cash Flow Statement
> the Group and Parent Company Statements of Changes in Equity and
> the related notes 1 to 36
The financial reporting framework that has been applied in the preparation of the Group financial statements is applicable law and IFRSs as adopted by the European Union. The financial reporting framework that has been applied in the preparation of the Parent Company financial statements is applicable law and United Kingdom Accounting Standards (United Kingdom Generally Accepted Accounting Practice), including FRS 101 ‘Reduced Disclosure Framework’.
SUMMARY OF OUR AUDIT APPROACH
KEY RISKS The key risks that we identified in the current year were:
> Accounting for the Ligado Cooperation Agreement
> Accuracy, completeness and occurrence of manual adjustments to airtime revenue
> ‘Take or Pay’ revenue cut-off
> Accounting for capitalised development expenditure
MATERIALITY The materiality that we used in the current year was $16.7m which was determined on the basis of profit before tax.
SCOPING We have performed full-scope audit procedures for components which contribute over 99% of net assets, revenue and profit before tax.
SIGNIFICANT CHANGES IN OUR APPROACH
Last year our report included the risk involved with the implementation of a new global ERP. This is not included in our report this year as it was completed in 2015. Furthermore, last year we included a risk of accuracy and occurrence of subscription of usage-based airtime services which in 2016 we refined to be focused on manual adjustments to airtime revenue and expanded the risk definition to include the completeness assertion. We have made no other significant changes to our audit approach.
ANNUAL REPORT AND ACCOUNTS 2016 – INMARSAT PLC – 105STRATEGIC REPORT – GOVERNANCE – FINANCIAL STATEMENTS

INDEPENDENT AUDITOR’S REPORT TO THE MEMBERS OF INMARSAT PLC CONTINUED
GOING CONCERN AND THE DIRECTORS’ ASSESSMENT OF THE PRINCIPAL RISKS THAT WOULD THREATEN THE SOLVENCY OR LIQUIDITY OF THE GROUP
As required by the Listing Rules we have reviewed the Directors’ statement regarding the appropriateness of the going concern basis of accounting contained within note 2 to the financial statements and the Directors’ statement on the longer-term viability of the Group contained within the risk management section of the Strategic Report on page 50 .
We are required to state whether we have anything material to add or draw attention to in relation to:
> the Directors' confirmation on pages 50 to 55 that they have carried out a robust assessment of the principal risks facing the Group, including those that would threaten its business model, future performance, solvency or liquidity;
> the disclosures on pages 50 to 55 that describe those risks and explain how they are being managed or mitigated;
> the Directors’ statement in note 2 to the financial statements about whether they considered it appropriate to adopt the going concern basis of accounting in preparing them and their identification of any material uncertainties to the Group’s ability to continue to do so over a period of at least 12 months from the date of approval of the financial statements; and
> the Directors’ explanation on pages 50 to 55 as to how they have assessed the prospects of the Group, over what period they have done so and why they consider that period to be appropriate, and their statement as to whether they have a reasonable expectation that the Group will be able to continue in operation and meet its liabilities as they fall due over the period of their assessment, including any related disclosures drawing attention to any necessary qualifications or assumptions.
We confirm that we have nothing material to add or draw attention to in respect of these matters.
We agreed with the Directors’ adoption of the going concern basis of accounting and we did not identify any such material uncertainties. However, because not all future events or conditions can be predicted, this statement is not a guarantee as to the Group’s ability to continue as a going concern.
INDEPENDENCE
We are required to comply with the Financial Reporting Council’s Ethical Standards for Auditors and confirm that we are independent of the Group and we have fulfilled our other ethical responsibilities in accordance with those standards.
We confirm that we are independent of the Group and we have fulfilled our other ethical responsibilities in accordance with those standards. We also confirm we have not provided any of the prohibited non-audit services referred to in those standards.
OUR ASSESSMENT OF RISKS OF MATERIAL MISSTATEMENTThe assessed risks of material misstatement described below are those that had the greatest effect on our audit strategy, the allocation of resources in the audit and directing the efforts of the engagement team.
Last year our report included the risk involved with the implementation of a new global ERP. This is not included in our report this year as it was completed in 2015. Furthermore, last year we included a risk of accuracy and occurrence of subscription of usage-based airtime services which in 2016 we refined to be focused on manual adjustments to airtime revenue and expanded the risk definition to include the completeness assertion.
Description of risks below should be read in conjunction with the significant issues considered by the Audit Committee discussed on pages 75 to 76.
106 – INMARSAT PLC – ANNUAL REPORT AND ACCOUNTS 2016

ACCOUNTING FOR THE LIGADO (FORMERLY LIGHTSQUARED) COOPERATION AGREEMENT
Risk description The Group continues to hold a material deferred revenue balance of $197.8m (2015: $208.8m) in respect of the Ligado Cooperation Agreement (‘the Agreement’). In March 2016 the agreement was amended resulting in the existing deferred income being recognised against obligations in respect of both Phase 1 and Phase 2 of the Agreement. The Group’s accounting policy in respect of the Agreement is summarised in note 4c to the financial statements.
We have identified a significant risk that the timing and amount of revenue and margin recognition is not in accordance with IFRS with respect to this deferred income since the revenue in respect of Phase 1 of the Agreement is being recognised on a percentage completion basis and the estimate of the future costs to be incurred in respect of Phase 1 are subject to a high degree of estimation uncertainty and management judgement.
Last year our risk also included a cut-off risk in respect of Ligado revenue recognition. Following Ligado’s emergence from Chapter 11 bankruptcy protection in December 2015, this is no longer considered to be a significant risk.
How the scope of our audit responded to the risk
We have tested the design and implementation of controls over the recognition of previously deferred revenue in respect of Phase 1 of the Agreement.
We have obtained and reviewed the amendment to the Agreement, signed in March 2016, and considered whether the deferred income recognised under the amended agreement is in accordance with the principles of IAS 18.
We have met with senior management throughout the year to corroborate our understanding of the commercial developments with Ligado and to understand any potential impact these may have on accounting for the agreement, as well as any technical and commercial developments which may impact the quantum of future costs incurred.
We have obtained and scrutinised management’s analysis of estimated costs to complete, which contains a number of scenarios, challenging the reasonableness of the assumptions which underpin the model and sought evidence to corroborate and understand the key drivers of the calculation through agreeing to third party information where possible and discussions with Inmarsat’s technical specialists and Inmarsat business unit management.
Further, we performed testing on the revenues recognised and recalculated the deferred income released in respect of Phase 2 of the contract to verify that the appropriate amount of revenue was recognised.
Key observations We concur with the conclusions of management’s analysis of the possible scenarios that could unfold over the period of the Ligado contract, along with associated estimates of the costs to complete Phase 1 of the contract under each scenario. Based on the range of cost outcomes indicated by the cost scenarios, we were satisfied that the cost to complete was sufficiently uncertain that no margin should be recognised on Phase 1 of the contract
REVENUE RECOGNITION – ACCURACY, COMPLETENESS AND OCCURRENCE OF MANUAL ADJUSTMENTS TO AIRTIME REVENUE
Risk description Airtime revenue, both subscription and usage-based, is the largest revenue stream within the business. This revenue principally relates to I-3 and I-4 services sold on a wholesale and retail basis, along with the resale of capacity from other satellite providers. Airtime revenue of $822.9m (2015: $845.8m) was earned in the year.
Each month manual postings are made to revenue accounts to adjust for items such as deferred revenue, accrued income, sales provisions, bundled transactions and breakage recognised under take or pay agreements to ensure revenue recognition meets the requirements of IAS 18.
Due to the highly material nature of airtime revenue, the high volume of transactions and the inherent risk that manual postings are susceptible to manipulation, a significant risk has been identified that if these postings are not accurate, complete or related to transactions which have occurred, revenue could be materially misstated.
The accounting policy for the recognition of revenue is set out in note 2 to the financial statements and includes the policies on the deferral of revenue and multiple-element contracts.
How the scope of our audit responded to the risk
We have tested the design, implementation and operating effectiveness of the key automated and manual controls relating to the recognition of airtime revenue across the Group’s principal billing systems.
We have tested the mechanical accuracy of the underlying schedules for a sample of manual postings to determine their completeness and accuracy and whether they are prepared consistently with the principles of IAS 18.
We have met with management, both from within finance and in the market-facing business to discuss results in each business unit and as a whole to evaluate the completeness and occurrence of manual postings. Additionally, we performed a monthly profit margin analysis by product and business unit and a monthly revenue trend analysis, corroborating and understanding unusual variances.
Further, we used subscriber numbers, usage reports and pricing information in order to develop an independent expectation of airtime revenue by product type to compare to airtime revenue recognised in order to assess the completeness, accuracy and occurrence of recorded revenue.
Key observations The results of our audit testing were satisfactory and we reported no findings to the Audit Committee.
ANNUAL REPORT AND ACCOUNTS 2016 – INMARSAT PLC – 107STRATEGIC REPORT – GOVERNANCE – FINANCIAL STATEMENTS
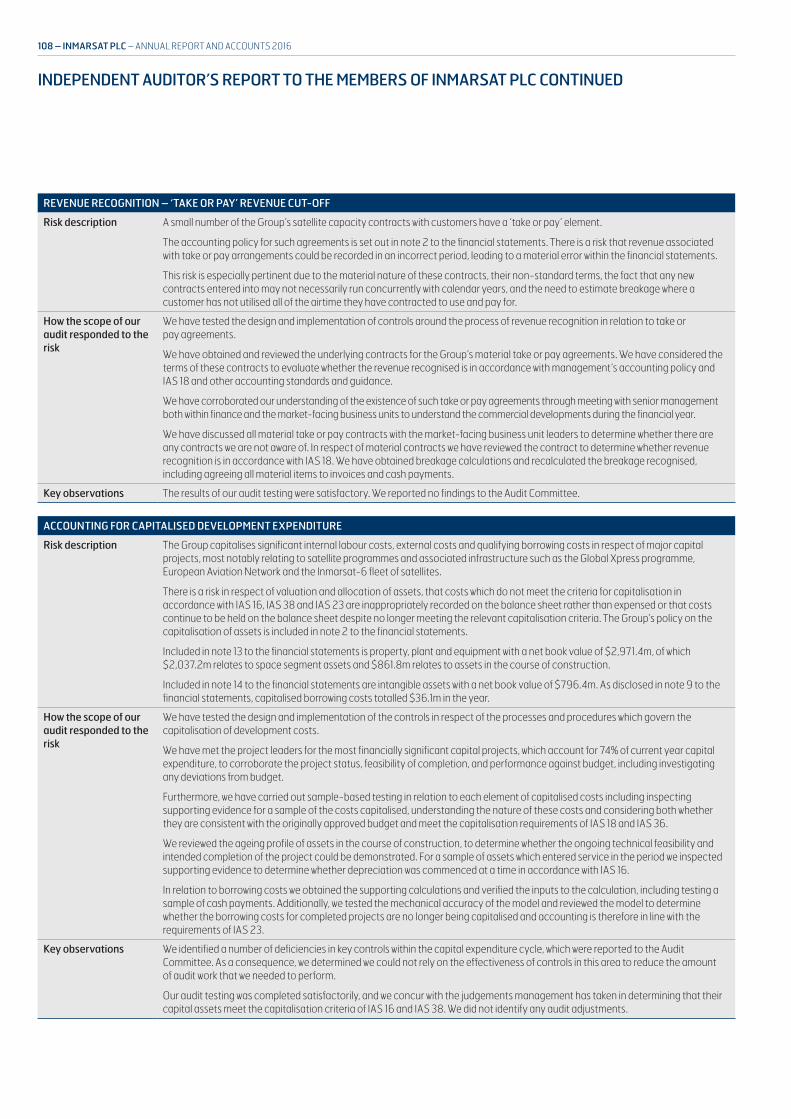
REVENUE RECOGNITION – ‘TAKE OR PAY’ REVENUE CUT-OFF
Risk description A small number of the Group’s satellite capacity contracts with customers have a ‘take or pay’ element.
The accounting policy for such agreements is set out in note 2 to the financial statements. There is a risk that revenue associated with take or pay arrangements could be recorded in an incorrect period, leading to a material error within the financial statements.
This risk is especially pertinent due to the material nature of these contracts, their non-standard terms, the fact that any new contracts entered into may not necessarily run concurrently with calendar years, and the need to estimate breakage where a customer has not utilised all of the airtime they have contracted to use and pay for.
How the scope of our audit responded to the risk
We have tested the design and implementation of controls around the process of revenue recognition in relation to take or pay agreements.
We have obtained and reviewed the underlying contracts for the Group’s material take or pay agreements. We have considered the terms of these contracts to evaluate whether the revenue recognised is in accordance with management’s accounting policy and IAS 18 and other accounting standards and guidance.
We have corroborated our understanding of the existence of such take or pay agreements through meeting with senior management both within finance and the market-facing business units to understand the commercial developments during the financial year.
We have discussed all material take or pay contracts with the market-facing business unit leaders to determine whether there are any contracts we are not aware of. In respect of material contracts we have reviewed the contract to determine whether revenue recognition is in accordance with IAS 18. We have obtained breakage calculations and recalculated the breakage recognised, including agreeing all material items to invoices and cash payments.
Key observations The results of our audit testing were satisfactory. We reported no findings to the Audit Committee.
ACCOUNTING FOR CAPITALISED DEVELOPMENT EXPENDITURE
Risk description The Group capitalises significant internal labour costs, external costs and qualifying borrowing costs in respect of major capital projects, most notably relating to satellite programmes and associated infrastructure such as the Global Xpress programme, European Aviation Network and the Inmarsat-6 fleet of satellites.
There is a risk in respect of valuation and allocation of assets, that costs which do not meet the criteria for capitalisation in accordance with IAS 16, IAS 38 and IAS 23 are inappropriately recorded on the balance sheet rather than expensed or that costs continue to be held on the balance sheet despite no longer meeting the relevant capitalisation criteria. The Group’s policy on the capitalisation of assets is included in note 2 to the financial statements.
Included in note 13 to the financial statements is property, plant and equipment with a net book value of $2,971.4m, of which $2,037.2m relates to space segment assets and $861.8m relates to assets in the course of construction.
Included in note 14 to the financial statements are intangible assets with a net book value of $796.4m. As disclosed in note 9 to the financial statements, capitalised borrowing costs totalled $36.1m in the year.
How the scope of our audit responded to the risk
We have tested the design and implementation of the controls in respect of the processes and procedures which govern the capitalisation of development costs.
We have met the project leaders for the most financially significant capital projects, which account for 74% of current year capital expenditure, to corroborate the project status, feasibility of completion, and performance against budget, including investigating any deviations from budget.
Furthermore, we have carried out sample-based testing in relation to each element of capitalised costs including inspecting supporting evidence for a sample of the costs capitalised, understanding the nature of these costs and considering both whether they are consistent with the originally approved budget and meet the capitalisation requirements of IAS 18 and IAS 36.
We reviewed the ageing profile of assets in the course of construction, to determine whether the ongoing technical feasibility and intended completion of the project could be demonstrated. For a sample of assets which entered service in the period we inspected supporting evidence to determine whether depreciation was commenced at a time in accordance with IAS 16.
In relation to borrowing costs we obtained the supporting calculations and verified the inputs to the calculation, including testing a sample of cash payments. Additionally, we tested the mechanical accuracy of the model and reviewed the model to determine whether the borrowing costs for completed projects are no longer being capitalised and accounting is therefore in line with the requirements of IAS 23.
Key observations We identified a number of deficiencies in key controls within the capital expenditure cycle, which were reported to the Audit Committee. As a consequence, we determined we could not rely on the effectiveness of controls in this area to reduce the amount of audit work that we needed to perform.
Our audit testing was completed satisfactorily, and we concur with the judgements management has taken in determining that their capital assets meet the capitalisation criteria of IAS 16 and IAS 38. We did not identify any audit adjustments.
INDEPENDENT AUDITOR’S REPORT TO THE MEMBERS OF INMARSAT PLC CONTINUED
108 – INMARSAT PLC – ANNUAL REPORT AND ACCOUNTS 2016

These matters were addressed in the context of our audit of the financial statements as a whole, and in forming our opinion thereon, and we do not provide a separate opinion on these matters.
OUR APPLICATION OF MATERIALITYWe define materiality as the magnitude of misstatement in the financial statements that makes it probable that the economic decisions of a reasonably knowledgeable person would be changed or influenced. We use materiality both in planning the scope of our audit work and in evaluating the results of our work.
Based on our professional judgement, we determined materiality for the financial statements as a whole as follows:
GROUP MATERIALITY $16.7m (2015: $12.4m)
BASIS FOR DETERMINING MATERIALITY
We determined materiality based on 5% of forecast profit before tax (2015: 5%), which resulted in 6% of actual profit before tax (2015: 5%) or 1% of equity (2015: less than 1%).
RATIONALE FOR THE BENCHMARK APPLIED
Pre-tax profit has been chosen as the basis for determining materiality as we determine this to be the most relevant measure to users of the financial statements. In previous years we adjusted this base to remove the impact of the earnings volatility arising from the revenue and costs associated with the Ligado Cooperation Agreement. Given that revenues under Phase 2 of the agreement now represent a recurring multi-year revenue stream we concluded that their inclusion in our determination of materiality is now appropriate.
We agreed with the Audit Committee that we would report to the Committee all audit differences in excess of $825,000 (2015: $250,000), as well as differences below that threshold that, in our view, warranted reporting on qualitative grounds. We also report to the Audit Committee on disclosure matters that we identify when assessing the overall presentation of the financial statements.
AN OVERVIEW OF THE SCOPE OF OUR AUDITOur Group audit was scoped by obtaining an understanding of the Group and its environment, including Group-wide controls, and assessing the risks of material misstatement at the Group level. Based on that assessment, we focused our Group audit scope primarily on the audit work performed in the following locations:
> London, United Kingdom
> St. John’s, Canada and
> Reston, United States
With the exception of one specific part of the US Government business, where we used a component audit team, we performed the Group audit with one integrated audit team led from London. The supervision of the audit team included the London team visiting the members of the audit team located in St. John’s and Reston.
We determined there to be three components in the Group, as follows:
> the core Inmarsat business unit headquartered in London
> the US Government retail business in Reston and
> non-core entities which are not included on the Group’s global accounting software, which includes TC Communications based in Sydney, Australia
The US Government retail business and non-core entities are considered to be separate components as they had a separate financial control environment during the year. The core Inmarsat and US Government components were subject to a full scope audit, whilst limited procedures were performed on the non-core component due to its relative financial significance.
PROFIT BEFORE TAX$299.2m
GROUP MATERIALITY$16.7m
Normalised profit before tax Materiality
Group materiality $16.7m
Component materiality range $5m to $15m
Audit Committee reporting threshold $0.825m
ANNUAL REPORT AND ACCOUNTS 2016 – INMARSAT PLC – 109STRATEGIC REPORT – GOVERNANCE – FINANCIAL STATEMENTS

The components subject to a full scope audit represent the principal business units and account for 99.9% (2015: 99.7%) of the Group’s net assets, 99.7% (2015: 99.3%) of the Group’s revenue and 99.4% (2015: 99.4%) of the Group’s profit before tax. They were also selected to provide an appropriate basis for undertaking audit work to address the risks of material misstatement identified above. Our audit work at the three locations was executed at levels of materiality which were lower than Group materiality and ranged from $5.0m to $15.0m (2015: $5m to $11.1m).
The scope of our audit also included consideration of the Group’s longer-term viability statement, which was prepared in accordance with the UK Corporate Governance Code. Our conclusions in respect of this work are set out above.
At the Parent Company level we also tested the consolidation process and carried out analytical procedures to confirm our conclusion that there were no significant risks of material misstatement of the aggregated financial information of the remaining components not subject to audit or audit of specified account balances.
The Senior statutory auditor visited the US Government component in the current year. For this component we involved the component audit partner and manager in our team briefing, discussed their risk assessment and reviewed documentation of the findings from their work.
OPINION ON OTHER MATTERS PRESCRIBED BY THE COMPANIES ACT 2006In our opinion, based on the work undertaken in the course of the audit:
> the part of the Directors’ Remuneration Report to be audited has been properly prepared in accordance with the Companies Act 2006
> the information given in the Strategic Report and the Directors’ Report for the financial year for which the financial statements are prepared is consistent with the financial statements and
> the Strategic Report and the Directors’ Report have been prepared in accordance with applicable legal requirements
In the light of the knowledge and understanding of the Company and its environment obtained in the course of the audit, we have not identified any material misstatements in the Strategic Report and the Directors’ Report.
MATTERS ON WHICH WE ARE REQUIRED TO REPORT BY EXCEPTION
Adequacy of explanations received and accounting records
Under the Companies Act 2006 we are required to report to you if, in our opinion:
> we have not received all the information and explanations we require for our audit or
> adequate accounting records have not been kept by the Parent Company, or returns adequate for our audit have not been received from branches not visited by us or
> the Parent Company financial statements are not in agreement with the accounting records and returns
We have nothing to report in respect of these matters.
Directors’ remuneration
Under the Companies Act 2006 we are also required to report if in our opinion certain disclosures of Directors’ remuneration have not been made or the part of the Directors’ Remuneration Report to be audited is not in agreement with the accounting records and returns.
We have nothing to report arising from these matters
Corporate Governance Statement
Under the Listing Rules we are also required to review part of the Corporate Governance Statement relating to the Company’s compliance with certain provisions of the UK Corporate Governance Code.
We have nothing to report arising from these matters
Our duty to read other information in the Annual Report
Under International Standards on Auditing (UK and Ireland), we are required to report to you if, in our opinion, information in the Annual Report is:
> materially inconsistent with the information in the audited financial statements or
> apparently materially incorrect based on, or materially inconsistent with, our knowledge of the Group acquired in the course of performing our audit or
> otherwise misleading
In particular, we are required to consider whether we have identified any inconsistencies between our knowledge acquired during the audit and the Directors’ statement that they consider the Annual Report is fair, balanced and understandable and whether the Annual Report appropriately discloses those matters that we communicated to the Audit Committee which we consider should have been disclosed.
We confirm that we have not identified any such inconsistencies or misleading statements.
INDEPENDENT AUDITOR’S REPORT TO THE MEMBERS OF INMARSAT PLC CONTINUED
110 – INMARSAT PLC – ANNUAL REPORT AND ACCOUNTS 2016

RESPECTIVE RESPONSIBILITIES OF DIRECTORS AND AUDITORAs explained more fully in the Directors’ Responsibilities Statement, the Directors are responsible for the preparation of the financial statements and for being satisfied that they give a true and fair view. Our responsibility is to audit and express an opinion on the financial statements in accordance with applicable law and International Standards on Auditing (UK and Ireland). We also comply with International Standard on Quality Control 1 (UK and Ireland). Our audit methodology and tools aim to ensure that our quality control procedures are effective, understood and applied. Our quality controls and systems include our dedicated professional standards review team and independent partner reviews.
This report is made solely to the Company’s members, as a body, in accordance with Chapter 3 of Part 16 of the Companies Act 2006. Our audit work has been undertaken so that we might state to the Company’s members those matters we are required to state to them in an auditor’s report and for no other purpose. To the fullest extent permitted by law, we do not accept or assume responsibility to anyone other than the Company and the Company’s members as a body, for our audit work, for this report, or for the opinions we have formed.
SCOPE OF THE AUDIT OF THE FINANCIAL STATEMENTSAn audit involves obtaining evidence about the amounts and disclosures in the financial statements sufficient to give reasonable assurance that the financial statements are free from material misstatement, whether caused by fraud or error. This includes an assessment of: whether the accounting policies are appropriate to the Group’s and the Parent Company’s circumstances and have been consistently applied and adequately disclosed; the reasonableness of significant accounting estimates made by the Directors; and the overall presentation of the financial statements. In addition, we read all the financial and non-financial information in the Annual Report to identify material inconsistencies with the audited financial statements and to identify any information that is apparently materially incorrect based on, or materially inconsistent with, the knowledge acquired by us in the course of performing the audit. If we become aware of any apparent material misstatements or inconsistencies we consider the implications for our report.
PAUL FRANEK FCASenior Statutory Auditor
for and on behalf of Deloitte LLP Chartered Accountants and Statutory Auditor London, United Kingdom
8 March 2017
ANNUAL REPORT AND ACCOUNTS 2016 – INMARSAT PLC – 111STRATEGIC REPORT – GOVERNANCE – FINANCIAL STATEMENTS

($ in millions) Note 2016 2015
Revenues 1,329.0 1,274.1
Employee benefit costs 7 (267.7) (260.4)
Network and satellite operations costs (168.6) (180.0)
Other operating costs (139.9) (147.2)
Own work capitalised 42.0 39.5
Total net operating costs (534.2) (548.1)
EBITDA 794.8 726.0
Depreciation and amortisation 6 (349.4) (311.2)
Gain on disposal1 0.5 9.3
Impairment loss 6 (1.2) (0.2)
Share of profit of associates 15 2.4 2.5
Operating profit 447.1 426.4
Financing income 9 4.3 1.8
Financing cost 9 (123.4) (90.2)
Change in fair value of derivative2 (28.8) –
Net financing costs 9 (147.9) (88.4)
Profit before tax 299.2 338.0
Taxation charge 10 (55.8) (56.0)
Profit for the year 243.4 282.0
Attributable to:
Equity holders 242.8 281.4
Non-controlling interest3 0.6 0.6
Earnings per share for profit attributable to the equity holders of the Company (expressed in $ per share)
– Basic 27 0.54 0.63
– Diluted 27 0.53 0.62
Adjusted earnings per share for profit attributable to the equity holders of the Company (expressed in $ per share)
– Basic 27 0.65 0.63
– Diluted 27 0.64 0.62
1 The gain on disposal of assets in the prior year relates primarily to the gain on disposal of the SkyWave investment. 2 The change in fair value of derivatives relates to the mark-to-market valuation of the conversion liability component of the new convertible bonds due 2023. 3 Non-controlling interest relates to the Group's 51% shareholding in Inmarsat Solutions ehf.
CONSOLIDATED INCOME STATEMENTFOR THE YEAR ENDED 31 DECEMBER 2016
112 – INMARSAT PLC – ANNUAL REPORT AND ACCOUNTS 2016

($ in millions) Note 2016 2015
Profit for the year 243.4 282.0
Other comprehensive income/(loss)
Items that may be reclassified subsequently to the income statement:
Transfer to income statement on disposal of available-for-sale financial asset – (9.4)
Foreign exchange translation differences 0.1 (0.7)
Net (loss)/gain on cash flow hedges 26 (24.3) 2.9
Tax credited directly to equity 10 0.1 1.0
Items that will not be reclassified subsequently to the income statement:
Remeasurement of the defined benefit asset and post-employment benefits 28 (13.4) 3.0
Tax credited/(charged) directly to equity 10 2.6 (0.6)
Other comprehensive loss, net of tax (34.9) (3.8)
Total comprehensive income, net of tax 208.5 278.2
Attributable to:
Equity holders 207.9 277.6
Non-controlling interest 0.6 0.6
CONSOLIDATED STATEMENT OF COMPREHENSIVE INCOMEFOR THE YEAR ENDED 31 DECEMBER 2016
ANNUAL REPORT AND ACCOUNTS 2016 – INMARSAT PLC – 113STRATEGIC REPORT – GOVERNANCE – FINANCIAL STATEMENTS
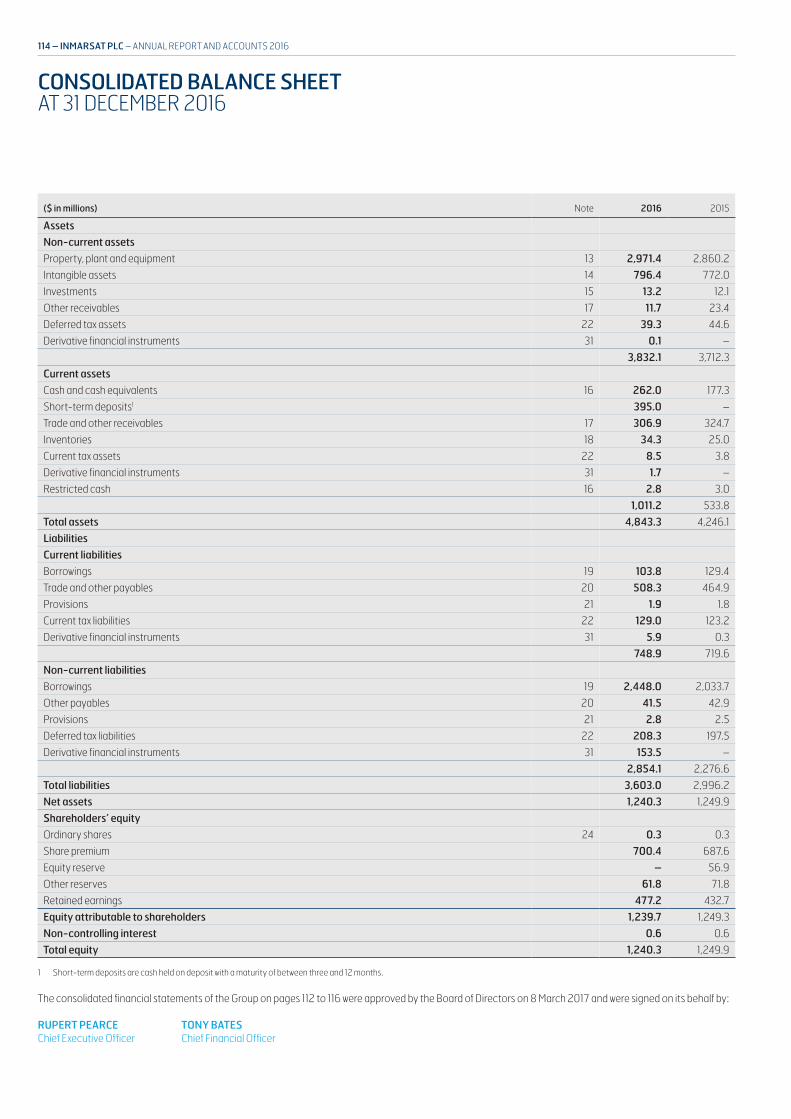
($ in millions) Note 2016 2015
Assets
Non-current assets
Property, plant and equipment 13 2,971.4 2,860.2
Intangible assets 14 796.4 772.0
Investments 15 13.2 12.1
Other receivables 17 11.7 23.4
Deferred tax assets 22 39.3 44.6
Derivative financial instruments 31 0.1 –
3,832.1 3,712.3
Current assets
Cash and cash equivalents 16 262.0 177.3
Short-term deposits1 395.0 –
Trade and other receivables 17 306.9 324.7
Inventories 18 34.3 25.0
Current tax assets 22 8.5 3.8
Derivative financial instruments 31 1.7 –
Restricted cash 16 2.8 3.0
1,011.2 533.8
Total assets 4,843.3 4,246.1
Liabilities
Current liabilities
Borrowings 19 103.8 129.4
Trade and other payables 20 508.3 464.9
Provisions 21 1.9 1.8
Current tax liabilities 22 129.0 123.2
Derivative financial instruments 31 5.9 0.3
748.9 719.6
Non-current liabilities
Borrowings 19 2,448.0 2,033.7
Other payables 20 41.5 42.9
Provisions 21 2.8 2.5
Deferred tax liabilities 22 208.3 197.5
Derivative financial instruments 31 153.5 –
2,854.1 2,276.6
Total liabilities 3,603.0 2,996.2
Net assets 1,240.3 1,249.9
Shareholders’ equity
Ordinary shares 24 0.3 0.3
Share premium 700.4 687.6
Equity reserve – 56.9
Other reserves 61.8 71.8
Retained earnings 477.2 432.7
Equity attributable to shareholders 1,239.7 1,249.3
Non-controlling interest 0.6 0.6
Total equity 1,240.3 1,249.9
1 Short-term deposits are cash held on deposit with a maturity of between three and 12 months.
The consolidated financial statements of the Group on pages 112 to 116 were approved by the Board of Directors on 8 March 2017 and were signed on its behalf by:
RUPERT PEARCE TONY BATESChief Executive Officer Chief Financial Officer
CONSOLIDATED BALANCE SHEETAT 31 DECEMBER 2016
114 – INMARSAT PLC – ANNUAL REPORT AND ACCOUNTS 2016
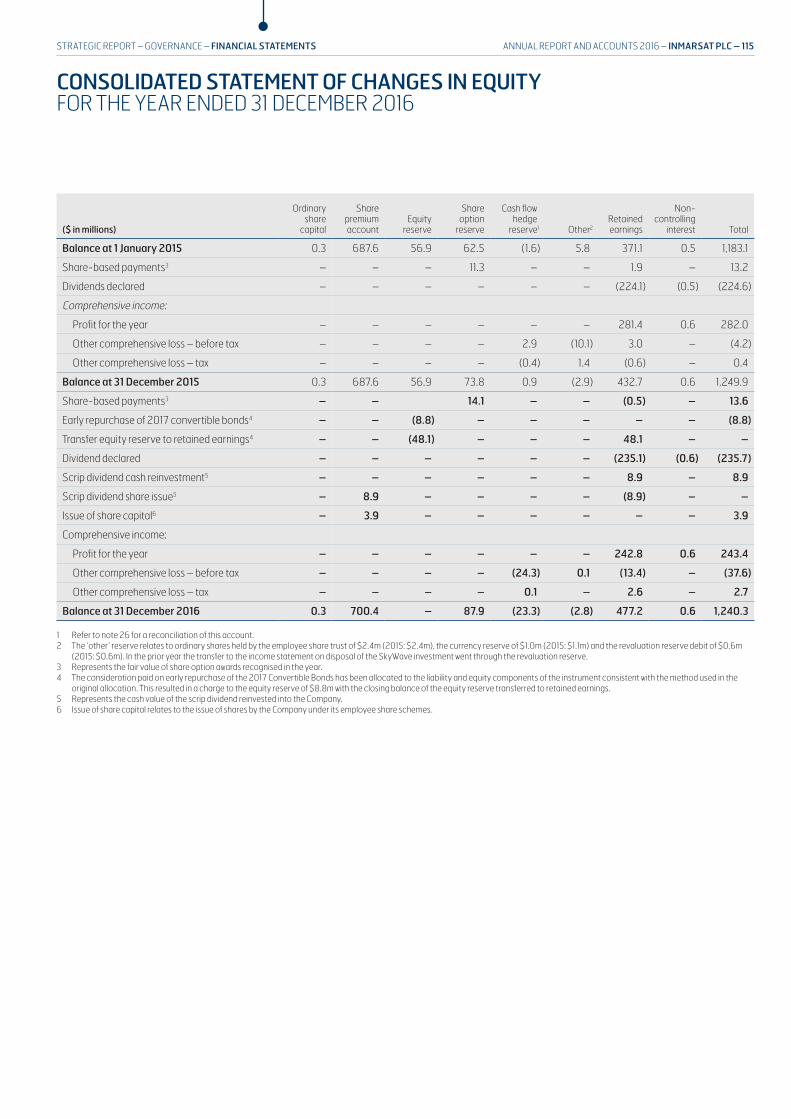
($ in millions)
Ordinary share
capital
Sharepremiumaccount
Equityreserve
Shareoption
reserve
Cash flowhedge
reserve1 Other2Retainedearnings
Non-controlling
interest Total
Balance at 1 January 2015 0.3 687.6 56.9 62.5 (1.6) 5.8 371.1 0.5 1,183.1
Share-based payments3 – – – 11.3 – – 1.9 – 13.2
Dividends declared – – – – – – (224.1) (0.5) (224.6)
Comprehensive income:
Profit for the year – – – – – – 281.4 0.6 282.0
Other comprehensive loss – before tax – – – – 2.9 (10.1) 3.0 – (4.2)
Other comprehensive loss – tax – – – – (0.4) 1.4 (0.6) – 0.4
Balance at 31 December 2015 0.3 687.6 56.9 73.8 0.9 (2.9) 432.7 0.6 1,249.9
Share-based payments3 – – 14.1 – – (0.5) – 13.6
Early repurchase of 2017 convertible bonds4 – – (8.8) – – – – – (8.8)
Transfer equity reserve to retained earnings4 – – (48.1) – – – 48.1 – –
Dividend declared – – – – – – (235.1) (0.6) (235.7)
Scrip dividend cash reinvestment5 – – – – – – 8.9 – 8.9
Scrip dividend share issue5 – 8.9 – – – – (8.9) – –
Issue of share capital6 – 3.9 – – – – – – 3.9
Comprehensive income:
Profit for the year – – – – – – 242.8 0.6 243.4
Other comprehensive loss – before tax – – – – (24.3) 0.1 (13.4) – (37.6)
Other comprehensive loss – tax – – – – 0.1 – 2.6 – 2.7
Balance at 31 December 2016 0.3 700.4 – 87.9 (23.3) (2.8) 477.2 0.6 1,240.3
1 Refer to note 26 for a reconciliation of this account. 2 The ‘other’ reserve relates to ordinary shares held by the employee share trust of $2.4m (2015: $2.4m), the currency reserve of $1.0m (2015: $1.1m) and the revaluation reserve debit of $0.6m
(2015: $0.6m). In the prior year the transfer to the income statement on disposal of the SkyWave investment went through the revaluation reserve.3 Represents the fair value of share option awards recognised in the year. 4 The consideration paid on early repurchase of the 2017 Convertible Bonds has been allocated to the liability and equity components of the instrument consistent with the method used in the
original allocation. This resulted in a charge to the equity reserve of $8.8m with the closing balance of the equity reserve transferred to retained earnings.5 Represents the cash value of the scrip dividend reinvested into the Company.6 Issue of share capital relates to the issue of shares by the Company under its employee share schemes.
CONSOLIDATED STATEMENT OF CHANGES IN EQUITYFOR THE YEAR ENDED 31 DECEMBER 2016
ANNUAL REPORT AND ACCOUNTS 2016 – INMARSAT PLC – 115STRATEGIC REPORT – GOVERNANCE – FINANCIAL STATEMENTS
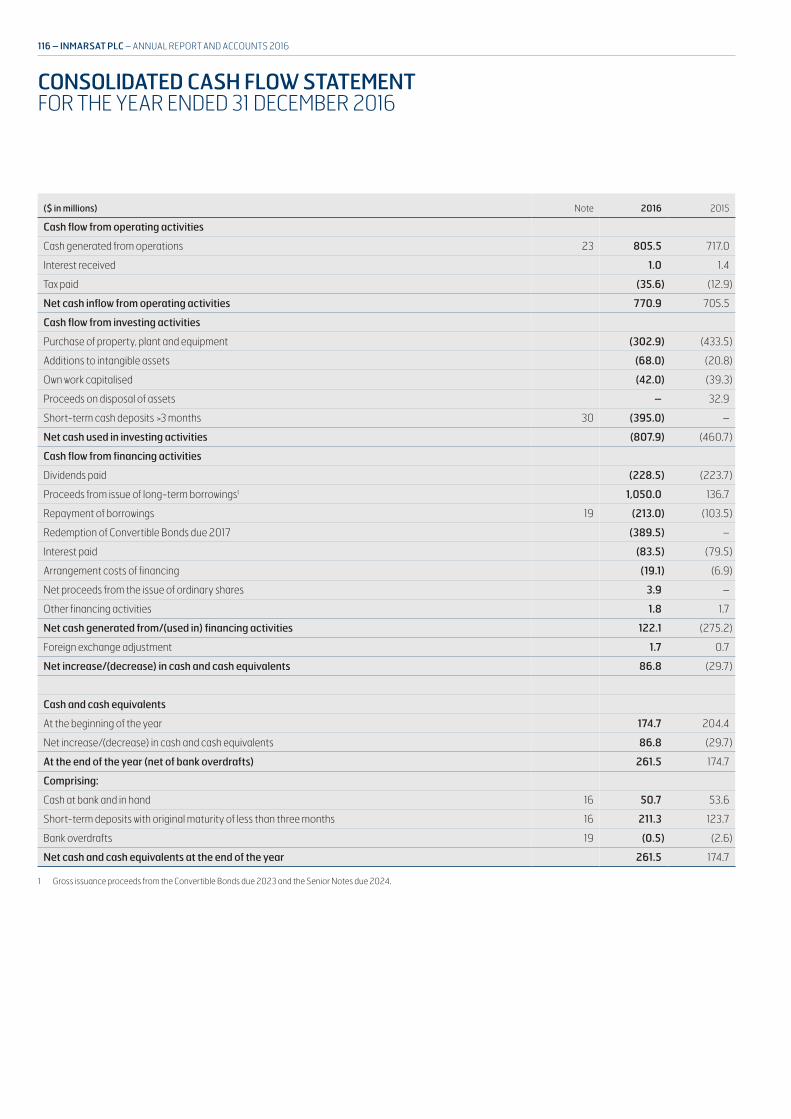
($ in millions) Note 2016 2015
Cash flow from operating activities
Cash generated from operations 23 805.5 717.0
Interest received 1.0 1.4
Tax paid (35.6) (12.9)
Net cash inflow from operating activities 770.9 705.5
Cash flow from investing activities
Purchase of property, plant and equipment (302.9) (433.5)
Additions to intangible assets (68.0) (20.8)
Own work capitalised (42.0) (39.3)
Proceeds on disposal of assets – 32.9
Short-term cash deposits >3 months 30 (395.0) –
Net cash used in investing activities (807.9) (460.7)
Cash flow from financing activities
Dividends paid (228.5) (223.7)
Proceeds from issue of long-term borrowings1 1,050.0 136.7
Repayment of borrowings 19 (213.0) (103.5)
Redemption of Convertible Bonds due 2017 (389.5) –
Interest paid (83.5) (79.5)
Arrangement costs of financing (19.1) (6.9)
Net proceeds from the issue of ordinary shares 3.9 –
Other financing activities 1.8 1.7
Net cash generated from/(used in) financing activities 122.1 (275.2)
Foreign exchange adjustment 1.7 0.7
Net increase/(decrease) in cash and cash equivalents 86.8 (29.7)
Cash and cash equivalents
At the beginning of the year 174.7 204.4
Net increase/(decrease) in cash and cash equivalents 86.8 (29.7)
At the end of the year (net of bank overdrafts) 261.5 174.7
Comprising:
Cash at bank and in hand 16 50.7 53.6
Short-term deposits with original maturity of less than three months 16 211.3 123.7
Bank overdrafts 19 (0.5) (2.6)
Net cash and cash equivalents at the end of the year 261.5 174.7
1 Gross issuance proceeds from the Convertible Bonds due 2023 and the Senior Notes due 2024.
CONSOLIDATED CASH FLOW STATEMENTFOR THE YEAR ENDED 31 DECEMBER 2016
116 – INMARSAT PLC – ANNUAL REPORT AND ACCOUNTS 2016
1. GENERAL INFORMATIONInmarsat plc (the ‘Company’ or, together with its subsidiaries, the ‘Group’) is a company incorporated in the United Kingdom and domiciled in England and Wales. The address of its registered office is 99 City Road, London EC1Y 1AX, United Kingdom.
2. PRINCIPAL ACCOUNTING POLICIESThe principal accounting policies adopted in the preparation of these financial statements are set out below. These policies have been applied consistently to all the years presented unless otherwise stated.
BASIS OF PREPARATION
These financial statements have been prepared in accordance with International Financial Reporting Standards (‘IFRS’) as adopted by the European Union, the Companies Act 2006 and Article 4 of the EU IAS Regulation. The financial statements have been prepared under the historical cost convention except for certain financial instruments that have been measured at fair value, as described later in these accounting policies.
GOING CONCERN
The Group has a robust and resilient business model, strong free cash flow generation and is compliant with all banking covenants. Because of this, the Directors believe that the Company and the Group are well-placed to manage its business risks successfully. After considering current financial projections and facilities available and after making enquiries, the Directors have a reasonable expectation that the Company and the Group have adequate resources to continue in operational existence for the foreseeable future. Accordingly, Inmarsat plc continues to adopt the going concern basis in preparing the consolidated financial statements.
Further discussion of the Group’s business activities, together with factors likely to affect its future development, performance and position are set out in the Strategic Report which encompasses the Chairman’s review, the Chief Executive’s review, the Financial review and the viability statement on pages 1 to 55.
BASIS OF ACCOUNTING
The consolidated financial statements are presented in US Dollars, which is the functional currency of the Company and most of the Group’s subsidiaries. The preparation of the consolidated financial statements in conformity with IFRS requires management to make estimates and assumptions that affect the reported amounts of assets and liabilities and disclosure of contingent assets and liabilities at the balance sheet date and the reported amounts of revenue and expenses during the year. Although these estimates are based on management’s best estimate of the amount, event or actions, the actual results ultimately may differ from these estimates. Further discussion on these estimates and assumptions are disclosed in note 4.
ACCOUNTING POLICY CHANGES
New and amended accounting standards adopted by the Group
There are no new IFRS or IFRIC Interpretations that are effective for this financial year that have had a material impact on the Group.
New and amended accounting standards that have been issued but are not yet effective and have not been early adopted
IFRS 15 ‘Revenue from contracts with customers’
IFRS 15 ‘Revenue from contracts with customers’ will be effective for periods beginning on or after 1 January 2018, subject to endorsement by the EU.
The standard sets out the requirements for recognising revenue from contracts with customers, and will supersede the current revenue recognition guidance including IAS 18 ‘Revenue’, IAS 11 ‘Construction Contracts’ and the related interpretations.
IFRS 15 will require the Group to apportion revenue earned from contracts to each deliverable that qualifies as a ‘performance obligation’. The total transaction price must be allocated to each performance obligation on a relative stand-alone selling price basis, based on a five-step model.
IFRS 15 contains guidance on a variety of areas, many of which are relevant to the Group, including determining the relevant ‘contract’ for IFRS 15 purposes, how to account for transactions in the indirect sales channel (such as wholesale transactions), agent versus principal considerations, unbundling of contracts that contain more than one performance obligation, assessing when control passes to a customer and identifying costs to obtain and fulfil contracts.
Management is currently undergoing a detailed review of the impact of adopting IFRS 15. An area which is likely to be impacted for the Group is breakage, where applying IFRS 15 is expected to result in the earlier recognition of breakage revenues for quarterly, semi-annual and annual allowance plans. Based on the findings of the review, neither this area nor any other is expected to result in material changes to the financial statements in future periods.
When IFRS 15 is adopted, it can be applied either on a fully retrospective basis, requiring the restatement of the comparative periods presented in the financial statements, or with the cumulative retrospective impact of IFRS 15 applied as an adjustment to equity on the date of adoption. The Group currently intends to adopt the full retrospective approach and from 1 January 2018 will show comparative figures for the December 2017 financial year under IFRS 15.
IFRS 16 ‘Leases’
IFRS 16 ‘Leases’ will be effective for periods beginning on or after 1 January 2019, subject to endorsement by the EU. The standard sets out requirements for recognising assets and liabilities in respect of leases, and will supersede the existing accounting guidance in IAS 17 ‘Leases’ and the related interpretations.
IFRS 16 will primarily change lease accounting for lessees; lease agreements will give rise to the recognition of an asset representing the right to use the leased item and a loan obligation for future lease payables. Lease costs will be recognised in the form of depreciation of the right to use asset and interest on the lease liability. Lessee accounting under IFRS 16 will be similar to existing IAS 17 accounting for finance leases, but will be substantively different for operating leases where rental charges are currently recognised on straight-line basis and no lease asset or lease loan obligation is recognised.
Lessor accounting under IFRS 16 is similar to existing IAS 17 accounting.
The Group is assessing the impact of the accounting changes that will arise under IFRS 16; however, the changes are expected to have a material impact on the consolidated income statement (being a reclassification between operating expenses and depreciation charge) and the consolidated balance sheet (the recognition of a right of use asset and lease liability).
The Group has not yet decided whether to adopt IFRS 16 when IFRS 15 is adopted, on 1 January 2018, or on 1 January 2019.
IFRS 9 ‘Financial Instruments’
IFRS 9 ‘Financial Instruments’ will be effective for periods beginning on or after 1 January 2018 and supersedes IAS 39 ‘Financial Instruments: Recognition and Measurement’. The standard will impact the classification and measurement of the Group’s financial instruments and will require certain additional disclosures. The changes to recognition and measurement of financial instruments and changes to hedge accounting rules are not currently considered likely to have any major impact on the Group’s current accounting treatment or hedging activities. The Group has not yet decided whether to early adopt IFRS 9.
NOTES TO THE CONSOLIDATED FINANCIAL STATEMENTS
ANNUAL REPORT AND ACCOUNTS 2016 – INMARSAT PLC – 117STRATEGIC REPORT – GOVERNANCE – FINANCIAL STATEMENTS

BASIS OF CONSOLIDATION
The consolidated financial statements include the financial statements of the Company and all its subsidiaries, and incorporate the share of the results of associates using the equity method of accounting.
The results of subsidiary undertakings established or acquired during the period are included in the consolidated income statement from the date of establishment or acquisition of control. The results of subsidiary undertakings disposed of during the period are included until the date of disposal. Where necessary, adjustments are made to the financial statements of subsidiaries to bring the accounting policies used into line with those used by the Group. All transactions, balances, income and expenses with and between subsidiary undertakings have been eliminated on consolidation.
Non-controlling interests in the net assets of consolidated subsidiaries which consist of the amounts of those interests at the date of the original business combination and the non-controlling interests’ share of changes in equity since the date of the combination, are not material to the Group’s financial statements.
Proxy Board arrangement
The US Government element of Inmarsat’s Government business unit is managed through the US trading entity, Inmarsat Government Inc., a wholly-owned subsidiary of the Group. The business is managed through a Proxy agreement as required by the US National Industrial Security Program (‘NISP’).
A Proxy agreement is an instrument intended to mitigate the risk of foreign ownership, control or influence when a foreign person owns, acquires or merges with a US entity that has a facility security clearance under the NISP. The Proxy agreement conveys the foreign owner’s voting rights to the Proxy Holders, comprised of the Proxy board. There are three Proxy holders who are US citizens cleared and approved by the US Defence Security Service (‘DSS’). The DSS requires Inmarsat Government Inc. to enter into a Proxy agreement because it is indirectly owned by the Group and it has contracts with the Department of Defence which contain certain classified information. The Proxy agreement enables Inmarsat Government Inc. to participate in such contracts with the US Government despite being owned by a non-US corporation.
Under the Proxy agreement, the Proxy holders have the power to exercise all privileges of share ownership of Inmarsat Government Inc. In addition, as a result of the Proxy agreement, certain limitations are placed on the information which may be shared, and the interaction which may occur, between Inmarsat Government Inc. and other Group companies.
The Group maintains its involvement in Inmarsat Government Inc.’s activities through normal business activity and liaison with the Chair of the Proxy Board. Inmarsat Government Inc.’s commercial and governance activity is included in the business update provided in regular Executive reports to the Board. This activity is always subject to the confines of the Proxy regime to ensure that it meets the requirement that Inmarsat Government Inc. must conduct its business affairs without external control or influence, and the requirements necessary to protect the US national security interest.
In accordance with IFRS 10 ‘Consolidated financial statements’, an assessment is required to determine the degree of control or influence the Group exercises and the form of any control to ensure that the financial statement treatment is appropriate. On the basis of the Group’s ability to affect the financial and operating policies of the entity, we have concluded that the Group meets the requirements of IFRS 10 in respect of control over the entity and, therefore, consolidates the entity in the Group’s consolidated accounts.
BUSINESS COMBINATIONS
Business combinations are accounted for using the acquisition method. When the Group acquires a business, it identifies the assets and liabilities of the acquiree at the date of acquisition and measures them at fair value. Only separately identifiable intangible assets are recognised. Any assets or disposal groups held for sale at the acquisition date are measured at fair value less costs to sell.
Consideration is the fair value at the acquisition date of the assets transferred and liabilities incurred in acquiring the business and includes the fair value of any contingent consideration. Changes in fair value of contingent consideration after the acquisition date are recognised in the income statement. Acquisition-related costs are expensed as incurred and included in operating costs.
Goodwill is initially measured at cost as the difference between the fair value of the consideration for the acquisition and fair value of the net identifiable assets acquired, including any intangible assets other than goodwill. If the assessment of goodwill results in an excess of the fair value of net assets acquired over the aggregate consideration transferred, then the gain is recognised in the income statement. After initial recognition, goodwill is measured at cost less any accumulated impairment losses. For the purpose of impairment testing, goodwill is allocated to each of the Group’s cash-generating units (‘CGUs’) that are expected to benefit from the business combination, irrespective of whether other assets or liabilities of the acquiree are assigned to those units.
FOREIGN CURRENCY TRANSLATION
The functional currency of the Company and most of the Group’s subsidiaries and the presentation currency of the Group is US Dollar, as the majority of operational transactions are denominated in US Dollars.
Foreign currency transactions are translated into the functional currency using the exchange rates prevailing at the date of the transaction. Foreign exchange gains and losses resulting from the settlement of transactions and the translation of monetary assets and liabilities denominated in foreign currencies at period end exchange rates are recognised in the income statement line which most appropriately reflects the nature of the item or transactions.
REVENUE
Mobile satellite communications services revenue results from utilisation charges that are recognised as revenue in the period during which the services are provided. Deferred income attributable to mobile satellite communications services or subscription fees represents the unearned balances remaining from amounts received from customers pursuant to prepaid contracts. Revenue from the sale of prepaid credit is deferred until such time as the customer uses the airtime, or the credit expires. The Group also enters into minimum spend contracts with customers, known as ‘take-or-pay’ contracts, whereby customers agree to purchase a minimum amount of mobile satellite communications services over a fixed period. Any unused portion of the prepaid contracts or the take-or-pay contracts (‘breakage’) is recognised in revenue in line with service provision when reasonable assurance as to the breakage amount exists, or otherwise when the contract expires. Mobile satellite communications services lease revenues are recorded on a straight-line basis over the term of the contract concerned, which is typically between one and 12 months, unless another systematic basis is deemed more appropriate.
Revenue also includes income from spectrum coordination agreements (such as Ligado Networks), services contracts, other communications services and income from the sale and installation of terminals and other communication equipment. Revenue from spectrum coordination agreements is recognised using the percentage of completion or straight-line approach depending on the underlying terms of the agreement. Revenue from service contracts is recognised as the service is provided. Sales of terminals and other communication equipment are recognised when the risks and rewards of
NOTES TO THE CONSOLIDATED FINANCIAL STATEMENTS CONTINUED
118 – INMARSAT PLC – ANNUAL REPORT AND ACCOUNTS 2016

ownership are transferred to the purchaser. Revenue from installation of terminals and other communication equipment is recognised when the installation is completed.
The Group offers certain products and services as part of multiple deliverable arrangements. Multi-deliverable arrangements are divided into separate units of accounting provided: 1) the deliverable has a stand-alone value to the customer if it is sold separately; and 2) the fair value of the item can be objectively and reliably determined. Consideration for these items is measured and allocated to each separate unit based on their relative fair values and the relevant revenue recognition policies are applied to them.
FINANCING INCOME AND FINANCING COST
Financing income comprises interest receivable on funds invested in short-term deposits.
Financing costs comprise interest payable on borrowings including the Senior Notes and Convertible Bonds, accretion of the liability component of the Convertible Bonds, amortisation of deferred financing costs the unwind of the discount on deferred satellite liabilities and interest on the net defined benefit asset and post-employment liability.
The change in fair value of the derivative liability component of the 2023 Convertible Bond is presented within net financing costs in the income statement. Further details on the accounting for derivative financial instruments is provided below.
FINANCIAL ASSETS
Trade and other receivables
Trade and other receivables, including prepaid and accrued income, are initially recorded at fair value and subsequently measured at amortised cost using the effective interest method, subject to reduction for allowances for estimated uncollectable amounts.
Cash and cash equivalents
Cash and cash equivalent, measured at fair value, comprises cash balances, deposits held on call with banks, and other short-term, highly liquid investments with maturities of three months or less. Bank overdrafts are shown as current liabilities within borrowings on the balance sheet.
FINANCIAL LIABILITIES AND EQUITY
Equity instruments
An equity instrument is any contract that evidences a residual interest in the assets of the Group after deducting all of its liabilities. Equity instruments issued by the Group are recorded at the proceeds received, net of direct issue cost.
Trade and other payables
Trade and other payables are recorded initially at fair value and subsequently measured at amortised cost using the effective interest method.
Borrowings
Borrowings, comprising interest-bearing bank loans and overdrafts, are initially recorded at fair value which equates to the proceeds received, net of direct transaction and arrangement costs. They are subsequently measured at amortised cost using the effective interest rate method. Finance charges related to borrowings, including amortisation of direct transaction costs, are charged to the income statement over the term of the borrowing using the effective interest rate method.
Borrowings are classified as current liabilities unless the Group has the unconditional right to defer settlement of the liability for at least 12 months after the balance sheet date.
Convertible Bonds
The Group has issued Convertible Bonds which are net share settled instruments, meaning upon conversion the Group will repay the principal in cash and satisfy the remaining conversion value in ordinary shares of the Company (if the market value of the Company’s shares at settlement date exceeds the conversion price). Upon issuance, in accordance with IAS 32 the instrument is bifurcated between a cash debt component and a derivative liability component. The debt component meets the definition of net borrowings and over the term of the bond will accrete up to the principal value of the bond with the cost of that accretion recognised in net financing costs. The derivative liability represents the value of the conversion rights associated with the instrument and is accounted for at fair value through profit and loss. It is excluded from net borrowings with the mark-to-market movements recognised in net financing costs.
The cash debt component is initially recognised as the present value of the principal and interest payments using a discount rate for a similar instrument with the same terms and conditions but without the conversion option. After initial recognition, it is recognised at amortised cost using the effective interest method with the interest expense recognised in the income statement and a cash outflow resulting from coupon payments to bond holders. The derivative liability component is assigned the residual amount after deducting from the fair value of the instrument as a whole, the amount separately determined for the cash debt component. The derivative liability is sensitive to changes in the bond price and is marked-to-market at each reporting date.
Senior Notes
The Group has issued Senior Notes that are included within borrowings, and initially are recorded at fair value which equates to the proceeds received, net of direct transaction costs and any premium or discount. They are subsequently measured at amortised cost using the effective interest rate method. Finance charges, including amortisation of direct transaction costs and any premium or discount, are charged to the income statement over the term of the borrowing.
Net borrowings
Net borrowings consists of total borrowings less cash and cash equivalents and short-term investments. Borrowings exclude accrued interest and any derivative financial liabilities.
Derivative financial instruments
The Group may use derivative financial instruments to manage its exposure to fluctuations in foreign exchange rates and interest rates. In accordance with its treasury policy, the Group does not hold or issue derivative financial instruments for trading or speculative purposes.
Derivatives are initially recognised and measured at fair value on the date the derivative contract is entered into and subsequently measured at fair value. The gain or loss on remeasurement is recognised in the income statement except where the derivative is designated as a cash flow hedging instrument. Changes in the fair value of derivative financial instruments that are designated and effective as hedges of future cash flows are recognised directly in equity. The gain or loss relating to any ineffective portion is recognised immediately in the income statement. Amounts deferred in equity are recognised in the income statement in the same period in which the hedged item affects profit or loss. Changes in the fair value of any derivative instruments that are not hedge accounted are recognised immediately in the income statement.
ANNUAL REPORT AND ACCOUNTS 2016 – INMARSAT PLC – 119STRATEGIC REPORT – GOVERNANCE – FINANCIAL STATEMENTS

Cash flow hedges
The effective portion of the gain or loss on the hedging instrument is recognised in other comprehensive income in the cash flow hedge reserve, while any ineffective portion is recognised immediately in the income statement within financing costs.
The Group changed its foreign exchange policy in 2015 and no longer generally hedges foreign currency transactions. Where there is a material contract with a foreign currency exposure, a specific hedge to match the specific risk will be evaluated. At present the Group only hedges certain foreign currency milestone payments to Airbus for the construction of the I-6 satellites.
Amounts recognised as other comprehensive income are transferred to profit or loss when the hedged transaction affects profit or loss, such as when the hedged financial income or financial expense is recognised or when a forecast sale occurs. When the hedged item is the cost of a non-financial asset or non-financial liability, the amounts recognised as other comprehensive income are transferred to the initial carrying amount of the non-financial asset or liability.
EMPLOYEE BENEFITS
Wages, salaries, social security contributions, accumulating annual leave, bonuses and non-monetary benefits are accrued in the year in which the associated services are performed by the employees of the Group.
Termination benefits are payable whenever an employee’s employment is terminated before the normal retirement date or whenever an employee accepts voluntary redundancy in exchange for these benefits. The Group recognises termination benefits when it has demonstrably committed to either terminate the employment of current employees or to provide termination benefits, as a result of an offer made to encourage voluntary redundancy.
The Group recognises liabilities relating to defined benefit pension plans and post-employment benefits in respect of employees. The Group’s net obligations in respect of defined benefit pension plans and post-employment benefits are calculated separately for each plan by estimating the amount of future benefit that employees have earned in return for their service in the current and prior periods; that benefit is discounted to determine its present value, and the fair value of any plan assets is deducted. The calculations are performed by qualified actuaries using the projected unit credit method.
All actuarial gains and losses that arise in calculating the present value of the defined benefit obligation and the fair value of plan assets are immediately recognised in the statement of comprehensive income.
The Group also operates a number of defined contribution pension schemes. Pension costs for the defined contribution schemes are charged to the income statement when the related employee service is rendered.
The Group issues equity-settled share options and awards to employees. Equity-settled share option awards are measured at fair value at the date of the grant. The fair value determined at the grant date is expensed on a straight-line basis over the vesting period, based on the Group’s estimate of shares that will eventually vest and adjusted for the effect of non-market-based vesting conditions.
TAXATION
Current tax
The tax currently payable is based on taxable profit for the year. Taxable profit differs from net profit as reported in the income statement because it excludes items of income or expense that are taxable or deductible in other years and it further excludes items that are never taxable or deductible. The Group’s liability for current tax is calculated using tax rates that have been enacted or substantively enacted by the balance sheet date.
Deferred tax
Deferred tax is provided, using the liability method, on temporary differences arising between the tax bases of assets and liabilities and their carrying amounts in the consolidated financial statements. However, if the deferred tax arises from initial recognition of an asset or liability in a transaction other than a business combination that at the time of the transaction affects neither accounting nor taxable profit or loss, it is not accounted for. Deferred tax is determined using tax rates (and laws) that have been enacted or substantively enacted by the balance sheet date and are expected to apply when the related deferred tax asset is realised or the deferred tax liability is settled.
Deferred tax assets are recognised to the extent that it is probable that future taxable profits will be available against which the temporary deductible differences or tax loss carry forwards can be utilised.
Deferred tax is provided on temporary differences arising on investments in subsidiaries and associates, except where the timing of the reversal of the temporary difference is controlled by the Group and it is probable that the temporary difference will not reverse in the foreseeable future.
Deferred tax assets and liabilities are offset when there is a legally enforceable right to set off current tax assets against current tax liabilities and when they relate to income taxes levied by the same taxation authority and the Group intends to settle its current tax assets and liabilities on a net basis.
Uncertain tax positions
The Group’s policy is to comply with all enacted laws in the relevant jurisdictions in which the Group is preparing its tax returns. However, tax legislation, especially as it applies to corporate taxes, is not always prescriptive and more than one interpretation of the law may be possible. In addition, tax returns in many jurisdictions are filed in arrears a year or more after the end of the accounting period to which they relate. The tax authorities often have a significant period in which to enquire into these returns once submitted. As a result, differences in view, or errors in returns, may not surface until some time after the initial estimate of tax due is determined. This necessarily leads to a position of uncertain tax positions.
Where the Group is aware of significant areas where the law is unclear and has been relied upon in a filing position of a tax return, or, in an area where different outcomes and interpretations are possible and may lead to a different result, the Group provides for the uncertain tax position. A provision is made when, based on the available evidence, the Group considers that it is probable that further amounts will be payable, or a recoverable tax position will be reduced, and the adjustment can be reliably estimated. The Group calculates the uncertain tax position using a single best estimate of the most likely outcome on a case by case basis.
RESEARCH AND DEVELOPMENT COSTS
Research expenditure is expensed when incurred. Development expenditure is expensed when incurred unless it meets criteria for capitalisation. Development costs are only capitalised once the technical feasibility and commercial viability of a business case has been demonstrated and they can be measured reliably. Capitalised development costs are amortised on a straight-line basis over the period of expected future benefit. Amortisation is recorded in the income statement.
PROPERTY, PLANT AND EQUIPMENT
Space segment assets
Space segment assets comprise satellite construction, launch and other associated costs, including ground infrastructure. Expenditure charged to space segment projects includes invoiced progress payments, amounts accrued appropriate to the stage of completion of contract milestones,
NOTES TO THE CONSOLIDATED FINANCIAL STATEMENTS CONTINUED
120 – INMARSAT PLC – ANNUAL REPORT AND ACCOUNTS 2016
external consultancy costs and direct internal costs. Internal costs, comprising primarily staff costs, are only capitalised when they are directly attributable to the construction of an asset. Progress payments are determined on milestones achieved to date together with agreed cost escalation indices. Deferred satellite payments represent the net present value of future payments dependent on the future performance of each satellite and are recognised in space segment assets when the satellite becomes operational. The associated liability is stated at its net present value and included within borrowings. These space segment assets are depreciated over the life of the satellites from the date they become operational and are placed into service.
Assets in the course of construction
These assets will be transferred to space segment assets and depreciated over the life of the satellites or services once they become operational and placed into service. No depreciation has yet been charged on these assets.
Capitalised borrowing costs
The Group incurs borrowing costs directly attributable to the acquisition, construction or production of an asset that necessarily takes a substantial period of time to get ready for its intended use or sale and capitalises these borrowing costs as part of the cost of the asset. Capitalisation commences when the Group begins to incur the borrowing costs and related expenditures for the asset, and when it undertakes the activities that are necessary to prepare the asset for its intended use or sale. Capitalisation of borrowing costs cease when substantially all of the activities necessary to prepare the asset for its intended use or sale are complete.
Other fixed assets
Other fixed assets are stated at historical cost less accumulated depreciation.
Depreciation
Depreciation is calculated to write-off the historical cost less residual values, if any, of fixed assets, except land, on a straight-line basis over the expected useful lives of the assets concerned. The Group selects its depreciation rates and residual values carefully and reviews them annually to take account of any changes in circumstances. When setting useful economic lives, the principal factors the Group takes into account are the expected rate of technological developments, expected market requirements for the equipment and the intensity at which the assets are expected to be used.
Derecognition
A fixed asset is derecognised upon disposal or when no future economic benefit is expected from its use or disposal. Any gain or loss arising on derecognition of the asset, calculated as the difference between the net disposal proceeds and the carrying amount of the asset, is included in the income statement.
GOVERNMENT GRANTS
Government grants are recognised where there is reasonable assurance that the grant will be received and all attached conditions will be complied with. When the grant relates to an expense item, it is recognised as income on a systematic basis over the periods that the related costs are expensed. When the grant relates to an asset, it is deducted from the cost of the relevant asset to arrive at the carrying amount. The grant is therefore recognised as income over the life of the asset by way of a reduced depreciation charge.
INTANGIBLE ASSETS
Intangible assets comprise goodwill, trademarks, software, terminal development and network access costs, spectrum rights, orbital slots and licences, customer relationships and intellectual property.
Intangible assets acquired separately are measured on initial recognition at cost. The cost of intangible assets acquired in a business combination is the fair value at the date of acquisition. After initial recognition, intangible assets are carried at cost less any accumulated amortisation and accumulated impairment losses.
Internally generated intangibles, excluding capitalised development costs, are not capitalised and the related expenditure is recognised in profit or loss in the period in which the expenditure is incurred.
Development costs directly relating to the development of new services are capitalised as intangible assets once a business case has been demonstrated as to technical feasibility and commercial viability.
Intangible assets with a finite useful life are amortised on a straight-line basis over the life of the asset and the amortisation period and method are reviewed each financial year. Intangible assets with an indefinite useful life are reviewed annually for impairment.
IMPAIRMENT REVIEWS
All assets that are subject to depreciation or amortisation are reviewed for impairment whenever events or changes in circumstances indicate that the carrying amount may not be recoverable. Goodwill is not amortised but is tested annually for impairment at 31 December each year. Indicators of impairment may include changes in technology and business performance. For the purposes of assessing impairment, assets are grouped at the lowest levels for which there are separately identifiable and independent cash flows; these are known as cash-generating units. An impairment loss is recognised in the income statement whenever the carrying amount of an asset exceeds its recoverable amount.
The recoverable amount is the higher of an asset’s fair value less costs of disposal and value in use. In assessing value in use, estimated future cash flows are discounted to their present value using a pre-tax discount rate that reflects current market assessments of the time value of money and the risks specific to the asset.
In respect of assets other than goodwill, an impairment loss is reversed if there has been a change in the estimates used to determine the recoverable amount. An impairment loss is reversed only to the extent that the asset’s carrying amount does not exceed the carrying amount that would have been determined, net of depreciation or amortisation, if no impairment loss had been recognised. Impairment losses in respect of goodwill are not reversed.
LEASES
Leases where a significant portion of the risks and rewards of ownership are retained by the lessor are classified as operating leases by the lessee. Rentals receivables under operating leases and income generated from terminal leases are recognised in the income statement on a straight-line basis over the term of the lease. Rentals payable under operating leases are charged to the income statement on a straight-line basis over the term of the lease.
ANNUAL REPORT AND ACCOUNTS 2016 – INMARSAT PLC – 121STRATEGIC REPORT – GOVERNANCE – FINANCIAL STATEMENTS

NON-CURRENT ASSETS AND DISPOSAL GROUPS HELD FOR SALE
When the carrying value of non-current assets and disposal groups will be recovered through a sale transaction rather than through continuing usage, they are classified as held for sale. This condition is regarded as met only when the sale is highly probable and the disposal group is available for immediate sale in its present condition. Assets held for sale are stated at the lower of their carrying amount and fair value less costs to sell.
Disposal groups are groups of assets and liabilities to be disposed of together as a group in a single transaction. They are recognised as held for sale at the reporting date and are separately disclosed as current assets and liabilities on the balance sheet. Any amortisation or depreciation ceases when an asset is classified as held for sale. Measurement differences arising between the carrying amount and fair value less cost of disposal are treated as impairment charges and separately disclosed.
Available-for-sale financial assets classified as held for sale are remeasured to fair value with the resulting gains or losses recorded through the revaluation reserve. These amounts are subsequently reclassified to profit or loss at the time of sale.
INVENTORIES
Inventories are stated at the lower of cost (determined by the weighted average cost method) and net realisable value. Allowances for obsolescence are recognised in other operating costs when there is objective evidence that inventory is obsolete.
PROVISIONS
Provisions are recognised when the Group has a present obligation (legal or constructive) as a result of a past event. It is probable that an outflow of economic benefits will be required to settle the obligation and a reliable estimate can be made of the amount of the obligation. The expense relating to a provision is presented in the income statement.
Asset retirement obligations
The fair value of legal obligations associated with the retirement of tangible property, plant and equipment is recognised in the financial statements in the period in which the liability is incurred. Upon initial recognition of a liability for an asset retirement obligation, a corresponding asset retirement cost is added to the carrying amount of the related asset, which is subsequently amortised to income over the remaining useful life of the asset. Following the initial recognition of an asset retirement obligation, the carrying amount of the liability is increased for the passage of time by applying an interest method of allocation to the liability with a corresponding accretion cost reflected in operating expenses.
Revisions to either the timing or the amount of the original estimate of undiscounted cash flows are recognised each period as an adjustment to the carrying amount of the asset retirement obligation.
3. FINANCIAL RISK MANAGEMENT
FINANCIAL RISK FACTORS
The Group’s operations and significant debt financing expose it to a variety of financial risks that include the effects of changes in debt market prices, foreign currency exchange rates, credit risks, liquidity risks and interest rates. The Group has in place a risk management programme that seeks to limit adverse effects on the financial performance of the Group by using forward exchange contracts to limit exposure to foreign currency risk and to limit the impact of fluctuating interest rates by minimising the amount of floating rate long-term borrowings.
The Board of Directors have delegated to the Treasury department the responsibility for setting and implementing the financial risk management policies applied by the Group. The treasury department has an operating manual that sets out specific guidelines for managing foreign exchange risk, interest rate risk and credit risk (see note 31). The Group does not hold or issue derivative financial instruments for speculative or trading purposes.
(A) MARKET RISK
(i) Foreign exchange risk
The functional currency of Inmarsat plc is the US Dollar. Apart from the deferred satellite liability, all of the Group’s long-term borrowings are denominated in US Dollars, the majority of its revenue is earned in US Dollars and the majority of capital expenditure is denominated in US Dollars, which are therefore not subject to risks associated with fluctuating foreign currency rates of exchange.
However, the Group operates internationally, resulting in approximately 3% and 17% of total revenue and total expenditure, respectively, being denominated in currencies other than the US Dollar. Approximately 32% (2015: 34%) of the Group’s operating costs are denominated in Pounds Sterling. In addition, 85% of the expenditure on the I-6 satellite programme is in currencies other than US Dollars. The Group’s exposures therefore need to be carefully managed to avoid variability in future cash flows and earnings caused by volatile foreign exchange rates.
As at 31 December 2016 it is estimated that a hypothetical 1% increase in the US Dollar/Sterling year end exchange rate (US$1.24/£1.00 to US$1.25/£1.00) would have increased the 2016 profit before tax by approximately $0.6m (2015: $0.4m);
Management believes that a 1% sensitivity rate provides a reasonable basis upon which to assess expected changes in foreign exchange rates.
(ii) Price risk
The Group is not exposed to significant equity securities price risk or commodity price risk.
(B) INTEREST RATE RISK
Given the Group has no significant interest-bearing assets (except cash and cash equivalents, short-term deposits, and non-current other receivables), income and operating cash flows are substantially independent of changes in market interest rates. Interest rate risk arises from long-term borrowings. Borrowings issued at variable rates expose the Group to cash flow interest rate risk; however, as at 31 December 2016, the Group has no borrowings issued at variable rates following the full repayment of the EIB loan in October 2016. The Senior Notes due 2022 and 2024, the Convertible Bonds due 2023 and the Ex-Im Bank Facilities are all at fixed rates.
NOTES TO THE CONSOLIDATED FINANCIAL STATEMENTS CONTINUED
122 – INMARSAT PLC – ANNUAL REPORT AND ACCOUNTS 2016

(C) CREDIT RISK
Credit risk refers to the risk that a counterparty will default on its contractual obligations resulting in financial loss to the Group. Financial instruments that potentially subject the Group to a concentration of credit risk consist of cash and cash equivalents, short-term deposits, trade receivables, other receivables, accrued income and derivative financial instruments. The credit risk on liquid funds (cash and cash equivalents and short-term deposits) and derivative financial instruments is limited because the counterparties are highly rated financial institutions.
The maximum exposure to credit risk as at 31 December is:
($ in millions) Note 2016 2015
Cash and cash equivalents 16 262.0 177.3
Trade receivables, other receivables and accrued income 31 250.7 310.8
Derivative financial instruments 31 1.8 –
Total credit risk 514.5 488.1
The Group’s average age of trade receivables as at 31 December 2016 was approximately 63 days excluding Ligado and approximately 58 days including Ligado (2015: 61 days excluding Ligado and 56 days including Ligado). At 31 December 2016, $165.6m (2015: $156.2m) of trade receivables were not yet due for payment. No interest is charged on trade receivables until the receivables become overdue for payment. Thereafter, interest may be charged at varying rates depending on the terms of the individual agreements.
The Group has credit evaluation, approval and monitoring processes intended to mitigate potential credit risks, and utilises both internal and third-party collection processes for overdue accounts. The Group maintains provisions for potential credit losses that are assessed on an ongoing basis. The provision for uncollectible trade receivables has decreased to $13.7m as at 31 December 2016 (2015: $16.1m).
For 2016, no customer comprised greater than 10% of the Group’s total revenues (2015: one customer, 11.4%). In 2015, the customer comprising greater than 10% of the Group’s total revenues accounted for 16.4% of the Group’s trade receivables balance as at 31 December 2015.
The ageing profile of past due but not impaired trade receivables is:
($ in millions) 2016 2015
Between 1 and 30 days overdue 35.3 30.2
Between 31 and 120 days overdue 7.9 9.0
Over 120 days overdue 1.5 1.4
As at 31 December 44.7 40.6
(D) LIQUIDITY RISK
The Group is exposed to liquidity risk with respect to its contractual obligations and financial liabilities. Prudent liquidity risk management implies maintaining sufficient cash and short-term deposits and the availability of funding through an adequate amount of committed credit facilities.
The Group manages liquidity risk by continuously monitoring forecast and actual cash flows and matching the maturity profiles of financial assets and liabilities.
The available liquidity of the Group as at 31 December is:
($ in millions) Note 2016 2015
Cash and cash equivalents 16 262.0 177.3
Available but undrawn borrowing facilities1 19 578.9 578.9
Total available liquidity 840.9 756.2
1 Relates to the Senior Credit Facility and Ex-Im Bank Facility (see note 19).
The Directors believe the Group’s liquidity position is more than sufficient to meet its needs for the foreseeable future.
4. CRITICAL ACCOUNTING ESTIMATES AND KEY JUDGEMENTSThe preparation of the consolidated financial statements requires management to make certain estimates and assumptions that affect the reported amounts of assets and liabilities and disclosure of contingent assets and liabilities at the balance sheet dates and the reported amounts of revenue and expenses during the reported period. Actual results could differ from those estimates. The more significant estimates are discussed below:
(A) IMPAIRMENT REVIEW
Impairment reviews of goodwill are performed at the level of the Group’s cash-generating units ('CGUs'). For the Group, these are considered to be the Maritime, Enterprise, Aviation, US Government and Global Government business units. The recoverable amount of each CGU has been determined based on value in use calculations. The key assumptions used by management in these calculations are the cash flow projections, long-term growth rates and discount rates for each CGU.
The impairment review conducted at 31 December 2016 identified sufficient headroom in the recoverable value of each CGU above their carrying value. A sensitivity analysis has been undertaken by changing key assumptions used for each CGU. Based on this sensitivity analysis, no reasonably possible change in the assumptions resulted in the recoverable amount of the CGUs being reduced to their carrying value. We do not anticipate any changes over the next 12 months that would result in the recoverable amount of the CGUs being reduced to their carrying value.
Key assumptions used to calculate the recoverable amount of the CGUs were as follows:
($ in millions)Allocated
goodwill
Pre-tax discount
rateLong-term growth rate
Maritime 215.5 8.2% 2.0%
Enterprise 54.8 8.2% 2.0%
Aviation 46.4 8.2% 2.0%
US Government 50.6 8.2% 2.0%
Global Government 54.8 8.2% 2.0%
Total Group 422.1
ANNUAL REPORT AND ACCOUNTS 2016 – INMARSAT PLC – 123STRATEGIC REPORT – GOVERNANCE – FINANCIAL STATEMENTS
Cash flow projections
The recoverable amount of each CGU is based on the value in use, which is determined using cash flow projections derived from the most recent financial budgets and forecasts approved by management covering a five-year period. The short and medium-term cash flows reflect management’s expectations of future outcomes taking into account past experience, adjusted for anticipated growth from both existing and new business in line with our strategic plans for each segment of our business. The cash flows also take into consideration our assessment of the potential impact of external economic factors.
Long-term growth rates
A long-term growth rate has been applied to extrapolate the cash flows into perpetuity. The growth rate has been determined using long-term industry growth rates and management’s conservative expectation of future growth.
Discount rates
The discount rates reflect the time value of money and are derived from the Group’s weighted average cost of capital, adjusted for the risk associated with the CGUs. The risk premium, when compared with the Group discount rate, was consistent across each of the CGUs given the similarities in exposure to economic and competitive conditions. The approach for calculation of the Group’s discount rate has been changed to use the debt to capital ratio rather than the debt to equity ratio. The prior year discount rate, calculated on the same basis, would have resulted in a 9.5% discount rate instead of the 8.9% that was disclosed.
(B) TAXATION
The calculation of the Group’s current and deferred tax balances, including potential liabilities or assets, necessarily involves a degree of estimation and judgement in respect of certain items whose tax treatment cannot be finally determined until resolution has been reached with the relevant tax authority, or, as appropriate, through a formal legal process. Issues can, and often do, take a number of years to resolve. The amounts recognised or disclosed are derived from the Group’s best estimation and judgement. However, the inherent uncertainty regarding the outcome of these means eventual realisation could differ from the accounting estimates and therefore impact the Group’s results and cash flows.
The Group maintains tax provisions in respect of ongoing enquiries with tax authorities. In the event that all such enquiries were settled as currently provided for, we estimate that the Group would incur a cash tax outflow of approximately $90m over 2017 or 2018. The enquiries remain ongoing at this time.
(C) REVENUE IN RESPECT OF THE LIGADO NETWORKS COOPERATION AGREEMENT
In December 2007, Inmarsat and Ligado Networks (formerly LightSquared LP, Skyterra (Canada) Inc. and LightSquared Inc.) entered into a Cooperation Agreement for the efficient use of L-band spectrum over North America. The Cooperation Agreement was segregated into phases and designed to enable and support the deployment of an ATC network by Ligado in North America. To date total cash payments of $775.0m have been received under the Cooperation Agreement, including $126.2m in 2016 (2015: $70.8m). The Group has, thus far, recognised $577.2m of revenue and $23.4m of operating costs under all phases of the agreement. For the year ended 31 December 2016, the Group recognised $119.4m of revenue with no associated operating costs (year ended 31 December 2015: $88.6m and $nil, respectively).
In March 2016, Ligado Networks agreed to take the 30MHz option (the ‘30MHz Plan’) under Phase 2 of the Cooperation Agreement between the companies. In exchange for the deferral of some payments from Ligado to Inmarsat, the parties agreed to delay the transition to the 30MHz Plan, with Ligado providing Inmarsat enhanced spectrum usage rights for its satellite operations for a minimum period of two years. With this in mind, Ligado made quarterly payments to Inmarsat totalling $108m during the course of 2016 and will make aggregate payments of approximately $111m and $118m in respect of 2017 and 2018 respectively, payable in quarterly instalments. This revenue is recognised on an accruals basis. Over the three-year period up to approximately $35m of additional contracted payments will be deferred.
At 31 December 2016, deferred income in respect of the Cooperation Agreement of $197.8m was recorded on the balance sheet. Although the cash has been received, the timing of the recognition of this deferred income, together with any related future costs and taxes, is dependent upon a number of factors that continue to be uncertain until such time as Ligado receive their FCC license. During 2016, Inmarsat recognised $11.0m of deferred income as revenue to reflect the impact of the revenue deferral arising under the revised transition agreement.
(D) CAPITALISATION OF SPACE SEGMENT ASSETS AND ASSOCIATED BORROWING COSTS
The key judgements involved in the capitalisation of space segment assets and associated borrowings costs are:
> whether the capitalisation criteria of the underlying IAS have been met
> whether an asset is ready for use and as a result further capitalisation of costs should cease and depreciation should commence and
> whether an asset is deemed to be substantially complete and as a result capitalisation of borrowing costs should cease
NOTES TO THE CONSOLIDATED FINANCIAL STATEMENTS CONTINUED
124 – INMARSAT PLC – ANNUAL REPORT AND ACCOUNTS 2016

5. SEGMENTAL INFORMATIONOperating segments are reported in a manner consistent with the internal reporting provided to the Chief Operating Decision Maker to allocate resources and assess the performance of the Group.
The Group’s operating segments are aligned to five market-facing business units, being:
> Maritime, focusing on worldwide commercial maritime services
> Enterprise, focusing on worldwide energy, industry, media, carriers, and M2M services
> Aviation, focusing on commercial, business and general aviation services
> US Government, focusing on US civil and military government services and
> Global Government, focusing on worldwide civil and military government services
Details of these business units are given on pages 28 to 45.
These five business units are supported by ‘Central Services’ which include satellite operations and backbone infrastructure, corporate administrative costs, and any income that is not directly attributable to a business unit (such as Ligado Networks). The Group has aggregated the US Government and Global Government operating segments into one reporting segment as the segments have a similar type of customer for the products and services and meet the criteria for aggregation under IFRS. Therefore, the Group’s reportable segments are Maritime, Government, Enterprise, Aviation and Central Services.
The accounting policies of the operating segments are the same as the Group’s accounting policies described in note 2. Segment results are assessed at the EBITDA level without the allocation of central costs, depreciation, net financing costs and taxation.
SEGMENT RESULTS
($ in millions)
2016
Maritime Government Enterprise AviationCentral
Services Total
Revenue 575.3 330.5 144.6 142.6 16.6 1,209.6
Ligado revenue – – – – 119.4 119.4
Total revenue 575.3 330.5 144.6 142.6 136.0 1,329.0
Net operating costs (120.5) (86.5) (38.7) (45.2) (243.3) (534.2)
EBITDA 454.8 244.0 105.9 97.4 (107.3) 794.8
Depreciation and amortisation – – – – (349.4) (349.4)
Other1 – – – – 1.7 1.7
Operating profit 454.8 244.0 105.9 97.4 (455.0) 447.1
Net financing cost (147.9)
Profit before tax 299.2
Taxation (55.8)
Profit for the year 243.4
Cash capital expenditure2 43.8 6.1 0.4 153.0 209.6 412.9
Financing costs capitalised in the cost of qualifying assets 36.1
Cash flow timing3 37.2
Total capital expenditure 486.2
1 Other relates primarily to the share of profit from associates.2 Cash capital expenditure is the cash flow relating to tangible and intangible asset additions, it includes capitalised labour costs and excludes capitalised interest.3 Cash flow timing represents the difference between accrued capex and the actual cash flows.
ANNUAL REPORT AND ACCOUNTS 2016 – INMARSAT PLC – 125STRATEGIC REPORT – GOVERNANCE – FINANCIAL STATEMENTS
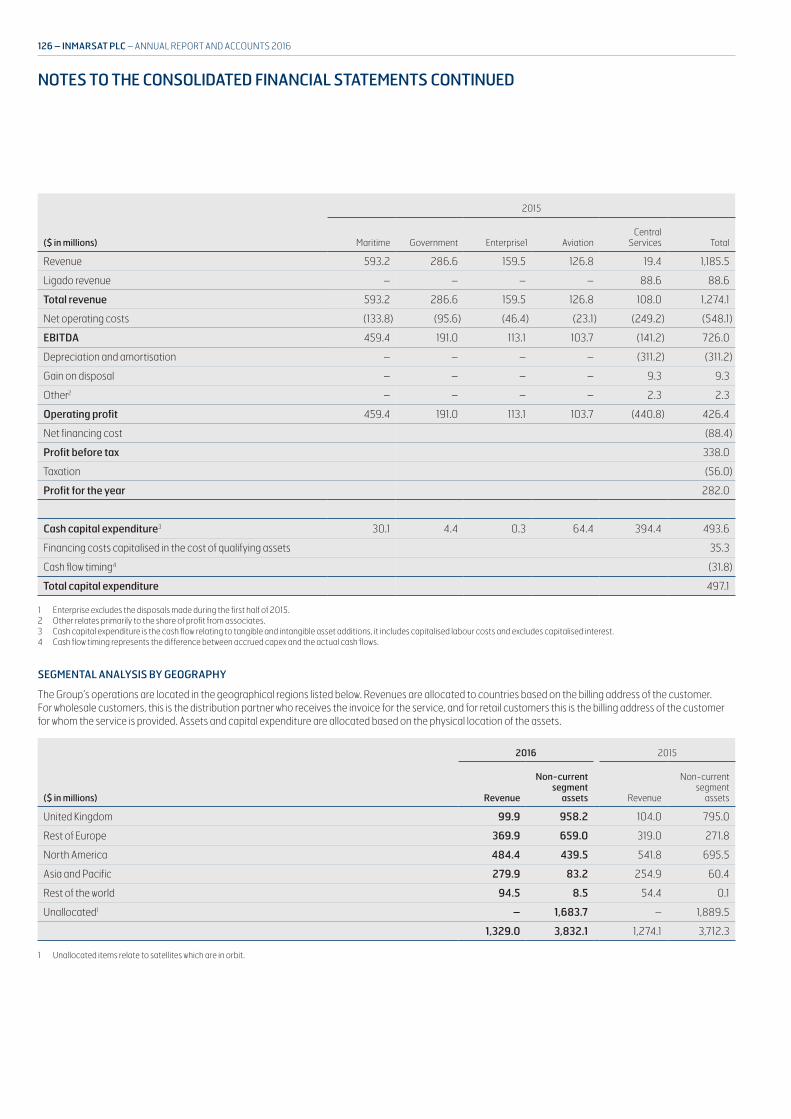
($ in millions)
2015
Maritime Government Enterprise1 AviationCentral
Services Total
Revenue 593.2 286.6 159.5 126.8 19.4 1,185.5
Ligado revenue – – – – 88.6 88.6
Total revenue 593.2 286.6 159.5 126.8 108.0 1,274.1
Net operating costs (133.8) (95.6) (46.4) (23.1) (249.2) (548.1)
EBITDA 459.4 191.0 113.1 103.7 (141.2) 726.0
Depreciation and amortisation – – – – (311.2) (311.2)
Gain on disposal – – – – 9.3 9.3
Other2 – – – – 2.3 2.3
Operating profit 459.4 191.0 113.1 103.7 (440.8) 426.4
Net financing cost (88.4)
Profit before tax 338.0
Taxation (56.0)
Profit for the year 282.0
Cash capital expenditure3 30.1 4.4 0.3 64.4 394.4 493.6
Financing costs capitalised in the cost of qualifying assets 35.3
Cash flow timing4 (31.8)
Total capital expenditure 497.1
1 Enterprise excludes the disposals made during the first half of 2015.2 Other relates primarily to the share of profit from associates.3 Cash capital expenditure is the cash flow relating to tangible and intangible asset additions, it includes capitalised labour costs and excludes capitalised interest.4 Cash flow timing represents the difference between accrued capex and the actual cash flows.
SEGMENTAL ANALYSIS BY GEOGRAPHY
The Group’s operations are located in the geographical regions listed below. Revenues are allocated to countries based on the billing address of the customer. For wholesale customers, this is the distribution partner who receives the invoice for the service, and for retail customers this is the billing address of the customer for whom the service is provided. Assets and capital expenditure are allocated based on the physical location of the assets.
($ in millions)
2016 2015
Revenue
Non-current segment
assets Revenue
Non-current segment
assets
United Kingdom 99.9 958.2 104.0 795.0
Rest of Europe 369.9 659.0 319.0 271.8
North America 484.4 439.5 541.8 695.5
Asia and Pacific 279.9 83.2 254.9 60.4
Rest of the world 94.5 8.5 54.4 0.1
Unallocated1 – 1,683.7 – 1,889.5
1,329.0 3,832.1 1,274.1 3,712.3
1 Unallocated items relate to satellites which are in orbit.
NOTES TO THE CONSOLIDATED FINANCIAL STATEMENTS CONTINUED
126 – INMARSAT PLC – ANNUAL REPORT AND ACCOUNTS 2016

6. OPERATING PROFIT Costs are presented by the nature of the expense to the Group. Network and satellite operation costs comprise costs to third parties for network service contracts, operating lease rentals and services. A breakdown of employee benefit costs is given in note 7.
Operating profit is stated after charging/(crediting) the following items:
($ in millions) Note 2016 2015
Depreciation of property, plant and equipment 13 278.1 239.5
Amortisation of intangible assets 14 71.3 71.7
Impairment of intangible assets 14 – 0.4
Gain on disposal of assets (0.5) (9.3)
Impairment loss 1.2 0.2
Operating lease rentals:
Land and buildings 14.8 15.4
Services equipment, fixtures and fittings 0.3 –
Cost of inventories recognised as an expense 33.3 31.9
Write downs of inventories recognised as an expense 18 0.5 3.9
Research and development costs expensed 13.3 13.6
Remuneration payable to the Group’s auditor Deloitte LLP and its associates in the year is analysed below:
($ in millions) 2016 2015
Audit fees:
Annual audit of the Company 0.2 0.2
Annual audit of subsidiary companies 0.8 0.9
Total audit fees 1.0 1.1
Audit-related assurance services1 0.1 0.1
Total audit and audit-related fees 1.1 1.2
Tax advisory services 0.1 0.6
Other services2 0.1 –
Total non-audit fees 0.2 0.6
Total auditor’s remuneration 1.3 1.8
1 Fees paid for audit-related assurance services refer to the half year and quarterly reviews of the Group’s interim financial statements. 2 Other services in 2016 relate to a corporate financing transaction.
ANNUAL REPORT AND ACCOUNTS 2016 – INMARSAT PLC – 127STRATEGIC REPORT – GOVERNANCE – FINANCIAL STATEMENTS

7. EMPLOYEE BENEFIT COSTS
($ in millions) Note 2016 2015
Wages and salaries 222.8 215.8
Social security costs 18.0 19.0
Share-based payments (including employers’ national insurance contribution) 15.8 14.2
Defined contribution pension plan costs 9.0 8.2
Defined benefit pension plan costs1 28 1.9 3.1
Post-employment benefits costs1 28 0.1 0.1
Total employee benefit costs 267.7 260.4
1 Defined benefit pension plan costs and post-employment benefits costs include the service cost and gain on curtailment in 2016 (see note 28).
EMPLOYEE NUMBERS
The average monthly number of employees (including the Executive Directors) employed during the year:
($ in millions) 2016 2015
By activity:
Operations 812 785
Sales and marketing 370 340
Development and engineering 223 213
Administration 357 349
1,762 1,687
By segment:
Maritime 337 378
Government 189 196
Enterprise 72 74
Aviation 108 68
Central Services 1,056 971
1,762 1,687
The employee headcount numbers presented above refer to permanent full time and part time employees and exclude contractors and temporary staff. Employee benefit costs of $21.7m (2015: $22.8m) relating to contractors and temporary staff have been included in the cost table above.
8. KEY MANAGEMENT COMPENSATIONThe Group’s Executive and Non-Executive Directors are the key management personnel of the business. Details of the total amounts earned during the year are as follows:
($ in millions) 2016 2015
Short-term benefits 3.9 4.5
Company contributions to defined contribution pension schemes1 – –
Share-based payments2 5.1 5.9
9.0 10.4
1 Includes the value of cash allowances taken by two Executive Directors in lieu of pension contributions.2 Includes employers’ national insurance or other social security contributions.
The Remuneration report contains full disclosure of Directors’ remuneration on page 90. In both the current and prior year, no Director has been a member of the Group’s defined contribution pension plan.
NOTES TO THE CONSOLIDATED FINANCIAL STATEMENTS CONTINUED
128 – INMARSAT PLC – ANNUAL REPORT AND ACCOUNTS 2016

9. NET FINANCING COSTS
($ in millions) 2016 2015
Bank interest receivable and other interest (4.3) (1.4)
Net interest on the net defined benefit asset and post-employment liability – (0.4)
Total financing income (4.3) (1.8)
Interest on Senior Notes and credit facilities 79.8 74.1
Interest on Convertible Bonds 33.6 30.7
Accelerated accretion on redemption of 2017 Convertible Bonds 32.8 –
Amortisation of debt issue costs 8.2 7.9
Amortisation of discount on Senior Notes due 2022 1.0 1.1
Unwinding of discount on deferred satellite liabilities 0.6 0.9
Net interest on the net defined benefit asset and post-employment liability 0.4 –
Other interest 3.1 10.8
Financing costs 159.5 125.5
Less: Amounts capitalised in the cost of qualifying assets (36.1) (35.3)
Total financing cost 123.4 90.2
Change in fair value of the derivative liability component of the Convertible Bonds1 28.8 –
Net financing cost 147.9 88.4
1 For further details of the derivative liability component of the Convertible Bonds due 2023 please refer to note 19.
Borrowing costs capitalised in the cost of qualifying assets during the year are calculated by applying a capitalisation rate to expenditures on such assets. The average interest capitalisation rate for the year was 7.4% (2015: 7.0%).
10. TAXATIONThe tax charge for the year recognised in the income statement:
($ in millions) 2016 2015
Current tax:
Current year 36.3 37.0
Adjustments in respect of prior years 3.8 24.0
Total current tax 40.1 61.0
Deferred tax:
Origination and reversal of temporary differences 26.3 33.7
Adjustments due to reduction in the UK corporation tax rate (0.3) (17.9)
Adjustments in respect of prior years (10.3) (20.8)
Total deferred tax 15.7 (5.0)
Total taxation charge 55.8 56.0
ANNUAL REPORT AND ACCOUNTS 2016 – INMARSAT PLC – 129STRATEGIC REPORT – GOVERNANCE – FINANCIAL STATEMENTS

The effective tax rate was 18.6% (2015: 16.6%) and is reconciled below:
($ in millions) 2016 2015
Profit before tax 299.2 338.0
Income tax at 20.0% (2015: 20.25%) (59.8) (68.4)
Differences in overseas tax rates 2.0 (2.3)
Adjustments in respect of prior periods (3.5) (6.1)
Adjustments due to reduction in the UK corporation tax rate 10.3 20.8
Impact of UK patent box regime 3.9 2.7
Impact of current year losses not recognised – (0.6)
Impact of change in fair value of derivative liability component of Convertible Bond (5.8) –
Other non-deductible expenses/non-taxable income (2.9) (2.1)
Total taxation charge (55.8) (56.0)
Tax credited directly to equity:
($ in millions) 2016 2015
Current tax credit on share-based payments 2.7 0.8
Deferred tax credit on share-based payments (3.2) 1.1
Total tax credited directly to equity (0.5) 1.9
Tax credited directly to other comprehensive income:
($ in millions) 2016 2015
Current tax credit on cash flow hedges – (0.2)
Deferred tax credit/(charged) relating to gains on cash flow hedges 0.1 (0.2)
Deferred tax credit/(charged) on remeasurement of defined benefit asset and post-employment benefits 2.6 (0.6)
Deferred tax credit on remeasurement of available for sale financial asset – 1.4
Total tax credited directly to other comprehensive income 2.7 0.4
11. NET FOREIGN EXCHANGE GAINS
($ in millions) Note 2016 2015
Defined benefit plan and post-employment benefits 28 0.4 (0.4)
Other operating income (11.2) (2.9)
Total foreign exchange gain (10.8) (3.3)
12. DIVIDENDSDuring 2016, the 2016 interim dividend of $91.8m (20.59 cents per ordinary share) and the 2015 final dividend of $143.3m (31.78 cents per ordinary share) were paid to the Company’s shareholders. With effect from the 2016 interim dividend, the Group offered a scrip dividend election allowing shareholders to take their cash dividend entitlement in Inmarsat shares. This option was taken up by shareholders holding approximately 43m shares, representing 9.54% of our issued share capital. For our 2016 interim dividend the scrip amounted to 946,283 new shares (0.21% of the then issued share capital), representing an $8.9m cash dividend savings. These shares were issued and made available for trading on 21 October 2016.
During 2015, the 2015 interim dividend of $88.1m (19.61 cents per ordinary share) and the 2014 final dividend of $136.0m (30.26 cents per ordinary share) were paid to the Company’s shareholders.
The Inmarsat plc Board of Directors intends to recommend a final dividend of 33.37 cents per ordinary share in respect of the year ended 31 December 2016 to be paid on 26 May 2017 to ordinary shareholders on the share register at the close of business on 21 April 2017.
NOTES TO THE CONSOLIDATED FINANCIAL STATEMENTS CONTINUED
130 – INMARSAT PLC – ANNUAL REPORT AND ACCOUNTS 2016

($ in cents) 2016 2015
Interim dividend paid per ordinary share 20.59 19.61
Final dividend per ordinary share 33.37 31.78
Total dividend per ordinary share 53.96 51.39
13. PROPERTY, PLANT AND EQUIPMENT
($ in millions)Freehold land and buildings
Service equipment, fixtures and
fittings Space segment
Assets in the course of
construction Total
Cost:
1 January 2015 16.9 242.1 2,732.7 1,079.9 4,071.6
Additions 0.3 30.5 90.4 326.3 447.5
Disposals – (18.1) (7.9) (0.1) (26.1)
Transfers from assets in the course of construction and reclassifications1 0.1 73.8 733.3 (802.2) 5.0
31 December 2015 17.3 328.3 3,548.5 603.9 4,498.0
Additions 3.3 8.2 54.3 324.7 390.5
Disposals – (7.6) (1.2) – (8.8)
Transfers from assets in the course of construction and reclassifications1 – 15.8 51.0 (66.8) –
31 December 2016 20.6 344.7 3,652.6 861.8 4,879.7
Accumulated depreciation:
1 January 2015 (8.6) (205.3) (1,208.3) – (1,422.2)
Charge for the year (1.3) (21.9) (216.3) – (239.5)
Disposals – 16.9 6.9 – 23.8
Reclassifications1 – (32.9) 33.0 – 0.1
31 December 2015 (9.9) (243.2) (1,384.7) – (1,637.8)
Charge for the year (0.6) (46.6) (230.9) – (278.1)
Disposals – 7.4 0.2 – 7.6
31 December 2016 (10.5) (282.4) 1,615.5 – (1,908.3)
Net book amount at 31 December 2015 7.4 85.1 2,163.8 603.9 2,860.2
Net book amount at 31 December 2016 10.1 62.3 2,037.2 861.8 2,971.4
1 Reclassifications relate to movements between tangible and intangible asset categories throughout the year to align accounting policies across the Group.
Depreciation of property, plant and equipment is charged using the straight-line method over the estimated useful lives, as follows:
Space segment assets: Satellites 13–15 years Other space segment, including ground infrastructure 5–12 yearsFixtures and fittings, and services-related equipment 3–15 yearsBuildings 20 years
Freehold land is not depreciated. At 31 December 2016 and 2015, the Group was carrying certain freehold land and buildings with a net book value of nil. Had they been revalued on a market basis, their carrying amount at 31 December 2016 would have been $33.2m (2015: $33.2m). Market valuation is based on the Directors’ best estimates.
In 2016 the Group received government grants in relation to the purchase and construction of certain assets. The grants have been deducted from the cost of the relevant asset to arrive at the carrying amount. Government grants received in 2016 were $3.1m (2015: $1.7m).
ANNUAL REPORT AND ACCOUNTS 2016 – INMARSAT PLC – 131STRATEGIC REPORT – GOVERNANCE – FINANCIAL STATEMENTS
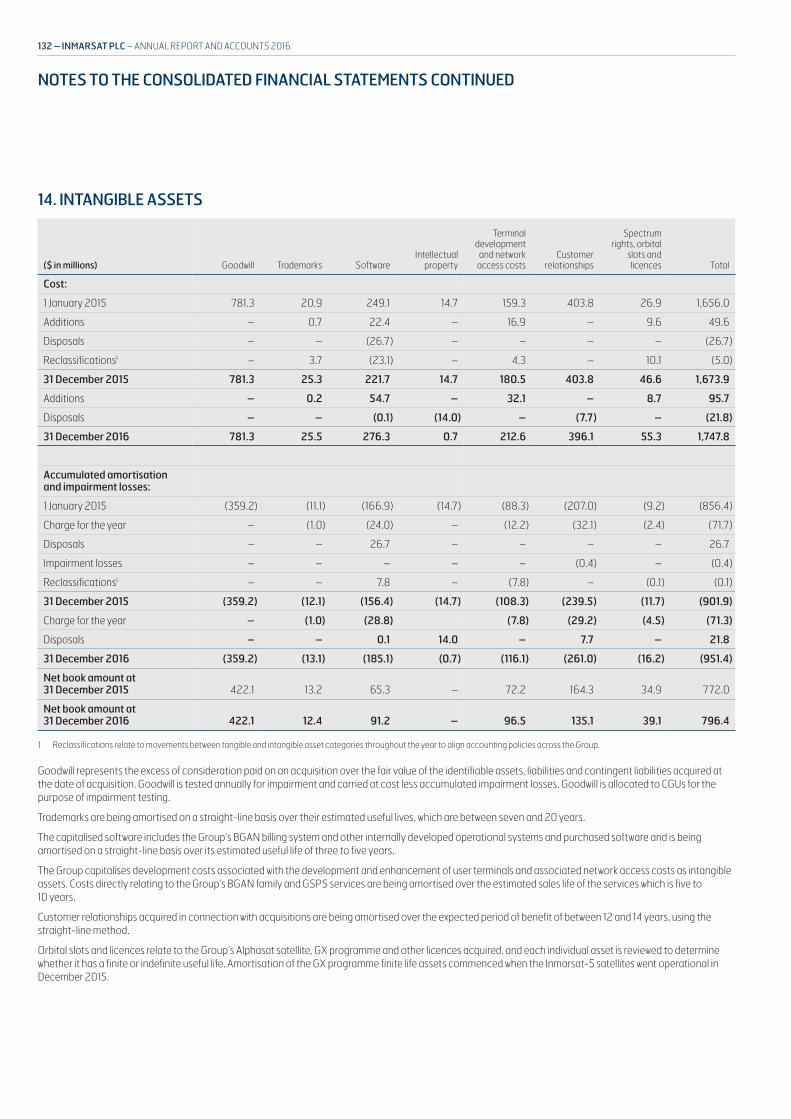
14. INTANGIBLE ASSETS
($ in millions) Goodwill Trademarks SoftwareIntellectual
property
Terminal development
and network access costs
Customer relationships
Spectrum rights, orbital
slots and licences Total
Cost:
1 January 2015 781.3 20.9 249.1 14.7 159.3 403.8 26.9 1,656.0
Additions – 0.7 22.4 – 16.9 – 9.6 49.6
Disposals – – (26.7) – – – – (26.7)
Reclassifications1 – 3.7 (23.1) – 4.3 – 10.1 (5.0)
31 December 2015 781.3 25.3 221.7 14.7 180.5 403.8 46.6 1,673.9
Additions – 0.2 54.7 – 32.1 – 8.7 95.7
Disposals – – (0.1) (14.0) – (7.7) – (21.8)
31 December 2016 781.3 25.5 276.3 0.7 212.6 396.1 55.3 1,747.8
Accumulated amortisation and impairment losses:
1 January 2015 (359.2) (11.1) (166.9) (14.7) (88.3) (207.0) (9.2) (856.4)
Charge for the year – (1.0) (24.0) – (12.2) (32.1) (2.4) (71.7)
Disposals – – 26.7 – – – – 26.7
Impairment losses – – – – – (0.4) – (0.4)
Reclassifications1 – – 7.8 – (7.8) – (0.1) (0.1)
31 December 2015 (359.2) (12.1) (156.4) (14.7) (108.3) (239.5) (11.7) (901.9)
Charge for the year – (1.0) (28.8) (7.8) (29.2) (4.5) (71.3)
Disposals – – 0.1 14.0 – 7.7 – 21.8
31 December 2016 (359.2) (13.1) (185.1) (0.7) (116.1) (261.0) (16.2) (951.4)
Net book amount at 31 December 2015 422.1 13.2 65.3 – 72.2 164.3 34.9 772.0
Net book amount at 31 December 2016 422.1 12.4 91.2 – 96.5 135.1 39.1 796.4
1 Reclassifications relate to movements between tangible and intangible asset categories throughout the year to align accounting policies across the Group.
Goodwill represents the excess of consideration paid on an acquisition over the fair value of the identifiable assets, liabilities and contingent liabilities acquired at the date of acquisition. Goodwill is tested annually for impairment and carried at cost less accumulated impairment losses. Goodwill is allocated to CGUs for the purpose of impairment testing.
Trademarks are being amortised on a straight-line basis over their estimated useful lives, which are between seven and 20 years.
The capitalised software includes the Group’s BGAN billing system and other internally developed operational systems and purchased software and is being amortised on a straight-line basis over its estimated useful life of three to five years.
The Group capitalises development costs associated with the development and enhancement of user terminals and associated network access costs as intangible assets. Costs directly relating to the Group’s BGAN family and GSPS services are being amortised over the estimated sales life of the services which is five to 10 years.
Customer relationships acquired in connection with acquisitions are being amortised over the expected period of benefit of between 12 and 14 years, using the straight-line method.
Orbital slots and licences relate to the Group’s Alphasat satellite, GX programme and other licences acquired, and each individual asset is reviewed to determine whether it has a finite or indefinite useful life. Amortisation of the GX programme finite life assets commenced when the Inmarsat-5 satellites went operational in December 2015.
NOTES TO THE CONSOLIDATED FINANCIAL STATEMENTS CONTINUED
132 – INMARSAT PLC – ANNUAL REPORT AND ACCOUNTS 2016
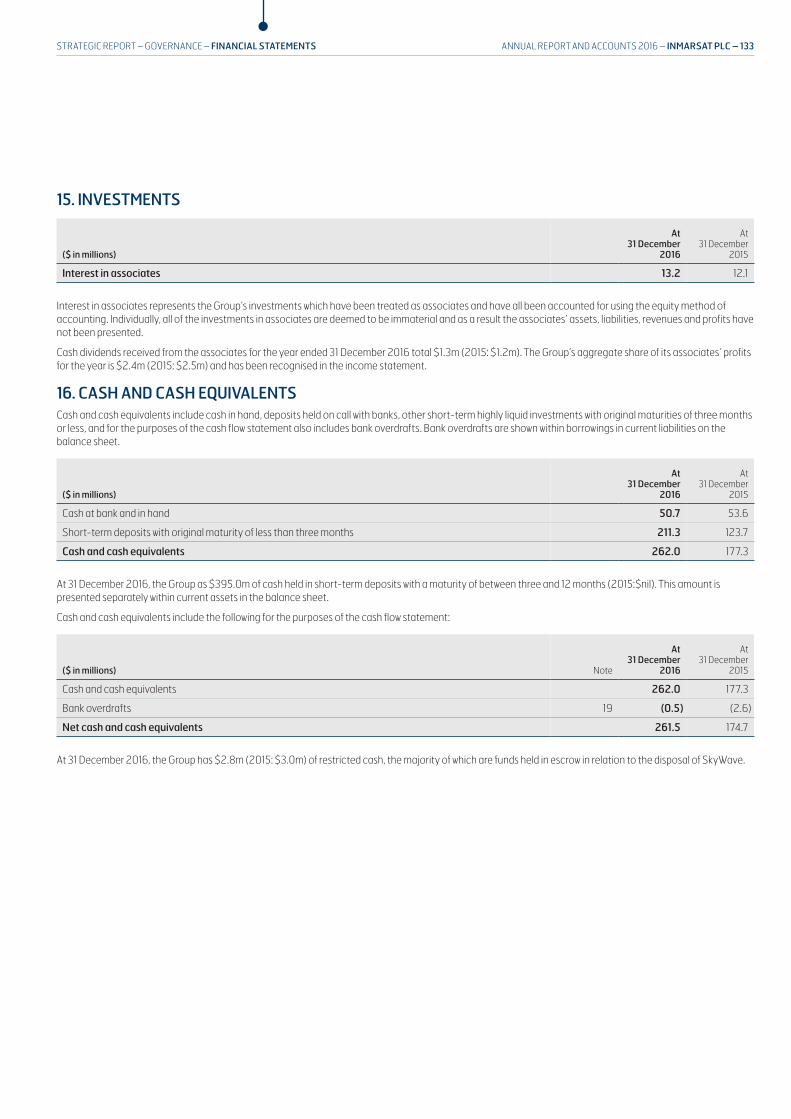
15. INVESTMENTS
($ in millions)
At31 December
2016
At 31 December
2015
Interest in associates 13.2 12.1
Interest in associates represents the Group’s investments which have been treated as associates and have all been accounted for using the equity method of accounting. Individually, all of the investments in associates are deemed to be immaterial and as a result the associates’ assets, liabilities, revenues and profits have not been presented.
Cash dividends received from the associates for the year ended 31 December 2016 total $1.3m (2015: $1.2m). The Group’s aggregate share of its associates’ profits for the year is $2.4m (2015: $2.5m) and has been recognised in the income statement.
16. CASH AND CASH EQUIVALENTSCash and cash equivalents include cash in hand, deposits held on call with banks, other short-term highly liquid investments with original maturities of three months or less, and for the purposes of the cash flow statement also includes bank overdrafts. Bank overdrafts are shown within borrowings in current liabilities on the balance sheet.
($ in millions)
At31 December
2016
At 31 December
2015
Cash at bank and in hand 50.7 53.6
Short-term deposits with original maturity of less than three months 211.3 123.7
Cash and cash equivalents 262.0 177.3
At 31 December 2016, the Group as $395.0m of cash held in short-term deposits with a maturity of between three and 12 months (2015:$nil). This amount is presented separately within current assets in the balance sheet.
Cash and cash equivalents include the following for the purposes of the cash flow statement:
($ in millions) Note
At31 December
2016
At 31 December
2015
Cash and cash equivalents 262.0 177.3
Bank overdrafts 19 (0.5) (2.6)
Net cash and cash equivalents 261.5 174.7
At 31 December 2016, the Group has $2.8m (2015: $3.0m) of restricted cash, the majority of which are funds held in escrow in relation to the disposal of SkyWave.
ANNUAL REPORT AND ACCOUNTS 2016 – INMARSAT PLC – 133STRATEGIC REPORT – GOVERNANCE – FINANCIAL STATEMENTS
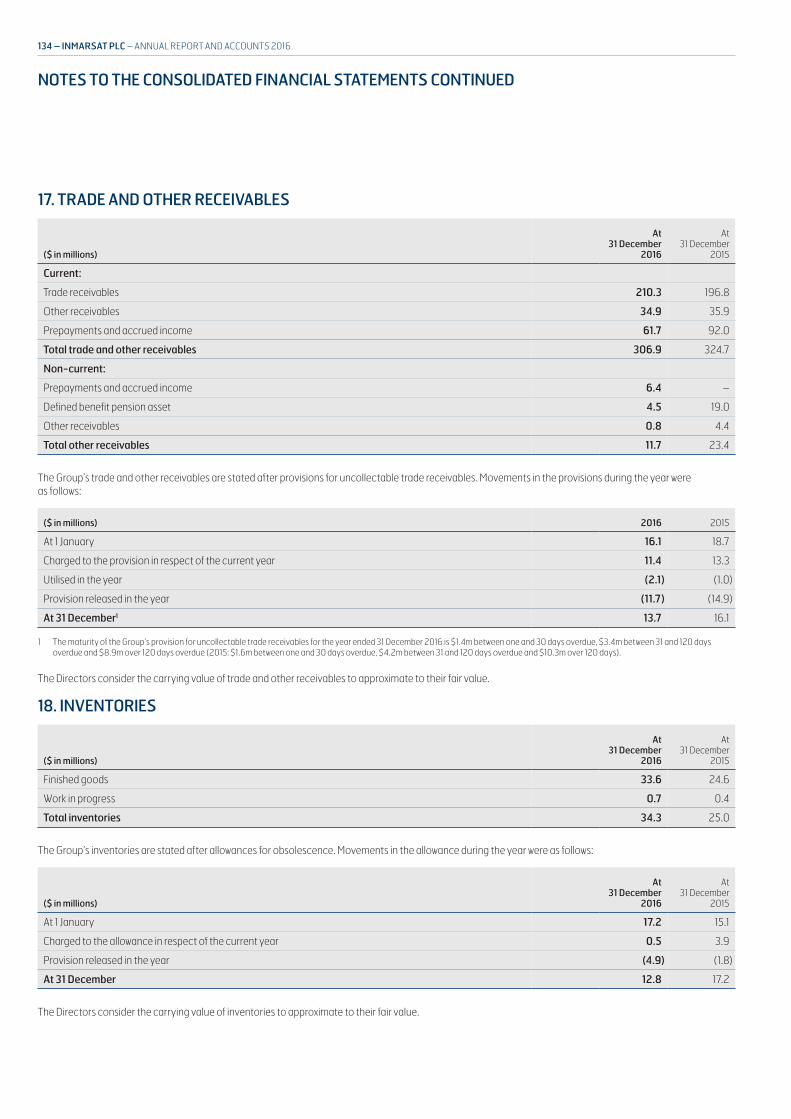
17. TRADE AND OTHER RECEIVABLES
($ in millions)
At31 December
2016
At 31 December
2015
Current:
Trade receivables 210.3 196.8
Other receivables 34.9 35.9
Prepayments and accrued income 61.7 92.0
Total trade and other receivables 306.9 324.7
Non-current:
Prepayments and accrued income 6.4 –
Defined benefit pension asset 4.5 19.0
Other receivables 0.8 4.4
Total other receivables 11.7 23.4
The Group’s trade and other receivables are stated after provisions for uncollectable trade receivables. Movements in the provisions during the year were as follows:
($ in millions) 2016 2015
At 1 January 16.1 18.7
Charged to the provision in respect of the current year 11.4 13.3
Utilised in the year (2.1) (1.0)
Provision released in the year (11.7) (14.9)
At 31 December1 13.7 16.1
1 The maturity of the Group’s provision for uncollectable trade receivables for the year ended 31 December 2016 is $1.4m between one and 30 days overdue, $3.4m between 31 and 120 days overdue and $8.9m over 120 days overdue (2015: $1.6m between one and 30 days overdue, $4.2m between 31 and 120 days overdue and $10.3m over 120 days).
The Directors consider the carrying value of trade and other receivables to approximate to their fair value.
18. INVENTORIES
($ in millions)
At31 December
2016
At 31 December
2015
Finished goods 33.6 24.6
Work in progress 0.7 0.4
Total inventories 34.3 25.0
The Group’s inventories are stated after allowances for obsolescence. Movements in the allowance during the year were as follows:
($ in millions)
At31 December
2016
At 31 December
2015
At 1 January 17.2 15.1
Charged to the allowance in respect of the current year 0.5 3.9
Provision released in the year (4.9) (1.8)
At 31 December 12.8 17.2
The Directors consider the carrying value of inventories to approximate to their fair value.
NOTES TO THE CONSOLIDATED FINANCIAL STATEMENTS CONTINUED
134 – INMARSAT PLC – ANNUAL REPORT AND ACCOUNTS 2016

19. NET BORROWINGS
($ in millions)
At 31 December 2016 At 31 December 2015
AmountDeferred
financing cost Net balance AmountDeferred
financing cost Net balance
Current:
Bank overdrafts 0.5 – 0.5 2.6 – 2.6
Deferred satellite payments 3.8 – 3.8 1.8 – 1.8
EIB Facility – – – 44.1 – 44.1
Ex-Im Bank Facilities 99.5 – 99.5 80.9 – 80.9
Total current borrowings 103.8 – 103.8 129.4 – 129.4
Non-current:
Deferred satellite payments 8.4 – 8.4 14.5 – 14.5
Senior Notes due 2022 1,000.0 (6.1) 993.9 1,000.0 (7.3) 992.7
– Net issuance discount (5.5) – (5.5) (6.5) – (6.5)
Senior Notes due 2024 400.0 (5.6) 394.4
EIB Facility – – – 88.1 (0.4) 87.7
Ex-Im Bank Facilities 533.9 (18.6) 515.3 633.3 (18.0) 615.3
Convertible Bonds due 2017 – – – 326.6 – 326.6
– Accretion of principal – – – 3.4 – 3.4
Convertible Bonds due 2023 545.5 (7.7) 537.8 – – –
– Accretion of principal 3.7 – 3.7 – – –
Total non-current borrowings 2,486.0 (38.0) 2,448.0 2,059.4 (25.7) 2,033.7
Total borrowings 2,589.8 (38.0) 2,551.8 2,188.8 (25.7) 2,163.1
Cash and cash equivalents (262.0) – (262.0) (177.3) – (177.3)
Short-term investments (395.0) – (395.0) – – –
Net borrowings 1,932.8 (38.0) 1,894.8 2,011.5 (25.7) 1,985.8
EIB FACILITY
In 2010, the Group signed an eight-year facility agreement with the European Investment Bank (the ‘EIB Facility’). The facility was repayable in equal annual instalments with interest equal to three-month USD LIBOR plus a margin, payable in January, April, July and October each year. On 31 October 2016, the Group fully repaid the EIB Facility.
EX-IM BANK FACILITIES
The Group has two direct financing agreements with the Export-Import Bank (the ‘Ex-Im Bank Facilities’) of the United States. The $700.0m facility signed in 2011 was available to be drawn down for four years and is now repayable in equal semi-annual instalments over a further 8.5 years. Drawings under this facility incur interest at a fixed rate of 3.11% for the life of the loan. In November 2014, the Group signed a seven-year $185.9m facility which has a total availability period of two years and will then be repayable in equal semi-annual instalments over a further five years. Drawings under this facility incur interest at a fixed rate of 1.96% for the life of the loan.
SENIOR NOTES DUE 2022 AND 2024
On 4 June 2014, the Group issued $1.0bn of 4.875% Senior Notes due 15 May 2022. The aggregate gross proceeds were $992.1m, net of $7.9m issuance discount. On 22 September 2016, the Group issued $400.0m of 6.5% Senior Notes due 1 October 2024.
SENIOR CREDIT FACILITY
On 22 May 2015, the Group signed a five-year $500.5m revolving credit facility (‘Senior Credit Facility’). Advances under the facility bear interest at a rate equal to the applicable USD LIBOR, plus a margin of between 0.70% and 1.70% determined by reference to the ratio of net debt to EBITDA. At 31 December 2016, there were no drawings under the Senior Credit Facility.
ANNUAL REPORT AND ACCOUNTS 2016 – INMARSAT PLC – 135STRATEGIC REPORT – GOVERNANCE – FINANCIAL STATEMENTS

CONVERTIBLE BONDS
In 2007, the Group issued $287.7m of 1.75% Convertible Bonds due 9 November 2017. The bonds were convertible into ordinary shares of the Company and had a 1.75% per annum coupon payable semi-annually and a yield to maturity of 4.5%. These bonds were repurchased in full on 12 September 2016.
On 9 September 2016, the Group issued $650m of 3.875% Convertible Bonds due 9 September 2023. The bonds are convertible into ordinary shares of the Company and have a 3.875% per annum coupon payable semi-annually and a yield to maturity of 3.681%. The bond is a net share settled instrument, meaning upon conversion the Group will repay the principal of $650m in cash and satisfy the remaining conversion value in ordinary shares (if the market value of the Company’s shares at settlement date exceeds the conversion price of $13.41 and the option is exercised by the Bondholder).
Upon issuance, in accordance with IAS 32 the instrument was bifurcated between a cash debt component and a derivative liability component, being $545.5m and $104.5m respectively. The debt component meets the definition of net borrowings and over the term of the bond will accrete up to the principal value of $650.0m with the cost of that accretion recognised in net financing costs. The derivative liability represents the value of the conversion rights associated with the instrument and is accounted for at fair value through profit and loss. It is excluded from net borrowings with the mark-to-market movements recognised in net financing costs as this represents the movement in fair value of the derivative component of the bond.
($ in millions) Note
Fair value of Convertible Bonds issued 650.0
Cost of issue (8.1)
Net proceeds 641.9
Derivative liability component (104.5)
Debt liability component at date of issue 537.4
Amortisation of debt issue costs in 2016 0.4
Interest charged in 2016 11.6
Coupon interest in 2016 (7.9)
Debt liability component at 31 December 2016 541.5
Fair value of derivative liability component at 31 December 2016 31 133.4
Fair value of Convertible Bond at 31 December 2016 674.9
The interest charged for the year is calculated by applying an effective interest rate of 6.8% to the liability component. The total interest charge is split between the coupon interest charge of $7.9m and accreted interest of $3.7m, with both charges recognised in net financing costs in the income statement. The coupon interest is paid semi-annually in March and September with the liability recognised in accrued interest (note 20). Similarly, the bonds accrete semi-annually in March and September with the liability recognised in borrowings.
The Directors consider the carrying value of borrowings, other than the Senior Notes, Convertible Bonds and the Ex-Im Bank 2011 Facility to approximate to their fair value (see note 31). The effective interest rates at the balance sheet dates were as follows:
Effective interest rate % 2016 2015
Bank overdrafts 3.75 1.25
EIB Facility – 1.66
Senior Notes due 2022 4.88 4.88
Senior Notes due 2024 6.50 –
Ex-Im Bank 2011 Facility 3.11 3.11
Ex-Im Bank 2014 Facility 1.96 1.96
Deferred satellite payments 3.75 4.00
Convertible Bonds due 2017 – 9.88
Convertible Bonds due 2023 6.80 –
NOTES TO THE CONSOLIDATED FINANCIAL STATEMENTS CONTINUED
136 – INMARSAT PLC – ANNUAL REPORT AND ACCOUNTS 2016

20. TRADE AND OTHER PAYABLES
($ in millions)
At31 December
2016
At 31 December
2015
Current:
Trade payables 133.8 91.6
Deferred consideration 0.5 1.5
Other taxation and social security payables 5.7 7.9
Other payables 11.2 6.8
Accruals and deferred income1 357.1 357.1
Total trade and other payables 508.3 464.9
Non-current:
Deferred consideration 0.2 0.5
Other payables 23.8 24.1
Defined benefit pension and post-employment liability 17.5 18.3
Total other payables 41.5 42.9
1 The deferred income balance includes $197.8m (2015: $208.8m) relating to payments received from Ligado Networks. During the current financial year, $11.0m (2015: $nil) of these payments was released to the income statement.
The Directors consider the carrying value of trade and other payables to approximate to their fair value.
21. PROVISIONSMovements in the current portion of the Group’s provisions were as follows:
($ in millions)
Asset retirement
obligationsOther
provisions Total
Current:
At 1 January 2015 0.3 3.1 3.4
Charged in respect of current year – 3.7 3.7
Utilised in current year – (5.2) (5.2)
Revision in estimated timing of settlement (0.1) – (0.1)
At 31 December 2015 0.2 1.6 1.8
Charged in respect of current year 0.1 3.5 3.6
Utilised in current year – (3.5) (3.5)
At 31 December 2016 0.3 1.6 1.9
The Group’s other provisions relate primarily to restructuring charges. The associated cash flows in respect of the restructuring provisions outstanding at 31 December 2016 are expected to occur within one year.
ANNUAL REPORT AND ACCOUNTS 2016 – INMARSAT PLC – 137STRATEGIC REPORT – GOVERNANCE – FINANCIAL STATEMENTS
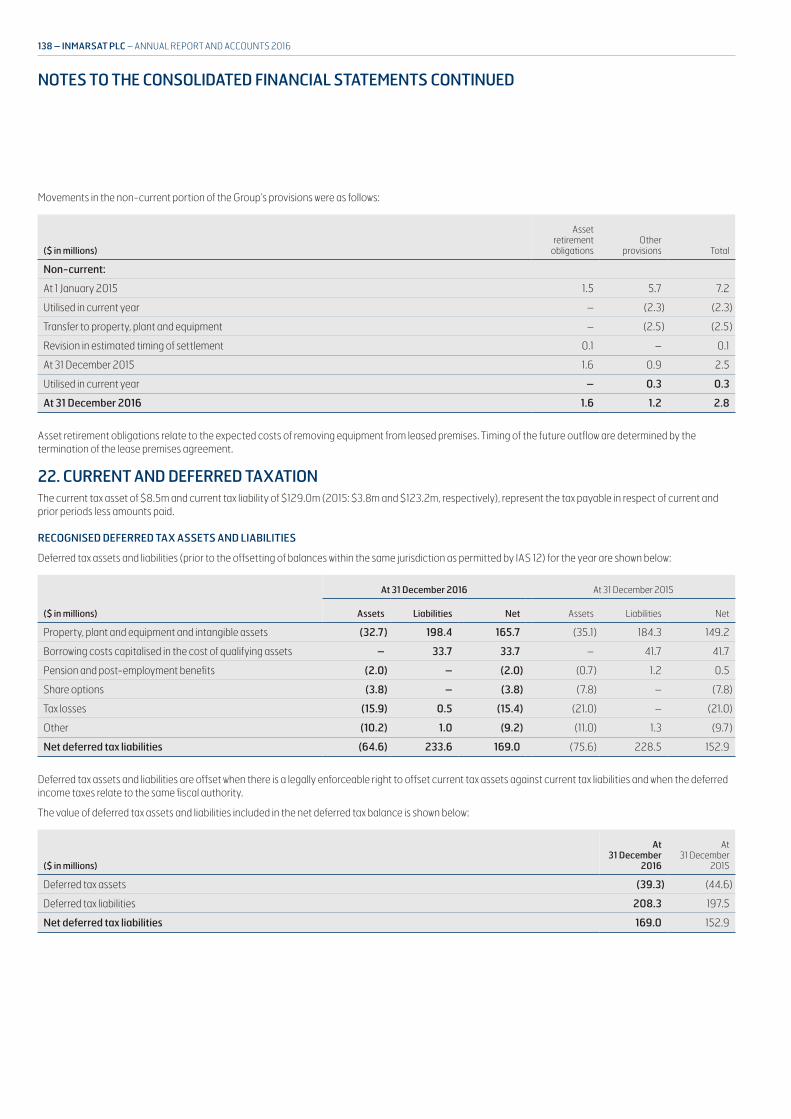
Movements in the non-current portion of the Group’s provisions were as follows:
($ in millions)
Asset retirement
obligationsOther
provisions Total
Non-current:
At 1 January 2015 1.5 5.7 7.2
Utilised in current year – (2.3) (2.3)
Transfer to property, plant and equipment – (2.5) (2.5)
Revision in estimated timing of settlement 0.1 – 0.1
At 31 December 2015 1.6 0.9 2.5
Utilised in current year – 0.3 0.3
At 31 December 2016 1.6 1.2 2.8
Asset retirement obligations relate to the expected costs of removing equipment from leased premises. Timing of the future outflow are determined by the termination of the lease premises agreement.
22. CURRENT AND DEFERRED TAXATIONThe current tax asset of $8.5m and current tax liability of $129.0m (2015: $3.8m and $123.2m, respectively), represent the tax payable in respect of current and prior periods less amounts paid.
RECOGNISED DEFERRED TAX ASSETS AND LIABILITIES
Deferred tax assets and liabilities (prior to the offsetting of balances within the same jurisdiction as permitted by IAS 12) for the year are shown below:
($ in millions)
At 31 December 2016 At 31 December 2015
Assets Liabilities Net Assets Liabilities Net
Property, plant and equipment and intangible assets (32.7) 198.4 165.7 (35.1) 184.3 149.2
Borrowing costs capitalised in the cost of qualifying assets – 33.7 33.7 – 41.7 41.7
Pension and post-employment benefits (2.0) – (2.0) (0.7) 1.2 0.5
Share options (3.8) – (3.8) (7.8) – (7.8)
Tax losses (15.9) 0.5 (15.4) (21.0) – (21.0)
Other (10.2) 1.0 (9.2) (11.0) 1.3 (9.7)
Net deferred tax liabilities (64.6) 233.6 169.0 (75.6) 228.5 152.9
Deferred tax assets and liabilities are offset when there is a legally enforceable right to offset current tax assets against current tax liabilities and when the deferred income taxes relate to the same fiscal authority.
The value of deferred tax assets and liabilities included in the net deferred tax balance is shown below:
($ in millions)
At31 December
2016
At31 December
2015
Deferred tax assets (39.3) (44.6)
Deferred tax liabilities 208.3 197.5
Net deferred tax liabilities 169.0 152.9
NOTES TO THE CONSOLIDATED FINANCIAL STATEMENTS CONTINUED
138 – INMARSAT PLC – ANNUAL REPORT AND ACCOUNTS 2016

Movement in temporary differences during the year:
($ in millions)
At 1 January
2016 Recognised
in incomeRecognised
in equity
Recognised in other
comprehensive income
At 31 December
2016
Property, plant and equipment and intangible assets 149.2 16.5 – – 165.7
Borrowing costs capitalised in the cost of qualifying assets 41.7 (8.0) – – 33.7
Other (9.7) 0.7 – (0.2) (9.2)
Pension and post-employment benefits 0.5 0.1 – (2.6) (2.0)
Share-based payments (7.8) 0.8 3.2 – (3.8)
Tax losses (21.0) 5.6 – – (15.4)
Total 152.9 15.7 3.2 (2.8) 169.0
($ in millions)
At1 January
2015 Recognised
in incomeRecognised
in equity
Recognised in other
comprehensive income
At31 December
2015
Property, plant and equipment and intangible assets 155.7 (6.5) – – 149.2
Borrowing costs capitalised in the cost of qualifying assets 37.7 4.0 – – 41.7
Pension and post-employment benefits (0.3) 0.2 – 0.6 0.5
Share-based payments (6.9) 0.2 (1.1) – (7.8)
Tax losses (20.6) (0.4) – – (21.0)
Other (6.0) (2.5) – (1.2) (9.7)
Total 159.6 (5.0) (1.1) (0.6) 152.9
Total unprovided deferred tax assets:
($ in millions)
At31 December
2016
At31 December
2015
Temporary timing differences – (0.3)
Unused income tax losses (34.1) (3.7)
Unused capital losses (24.2) (24.2)
Total (58.3) (28.2)
Overseas dividends received are largely exempt from UK tax but may be subject to foreign withholding taxes. The unrecognised gross temporary difference in respect of the unremitted earnings of those overseas subsidiaries affected by such taxes is $nil (2015: $nil), resulting in a deferred tax liability of $nil (2015: $nil).
The Budget announced by the Chancellor on 16 March 2016 included changes to the main rates of corporation tax for UK companies. The standard rate of corporation tax remains 20% for the financial year 1 April 2016, however there will be a further reduction to 19% with effect from 1 April 2017, and to 17% from 1 April 2020. The deferred tax assets and liabilities at the balance sheet date are calculated taking account of the forecast impact of the reduction of the corporation tax rate from 20% to the substantively enacted rate of 17%.
ANNUAL REPORT AND ACCOUNTS 2016 – INMARSAT PLC – 139STRATEGIC REPORT – GOVERNANCE – FINANCIAL STATEMENTS
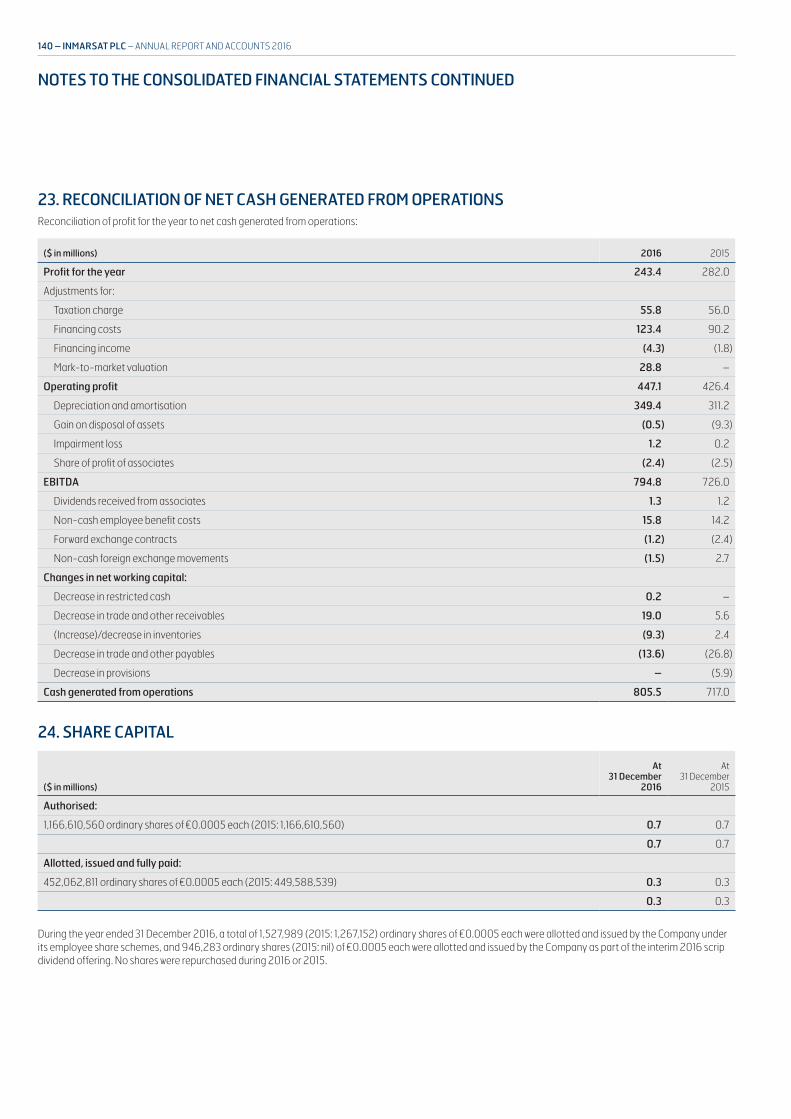
23. RECONCILIATION OF NET CASH GENERATED FROM OPERATIONSReconciliation of profit for the year to net cash generated from operations:
($ in millions) 2016 2015
Profit for the year 243.4 282.0
Adjustments for:
Taxation charge 55.8 56.0
Financing costs 123.4 90.2
Financing income (4.3) (1.8)
Mark-to-market valuation 28.8 –
Operating profit 447.1 426.4
Depreciation and amortisation 349.4 311.2
Gain on disposal of assets (0.5) (9.3)
Impairment loss 1.2 0.2
Share of profit of associates (2.4) (2.5)
EBITDA 794.8 726.0
Dividends received from associates 1.3 1.2
Non-cash employee benefit costs 15.8 14.2
Forward exchange contracts (1.2) (2.4)
Non-cash foreign exchange movements (1.5) 2.7
Changes in net working capital:
Decrease in restricted cash 0.2 –
Decrease in trade and other receivables 19.0 5.6
(Increase)/decrease in inventories (9.3) 2.4
Decrease in trade and other payables (13.6) (26.8)
Decrease in provisions – (5.9)
Cash generated from operations 805.5 717.0
24. SHARE CAPITAL
($ in millions)
At31 December
2016
At31 December
2015
Authorised:
1,166,610,560 ordinary shares of €0.0005 each (2015: 1,166,610,560) 0.7 0.7
0.7 0.7
Allotted, issued and fully paid:
452,062,811 ordinary shares of €0.0005 each (2015: 449,588,539) 0.3 0.3
0.3 0.3
During the year ended 31 December 2016, a total of 1,527,989 (2015: 1,267,152) ordinary shares of €0.0005 each were allotted and issued by the Company under its employee share schemes, and 946,283 ordinary shares (2015: nil) of €0.0005 each were allotted and issued by the Company as part of the interim 2016 scrip dividend offering. No shares were repurchased during 2016 or 2015.
NOTES TO THE CONSOLIDATED FINANCIAL STATEMENTS CONTINUED
140 – INMARSAT PLC – ANNUAL REPORT AND ACCOUNTS 2016

25. EMPLOYEE SHARE OPTIONS AND AWARDSThe Group operates a number of share plans used to award options and shares to Directors and employees as part of their remuneration packages. In 2014, the Inmarsat plc Executive Share Plan (‘ESP’) was approved by shareholders and replaced the previous Executive Share Plans. Share awards since May 2014 have been made in accordance with the new share plan rules. Under the ESP the Company can grant Bonus Share Awards (‘BSA’) and Performance Share Awards (‘PSA’), which replicate the previous Bonus Share Plan (‘BSP’) and Performance Share Plan (‘PSP’) awards. The costs of these awards are recognised in the income statement (see note 7) based on the fair value of the awards on the grant date. Further information on how these are calculated can be found on the next page and under ‘Employee benefits’ in the principal accounting policies on page 120.
STAFF VALUE PARTICIPATION PLAN
All options granted under the Staff Value Participation Plan (the ‘2004 Plan’) have vested and expired. Whenever options are exercised under the 2004 Plan, the holder must pay a de minimis charge of €1 for each tranche of options exercised. The options expire 10 years from the date of grant. Shares are transferred to the option holders from the Inmarsat Employees’ Share Ownership Plan Trust (the ‘Trust’) (resident in Jersey). No new shares have been issued to satisfy the exercise of these options.
A summary of all share activity within the Trust, which reflects the options outstanding under the 2004 Plan as at 31 December 2016, is as follows:
($ in millions)
Shares available for
grant
2004 Plan options
outstanding
Weighted average
exercise price per option
Balance at 1 January 2015 224,128 50,515 £3.74
Exercised – Bonus Share Plan and Staff Value Participation Plan (136,557) –
Balance at 31 December 2015 and 2016 87,571 –
Exercisable at 31 December 2016 87,571 –
BONUS SHARE AWARD
Awards have been made regularly under the BSA to Executive Directors and certain members of senior management. Further information on awards granted to Directors can be found in the Remuneration report on page 101.
Awards are made in the form of a conditional allocation of shares. The performance conditions attached to the BSA are non-market-based performance conditions. Any dividends paid by the Company will accrue and be added as additional shares upon vesting.
Under the rules of the BSA the Remuneration Committee has the discretion to satisfy the awards using cash instead of shares. It is, however, the intention of the Company to generally satisfy the awards using newly-issued shares.
As the BSA provides non-contributory share awards that have an entitlement to dividends and no market-based performance conditions attached, the fair value of the awards is the value of the grant. This is due to the fact that regardless of the market price at the time the award of shares is made, the total value of shares to be awarded (excluding shares added in lieu of dividends) will not change.
The Remuneration Committee has approved a Long-Term Incentive Plan (‘LTIP’), for the Group’s Business Unit presidents and certain members of staff. The three-year plan relates to the 2012 to 2014 financial years and awards are made according to achievements against non-market-based targets. Any dividends paid by the Company will accrue and be added as additional shares upon vesting. Since 2015, this plan has been replaced and the participants of the LTIP are now included within the BSA scheme.
PERFORMANCE SHARE AWARD
The PSA makes regular annual awards to Executive Directors and certain members of senior management. Further information on awards granted to Directors can be found in the Remuneration report on page 102. Participants are entitled to receive the value of any dividends that are paid between the date of award and the date of vesting in the form of additional shares. Any such additional shares are only added to the number of shares which will vest subject to performance conditions being satisfied.
The PSA shares will not ordinarily be transferred to participants until the third anniversary of the award date. The transfer of shares is dependent upon performance conditions being satisfied over the three consecutive financial years starting in the financial year the award date falls. The rules of the PSA provide that the Remuneration Committee has the discretion to satisfy the awards using cash instead of shares. It is, however, the intention of the Company to satisfy the awards using newly-issued shares at the end of the relevant three-year period.
The performance conditions for the PSA are based on the Group’s Total Shareholder Return (‘TSR’) relative to constituents of the FTSE 50-150 and FTSE 350 Indices (excluding investment trusts), depending upon the year of the award, and on EBITDA or revenue growth measured over a three-year period. For the awards made in 2012, 2013 and 2014, the vesting schedule is structured so that 50% of the reward is linked to the performance of TSR and 50% is linked to EBITDA, as individual performance measures. The market-based performance condition has been incorporated into the fair value. For the 2015 and 2016 awards, the vesting schedule has been restructured so that 30% of the reward is linked to the performance of TSR for Executive Directors (for any participants below Executive Director level this is linked to revenue growth over the three-year period of the awards), 30% is linked to EBITDA and 40% is linked to strategic objectives set out prior to the grant date of the scheme.
ANNUAL REPORT AND ACCOUNTS 2016 – INMARSAT PLC – 141STRATEGIC REPORT – GOVERNANCE – FINANCIAL STATEMENTS
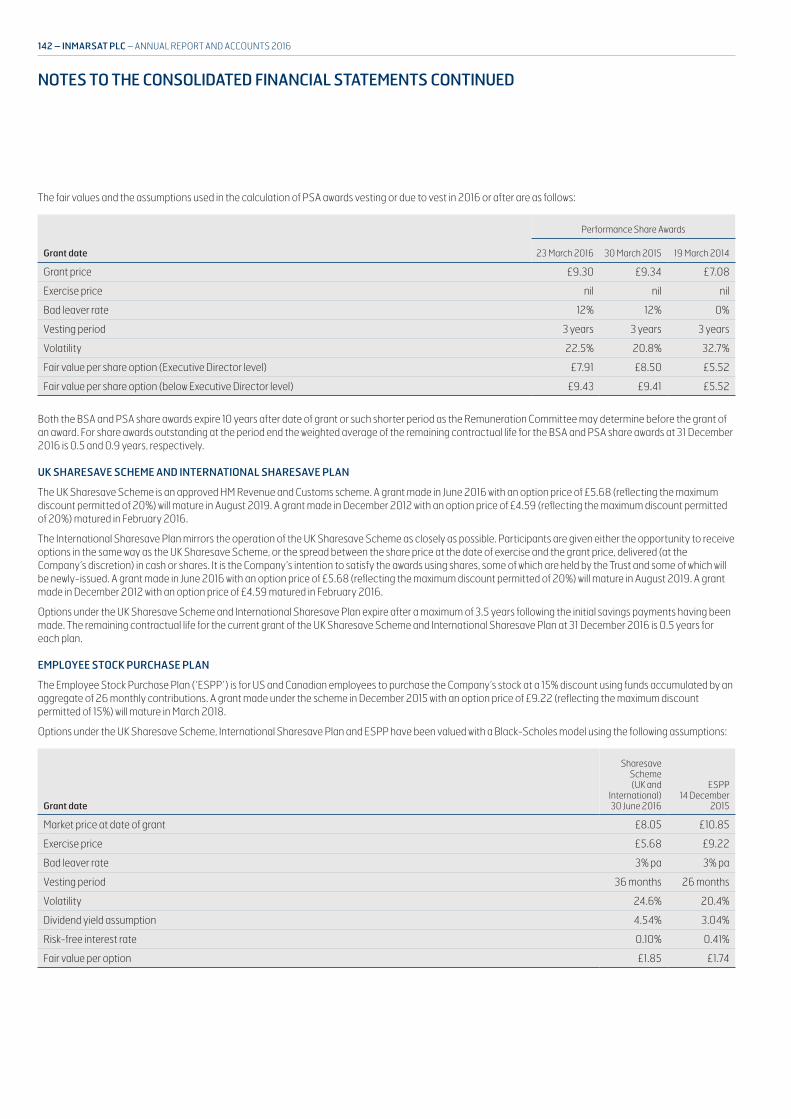
The fair values and the assumptions used in the calculation of PSA awards vesting or due to vest in 2016 or after are as follows:
Grant date
Performance Share Awards
23 March 2016 30 March 2015 19 March 2014
Grant price £9.30 £9.34 £7.08
Exercise price nil nil nil
Bad leaver rate 12% 12% 0%
Vesting period 3 years 3 years 3 years
Volatility 22.5% 20.8% 32.7%
Fair value per share option (Executive Director level) £7.91 £8.50 £5.52
Fair value per share option (below Executive Director level) £9.43 £9.41 £5.52
Both the BSA and PSA share awards expire 10 years after date of grant or such shorter period as the Remuneration Committee may determine before the grant of an award. For share awards outstanding at the period end the weighted average of the remaining contractual life for the BSA and PSA share awards at 31 December 2016 is 0.5 and 0.9 years, respectively.
UK SHARESAVE SCHEME AND INTERNATIONAL SHARESAVE PLAN
The UK Sharesave Scheme is an approved HM Revenue and Customs scheme. A grant made in June 2016 with an option price of £5.68 (reflecting the maximum discount permitted of 20%) will mature in August 2019. A grant made in December 2012 with an option price of £4.59 (reflecting the maximum discount permitted of 20%) matured in February 2016.
The International Sharesave Plan mirrors the operation of the UK Sharesave Scheme as closely as possible. Participants are given either the opportunity to receive options in the same way as the UK Sharesave Scheme, or the spread between the share price at the date of exercise and the grant price, delivered (at the Company’s discretion) in cash or shares. It is the Company’s intention to satisfy the awards using shares, some of which are held by the Trust and some of which will be newly-issued. A grant made in June 2016 with an option price of £5.68 (reflecting the maximum discount permitted of 20%) will mature in August 2019. A grant made in December 2012 with an option price of £4.59 matured in February 2016.
Options under the UK Sharesave Scheme and International Sharesave Plan expire after a maximum of 3.5 years following the initial savings payments having been made. The remaining contractual life for the current grant of the UK Sharesave Scheme and International Sharesave Plan at 31 December 2016 is 0.5 years for each plan.
EMPLOYEE STOCK PURCHASE PLAN
The Employee Stock Purchase Plan (‘ESPP’) is for US and Canadian employees to purchase the Company’s stock at a 15% discount using funds accumulated by an aggregate of 26 monthly contributions. A grant made under the scheme in December 2015 with an option price of £9.22 (reflecting the maximum discount permitted of 15%) will mature in March 2018.
Options under the UK Sharesave Scheme, International Sharesave Plan and ESPP have been valued with a Black-Scholes model using the following assumptions:
Grant date
Sharesave Scheme (UK and
International)30 June 2016
ESPP14 December
2015
Market price at date of grant £8.05 £10.85
Exercise price £5.68 £9.22
Bad leaver rate 3% pa 3% pa
Vesting period 36 months 26 months
Volatility 24.6% 20.4%
Dividend yield assumption 4.54% 3.04%
Risk-free interest rate 0.10% 0.41%
Fair value per option £1.85 £1.74
NOTES TO THE CONSOLIDATED FINANCIAL STATEMENTS CONTINUED
142 – INMARSAT PLC – ANNUAL REPORT AND ACCOUNTS 2016
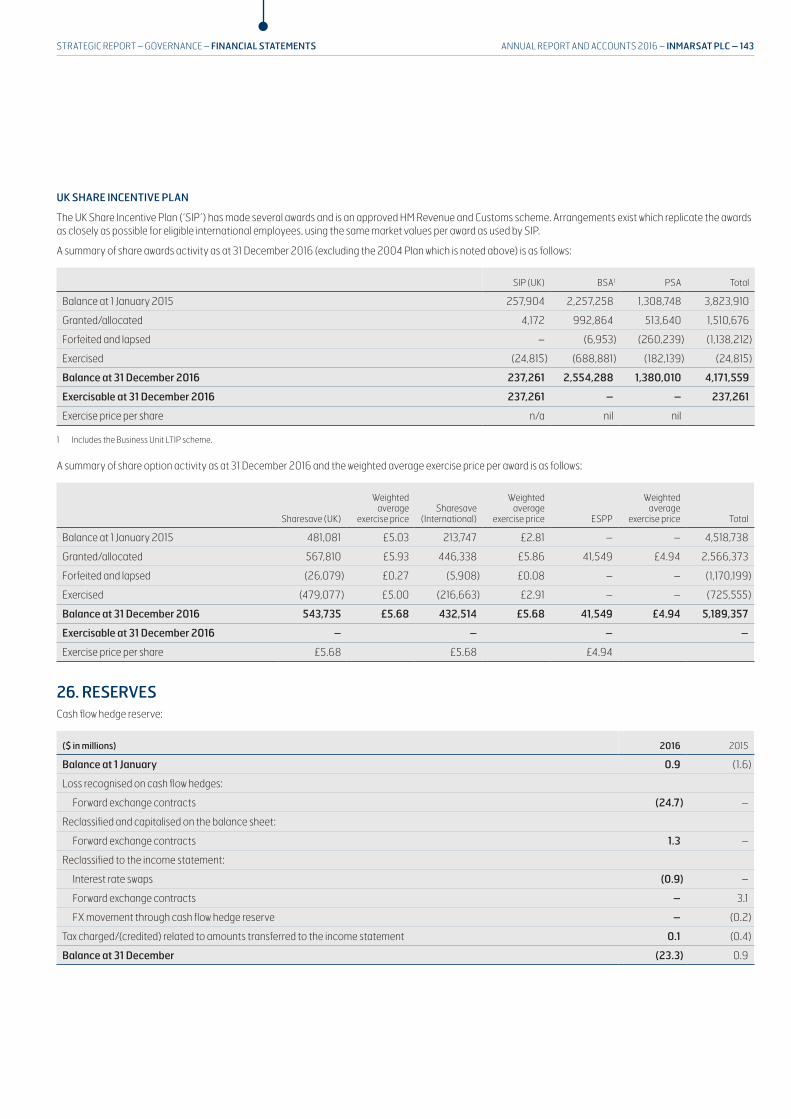
UK SHARE INCENTIVE PLAN
The UK Share Incentive Plan (‘SIP’) has made several awards and is an approved HM Revenue and Customs scheme. Arrangements exist which replicate the awards as closely as possible for eligible international employees, using the same market values per award as used by SIP.
A summary of share awards activity as at 31 December 2016 (excluding the 2004 Plan which is noted above) is as follows:
SIP (UK) BSA1 PSA Total
Balance at 1 January 2015 257,904 2,257,258 1,308,748 3,823,910
Granted/allocated 4,172 992,864 513,640 1,510,676
Forfeited and lapsed – (6,953) (260,239) (1,138,212)
Exercised (24,815) (688,881) (182,139) (24,815)
Balance at 31 December 2016 237,261 2,554,288 1,380,010 4,171,559
Exercisable at 31 December 2016 237,261 – – 237,261
Exercise price per share n/a nil nil
1 Includes the Business Unit LTIP scheme.
A summary of share option activity as at 31 December 2016 and the weighted average exercise price per award is as follows:
Sharesave (UK)
Weighted average
exercise priceSharesave
(International)
Weighted average
exercise price ESPP
Weighted average
exercise price Total
Balance at 1 January 2015 481,081 £5.03 213,747 £2.81 – – 4,518,738
Granted/allocated 567,810 £5.93 446,338 £5.86 41,549 £4.94 2,566,373
Forfeited and lapsed (26,079) £0.27 (5,908) £0.08 – – (1,170,199)
Exercised (479,077) £5.00 (216,663) £2.91 – – (725,555)
Balance at 31 December 2016 543,735 £5.68 432,514 £5.68 41,549 £4.94 5,189,357
Exercisable at 31 December 2016 – – – –
Exercise price per share £5.68 £5.68 £4.94
26. RESERVESCash flow hedge reserve:
($ in millions) 2016 2015
Balance at 1 January 0.9 (1.6)
Loss recognised on cash flow hedges:
Forward exchange contracts (24.7) –
Reclassified and capitalised on the balance sheet:
Forward exchange contracts 1.3 –
Reclassified to the income statement:
Interest rate swaps (0.9) –
Forward exchange contracts – 3.1
FX movement through cash flow hedge reserve – (0.2)
Tax charged/(credited) related to amounts transferred to the income statement 0.1 (0.4)
Balance at 31 December (23.3) 0.9
ANNUAL REPORT AND ACCOUNTS 2016 – INMARSAT PLC – 143STRATEGIC REPORT – GOVERNANCE – FINANCIAL STATEMENTS
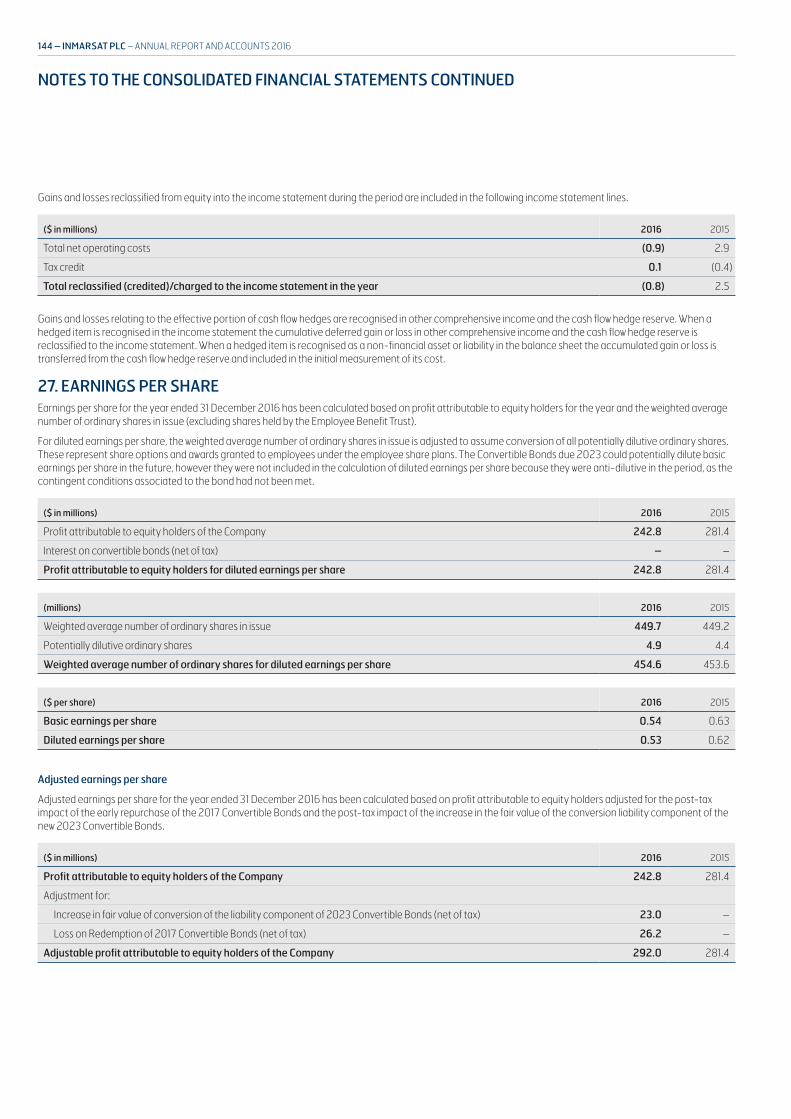
Gains and losses reclassified from equity into the income statement during the period are included in the following income statement lines.
($ in millions) 2016 2015
Total net operating costs (0.9) 2.9
Tax credit 0.1 (0.4)
Total reclassified (credited)/charged to the income statement in the year (0.8) 2.5
Gains and losses relating to the effective portion of cash flow hedges are recognised in other comprehensive income and the cash flow hedge reserve. When a hedged item is recognised in the income statement the cumulative deferred gain or loss in other comprehensive income and the cash flow hedge reserve is reclassified to the income statement. When a hedged item is recognised as a non-financial asset or liability in the balance sheet the accumulated gain or loss is transferred from the cash flow hedge reserve and included in the initial measurement of its cost.
27. EARNINGS PER SHARE Earnings per share for the year ended 31 December 2016 has been calculated based on profit attributable to equity holders for the year and the weighted average number of ordinary shares in issue (excluding shares held by the Employee Benefit Trust).
For diluted earnings per share, the weighted average number of ordinary shares in issue is adjusted to assume conversion of all potentially dilutive ordinary shares. These represent share options and awards granted to employees under the employee share plans. The Convertible Bonds due 2023 could potentially dilute basic earnings per share in the future, however they were not included in the calculation of diluted earnings per share because they were anti-dilutive in the period, as the contingent conditions associated to the bond had not been met.
($ in millions) 2016 2015
Profit attributable to equity holders of the Company 242.8 281.4
Interest on convertible bonds (net of tax) – –
Profit attributable to equity holders for diluted earnings per share 242.8 281.4
(millions) 2016 2015
Weighted average number of ordinary shares in issue 449.7 449.2
Potentially dilutive ordinary shares 4.9 4.4
Weighted average number of ordinary shares for diluted earnings per share 454.6 453.6
($ per share) 2016 2015
Basic earnings per share 0.54 0.63
Diluted earnings per share 0.53 0.62
Adjusted earnings per share
Adjusted earnings per share for the year ended 31 December 2016 has been calculated based on profit attributable to equity holders adjusted for the post-tax impact of the early repurchase of the 2017 Convertible Bonds and the post-tax impact of the increase in the fair value of the conversion liability component of the new 2023 Convertible Bonds.
($ in millions) 2016 2015
Profit attributable to equity holders of the Company 242.8 281.4
Adjustment for:
Increase in fair value of conversion of the liability component of 2023 Convertible Bonds (net of tax) 23.0 –
Loss on Redemption of 2017 Convertible Bonds (net of tax) 26.2 –
Adjustable profit attributable to equity holders of the Company 292.0 281.4
NOTES TO THE CONSOLIDATED FINANCIAL STATEMENTS CONTINUED
144 – INMARSAT PLC – ANNUAL REPORT AND ACCOUNTS 2016

(millions) 2016 2015
Weighted average number of ordinary shares in issue 449.7 449.2
Potentially dilutive ordinary shares 4.9 4.4
Weighted average number of ordinary shares for diluted earnings per share 454.6 453.6
($ per share) 2016 2015
Basic earnings per share 0.65 0.63
Diluted earnings per share 0.64 0.62
28. PENSIONS AND POST-EMPLOYMENT BENEFITSThe Group operates pension schemes in each of its principal locations. The Group’s pension plans are provided through both defined benefit schemes and defined contribution arrangements.
The Group operates defined benefit pension schemes in the United Kingdom, regulated by the Pensions Regulator, and The Netherlands. The Group’s principal defined benefit pension plan is the Inmarsat Global scheme, which is a UK funded scheme with assets held in a separate fund administered by a corporate trustee; the scheme is closed to new employees. The trustee is required by law to act in the interest of the fund and of all relevant stakeholders in the scheme. The trustees of the pension schemes are responsible for the investment policy with regards to the assets of the fund.
The Group is required to ensure that the plan is fully funded where the future liabilities for benefits are covered by the fund’s assets. The Group is also required to make employer contributions at 15% of the members salary to the fund assets. The size of the asset that can be recognised as a result of a pension surplus should not exceed the recoverable amount and is restricted to the asset ceiling per IAS 19.
The Inmarsat Global defined benefit plan was valued using the projected unit credit method with the valuation undertaken by professionally qualified and independent actuaries as at 31 December 2016. The results of the valuation, which have been updated for any material transactions and material changes in circumstances (including changes in market prices and interest rates) up to 31 December 2016, are set out below.
The Group also provides post-employment benefits for some of its employees. The Group’s principal scheme is the Inmarsat Global post-retirement healthcare benefit scheme, which is the provision of healthcare to retired employees (and their dependants) who were employed before 1 January 1998. Employees who have 10 years of service at the age of 58 and retire are eligible to participate in the post-retirement healthcare benefit plans. Membership of this plan is multinational, although most staff are currently employed in the UK. The plans are self-funded and there are no plan assets from which the costs are paid. The cost of providing these benefits is actuarially determined and accrued over the service period of the active employee groups. The Group’s post-retirement medical liability is capped at CPI plus 1%.
Schemes denominated in local currencies are subject to fluctuations in the exchange rate between US Dollars and local currencies.
The primary risk to which the Inmarsat Global defined benefit plan exposes the Group is the risk arising through a mismatch between the plan’s assets and its liabilities. This is primarily made up of a number of strategic investment risks. The key strategic investment risks inherent in the current investment strategy are as follows:
> market risk (the risk that investment returns on assets are lower than assumed in the actuarial valuation, thereby resulting in the funding level being lower than expected)
> interest rate risk (the risk that the assets do not move in line with the value placed on the liabilities in response to changes in interest rates)
> inflation risk (similar to interest rate risk but concerning inflation)
> credit risk (the risk that payments due to corporate bond investors may not be made)
> active management risk (the risk that active managers underperform the markets in which they invest, resulting in lower-than-expected investment returns) and
> currency risk (the risk that currency market movements adversely impact investment returns)
In addition to the investment-related risks, the plan is also subject to the risk that members live longer than expected, or that the financial assumptions used in valuing the liabilities are not borne out in practice. This could lead to unexpected contributions from the Group being required to meet the benefit payments due.
ANNUAL REPORT AND ACCOUNTS 2016 – INMARSAT PLC – 145STRATEGIC REPORT – GOVERNANCE – FINANCIAL STATEMENTS

The principal actuarial assumptions used to calculate the Group’s pension and post-employment benefits liabilities under IAS 19 are:
At31 December
2016
At31 December
2015
Weighted average actuarial assumptions:
Discount rate 2.69% 3.92%
Future salary increases 3.23% 3.14%
Medical cost trend rate 3.57% 3.50%
Future pension increases 2.77% 3.01%
Mortality assumptions have been updated to reflect experience and expected changes in future improvements in life expectancy. The average life expectancy assumptions for the Company’s pension and post-employment benefits liabilities are as follows:
Life expectancy
2016
Life expectancy
2015
Male current age 65 88.6 88.5
Female current age 65 89.7 89.6
Mortality assumptions used are consistent with those recommended by the individual scheme actuaries and reflect the latest available tables, adjusted for the experience of the Group where appropriate. For the Inmarsat Global defined benefit pension scheme and the Inmarsat Global post-retirement healthcare benefits for 2016 and 2016, mortality has been assumed to follow the SAPS tables with -1 year age rating for males and CMI 2013 improvement with a long-term trend of 1.5%.
Significant actuarial assumptions for the determination of the defined benefit obligation are discount rate, expected salary increase, mortality and healthcare cost trend rates. The sensitivity analysis below is for the Group’s principal pension and post-employment benefits schemes, and has been determined based on reasonable possible changes of the assumptions occurring at the end of the reporting period assuming that all other assumptions are held constant.
Inmarsat Global defined benefit scheme:
Change in assumption
Impact on benefit
obligation increase/
(decrease)
Impact on projected
pension cost increase/
(decrease)
Increase in discount factor of 0.25% (6.1%) (18.6%)
Decrease in discount factor of 0.25% 6.5% 18.2%
Increase in inflation of 0.25% 6.1% 18.0%
Decrease in inflation of 0.25% (5.7%) (16.5%)
Mortality: -2 years for males and -1 year for females 3.4% 9.6%
Inmarsat Global post-retirement healthcare benefit scheme:
Change in assumption
Impact on benefit
obligation increase/
(decrease)
Impact on service cost
increase/ (decrease)
Increase in discount factor of 0.5% (6.2%) –
Increase in inflation of 0.5% 11.9% –
Increase in healthcare cost trend rate of 1% 20.1% 24.8%
Decrease in healthcare cost trend rate of 1% (15.9%) (19.4%)
In reality there is an expectation of inter-relationships between the assumptions, for example, between discount rate and inflation. The above analysis does not take the effect of these inter-relationships into account.
NOTES TO THE CONSOLIDATED FINANCIAL STATEMENTS CONTINUED
146 – INMARSAT PLC – ANNUAL REPORT AND ACCOUNTS 2016

Amounts recognised in the balance sheet are:
($ in millions)
At31 December
2016
At31 December
2015
Present value of funded defined benefit obligations (pension) (135.9) (109.2)
Present value of unfunded defined benefit obligations (pension) (0.4) (0.7)
Present value of unfunded defined benefit obligations (post-employment benefits) (16.7) (17.0)
Fair value of defined benefit assets 140.0 127.6
Net defined benefit (liability)/asset recognised in the balance sheet (13.0) 0.7
The above net liability is recognised in the balance sheet as follows:
($ in millions) Note
At31 December
2016
At31 December
2015
Defined benefit pension asset 17 4.5 19.0
Defined benefit pension and post-employment liability 20 (17.5) (18.3)
Analysis of the movement in the present value of the defined benefit obligations is as follows:
($ in millions)Defined benefit
pension plan
Post-employment
benefits
At 1 January 2015 117.2 18.4
Current service cost 2.7 0.2
Past service cost – (0.1)
Interest cost 4.4 0.7
Remeasurement losses:
Actuarial gains arising from changes in demographic assumptions (1.5) –
Actuarial gains arising from changes in financial assumptions (2.5) (0.7)
Actuarial gains arising from experience adjustments (2.9) –
Foreign exchange loss (7.4) (1.1)
Benefits paid (1.4) (0.4)
Contributions by pension participants 1.3 –
At 31 December 2015 109.9 17.0
Current service cost 1.7 0.1
Interest cost 3.6 0.6
Remeasurement losses:
Actuarial gains arising from changes in financial assumptions 37.8 2.0
Foreign exchange loss (16.8) (2.7)
Benefits paid (0.9) (0.3)
Contributions by pension participants 1.0 –
At 31 December 2016 136.3 16.7
ANNUAL REPORT AND ACCOUNTS 2016 – INMARSAT PLC – 147STRATEGIC REPORT – GOVERNANCE – FINANCIAL STATEMENTS
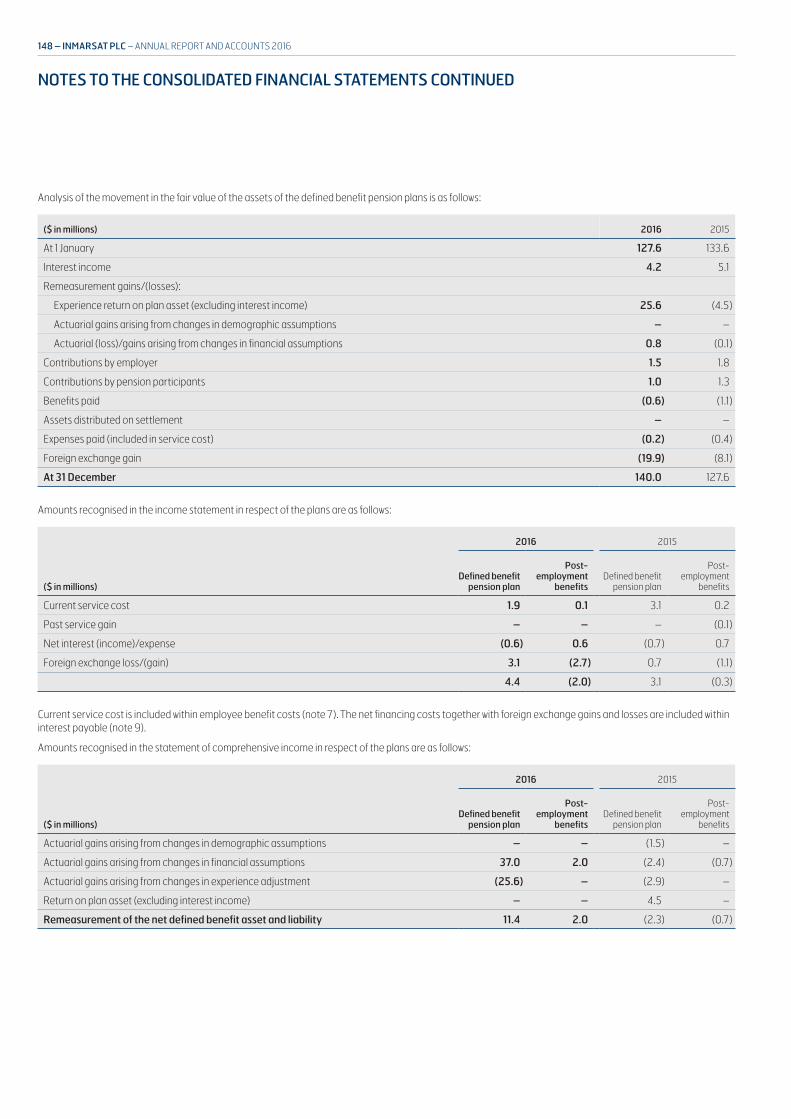
Analysis of the movement in the fair value of the assets of the defined benefit pension plans is as follows:
($ in millions) 2016 2015
At 1 January 127.6 133.6
Interest income 4.2 5.1
Remeasurement gains/(losses):
Experience return on plan asset (excluding interest income) 25.6 (4.5)
Actuarial gains arising from changes in demographic assumptions – –
Actuarial (loss)/gains arising from changes in financial assumptions 0.8 (0.1)
Contributions by employer 1.5 1.8
Contributions by pension participants 1.0 1.3
Benefits paid (0.6) (1.1)
Assets distributed on settlement – –
Expenses paid (included in service cost) (0.2) (0.4)
Foreign exchange gain (19.9) (8.1)
At 31 December 140.0 127.6
Amounts recognised in the income statement in respect of the plans are as follows:
($ in millions)
2016 2015
Defined benefit pension plan
Post-employment
benefitsDefined benefit
pension plan
Post-employment
benefits
Current service cost 1.9 0.1 3.1 0.2
Past service gain – – – (0.1)
Net interest (income)/expense (0.6) 0.6 (0.7) 0.7
Foreign exchange loss/(gain) 3.1 (2.7) 0.7 (1.1)
4.4 (2.0) 3.1 (0.3)
Current service cost is included within employee benefit costs (note 7). The net financing costs together with foreign exchange gains and losses are included within interest payable (note 9).
Amounts recognised in the statement of comprehensive income in respect of the plans are as follows:
($ in millions)
2016 2015
Defined benefit pension plan
Post-employment
benefitsDefined benefit
pension plan
Post-employment
benefits
Actuarial gains arising from changes in demographic assumptions – – (1.5) –
Actuarial gains arising from changes in financial assumptions 37.0 2.0 (2.4) (0.7)
Actuarial gains arising from changes in experience adjustment (25.6) – (2.9) –
Return on plan asset (excluding interest income) – – 4.5 –
Remeasurement of the net defined benefit asset and liability 11.4 2.0 (2.3) (0.7)
NOTES TO THE CONSOLIDATED FINANCIAL STATEMENTS CONTINUED
148 – INMARSAT PLC – ANNUAL REPORT AND ACCOUNTS 2016

The assets held in respect of the Group’s defined benefit schemes were as follows:
At 31 December 2016 At 31 December 2015
Value($ in millions)
Percentage of total plan
assets(%)
Value($ in millions)
Percentage of total plan
assets(%)
Equities 36.0 25.7% 36.6 32.93%
Cash 1.6 1.1% 0.1 0.07%
Bonds 78.5 56.1% 70.0 55.31%
Other 23.9 17.1% 20.9 11.68%
Fair value of scheme assets 140.0 127.6
The Inmarsat Global defined benefit plan assets, which contribute over 95% of the total Group assets, are all invested in pooled investment funds, the majority of which are priced daily, except for the High Lease-to-Value Property, Alternatives and Multi Asset Credit funds, which are priced monthly. With regard to private debt, the portfolio will be valued on an absolute basis, using the ‘best efforts’ value on a quarterly basis. Therefore, fund investments are primarily valued based on the market value/capital account statements received from the underlying general partners of the underlying funds. Capital account statements and unaudited financial statements are distributed approximately 90 days after each quarter. The fund also distributes US GAAP audited financials, including capital account statements, for each 31 December fiscal year-end around 30 June of the subsequent year.
The allocations to each of the investment funds as at 31 December 2016 are as follows:
Fund Legal structureAllocation
(%)
Passive Global Equity Mercer QIF CCF 4.9
Global Fundamental (RAFI) Equity Mercer QIF CCF 4.9
Global Low Volatility Equity MGI Funds PLC 3.0
Global Small Cap Equity MGI Funds PLC 4.5
Sustainable Equity MGI Funds PLC 2.0
Eurozone Equity MGI Funds PLC 0.5
Emerging Markets Equity MGI Funds PLC 7.6
Emerging Markets Debt MGI Funds PLC 3.0
Global High Yield Bonds MGI Funds PLC 1.1
Multi Asset Credit Mercer QIF Fund PLC 4.4
Absolute Return Fixed Income MGI Funds PLC 1.0
Liquid Alternatives Strategies Mercer QIF Fund PLC 9.2
High Lease-to-Value Property Mercer QIF CCF 2.2
Private Debt Mercer Private Investment Partners (Offshore) LLP 1.4
Total growth portfolio 49.7
UK Credit Mercer PIF Fund PLC 12.0
UK Inflation Linked Bonds MGI Funds PLC 6.7
UK Inflation Linked LDI Bonds Mercer QIF Fund PLC 2.4
Long Flexible Enhanced Matching Fixed Mercer QIF Fund PLC 4.5
Short Flexible Enhanced Matching Real Mercer QIF Fund PLC 1.7
Medium Flexible Enhanced Matching Real Mercer QIF Fund PLC 10.2
Long Flexible Enhanced Matching Real Mercer QIF Fund PLC 12.8
Total matching portfolio 50.3
Total assets 100.0
ANNUAL REPORT AND ACCOUNTS 2016 – INMARSAT PLC – 149STRATEGIC REPORT – GOVERNANCE – FINANCIAL STATEMENTS

The investment portfolio seeks to mitigate the investment risks identified above through a combination of asset class diversification, underlying investment manager diversification and the use of currency hedging where appropriate. The assets are split into two portfolios, the growth portfolio and the matching portfolio. The assets within the growth portfolio are invested so as to achieve an appropriate level of growth above that of the plan’s liabilities, ensuring a sufficiently diversified portfolio of investments provides the plan with a variety of sources of return, without unduly exposing the plan to a single type of risk. The assets within the matching portfolio are invested so as to minimise the level of unrewarded risk and ensure the portfolio broadly matches changes in the value of the plan’s liabilities. This is achieved by investing in a range of pooled investment funds as outlined in the table above, with the allocation to each fund determined by a combination of the following: the nature of the plan’s liability structure, the target level of hedging deemed appropriate to reflect the Trustee’s risk tolerance and a ‘fair value’ assessment of market levels. Some of these funds achieve their objectives by utilising a range of bond or bond type instruments, resulting in leveraged exposure which enables the plan to match a greater proportion of its liabilities than would be possible by only holding physical securities. Instruments utilised within the funds include fixed interest gilts, index-linked gilts, corporate bonds, gilt repos, interest rate swaps, inflation swaps and total return swaps.
The plan does not hold any direct investments in the Group; however, due to the pooled nature of the investment funds, there may be some indirect investment.
The duration of the defined benefit liabilities within the Inmarsat Global defined benefit plan is approximately 25 years. The defined benefit obligation within that plan is split as follows:
Active members 54% Deferred members 38% Pensioner members 8%
The average age of the active, deferred and pensioner members at the date of the last statutory funding valuation for the Inmarsat Global defined benefit plan (31 December 2014) was 54 years, 55 years and 68 years, respectively.
The estimated contributions expected to be paid into the Inmarsat Global defined benefit pension plan during 2017 are $2.2m. In 2016 actual contributions under this plan were $0.7m (2015: $1.0m).
Under the current Inmarsat Global defined benefit plan Recovery Plan and Schedule of Contributions there are no further contributions due in respect of the past service deficit revealed as part of the last statutory funding valuation as at 31 December 2014. The current Schedule of Contributions requires the Company to pay 15% of pensionable salary in respect of the additional accrual of future benefits for members of the defined benefit tier of the Pensionbuilder section and any notional member contributions payable under the SMART arrangement. Contributions in respect of the Defined Contribution tier and the Pensionsaver section are paid in addition.
The next statutory funding valuation of the plan will be carried out as at 31 December 2017. As part of this the Trustees and Company will be required to agree a pattern of contributions to cover any deficit revealed by the valuation, along with the rate payable for future accrual of benefits. This could lead to an increase or decrease from the current level of contributions.
29. OPERATING LEASE AND OTHER COMMITMENTSThe Group’s future aggregate minimum lease payments under non-cancellable operating leases and other unrecognised contractual commitments are as follows:
($ in millions)
At 31 December 2016 At 31 December 2015
Non-cancellable
operating leases
Other unrecognised
contractual commitments Total
Non-cancellable
operating leases
Other unrecognised
contractual commitments Total
Within one year 15.5 5.4 20.9 22.9 22.9 45.8
Within two to five years 50.5 36.4 86.9 45.6 18.7 64.3
After five years 72.1 0.8 72.9 51.1 0.7 51.8
138.1 42.6 180.7 119.6 42.3 161.9
Operating lease commitments primarily relate to leased office space, including the Group’s head office located at 99 City Road, London. Other unrecognised non-cancellable contractual commitments relate to network service contracts and maintenance contracts, which have varying terms.
The total of future sublease payments expected to be received under non-cancellable subleases at 31 December 2016 relating to the aforementioned head office lease is $0.2m over one year (at 31 December 2015: $0.5m over one year).
NOTES TO THE CONSOLIDATED FINANCIAL STATEMENTS CONTINUED
150 – INMARSAT PLC – ANNUAL REPORT AND ACCOUNTS 2016

In addition, the Group has the following purchase commitments, relating to future obligations to purchase space segment capacity:
($ in millions)
At31 December
2016
At31 December
2015
Within one year 30.4 16.1
Within two to five years 5.8 32.6
36.2 48.7
The Group has various agreements deriving revenue from designated leased capacity and leased equipment. These amounts are recorded as revenue on a straight-line basis over the respective lease terms and represent the majority of the Group’s future aggregate minimum lease payments under non-cancellable operating leases expected to be received:
($ in millions)
At31 December
2016
At31 December
2015
Within one year 23.3 29.0
Within two to five years 2.5 2.5
25.8 31.5
30. CAPITAL RISK MANAGEMENTThe following table summarises the capital of the Group:
($ in millions)
At31 December
2016
At31 December
2015
As per balance sheet
Cash and cash equivalents (262.0) (177.3)
Short-term deposits (395.0) –
Borrowings 2,551.8 2,163.1
Net borrowings 1,894.8 1,985.8
Equity attributable to shareholders of the parent 1,239.7 1,249.3
Capital 3,134.5 3,235.1
The Group’s objective when managing its capital is to safeguard its ability to continue as a going concern in order to provide returns for shareholders and benefits for other stakeholders and to maintain an optimal capital structure to reduce the cost of capital. The Group continually evaluates sources of capital and may repurchase, refinance, exchange or retire current or future borrowings and/or debt securities from time to time in private or open-market transactions, or by any other means permitted by the terms and conditions of borrowing facilities and debt securities. Additionally, the Group may adjust the amount of dividends paid to shareholders, return capital to shareholders, issue new shares or sell assets to reduce debt.
The Group uses a maximum ratio of net borrowings to EBITDA as an internal planning parameter and in regular forecasting and monitoring activities. In addition, movements in cash and borrowings as well as total available liquidity are monitored regularly.
The net borrowings (gross of deferred finance costs) to EBITDA ratio for the year ended 31 December 2016 is 2.43 (2015: 2.77). The Group’s liquidity is disclosed in note 3(d). No changes were made in the Group’s objectives, policies or processes for managing capital during the current or preceding year.
ANNUAL REPORT AND ACCOUNTS 2016 – INMARSAT PLC – 151STRATEGIC REPORT – GOVERNANCE – FINANCIAL STATEMENTS
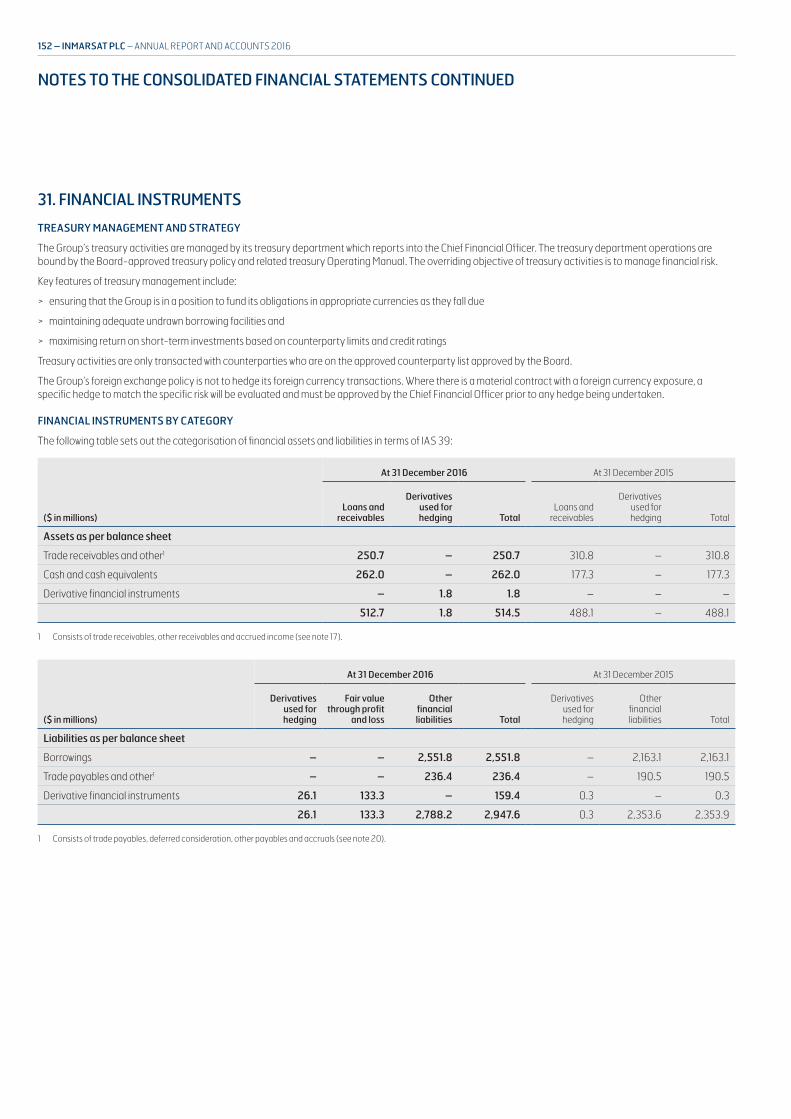
31. FINANCIAL INSTRUMENTS
TREASURY MANAGEMENT AND STRATEGY
The Group’s treasury activities are managed by its treasury department which reports into the Chief Financial Officer. The treasury department operations are bound by the Board-approved treasury policy and related treasury Operating Manual. The overriding objective of treasury activities is to manage financial risk.
Key features of treasury management include:
> ensuring that the Group is in a position to fund its obligations in appropriate currencies as they fall due
> maintaining adequate undrawn borrowing facilities and
> maximising return on short-term investments based on counterparty limits and credit ratings
Treasury activities are only transacted with counterparties who are on the approved counterparty list approved by the Board.
The Group’s foreign exchange policy is not to hedge its foreign currency transactions. Where there is a material contract with a foreign currency exposure, a specific hedge to match the specific risk will be evaluated and must be approved by the Chief Financial Officer prior to any hedge being undertaken.
FINANCIAL INSTRUMENTS BY CATEGORY
The following table sets out the categorisation of financial assets and liabilities in terms of IAS 39:
($ in millions)
At 31 December 2016 At 31 December 2015
Loans and receivables
Derivatives used for hedging Total
Loans and receivables
Derivatives used for hedging Total
Assets as per balance sheet
Trade receivables and other1 250.7 – 250.7 310.8 – 310.8
Cash and cash equivalents 262.0 – 262.0 177.3 – 177.3
Derivative financial instruments – 1.8 1.8 – – –
512.7 1.8 514.5 488.1 – 488.1
1 Consists of trade receivables, other receivables and accrued income (see note 17).
($ in millions)
At 31 December 2016 At 31 December 2015
Derivatives used for hedging
Fair value through profit
and loss
Other financial liabilities Total
Derivatives used for hedging
Other financial liabilities Total
Liabilities as per balance sheet
Borrowings – – 2,551.8 2,551.8 – 2,163.1 2,163.1
Trade payables and other1 – – 236.4 236.4 – 190.5 190.5
Derivative financial instruments 26.1 133.3 – 159.4 0.3 – 0.3
26.1 133.3 2,788.2 2,947.6 0.3 2,353.6 2,353.9
1 Consists of trade payables, deferred consideration, other payables and accruals (see note 20).
NOTES TO THE CONSOLIDATED FINANCIAL STATEMENTS CONTINUED
152 – INMARSAT PLC – ANNUAL REPORT AND ACCOUNTS 2016
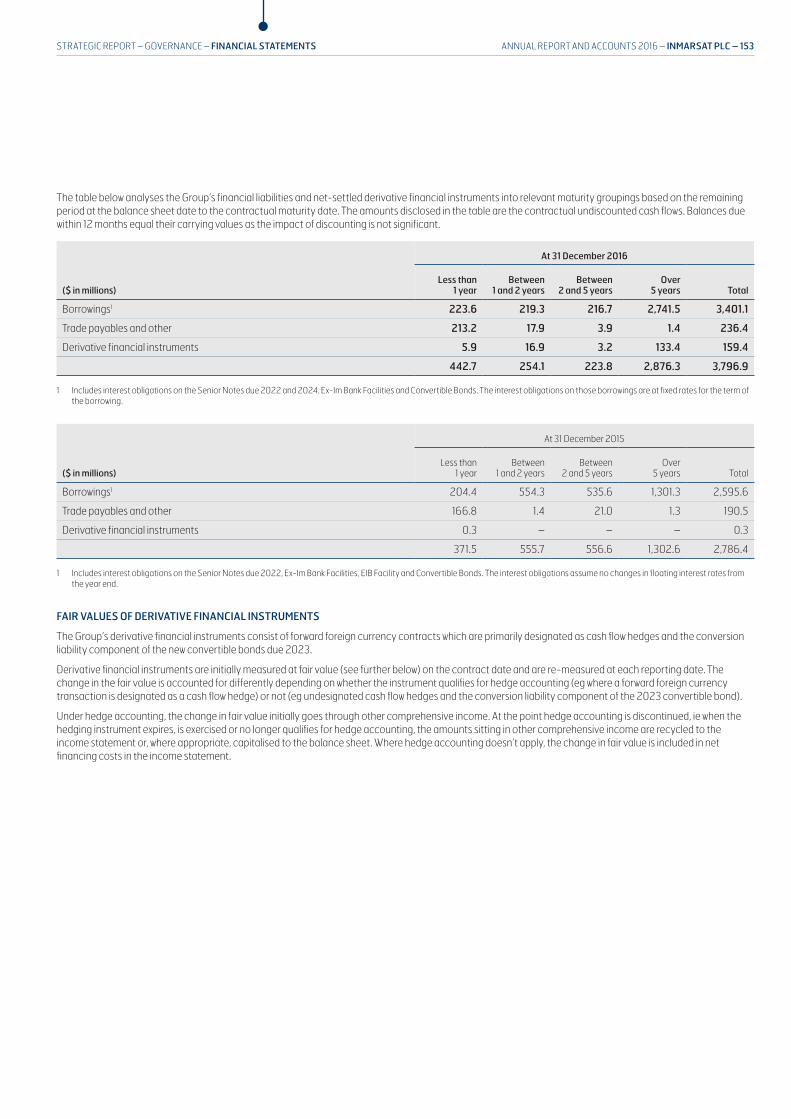
The table below analyses the Group’s financial liabilities and net-settled derivative financial instruments into relevant maturity groupings based on the remaining period at the balance sheet date to the contractual maturity date. The amounts disclosed in the table are the contractual undiscounted cash flows. Balances due within 12 months equal their carrying values as the impact of discounting is not significant.
($ in millions)
At 31 December 2016
Less than 1 year
Between 1 and 2 years
Between 2 and 5 years
Over 5 years Total
Borrowings1 223.6 219.3 216.7 2,741.5 3,401.1
Trade payables and other 213.2 17.9 3.9 1.4 236.4
Derivative financial instruments 5.9 16.9 3.2 133.4 159.4
442.7 254.1 223.8 2,876.3 3,796.9
1 Includes interest obligations on the Senior Notes due 2022 and 2024, Ex-Im Bank Facilities and Convertible Bonds. The interest obligations on those borrowings are at fixed rates for the term of the borrowing.
($ in millions)
At 31 December 2015
Less than 1 year
Between 1 and 2 years
Between 2 and 5 years
Over 5 years Total
Borrowings1 204.4 554.3 535.6 1,301.3 2,595.6
Trade payables and other 166.8 1.4 21.0 1.3 190.5
Derivative financial instruments 0.3 – – – 0.3
371.5 555.7 556.6 1,302.6 2,786.4
1 Includes interest obligations on the Senior Notes due 2022, Ex-Im Bank Facilities, EIB Facility and Convertible Bonds. The interest obligations assume no changes in floating interest rates from the year end.
FAIR VALUES OF DERIVATIVE FINANCIAL INSTRUMENTS
The Group’s derivative financial instruments consist of forward foreign currency contracts which are primarily designated as cash flow hedges and the conversion liability component of the new convertible bonds due 2023.
Derivative financial instruments are initially measured at fair value (see further below) on the contract date and are re-measured at each reporting date. The change in the fair value is accounted for differently depending on whether the instrument qualifies for hedge accounting (eg where a forward foreign currency transaction is designated as a cash flow hedge) or not (eg undesignated cash flow hedges and the conversion liability component of the 2023 convertible bond).
Under hedge accounting, the change in fair value initially goes through other comprehensive income. At the point hedge accounting is discontinued, ie when the hedging instrument expires, is exercised or no longer qualifies for hedge accounting, the amounts sitting in other comprehensive income are recycled to the income statement or, where appropriate, capitalised to the balance sheet. Where hedge accounting doesn’t apply, the change in fair value is included in net financing costs in the income statement.
ANNUAL REPORT AND ACCOUNTS 2016 – INMARSAT PLC – 153STRATEGIC REPORT – GOVERNANCE – FINANCIAL STATEMENTS

The fair values at the balance sheet date were:
($ in millions)
At31 December
2016
At31 December
2015
Financial assets:
Forward foreign currency contracts – designated cash flow hedges 0.8 –
Forward foreign currency contracts – undesignated 1.0 –
Total derivative financial assets 1.8 –
Current portion of derivative financial assets 1.7 –
Non-current portion of derivative financial assets 0.1 –
Financial liabilities:
Conversion liability component of 2023 Convertible Bond 133.4 –
Forward foreign currency contracts – designated cash flow hedges 23.9 –
Forward foreign currency contracts – undesignated 2.1 0.3
Total derivative financial liabilities 159.4 0.3
Current portion of derivative financial liabilities 5.9 0.3
Non-current portion of derivative financial liabilities 153.5 –
The full value of a hedging derivative is classified as a non-current asset or liability if the remaining maturity of the hedged item is more than 12 months and, as a current asset or liability if the maturity of the hedged item is less than 12 months.
In 2016 there was no hedge ineffectiveness recognised in profit or loss or in comprehensive income.
The fair values of forward foreign exchange contracts are based on the difference between the contract amount at the current forward rate at each period end and the contract amount at the contract rate, discounted at a variable risk-free rate at the period end. The fair value of the conversion liability component of the Convertible Bonds due 2023 is determined as the difference between the market value of the Convertible Bond and the carrying amount of the liability component of the Convertible Bond. Both are classified as level 2 in the fair value hierarchy according to IFRS 7.
The Group has no financial instruments with fair values that are determined by reference to significant unobservable inputs, ie those that would be classified as level 3 in the fair value hierarchy, nor have there been any transfers of assets or liabilities between levels of the fair value hierarchy. There are no non-recurring fair value measurements.
FORWARD FOREIGN EXCHANGE
The following tables set out the face value and fair value of forward foreign exchange contracts outstanding for the Group as at 31 December 2016 and 2015:
Outstanding forward foreign exchange contracts (in millions)
At 31 December 2016
Face value
Maturing within 1 year
Maturing between
1 and 2 years
Maturing between
2 and 5 YearsFair value
(US$)
GBP contracts £124.1 £24.8 £81.8 £17.5 (24.5)
CAD contracts CAD 50.5 CAD 22.2 CAD 17.5 CAD 10.8 0.3
Outstanding forward foreign exchange contracts (in millions)
At 31 December 2015
Face value
Maturing within 1 year
Maturing between
1 and 2 years
Maturing between
2 and 5 YearsFair value
(US$)
GBP contracts £10.0 £10.0 – £(0.3) 0.3
The Group has entered into contracts to build the I-6 satellite. The Group has entered into forward foreign exchange contracts (for terms equivalent to when the milestone payments fall due) to hedge the exchange rate risk arising from these anticipated milestone payments, which are designated as cash flow hedges.
NOTES TO THE CONSOLIDATED FINANCIAL STATEMENTS CONTINUED
154 – INMARSAT PLC – ANNUAL REPORT AND ACCOUNTS 2016

As at 31 December 2016, the aggregate amount of losses under forward foreign exchange contracts deferred in the cash flow hedging reserve relating to the exposure on these payments is $24.2m. The milestone payments will take place at irregular periods throughout each year until 2021, at which time the related cash flow hedges deferred in equity will be reclassified to profit and loss.
NON-DERIVATIVE FINANCIAL ASSETS AND FINANCIAL LIABILITIES
Non-derivative financial assets consist of cash at bank, short-term investments, trade receivables, other receivables and accrued income.
Non-derivative financial liabilities consist of borrowings, trade payables, deferred consideration, other payables and accruals.
FAIR VALUE OF NON-DERIVATIVE FINANCIAL ASSETS AND FINANCIAL LIABILITIES
With the exception of the Senior Notes, the Ex-Im Bank Facilities and the Convertible Bonds, the fair values of all non-derivative financial instruments approximate to the carrying value in the balance sheet. The fair value of Senior Notes, Ex-Im Bank Facilities and Convertible Bonds are classified as level 2 in the fair value hierarchy according to IFRS 7.
The following methods and assumptions have been used to determine fair values:
> the fair values of cash at bank, overdrafts and short-term deposits approximate their carrying values because of the short-term maturity of these instruments (see note 16);
> the fair value of trade and other receivables and payables, accrued income and costs, and deferred consideration approximate their carrying values (see notes 17 and 20 respectively);
> the carrying amount of deferred satellite payments represents the present value of future payments discounted, using an appropriate rate, at the period end. This carrying amount approximately equals fair value (see note 19);
> the Senior Notes due 2022 are reflected in the balance sheet net of unamortised arrangement costs and net issuance premium of $6.1m and $5.5m, respectively (see note 19). The fair values of the Senior Notes due 2022 are based on the market price of the bonds and are reflected in the next table;
> the Senior Notes due 2024 are reflected in the balance sheet net of unamortised arrangement costs of $5.6m (see note 19). The fair values of the Senior Notes due 2024 are based on the market price of the bonds and are reflected in the next table;
> the Ex-Im Bank Facilities are reflected in the balance sheet net of unamortised arrangement costs of $18.6m (2015: $18.0m). The fair value of the 2011 facility has been based on the implicit interest rate of the 2014 facility (see note 19); and
> the liability component of the Convertible Bonds is reflected in the balance sheet on an amortised cost basis, net of unamortised arrangement costs of $7.7m (2015: $nil) (see note 19). The fair value of the Convertible Bonds is based on the market price of the bonds and is reflected in the table below.
($ in millions)
At 31 December 2016 At 31 December 2015
Carrying amount
Fair value amount
Carrying amount
Fair value amount
Senior Notes due 2022 1,000.0 975.0 1,000.0 996.3
Senior Notes due 2024 400.0 408.3 – –
Ex-Im Bank Facilities 633.4 649.4 714.2 741.4
Convertible Bonds due 2017 – – 326.6 498.6
Convertible Bonds due 2023 549.2 682.6 – –
32. CAPITAL COMMITMENTSThe Group had authorised and contracted but not provided for capital commitments as at 31 December 2016 of $972.2m (2015: $1,219.9m). These amounts primarily represent commitments in respect of the Group’s GX, S-band and I-6 satellite programmes. The Group has not reported the split between tangible assets and intangible assets for these capital commitments, as the necessary information is not available and the cost to develop it would be excessive.
33. CONTINGENT LIABILITYIn the ordinary course of business, the Group is subject to contingencies pursuant to requirements that it complies with relevant laws, regulations and standards. Failure to comply could result in restrictions in operations, damages, fines, increased tax, increased cost of compliance, interest charges, reputational damage and other sanctions. These matters are inherently difficult to quantify.
In cases where the Group has an obligation as a result of a past event existing at the balance sheet date, and it is probable that an outflow of economic resources will be required to settle the obligation and the amount of the obligation can be reliably estimated, a provision will be recognised based on best estimates and management judgement.
A contingent liability is disclosed where the existence of the obligation will only be confirmed by future events, or where the amount of the obligation cannot be measured with reasonable reliability. At 31 December 2016, the Group had no material contingent liabilities.
ANNUAL REPORT AND ACCOUNTS 2016 – INMARSAT PLC – 155STRATEGIC REPORT – GOVERNANCE – FINANCIAL STATEMENTS

34. EVENTS AFTER THE BALANCE SHEET DATEOn 1 March 2017, the Company notified members of its Defined Benefit Pension Plan that the plan will close to future benefit accrual on 31 March 2017 and that from 1 April 2017 members can elect to transfer to the Group Defined Contribution Plan. It is expected that the majority of members will take up this election.
Since the balance sheet date there have been no other significant events which would require disclosure in the 31 December 2016 Annual Report.
35. RELATED PARTY TRANSACTIONSIn the normal course of operations the Group engages in transactions with its equity-owned investees NTS Maritime Limited, Navarino Telecom SA and JSAT Mobile Communications Inc. These transactions represent sales of airtime and equipment and are measured at the amounts exchanged. Group revenue from the related parties for the 2016 financial year was $nil, $33.1m and $18.2m, respectively (2015: $37.4m, $nil and $22.8m, respectively). The amount receivable from the related parties at 31 December 2016 was $nil, $9.3m and $1.8m, respectively (2015: $13.1m, $nil and $2.2m, respectively).
Amounts owing to the Executive and Non-Executive Directors as at 31 December 2016 and 2015 were $1.1m and $1.0m, respectively, and relate to remuneration earned in the normal course of operations (see note 8).
36. SUBSIDIARIESAt 31 December 2016, the Company had investments in the following subsidiaries and associates:
Principal activityCountry of incorporation /
registered address key1
Interest in issued
ordinary share capital at
31 December 2016
Interest in issued
ordinary share capital at
31 December 2015
Inmarsat Holdings Limited Holding company England and Wales / A 100% 100%
Inmarsat Group Limited Holding company England and Wales / A 100% 100%
Inmarsat Finance PLC Finance company England and Wales / A 100% 100%
Inmarsat Investments Limited Holding company England and Wales / A 100% 100%
Inmarsat Ventures Limited Operating company England and Wales / A 100% 100%
Inmarsat Global Limited Satellite telecommunications England and Wales / A 100% 100%
ISAT Global Xpress OOO Operating company Russian Federation / Y 100% 100%
Inmarsat Brasil Limitada Dormant Brazil / H 100% 100%
Inmarsat Leasing (Two) Limited Satellite leasing England and Wales / A 100% 100%
Inmarsat New Zealand Limited Operating company New Zealand / V 100% 100%
Inmarsat Services Limited Operating company England and Wales / A 100% 100%
PT ISAT Operating company Indonesia / Q 100% 100%
Inmarsat Communications Company LLC Operating company United Arab Emirates / AD 49% 49%
Inmarsat Group Holdings Inc. Operating company United States / C 100% 100%
ISAT US Inc. Operating company United States / C 100% 100%
Inmarsat Government Inc. Operating company United States / C 100% 100%
Stratos Government Services Inc. Operating company United States / D 100% 100%
Segovia Commercial Services Inc. Operating company United States / D 100% 100%
Inmarsat Solutions (US) Inc. Operating company United States / D 100% 100%
Inmarsat Inc. Holding company United States / E 100% 100%
Inmarsat US Investments Limited Dormant England and Wales / A 100% 100%
Europasat Limited Operating company England and Wales / A 100% 100%
Inmarsat Employment Company Limited Employment company Jersey / T 100% 100%
Inmarsat Trustee Company Limited Dormant England and Wales / A 100% 100%
Inmarsat Finance III Limited Operating company England and Wales / A 100% 100%
Inmarsat Solutions Limited Holding company England and Wales / A 100% 100%
NOTES TO THE CONSOLIDATED FINANCIAL STATEMENTS CONTINUED
156 – INMARSAT PLC – ANNUAL REPORT AND ACCOUNTS 2016

Principal activityCountry of incorporation /
registered address key1
Interest in issued
ordinary share capital at
31 December 2016
Interest in issued
ordinary share capital at
31 December 2015
Inmarsat Solutions (Canada) Inc. Operating company Canada / B 100% 100%
Stratos Holdings (Cyprus) Limited Holding company Cyprus / K 100% 100%
Stratos Gesellschaft fur satelliten-kommunikation mbH. Operating company Germany / L 100% 100%
Stratos Global Japan KK Holding company Japan / S 100% 100%
Stratos Broadband Communications Dormant Kazakhstan / U 100% 100%
Stratos Investments BV Holding company The Netherlands / W 100% 100%
Inmarsat Solutions B.V. Operating company The Netherlands / W 100% 100%
Inmarsat Solutions SA (PTY) Limited Operating company South Africa / AA 90% 90%
Inmarsat Spain S.A. Operating company Spain / AB 100% 100%
Inmarsat Hong Kong Limited Operating company Hong Kong / N 100% 100%
Xantic Brazil Limited Dormant Brazil / I 100% 100%
Inmarsat (IP) Company Limited Operating company England and Wales / A 100% 100%
Inmarsat Employee Share Plan Trustees Limited Dormant England and Wales / A 100% 100%
Inmarsat Hellas Satellite Services SA Satellite telecommunications Greece / M 100% 100%
Inmarsat Navigation Ventures Limited Operating company England and Wales / A 100% 100%
Inmarsat Launch Company Limited Operating company Isle of Man / R 100% 100%
Inmarsat Global Xpress Limited Operating company England and Wales / A 100% 100%
Inmarsat SA Operating company Switzerland / AC 100% 100%
NewWave Broadband Limited Operating company England and Wales / A 100% 100%
Inmarsat Solutions Global Limited Operating company England and Wales / A 100% 100%
Inmarsat Solutions AS Operating company Norway / X 100% 100%
Inmarsat Solutions Pte. Limited Operating company Singapore / Z 100% 100%
Inmarsat Solutions ehf. Operating company Iceland / O 51% 51%
Inmarsat Australia Pty Limited Operating company Australia / F 100% 100%
TC Communication Pty Limited Operating company Australia / G 100% 100%
Inmarsat KK Operating company Japan / S 100% 100%
Inmarsat Solutions (Shanghai) Co. Limited Operating company China / J 100% 100%
Inmarsat India Private Limited Operating company India / P 100% 100%
Inmarsat Licences (Canada) Inc. Holding company Canada / B 100% 100%
Navarino UK Limited Associate England and Wales / AE 49% 49%
JSAT Mobile Communications Inc. Associate Japan/ AF 26.67% 26.67%
1 For the list of registered addresses please refer to the next table.
In accordance with s479A of the Companies Act 2006, the following companies are exempt from the requirements relating to the audit of individual accounts for the year ended 31 December 2016: Inmarsat Trustee Company Limited (03688399), Stratos Global Holdings Limited (04113448), Inmarsat Employee Share Plan Trustees Limited (03669306) and Inmarsat Leasing Limited (02487502).
ANNUAL REPORT AND ACCOUNTS 2016 – INMARSAT PLC – 157STRATEGIC REPORT – GOVERNANCE – FINANCIAL STATEMENTS

REGISTERED ADDRESS KEY
Key Registered Address
A 99 City Road, London EC1Y 1AX
B 34 Glencoe Drive, Box 5754, Donovan's Bus. Park, Mount Pearl Newfoundland A1C 5X3, Canada
C 874 Walker Road, Suite C, City of Dover DE 19904, United States
D 2711 Centerville Road, Suite 400, Wilmington, New Castle DE, United States
E 1101 Connecticut Avenue, N.W. Suite 1225 WA 20036, United States
F Level 40, Governor Macquarie Tower, 1 Farrer Place, Sydney NSW 2000, Australia
G Unit A3 Cameron Centre, 255 Rawson Street, Auburn NSW 2144, Australia
H Av Presidente Juscelino Kubitschek 50, Suite 172, Room 7, 17th Floor, Sao Paulo, CEP 04543-000, Brazil
I City of Niterói, State of Rio de Janeiro, at Rua Coronel Moreira César, 229, room 911, Icaraí, Zip Code (CEP) 24230-063, Brazil
J 4th and 5th floors of No. 20-4, Ronghui Park, Yuhua Road, Area B, Tianzhu Airport Industrial Zone, Shunyi District, Beijing
K 1, Lampousas, Nicosia, 1095, Cyprus
L Aarberger Strasse 18, 12205, Berlin, Germany
M 280 Kifisias Avenue, Halandri, 152 32, Greece
N 19 Floor, Millennium Trade Centre, No. 56 Kwai Cheong Road, Kwai Chung, New Territories, Hong Kong
O Hlíðarsmára 10, 201 Kópavogi
P B-92, 9th Floor Himalaya House, K.G. Marg, New Delhi, 110001, India
Q Jl. Jaksa Agung R. Suprapto, Sekupang, Batam, 29422, Indonesia
R Fort Anne, Douglas, IM1 5PD, Isle of Man
S Level 25 Ark Hills Sengokuyama Mori Tower, 1-9-10, Roppongi, Minato-ku, Tokyo, 106-0032, Japan
T 44 Esplanade, St. Helier, Jersey JE4 9WG, Jersey
U Almaty city, microdistrict Orbita-1, 24 building, Kazakhstan
V Bell Gully, Lvl 22, Vero Centre, 48 Shortland Street, Auckland, New Zealand
W Loire 158-160, 2491 AL, The Hague, Netherlands
X Borgundfjordvegen 116, 6017 Alesund, 1504 Ålesund, Norway
Y Bld. 5, 13 Kasatkina Street, 129301, Moscow, Russian Federation
Z 11 Lorong 3 Toa Payoh , #01-31, Jackson Square, 319579, Singapore
AA Deloitte Place, The Woodlands, 20 Woodlands Drive, Woodmead, Sandton, Johannesburg, Gauteng, South Africa, 2052
AB Príncipe de Vergara 73, 28006, Madrid, Spain
AC Route de Crassier 19, 1262, Eysins, Switzerland
AD Al Maktoum Street, Al Reem Tower, Suite 402, P.O. Box 27313, Dubai, UAE, United Arab Emirates
AE Camburgh House, 27 New Dover Road, Canterbury, Kent CT1 3DN
AF Nisso Building #22 8F, Azabudai1-11-10, Minato-ku, Tokyo 106-0041, Japan
NOTES TO THE CONSOLIDATED FINANCIAL STATEMENTS CONTINUED
158 – INMARSAT PLC – ANNUAL REPORT AND ACCOUNTS 2016
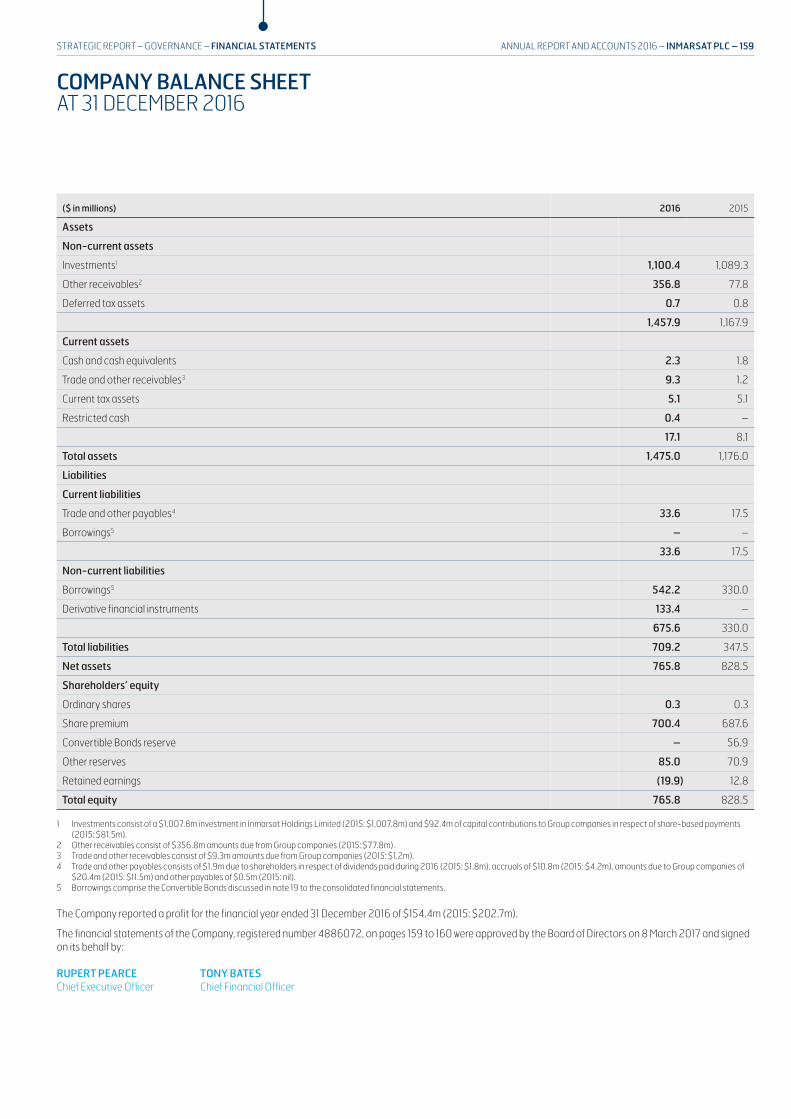
($ in millions) 2016 2015
Assets
Non-current assets
Investments1 1,100.4 1,089.3
Other receivables2 356.8 77.8
Deferred tax assets 0.7 0.8
1,457.9 1,167.9
Current assets
Cash and cash equivalents 2.3 1.8
Trade and other receivables3 9.3 1.2
Current tax assets 5.1 5.1
Restricted cash 0.4 –
17.1 8.1
Total assets 1,475.0 1,176.0
Liabilities
Current liabilities
Trade and other payables4 33.6 17.5
Borrowings5 – –
33.6 17.5
Non-current liabilities
Borrowings5 542.2 330.0
Derivative financial instruments 133.4 –
675.6 330.0
Total liabilities 709.2 347.5
Net assets 765.8 828.5
Shareholders’ equity
Ordinary shares 0.3 0.3
Share premium 700.4 687.6
Convertible Bonds reserve – 56.9
Other reserves 85.0 70.9
Retained earnings (19.9) 12.8
Total equity 765.8 828.5
1 Investments consist of a $1,007.8m investment in Inmarsat Holdings Limited (2015: $1,007.8m) and $92.4m of capital contributions to Group companies in respect of share-based payments (2015: $81.5m).
2 Other receivables consist of $356.8m amounts due from Group companies (2015: $77.8m).3 Trade and other receivables consist of $9.3m amounts due from Group companies (2015: $1.2m).4 Trade and other payables consists of $1.9m due to shareholders in respect of dividends paid during 2016 (2015: $1.8m), accruals of $10.8m (2015: $4.2m), amounts due to Group companies of
$20.4m (2015: $11.5m) and other payables of $0.5m (2015: nil).5 Borrowings comprise the Convertible Bonds discussed in note 19 to the consolidated financial statements.
The Company reported a profit for the financial year ended 31 December 2016 of $154.4m (2015: $202.7m).
The financial statements of the Company, registered number 4886072, on pages 159 to 160 were approved by the Board of Directors on 8 March 2017 and signed on its behalf by:
RUPERT PEARCE TONY BATESChief Executive Officer Chief Financial Officer
COMPANY BALANCE SHEETAT 31 DECEMBER 2016
ANNUAL REPORT AND ACCOUNTS 2016 – INMARSAT PLC – 159STRATEGIC REPORT – GOVERNANCE – FINANCIAL STATEMENTS
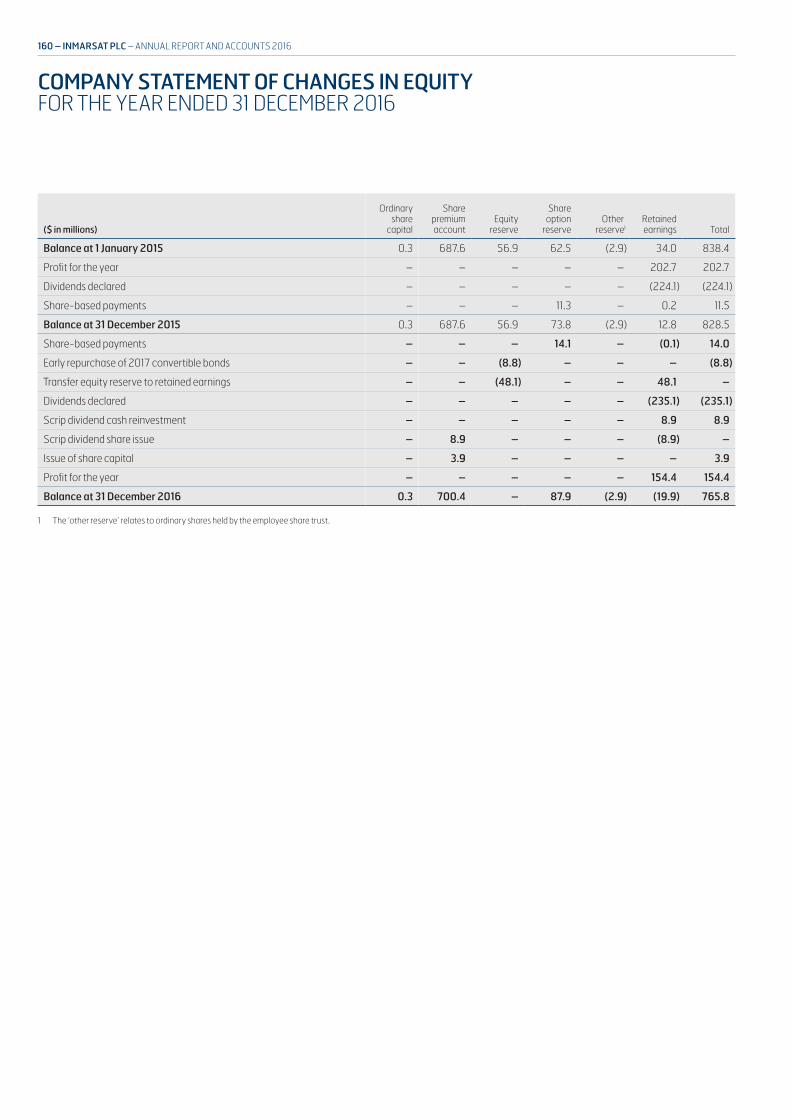
($ in millions)
Ordinary share
capital
Share premium account
Equity reserve
Share option
reserveOther
reserve1Retained earnings Total
Balance at 1 January 2015 0.3 687.6 56.9 62.5 (2.9) 34.0 838.4
Profit for the year – – – – – 202.7 202.7
Dividends declared – – – – – (224.1) (224.1)
Share-based payments – – – 11.3 – 0.2 11.5
Balance at 31 December 2015 0.3 687.6 56.9 73.8 (2.9) 12.8 828.5
Share-based payments – – – 14.1 – (0.1) 14.0
Early repurchase of 2017 convertible bonds – – (8.8) – – – (8.8)
Transfer equity reserve to retained earnings – – (48.1) – – 48.1 –
Dividends declared – – – – – (235.1) (235.1)
Scrip dividend cash reinvestment – – – – – 8.9 8.9
Scrip dividend share issue – 8.9 – – – (8.9) –
Issue of share capital – 3.9 – – – – 3.9
Profit for the year – – – – – 154.4 154.4
Balance at 31 December 2016 0.3 700.4 – 87.9 (2.9) (19.9) 765.8
1 The ‘other reserve’ relates to ordinary shares held by the employee share trust.
COMPANY STATEMENT OF CHANGES IN EQUITYFOR THE YEAR ENDED 31 DECEMBER 2016
160 – INMARSAT PLC – ANNUAL REPORT AND ACCOUNTS 2016

A) PRINCIPAL ACCOUNTING POLICIES
BASIS OF ACCOUNTING
The Company meets the definition of a qualifying entity under FRS 100 ‘Application of Financial Reporting Requirements’ issued by the Financial Reporting Council (‘FRC’). Accordingly, in the year ended 31 December 2015 the Company has undergone transition from reporting under International Financial Reporting Standards (‘IFRS’) adopted by the European Union to FRS 101 issued by the FRC. The financial statements have therefore been prepared in accordance with FRS 101. This transition is not considered to have had a material effect on the financial statements.
As permitted by FRS 101, the Company has taken advantage of the disclosure exemptions available under that standard in relation to presentation of a cash flow statement, the reconciliation of net cash from operations, and related party transactions.
Where relevant, equivalent disclosures have been given in the Group accounts of the Company.
The accounting policies and financial risk management policies and objectives, where relevant to the Company, are consistent with those of the consolidated Group as set out in notes 2 and 3 to the consolidated financial statements.
B) INCOME STATEMENTThe Company has taken advantage of the exemption available under Section 408 of Companies Act 2006 and has not presented an income statement. The profit for the year ended 31 December 2016 was $80.6m (2015: $202.7m).
AUDITOR’S REMUNERATION
During the year, the Company paid its external auditor $0.1m for statutory audit services (2015: $0.1m).
EMPLOYEE COSTS AND DIRECTORS’ REMUNERATION
The average monthly number of people employed during the year was two (2015: two). Total staff costs for 2016 were $7.4m (2015: $6.7m). Full details of Directors’ remuneration and Directors’ share options and share awards are given in the Remuneration report.
FOREIGN CURRENCY TRANSLATION
Accounting for foreign currency transactions of the Company is consistent with that of the Group, which is disclosed in note 2 to the consolidated financial statements.
SHARE CAPITAL
The share capital of the Company is disclosed in note 24 to the Group’s consolidated financial statements.
C) FINANCIAL INSTRUMENTSThe IFRS 7, ‘Financial Instruments’ disclosures, where relevant to the Company, are consistent with that of the Group as set out in note 31 to the consolidated financial statements.
The differences between the Group and the Company in relation to intercompany balances are $366.0m (2015: $79.0m) amounts due from Group companies and $21.1m (2015: $11.5m) amounts due to Group companies, which eliminate on consolidation. The Directors consider the carrying value of the intercompany balances to approximate to their fair value.
NOTES TO THE COMPANY FINANCIAL STATEMENTSFOR THE YEAR ENDED 31 DECEMBER 2016
ANNUAL REPORT AND ACCOUNTS 2016 – INMARSAT PLC – 161STRATEGIC REPORT – GOVERNANCE – FINANCIAL STATEMENTS
COMMISSIONED TERMINAL
A terminal that is registered with one of our services at the period end.
CAGR
The Compound Annual Rate of Growth measures average annual growth over a period of time and is a key performance indicator for our MSS wholesale revenues.
CGU
A cash-generating unit is the smallest group of assets that generates cash inflows largely independently from the other parts of the business and which represents the lowest level at which goodwill is monitored within the business.
THE COMPANY
Where we refer to the Company we are referring to Inmarsat plc, the holding company of the Inmarsat Group.
D
DEFINED BENEFIT AND DEFINED CONTRIBUTION SCHEMES
Defined benefit pensions schemes provide post-employment benefits based on an employee’s final salary. Defined contribution pension schemes are schemes into which Inmarsat makes fixed contributions based on a percentage of an employee’s salary.
E
EBITDA
Earnings before interest, tax, depreciation and amortisation is a key performance indicator used in the commercial and financial management of the business. It is a non-GAAP measure under IFRS.
F
FLEETBROADBAND
Our flagship maritime service providing voice and broadband data services across the world’s oceans.
G
GAAP
Generally Accepted Accounting Principles is the standard financial reporting framework as defined by a body of accounting standards and other guidance used in a given jurisdiction (see ‘IFRS’).
GEOSTATIONARY ORBIT
A circular geosynchronous orbit directly above the Earth’s equator. Satellites in geosynchronous orbit match their orbit to the orbit of the earth and so remain permanently in the same area of the sky.
GLOBAL XPRESS (‘GX’)
Services offered by Inmarsat using Inmarsat's Inmarsat-5 satellites and Ka-band frequencies. GlobalXpress is the first high-speed broadband satellite network to span the globe, from a single operator. It uses powerful beams able to reach small antennas on earth providing digital connections for aviation, land and maritime use.
GMDSS
Global Maritime Distress and Safety Service which is a system designed to automate a vessel’s radio distress alert, eliminating the need for manual watchkeeping of distress channels. Inmarsat is the only approved provider of this Maritime Safety Service by the International Maritime Organization (‘IMO’).
GROUND STATIONS
Our Ground Stations connect Inmarsat satellites to terrestrial networks and the internet. They are manned 24/7 in locations across the globe and continuously monitored from our network operations centre in London.
THE GROUP
The Group refers to Inmarsat plc and all of its subsidiaries. We may also use ‘we’ and ‘our’ in reference to the Group, depending on the context.
GSPS
Global Satellite Phone Services are our handheld products and services including IsatPhone Pro and IsatPhone 2.
I
IAS OR IFRS
International Accounting Standards or International Financial Reporting Standards are the accounting standards issued by the International Accounting Standards Board. IFRS is also used to refer to international GAAP as a whole.
ICAO
International Civil Aviation Organization.
Due to the technical nature of satellite communications and financial reporting we use a number of terms and abbreviations in this Annual Report and Accounts that are widely used within those industries but are less commonly used by our broader community of stakeholders. The principal ones are summarised below.
A
ACTIVE TERMINAL
A terminal that has been used to access commercial services (except certain handheld terminals) at any time during the preceding 12 months and is registered with one of our services at the period end. It includes the average number of certain handheld terminals active on a daily basis during the final month of a period and excludes M2M terminals.
ALPHASAT
A satellite developed with the European Space Agency and launched in 2013. It supplements our Inmarsat-4 satellite constellation.
ATC
Ancillary Terrestrial Components provide communications services from ground stations either as stand-alone services or to complement satellite services.
ATG (ALSO ‘CGC’)
For our European Aviation Network, the satellite and CGC components are integrated and the CGC is not stand alone. ATG means the air to ground terrestrial component of the EAN.
B
BANDWIDTH
The radio spectrum is divided into different bands which each cover a section of frequencies that are usually used for a similar purpose. Bands are allocated to specific uses at international level by the ITU and regulated at a national level by domestic organisations and governments.
BGAN
Broadband Global Area Network is a high-speed data satellite network that spans the globe.
C
CASH CAPITAL EXPENDITURE
Cash capital expenditure is the cash flow relating to tangible and intangible asset additions, it includes capitalised labour costs and excludes capitalised interest.
GLOSSARY OF TERMS
162 – INMARSAT PLC – ANNUAL REPORT AND ACCOUNTS 2016
MSS
Mobile Satellite Services.
MBPS
Megabits per second are the units used to measure data transfer rates in the satellite communications industry.
N
NETWORK AND SATELLITE OPERATIONS COSTS
The costs of operating our ground stations.
O
OWN WORK CAPITALISED
Employee-related costs including salary and travel costs incurred in bringing property, plant and equipment into use. Own work capitalised is capitalised as part of the total cost of an asset.
R
RIGNET INC
A distribution partner and the company that acquired the retail energy business that we disposed of in 2014.
S
SAS
Satellite Access Station is another term for a Ground Station.
S-BAND
A mobile satellite band between 2 and 2.5GHz, which we are using for a high-speed broadband service under development for the EU aviation industry. The programme will see an Inmarsat S-band satellite fully integrated with a ground network. We also use the term S-band to refer to the S-band programme in general.
SCOPE 1, 2 AND 3 EMISSIONS
Carbon emissions as defined by the greenhouse gas protocol.
Scope 1: All direct greenhouse gas emissions.
Scope 2: Indirect emissions from purchased electricity, heat or steam.
Scope 3: Other indirect emissions including travel.
SEP/INMARSAT GATEWAY
Our Service Enablement Platform for GX delivering customer support, network services and an app store, it also opens up our networks to innovators through a developer portal. This is also now referred to as the Inmarsat Gateway.
SWIFTBROADBAND
A global service providing voice and high-speed data simultaneously through a single installation on an aircraft.
T
TÉLÉCOMS SANS FRONTIÈRES (‘TSF’)
The telecommunications relief aid organisation, it is a core beneficiary of our charitable support.
TERMINALS
The consumer hardware used to receive and transmit voice and data from earth across our satellite network. It includes antenna enabled hardware such as satellite phones and on-board antennas.
V
VSAT
Very Small Aperture Terminals are small mobile two-way satellite antennas able to receive and transmit voice and broadband data to a satellite. VSAT services are typically charged using a fixed monthly fee.
X
XPRESSLINK
XpressLink is a fully-integrated Ku-band and L-band service with VSAT and FleetBroadband terminals for maritime end-users.
INMARSAT-2 (‘I-2’), INMARSAT-3 (‘I-3’), INMARSAT-4 (‘I-4’), INMARSAT-5 (‘I-5’), INMARSAT-6 (‘I-6’)
The second, third, fourth, fifth and sixth generations of Inmarsat satellites. Individual satellites in each constellation are numbered F1, F2, F3, etc, so I-5 F2 refers to the second satellite launched in the fifth generation of Inmarsat satellites.
ITU
International Telecommunications Union.
K
KA-BAND
Downlink frequencies between 18GHz and 22GHz and uplink frequencies between 27GHz and 31GHz. Often referred to as 20/30GHz. This is the frequency band used by our GX satellites, it has higher bandwidth than other bands allowing more data to be transmitted over the same satellite capacity.
KU-BAND
Downlink frequencies between 10.7GHz and 12.74GHz and uplink frequencies between 13.75GHz and 14.8GHz. Often referred to as 11/14 or 12/14GHz. This is the frequency band used by a number of our products and services that we procure from other satellite network operators to complement our own spectrum.
L
L-BAND
Uplink and downlink frequencies between satellites and mobile users between 1.5 GHz and 1.6 GHz. This is the frequency band used by our Inmarsat-3 and Inmarsat-4 satellites and also by our planned Inmarsat-6 satellites.
LIGADO NETWORKS
A Cooperation Agreement between Inmarsat and Ligado Networks (formerly LightSquared LP, Skyterra (Canada) Inc. and LightSquared Inc.) for the use of L-band in North America.
M
M2M
Machine-to-machine services and products.
ANNUAL REPORT AND ACCOUNTS 2016 – INMARSAT PLC – 163STRATEGIC REPORT – GOVERNANCE – FINANCIAL STATEMENTS
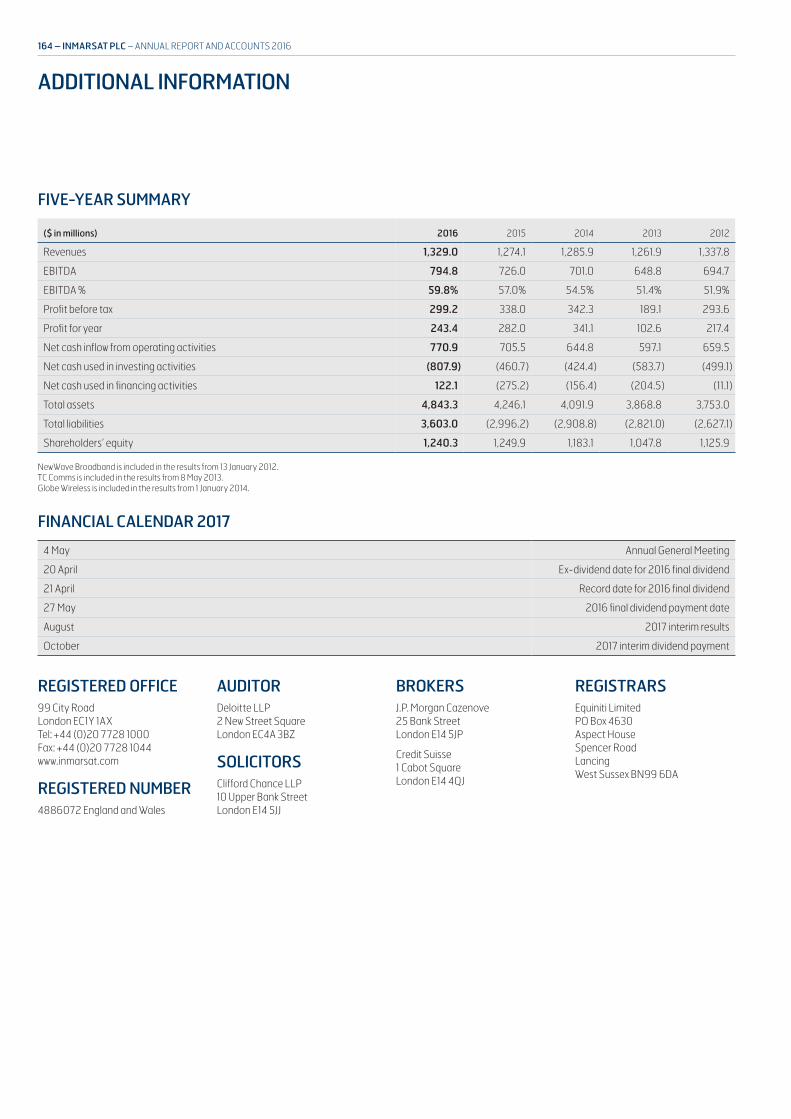
FIVE-YEAR SUMMARY
($ in millions) 2016 2015 2014 2013 2012
Revenues 1,329.0 1,274.1 1,285.9 1,261.9 1,337.8
EBITDA 794.8 726.0 701.0 648.8 694.7
EBITDA % 59.8% 57.0% 54.5% 51.4% 51.9%
Profit before tax 299.2 338.0 342.3 189.1 293.6
Profit for year 243.4 282.0 341.1 102.6 217.4
Net cash inflow from operating activities 770.9 705.5 644.8 597.1 659.5
Net cash used in investing activities (807.9) (460.7) (424.4) (583.7) (499.1)
Net cash used in financing activities 122.1 (275.2) (156.4) (204.5) (11.1)
Total assets 4,843.3 4,246.1 4,091.9 3,868.8 3,753.0
Total liabilities 3,603.0 (2,996.2) (2,908.8) (2,821.0) (2,627.1)
Shareholders’ equity 1,240.3 1,249.9 1,183.1 1,047.8 1,125.9
NewWave Broadband is included in the results from 13 January 2012.TC Comms is included in the results from 8 May 2013.Globe Wireless is included in the results from 1 January 2014.
FINANCIAL CALENDAR 2017
4 May Annual General Meeting
20 April Ex-dividend date for 2016 final dividend
21 April Record date for 2016 final dividend
27 May 2016 final dividend payment date
August 2017 interim results
October 2017 interim dividend payment
REGISTERED OFFICE99 City RoadLondon EC1Y 1AXTel: +44 (0)20 7728 1000Fax: +44 (0)20 7728 1044www.inmarsat.com
REGISTERED NUMBER4886072 England and Wales
AUDITORDeloitte LLP2 New Street SquareLondon EC4A 3BZ
SOLICITORSClifford Chance LLP10 Upper Bank StreetLondon E14 5JJ
BROKERSJ.P. Morgan Cazenove25 Bank StreetLondon E14 5JP
Credit Suisse1 Cabot SquareLondon E14 4QJ
REGISTRARSEquiniti LimitedPO Box 4630Aspect HouseSpencer RoadLancingWest Sussex BN99 6DA
ADDITIONAL INFORMATION
164 – INMARSAT PLC – ANNUAL REPORT AND ACCOUNTS 2016
CAUTIONARY STATEMENT REGARDING FORWARD-LOOKING STATEMENTSCertain statements in this Annual Report constitute ‘forward-looking statements’ within the meaning of the US Private Securities Litigation Reform Act of 1995. These forward-looking statements involve risks, uncertainties and other factors that may cause our actual results, performance or achievements, or industry results, to be materially different from those projected in the forward-looking statements. These factors include: general economic and business conditions; changes in technology; timing or delay in signing, commencement, implementation and performance of programmes, or the delivery of products or services under them; structural change in the satellite industry; relationships with customers; competition; and ability to attract personnel. You are cautioned not to rely on these forward-looking statements, which speak only as of the date of this Annual Report.
Inmarsat undertakes no obligation to update or revise any forward-looking statement to reflect any change in its expectations or any change in events, conditions or circumstances, except where it would be required to do so under applicable law.
Designed and produced by Gather www.gather.london
The paper used in this Report is derived from sustainable sources.

INM
AR
SAT PLC AN
NU
AL REPORT AN
D ACCOU
NTS 2016
Inmarsat plc99 City Road London EC1Y 1AX United Kingdom
INMARSAT.COM