molecular visualization in science education
TRANSCRIPT

8/8/2019 Molecular Visualization in Science Education
http://slidepdf.com/reader/full/molecular-visualization-in-science-education 1/36
Molecular Visualization in Science Education
Report from the
MOLECULAR VISUALIZATION IN SCIENCE EDUCATION WORKSHOP
NCSA Access Center, Arlington, VA
January 12-14, 2001
Sponsored by the National Science Foundation
NSF Award REC-0090523

8/8/2019 Molecular Visualization in Science Education
http://slidepdf.com/reader/full/molecular-visualization-in-science-education 2/36
Molecular Visualization ii
Table of Contents
Preface…………………………………………………………………………………………. iv
Overview………………………………………………………………………………………. v
A Context for Molecular Visualization in Education……………………………………….. 1Learning Science…………………………………………………………………...……… 1Why Chemistry?.…………………………………………………………………….…….. 1Goals for Science Learning…………………………………………………..……………. 1Vision and Visual Thinking………………………………………………………….……. 2Imaging Technology.……………………………………………………………………… 3Visualization.…………………………………………………………………….………… 3Visualization in Science Learning…………………………………………………. 4
Properties of Molecular Visualizations……………………………………………… 5Potential Implications of Molecular Visualization………………………………… 6
The promise for students…….……………………………………………….…….. 6The potential for educational technology…………………………….…………… 7
Learning with Molecular Visualization…….…………………………………………. 7Visual subtlety………………………………………………………….……………… 7
Complexity………………………………………………………….…………………. 7Abstractness and conceptual depth…………………………………………………….. 8
Individual and Group Differences in Learning…………………………………………….. 9
Molecular Visualization in the Curriculum…………………………………………………. 9
Factual and Visual Fluency………………………………………………………….…….. 9Practice: Amount, timing, and feedback……………………………………………….10
Annotation………………………………………………………….…………………. 10
Dimensional focus………………………………………………………….………… 10Comparative presentation………………………………………………………….…. 10
Animation………………………………………………………….…………………. 11Promoting Understanding through Interaction……………………………………………. 12
Software interactivity………………………………………………………….……… 12
Interactivity that explores causality…………………………………………………… 12
Software-based classroom interaction………………………………………………… 12
Active Concept Mastery and Inquiry……………………………………………………… 13
Summary of Recommendations……………………………………………………….…….. 14Research on molecular visualization……………………………………………………… 14
Characteristics of visualizations……………………………………………………… 15
Curriculum issues……………………………………………………………….…….. 15Interactions……………………………………………………………………….…… 15
Molecular visualization in the chemistry and biology curriculum……………………….. 16Develop approaches to visualization that are easy for students to use and interpret…. 16Develop instructional methodologies that take advantage of the interactive
nature of visualization…………………………………………………….……… 16Integrate visualization and modeling into curricular materials……………………..… 16 Support faculty who are introducing visualization..………………………………….. 16
Develop a digital library for molecular visualization in science education…….…….. 17

8/8/2019 Molecular Visualization in Science Education
http://slidepdf.com/reader/full/molecular-visualization-in-science-education 3/36
Molecular Visualization iii
References……..………………………………………………………….…………………. 18
Resources……………………………………………………………………………….…… 19Molecular Visualization Workshop Advisory Board………………………………….….. 19Molecular Visualization Workshop participants…………………………………….……. 20
Molecular Visualization Projects Contributed by Workshop Participants……………….. 22Bibliography for Molecular Visualization In Science Education………………………… 25
Additional Relevant Web Links………………………………………………………….. 29

8/8/2019 Molecular Visualization in Science Education
http://slidepdf.com/reader/full/molecular-visualization-in-science-education 4/36
Molecular Visualization iv
Preface
There is usually a long gap between technological innovation and its application in education.
Sometimes this is because educators and teachers do not see its relevance and sometimes because
of the capital and recurrent costs of using the innovation.
However, from the early days of computing, it was recognised that the innovation would make a
major impact in education and some of those who had the foresight and perseverance were
amongst the participants of this workshop and must feel vindicated.
Some of the greatest advances in science recently are in the area of molecular biology, which
enfolds many of the branches of the great disciplines of biology and chemistry and these have
been made possible by the use of computation, particularly by the way we can now look at
molecular structure.
In the early days these techniques needed computers at the very forefront in terms of size and
cost. Then 15 or so years ago microcomputers became available, which allowed for desktop
structural computations in research and thence led to programs on molecular modelling that could
be simplified for university and school biology and chemistry curricula.
This is of great significance, for chemical education demands so much from students. It requires
them to understand abstract theories, (sometimes two to explain one phenomenon!), to have
mathematical skills, to have experimental skills, to be able to communicate orally and in writing
and to visualise in three dimensions given information in two dimensions. And that is just thestart.
Visualisation of even simple molecules or crystal structures in three dimensions, even the position
of a functional group in a small organic molecule is found by many students to impose an almost
insuperable hurdle to their understanding, a problem borne out by research over many years. They
need help to obtain a concrete model. Just like the researchers in molecular recognition working
on similar if more complex systems.
This workshop and the 2001 Gordon Research Conference on Science Education andVisualization are special for two reasons. First, they bring educators together with scientists andcognitive psychologists, allowing each group to break out of its box in which the members talk only to one another, and the three groups can then learn from each other. Secondly these aretimely events, as we are literally on the threshold of being able to realise the dreams of thosepioneers as more and more investment is made by universities, colleges and schools across theworld in hardware and software for instruction.
Professor D. J. WaddingtonDepartment of Chemistry
University of York, UK
Vice-Chair, European Coordinating Committee
2001 Gordon Research Conference on Science Education and Visualization
8/8/2019 Molecular Visualization in Science Education
http://slidepdf.com/reader/full/molecular-visualization-in-science-education 5/36
Molecular Visualization v
Background and Overview
This document reports on a workshop that was held to consider how we can help studentsvisualize and comprehend the molecular level of matter. The workshop, which was funded by the
National Science Foundation, was held at the National Center for Supercomputing Applications
ACCESS Center in Arlington, Virginia on January 12-14, 2001. Scientists, cognitive
psychologists, and science educators came together at this workshop to examine how scientists
use representations of chemical structure, mechanics, and dynamics to communicate ideas and
how students can best learn from them. See http://pro3.chem.pitt.edu/workshop/ for more details.
The workshop was the first part of a National Science Foundation-funded effort to support
collaboration among diverse research communities in order to define the role of and encourage
research into the use of molecular visualization in science education. The second part of this
effort is support of the 2001 Gordon Research Conference on Science Education andVisualization and the third part is the awarding of mini-grants to support new collaborations
related to the study of visualization in science education.
The goals of the workshop were to:
• identify characteristics of molecular representations and visualizations that enhance
learning.• identify the types of interactions with molecular visualizations that best help students
learn about molecular structure and dynamics and explore new technologies that show
promise for this application.• identify the roles of molecular modeling in college chemistry curricula.
• recommend fruitful directions for research on molecular visualization in science
education.
Prior to the workshop participants commented on these goals and posed questions for discussion.
At the workshop Andrew Johnson, Nate Lewis, Jeffrey Madura, Barbara Tversky, and David
Uttal gave opening perspectives and a variety of projects incorporating molecular visualization
were demonstrated. Participants broke into four working groups to address the first three goals
and all groups prepared recommendations on research directions. This document reports on the
group discussions and recommendations. Although it focuses on molecular visualization it is
intended to stimulate thinking on how the three disciplines of science, cognition, and education
can be joined to study and improve visualization in all fields of science education.
We would like to express our appreciation to Mindy Correll at the University of Northern
Colorado Mathematics and Science Teaching Center for assistance in conference planning and to
Tom Coffin and the rest of the staff of the National Supercomputing Center ACCESS Center for
providing a facility ideally suited to the interactions, demonstrations, and connectivity we
required. We also want to acknowledge Nora Sabelli and Lee Zia of the National Science
Foundation for their guiding vision and support, the workshop advisory board for contributingdirection and literature, and the workshop participants for their enthusiastic participation and
generous sharing of their time and ideas.
Loretta Jones, University of Northern Colorado
Kenneth Jordan, University of Pittsburgh
Neil Stillings, Hampshire College
Workshop Organizers
8/8/2019 Molecular Visualization in Science Education
http://slidepdf.com/reader/full/molecular-visualization-in-science-education 6/36
Molecular Visualization 1
A Context for Molecular Visualization in Education
Learning Science
For professional scientists, learning science is a life-long enterprise. The occasions of learning arevaried, encompassing spontaneous reflection, reading, course work, interactions with colleagues,the acquisition of laboratory and mathematical techniques, and research itself, for it is useful tothink of research as an activity in which the individual rediscovery that typifies most learning istransmuted into discovery that is new to others. When we ask how to improve science learning,then, we are asking about some of the most extraordinary and complex developmental changesthat occur in the human mind and brain.
The workshop reported here was an attempt to further the growing and critical interaction
between the sciences of learning and the learning of science. The workshop focused on the
changes in science education sparked by the rise of computational chemistry and by the
widespread availability of computer-based visualization tools. The dual premises of the workshop
were, first, that molecular visualization in chemistry education is an important context forexploring the educational implications of recent advances in the cognitive and learning sciences,
and, second, that questions about the optimal usage of molecular visualization for both educationand research can provide an important stimulus for new research on cognition and instruction.
Why Chemistry?
Because the understanding of spatial structures and processes is central to the discipline,
chemistry is an ideal site for exploring questions about the use of computer-based visualization
and animation that are arising throughout science education. Conclusions about the sound designof graphical displays and animations should have wide applicability in other sciences.
P. W. Atkins (1987) once noted with approval that the subtitle of a widely used chemistry text
was The Central Science, a phrase that captures chemistry's role in linking physics and biology,and hence its crucial conceptual position in science education as a whole. Enhancements to
chemistry education can have powerful positive effects on the rest of the science curriculum.
(Note that the cognitive scientists who participated in the workshop are practitioners of another
central science, which links biology and psychology.)
Goals for Science Learning
Science instruction must address the notably complex nature of science learning. Instructors in a
given instructional context can select from a range of goals, which may or may not be achieved
by students. As graphical displays and visualization tools are increasingly introduced into science
education, the possibility of new learning goals arises. It is therefore important to reflect oncurrent learning goals and how new tools may affect what and how much we expect students to
learn.
Recent national studies (AAAS, 1994; NRC, 1996; Advisory Committee, 1996) have convergedon the recommendation that multi-leveled science learning goals be pursued in parallelthroughout the K-16 curriculum. The authors argue that the facts and procedures students arelearning should always be put to work in concurrent learning activities that involve the active

8/8/2019 Molecular Visualization in Science Education
http://slidepdf.com/reader/full/molecular-visualization-in-science-education 7/36
Molecular Visualization 2
application of concepts and scientific inquiry. A reconsideration of the goals of science educationand the results of learning research both support this approach to instruction.
When science is taught mainly as a collection of facts that serve as prerequisite knowledge to
later learning, many students finish their scientific education with misconceptions of the nature of
scientific research and little ability to think critically about scientific issues. They may become
citizens who are neither inclined nor equipped to think through the intrinsically scientific issuesthat permeate the workplace and the public sphere today. Introducing all students to a deeper
appreciation of scientific theories and inquiry should be a central goal of science education.
Those students who wish to go on to advanced levels often struggle to make the transition from
memory-based performance to the active use of scientific concepts in novel, open-ended
situations. Educating more individuals, who are more analytical and creative, should be a central
goal of science education.
There is solid evidence that infusing the entire K-16 curriculum with learning activities that
involve inquiry and active concept mastery can contribute to the goals of a more scientifically
sophisticated citizenry and a stronger research community. Contemporary cognitive and
educational research has shown that conceptual, inquiry-oriented knowledge is more persistent,
provides better support for future learning, and transfers more readily to novel situations than list-like factual knowledge or rote problem-solving procedures (NRC, 2000). Educators have begunto articulate key scientific concepts and inquiry experiences that are appropriate for different
grade levels (NRC, 1996), and recent educational research and development have demonstrated
learning activities, instructional methods, and materials that can support the desired learning
outcomes throughout the K-16 curriculum (NRC, 2000; AAAS, 1994).
The learning goals in the new science standards can serve as a framework for the development
and assessment of new educational materials and instructional approaches that incorporate
technology-intensive visualization. Visual media and software should be designed with clear
learning goals in mind, and their refinement and revision should be guided by the careful
assessment of whether students are attaining the goals.
It is particularly important that K-12 teachers have a firm grasp of molecular concepts.Visualization tools such as molecular modeling and animation can be used in teacher preparationto give teachers an accurate and rich picture of the dynamic nature of molecules and molecularinteractions – which often they will not use in the same way with students – but at least they havethe right picture on which to build their instruction.
Vision and Visual Thinking
From an evolutionary perspective, vision is an adaptation that allows organisms to extract
information about the macroscopic three-dimensional physical world from light reflected by
physical surfaces. Vision in primates involves an extraordinarily complex computational system,including numerous specialized regions of the brain (Kosslyn, 1994). The potential of
visualization for education stems in part from the sheer power of the information-processing
resources available in the visual system and in part from subsystems that are specialized for
different tasks, including
• Representing the shapes and relative spatial positions of objects in the immediate
environment over time.
• Memory for visual patterns and visual concepts. The staggering capacity of visual memory
is suggested by our ability to recognize many thousands of objects. Its powers of

8/8/2019 Molecular Visualization in Science Education
http://slidepdf.com/reader/full/molecular-visualization-in-science-education 8/36
Molecular Visualization 3
generalization and abstraction are suggested by our ability to assign a wide range of objects,varying in size, orientation, shape, coloration, and texture, to a category such as "dog."
Visual memory vastly expands our ability to understand what we see and to take appropriate
action (an informative empirical and theoretical exploration appears in Chase & Simon,
1973 and Simon & Chase, 1973).
• Visual imagination. The visual system can synthesize representations from information in
thought and memory rather than from retinal input, allowing us to predict transformations inthe physical world and to plan our interventions in it (see Shepard & Cooper, 1982 for a
series of classic scientific studies of visual imagery).
The visual system is thus a powerful educational resource. If science content can be cast in visualform, the learner can benefit from the system's formidable powers of spatial representation and
transformation, memory, and concept formation. Note, however, that experience with a particular
class of visualizations may be necessary for comprehension. Spatial patterns and transformations
that are specific to the visualizations take time to learn.
The visual system is also artfully designed to conceal its limitations from consciousness. We
experience a uniform visual field in spite of the fact that full pattern processing is only available
in a small region a few degrees in diameter in the current direction of gaze. Even within thisregion a limited-capacity neural resource seems to be required to bind separate features into
coherent object representations (e.g. Treisman, 1985). The neural resources for tracking the
identities and spatial locations of particular objects also appear to be limited in capacity (Trick
and Pylyshyn, 1994). In educational settings, the visual system should not be treated as if it has
unlimited capacity. Visual displays can be too complex to process, particularly for the
inexperienced. Designers who have learned the patterns and practiced the transformations
represented in such displays may be unaware of the challenges they pose to novices.
Imaging Technology
The strength of the human desire to extend the powers of vision beyond immediate physicalcircumstances is suggested by the fact that imaging technologies are among the earliest and mostwidespread manifestations of culture (Tomasello, 2000). It is of interest in the present context to
note the prominent role played by chemistry in the development of imaging technologies, such as
painting, printing, photography, and electronic imaging. The continuous historical development
of these technologies has brought us to the threshold of virtual reality (which, of course, promises
to involve the non-visual senses, as well). We have arrived at the moment in human history whenany idea we have about synthesizing a visual experience can be realized. In education, we can for
the first time envision the potential of visualization without regard to technical limitations.
Visualization
The term visualization is used traditionally to refer to activities of visual imagination and has
been extended to apply to the creation of external images that extend our visual experience or
imagination. Visualizations bridge gaps between ordinary vision, which is powerful but depends
on the presence of the relevant parts of the actual world, and visual imagination, which functionswithout sensory input but is highly limited in capacity. Visualizations extend visual memory and
thought by providing virtual worlds for vision to work on. A neurosurgeon, for example, can
visualize a brain tumor by imagining its location or by inspecting magnetic resonance images of
the patient's brain. The MRI images augment the mental image of the surgeon, who can in turn

8/8/2019 Molecular Visualization in Science Education
http://slidepdf.com/reader/full/molecular-visualization-in-science-education 9/36
Molecular Visualization 4
transform his or her image to plan a surgical approach or to consider the possible need for furthertests. External visualizations also serve valuable communication functions. The MRI images can
help the neurosurgeon communicate his or her understanding of the tumor to the patient, who
ideally acquires an internal image that resembles the surgeon's.
Thinking clearly about the role of visualization hinges on understanding that the immediate
significance, or meaning, of an internal or external visual image depends critically on an intendedinterpretation. That is, the meanings of images involve relations to other things and ideas. These
relations are symbolic in the sense that they are matters of convention that involve some degree of
arbitrariness. Some conventions exploit natural correspondences that facilitate image
understanding. Perspective rendering, for example, exploits a natural projective correspondencebetween three-dimensional and two-dimensional space. The time lines and number lines used in
graphs exploit cognitively natural correspondences between time or number and spatial extent.
Nevertheless, the need for interpretation is never fully eliminated. In intellectual contexts
particularly, the proper interpretation of an image is not fully encoded in its spatial structure.
Consider our hypothetical neurosurgical situation again. Magnetic resonance imaging maps
numerical data representing tissue density onto two-dimensional brightness or color values that
are displayed for human visual perception. Interpreting one kind of MRI image requires knowingthat it represents a particular cross section of the brain in a particular left-right and top-bottom
orientation, that particular areas of the two-dimensional image represent functionally-significant
three-dimensional structures in the brain, and that brightness values are correlated with particular
types of tissue and states of health. Although the neurosurgeon can "see" the diagnosis at a
glance, the image is initially meaningless to the patient, who lacks the surgeon's knowledge of
neuroanatomy, MRI imaging conventions, and typical spatial patterns that show up on the
images. The surgeon's conference with the patient becomes a mini-course on neurology, MRI,
and the network of conceptual relations that connect them.
Visualization in Science Learning
The above remarks suggest that the usefulness of a visualization to students depends onknowledge of concepts that the visualization is designed to represent. For example, a student
cannot learn from space-filling models of molecules without at least rudimentary concepts of
atom, molecule, carbon, oxygen, and so on. Students must also understand something about the
mapping between the models and the concepts; for example, black or gray spheres represent
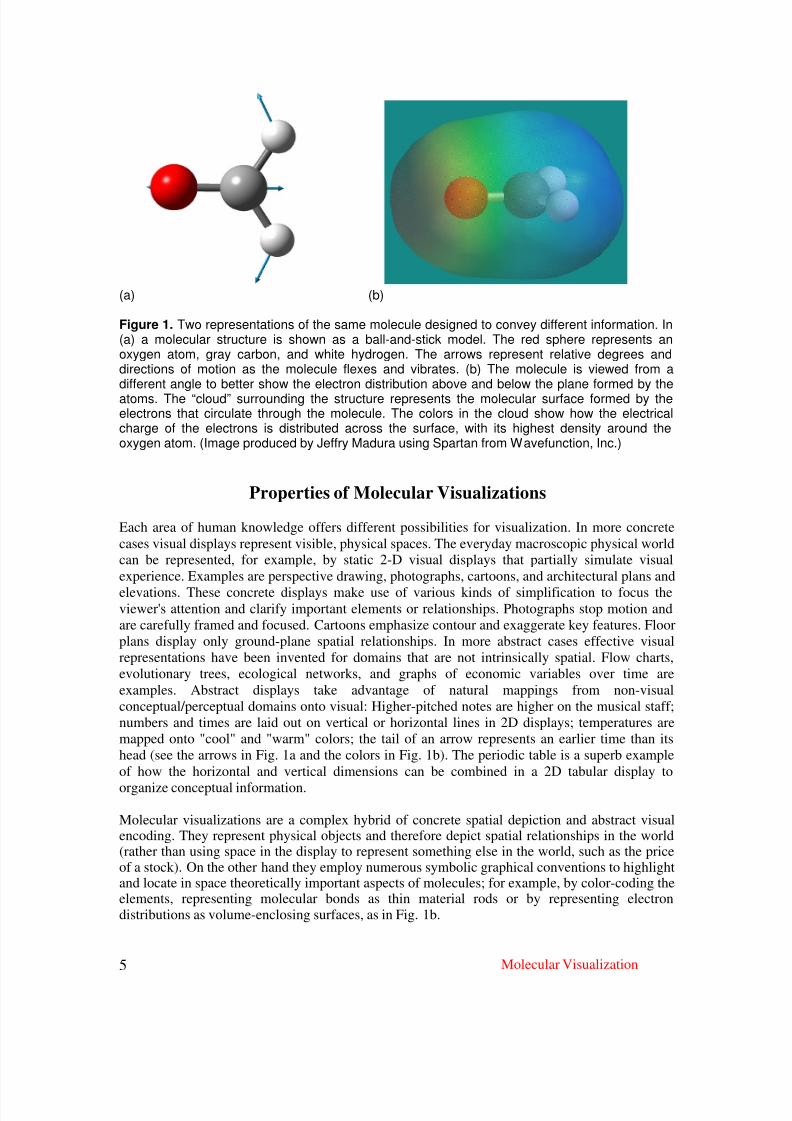
carbon atoms, red spheres represent oxygen atoms, and white spheres represent hydrogen atoms(see Fig. 1a).
If students are to learn something new from a particular display, they must attend to relevant
aspects of the display and appreciate how they illustrate new concepts. For example, the
conceptual point of an electrostatic potential diagram (see Fig. 1b) is not that a molecule consists
of connected atoms in a cloud of electrons, but that the distribution of electrons across differentatoms may be of conceptual importance. The typical learning situation utilizing visualizations,
then, involves a process of bootstrapping in which students are simultaneously learning about and
from the displays, that is, learning both new concepts and how those concepts are visually
represented in images that are intended to facilitate learning the concepts. Fluency with the visualconventions employed in a particular type of visualization develops with time, ultimately leading
to the expert’s fluent perception of the conceptual relationships that are encoded in the displays.
8/8/2019 Molecular Visualization in Science Education
http://slidepdf.com/reader/full/molecular-visualization-in-science-education 10/36
Molecular Visualization 5
(a) (b)
Figure 1. Two representations of the same molecule designed to convey different information. In(a) a molecular structure is shown as a ball-and-stick model. The red sphere represents anoxygen atom, gray carbon, and white hydrogen. The arrows represent relative degrees anddirections of motion as the molecule flexes and vibrates. (b) The molecule is viewed from adifferent angle to better show the electron distribution above and below the plane formed by theatoms. The “cloud” surrounding the structure represents the molecular surface formed by theelectrons that circulate through the molecule. The colors in the cloud show how the electricalcharge of the electrons is distributed across the surface, with its highest density around theoxygen atom. (Image produced by Jeffry Madura using Spartan from Wavefunction, Inc.)
Properties of Molecular Visualizations
Each area of human knowledge offers different possibilities for visualization. In more concrete
cases visual displays represent visible, physical spaces. The everyday macroscopic physical worldcan be represented, for example, by static 2-D visual displays that partially simulate visual
experience. Examples are perspective drawing, photographs, cartoons, and architectural plans and
elevations. These concrete displays make use of various kinds of simplification to focus theviewer's attention and clarify important elements or relationships. Photographs stop motion and
are carefully framed and focused. Cartoons emphasize contour and exaggerate key features. Floor
plans display only ground-plane spatial relationships. In more abstract cases effective visual
representations have been invented for domains that are not intrinsically spatial. Flow charts,
evolutionary trees, ecological networks, and graphs of economic variables over time are
examples. Abstract displays take advantage of natural mappings from non-visual
conceptual/perceptual domains onto visual: Higher-pitched notes are higher on the musical staff;
numbers and times are laid out on vertical or horizontal lines in 2D displays; temperatures are
mapped onto "cool" and "warm" colors; the tail of an arrow represents an earlier time than its
head (see the arrows in Fig. 1a and the colors in Fig. 1b). The periodic table is a superb example
of how the horizontal and vertical dimensions can be combined in a 2D tabular display to
organize conceptual information.
Molecular visualizations are a complex hybrid of concrete spatial depiction and abstract visualencoding. They represent physical objects and therefore depict spatial relationships in the world(rather than using space in the display to represent something else in the world, such as the priceof a stock). On the other hand they employ numerous symbolic graphical conventions to highlightand locate in space theoretically important aspects of molecules; for example, by color-coding theelements, representing molecular bonds as thin material rods or by representing electrondistributions as volume-enclosing surfaces, as in Fig. 1b.

8/8/2019 Molecular Visualization in Science Education
http://slidepdf.com/reader/full/molecular-visualization-in-science-education 11/36
Molecular Visualization 6
Many chemists believe that the real power of computers and visualization in chemistry is theiruse in helping students understand the dynamics involved in chemistry; for example, that proteinsare flexible and not rigid entities, the mechanism by which ions get through biological channels,how heating a molecule increases its reactivity, and the origin of phase transitions. Visualizationsare important in this context in that the effect of subtle interactions between molecules, which are
complex and difficult to describe simply, can be grasped in a glance.
Potential Implications of Molecular Visualization
Visualization in chemistry is part of the general multimedia explosion in science education, which
is characterized by the design of custom visualizations to illustrate particular structures or
concepts. The better illustrations are informed by general principles of good visual representation
and graphic design, but the linkage between scientific concepts and visual representation is often
not deeply principled or algorithmic. Textbooks in physiology or geology, for example, contain
hundreds of illustrations that opportunistically employ a huge range of graphical conventions to
illustrate numerous structures, processes, and models that are related to each other but not
strongly integrated theoretically. In chemistry, however, a unified theory is used to makequantitative spatial predictions, which allows highly generalized rules to link theoretical concepts
to visual displays. Expanded structural formulas that show the connectivity within a molecule by
lines connecting the elemental symbols of the atoms, are an example of a type of productive
visualization, in which a set of diagrammatic rules produces qualitatively informative diagrams of
an unlimited range of molecules (Fig. 2). In contemporary chemistry the possibilities have been
expanded by using computer-based numerical representations and graphical rendering algorithms
in molecular modeling programs to produce spatially accurate graphical displays of molecular
structure and dynamics.
H
H C O H
(a) H (b) CH3OH
Figure 2. The expanded structural formula of methanol (a) conveys more information about themolecule than the condensed structural formula (b).
The promise for students
Because basic 3D spatial relationships in molecules have systematic and profound causalsignificance, chemistry is an extraordinarily fertile field for visual learning. To learn chemistry is
in part to learn how chemical concepts play out in space and how spatial relationships signal
theoretical meanings. It is in part to learn how to use diagrams and displays to aid understanding.
Typically students enter chemistry courses with persistent misconceptions about the particulate
nature of matter (Gabel, Samuel, & Hunn, 1987). Visualization tools provide a means of helpingstudents improve their conceptions. Teaching chemistry involves helping students grasp the
spatial dimensions of chemical theory, as they simultaneously learn about and learn from the
visualizations that are employed in the field. A student's struggle to master the meaning of a
particular display nearly always has the potential to transfer to other displays and problems,
because displays are based on general principles and are used consistently in beginning and
advanced work. Since visualization is intrinsic to research in chemistry, learning to work with
visualizations can be integrated with active, problem-based, or inquiry-oriented learning activities
that mirror the research experience.

8/8/2019 Molecular Visualization in Science Education
http://slidepdf.com/reader/full/molecular-visualization-in-science-education 12/36
Molecular Visualization 7
The potential for educational technology
The productive, algorithmic nature of computer-based molecular visualization opens up exciting
possibilities for educational technology. The possibilities, discussed further below, range from
intelligent skill-building tutors to virtual reality molecular worlds to student research projects
using molecular databases.
Learning with Molecular Visualization
Its highly systematic and conceptual nature make molecular visualization an ideal arena for visual
learning. From the standpoint of theories of vision, cognition, and learning, however, it also poses
highly significant challenges to the learner. The difficulties that students might face in
understanding and using molecular visualizations can tentatively be divided into four areas:
Visual subtlety
Basic spatial relationships in molecular displays, even when they are faithfully rendered,
challenge human visual capacities for at least the following reasons:
• Angular relationships that are not 90 degrees and that therefore can not be aligned with
orthogonal 3D coordinates are significant. Orthogonal relationships, particularly when
aligned with the horizontal and vertical, are relatively easy to perceive. Non-right angles are
relatively difficult to perceive, particularly when they are not embedded in a picture plane (a
plane orthogonal to the line of sight). The relative difficulty is amplified in 2D perspective
views, which lack some depth cues (e.g. stereopsis and head-motion-induced parallax), but
is still present for actual 3D models or virtual reality displays.
• The values of distances and angles are sometimes significant. Precise metric values are
generally not directly perceivable, and relative values can be difficult to perceive,
particularly when they lie in different 3D planes. The difficulty is exacerbated by 2Dperspective representation.
• Spatial relationships among three or more parts of a molecule are often significant.
Limitations on visual attention make it difficult to grasp the arrangement of multiple objects
in space. Tracking multiple objects in motion is very difficult.
• Relationships that involve symmetry, reflection, or rotation are frequently significant in
molecular visualizations. Although symmetry about a vertical axis in a picture plane can be
readily perceived in two dimensions, symmetries in three dimensions are more difficult to
perceive. The “handedness” of objects is not directly perceived. It is therefore difficult to
distinguish between two objects that differ only by reflection. The mental comparisons or
rotations involved in appreciating 3D correspondences, or the details of 3D shape, areeffortful and error-prone.
Complexity
The amount and depth of the information that potentially can be encoded in visual displays makesmolecular visualization exceptionally complex. The complexity has been managed through the
design of different types of displays to represent information at different spatial scales or to
highlight particular theoretical analyses. Students are confronted with many different types of
displays, including structural formulas, organic line structures, Lewis structures, ball-and-stick

8/8/2019 Molecular Visualization in Science Education
http://slidepdf.com/reader/full/molecular-visualization-in-science-education 13/36
Molecular Visualization 8
models, space-filling models, electron-density models, protein ribbon models, and othercomputer-generated graphics and animations (Fig. 3). On the one hand, students benefit from the
tuning of the visual elements of each type of display to its conceptual content. On the other hand,
learning to understand each type of display and the interrelations among them is a formidable
learning task.
(a) (b)Figure 3. Two modes of representing protein molecules. In (a) only the bonds between atoms aredepicted (by lines) and the surrounding water molecules by the red dots. This representationfacilitates the study of how different regions of the protein interact with water. In the more abstractstructure in (b) the red ribbons represent alpha helix regions of a protein and the yellow ribbonsbeta sheet (planar) regions. This representation shows at a glance how the long chain of atomsmaking up the “backbone” of the protein is arranged. Each representation allows the viewer tofocus on important properties by leaving out less relevant parts of the structure.
Abstractness and conceptual depthThe earliest stages of learning are complicated by the need to master the relatively abstract
graphic conventions involved in any depiction of molecules, which we do not see at the molecular
scale under normal conditions, and which therefore do not have natural visual appearances. Ball-
and-stick models, for example, mix spatial realism and graphic convention in a way that isbeautifully adjusted to their purpose but potentially quite opaque to beginners. Balls and sticks
are symbols that stand for things that have few of the properties of the symbols themselves.
Students must learn to "read" these symbols, much as they learn that a double blue line on a map
represents an interstate highway and that a small white square on the line represents an exit.
Throughout learning, students must confront the conceptual depth of molecular visualizations,
which depict physical objects, but which cannot be understood, sensibly manipulated, or created
without understanding the concepts that they are linked with. The theory of chemical bonds, forexample, determines much of what we see in a molecular visualization, but the display encodes
consequences of the theory, not the theory itself.
For expert chemists the cognitive links between theory and appearance are so fluent that they
"see" the theory in the display. For novices some of these links may not exist and others may
require effortful recall. Merely looking at the visualizations does not instill the relevant concepts.
Experts amplify their well-established knowledge by carefully selecting visualizations to support
memory and thought or confirm predictions. For the novice learners this feedback, or
8/8/2019 Molecular Visualization in Science Education
http://slidepdf.com/reader/full/molecular-visualization-in-science-education 14/36
Molecular Visualization 9
bootstrapping, relationship between a visualization and underlying concepts is much moredelicate because of the relatively fragile state of their conceptual knowledge and experience with
visualizations. In order for a display to enhance their use of a concept, they must already have
some grasp of the concept and how it maps onto the display. In order to learn more about a
concept from the display they must already know and be able to remember something about the
concept. If the scaffolding knowledge fails, the visualization becomes meaningless, a sentence in
a foreign language. If it succeeds, the visualization may contribute significantly to bothmomentary understanding and long-term conceptual mastery.
The visual subtlety, complexity, and conceptual depth of molecular visualization pose significant
challenges to learners and teachers, and they raise important research and design issues forcurriculum developers and educational researchers. Some of the issues are outlined below.
Individual and Group Differences in Learning
The novice learner, invoked in the above discussion, is a statistical mode that stands for a range
of individual differences among students in entry-level spatial cognition and reasoning. It should
not be assumed that any change in the use of molecular visualization in instruction will increasethe range of students who master chemistry. It would be relatively easy, in fact, to design a
rapidly-paced, visualization-intensive curriculum that would disadvantage students with weak
entering skills in visual cognition.
Individual differences sometimes reflect group differences that are of current social importance.
For example, gender differences, favoring men, in understanding and imagining spatial
transformations, such as rotation, are among the largest and most consistent that have been
reported in the general psychological literature. If this difference plays a role in college chemistry
performance, chemistry instruction could play either a positive or negative role in women's entry
to scientific careers, depending on whether students are given adequate opportunity to learn
visualization skills. Cultural differences may also influence how students use and learn from
visualizations.
Molecular Visualization in the Curriculum
The centrality of molecular visualization in the field of chemistry suggests that its role should be
considered in relation to the full range of goals for science education that have been articulated inrecent national reports (Advisory Committee, 1996; AAS, 1993; NRC, 1996). It should be noted
that the points discussed at the workshop and presented here are motivated mainly by general
theories of learning and instruction and by current work in educational technology. They will
have to be shaped further by commentary and experience from the chemistry education
community. No attempt is made here to assess the degree to which the suggestions made have
been implemented.
Factual and Visual Fluency
High school and college science instruction has traditionally been over-balanced toward
delivering relatively inert facts to students and testing them for rote retention. Facts should be
acquired in environments that require their understanding and meaningful application. It is worth
noting, however, some of the factors that affect the learning of facts in visualization-rich contexts.

8/8/2019 Molecular Visualization in Science Education
http://slidepdf.com/reader/full/molecular-visualization-in-science-education 15/36
Molecular Visualization 10
Practice: Amount, timing, and feedback
As noted above chemistry is rich in nomenclature, structures, and multiple visualizationtypes. Extensive practice is required to achieve any degree of fluency in such a complex
domain. Software-based visualization can enhance the amount and quality of practice in
several ways. The production of examples and problems can be automated (or semi-
automated), increasing the number of exposures in a course, or achieving the sameamount of exposure at the cost of less laboratory, problem-solving, or teacher time.
Software-based tutors can generate immediate feedback and sequence exercises
contingent on student performance. Because brief (10-30 minutes) practice sessions heldthree times per week or more appear to be effective during the first few years of complex
skill acquisition, brief, relatively low-level, practice sessions with molecular
visualizations should have a measurable pay-off for higher-level learning activities. Thevalue of frequent practice can be enhanced through the immediate feedback provided by
the use of web delivery and by several strategies such as those that follow.
Annotation
Verbal descriptions of visualizations are essential for pointing out their significant features andbuilding relevant causal concepts. Descriptions are frequently unclear to students, however,because they are not sure how the words map onto the picture. In the classroom such
misunderstandings are often cleared up by redundancy in the lecturer's presentation or by student-
teacher interaction. The chances of confusion are much greater in computer-based presentation.
Confusion can be reduced by providing students with a simple way to post questions or
comments on material and by annotating the visualization itself. An advantage of computer-based
over print presentation is that the density of annotation can be increased through step-wise
animation of labels, arrows, color codes, and so on. The student can be given the power to step
through and replay the stages.
Dimensional focus
Given the challenges that the structural subtleties of molecules present to human visualperception and cognition, it is unlikely that enough attention is currently being paid to helping
students overcome them. The challenges could be specifically addressed in software-based
tutorials. Properties such as dihedral angles, polyhedral structure, chirality, functional groups, or
the dynamics of molecular conformations can be carefully explored through color-coding,
rotation, or piecewise highlighting or animation. Using the simplest possible display that contains
the target information is a useful strategy that is sometimes not followed in computer-generated
presentations. Richer displays often contain irrelevant information that can distract or mislead the
learner. Traditional molecular line drawings have much to recommend themselves in this regard.
The ability easily to add or subtract elements of displays in molecular modeling programs is a
very useful recent development.
Comparative presentationThe complexity of molecules and their representations can be addressed in part by presenting
students with side-by-side comparisons of related displays. Comparisons as simple as frequently
labeling visualizations with their chemical names or displaying expanded structural formulas nextto their ball-and-stick or space-filling models are potentially of great value. The availability of
display options in molecular modeling programs is an example of offering adventurous students
the opportunity to explore a range of such comparisons. It can also be exploited by tutorial
developers to support students' exploration. The simple idea of using visual comparison to clarify
concepts is indefinitely extendable. Any visualization can potentially be clarified by comparing it

8/8/2019 Molecular Visualization in Science Education
http://slidepdf.com/reader/full/molecular-visualization-in-science-education 16/36
Molecular Visualization 11
to another that is similar but differs on a critical dimension. Guided visual comparison appears tobe a very widely-employed strategy in both traditional and computer-based chemistry instruction.
However, computer-generated visualization should allow many more, high-quality comparisons
to be presented to students.
Animation
Animation can add considerable learning potential to computer-generated visualization. Wemight distinguish roughly between two uses of animation. First, animation can be used to clarify
information that is essentially static. For example, by rotating a computer-generated molecular
model, one can get a better appreciation of its 3D structure; by systematically assembling and
taking apart the visualization of a crystal, one can clarify structural relationships. Second,animation can be used to visualize the dynamics of individual molecules or molecular
interactions. There is much educational potential in both these uses, but the second seems clearly
the most important, since it extends molecular visualization to the processes that are at the heart
of chemistry. Bringing numerically accurate dynamic simulations of complex processes into the
classroom is a particularly exciting prospect.
It should be said, however, that we know very little about how to use animation effectively in
instruction. The proper role of animation in chemistry education should be treated as an issue incognitive, educational, and curricular research. As animation is brought increasingly into the
curriculum, its effects on students should be carefully researched.
From the standpoint of the cognitive science of vision, a clear issue is that displays of molecules
in motion are extraordinarily complex. There will be cases where most novices fail to see what is
important in an animation. One corrective strategy is breaking a continuous transformation down
into static snapshots, which are then annotated and compared. Giving the user the ability to step
through and stop transformations, and to turn various kinds of annotation on and off, should also
be important. An example might be a protein folding into a certain large scale shape. It can be
easy to see that two shapes fit together. On the other hand it can be difficult to track the relative
positions of four or five atoms in a protein molecule as they move through the simulated folding
(Fig. 4).
Figure 4. Four steps in the folding ofa protein molecule. Showing thefolding in separate steps makes iteasier to comprehend the process bywhich the strand folds upon itself.(Image from Molecular Universe , byRichard Catlow and Clive Freeman;see www.molecularuniverse.com.Produced with WebLabViewerPro.)
8/8/2019 Molecular Visualization in Science Education
http://slidepdf.com/reader/full/molecular-visualization-in-science-education 17/36
Molecular Visualization 12
Promoting Understanding through Interaction
If computer-based visualization were used extensively, following all of the recommendations
above, and nothing else were done, it is likely that many students would not develop a very
sophisticated understanding of chemistry. Students must do more than simply view well-prepared
visualizations. One of the unfortunate drawbacks of current visualization technology is that when
it is the sole means of learning about molecular structure and dynamics students simply observewhat they once might have struggled to imagine or draw or build activities that may lead to
deeper learning. A major goal for the use of computer-based visualization should be the provision
for students to actively explore and use concepts.
Software interactivity
The most straightforward step toward increasing active student involvement in learning is to
make visualizations interactive. There are a number of relatively simple forms of interactivity that
are easy to apply. For example, students can be asked to answer multiple-choice questions about
displays, to make predictions about displays, to point to critical parts of displays, or to manipulate
a display (such as a computer-generated molecular model) in order to answer a question.
Questions can be designed to tap different levels of conceptual understanding. With someadditional development work item statistics can be collected on particular questions to confirm
their difficulty level and the content of tutorials can be contingent on the student's answers. Most
current visualization-based chemistry tutorials contain examples of good interactive questions but
do not contain nearly enough interactive material to build conceptual understanding.
Interactivity that explores causality
A particular strength of computed molecular visualization is the ability to represent causal factors
and processes more easily, more accurately and, in more detail than was traditionally possible.
Tutorials can explore the consequences of factors such as precise spatial conformation, orbitals,
and charge distributions. Emphasis should be placed on having students make theory-based
predictions or answer theory-based questions about the consequences of these key causal factors.
As students grapple repeatedly with why molecules are structured in certain ways and react incertain ways, relatively unconnected facts begin to be welded together into an explanatory
conceptual network that is resistant to forgetting and that serves as an input to active problem
solving.
Software-based classroom interaction
Although software interactivity helps to build conceptual understanding, the current state of theart is not sufficient to bring students to a decent mastery of chemical theory. Good human tutors
bring certain things to their interactions with students that are currently difficult to embed in
software. Human tutors, for example, can ask students questions about the theoretical significance
of a representation and respond intelligently to their answers. Students' answers often reveal
initial conceptions that are inconsistent with chemical theory or incomplete. The tutor can then
pose a scaffolding question that asks the students to use what they know to think more deeplyabout the issue, or to consider another case. By actively using their concepts in this kind of
tutorial setting, students rebuild and extend them. Artificial intelligence applied to this purpose
may one day lead to effective computer-based tutoring.
In a moderate-size electronic classroom, one way of achieving concept-driven tutorial interaction
is to have students work individually or in pairs with visualization or simulation software to
answer conceptual questions posed by the instructor (Khan, 2001a, 2001b). The instructor polls
one or more students/pairs for answers and justification and suggests further lines of exploration

8/8/2019 Molecular Visualization in Science Education
http://slidepdf.com/reader/full/molecular-visualization-in-science-education 18/36
Molecular Visualization 13
with the software to test theories or resolve disagreements. The interactions set up a Generate,Evaluate, Modify (GEM) cycle that progressively builds concepts from the student's initial
conception. These approaches can be modified to meet the needs of large lecture classes (Mazur,
1997).
Another approach to achieving a high level of student interactivity is the use of palm computers
with simulation and modeling programs in the classroom. At the University of North Carolina-Wilmington students in large general chemistry classrooms use HyperChem modeling software
on hand-held computers with wireless Internet access to create, modify, and make measurements
on molecular structures (Shotsberger and Vetter, 2001).
At the high end of technological development are novel learning environments that help students
to visualize complex or invisible phenomena. For example, the haptic arm is a mouse that
allows students to sense attractions and repulsions as they interact with three-dimensional
molecular structures. Virtual reality tools such as the Immersadesk and the Narrative-basedImmersive Constructionist/Collaborative Environments (NICE) developed at the University of
Illinois at Chicago are used to create, enter, and study representations of fundamental scientific
ideas in a three-dimensional virtual environment (Johnson, 2000). Figure 5 shows students
collaborating on the exploration of a virtual world. The goal of this application is to strengthenstudent understanding by allowing them to form mental models of abstract concepts by
experiencing and controlling multiple representations of the concepts.
Figure 5. Sixth grade teacher Kevin Harris watches as three of his students explore a virtual worldat Abraham Lincoln Elementary School in Oak Park, Illinois. One student drives the groupthrough the space; another records the data they find using the Pocket PC; the third tracks theirprogress on a laptop computer. (Photograph courtesy of Andrew Johnson.)
Active Concept Mastery and Inquiry
If students are to be encouraged actively to explore and master concepts, at some point
visualization and simulation software must become a tool that they, as well as their teachers, areputting to use. Individuals or groups of students can be assigned to prepare and present
visualizations that they have created to solve a problem, verify a prediction, or illustrate a

8/8/2019 Molecular Visualization in Science Education
http://slidepdf.com/reader/full/molecular-visualization-in-science-education 19/36
Molecular Visualization 14
reaction. In such problem-based learning students become producers as well as consumers of visualizations and are forced to grapple with the concepts underlying their work. A higher
education example of this kind of work comes from the University of Michigan, where groups of
introductory students study and report on chemical synthesis problems over a period of weeks,
defending their work to teachers and peers (Coppola, 2001). An example from the secondary
school level is the ChemDiscovery curriculum, in which students construct their own learning
pathways using highly interactive CD-ROM lessons (Jones, 1999). The teacher facilitatesstudents’ work as they design materials and compounds using extensive interactive databases.
Embedding the use of visualization tools in laboratory work that involves the collection and
interpretation of empirical data is a final, crucial element in achieving an understanding of chemical theory and inquiry. Students must come to an understanding of how the highly abstract
and symbolic visualizations that they have become familiar with are anchored in empirical
observation. Visualization tools can also fundamentally change the way laboratory work is done–
through an iterative process that uses the results of visualization tools to help design the next step
in an experiment. One of the workshop organizers (Stillings) recently interviewed a professional
scientist who reported that the most significant experience of his undergraduate career was trying
to reconcile NMR data he had collected in a faculty mentor's laboratory with his theoretical ideas
about what was supposed to have happened in his experiment. He became a scientist when hisconcepts (expressed as 3D line drawings and physical ball-and-stick models) bumped into the real
world. A primary goal in developing the uses of molecular visualization in the curriculum should
be to bring this kind of experience to greater numbers of students.
Summary of Recommendations
This section summarizes the main recommendations presented above and additional
recommendations made by the four groups at the workshop. As stated previously, these
recommendations are not intended to be either prescriptive or restrictive, but rather to stimulate
dialog on molecular visualization among different research communities. Recommendations are
divided into suggestions for fruitful research questions related to molecular visualization inscience education and proposals for change in the chemistry curriculum. The central role of
molecular visualization in chemistry and biology research today suggests that research into the
scientific applications of visualization is as important as research into learning with
visualizations.
Research on molecular visualization
Collaborations among chemists, biologists, cognitive scientists, and science educators maypresent new opportunities to study how students learn. Two types of approaches to research onthe characteristics and usage of molecular visualizations were considered.Macroscopic approach: large scale, long-term studies of the effectiveness of entire courses,
including transfer.• Microscopic approach: controlled studies comparing particular aspects of visualizations,
such as three vs. two dimensions, the effectiveness of animation, and the degrees of
schematization required for teaching specific concepts.

8/8/2019 Molecular Visualization in Science Education
http://slidepdf.com/reader/full/molecular-visualization-in-science-education 20/36
Molecular Visualization 15
Characteristics of visualizations.Analyze new visualizations produced by scientists: what drives the development of the
visualizations? how are previous conventions used or changed? Where do new conventionscome from?
• What are the effects of visualizations on intuitions, research questions, conceptions, and
misconceptions?
• When are tactile interactions important?• What are the effects of mixing different types of visualizations?
• How do individual differences such as gender, learning style, culture, etc., affect the
ability to learn from visualizations?
• Is there a right-left brain shift in activation of visualization from experts to novices,
comparable to that seen in music training?
• What principles of graphic design are important for the design of effective molecular
visualizations?
Curriculum issues.
• What are the barriers to educators introducing molecular visualization into the
classroom?
• What new student misconceptions might be introduced by visualization tools?
• How can networking, discussion groups, and other communication opportunities be used
to support learning with visualizations?
• How can visualization best be used in combination with practical work in a hands-on
laboratory setting? In groups of students?
• How do instructors use different visualization systems and representations? What do they
use? For which topics? When?
• What pedagogical content knowledge is appropriate?
• Does working with visualizations require different kinds of problem-solving skills than
are currently taught?
• How does knowing what a molecule looks like contribute to learning?
•
How will the curriculum be restructured? (What must be given up?)• How much guidance do we give students?
• How much visualization of a given type has to be present in a course for it to be
effective?
• How can learning from visualizations best be assessed?
Interactions
Ideas for fruitful research questions included the following:
• How do student mental models of matter change as a function of interaction with
molecular visualizations?
• How do student-generated representations change as a function of interaction with
visualization systems?
• How do student-generated visualizations develop and change as students learn scientificconcepts?
• Can we generate “thick ” descriptions of students interacting with molecular
visualizations to try to characterize the learning experience?
• What types of interactions are best for which types of situations or topics?
• How do students integrate different types of representations?
• Are different learning methods more appropriate for different situations? For example, is
discovery learning preferable for qualitative notions, direct for quantitative?

8/8/2019 Molecular Visualization in Science Education
http://slidepdf.com/reader/full/molecular-visualization-in-science-education 21/36
Molecular Visualization 16
Molecular visualization in the chemistry and biology curriculum
Molecular visualization provides new ways to talk about structure and dynamics and may thus be
a stimulus for change in chemistry and biology courses. Workshop participants felt that such
change must be undertaken with caution and expressed concerns about the appropriate use of
molecular visualization in education. At present too many topics may be introduced to students at
a time. We need to reduce the load on student working memory rather than add more. We alsoneed to avoid introducing additional (and possibly confusing) variables along with the use of
molecular visualization. For example, the hydrogen atoms in model kits are often too large
relative to the other atoms, different model sets are used in lecture and lab, and some
characteristics of representations may not be comprehensible to students. Introducing molecular
visualization may also take time away from building problem-solving skills and may also be
expensive.
The advantages of using molecular visualizations were seen as sufficient to make the effort of introducing them into the curriculum worthwhile. Molecular visualizations are believed to
N get students to think about chemistry in terms of molecules, models, and symbols.N
allow students to be more active learners.N
help students to understand models and symbolic representations.N offer a chance to move toward change.
The interactive nature of visualizations encourages movement away from an instructor-centered
paradigm of instruction in which students are passive learners toward a more student-centered
approach in which students are active participants.
Develop approaches to visualization thqt are easy for students to use and interpret.
The abundance of different types of representations (chemical equations, mathematical formulas,
graphs, animations, and different types of molecular representations) is a barrier to learning.
Students can better cope with the variety of representations if the purpose of each type isdiscussed with students. It may be advisable to start with simpler structures, such as two-
dimensional representations and move from them to more complex, three-dimensional ones.
Develop instructional methodologies that take advantage of the interactive nature of visualization.Visualizing chemistry should be fun for students and hence motivating. Although visualization is
not a “magic bullet” that can solve all the problems students have learning chemistry and biology,
its use in classrooms provides many opportunities to raise the activity level of students. New
technologies need to be explored to assess their potential as mechanisms for teaching
visualization. For example, students in courses using a central computer server can collaborateand complete work that is tracked.
Integrate visualization and modeling into curricular materials .
Not all topics can be taught with visualizations; the topics best taught this way need to be
identified. Publishers play an important role in the kind of visualizations distributed and so needto be involved in the development of visualization curricula.
Support faculty who are introducing visualization.
Instructional materials for visualization need to be easy for instructors to learn and to use. In
addition, faculty members need guidance and support when beginning to use molecular
visualizations in teaching. Professional development and “in-service” opportunities are needed, as
well as workshops on effective instructional strategies and on the research and dissemination of
new ideas.

8/8/2019 Molecular Visualization in Science Education
http://slidepdf.com/reader/full/molecular-visualization-in-science-education 22/36

8/8/2019 Molecular Visualization in Science Education
http://slidepdf.com/reader/full/molecular-visualization-in-science-education 23/36
Molecular Visualization 18
References
Advisory Committee to the National Science Foundation (1996). Shaping the Future: New
Expectations for Undergraduate Education in Science, Mathematics, Engineering, and
Technology. NSF 96-139. Washington, D.C.: National Science Foundation.
American Association for the Advancement of Science: Project 2061 (1993). Benchmarks for
Science Literacy. New York: Oxford.
Atkins, P. W. (1987). Molecules. New York: Scientific American Library (W. H. Freeman).
Chase, W. G. & H. A. Simon (1973). Perception in chess. Cognitive Psychology, 4, 55-81.
Coppola, B. P. (2001). http://www.umich.edu/~chem215. Follow the links to the “HTML
Project”.
Gabel, D. L., Samuel, K. V., and Hunn, D. (1987) Understanding the particulate nature of matter, Journal of Chemical Education, 64, 695-697.
Johnson, A., Moher, T., Ohlsson, S., and J. Leigh. (2001). Exploring multiple representations in
elementary school science education. Proceedings of IEEE Virtual Reality 2001, March 13-
17, Yokohama, Japan.
Jones, L. L., “Learning Chemistry through Design and Construction,” UniServe Science News,
14, November, 1999, 3-7. (http://science.uniserve.edu.au/newsletter/vol14/jones.html)
Khan, S. (2001a). A guided discovery approach to developing inquiry skills using multiple,compact simulations. Presented at the annual meeting of the National Association forResearch in Science Teaching, St. Louis, MO, March 25-28, 2001.
Khan, S. (2001b). Developing inquiry skills while learning about unobservable processes inchemistry. Presented at the annual meeting of the American Educational ResearchAssociation, Seattle,WA. April, 2001.
Kosslyn, S. M. (1994). Image and brain: The resolution of the imagery debate. Cambridge, MA:
MIT Press.
Mazur, E. (1997). Peer instruction: A user’s manual. Series in Educational Innovation, Upper
Saddle River, NJ: Prentice Hall.
National Research Council (1996). National Science Education Standards. Washington, D.C.:
National Academy Press.
National Research Council, (2000). How People Learn: Brain, Mind, Experience, and School:Expanded Edition. Washington, DC: National Academy Press
Shepard, R. N. & L. A. Cooper (1982). Mental images and their transformations. Cambridge,
MA: MIT Press.
Shotsberger, P. G., & Vetter. (2001). Teaching and learning in the wireless classroom. Computer ,
34(5), 110-111. (http://computer.org/computer/homepage/march/int_watch/0301.htm)Simon, H. A. & W. G. Chase. (1973). Skill in chess. American Scientist, 61, 394-403.
Tomasello, M. (2000). The cultural origins of human cognition. Cambridge, MA: Harvard
University Press.
Treisman, A. (1985). Preattentive processing in vision. Computer Vision, Graphics, and Image
Processing, 31, 156-177.Trick, L. M., & Z. W. Pylyshyn. (1994). Why are small and large numbers enumerated
differently? A limited capacity preattentive stage in vision. Psychological Review, 100, 80-102.

8/8/2019 Molecular Visualization in Science Education
http://slidepdf.com/reader/full/molecular-visualization-in-science-education 24/36
Molecular Visualization 19
Resources
Molecular Visualization Workshop Advisory Board
Peter AtkinsProfessor of Chemistry and Fellow
Lincoln College, Oxford, UK
Brian P. CoppolaAssociate Professor
Department of Chemistry
University of Michigan
Chris DedeTimothy E. Wirth Professor in Learning Technologies
Graduate School of Education
Harvard University
Steve KosslynProfessor
Department of Psychology
Harvard University
Nathan S. LewisProfessor
Department of Chemistry
California Institute of Technology
Marcia LinnProfessor
Graduate School of EducationUniversity of California at Berkeley
Eric MartzProfessor of Immunology
Department of Microbiology
University of Massachusetts at Amherst
Klaus SchultenSwanlund Professor of Physics
Beckman Institute
University of Illinois at Urbana-Champaign

8/8/2019 Molecular Visualization in Science Education
http://slidepdf.com/reader/full/molecular-visualization-in-science-education 25/36
Molecular Visualization 20
Molecular Visualization Workshop participants
Peter AtkinsProfessor of Chemistry and Fellow
Lincoln College, Oxford, UK
Eric BaumgartnerResearcher
Graduate School of Education
University of California-Berkeley
Orville L. ChapmanProfessor of Chemistry and Associate Dean
of Education Innovation
University of California-Los Angeles
Brian P. CoppolaAssociate Professor of Chemistry
Department of ChemistryUniversity of Michigan
Peter GarikAssociate Professor
School of Education
Boston University
John I. GelderProfessor of Chemistry
Department of Chemistry
Oklahoma State University
Bob Gotwals Computational Science Educator
The Shodor Education Foundation
Eric JakobssonProfessor, Department of Molecular andIntegrative Physiology
Head, Bioengineering Program
Senior Research Scientist, NCSA
University of Illinois at Urbana-Champaign
Andrew JohnsonAssistant Professor
Electronic Visualization Laboratory
University of Illinois at Chicago
Loretta JonesProfessor of Chemistry
Department of Chemistry and Biochemistry
University of Northern Colorado
Kenneth D. JordanProfessor of Chemistry
Department of Chemistry
University of Pittsburgh
Thomas JoseDepartment of Chemistry
Texas A & M University
Resa KellyDepartment of Chemistry and Biochemistry
University of Northern Colorado
Bruce E. KoelProfessor of Chemistry and Materials
Science
University of Southern California
Robert KozmaPrincipal Scientist
Center for Technology in Learning
SRI International
Nathan S. LewisProfessor of Chemistry
Department of Chemistry
California Institute of Technology
Jeffry D. MaduraAssociate Professor & ChairDepartment of Chemistry & Biochemistry
Duquesne University
Peter MahaffyProfessor of ChemistryThe King’s University College
Edmonton, AB Canada
Neil S. OstlundPresident and CEO
Hypercube, Inc.
Barry RoweChemistry / Physics Instructor / Technology
MentorChampaign Centennial High School
Champaign, IL

8/8/2019 Molecular Visualization in Science Education
http://slidepdf.com/reader/full/molecular-visualization-in-science-education 26/36
Molecular Visualization 21
Nora Sabelli Senior Visiting Scholar
Department of Curriculum and Instruction
University of Texas (on leave from NSF)
Alan J. ShustermanProfessor of Chemistry
Reed College
Gwen Shusterman Associate Professor of Chemistry
Portland State University
Portland, OR
Neil A. StillingsProfessor of Psychology
School of Cognitive Science
Hampshire College
Robert TinkerPresident
The Concord Consortium
Barbara TverskyProfessor
Department of Psychology
Stanford University
David H. UttalAssociate Professor
Department of Psychology
Northwestern University
William Vining
Associate professorDepartment of Chemistry
University of Massachusetts at Amherst
John Wintersteen
Product Manager, Experimental Chemistry
Molecular Simulations Inc.A Subsidiary of Pharmacopeia
Vickie M. Williamson
Workshop Evaluator and Senior LecturerDepartment of Chemistry
Texas A & M University
Qian XieProgrammer
Concord Consortium

8/8/2019 Molecular Visualization in Science Education
http://slidepdf.com/reader/full/molecular-visualization-in-science-education 27/36
Molecular Visualization 22
Molecular Visualization Projects Contributed by Workshop Participants
Using Molecular Visualization to Demonstrate Principles of Protein Structure and
conservation of Essential Function during Evolution.
A bioinformatics tool (the Biology Workbench) and a molecular visualization tool (Protein Explorer ) are used in the teaching of molecular biology. The Workbench is used to align
sequences of homologous proteins from widely different organisms and Protein Explorer is used
to transform those alignments into three dimensional structural representations that illustrate
functional conservation and principles of protein folding.
http://peptide.ncsa.uiuc.edu/educwb
Contact: Eric Jakobbson, [email protected]
Palm, Pocket, and Handheld Devices for Molecular Modeling
Handheld computers can now support sophisticated molecular modeling programs that aresuitable for education and research. At the University of North Carolina-Wilmington students are
issued handheld computers when they arrive for class. During class time they explore the
properties of molecules and complete projects.http://aa.uncwil.edu/numina/
Contact: Neil Ostlund, [email protected]
Beneath the Surface of the Chemical Article Beginning in 1996, a number of term-long projects were interwoven with the Structured Study
Group program, in which first-year chemistry students earn honors credit. In one project, all of
the students contribute to the construction of a written and HTML literature-driven resource onwhich their final examination is based. Ultimately, the multimedia text is fully owned by the
students in the course, and they must seek out each other's expertise in order to examine their
understanding.
http://www.umich.edu/~chemh215
Contact: Brian Coppola, [email protected]
ChemSense ChemSense is a software environment that provides students with a variety of representational
tools and resources that they can use to express their understanding of chemical phenomena.
These tools allow students to create different types of representations and use them in a
community of learners to make predictions and explain the results of their laboratory
investigations. These representations are both student-generated (e.g., molecular diagrams and
animations) and generated by probes connected to student experiments (e.g., tabular data and real
time graphs). Students work in a networked environment to comment and build on each other's
work.
http://www.chemsense.org/
Contact: Robert Kozma, [email protected]
Integrated Molecular VisualizationAs the wealth of molecular information existing in public and private databases or derived from
tools based on new technologies continues to grow, the need to see and integrate results is now
more important than ever. MSI is developing programs that facilitate understanding through
effective visual representation, and provides tools for integrating chemistry on the PC.
http://www.accelrys.com/
Contact: John Wintersteen, [email protected]
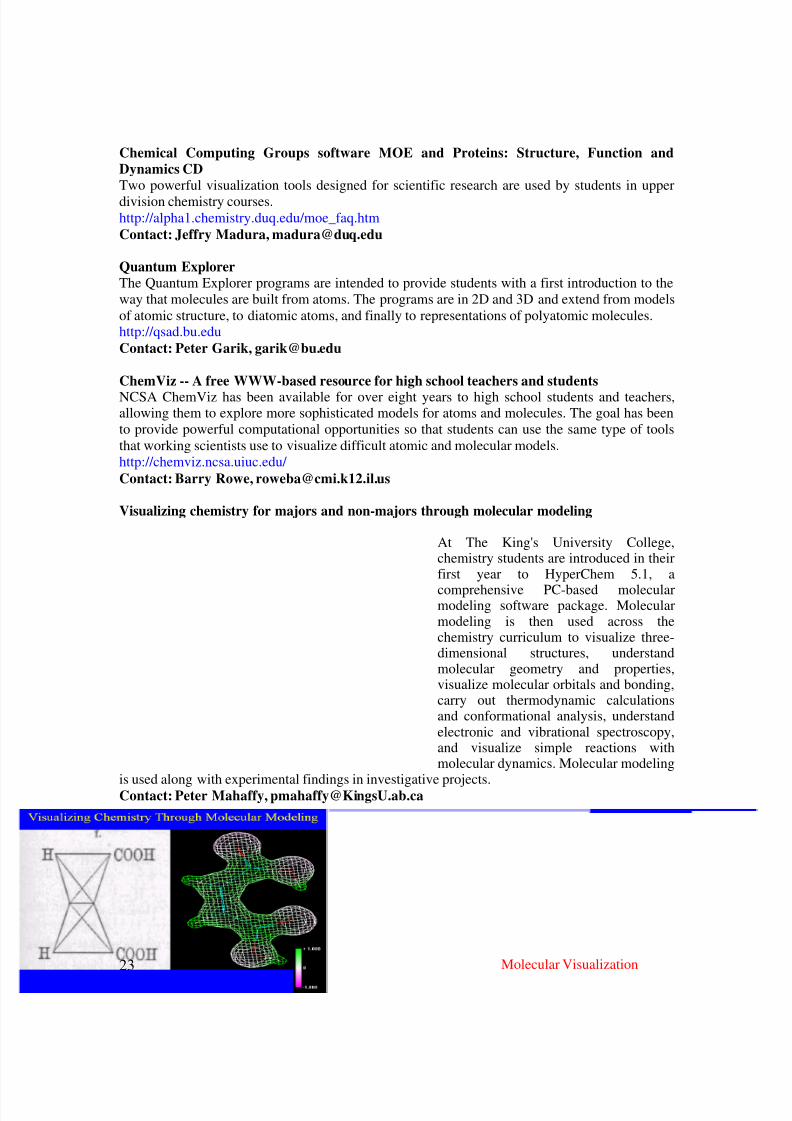
8/8/2019 Molecular Visualization in Science Education
http://slidepdf.com/reader/full/molecular-visualization-in-science-education 28/36
Molecular Visualization 23
Chemical Computing Groups software MOE and Proteins: Structure, Function and
Dynamics CDTwo powerful visualization tools designed for scientific research are used by students in upper
division chemistry courses.
http://alpha1.chemistry.duq.edu/moe_faq.htm
Contact: Jeffry Madura, [email protected]
Quantum ExplorerThe Quantum Explorer programs are intended to provide students with a first introduction to the
way that molecules are built from atoms. The programs are in 2D and 3D and extend from models
of atomic structure, to diatomic atoms, and finally to representations of polyatomic molecules.http://qsad.bu.edu
Contact: Peter Garik, [email protected]
ChemViz -- A free WWW-based resource for high school teachers and students
NCSA ChemViz has been available for over eight years to high school students and teachers,allowing them to explore more sophisticated models for atoms and molecules. The goal has been
to provide powerful computational opportunities so that students can use the same type of tools
that working scientists use to visualize difficult atomic and molecular models.
http://chemviz.ncsa.uiuc.edu/
Contact: Barry Rowe, [email protected]
Visualizing chemistry for majors and non-majors through molecular modeling
At The King's University College,chemistry students are introduced in theirfirst year to HyperChem 5.1, a
comprehensive PC-based molecularmodeling software package. Molecularmodeling is then used across thechemistry curriculum to visualize three-dimensional structures, understandmolecular geometry and properties,visualize molecular orbitals and bonding,carry out thermodynamic calculationsand conformational analysis, understandelectronic and vibrational spectroscopy,and visualize simple reactions withmolecular dynamics. Molecular modeling
is used along with experimental findings in investigative projects.Contact: Peter Mahaffy, [email protected]

8/8/2019 Molecular Visualization in Science Education
http://slidepdf.com/reader/full/molecular-visualization-in-science-education 29/36
Molecular Visualization 24
Interaction and Assignability Software has been developed to engage students in their work with animations of molecular
reaction mechanisms, moving toward a student-active approach to visualization. Letter-line
drawings are used instead of 3D models as tools for following electron flow in organic
mechanisms. The UMass OWL system, a web-based homework and tutoring system, is being
extended for use with molecular models.
http://soulcatcher.chem.umass.edu/ Contact: Bill Vining, [email protected]
Oslet Oslet is a molecular simulation software being developed at the Concord Consortium. Oslet can
be used to build arbitrary 2D (for the time being) atomic- scale models ranging from gas, solids,
surfaces, molecules to polymers, micelles and bilayers, run them using molecular dynamics
engines, and analyze the results. Oslet differs from some existing molecular dynamics software in
the fact that it can not only do particle dynamics (typically with the Lennard-Jones potentials), but
also build any kind of 2D molecular structure and investigate its dynamical behaviors. Oslet has a
powerful modelling environment with which the user can create and edit a structure.
http://www.concord.org/%7Ebarbara/workbenchcc/workbench_index.html
Contact: Bob Tinker and Qian Xie, [email protected]
A Web-based Molecular Level Inquiry Laboratory ActivityA new computer-based atomic level simulation of an ideal gas was written in JAVA and is
accessed by students through a web browser. This software is used in conjunction with a
laboratory experiment report developed within the framework of an inquiry instructional strategy.
This molecular level laboratory experiment is used in combination with a parallel macroscopic
laboratory experiment. It is hypothesized that students exposed to these kinds of parallel activities
will be better able to link their macroscopic, microscopic, and symbolic understanding of chemical concepts.
Contact: John Gelder, [email protected]
The Consortium for Technology in Teaching Chemistry, (CTTC) Program at USC The CTTC was started last year to establish a consortium for Southern California teachers andinstitutions who are interested in implementing computer technologies in their high school
science classrooms, in order to pool resources, share ideas, develop strategies, and provide
continuing education. Atomistic and molecular imaging using STM and AFM are used to
visualize chemistry and materials.
http://michele.usc.edu/cttc/index.html
Contact: Bruce Koel, [email protected]
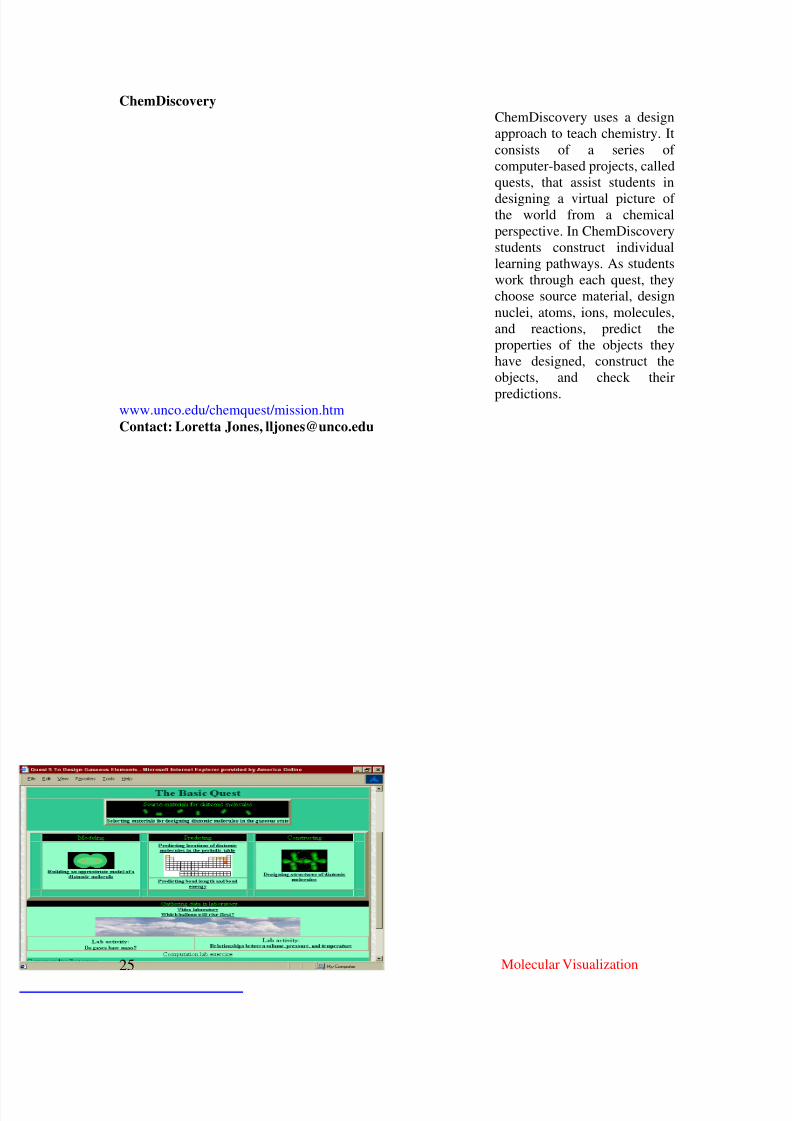
8/8/2019 Molecular Visualization in Science Education
http://slidepdf.com/reader/full/molecular-visualization-in-science-education 30/36
Molecular Visualization 25
ChemDiscoveryChemDiscovery uses a design
approach to teach chemistry. It
consists of a series of
computer-based projects, called
quests, that assist students in
designing a virtual picture of the world from a chemical
perspective. In ChemDiscovery
students construct individual
learning pathways. As students
work through each quest, they
choose source material, design
nuclei, atoms, ions, molecules,
and reactions, predict the
properties of the objects they
have designed, construct the
objects, and check their
predictions.www.unco.edu/chemquest/mission.htm
Contact: Loretta Jones, [email protected]

8/8/2019 Molecular Visualization in Science Education
http://slidepdf.com/reader/full/molecular-visualization-in-science-education 31/36
Molecular Visualization 26
Bibliography for molecular visualization in science education
Antionietti, A. (1991). Why does mental visualization facilitate problem solving? In R. Logie
and M. Denis, (Eds.), Mental images in human cognition. (pp. 211-230). New York: North
Holland.
Arnheim, R. (1969). Visual thinking. Berkeley, CA: University of California Press.
Baker, S. & Talley, R. (1974). Visualization skills as a component of aptitude for chemistry: Aconstruct validation study. Journal of Research in Science Teaching, 11 (2), 95-97.
Ben-Zvi, R, Eylon, B and Silberstein, J. (1987). Students Visualisation of a Chemical Reaction. Education in Chemistry, July, 117-120.
Chandler, P. and J. Sweller. (1991). Cognitive load theory and the format of instruction.Cognition and Instruction, 8(4), 293-332.
Chiu, M. & Fu, H. (1990). Molecular kits and problem solving in stereochemistry. Chinese
Journal of Science Education,1(2) 161-188.
Cohen, M. S., Kosslyn, S. M., Breiter, H. C., DiGirolamo, G. J., Thompsonb, W. L., Anderson,
A. K., Bookheimer, S. Y., Rosen, B. R. and J. W. Belliveau. (1996). Changes in cortical
activity during mental rotation: A mapping study using functional MRI. Brain, 119, 89-100.
Coleman, S. & Gotch, A. (1998). Spatial perception skills of chemistry students. Journal of
Chemical Education, 75 (2), 206-209.Dede, C., Ed. (1998). Learning with technology (1998 ASCD Yearbook). Alexandria, VA:
Association for Supervision and Curriculum Development.
de Jong, T. & van Joolingen, W. (1998). Scientific discovery learning with computer
simulations of conceptual domains. Review of Educational Research, 68, (2), 179-201.
Dwyer, F. (1978). Strategies for improving visual learning. State College, PA: Learning
Services.
Dwyer, F. (1987a). Enhancing visualized instruction: Recommendations for practitioners.
State College, PA: Learning Services.
Dwyer, F. (1987b). Examining the symbiotic relationship between verbal and visual literacy in
terms of facilitating student achievement. Reading Psychology: An International Quarterly,
9, 365-380.
Edelson, D. C., and Gordin, D. (1997) Creating science learning tools from experts’ investigationtools: a design framework, Annual Meeting of the National Association for Research in
Science Teaching, Oak Brook, IL, March 20-24, 1997.
Farah, M. (1990). The neurological basis of mental imagery: A computational Analysis. In S.
Pinker (Ed.), Visual cognition. Amsterdam: Elsevier.
Gabel, D. & Sherwood, R. (1980). The effect of student manipulation of molecular models on
chemistry achievement according to Piagetian level. Journal of Research in Science
Teaching, 17 (1), 75-81.
Gentner, D. & Stevens, A. (1983). (Eds.). Mental models. Hillsdale, NJ: Erlbaum. Gordin, D. N., and Pea, R. D. (1995) Prospects for scientific visualization as an educational
technology. Journal of the Learning Sciences, 4(3), 249-279.
Griffiths, A., and Preston, K. (1992) Grade 12 students' misconceptions relating to fundamental
characteristics of atoms and molecules. Journal of Research in Science Teaching, 29, 611-628.
Haidar, A. H., & Abraham, M. R. (1991). A comparison of applied and theoretical knowledge
of concepts based on the particulate nature of matter. Journal of Research in Science
Teaching, 28, 919-938.Harrison, A. G. and D. F. Treagust. (1996). Secondary students’ mental models of atoms and
molecules: Implications for teaching chemistry. Science Education, 80(5), 509-534.

8/8/2019 Molecular Visualization in Science Education
http://slidepdf.com/reader/full/molecular-visualization-in-science-education 32/36
Molecular Visualization 27
Hayes, T. (1996). Spatial ability and the effects of computer animation on short termcomprehension and long term comprehension. Journal of Educational Computing
Research,14 (2), 139-155.
Jih, H. J., & Reeves, T. C. (1992). Mental models: A research focus for interactive learning
systems. Educational Technology Research and Development, 40(3), 39-53.
Jones, L. L. (1996). The role of molecular structure and modeling in general chemistry. New
Initiatives in Chemical Education: An On_Line Computer Conference, Summer, 1996.http://www.inform.umd.edu:8080/EdRes/Topic/Chemistry/ChemConference/ChemConf96/J
ones/Paper3.html
Keig, P. F., and P. A. Rubba. (1993). Translations of representations of the structure of matter and
its relationship to reasoning, gender, spatial reasoning, and specific prior knowledge. Journal of Research in Science Teaching, 30, 883-903.
Kleinman, E. & Dwyer, F. (1998). Analyzing the visual dimensions of cognition. In R.
Griffin, C. Schiffman, W. Gibbs (Eds.), Connecting with the community: Exploring
resources for visual learning & expression. (pp. 33-40). University Park, PA: IVLA.
Kosslyn, S. M. (in press). Einstein's mental images: The role of visual, spatial, and motoric
representations. In Galaburda, A. M., Kosslyn, S. M., & Christen, Y. (Eds.), Languages of
the Brain. Harvard University Press, Cambridge, MA.
Kosslyn, S. M. (1999). If neuroimaging is the answer, what is the question? Phil. Trans. RoyalSociety London B, 354, 1283-1294.
Kosslyn, S. M., Thompson, W. L., Kim, I. J., and N. M. Alpert. (1995). Topographical
representations of mental images in primary visual cortex. Nature, 378, 496-498.
Kozma, R. (2000). The use of multiple representations and the social construction of
understanding in chemistry. In M. Jacobson & R. Kozma (Eds.) Innovations in science and
mathematics education: Advanced designs for technologies of learning (pp. 11-46).
Mahwah, NJ: Erlbaum.
Kozma, R.B., Chin, E., Russell, J., & Marx, N. (2000). The role of representations and tools in
the chemistry laboratory and their implications for chemistry learning. Journal of the
Learning Sciences, 9(3), 105-144.
Kozma, R. & Russell, J. (1997). Multimedia and understanding: Expert and novice responses to
different representations of chemical phenomena. Journal of Research in Science Teaching,34(9), 949-968.
Kozma, R. B., Russell, J., Jones, T., Marx, N., and Davis, J. (1996). The use of multiple, linked
representations to facilitate science understanding. In Vosniadou, S., Glaser, R., DeConte,
E., & Mandel, H. (Eds.), Technology-based learning environments: Psychological and
educational foundations (NATO Asi Series, Series F: Computer and System Sciences, Vol.
13). Hillside, NJ: Erlbaum.Lagowski, J. (1994). Visualizing chemical concepts. Journal of Chemical Education, 71 (9),
720.
Linn, M. C. (1998). The impact of technology on science instruction: Historical trends and
current opportunities. In K. Tobin & B. Fraser (Ed.), International Handbook of Science
Education (pp. 265-294). The Netherlands: Kluwer.
Linn, M. C. & Hsi, S. (1999). Computers, Teachers, and Peers: Science Learning Partners.Hillsdale, NJ: Lawrence Erlbaum Associates.
Mayer, R. & Anderson, R. (1992). The instructive animation: Helping students build
connections between words and pictures in multimedia learning. Journal of Educational
Psychology, 84, 444-452.McKim, R. (1982). Experiences in visual thinking. Monterey, CA: Brooks Cole.
Moore, D. & Dwyer, F. (1994). Visual literacy: A spectrum of visual learning. Englewood
Cliffs, NJ: Educational Technology Publications.

8/8/2019 Molecular Visualization in Science Education
http://slidepdf.com/reader/full/molecular-visualization-in-science-education 33/36
Molecular Visualization 28
Morrison, J. B., Tversky, B., and M. Betrancourt. (2000). Animation: Does It Facilitate
Learning? Proceedings of the AAAI Spring Symposium on Smart Graphics, March,
2000, Stanford, CA.Nakhleh, M. B. (1992). Why some students don't learn chemistry: Chemistry misconceptions.
Journal of Chemical Education, 69, 191-196. Njoo, M. and deJong, T. (1993). Exploratory learning with a computer simulation for control
theory: Learning processes and instructional support. Journal of Research in Science
Teaching, 30, 821-844.
Novick, S., & Nussbaum, J. (1981). Pupils' understanding of the particulate nature of matter: Across-age study. Science Education, 65, 187-196.
Nurrenbern, S. C., & Pickering, M. (1987). Concept learning versus problem solving: Is there a
difference? Journal of Chemical Education, 64(6), 508-512.
Osborne, R. J., & Cosgrove, M. M. (1983). Children's conceptions of the changes of state of
water. Journal of Research in Science Teaching, 20, 825-838.Paivio, A. (1986). Mental representations: A dual coding approach. New York: Oxford
University Press.
Park, O. (1998). Visual displays and contextual presentations in computer-based instruction.
Educational Technology, Research & Development , 46 (3), 37-50.
Pereira, M. P., and M. E. M. Pestana. (1991). Pupils' representations of models of water. International Journal of Science Education, 13(3) (July-Sept. 1991): 313-19.
Peterson, R. F., & Treagust, D. F. (1989). Grade-12 students' misconceptions of covalent bonding
and structure. Journal of Chemical Education, 66(6), 459-460.
Pinker, S. (1984). Visual Cognition. Amsterdam: Elsevier.
Pribyl, J. & Bodner, G. (1987). Spatial ability and its role in organic chemistry: a study of fourorganic courses. Journal of Research in Science Teaching, 24 (3), 229-240.
Rzepa, H. S., and A. P. Tonge. (1998). VChemLab: A virtual chemistry laboratory. The
storage, retrieval and display of chemical information using standard Internet tools. Journal of Chemical Information and Computer Sciences, 38(6), 1048-1053.
Sawrey, B. A. (1990). Concept learning versus problem solving: Revisited. Journal of Chemical
Education, 67(3), 253-254.Seddon, G., Eniaiyeju, P. & Jusoh, I. (1984). The visualization of rotation in diagrams of threedimensional structures. American Educational Research Journal, 21 (1), 25-38.
Seddon, G. & Tariq, R. (1982). The visualization of spatial transformations in diagrams of molecular structures. European Journal of Science Education, 4, 409-420.
Shute, V. & Glaser, R. (1990). A large-scale evaluation of an intelligent discovery world.
Interactive Learning Environments 1, 51-77.
Smith, K. J., & Metz, P. A. (1996). Evaluating student understanding of solution chemistry
through microscopic representations. Journal of Chemical Education, 73, 233-235.
Smith, S. G., and Jones, L. L. "Images, Imagination, and Chemical Reality," J. Chemical
Education 66, 8-11, 1989.
Talley, R. (1973). The use of three dimensional visualization as a moderator in the higher
cognitive learning of concepts in college level chemistry. Journal of Research in Science
Teaching.10 (3), 263-269.
Tasker, R. (1998). The VisChem Project: Molecular Level Animations in Chemistry - Potentialand Caution. UniServe Science News, 9, March, 1998.
(http://science.uniserve.edu.au/newsletter/vol9/tasker.html)
Thompson, W. L., and S. M. Kosslyn. (2000). Neural systems activated during visual mental
imagery: A review and meta-analyses. Brain Mapping: The System, 535-560. Orlando:
Academic Press.
8/8/2019 Molecular Visualization in Science Education
http://slidepdf.com/reader/full/molecular-visualization-in-science-education 34/36
Molecular Visualization 29
Tobin, K. & Tippins, D.J. (1993). Constructivism as a referent for teaching and learning. In K.Tobin (Ed.), The practice of constructivism in science education, (pp. 3-21). Washington
DC: American Association for the Advancement of Science Press.
Tufte, E. (1990). Envisioning Information . Cheshire, CT: Graphics Press.
Tufte, E. (2001). The Visual Display of Quantitative Information, second edition. Cheshire, CT:
Graphics Press.
Tversky, B. (In press). Functional significance of visuospatial reprsentations In P. Shah and A.Miyake (Editors), Handbook of higher-level visuospatial thinking. Cambridge: Cambridge
University Press.
Uttal, D. H., Scudder, K. V., and J. S. DeLoache. (1997). Manipulatives as symbols: A new
perspective on the use of concrete objects to teach mathematics. Journal of Applied
Developmental Psychology , 18, 37-54.
Vosniadou, S., De Corte, E. & Mandl, H. (Eds.). (1994). Technology-based learning
environments: Psychological and educational foundations. Berlin: Springer-Verlag.
Wandersee, J. H., H. H. Mintzes, and J. D. Novak (1994). Research on alternative conceptions in
science. In D. Gabel (Editor), Handbook of research on science teaching and learning, New
York: MacMillan, 177-210.
White, B. & Frederisken, J. (1990). Causal model progressions as a foundation for intelligent
learning environments. Artificial Intelligence , 42, 99-157.Williamson, V. M. and M. R. Abraham. (1995). The effects of computer animation on the
particulate mental models of college chemistry students. Journal of Research in Science
Teaching, 32(5), 521-534.

8/8/2019 Molecular Visualization in Science Education
http://slidepdf.com/reader/full/molecular-visualization-in-science-education 35/36
Molecular Visualization 30
Additional Relevant Web Links
Workshop on modeling and visualization in teacher education
http://www.eot.org/edgrid/mvworkshop.html
NCSA virtual reality demos (Note: most require special hardware)
http://www.ncsa.uiuc.edu/VEG/homepages/tcoffin/ACCESS/access_demos.html
Virtual molecular dynamics lab
http://polymer.bu.edu/vmdl/
Protein explorer
http://proteinexplorer.org
List of Molecular Visualization sites
http://molvisindex.org
Leffingwell's list of visualization resources
www.leffingwell.com/links4.htm
Computational Chemistry for Chemistry Educators
http://www.shodor.org/compchem/
Cabrillo College molecular visualization page
http://c4.cabrillo.cc.ca.us/
Okanagan University's collection of viewable molecular models http://www.sci.ouc.bc.ca/chem/molecule/molecule.html
Indiana University's Molecular Structure Center
http://www.iumsc.indiana.edu/common/common.html
MacMolecule and PCMolecule home page
http://www.molvent.com/
Home page for Chime
http://www.mdli.com/chemscape/chime/
Home page for Rasmol
http://www.umass.edu/microbio/rasmol/
PDB Lite molecule finder
http://pdblite.org
The Role of Representations in Problem Solving in Chemistry, George M. Bodner and Daniel
S. Domin
www.inform.umd.edu/EdRes/Topic/Chemistry/ChemConference/ChemConf96/Bodner/Paper2.ht
ml
Recent Applications of Hyperactive Chemistry and the World-Wide-Web, Henry Rzepa
http://www.ch.ic.ac.uk/rzepa/cc96/

8/8/2019 Molecular Visualization in Science Education
http://slidepdf.com/reader/full/molecular-visualization-in-science-education 36/36
Are Simulations Just a Subsitute for Reality?, Harry E. Pence
http://snyoneab.oneonta.edu/~pencehe/paper9CC97.html
Using Technology to Solve the Conceptual Riddle: "How can we help them see what wesee?" Jimmy Reeves
http://aa.uncwil.edu/reeves/confchem_2000/
Why use animations and simulations? Brian Pankuch
http://www.ched-ccce.org/confchem/2000/b/pankuch/uses.htm
Computer Animations and Simulations in General Chemistry, Chung Chieh and Newman
K.S. Sze
http://www.science.uwaterloo.ca/~cchieh/cact/trios/simulation.html
Discovery-based General Chemistry Using Chemland Simulations, Bill Vining
http://www.ched-ccce.org/confchem/2000/b/vining/vining.htm
Using Simulations to Transform the Nature of Chemistry Homework, David Yaron, ReaFreeland, Donovan Lange, and Jeff Milton
http://www.ched-ccce.org/confchem/2000/b/yaron/Default.htm
Assessing modelling capability in chemistry, John Oversby
http://www.ched-ccce.org/confchem/2000/c/oversby/oversby1.html
Quantum Sciences across Disciplines:http://qsad.bu.edu
An Introduction to Chemistry on the Internet http://chemlinks.beloit.edu/MolecularModel/internet.html
Chemistry Visualization Resources for Teachers http://www.canby.com/hemphill/chmvis.htm