molecular visualization i
TRANSCRIPT

1
Molecular Visualization
Jeffry D. MaduraDepartment of Chemistry & Biochemistry
Center for Computational SciencesDuquesne University
Introduction• Assessments of change, dynamics, and cause and
effect are at the heart of thinking and explanation. To understand is to know what cause provokes what effect, by what means, at what rate. How then is such knowledge to be represented?1”
• The goal is to design “…proper arrangement in space and time images, words, numbers – for presenting information about motion, process, mechanism, cause, and effect.1ec a s , cause, a d e ect.
• Therefore visualization, in our case molecular visualization, is extremely important since it is an extremely effective method to convey information.
1Tufte, Edward R. “Visual Explanations” , 1997, Graphics Press.

2
Examples
Examples

3
Examples
Examples

4
History of Visualization of Biological Macromolecules
http://www.umass.edu/microbio/rasmol/history.htm
OpenDX

5
RasMol• Created by Roger
Sayle• Easy to use, very y , y
basic, and quick to learn.
PyMol• Open-source molecular
modelling system• http://pymol.sourceforge.net/
6
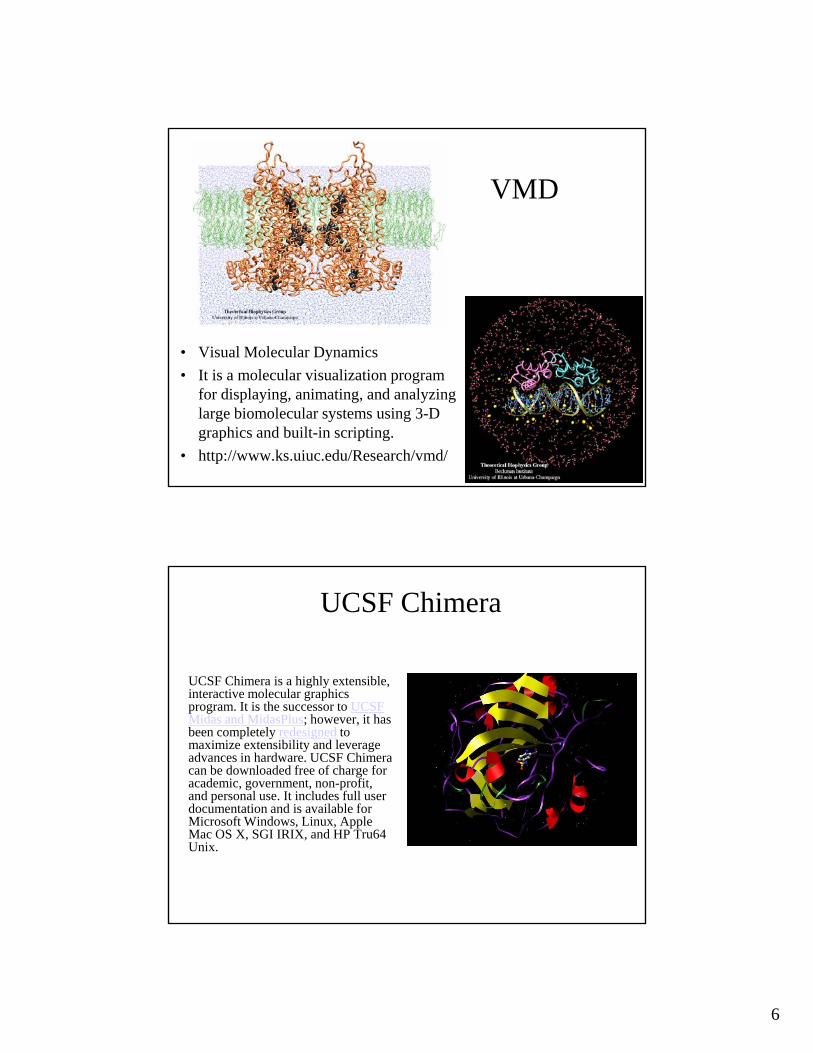
VMD
• Visual Molecular Dynamics• It is a molecular visualization program
for displaying, animating, and analyzing large biomolecular systems using 3-D graphics and built-in scripting.
• http://www.ks.uiuc.edu/Research/vmd/
UCSF Chimera
UCSF Chimera is a highly extensible,UCSF Chimera is a highly extensible, interactive molecular graphics program. It is the successor to UCSF Midas and MidasPlus; however, it has been completely redesigned to maximize extensibility and leverage advances in hardware. UCSF Chimera can be downloaded free of charge for academic, government, non-profit, and personal use. It includes full user d i d i il bl fdocumentation and is available for Microsoft Windows, Linux, Apple Mac OS X, SGI IRIX, and HP Tru64 Unix.

7
MOE• Molecular Operating
Environment• Chemical Computing• Chemical Computing
Group (www.chemcomp.com)
• Visualization and simulation tool
• Runs of numerous computers and has distributive computing capabilities
• Programmable
MolscriptMolScript is a program for creating schematic or detailed molecular graphics images from molecular 3D coordinatesimages from molecular 3D coordinates, usually, but not exclusively, protein structures. The user supplies an input file (the script) which specifies the coordinate file, what objects to render and the exact appearance of the objects through the graphics state parameters There is agraphics state parameters. There is a helper program MolAuto, which produces a good first-approximation input file from a coordinate file.
8
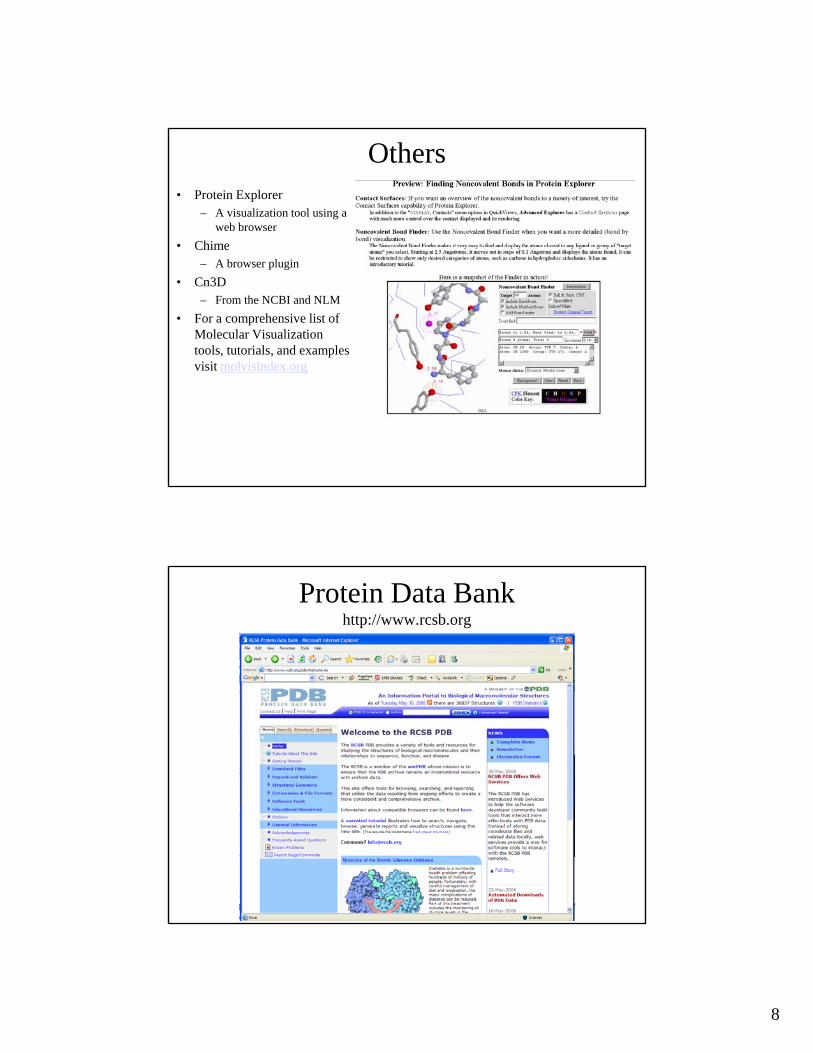
Others• Protein Explorer
– A visualization tool using a web browser
• ChimeChime– A browser plugin
• Cn3D– From the NCBI and NLM
• For a comprehensive list of Molecular Visualization tools, tutorials, and examples visit molvisindex orgvisit molvisindex.org
Protein Data Bankhttp://www.rcsb.org
9
MOE (Molecular Object Environment)• MOE is a visualization and computational
program• Features include
– Visualization and manipulation of molecular objects– Computation of various molecular properties by a
number of methods (e.g. MM/D, Electrostatics, etc.)– Database capabilitiesp– Programmable using SVL (Scientific Vector
Language)– Runs on different computational platforms
• PC, SGI, Sun, HP, and Dec Alpha/NT
MOE as a Visualization Tool• MOE is capable of building as well as editing both simple molecules p g g p
and complex protein structures.• The next few slides will illustrates MOE’s visualization capabilities:
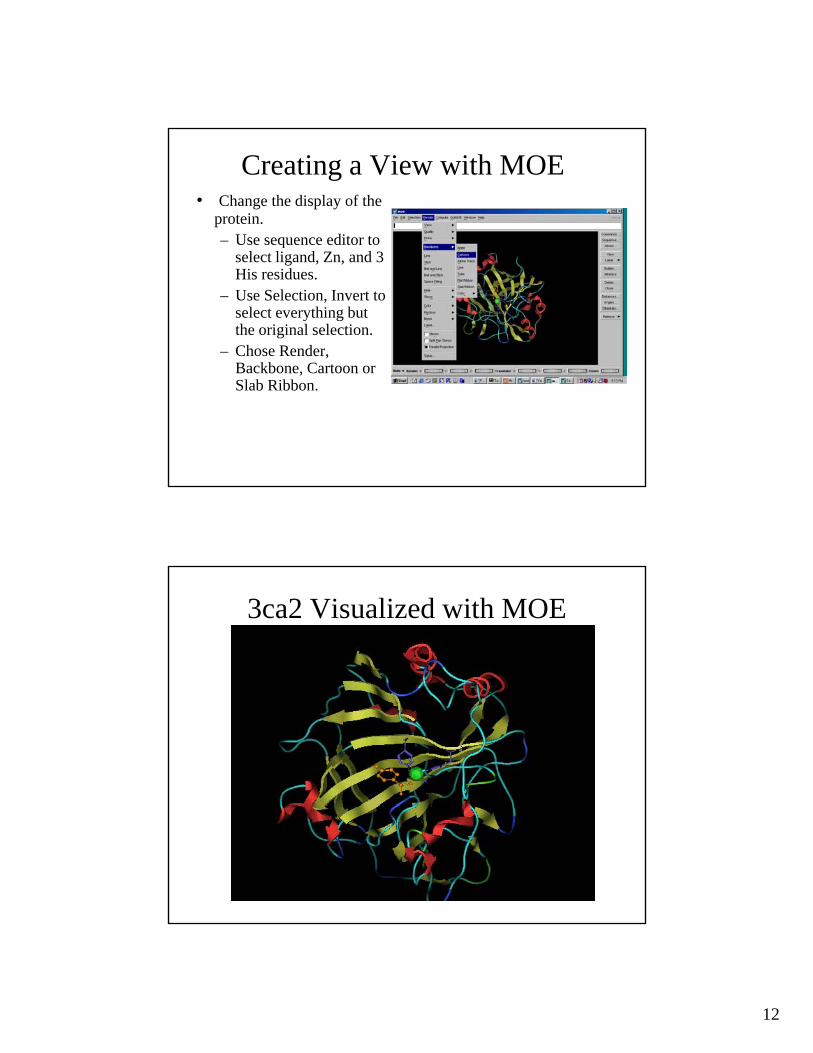
– The final view will be of carbonic anhydrase (3ca2). The enzyme is represented as a solid ribbon, the zinc atom as a green sphere, the three histidines sticks (blue), and the drug (AMS) as ball and stick (orange).
• We will use this example to show MOE’s visualization power by:– Editing the display of an existing protein structure.– Using the atom builder to modify the drug (AMS) bound to 3ca2.

10
Creating a View with MOE• Load the structure fileLoad the structure file
to be viewed (PDB).– File, Open. Find the
directory that contains the structure. Select the file by choosing either the Load PDBeither the Load PDB File Operation (mid right) or the Ok button (lower left).
Creating a View with MOE
• Manipulating the protein.p- Remove bound water
molecules and 2 Hg atoms.
- Chose Window, Sequence Editor. Select the 2 Hg atoms and “Split Ch i ” hChain” to move them to a new chain.
- Delete Chains: Water, 2 Hg atoms.

11
Creating a View with MOE– Display ligand (ams).p y g ( )
• Zoom: Cntrl+Rt/Dial.• Translate: Shift+Rt/Dial.• Rotate: Right/Dial.• After zooming in on
ligand, select it by clicking on any atom while using Cntrl+Lft.
• Under Render, chose Ball and Stick. Then, color the ligand by chosing Color, Basic.
Creating a View with MOE– Display the Zn atom,
highlighting the three bound His residues.
• Select the Zn atom bySelect the Zn atom by left clicking once. Under Render, chose Space Filling; then Color, Basic, Green.
• Select the 3 His residues (116, 93, 91) by using Cntrl+left on each. Chose Render, ,Line; then Color, Basic, Blue.
• Use Builder to remove unbond ligand and Zn atom.
12
Creating a View with MOE• Change the display of the
protein. – Use sequence editor to q
select ligand, Zn, and 3 His residues.
– Use Selection, Invert to select everything but the original selection.
– Chose Render, Backbone Cartoon orBackbone, Cartoon or Slab Ribbon.
3ca2 Visualized with MOE

13
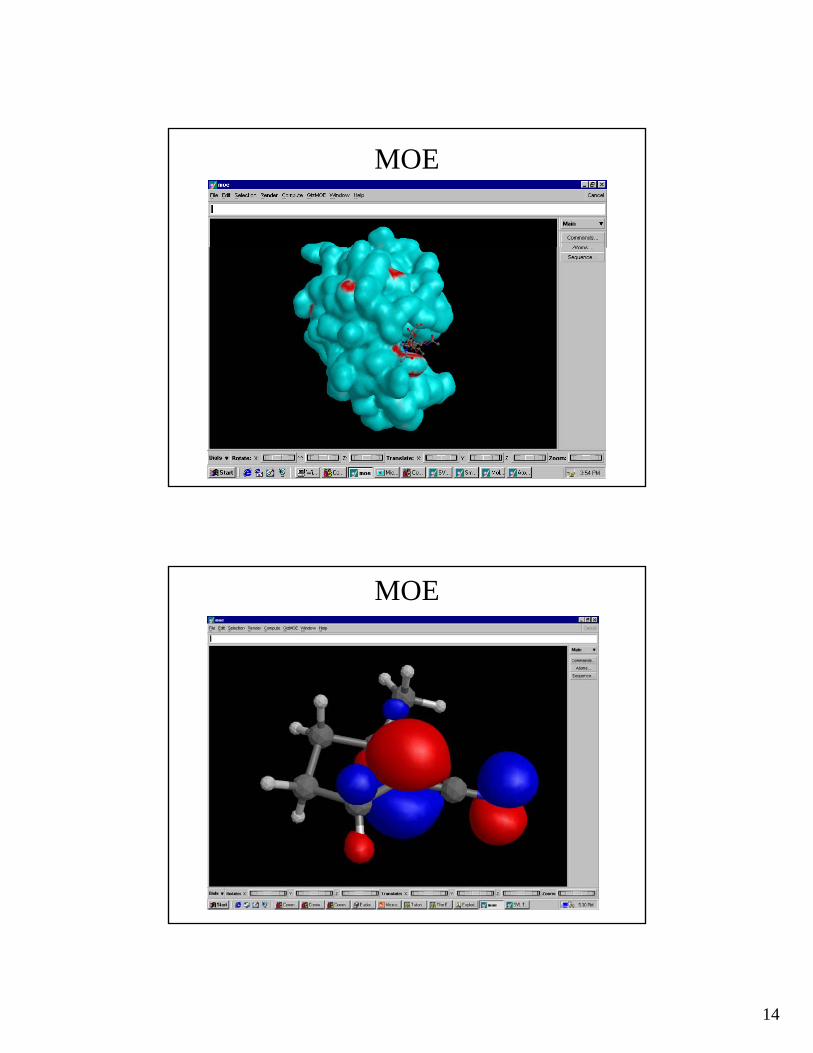
MOE
MOE
• Interactive Modeling– Color atoms by forceColor atoms by force– Indicate formation of
hydrogen bonds (white dots)
– Indicate bad van der Waal contacts (yellow dots)(yellow dots)
– Current energy for the system
14
MOE
MOE

15
Manipulating Molecules:3D Rendering Window
• rotate: drag middle mouse• rotate: drag middle mouse• zoom in/out: <ctrl>+drag middle mouse• shift/pan: <shift>+drag middle mouse• change center of rotation: click the middle mouse
button on the desired atom. To reset, click the iddl b tt f tmiddle mouse button away from any atoms.
• rotate about a bond: select the bonded atoms, then use <alt>-drag left button.
Editing with Molecule Builders• Tools for Building
Molecules in MOE:– Small Molecule Builder
(Edit|Small Molecule
• Small Molecule Builder Features:– Build molecules or add (Edit|Small Molecule
Builder)– Protein Builder
(Edit|Protein Builder)– Carbohydrate Builder
(Edit|Carbohydrate Builder)• Creates carbohydrates by
linking sugar residues at specific positions Can
fragments using buttons, SMILES string
– Substitutions can be made by first selecting atom in 3D rendering window
– Append residues to a chain using the name of an existing compound. Or, specific positions. Can
Invert chiral centers, mutate residues, specify glycosidic torsion angles between residues.
– Create Sequence(SE|Edit|Create Sequence)
create a new chain if the name is new.

16
Editing with 3D Rendering Window
• 3D Rendering Window:– Functions found under Edit
i h b b
Button Bar for 3D Rendering
menu, or right button bar.– Some are on per atom basis,
others work on set of selected atoms.
• Functions include:– Adding/Removing H’s
Ch l
gWindow
– Change Element– Change Ionization– Change Geometry– Bond/Unbond– Delete
Editing 3ca2 Ligand• Delete the Hg atom on the
ligand as well as the H that replaces it.F b i t th• Fuse a benzene ring to the aromatic already present.– Select the 2 Carbons to fuse
the ring to. Chose Create Ring (6) with sp2 geometry
• Replace one of the sp2 Carbons with a carbonyl functional groupfunctional group.
• Use the Unbond key to release the fused ring from ams and delete it.

17
Using the Atom Manager• Used to view atom
attributes.• Accessed by Edit pulldown
• Use Atom Manager to:– Change aromatic ring in ams
to cyclohexanein main window or by double clicking on atom of interest.
• Attributes relevant to bonding:– Element– Ionization: Formal Charge
– Change formal charge of nitrogen
– Change resonance structure of ams.
Ionization: Formal Charge– Geometry: hybridization– HintLP (toggle to indicate if
element has a lone pair not conjugated into aromatic system)
Atom Attributes
• Can be viewed in Atom ManagerM difi d i f Edi lld• Modified in atom manager or from Edit pulldown in main window
• Attributes relevant to bonding– Element– Ionization: formal charge
G h b idi i– Geometry: hybridization– HintLP (toggle to indicate if the element has a lone pair
not conjugated into an aromatic system)

18
Viewing Molecular Data
• MOE has 3 main windows for viewing the• MOE has 3 main windows for viewing the molecular data– main window– atom manager– sequence editor
• can be used to view, edit and select molecular data
Display Options: 3D Rendering Window
• Render|Draw offers options of what to show• Render|Draw offers options of what to show in the main window– Ribbon, Alpha Trace, Hydrogen Bonds, Meters,
Constraints, Bond Orders, Coordinate Axes• these modes are applied to the entire system

19
3D Rendering Window: Footer
• The footer in the 3D rendering window has 3 pages: Dials, 3D, View
• Dials: rotate and translate the system. Same <ctrl>+middle mouse drag and <shift>+middle mouse drag but the dials may give you more
lcontrol.• View: same as Render|View and right button bar
View page but with 8 slots instead of 4.• 3D:controls the Z-axis clipping region and Z-axis
depth cue shading parameters.
Selecting Atoms and Sets of Atoms
• Atom, residue, chain l ti tselection sets
• Selection menus provide specialized operations
• most selection operations add to the current selection setto the current selection set

20
Selecting Atoms: 3D Rendering Window
• Left mouse button for selection• Left mouse button for selection• Double click to select and open Atom
Manager with the selected atom highlighted• <Shift>-click to toggle a selection state• <Ctrl>-click to select entire residue• <Ctrl>-click to select entire residue• <Shift> + <Ctrl>-click to toggle selection of
entire residue
Selecting Atoms: 3D Rendering Window
• Selection Menu used for more advanced types of selections
• Substructure matching and proximity
• Save & Restore selection• Save & Restore selection set

21
Selecting Residues: Sequence Editor
• Left mouse button click to select a residue• <Shift>-click to extend the selection set to
i l d ll id l t d i b t thinclude all residues located in between the previous selection and the current
• <Ctrl>click to toggle a selection state of a residue
Carbohydrate Builder
• Creates carbohydrates by linking sugar residues at specific positionsresidues at specific positions
• invert chiral centers or entire residues by first selecting
• mutate residues in existing carbohydrate structures
if l idi i l b• specify glycosidic torsion angles between residues

22
Protein Builder
• Located under the Edit file menu
Nucleic Acid Builder
• Hidden in the Sequence Window underHidden in the Sequence Window under Edit|Create sequence

23
Problems with Ice/Vacuum Calculations• Temperature of ice is 0 K!
H d b di h i d!• Hydrogen bonding over emphasized!• Energy vs. free energy• Interacting not Binding