modification of metabolic pathways by anabolic agents and...
TRANSCRIPT

Technische Universität München Lehrstuhl für Physiologie
Modification of metabolic pathways by anabolic agents and identification of gene expression biomarkers
Martina Reiter
Vollständiger Abdruck der von der Fakultät Wissenschaftszentrum Weihenstephan für Ernährung, Landnutzung und Umwelt der Technischen Universität München zur Erlangung des akademischen Grades eines
Doktors der Naturwissenschaften (Dr.rer.nat)
genehmigten Dissertation.
Vorsitzender: Univ.-Prof. Dr. Th. Knoke
Prüfer der Dissertation: 1. Univ.-Prof. Dr. H.H.D. Meyer 2. Univ.-Prof. Dr. J. Polster 3. Priv.-Doz. Dr. M. W. Pfaffl Die Dissertation wurde am 16.04.2008 bei der Technischen Universität München eingereicht und durch die Fakultät Wissenschaftszentrum Weihenstephan für Ernährung, Landnutzung und Umwelt am 03.07.2008 angenommen.

Wissenschaft –
Einem ist sie die hohe, die himmlische Göttin,
dem Andern eine tüchtige Kuh, die ihn mit Butter versorgt.
(Friedrich Schiller)

Contents
I
TABLE OF CONTENTS
ABBREVIATIONS III
ZUSAMMENFASSUNG VI
ABSTRACT VIII
1. INTRODUCTION 1
1.1 ANABOLIC AGENTS 1 1.1.1 MISUSE OF ANABOLIC AGENTS IN SPORTS 4 1.1.2 APPLICATION AND MISUSE OF ANABOLIC AGENTS IN ANIMAL HUSBANDRY 5 1.1.3 CLINICAL APPLICATION OF ANABOLIC AGENTS 6 1.2 THE IDEA OF BIOMARKERS 7 1.3 AIMS 11
2. MATERIAL AND METHODS 13
2.1 STUDIES ON BOVINE TISSUES 13 2.2 STUDIES ON PRIMATE TISSUES 13 2.3 STUDIES ON HUMAN TISSUES 14 2.3.1 CELL CULTURE EXPERIMENTS 14 2.3.2 HAIR FOLLICLE EXPERIMENTS 16 2.4 RNA EXTRACTION, RNA QUALITY 16 2.5 SELECTION OF TARGET GENES 17 2.6 PRIMER DESIGN AND AGAROSE GEL ELECTROPHORESIS 21 2.7 REAL-TIME QRT-PCR 22 2.8 DATA ANALYSIS AND STATISTICS 23
3. RESULTS AND DISCUSSION 25
3.1 STUDIES ON BOVINE TISSUES 25 3.2 STUDIES ON PRIMATE TISSUES 30 3.3 STUDIES ON HUMAN TISSUES 37 3.3.1 CELL CULTURE EXPERIMENTS 37 3.3.2 HAIR FOLLICLE EXPERIMENTS 42
4. CONCLUSION 46
REFERENCE LIST 50

Contents
II
ACKNOWLEDGMENTS 56 SCIENTIFIC COMMUNICATIONS 57 CURRICULUM VITAE 59 APPENDIX 60

Abbreviations
III
ABBREVIATIONS AAS anabolic androgenic substances ACADvl acyl-CoA-dehydrogenase ACC.NR. accession number ACTA1 α-actin ACTB β-actin ADI acceptable daily intake AM arithmetic mean Angpt angiopoetin AR androgen receptor AT annealing temperature bp base pairs Bcl-2 b-cell leucemia/lymphoma 2
Bcl-xl bcl-xl protein BW body weight CALR calreticulin CAPN3 calpain 3 CAST calpastatin CDH15 m-cadherin CDK2 cyclin-dependent kinase 2 c-fos c-fos protein c-jun c-jun protein CK creatin kinase Cox cyclo-oxogenase CRL community reference
laboratory Ct crossing point
CTSB cathepsin B CTSL cathepsin L C.V. coefficient of variation CyP1A1 cytochrome P1 DNA desoxyribonucleic acid EDTA ethylenediaminetetraacetic acid e.g. example given Enoyl-CoA enoyl-CoA-hydratase ER estrogen receptor EU European Union FAO food and agriculture organisation FasL death receptor ligand FasR death receptor FCS fetal calf serum FDA food and drug administration FGF fibroblast growth factor FGFR fibrolblast growth factor receptor FLK-1 vascular endothelial growth
factor receptor for forward primer GAPDH glyceraldehyde-3- phosphate dehydrogenase GC gas chromatography GDF8 myostatin GHR growth hormone receptor GLUT glucose transporter

Abbreviations
IV
GR glucocorticoid receptor HBSS hank's buffered salt solution HEPES 4-(2-hydroxyethyl)-1- piperazineethanesulfonic acid HF hair follicle HFDPC hair follicle dermal papilla
cells HGF hepatocyte growth factor HK hexokinase HRE hormone responsive element HSD17b 17β-hydroxy-steroid- dehydrogenase Hsp heat shock protein IGF1 insulin like growth factor 1 IGF1R insulin like growth factor 1 receptor IGFBP insulin like growth factor binding protein IL interleucin IOC international olympic
committee IR insulin receptor JECFA joint FAO/WHO expert committee on food additives LDH lactate-dehydrogenase MGA melengestrol acetate MMP matrix metalloproteinase MS mass spectrometry Myf myogenic factor MYHC2x myosin heavy chain MyoD myogenic differenciation factor
MyoG myogenin NCBI national center for biotechnology information n.m. not measured NRL national reference laboratory NT neurotrophin OD optical density p53 tumor supressor PCR polymerase chain reaction PPIA cyclophilin A PRLR prolactin receptor qRT-PCR quantitative reverse- transcription polymerase chain reaction PYGM glycogen phosphorylase rev reverse primer RG reference gene RGI RG-Index RIN RNA integrity number RT reverse transcription mRNA messenger ribonucleic acid SARM selective androgen receptor
modulator S.D. standard deviation s.r. significantly regulated SRD5A steroid-5α-reductase TAT tyrosin-amino-transferase TBA trenbolone acetate T/E testosterone/epitestosterone ratio

Abbreviations
V
TE-buffer trishydroxymethyl- aminomethane/ ethylene- diaminetetraacetic acid buffer
TIMP matrix metalloproteinase
inhibitor TG target gene T/LH testosterone/luteinizing hormone ratio Tm melting temperature TM treatment TNF tumor necrosis factor trt treatment TU technical university UBC ubiquitin USA United States of America UV ultra violet VEGF vascular endothelial growth
factor v-myb myeloblastosis viral oncogene WADA world anti doping agency WHO world health organisation YWHAZ tyrosine 3-monooxygenase/
tryptophan 5-monooxygenase activation protein
Z zeranol

Zusammenfassung
VI
ZUSAMMENFASSUNG
Der Begriff anabole Wirkstoffe umfasst alle anabolen androgenen Steroide (AAS) und andere
anabole Wirkstoffe. Diese Substanzen werden wegen ihrer anabolen Wirkung eingenommen,
welche einen Zuwachs an Muskelmasse, eine Reduzierung der Fettmasse, eine positive
Stickstoffbilanz und eine allgemeine Leistungssteigerung bewirken soll.
AAS finden im Leistungssport Anwendung, wobei die Einnahme im Profisport illegal ist und
geahndet wird. Bei Lebensmittel liefernden Tieren ist der Einsatz anaboler Substanzen in
Ländern wie den USA und Kanada legal, in der EU jedoch verboten. Anabole androgene
Substanzen finden auch in der medizinischen Therapie ihren Platz. Hier werden sie
überwiegend für die Behandlung von Osteoporose bei Frauen und Hypogonadismus beim
Mann eingesetzt. Eine Behandlung mit anabolen Stoffen hat meist auch Nebenwirkungen zur
Folge, weshalb neue Substanzen, so genannte SARM (selective androgen receptor
modulators) entwickelt wurden. Diese Substanzen sollen dieselbe anabole Wirkung wie das
Androgen Testosteron aufweisen, jedoch geringere Nebeneffekte zeigen.
Verschiedenste Methoden um anabole Wirkstoffe nachzuweisen wurden entwickelt, meist
basierend auf Massenspektrometrie, welche die direkte Analyse des Wirkstoffes erlaubt. Es ist
allerdings auch bekannt, dass anabole Wirkstoffe bereits die mRNA Expression in der Zelle
beeinflussen können, weshalb die Wirkung dieser Stoffe mittels mRNA-Expressionsanalysen
messbar sein sollte.
Konkrete Zielsetzung dieser Arbeit war es festzustellen, ob AAS mit Hilfe von Gen-
Expressionsanalysen in verschiedenen Geweben und Spezies nachzuweisen sind. Durch die
Identifizierung von Biomarkern, gemessen mittels qRT-PCR sollte die Entwicklung eines
Expressionsmusters, speziell für AAS möglich sein. Ebenso sollten die physiologischen
Auswirkungen der Substanzen im Organismus, hervorgerufen durch die anabolen Stoffe
aufgezeigt werden. Dafür wurden verschiedene Gewebe, welche alle direkt oder indirekt unter
dem Einfluss von anabolen androgenen Stoffen stehen, wie etwa der Uterus, die Leber,
Muskeln und Haarfollikel analysiert und nach möglichen Biomarkern und physiologischen
Signalwegen geforscht. Die Zielgene wurden in funktionelle Gruppen eingeteilt, um später die
Identifizierung metabolischer Veränderung zu erleichtern.
Erste Stoffwechselwege, welche hauptsächlich unter dem Einfluss von anabolen Wirkstoffen
zu stehen scheinen, konnten identifiziert werden. Gene des extrinischen Apoptosesignalweges
zeigten signifikante Regulationen in allen Geweben und Spezies. Weiter konnte immer auch
die Expression der Steroid-Rezeptoren und Enzyme des Energiestoffwechsels unter dem

Zusammenfassung
VII
Einfluss von anabolen Substanzen nachgewiesen werden. Somit war eine Identifizierung
erster gewebespezifischer Biomarker möglich, welche wiederum für die Entwicklung eines
AAS spezifischen Gen-Expressionsmusters verwendet werden können. Gewebe wie der
Uterus, die unter direktem Hormoneinfluss stehen, zeigten sehr hohe Regulationen. Deshalb
werden primäre Sexualorgane, wie etwa die Hoden oder der Uterus, aber auch Blut für
weitere Versuche empfohlen.
Da es sich bei allen Projekten um Erstversuche handelte, werden weitere Studien nötig sein,
um Stoffwechselkaskaden zu identifizieren und weitere Biomarker zu finden, um ein Gen-
Expressionsmuster zu vervollständigen. Somit konnten erste Schritte in Richtung einer neuen
Nachweismethode für anabole androgene Substanzen gemacht werden, welche zukünftig bei
der Aufdeckung von Missbrauchsfällen mit AAS helfen könnte.

Abstract
VIII
ABSTRACT
Anabolic agents are defined as anabolic androgenic substances (AAS) and other anabolic
substances. Anabolic agents increase muscle mass, reduce total body fat and induce a positive
nitrogen balance, which should result in higher performance.
The use of AAS in competitive sports exists but is illegal. In animal husbandry the application
of AAS is legal in the USA and Canada but forbidden in the EU. Also in medical therapies
anabolic agents are applied, for example in order to treat osteoporosis in women or
hypogonadism in men. Here only the positive effects of the agents are desirable, such as
muscle development and an increase in bone density. Unfortunately, the intake of anabolic
hormones also includes negative side effects. Therefore special substances called SARM
(selective androgen receptor modulators) were developed. SARM should have the ability to
mimic the anabolic effects of testosterone with lower negative side effects of the natural
hormone.
Various residue analyses for anabolic substances exist and most of them are based on mass
spectrometry, which directly analyse the drug. It is also known that AAS can influence
mRNA expression. This should make it possible to measure the influence of these substances
via gene expression analysis. Taking these substance specific gene expressions the
development of a new screening method should be possible.
The aim of this thesis was to proof the possibility to detect AAS treatment via mRNA
expression analysis in different tissues and species. With the identification of so-called
biomarkers for anabolic agents using qRT-PCR, a gene expression pattern for AAS should be
established. The identified gene regulations could also be used to show up metabolic
pathways, influenced by the AAS. Therefore various androgen dependent tissues like the
uterus, liver, muscle and hair were analysed, to find such biomarkers as well as signalling
pathways of the steroids. All target genes were separated into functional groups to facilitate
the identification of metabolic influences.
First effects of AAS treatment on metabolic pathways could be analysed. Target genes of the
extrinsic apoptosis pathway were significantly regulated in all tissues and species.
Additionally the expression of the steroid receptors and factors of the energy metabolism
appeared to play an important role in the signalling cascades.
First tissue specific biomarkers could be detected which could be taken to establish a tissue
specific screening pattern for anabolic agents.

Abstract
IX
Tissues, such as the uterus, that are directly influenced by anabolic agents showed very high
gene expression regulations. It is supposed that especially these primary sexual organs, e.g.
testes or uterus but also blood would be very promising for further biomarker analysis.
The studies showed that AAS provoke very specific signalling pathways and therefore also
biomarkers for these substances can be identified. To develop an AAS screening pattern
further experiments are necessary to find more biomarkers and to complete the signal
cascades of the identified metabolic pathways. Anyhow, first steps toward a new screening
method for anabolic agents could be done, that could help to uncover abuses of anabolic
agents in the future.

Introduction
1
1. INTRODUCTION
1.1 Anabolic agents
The term “anabolic agents” includes anabolic androgenic steroids (AAS) and other anabolic
agents. All these substances have anabolic effects, resulting in the following:
• Increase in muscle mass
• Decrease in total body fat
• Enhancement of protein accretion ⇒ positive nitrogen balance
• Increase in calcium intake of the bone ⇒ positive bone density
Anabolic androgenic steroids
Anabolic androgenic steroids include exogenous and endogenous AAS. Exogenous AAS are
not produced by the body naturally and are xenobiotic testosterone analogs, for example
stanozolol and metandienone. Endogenous AAS are androgens that are naturally synthesised
by the organism, such as testosterone, dihydrotestosterone and 19-nortestosterone
(nandrolone). They become prohibited substances when the value found in a sample is
unlikely to be consistent with normal endogenous production [1, 2].
Testosterone
19-Nortestosterone
O
OH
O
OH

Introduction
2
Stanozolol
Figure 1: Testosterone, 19-norstestosterone and the xenobiotic androgen stanozolol.
Testosterone is synthesised from cholesterol and is the most important male sexual hormone.
It is mainly produced in the testes and regulates essential functions such as muscle protein
metabolism, sexual functions and characteristics, plasma lipid levels and bone metabolism. In
females it is also produced in the ovary and the adrenal gland but plays an inferior role. [3].
19-Norstestosterone (nandrolone; 17β-hydroxy-Δ4-estren-3-one) is also an endogenous
hormone and compared to 5α-dihydrotestosterone it has a binding affinity of 75% to the
androgen receptor. It is known as a performance enhancing substance that increases muscle
strength and mass and speeds up recovery. Like testosterone it is hardly orally active and has
to be injected into the muscle in form of its ester, called nandrolone decanoate. [4, 5].
Stanozolol (17β-hydroxy-17α-methyl-5α-androst-2-eno[3,2c]pyrazol) is synthesised starting
with oxymetholone, which was first done in 1959, and it is active orally. It shows comparable
anabolic effects like testosterone [6].
Other anabolic substances
Trenbolone acetate (TBA) is active after hydrolysis to trenbolone-17beta, a 19-norsteroid. It
also acts as an anabolic agent and anti-glucocorticoid and provokes the synthesis of
myofibrillar proteins in muscle. Trenbolone binds to the androgen receptor with a higher
affinity than dihydrotestosterone, to the progestin receptor and even to the glucocorticoid
receptor. It is applied as trenbolone acetate in animal husbandry to induce growth [7, 8, 9].
Zeranol has the same effects as estrogen and is derived from the mycotoxin zearalenone. It
provokes a higher absorption rate on the regular nutrition level in heifers and improves
growth rates in cattle [10, 11].
The xenobiotic gestagen melengestrol acetate (MGA) is orally active and has glucocorticoid
and anabolic effects because it promotes growth and increases the endogenous synthesis of
estradiol in cyclic females. In the USA and Canada it is licensed for the application in heifers
[4].
OH
N HN

Introduction
3
Clenbuterol is a β-agonist. It belongs to the group of β2-sympathomimetics that are used to
relax both the bronchia and the uterus. It is applied in asthma therapy as well as a
tokolyticum. Clenbuterol stimulates amino acid retention and inhibits the activity of
proteolytic enzymes, such as CTSL and CTSB, which results in an increased muscle growth
[12, 13].
Trenbolone
Zeranol
MGA
O
OH
OH
OH O
OH
O
O
OO
O O

Introduction
4
Clenbuterol
Figure 2: Other substances with anabolic effects.
1.1.1 Misuse of anabolic agents in sports
After the big doping scandals during the 2007 Tour de France the doping topic has constantly
been present in the media and the creeds “fair play” or “give drugs no chance” appear to no
longer have any meaning. The abuse of AAS was first reported in the 1950s in samples taken
from Soviet weight lifters that captured the substances to gain weight and power. In 1967 the
International Olympic Committee (IOC) established a list of prohibited substances that was
later adopted by the World Anti Doping Agency (WADA). Today the WADA has composed
several anti-doping rules, and the violation of one or more of them is called doping. In most
cases this means the intake of forbidden medications that increase performance [14, 15, 16].
The WADA publishes an annual list of prohibited substances that includes all forbidden
agents and separates them into functional groups [1]. The following substances and methods
are prohibited at all times (in and out of competition):
Prohibited substances:
S1. Anabolic agents
S2. Hormones and related substances
S3. Beta-2 agonists
S4. Agents with anti-estrogenic activity
S5. Diuretics and other masking agents
Prohibited methods:
M1.Enhancement of oxygen transfer
M2. Chemical and physical manipulation
M3. Gene doping
CI
H2N OHCHCH2
CI
C NH

Introduction
5
Especially xenobiotic steroids are not only used by competitive athletics. Studies in the USA
have shown that more and more pupils take these substances in the hope of obtaining better
social prestige and getting a sport scholarship. In Europe the intake of anabolic steroids has
become popular with people who have a gym membership, especially with man between 21
and 25 years and whose training goals are to increase muscle mass and gain of strength [17,
18].
1.1.2 Application and misuse of anabolic agents in animal husbandry
The application of anabolic agents in animal husbandry is forbidden since 1988 in the
Euoprean Union. In the USA and Canada estradiol-17β, zeranol (estrogens), testosterone,
trenbolone (androgens), progesterone, melengestrol acetate (gestagens), ractopamin (β-
agonist) and the growth hormone somatotropin are still legally used to induce better growth
rate, reduce fat thickness and produce leaner animals with more meat [12,13,19].
The consumption of meat from hormone treated animals may have certain risk for the
cunsumers, especially when parts near the point of implantation are eaten. The consequences
of an overdose of hormones caused by meat consumption include the disturbance of fertility
and the menstruation cycle in women and an increased risk of testicular and prostate cancer in
men [20].
To protect the consumer, authorities such as the European Union has established very
comprehensive control systems. The Joint FAO/WHO Expert Committee on Food Additives
(JECFA) is engaged in collecting and evaluating scientific data on contaminants and residues
of veterinary drugs in food. The JECFA has estimated a so-called ADI (Acceptable Daily
Intake) that defines the daily and lifelong amount of a substance in food or drinking water
without appreciable risk for the consumer. This value is based on pharmacological,
microbiological and toxicological studies [4, 21].

Introduction
6
Anabolic agent ADI [µg/kg BW per day]
Testosterone 2
Trenbolone 0.02
Zeranol 0.5
MGA 0.03
Tabel 1: Acceptable daily intake (ADI) of anabolic agents used in animal husbandry
European Community Reference Laboratories (CRL) and National Reference Laboratories
(NRL) are responsible for residue analysis and the control of adherence to maximum
permissible quantities for the European Union. Analytical methods and techniques for residue
analysis are established and standardized; therefore the acceptance of additional new
techniques as part of enforcement methods is discussed at intervals. New methods can be
accepted as long as they are not expensive, are considered to be commonly available and
sample preparation is not time consuming [22, 23].
1.1.3 Clinical application of anabolic agents
Anabolic agents are not only used as drugs of abuse to increase performance and strength, but
testosterone is also one of the commonly used drugs in androgen replacement therapy.
Synthetic androgens are prescribed to treat a variety of male and female disorders, for
example hypogonadism, anemias and primary osteoporosis, all resulting from deviant
androgen levels [24, 25]. Especially older people and women in the menopause suffer from
decreasing hormone levels, which result in sarcopenia and frailty. Already 30% of those over
60 years of age are affected. Sarcopenia, the loss of skeletal muscle mass and strength, results
in both men and women in a high incidence of accidental falls and can compromise the
quality of life. Chronic, age-related afflictions, e.g. osteoporosis are linked to sarcopenia. A
decrease in the production of hormones such as testosterone, estradiol and growth hormone
and a general decline in muscle protein turnover as well as neuromuscular alterations, are the
major reasons for the appearance of frailty. This results in weakness, impaired mobility and
poor endurance - factors that reduce independence and the quality of life [26, 27, 28, 29].
Particularly for women, the therapeutic uses of androgens do not only have beneficial effects,
as numerous side effects also exist, e.g. acne, hirsutism, frontal hair thinning and menstrual

Introduction
7
disruption [30, 31, 32, 33, 34]. A promising alternative to androgen replacement therapies,
for example in case of osteoporosis and frailty, could be the discovery of selective androgen
receptor modulators (SARM). SARM are expected to have the ability to mimic the central and
peripheral androgenic and anabolic affects of testosterone with lower negative side effects
than the natural hormone [35]. Further positive properties of SARM, such as the oral activity,
an increase in muscle mass and strength and an increase in fat-free mass, are important factors
for its use as a medication [36, 37, 38]. Specific genes could be analysed via mRNA
expression in order to identify the influence and effects of SARM in the body and so that the
identification of metabolic pathways is possible.
1.2 The idea of biomarkers
The techniques for the identification and characterisation of steroids and their metabolites
have changed since the first tests were performed on athletes´ urine in 1976. Until now
several methods of detection have been developed, ranging from radio immunoassays to gas
chromatography (GC) and mass spectrometry. Today the major metabolites of nearly all AAS
are known and several analysis methods exist especially for their detection in urine, blood or
hair samples. Various urine tests for detecting testosterone have been developed, for example
the calculation of the ratio of testosterone to epitestosterone (T/E), the ketoconazole test and
the testosterone glucoronid to luteinising hormone (T/LH) ratio [39, 3, 6].
An important aspect in xenobiotic steroid testing is the question of the origin of the detected
substances. Even small amounts of AAS can be detected already in urine samples from people
who have ingested meat from clenbuterol or 19-norstestosterone treated animals. But how can
a person determine if the steroids analysed have endogenous or exogenous sources? The
question remains where to set a limit between illegally taken AAS and the physiological,
endogenous production of the hormones [3].
This is where the term “biomarker” becomes important. Several definitions for biomarkers
exist, for example the definition from the Food and Drug Administration (FDA): “a biomarker
is a characteristic that is objectively measured and evaluated as an indicator of normal
biologic or pathogenic processes or pharmacological responses to a therapeutic intervention”
[40]. Many more definition can be found but all of them try to explain that biomarkers can be
used to identify physiological changes in the organism induced by exogenous administered

Introduction
8
substances. The identification of such biomarkers in affected tissues could then be used to
detect the intake of specific substances, such as anabolic agents.
In theory this would be a new, accurate and easy way to perform drug residue analysis in
various species and samples. But at the mRNA expression level a lot of factors exist that
could influence these biomarker regulations and that should be kept in mind when developing
such a new screening method. The body, human or animal, is exposed to many different
environmental factors and especially the analysis of different gene expression regulations can
be significantly influenced by factors, such as the condition of the immune system, nutrition
or environmental conditions.
Target genes
Steroid hormones can influence the mRNA expression of specific genes by binding to their
hormone receptor in the cell. The resulting hormone-receptor complex then can bind to the
hormone-responsive-element (HRE), a short nucleotide sequence of DNA that is also called a
palindrome or enhancer of transcription. The binding of the hormone-receptor-complex to the
HRE activates the transcription of specific genes. The synthesised mRNA is released from the
nucleus and is translated into proteins in the cytoplasm [41].

Introduction
9
Figure 3: Mechanism of hormone-receptor interaction in the cell. The connection of hormone and hormone-receptor is catalyzed by a heat shock protein (Hsp90). After this the hormone–receptor complex can bind to the hormone responsive element (HRE) which is located on the DNA strand. The synthesised mRNA is released from the nucleus and translated into proteins that code for biomarkers.
Most anabolic agents are hormones that can affect the mRNA expression of specific genes in
the cell. These so-called target gene (TG) expressions are on one side tissue dependent, for
example in uterus the muscle proteins of smooth muscles. On the other side they can be used
as universal factors that are expressed in more than one tissue. After finding target genes that
are specifically influenced by anabolic agents the identification of substance specific
biomarkers should be possible. Taking these biomarkers, a residue analysis pattern could be
developed. Additionally metabolic pathways, influenced by the treatment could be identified
and affirm physiological functions.
To measure these specific target gene expressions a method called polymerase chain reaction
(PCR) was used. Combining reverse transcriptase (RT) reaction with PCR, it is possible to
identify a specific RNA product, what was first done in the early 90s. With the beginning of
competitive PCR also the quantification of transcripts from unknown samples could then be
hormone
Hormone-receptor
Hsp 90
Hsp 90
nucleus
HRE
mRNA–Gene expression
protein
Biomarkers (receptors, enzymes..)

Introduction
10
realized. Nowadays PCR has become the most accurate and sensitive method for the detection
and quantification of nucleic acids [42]. Therefore this method meets all conditions for
biomarker analysis in different tissues.

Introduction
11
1.3 Aims Residue analysis of anabolic agents is an interesting and important issue in food safety and
competitive sports. Especially in these areas stringent control systems are necessary because
the effects of AAS are often abused.
The objective of the thesis was to proof the possibility to detect AAS treatment via gene
expression analysis. Therefore substance specific target genes were selected and analysed in
different tissues and species, treated with anabolic agents. Gene expression regulations were
measured via qRT-PCR to show up effects on metabolic pathways and to identify possible
biomarkers for AAS.
The identified biomarkers could be taken to develop a substance specific gene expression
pattern, used for drug residue analysis. Additionally the identified signal cascades could help
to understand the influences of newly developed drugs in the organism.

Introduction
12
Figure 4: Overview of species and tissues investigated in this thesis with regard of biomarkers and metabolic pathways. Liver, skeletal muscles, uterus, hair follicle dermal papilla cells (HFDPC) and hair follicle (HF) were analysed.
Anabolic Androgenic Agents
HF Uterus Muscle HFDPC
Muscle
Liver
Biomarkers
Physiological functions

Material and Methods
13
2. MATERIAL AND METHODS 2.1 Studies on bovine tissues
Holstein-Friesian heifers were treated either orally with MGA (0.5mg daily=1fold; Pfizer
Animal Health, New York, USA) or with the implant preparations of Finaplix-H® (200mg
TBA=1fold; Hoechst Roussel Vet, Sommerville, USA) or Ralgro® (36mg zeranol=1fold;
Mallinckrodt Veterinary Inc., Mundelein, USA). According to the manufacturers’ instruction,
the implants were administered to the middle third of the pinna of the right ear. In every
treatment group always 2 heifers were given 1-fold, 3-fold and 10-fold doses of preparation,
the control group without any treatment consisted of 2 animals per group. The heifers were
aged between 12 to 16 month with a mean weight of 320±57 kg. After 56 days treatment all
heifers were slaughtered, tissue samples (liver, m. splenius, m. quadriceps and uterus) were
taken and stored at –80°C until total RNA extraction.
2.2 Studies on primate tissues This study was done in cooperation with TAP Pharmaceutical Products Inc. (Lake Forest,
USA), to identify the influence of a new developed drug, a SARM, on the gene expression in
muscle tissues (m. quadriceps, m. triceps).
The in-life portions of the study and tissue collection were done by Covance Laboratories
GmbH (Münster, Germany). 24 male cynomologous monkeys (macaca fascicularis) were
separated in four groups, a testosterone group, a SARM1 and SARM10 group and a control
group, each consisting of 6 animals. The testosterone group was treated i.m. with 3.0 mg/kg
Testostoviron®-depot-250 (testosteronenanthat; Schering, Berlin, Germany) every two
weeks; the SARM1 and SARM10 group with 1 mg/kg or 10 mg/kg SARM LGD2941 orally
each day, and the control group stayed untreated. All animals were 5-6 years old, skeletally
mature and had an average body weight of 6 kg at the start of dosing.
Muscle biopsies of musculus quadriceps (musculus rectus femoris) and musculus triceps were
taken at three treatment time points. Predose samples were taken after study start without
prior treatment. Further samples were taken at day 16 and day 90 of treatment.
Predose muscle samples (50 mg each) were snap frozen directly in liquid nitrogen, wrapped in
aluminium foil and stored at –80°C until RNA extraction. Subsequently muscle samples of

Material and Methods
14
100 mg each were collected on day 16 (by biopsy) and 90 (at the end of the in-life phase),
placed in kryotubes before freezing in liquid nitrogen and stored at –80°C until RNA
extraction.
2.3 Studies on human tissues The studies were supported by the Bundesinstitut für Sportwissenschaften (Bonn, Germany)
and done in cooperation with the Lehrstuhl für Sport und Gesundheitsförderung, TU Munich
and the institute of forensic medicine, TU Munich.
Only very limited numbers of hair follicle samples from treated persons could be taken,
therefore a first feasibility study was done in cell culture with human dermal papilla cells, to
identify first target genes.
In a second feasibility study a method to take hair follicle samples and extracte total RNA out
of them, was tested. Additionally histological stains were prepared from the hair samples to
demonstrate if hair follicle cells could be taken by plucking. Also first target genes were
measured in hair follicle samples.
2.3.1 Cell culture experiments
Two HFDPC (hair follicle dermal papilla cell) cultures, one from a female and one from a
male donor were treated with various concentrations of the anabolic steroids testosterone (4-
androsten-17β-ol-3-one), stanozolol (17β-hydroxy-17α-methyl-androstano[3,2-c]pyrazole),
nortestosterone (17β-hydroxy-Δ4-estren-3-one) and the β-agonist clenbuterol (clenbuterol
hydrochlorid). Samples were taken as indicated below.
Cell culture from female donor
Human HFDPC were ordered from Cell Applications (San Diego, USA). Cells had been
cultivated from skin samples of the temple taken during plastic surgery at a 49 year-old,
female patient. After establishing a primary cell culture the cells were frozen in serum-free
freezing medium and sent cryopreserved (500,000). A ready-to-use HFDPC Medium and
Supplement Kit (Cell Applications, San Diego, USA), containing Basal Medium, FCS (fetal
calf serum), growth factors and antibiotics were additionally ordered to cultivate the cells. For

Material and Methods
15
sub-cultivation served a kit containing HBSS (HEPES buffered saline solution),
trypsin/EDTA solution and neutralizing solution (Cell Applications, San Diego, USA).
The thawed cells were cultivated in collagen coated T-75 flasks (Cell Applications, San
Diego, USA) containing 15ml HFDPC medium at 37°C in a humidified atmosphere of 5%
CO2 and sub-cultivated at 85% confluence. Cells were frozen and stored at -80°C after each
splitting that was up to the sixth passage. For the experiment cells from third and fourth
passage were thawed, given into 12-well plates (ca. 3.4x10⁴/well) and cultivated till 85%
confluence. Cells were cultured in triplicates with 0nM (control-treatment), 1nM, 10nM and
100nM treatment groups on each plate. Sampling took place at 0h, 6h, 24h and 48h.
To remove natural containing steroids for all experiments the FCS was stripped by using
charcoal, as described by Darbre et al. [43].
Cell culture from male donor
Human HFDPC cells were ordered from Promo Cell (Heidelberg, Germany). Cells had been
cultivated from skin samples of the temple taken during plastic surgery at a 40 year-old, male
patient. After establishing a primary cell culture the cells were frozen in serum-free freezing
medium and sent cryopreserved (500,000 cells). A ready-to-use HFDPC Medium and
Supplement Kit (Promo Cell, Heidelberg, Germany), containing Basal Medium, FCS (fetal
calf serum), basic FGF and Insulin was additionally ordered to cultivate the cells. Sub-
cultivation was done with a kit containing HBSS (HEPES buffered saline solution),
trypsin/EDTA solution and neutralizing solution (Promo Cell, Heidelberg, Germany). The
experiment was done in the same way as it is described in the cell culture of the female donor
but only with 10nM and 100nM treatment concentrations. Sampling took place 0h, 6h, 24h
and 72h after treatment.

Material and Methods
16
Figure 5: Cultivated hair follicle dermal papilla cells.
2.3.2 Hair follicle experiments
Frontal scalp hair follicle samples were taken from the androgen dependent upper part of the
head. In a first study twenty hair follicle samples were taken from women and twenty samples
were taken from men to find possible gender specific differences. In a second study three
samples from weight lifters taking a mix of anabolic agents (testosterone, TBA) could be
taken and three hair samples from untreated man served as control. 5-6 hairs from the upper
part of the head were taken by plucking, long hairs were shortened to 1cm and given in 1.5 ml
tubes containing lysis buffer (MasterPure RNA Purification Kit, Epicentre Biotechnologies,
Madison, USA.). In the first study the tubes were frozen in liquid nitrogen and stored at -
80°C, in the second study the RNA extraction was done directly after the plucking.
2.4 RNA extraction, RNA quality
For the RNA extraction different sample amounts had to be taken for the various tissues. For
the extraction of the bovine tissues, 200mg of the frozen tissue was taken. In the studies on
primate tissues, 50 mg of predose and 100 mg of day 16 and day 90 muscle biopsy samples
were used. For the extraction of the HFDPC, 600 µl of TriFast® (peqLab Biotechnologie
GmbH, Erlangen, Germany) was directly given in the wells of the cell culture plates. All hair
follicle samples that could be gained by plucking were taken for the further extraction.

Material and Methods
17
TriFast® and a standardized protocol from the company were used for the RNA isolation of
uterus, muscle and cell culture samples. The principal of this protocol was phenol/chloroform
extraction of total RNA. Isolated RNA was diluted in 30µl (liver, uterus and muscle tissue)
RNAse free water and stored at -80°C. Because low tissue yield was expected from hair
follicle samples a special kit, the MasterPureTM RNA Purification Kit (Epicentre
Biotechnologies, Madison, USA.) was used. RNA was extracted following the instruction of
the kit what contained proteinase K (50µg/µl) and DNase for RNA purification. RNA was
diluted in 10µl TE-Buffer and stored at -80°C.
To quantify the amount of total RNA extracted, optical density (OD) was measured with the
photometer (Eppendorf, Hamburg, Germany) or the NanoDrop ND-1000 (peqLab
Biotechnologie GmbH, Erlangen, Germany) for each sample. RNA purity was screened
taking the OD260/280 ratio.
RNA integrity and quality control was performed with the Bioanalyzer 2100 (Agilent
Technology, Palo Alto, USA). For sample analysis eukaryotic total RNA Nano Assay
(Agilent Technology, Palo Alto, USA) was taken and the RNA Integrity Number (RIN)
served as RNA quality parameter. Agilent Bioanalyzer 2100 calculated the RIN value based
on a numbering system from 1 to 10 (1 being the most degraded profile, 10 being the most
intact) for all samples [44, 45].
2.5 Selection of target genes
All target genes were selected if supposed to play an important role in the anabolic pathways
of the analysed tissues. Following target genes were chosen by screening the respective
literature:

Material and Methods
18
Study in bovine tissues
Liver, muscle and uterus
Angiogenesis vascular enothelial growth factors (VEGF120, 164, 188)
VEGF receptor (FLK-1)
Fibroblast growth factors (FGF2, 7)
Angiopoetin (Angpt1, Angpt2)
Matrix metalloproteinases (MMP1, MMP2, MMP14)
MMP inhibitors (TIMP1, TIMP2)
Apoptosis Death receptor ligand (FasL)
Death receptor (FasR)
Caspase 3
Bcl-xl protein (Bcl-xl)
Cell cycle Cyclin dependent kinase (CDK2)
Cyclin A, D1
Myostatin (GDF8)
Endocrine factors Androgen receptor (AR)
Estrogen receptors (ERα, ERβ)
Growth hormone receptor (GHR)
Prolactin receptor (PRLR)
Insulin receptors (IRα, IRβ)
Glucocorticoid receptor (GR)
Insulin-like growth factor (IGF1)
Insulin-like growth factor receptor (IGF1R)
Insulin-like growth factor binding protein (IGFBP3)
Energy metabolism Hexokinase (HK),
Lactate-dehydrogenase (LDH)
Creatinkinase (CK)
Aconitase
Acyl-CoA-dehydrogenase (ACADvl)
Enoyl-CoA-hydratase (EnoylCoA)
Inflammatory factors Cycle-oxogenase (Cox2)
Interleucin 1 (IL1β)
Tumor necrosis factor (TNFα)
Muscle function α-Actin (ACTA1)
Myosin heavy chain (MYHC2x)
Myogenic differentiation factor (MyoD)
Oncogenes Tumor suppressor p53 (p53)
Myeloblastosis viral oncogene (v-myb)
Protein metabolism Cathepsin B, L (CTSB, CTSL)
Calpain 3 (CAPN3)
Calpastatin (CAST)
Tyrosin-amino-transferase (TAT)

Material and Methods
19
Transcription factors c-fos protein (c-fos)
c-jun protein (c-jun)
Reference genes Glyceraldehyde-3-phosphate dehydrogenase (GAPDH)
β-Actin (ACTB)
Ubiquitin C (UBC)
Others Cytochrom P1 (CyP1A1)
Calreticulin (CALR)
Table 2: List of target genes analysed in bovine tissues [9, 46, 47, 48, 49, 50, 51, 52, 53, 54, 55,
56, 57, 58, 59, 60, 61]

Material and Methods
20
Study in primate tissues
Muscle
Muscle fibre proteins Myosin heavy chain (MYHC2x)
α-Actin (ACTA1)
Transcription factors Myogenin
Myogenic differentiation factor (MyoD)
Protein metabolism Cathepsin B, L (CTSB, CTSL)
Calpain 3 (CAPN3)
Tyrosin-amino-transferase (TAT)
Cell cycle Cyclin-dependent kinase 2 (CDK2),
Cyclin A, D1
Myostatin (GDF8)
Endo- paracrine factors Androgen receptor (AR),
Estrogen receptors (ERα, ERβ),
Growth hormone receptor (GHR),
Glucocorticoid receptor (GR),
Insulin like growth factor receptor (IGF1R),
Insulin receptor (IR),
Insulin like growth factor binding proteins (IGFBP3, IGFBP4)
Energy metabolism Hexokinase (HK),
Lactate-dehydrogenase (LDH)
Creatin kinase (CK)
Glucose transporter 4 (GLUT4)
Glycogen phosphorylase (PYGM)
Satellite cell biology Myogenic factors 5, 6 (Myf5, Myf6)
Myogenin (MyoG)
M-cadherin (CDH15)
Reference genes β-Actin (ACTB)
Cyclophilin A (PPIA),
Tyrosin3/tryptophan5-monooxygenase activation protein (YWHAZ)
Ubiquitin C (UBC)
18S rRNA
Table 3: List of target genes analysed in primate m. quadriceps and m. triceps [62, 63, 64, 65, 66,
67, 68, 69 , 70, 71].
Material and Methods
21
Study in human tissues
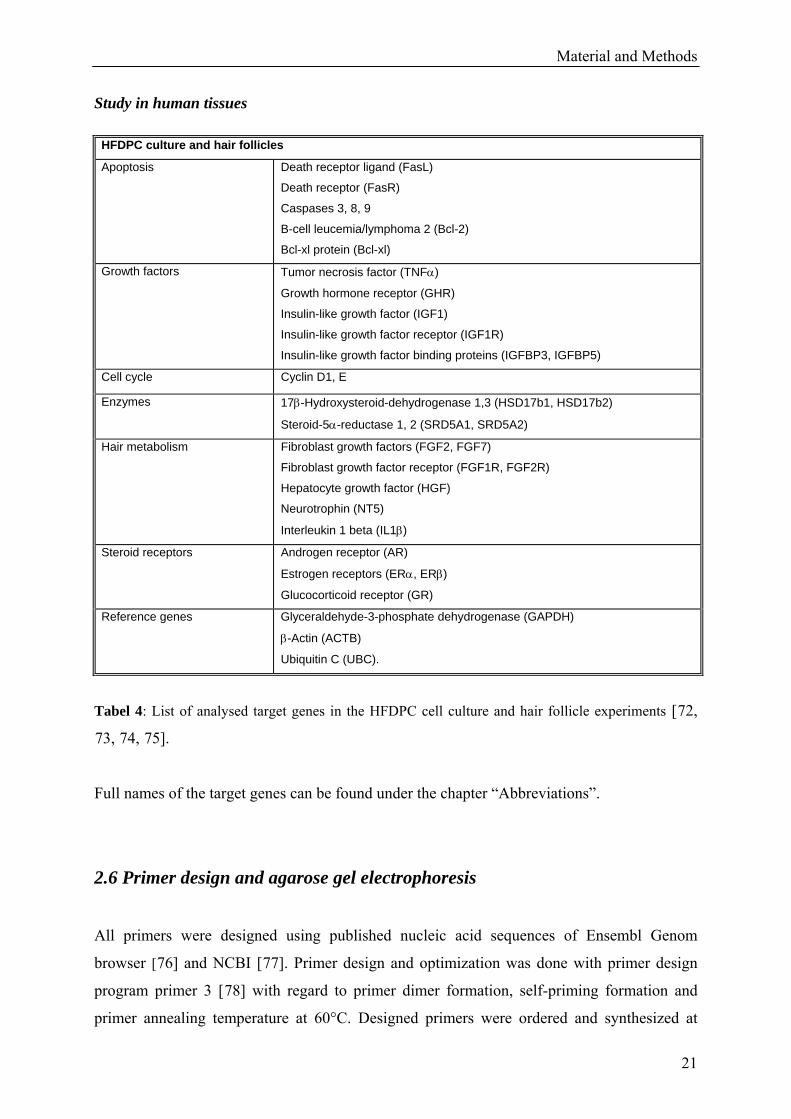
Tabel 4: List of analysed target genes in the HFDPC cell culture and hair follicle experiments [72,
73, 74, 75].
Full names of the target genes can be found under the chapter “Abbreviations”.
2.6 Primer design and agarose gel electrophoresis
All primers were designed using published nucleic acid sequences of Ensembl Genom
browser [76] and NCBI [77]. Primer design and optimization was done with primer design
program primer 3 [78] with regard to primer dimer formation, self-priming formation and
primer annealing temperature at 60°C. Designed primers were ordered and synthesized at
HFDPC culture and hair follicles
Apoptosis Death receptor ligand (FasL)
Death receptor (FasR)
Caspases 3, 8, 9
B-cell leucemia/lymphoma 2 (Bcl-2)
Bcl-xl protein (Bcl-xl)
Growth factors Tumor necrosis factor (TNFα)
Growth hormone receptor (GHR)
Insulin-like growth factor (IGF1)
Insulin-like growth factor receptor (IGF1R)
Insulin-like growth factor binding proteins (IGFBP3, IGFBP5)
Cell cycle Cyclin D1, E
Enzymes 17β-Hydroxysteroid-dehydrogenase 1,3 (HSD17b1, HSD17b2)
Steroid-5α-reductase 1, 2 (SRD5A1, SRD5A2)
Hair metabolism Fibroblast growth factors (FGF2, FGF7)
Fibroblast growth factor receptor (FGF1R, FGF2R)
Hepatocyte growth factor (HGF)
Neurotrophin (NT5)
Interleukin 1 beta (IL1β)
Steroid receptors Androgen receptor (AR)
Estrogen receptors (ERα, ERβ)
Glucocorticoid receptor (GR)
Reference genes Glyceraldehyde-3-phosphate dehydrogenase (GAPDH)
β-Actin (ACTB)
Ubiquitin C (UBC).

Material and Methods
22
MWG Biotech (Ebersberg, Germany). Primer testing was performed with three samples and a
negative control (RNAse free water) for each primer set. With the PCR products an agarose
gel electrophoresis was done to check the primer length and absence of primer dimers.
High resolution agarose gel and electrophoresis was conducted at 90 V for 30 minutes.
Agarose gel was then photographed under UV-excitation to enable analysis of fragment size,
band intensity and integrity.
2.7 Real-time qRT-PCR
Quantitative real-time RT-PCR was performed using SuperScript III Platinum SYBR Green
One-Step qPCR Kit (Invitrogen, Carlsbad, USA) by a standard protocol, recommended by the
manufacture. With the kit the master mix was prepared as follows: For one sample was
calculated 5µl 2x SYBR Green Reaction Mix, 0.5µl forward primer (10 pmol/µl), 0.5µl
reverse primer (10 pmol/µl) and 0.2µl SYBR Green One-Step Enzyme Mix. 6.2µl of the
master mix was filled in the special 100 µl tubes and 1 ng/µl total RNA in 3.8 µl volume was
added. The following uniform RT-PCR protocol was used for all genes:
One Step qRT-PCR Protocol, Invitrogen
Step Temperature Time
I(hold, RT) 55°C 10 min
II(denaturation) 95°C 5 min
III(cycling) 40 cycles
1.(denaturation) 95°C 15 sec
2.(annealing) 60°C 30 sec
3.(elongation) 68°C 20 sec
IV(hold2) 40°C 1 min
V Melting Curve Analysis 60°C-95°C; 0.5sec
Tabel 5: One-step qRT-PCR protocol for used real-time PCR instruments.
All experiments were done with the Rotor-Gene instruments from Corbett (Corbett Life
Science, Sydney, Australia). Studies on bovine tissues were done with the Rotor-Gene 3000,
studies on primate and human tissues with the Rotor-Gene 6000.
Crossing Points (Ct) and melting curves were acquired by using the “Quantitation” (cell
culture experiment, hair follicle experiment), “Comparative quantification” (muscle

Material and Methods
23
experiment, uterus experiment) and “Melting curve” program of the Rotor-Gene 3000 and
6000 analysis software. All samples were baseline corrected and threshold was set manually
in the cell culture and hair follicle experiment, using same threshold levels for one gene in all
samples of an experiment.
Only genes with clear and single melting peaks were taken for further data analysis, samples
with irregular melting peaks were excluded.
2.8 Data Analysis and Statistics
Data were processed applying relative quantification method comparable to the ΔΔCt-method
(2ΔΔCt), also abbreviated as ddCt [79, 80, 81]. Expression changes are shown as relative up- or
down-regulation compared to the three internal reference genes. For normalization of target
gene expression the arithmetic mean (AM) of the non-regulated reference genes were taken
and the reference gene index (RGI) was calculated.
Reference genes Human tissues
Primate tissues Bovine tissues
Cell culture experiments
Hair follicle experiments
Muscles Liver Muscles Uterus
1 2 1 2
ACTB ACTB s.r. ACTB ACTB ACTB s.r. s.r.
UBC UBC UBC UBC PPIA UBC UBC UBC
s.r. GAPDH GPDH s.r. YWHAZ GAPDH ACTB GAPDH
Tabel 6: List of reference genes, taken for relative quantification in the different studies. s.r. = significantly regulated.
In the first step of the ΔΔCt-method the crossing point of the AM of the target genes was
subtracted from the crossing point of the reference gene index. From the so calculated ΔCt the
mean value of the repeat determination was taken to get the ΔCt of the treatment. From this
ΔCt (treatment) the mean value of ΔCt (control) of the non treated control was subtracted. The result
was the ΔΔCt value. In this calculation model the optimal PCR efficiency, representing a
DNA doubling after each cycle (efficiency = 2), is assumed. Therefore the expression ratio of
a target gene compared to the control treatment of the analysis expected as 2-ΔΔCt.

Material and Methods
24
ΔCt = Ct (TG) – Ct (RGI)
ΔCt (treatment) = mean ΔCt value of repeat determination of treated animals
ΔCt (control) = mean ΔCt value of control animals or control treatment
ΔΔCt = ΔCt (treatment) – ΔCt (control)
Ratio = 2-ΔΔCt
In the studies on bovine and primate tissues the expression ratio 2-ΔΔCt was calculated for all
significantly regulated target genes. If the expression ratio was < 1 the expression of the gene
was down-regulated, if the expression ratio was > 1 the gene was up-regulated. In the bovine
studies the regression of ΔΔCt over treatment time was calculated in a linear regression model
to show the gene regulation over time. Additionally, in the studies on primate tissues
statistical descriptions of the expression data as well as statistical tests were produced with
SAS v. 9.1.3 for Windows. With box-whisker plots the visual screening of regulated genes
was possible.
In the cell culture and hair follicle experiments ΔΔCt was calculated, regulations over
treatment time were evaluated using a 2-Way-Anova with SigmaStat 3.0 Software (SPSS,
Munich, Germany).
All ΔΔCt calculations were done in Excel (Microsoft, USA) by using the t-test. All data were
illustrated by means±standard deviation (S.D.), significance minimum was p<0.05.

Results and Discussion
25
3. RESULTS AND DISCUSSION All feasibility studies were done using similar methods and instruments, to make results
comparable.
3.1 Studies on bovine tissues
RNA concentration and RNA integrity
Total RNA concentration from liver samples was in mean±S.D. 2084.9±765.1 ng/µl, in the
muscles 1244.3±908.1 ng/µl and in the uterus 3320.1±212.9 ng/µl. In the liver, muscles and
uterus the mean RIN were 7.7, 7.6, and 7.3. All tissue samples were taken in 1998, so they
kept frozen at -80°C for seven years until extraction. Anyhow, the RIN showed quite good
results and so samples could be taken for further qRT-PCR analysis.
Primer design
Primer pairs of 57 genes were used for qRT-PCR analysis to get single peaks and uniform
melting curves, as well as a specific single band in agarose gel electrophoresis. All primer
pairs listed below showed satisfactory results in PCR analysis and could be used for further
calculations.
GROUP INDEX SEQUENCE 5´→ 3´ BP AT (°C)
ACC.NR.
Angpt 1 for TTC CTC GCT GCT ATT CTG ACT 194 58 * Angpt 1 rev TGA CAG CAC TCT CAT GCT GTC Angpt2 for AAT TCA GT CTC CAA AAG CAG C 234 58 * Angpt2 rev TCC ACC CGT TTC CAT GTC FGF2 for AGC CTT GCA ACT CTG CTT GT 210 60 * FGF2 rev CGA ATT CAG ATC CCT CCT GA FGF7 for CTG CCA AGT TTG CTC TAC AG 294 60 * FGF7 rev TCC AAC TGC CAG GGT CCT GAT FLK-1 for GCT TCT ACC AGG ACA CTG ACA T 144 62 * FLK-1 rev AAC ACG GAA TCA CCA CCA CAG TT MMP1 for GAG GAG ACG CTC ATT TTG ATG 235 60 NM174112 MMP1 for ACT GGC TGA GTG GGA TTT TG MMP2 for CCC AGA CAG TGG ATG ATG C 237 60 NM174745 MMP2 rev TTG TCC TTC TCC CAG GGT C MMP14 for ACT TGG AAG GGG GAC ACC 232 60 * MMP14 for AGG GGG CAT CTT AGT GGC TIMP1 for CAT CTA CAC CCC TGC CAT G 231 60 NM174471
angiogenesis
TIMP1 rev CAG GGG ATG GAT GAG CAG

Results and Discussion
26
TIMP2 for GGG TCT CGC TGG ACA TTG 255 59 NM174472 TIMP2 rev TTG ATG TTC TTC TCC GTG ACC VEGF all for CCG TCC CAT TGA GAC CCT G * VEGF120 rev CGG CTT GTC ACA ATT TTT CTT GTC 280 59 * VEGF164 rev GCC CAC AGG GAT TTT CTT GC 278 59 * VEGF188 rev TGC CCC TTT CCC TTT CCT C 296 60 * VEGF for GGT GGA CAT CTT CCA GGA GTA 177 60 NM174216 VEGF rev CTA TGT GCT GGC TTT GGT GAG bcl-xl for GGC ATT CAG CGA CCT GAC 203 60 AF245487 bcl-xl rev CCA TCC AAG TTG CGA TCC Caspase 3 for GCA ACG TTT CTA AAG AAG ACC ATA G 64 60 NM174260 Caspase 3 rev CCA TGG CTT AGA AGC ACA CAA ATA A Fas-L for CAT CTT TGG AGA AGC AAA TAG 205 60 AB035802
apoptosis
Fas-L rev GGA ATA CAC AAA ATA CAG CCC CDK2 for CTC ATC GAG TCC TGC ACC G 183 60 BT020790 CDK2 rev GTA GTA TTT GCA GCC CAG AAG G Cyclin A for GCT ATC CTC GTG GAC TGG TTA 159 60 X68321 Cyclin A rev AAG CAT AGC AGC AGT GCC CA Cyclin D1 for GAA GAT GAA GGA GAC CAT CCC 190 60 * Cyclin D1 rev TTG TTC TCC TCT GCC ACT GG Myostatin for GCC TGT CAA GAC TCC TGC GA 173 60 AY160688
cell cycle
Myostatin rev TGT TTG AGC CAG TTC TGC AAC AC AR for CCT GGT TTT CAA TGA GTA ACC GCA
TG 172 60 AY862875
AR rev TTG ATT TTT CAG CCC ATC CAC TGG A ERα for AGG GAA GCT CCT ATT TGC TCC 234 60 AF177936 ERα rev CGG TGG ATG TGG TCC TTC TCT ERβ for GAG ATA TTC TTT GTG TTG GAG TTT 242 60 * ERβ rev CTT CGT GGA GCT CAG CCT GT GHR for CCA GTT TCC ATG GTT CTT AAT TAT 136 60 NM176608 GHR rev TTC CTT TAA TCT TTG GAA CTG G GR for TTC GAA GAA AAA ACT GCC CAG C 190 60 AY238475 GR rev CAG TGT TGG GGT GAG TTG TG IGF1 for CCA AAG GCC AGA CCT ACT TG 180 60 X15726 IGF1 rev TCC TCA GAT CAC AGC TCC GA IGF1R for TTA AAA TGG CCA GAA CCT GAG 314 60 X54980 IGF1R rev ATT ATA ACC AAG CCT CCC AC IGFBP3 for ACA GAC ACC CAG AAC TTC TCC T 202 60 NM174556 IGFBP3 rev AGA AAC CCC GCT TCC TGC C IRα for TCC TCA AGG AGC TGG AGG AGT 89 60 AJ320235 IRα rev TTT CCT CGA AGG CCT GGG GAT IRβ for TCC TCA AGG AGC TGG AGG AGT 111 60 AJ320235 IRβ rev TAG CGT CCT CGG CAA CAG G PRLR for AAG GAA GGA GAA ACA CTC ATC CA 203 60 L02549
endocrine factors
PRLR rev AGG TTT GCA GGA GGC TCT G ACADvl for ACT TTG ACG GAG TAC GGG TG 198 60 U30817 ACADvl rev CAA AGT TGT GAA TTT TCT CCC C Aconitase for CAT CCG AGT TGG TCT GAT TG 188 60 NM173977 Aconitase rev ACA TCC CTC AGG ATC TGT G CK for ATG ACA GAG CAG GAG CAG CA 183 60 BT021173 CK rev ATG GAG ATG ACT CGG AGG TG
energy metabolism
EnoylCoA for GCT GCT GTC AAT GGC TAT GC 202 60 BT021569

Results and Discussion
27
EnoylCoA rev ACC AGT GAG GAC CAT CTC CA HK for CAA GAC GCA CCC ACA GTA TCC 211 60 NM001012668 HK rev TCA CCT CCA GCA GCA TTT CCT T LDH for GTG GCT TGG AAG ATA AGT GG 155 60 NM174099 LDH rev ACT AGA GTC ACC ATG CTC C Cox2 for CCT GAT GAC TGC CCA ACA C 162 60 AF004944 Cox2 rev AAA TTG ATG GGT GAA GTG CTG G IL1β for TTC TCT CCA GCC AAC CTT CAT T 198 60 M37211 IL1β rev ATC TGC AGC TGG ATG TTT CCA T TNFα for TAA CAA GCC GGT AGC CCA CG 256 60 AF011926
inflammatory factors
TNFα rev GCA AGG GCT CTT GAT GGC AGA ACTA1 for TAT TGT GCT CGA CTC CGG CGA 160 60 NM174225 ACTA1 rev GTC ACG AAG GAG TAG CCA CG MYHC2x for GAT CAA TGC TGA GCT GAC GG 173 60 AB059399
muscle function
MYHC2x rev CAA TGG TTT CAT CCA GAC CTG C p53 for GAC TTC TCT CGG CGC CTA CC 191 60 X81704 p53 rev TGG TGC ACT CAG AGT CGA TC v-myb for TCA CGT CCC ATA TCC TGT AGC 170 60 NM175050
oncogenes
v-myb rev CCT GTC CTT TGA GTT CGT TCT CA CAPN3 for GAC TGG AGC TAT GTG GAC AAG 179 60 NM174260 CAPN3 rev GTC CAA GTC TGA AGC TTG TCG CAST for GAT CAG AAG TGC TGC TCC A 206 60 NM174003 CAST rev GGA CTG TTT CCT CAT CTT ACC CTSB for GAT CTG CAT CCA CAG CAA 192 60 NM174031 CTSB for ATG GAG TAC GGT CTG CAA CC CTSL for CAC TGG TGC TCT TGA AGG ACA 183 60 NM174032 CTSL rev TAA GAT TCC TCT GAG TCC AGG C TAT for ACC CTT GTG GGT CAG TGT TC 167 60 BT021798
protein metabolism
TAT rev ACA GGA TGG GGA CTT TGC TG c-fos for GCT CCA GGC GGA GAC AGA 302 60 AY069515 c-fos rev AGG GTG AAG GCC TCC TCA GA c-jun for TCA ACG CCT CGT TCC TCC 278 60 AF069514
transcription factors
c-jun rev CTC ATC TGT CAC GTT CTT GGG GCA ACTB for AAC TCC ATC ATG AAG TGT GAC 202 60 AY141970 ACTB rev GAT CCA CAT CTG CTG GAA GG GAPDH for GTC TTC ACT ACC ATG GAG AAG G 197 60 U85042 GAPDH rev TCA TGG ATG ACC TTG GCC CAG UBC for AGA TCC AGG ATA AGG GAA GGC AT 198 60 Z18245
reference genes
UBC rev GCT CCA CCT CCA GGG TGA T CyP1A1 for CCG ACC TCT ACA GCT TCA C 181 60 AB060696 CyP1A1 rev GCC TCC TTG TTC ACA TGC TC CALR for TTG ACA ACA GCC AGG TGG AG 192 60 NM007591
others
CALR rev CAG GTT TCT TAG CAT CAG GGT C
Table 7: List of designed primer pairs for all bovine tissues. Length of the amplicons (BP) and annealing temperatures (AT) are listed. Some primer pairs were taken from extern references (*), so the accession number was not available.

Results and Discussion
28
qRT-PCR and gene expression regulations in liver, muscle and uterus
Tissue specific biomarkers were analysed to show first metabolic effects in the different
tissues and treatment dependent regulations.
Tabel 8: Tissue depentent biomarkers in bovine samples.The arrow shows the up or down-regulation of the target gene (TG). P-value<0.05 is shown by one arrow, p-value<0.01 is shown by two arrows. Treatments (TM) were melengestrol acetate (MGA), trenbolone acetate (TBA) and zeranol (Z).
Metabolic pathways in the liver
Especially genes of the endocrine (IGF1, IRα, IRβ, GR, PRLR, GHR) adipolysis (ACADvl,
EnoylCoA) and oncogene systems (v-myb, p53) were regulated and showed first auspicious
effects.
The adipolysis factors ACADvl and EnoylCoA showed significant up-regulations (71%;
76%) in the liver under TBA treatment. One central reaction during the fatty acid oxidation is
the ACADvl induced oxidation of Acyl-CoA with the formation of Enoyl-CoA followed by
another essential reaction, which is the EnoylCoA enzyme induced hydratisation with the
formation of hydroxyacyl-CoA. At the end of the fatty acid oxidation Acetyl-CoA is produced
which feeds into the citric acid cycle of energy-yielding reactions in the mitochondrial matrix
Liver M. splenius M. quadriceps Uterus
TG TM TG TM TG TM TG TM EnoylCoA ↑↑
TBA MYHC2x ↓ TBA MYHC2x ↓ TBA ACTA1 ↓ Z
ACADvl ↑↑ TBA ACTA1 ↓ MGA, TBA CTSL ↑ TBA, Z CTSL ↑↑ TBA FasL ↑↑ TBA CDK2 ↑ MGA Cyclin A ↑ MGA MMP2 ↓ MGA Bcl-xl ↑↑ TBA Cyclin A ↑ Z AR ↓ TBA TIMP2 ↑↑ MGA IGF1 ↑↑ Z GDF8 ↓ TBA IGF1 ↑ Z Angpt2 ↓↓ TBA IRα ↑ TBA IGF1 ↑ Z GRα ↑, ↓ MGA, TBA AR ↑ TBA IRβ ↑ MGA IGFBP3 ↑ MGA LDH ↓↓ TBA ERβ ↓↓ TBA
PRLR ↑↑ MGA ERα ↑, ↓ MGA, Z IGFBP3 ↑↑ TBA GR ↑↑ Z GRα ↑, ↓ MGA, TBA HK ↓↓ Z GHR ↑↑ MGA, TBA HK ↑ TBA Aconitase ↑ MGA,
TBA IL1 β ↑ TBA LDH ↓ TBA FasL ↑ MGA,
TBA Cox2 ↓ MGA Bcl-xl ↓ Z CAST ↑ MGA Caspase 3 ↑ TBA CTSB ↑↑ TBA CTSL ↑↑ MGA p53 ↓ MGA v-myb ↑↑ MGA, TBA c-fos ↑ MGA

Results and Discussion
29
or is used to form keto acids [82]. To show next metabolic pathways of Acetyl-CoA further
factors of the citric acid cycle or the ketose pathways need to be analysed.
Metabolic pathways in the muscles
In both muscles very similar gene regulations could be identified. Muscle proteins (MYHC2x,
ACTA1), enzymes of the energy metabolism (HK, LDH) and cell cycle factors (Cyclin A,
GDF8, CDK2) indicated a possible influence of AAS on theses pathways.
In m. splenius factors of energy metabolism, such as HK were up-regulated (62%), LDH was
down-regulated (51%) under TBA treatment. HK catalyse the formation of glucose to
glucose-6-phsophate. The endproduct of the cascade is pyruvat that can be convertet to lactate
by LDH. This last step is called anaerobic way of glycolysis [39]. AAS seem to induce the
aerobic and inhibit the anaerobic way of glycolysis but again further enzymes of the cascade
have to be tested to confirm the consumption.
Metabolic pathways in the uterus
In this tissue the angiogenesis factors (MMP2, TIMP2, Angpt2), the apoptosis factors (FasL,
Caspase 3, Bcl-xl) and the steroid receptors (AR, ERβ) seem to be affected pathways.
As primary sexual organ, the uterus showed the highest gene expression regulations.
Especially the apoptosis factors showed related regulations. FasL and Caspase 3 were
significantly up-regulated (263%; 151%) under TBA treatment. The extrinsic way of
apoptosis is induced by the death receptor ligand FasL which binds to death receptor FasR.
The complex can transform procaspase 8 to Caspase 8 which then influences Caspase 3.
Caspase 3 induces apoptosis [83]. It is supposed that AAS influence this way of apoptosis.
First tissue and treatment specific biomarkers could be identified. Additionally first
modifications on metabolic pathways are supposed to be induced by AAS. In the liver the
various gene regulations were expected because of its role as multi functional accumulator.
The primary sexual organs, the uterus, turned out to be very promising for gene expression
regulations.

Results and Discussion
30
3.2 Studies on primate tissues
RNA concentration and RNA integrity
The mean±S.D. total RNA concentration of the predose samples was 947.9±387.1 ng/µl for
the m. quadriceps and 515.8±209.5 ng/µl for the m. triceps. The day 16 samples showed a
total RNA concentration of 1384.9±455.8 ng/µl for the m. quadriceps and 1141.8±565.9 ng/µl
for the m. triceps. 1573.7±375.1 ng/µl total RNA for the m. quadriceps and 1563.3±396.9
ng/µl for the m. triceps samples in day 90 could be measured.
The first measurements of predose samples showed a very high 5S RNA peak for all samples
which indicates partly degraded total RNA and lower RNA quality. Because predose biopsy
samples were directly frozen in liquid nitrogen without protection of the sample, it is possible
that the RNA was damaged and resulted in a partly degraded total RNA with a high 5S RNA
peak. To address this problem the sensitivity of the 5S region was augmented in the algorithm
of the Bioanalyzer 2100 (Agilent Technologies, Santa Clara, USA) with the result that the
significant 18S and 28S regions could be identified.
The mean RIN value was 6.5 for the m. quadriceps and 6.9 for the m. triceps predose
samples, representing a total RNA of average quality.
At the second sampling on day 16, the biopsy tissues were placed into kryotubes before
freezing in liquid nitrogen. In RNA integrity analysis all samples showed a lower 5S region
than the predose samples, but for standardization the 5S peak sensitivity was also augmented.
The m. quadriceps samples had a mean RIN of 7.1, the m. triceps of 7.6.
For the day 90 samples the standardization the 5S peak sensitivity was augmented because the
5S peak was still dominant. M. quadriceps samples had a mean RIN of 6.9, m. triceps
samples of 7.6. For each time point, the m. triceps samples showed better RNA quality with
less variation than the m. quadriceps samples.
The low RNA quality of predose samples clearly showed that muscle biopsy samples should
not be stored directly in liquid nitrogen. Because of the small surface of the samples it seems
that the liquid nitrogen totally destroyed the muscle tissue cells and the included RNA. The
samples frozen in kryotubes (days 16 and 90) appeared to not have this kind of freezer burn
because more total RNA could be isolated and was still intact in these samples.
However, muscle tissue samples from euthanized animals (day 90) resulted in better quality
RNA than the biopsy samples from day 16. Most of the biopsy samples were coated with

Results and Discussion
31
blood and included connective tissue, factors that influence the pureness of muscle cell RNA.
The samples collected at day 90 did not appear to include blood or connective tissue.
Primer design
Again only primers that showed a specific PCR product in PCR analysis were taken for
further statistical analysis.
GROUP IDENTITY SEQUENCE 5´→ 3´ BP AT (°C)
ACC.NR.
muscle fibre
proteins
ACTA1 for CAT GGT CGG TAT GGG TCA GAA 154 60 NM001100
ACTA1 rev CGC GAA GCT CGT TGT AGA AG
MYHC2x for GCA CAT CCA GAG CAG AGA AGA A 229 60 NM017534
MYHC2x rev GAC AGT GAC ACA GAA GAG ACC T
transcription
factors
Myogenin for ATC ATC TGC TCA CGG CTG AC 108 60 NM002479
Myogenin rev TTT CAT CTG GGA AGG CCA CAG A
protein
metabolism
CTSB for ACAATTCCTACAGCGTCTCC 299 60 L16510
CTSB rev CACCACTTCTGATTCGATTCC
CTSL for ACATCCCTAAGCAGGAGAAGGC 159 60 M20496
CTSL rev CCAGCACACCATGATCCATGTC
CAPN3 for TCCAGTTCGTCTGGAAGAGACC 273 60 AY902237
CAPN3 rev TGTACGTTGGCAGGCAGTCATC
cell cycle
regulation
CyclinD for AAC AAG CTC AAG TGG AAC CTG G 170 60 NM053056
CyclinD rev CAT GGA GGG CGG ATT GGA AAT
Myostatin for AAC TTG ACA TGA ACC CAG GCA C 177 60 NM005259
Myostatin rev ACG GAT TCA GCC CAT CTT CTC
endo-
paracrine
factors
AR for TTG TCC ATC TTG TCG TCT TCG G 237 60 L29496
AR rev TGT CCA GCA CAC ACT ACA CC
ERβ for ATG CTC ACT TCT GCG CTG TC 219 60 NM001437
ERβ rev CAC ACT TCA CCA TTC CCA CTT C
GHR for ATC CAC CCA TTG CCC TCA AC 246 60 NM00163
GHR rev ATC TCA CAC GCA CTT CAT ATT CC
IGF1R for CAT TTC ACC TCC ACC ACC AC 151 60 NM000875
IGF1R rev AGG CAT CCT GCC CAT CAT AC
IGFBP3 for CAC AGA TAC CCA GAA CTT CTC C 227 60 M35878

Results and Discussion
32
IGFBP3 rev CCA TAC TTA TCC ACA CAC CAG C
IGFBP4 for CAA CTT CCA CCC CAA GCA GT 130 60 NM001552
IGFBP4 rev CTG GTG GCA GTC CAG CTC
IR for TCC AGA CAG ATG CCA CCA AC 280 60 NM000208
IR rev ATC CAG CTC GAA CAG CTC AC
GR for TTC TGC GTC TTC ACC CTC AC 159 60 AH002750
GR rev CTG TCT CTC CCA TAT ACA GTC C
energy
metabolism
HK for CGC ATC TGC TTG CCT ACT TC 229 60 NM000189
HK rev AAC TCT CCG TGT TCT GTC CC
LDH for TTC AGC CCG ATT CCG TTA CC 226 60 NM005566
LDH rev CAC CTC ATA AGC ACT CTC AAC C
CK for GAC ATC GTC TAC AGT GAA GCC 157 60 NM001824
CK rev AGT TCA AGC TGA ATT TAC AAG CCT G
PYGM for ACA TCA ACC CCA ACT CAC TCA C 160 60 AF066859
PYGM rev GCC TTC CCT CCA ATC ATC AC
satellite cell
biology
Myf5 for TGA GAG AGC AGG TGG AGA AC 290 60 NM005593
Myf5 rev GGC AAC TGG AGA GAG AGA AG
Myf6 for GCC AAG TGT TTC CGA TCA TTC C 166 60 NM002469
Myf6 rev ACT TCT CCA CCA CTT CCT CC
reference
genes
ACTB for TATAA Biocenter 60 *
ACTB rev TATAA Biocenter *
PPIA for TATAA Biocenter 60 *
PPIA rev TATAA Biocenter *
YWHAZ for GCA ACC AAC ACA TCC TAT CAG AC 243 60 NM145690
YWHAZ rev TTC TCC TGC TTC AGC TTC GTC
Table 9: List of designed primer pairs for both primate muscles. Length of the amplicons (BP) and annealing temperatures (AT) are listed. Some primers (*) were taken from the human endogenous control panel kit (TATAA Biocenter, Gothenburg, Sweden), therefore primer sequence and accession number was not available.
It was not possible to design perfect and working primer pairs for all target genes. The reason
was that few gene sequences of macaca fascicularis are available in public gene banks so the
gene sequences of homo sapiens were used for primer pair design. Because the genome of
cynomolgous monkey does not correlate hundred per cent with the genome of homo sapiens,
the chance of designing non-annealing primer pairs is still high.

Results and Discussion
33
Results and discussion of qRT-PCR and gene expression regulations in the muscle
Measured target genes in muscle biopsy samples:
M. quadriceps M. triceps
Predose Day 16 Day 90 Predose Day 16 Day 90
ACTA1
MYHC2x
MyoG
CTSL
CTSB no result
CAPN3
Cyclin D1
Myostatin
AR no result no result
ERα excluded
ERβ no result no result
GHR no result excluded
GR
IGF1R no result no result no result
IGFBP4
IGFBP3
IR
HK no result no result no result
LDH no result no result no result
CK
Myf5 no result excluded
Myf6 no result
CDH15 excluded
PYGM excluded
Table 10: Measured target genes in m. quadriceps and m. triceps biopsies of macaca fascicularis.
means TG with specific PCR products. No results indicate an unsatisfactory melting curve. Genes that did not show specific products in all three time points were excluded.
In m. quadriceps significant differences between the control and the treatments could be
identified after 90 day treatment, including the CTSL (p-value=0.0138), CAPN3 (p-
value=0.0625) and IGFBP3 (p-value=0.0280) (Figure 1, 2, 3). There were no significantly
regulated genes found in m. triceps. Possible effect of outliers was investigated and could not
be excluded. Only the three significantly regulated genes on the time point 90 days in m.
quadriceps are hence discussed further. Surprisingly the expression ratio deviated from the

Results and Discussion
34
value one in the control group, showing thus endogenously induced up-regulation throughout
the growth period of the animals. This conclusion is supported by the fact that no pronounced
regulation was found on the time point 16 days.
Figure 6: Significant down-regulation of CTSL between control and treated samples. Box-whisker plot show the expression ratio between the normalised expression of the timepoint 90 and baseline. The horizontal line inside the box indicates median and the box indicates the interquertile range. The full point indicates mean. The whiskers indicate the maximum and minimum and the squer indicates outliers. The calculation of the outliers is based on the box-whisker rule saying that a outlier is a point which falls more than 1.5 times (weak outlier) or 3 times (strong outlier) the interquartile range above the third quartile or below the first quartile. The control group showed also high variability as compared to the treatment groups as
indicated by the box-whisker plot. This reflects the natural variability of the non-induced
expression in each studied subject. In contrast to the control group, in the treated groups also
smaller variability was observed, possibly supporting the evidence for induced suppressing
effect on the individual expression.

Results and Discussion
35
Figure 7: Significant down-regulation for CAPN3 between control and treated samples. Box-whisker plot show the expression ratio between the normalised expression of the timepoint 90 and baseline. The horizontal line inside the box indicates median and the box indicates the interquertile range. The full point indicates mean. The whiskers indicate the maximum and minimum and the squer indicates outliers. The calculation of the outliers is based on the box-whisker rule saying that a outlier is a point which falls more than 1.5 times (weak outlier) or 3 times (strong outlier) the interquartile range above the third quartile or below the first quartile. In m. quadriceps the control samples already showed an expression with a high statistical
spread in the significantly regulated candidate genes what mirrors natural differences between
gene expressions in the individuals. This spread reduced in the treatment groups, showing a
suppression of the individual expression differences induced by the treatment.

Results and Discussion
36
Figure 8: Significant down-regulation for IGFBP3 between control and treated samples. Box-whisker plot show the expression ratio between the normalised expression of the timepoint 90 and baseline. The horizontal line inside the box indicates median and the box indicates the interquertile range. The full point indicates mean. The whiskers indicate the maximum and minimum and the squer indicates outliers. The diamond indicates weak outliers. The calculation of the outliers is based on the box-whisker rule saying that a outlier is a point which falls more than 1.5 times (weak outlier) or 3 times (strong outlier) the interquartile range above the third quartile or below the first quartile.
Both the down-regulation of CTSL and IGFBP3 can be interpreted as first anabolic effects of
the treatments in the muscle tissue. In the protein metabolism of the muscle CTSL expression
characterises muscle wasting and IGFBP3 can inhibit the interaction of IGF1 and IGF1R
which are important factors of muscle growth [84, 85, 86, 87]. With the down-regulation of
both genes a positive effect on the protein anabolism and growth in the muscle can be
supposed.
Down-regulations of CAPN3 could only be seen in conditions related to disuse and
denervation of the muscle, an age-related phenomenon [88, 89, 90]. The animals were held in
cages what could mirror the disuse of the muscle and explain the decrease of CAPN3 in the
muscle tissue.
First influences of the treatments on the protein metabolism and the muscle growth could be
seen via the significant expression of CTSL, CAPN3 and IGFBP3. These genes can be taken
as the first biomarkers for a gene expression pattern of anabolic steroids.

Results and Discussion
37
3.3 Studies on human tissues
3.3.1 Cell culture experiments
RNA concentration and RNA integrity
Samples of the cell culture of the male donor showed higher mean±S.D. total RNA
concentrations (86.2±41.2 ng/µl) than the samples of the cell culture of the female donor
(51.4±8.3 ng/µl). In both cell cultures Stanozolol samples showed the highest concentrations
(76.8±22.5 ng/µl; 144.7±35.1 ng/µl).
Samples taken after 6h treatment were analysed as mean reference for the RIN value. Mean
RIN values were higher in the cell culture of the male donor (8.6, stanozolol; 9.9,
testosterone; 7.5, nortestosterone; 8.4, clenbuterol) than in cell culture of the female donor
(8.8, stanozolol; 8.1, testosterone; 5.0, nortestosterone; 5.1, clenbuterol).
Primer design
Not all of the tested primer pairs showed satisfactory results in melting curve analysis and in
agarose gel electrophoresis. FasL, ERα, ERβ, Caspase 3 primer pairs were successfully
established in human muscle and therefore also tested in human HFDPC. For these genes no
specific product could be measured in HFDPC and also new designed primer pairs did not
show a specific product. It can be supposed that these genes were not expressed in HFDPC.
Therefore the results from these genes were not taken for statistical analysis. All other genes
were taken for further calculations.
GROUP IDENTITY SEQUENCE 5´→ 3´ BP AT (°C)
ACC.NR.
apoptosis CAPN8 FOR TGG CAC TGA TGG ACA GGA G 230 60 NM001228 REV GCA GAA AGT CAG CCT CAT CC FasR FOR TTC TGC CAT AAG CCC TGT CC 174 60 NM000043 REV CCA CTT CTA AGC CAT GTC CTT C Bcl-xl FOR TAA ACT GGG GTC GCA TTG TG 145 60 NM138578 REV TGG ATC CAA GGC TCT AGG TG Bcl-2 FOR GAG GAT TGT GGC CTT CTT TGA G 170 60 NM000633 REV ACA GTT CCA CAA AGG CAT CCC growth GHR FOR ATC CAC CCA TTG CCC TCA AC 246 60 NM00163 factors REV ATC TCA CAC GCA CTT CAT ATT CC IGF1R FOR CAT TTC ACC TCC ACC ACC AC 151 60 NM000875 REV AGG CAT CCT GCC CAT CAT AC IGFBP3 FOR CAC AGA TAC CCA GAA CTT CTC C 227 60 M35878

Results and Discussion
38
REV CCA TAC TTA TCC ACA CAC CAG C IGFBP5 FOR GAG CTG AAG GCT GAA GCA GT 177 55 ENST0233813 REV GAA TCC TTT GCG GTC ACA ATT cell cycle Cyclin D1 FOR AAC AAG CTC AAG TGG AAC CTG G 170 60 NM053056 REV CAT GGA GGG CGG ATT GGA AAT Cyclin E FOR CTA TCC TCC AAA GTT GCA CCA G 259 60 AF518727 REV CAA GGC AGT CAA CAT CAA GGA enzymes HSD17b1 FOR TGG ACG TCT TGG AGC TTT GTG 233 58 ENS0225929 REV CAG ATC TGT CTG GGT CAG CA SRD5A1 FOR CTT GAG CCA TTG TGC AGT GT 166 58 ENST0233239 REV GCC TCC CCT TGG TAT TTT GT SRD5A2 FOR TGA ATA CCC TGA TGG GTG GT 181 60 ENST0233139 REV GGA AAT TGG CTC CAG AAA CAT A hair FGF2 FOR AGA AGA GCG ACC CTC ACA TC 237 60 M27968 metabolism REV ACT GCC CAG TTC GTT TCA GT FGF7 FOR CCT GAG CGA CAC ACA AGA AG 167 60 M60828 REV GCC ACT GTC GCT TCC TTA TT FGF1R FOR GAA GTT CAA ATG CCC TTC CAG
TG 215 58 ENST0310729
REV CCA GCT GGT ATG TGT GGT TG FGF2R FOR CAG AGA CCA ACG TTC AAG CA 196 58 ENST0336553 REV GAG GAA GGC ATG GTT CGT AA HGF FOR CTG GTT CCC CTT CAA TAG CA 171 58 ENST0222390 REV CTC CAG GGC TGA CAT TTG AT NT5 FOR AGG CTG ATA ACG CTG AGG AAG 105 60 NM006179 REV CAT AGG ACT GCT TGG CCT TG steroid AR FOR TTG TCC ATC TTG TCG TCT TCG G 237 60 L29496 receptors REV TGT CCA GCA CAC ACT ACA CC GR FOR TTC TGC GTC TTC ACC CTC AC 159 60 AH002750 REV CTG TCT CTC CCA TAT ACA GTC C reference UBC FOR TGA AGA CTC TGA CTG GTA AGA
CC 128 60 NM021009
genes REV CAT CCA GCA AAG ATC AGC CTC GAPDH FOR GAA GGT GAA GGT CGG AGT CAA 233 60 NM002046 REV GCT CCT GGA AGA TGG TGA TG ACTB FOR AGTCCTGTGGCATCCACGAAAC 78 60 NM01101 REV GCAGTGATCTCCTTCTGCATCC
Tabel 11: Primer sequences of genes analysed in HFDPC and hair follicle samples. Amplicon lengths (BP) and annealing temperatures (AT) are listed. Not all genes could be measured in the experiments because of the limited RNA amount.
qRT-PCR and gene expression regulations in HFDPC
The results of the qRT-PCR runs showed high variations between the replicates (>1.5 cycles)
for the testosterone, nortestosterone and clenbuterol treatment. It can be supposed that the
rather low total RNA amount of several samples was the reason for the high variations in the
Ct values. To avoid speculations and false-positive results only the constant Ct values of the
stanozolol treatment were taken for further statistical analysis.

Results and Discussion
39
Gen expression analysis within one treatment time point (ΔΔCt)
In both cell cultures AR showed a significant down regulation at 24h and FasR an up-
regulation at 6h. In the cell culture of the female donor the 71% down regulation of AR was
seen in the 1nM concentration (p-value=0.047), in the cell culture of the male donor with 35%
in the 100nM concentration (p-value=0.014). FasR was up-regulated at 6h for 10nM
concentration in the cell culture the female donor (55%, p-value=0.023) and in the cell culture
of the male donor (720%, p-value=0.049). Additionally FGF7 was down-regulated at 0h in
the 100nM concentration (85%, p-value=0.009) and 10nM concentration (65%, p-
value=0.046) and at 6h in the 100nM concentration (94%, p-value=0.03) in the cell culture of
the female donor. In the cell culture of the male donor SRD5A2 (6h, p-value=0.028) and
FGF2 (0h, p-value=0.010) showed a significant down-regulation of 83% and 15%in the
100nM concentration.
Gen expression over treatment time (2-Way-Anova)
With the 2-Way-Anova one significant correlation of Caspase 8 to treatment concentration
and treatment time could be calculated in the cell culture of the female donor. Caspase 8 in
the 1nM concentration was significantly different from all other concentrations and
significant differences between 0h to 6h and 0h to 48h could be measured for this gene.
Stanozolol time treatment AR 0.751 0.312 FasR 0.137 0.057 FGF2 0.203 0.471 FGF7 0.374 0.959 IGF1R 0.095 0.181 Caspase8 0.028 0.010
Tabel 12: P-Values of 2-Way-Anova calculations of treatment and treatment time points. Caspase 8 showes significant differences between the treatment groups and the treatment time points (p-value< 0.05).
In both cell cultures AR and FasR showed the similar regulation under stanozolol treatment at
the same treatment time point. FasR additionally showed same regulations at the same
concentration. Therefore, AR and FasR could be taken as first biomarkers for a gene
expression pattern of stanozolol treatment.

Results and Discussion
40
Figure 9: Significant gene expression regulations in the cell culture of the female donor. The ratio was calculated by 2-ΔΔCt whereby the control was set 1 (upper control line). Data are depicted in bars ± standard deviations. Red asterisks (*) mark the significantly regulated target genes.
Figure 10: Significant gene expression regulations in the cell culture of the male donor. The ratio was calculated by 2-ΔΔCt whereby the control was set 1 (upper control line). Data are depicted in bars ± standard deviations. Red asterisks (*) mark the significantly regulated target genes.
Gene expression regulations in cell culture 1
treatment groups
Control 100nM 10nM 1nM
2-ΔΔ
Ct
0
2
4
6
8
10
12
14
16AR-24-hFasR-6hFGF7-0hFGF7-6h Plot 1 Upper control line
**
*
*
*
Gene expression regulations in cell culture 2
treatment groups
Control 100nM 10nM
2-ΔΔ
Ct
0
2
4
6
8
10
12
14
16AR-24hFGF2- 0hSRD5A2-6hFasR-6hPlot 1 Upper control line
*
* **

Results and Discussion
41
A first hint that also the growth phase of the hair follicle influences gene expressions could be
seen in the different regulations of FGF2 and FGF7 in the untreated samples in both cultures.
FGF7 is known to induce the growth phase (anagen phase) in the hair follicle, whereas FGF2
could be taken as its antagonist by inhibiting the morphogenesis [48]. In the cell culture of the
female donor FGF7 was significantly down-regulated what would show that these cells were
taken from a hair follicle in the catagen phase. In the cell culture of the male donor FGF2 was
significantly down-regulated, indicating the anagen phase. Several studies identified this
factor in the hair follicle but this was the first time that also an expression in the hair papilla
could be measured [45, 46, 47].
The significant regulations of FasR and Caspase 8 in the cell culture of the female donor
showed first influences on metabolic pathways. The regulation of both factors could indicate a
possible influence of stanozolol on the extrinsic way of apoptosis.
In this study AR and FasR were identified as first biomarkers for a gene expression pattern for
stanozolol treatment. Caspase 8 and FGF2 and FGF7 were not significantly regulated but
expressed in the hair papilla what makes the steroid receptor, apoptosis and hair cycle group
to interesting functional groups for further analysis. Physiological influences can be supposed
in the apoptosis and hair growth regulation. The results of this study were taken for further
analysis in hair follicle samples.

Results and Discussion
42
3.3.2 Hair follicle experiments
Histological stains Histological stains of plucked hair follicle samples clearly showed that cells of the root
sheath, especially the outer root sheath could be gained and used for RNA extraction without
taking a skin biopsy. It was not possible to gain the hair papilla by plucking as expected
because it remains to build up a new hair shaft.
Figure 11: Slice of the plucked hair with the hair shaft (1) and outer root sheath cells (2) which are
clearly outlined by perifollicular sheath cells (3), stained in blue.
RNA concentration and RNA integrity
Mean total RNA concentration of all samples of the first study was 67.5±52.0 ng/µl, in the
second study 102.5±80.1 ng/µl.
In the first study six male and six females samples were taken for mean RIN analysis that was
4.4. In study two the control and treated samples showed a mean RIN of 7.0.
The total RNA extraction of the hair follicle samples of the second study was done directly
after the plucking, in the first study samples were first frozen in liquid nitrogen, stored at
1
2
3

Results and Discussion
43
-80°C for some days until extraction was done. The freezing seems to damage cells so that
RNA is partly destroyed or degraded, what results in a lower RNA yield.
This explains the differences in the RNA concentrations and RIN values between the samples
of the first and the second study.
Primer design
The primer pairs designed for all measured target genes were first established in human hair
follicle dermal papilla cell samples or primate muscle tissue. Like in the HFDPC, ERα and
Caspase 3 did not show specific results in melting curve analysis. AR, FGF2, SRD5A2 and
Caspase 8 also showed no specific products even though the genes were measured in HFDPC.
It is supposed that these genes were not expressed in the hair follicle cells, what is possible
because it is known that androgens act via the hair papilla and induce gene expressions in the
hair follicle afterwards.
In the first study the reference genes GAPDH and UBC and in the second study the reference
genes ACTB and UBC had constant expression levels and could be taken for statistical
calculation.

Results and Discussion
44
Results and discussion of qRT-PCR and gene expression regulations in hair follicles
Following target genes were measured in the hair follicle experiments:
TG Study 1 Study 2
AR
ERα
GR
FGF7 n.m. /
FGF2 n.m.
Caspase 8
FasR
Bcl-2 n.m.
SRD5A2 n.m.
IL1β n.m.
Tabel 13: Target genes measured in both hair follicle experiments. Study 1 included male and female samples; in study 2 samples of treated and untreated men were measured. n.m. means not measured target genes, showed specific products and showed unspecific products in the PCR run. All TG with a were not taken for statistical analysis.
FGF7 only showed a specific product in the treated samples of study two, in the control
samples the melt curve analysis showed no specific peak.
Figure 12: For FGF7 a specific PCR product could only be seen in the treated samples (orange), not in control samples (green). On the x-axis the temperature in °C and on the y-axis the first derivative of the melt curve is shown.

Results and Discussion
45
In study 1 no significant differences between gene expressions in the female and male
samples could be identified.
In the second study a first androgen dependent effect on the gene expression could be seen for
FGF7. Looking at the specific melt peak of treated and untreated hair follicle samples (Figure
12), FGF7 was only expressed in the treated samples (mean Ct = 23.9 cycles). Additionally
GR was significantly down-regulated (41%; p-value=0.02) in the treatment samples. It is
known that androgens can bind and act via the GR what induced the significant regulation in
this study. The expression of IL1β and Bcl-2 in the first study and FasR in both studies in the
inner and outer root sheath of the hair follicle could be approved. [46, 91, 92].
These results show first promising differences between treated and untreated samples, a
precondition for the development of a possible screening method for anabolic agents. FGF7
GR, IL1β, Bcl-2 and FasR were identified as first potential biomarkers for anabolic agents in
hair follicle samples. Different gene expressions between HFDPC and hair follicle samples
were expected because it is known that androgens act via the hair papilla and influence factors
in the hair follicle afterwards [93, 94, 95, 96, 97]. Therefore the hair papilla would be the
more promising tissue for gene expression analysis. Because it can not be taken by plucking,
only by skin biopsy, it is not suitable as potential doping control tissue. This would only be
possible with the hair follicle samples but further studies are necessary to show if the
influences of AAS in this tissue are still strong enough to induce constant gene expressions.

Conclusion
46
4. Conclusion
All the various studies that are included in this thesis clearly show that qRT-PCR seems to be
a highly specific and sensitive method to analyze gene expressions in various tissues and
species. The most important part of a study and therefore precondition of a successful data
analysis is sampling, RNA extraction and purification in the beginning of the experiment.
Especially in samples with low RNA yield, a high RNA quality is important for good results.
In all experiments the relative quantification of gene expression was done, using reference
genes for normalization. This method is accepted for gene expression analysis but bears the
risk that the chosen reference genes are also significantly regulated. Therefore it is extremely
important to proof the non-regulation of the reference genes to avoid false interpretations.
To search for relevant target genes in the beginning of the study using literature shaped up as
a very efficient approach in tissues like the uterus and muscle. Here the influence of AAS was
often investigated and most of the selected target genes could be amplified and showed
significant regulations. In some tissues, e.g. the hair follicle the influence of anabolic agents
might not be established as well as in the uterus or the muscle. For such tissues a pre-analysis
of target genes using a hybridisation microarray could be helpful.
The experiments also showed that it is more promising to choose tissues that are directly
influenced by anabolic hormones, such as the uterus. Here the regulations of the biomarkers
showed very high expressions differences. It is recommended that further animal studies to
identify biomarkers for treatment with anabolic agents should be done in primary sexual
organs, e.g. the uterus, testis, prostate, sperm, or in blood. This is also applied for the human
system but here only very few tissues can be taken for such analysis, e.g. blood or hair. The
blood seems to be an auspicious tissue because it can easily be taken in every species and
higher gene expression regulations can be expected under the influence of anabolic agents.
Taking the hair for such analysis, the hair papilla would be more promising than the hair
follicle.
The aim to identify biomarkers, showing same regulations under a specific treatment in
various tissues could partly be obtained because biomarkers have to be optimized for each
tissue. Also factors like the health status, nutrition or environmental conditions seem to
influence gene expression regulations. This should be kept in mind when gene expression
regulations are interpreted. The number of animals or samples taken for further studies has to
be much higher to make organism specific differences as low as possible.

Conclusion
47
Summarizing all biomarkers for a treatment pattern of anabolic agents that were found in the
different tissues, the steroid receptors, protein metabolism factors and apoptosis factors seem
to be universal biomarkers, expressed in every tissue and species. Also tissue specific
biomarkers, such as the adipolysis factors in the liver, the muscle proteins in the muscles and
the glycolysis factors in the uterus, could be identified.
It also seems that the treatment with AAS results in a general suppression of the natural,
individual gene expressions.
Figure 13: List of identified biomakers for a treatment pattern of anabolic agents in the different tissues. ↓ shows a down-regulation, ↑ an up-regulations, one arrow shows p-value<0.05, two arrows show p-value<0.01. means that no significant expression could be calculated (no control group) but these target genes were also expressed in the tissue and could be taken as possible biomarkers. TG colored in blue were significantly regulated under androgen treatment, in green under estrogen treatment and in purple under gestagen treatment.
m. quadriceps
m. quadriceps
m. splenius
MYHC2x ↓ Cyclin A ↑ AR ↓ IGF1 ↑ LDH ↓↓
ACTA1 ↓ CTSL ↑↑ MMP2 ↓ TIMP2 ↑↑ Angpt2 ↓↓ AR ↑ ERβ ↓↓ IGFBP3 ↑↑ HK ↓↓ Bcl-xl ↓ Caspase3↑
MYHC2x↓ CDK2 ↑ Cyclin A↑ GDF8 ↓ IGF1 ↑ IGFBP3↑ HK ↑ LDH ↓
GR↓ FGF7 FasR Bcl-2 IL1β
HF Uterus Muscle
AR ↓ FasR ↑ Caspase8 FGF2 FGF7
CTSL ↓ CAPN3 ↓ IGFBP3 ↓
Enoyl CoA ↑↑ ACADvl ↑↑ FasL ↑↑ Bcl-xl ↑↑ IGF1 ↑↑ IRα ↑ IRβ ↑ PRLR ↑↑ GR ↑↑ IL1 β ↑ Cox2 ↓ CAST ↑ CTSB ↑↑ CTSL ↑↑ p53 ↓ c-fos ↑
Biomarkers
HFDPC
Muscle
Liver
Anabolic Androgenic Agents

Conclusion
48
Physiological effects of AAS are supposed to influence the extrinsic apoptosis pathway. In
this signal cascade several factors were significantly up-regulated and anti-intrinsic factors
down-regulated (Figure 14).
Figure 14: Signalling pathway of apoptosis. Genes coloured in red are part of the extrinsic way and were significantly regulated in all treated tissues.
This thesis showed that the analysis of AAS via gene expression biomarkers is possible in
specific tissues and could be used to identify physiological changes in the organism. First
steps toward a screening pattern for anabolic agents could be done. The development of a
universal, bovine screening pattern is not recommended because the biomarkers have to be
optimized for each specific tissue. It should be possible to use the identified tissue specific
biomarkers in different species. Modifications of the apoptosis pathway, the glycolysis, the β-
oxidation and protein metabolism seem to show first metabolic effects of AAS in the
organism.
FasL ↑
FasR ↑
Procaspase 8
Caspase 8
Caspase 3 ↑
APOPTOSIS
Caspase 9
Cytochrome C
Bcl-xl ↓
mitochondrium
cell membrane

Conclusion
49
It has to be pointed out that all studies done for this thesis were feasibility studies and first
steps toward a possible new screening method. Further studies are necessary to find more
biomarkers for a screening pattern of anabolic agents and to identify complete metabolic
pathways.
The ambitions for the future should be the identification of specific gene patterns for
functional groups of anabolic agents in one tissue, in order that abuses can be uncovered.

50
Reference List 1 The prohibited list 2007. International standard. World anti-doping agency. 2006. 2 Clasing D, Müller RK. Dopingkontrolle – Informationen für Aktive, Betreuer und Ärzte zur Bekämpfung des Medikamentenmissbrauchs im Sport. Bundesinstitut für Sportwissenschaften. 4., überarbeitete Auflage, 2006. 3 Saudan C, Baume N, Robinson N, Avois L, Mangina P, Saugy M. Testosterone and doping control. Br J Sports Med, 2006, 21-24. 4 Lange I, Meyer HD. Hormone. In: Handbuch der Lebensmitteltoxikologie, Band3 von 5, (Dunkelberg H, Gebel T, Hartwig A, eds,):Wiley-VCH Verlag Weinheim, ISBN 978-3-527-31166-8, S. 1579-1608, 2007. 5 Homepage des Instituts für Biochemie der DSHS Köln. 15.01.2005 www.dopinginfo.de 6 Ayotte C. Significance of 19-norandrosterone in athletes´urine samples. Br J Sports Med, 2006, 40:25-29. 7 Meyer HD. Estrogens and Antiestrogens. In: Handbook of Experimental Pharmacology (Oettel, M. and Schillinger, E., eds.), Volume 135/II. Springer-Verlag, Berlin, Heidelberg, 1999.
8 Pottier J, Cousty C, Heitzman RJ, Reynolds IP. Differences in the biotransformation of a 17 beta-hydroxylated steroid, trenbolone acetate, in rat and cow. Xenobiotica, 1981, 11, 489-500.
9 Randall D, Burggen W, French K, Eckert WH. Animal Physiology, Freeman and Company 2002. 10 Kleinova M, Zoellner P, Kahlbacher H, Hochsteiner W, Lindner W. Metabolic profiles of the mycotoxin zearalenone and of the growth promoter zeranol in urine, liver, and muscle of heifers.
J Agric Food Chem, 2002, 50, 4769-4776. 11 Meyer HHD. Bewertung von Wirkstoffen aus der Tierhaltung als mögliche Dopingsubstanzen im Humansport – In: Entwicklung in der Dopingforschung. Wissenschaftliche Berichte und Materialien; Bundesinstitut für Sportwissenschaften, (Müller-Platz C. eds.), Sportverlag Strauß, Köln, Band 08, ISBN 3-939390-87-9, S. 77-85, 2006. 12 Meyer HHD, Biochemistry and physiology of anabolic hormones used for improvement of meat production. APMIS, 2001 109, 1- 8
13 Meyer HHD, Lange IG. β-Agonisten. In:Handbuch der Lebensmitteltoxikologie, Band3 von 5, (Dunkelberg H, Gebel T, Hartwig A, eds,):Wiley-VCH Verlag Weinheim, ISBN 978-3-527-31166-8, S. 1579-1608, 2007. 14 Baron DA, Martin DM, Magd SA. Doping in sports and is spread to at-risk populations: an international review. World Psychiatry, 2007, 6:2. 15 Kuhn CM. Anabolic Steroids. Recent Prog Horm Res, 2002, 57:411-34. 16 Brook R. Doping in Sport: Misuse, analytical tests, and legal aspects. Clin Chem, 1997, 43:7. 17 Pallesen S, Jǿsendal O, Johnsen BH, Larsen S, Molde H. Anabolic steroid use in high school students. Subst Use Misuse, 2006, 41(13):1705-17.

51
18 VandenBerg P, Neumark-Sztainer D, Carfi G, Wall M. Steroid use among adolescents: longitudinal findings from project EAT. Pediatrics, 2007, 119(3):476-86. 19 Apple JK, Dikemann ME, Simms DD, Kuhl G. Effects of synthetic hormone implants, singularly or in combination, on performance, carcass traits and longissimus muscle palatability of Holstein steers. J Anim Sci, 1991, 69:4437-4448. 20 Hartel A. Biologisches Screening anaboler Wirkstoffe – In: Entwicklung in der Dopingforschung, Wissenschaftliche Berichte und Materialien; Bundesinstitut für Sportwissenschaften, (Müller-Platz C eds.) Sportverlag Strauß, Köln, Band 08, (2006), ISBN 3-939390-87-9, S. 65-76. 21 Food and Agriculture Organization of the United Nations. Joint FAO/WHO expert committee on food additives (JECFA). FAO Roster of experts for JECFA for residue of veterinary drugs in food (2007-2001). 28.09.2007 http://jecfa.ilsi.org/ 22 European Commission, Directorate General Health and Consumer Protection. Guidance document on residue analytical methods. SANCO/825/00 rev. 17/03/2004. 23 Bundesamt für Verbraucherschutz und Lebensmittelsicherheit. Tierarzneimittelrückstände in Lebensmitteln.05.09.2005. http://www.bvl.bund.de/cln_027/nn_493968/DE/05__Tierarzneimittel/02__RueckstInLm/rueckst__LM__node.html__nnn=true 24 Handelsman DJ. Testosterone:use, misuse and abuse. MJA, 2006, 185(8):436-439. 25 Yin D, Gao W, Kearby JD, Xu H, Chung K, He Y, Marhefka CA, Veverka KA, Miller DD, Dalton JT. Pharmacondynamics of selective androgen receptor modulators. J Pharmacol Eperim Therap, 2003, 304(3):1334-1340. 26 Bross R, Storer T, Bashin S. Aging and Muscle loss. TEM 1999, 10(5): 194-198.
27 Muller M, Grobbee DE, Thijssen JHH. Sex hormones and male health: effects on components of the frailty syndrome. Trends Endocrinol Metabol, 2003, 14(6): 289-296.
28 Van den Beld A, Huhtaniemi IT, Pettersson KS et al. Luteinizing Hormone and Different Genetic Variants, as Indicators of Frailty in Healthy Elderly Men, JCEM, 1998, 84(4): 1334-1339.
29 Yialamas MA, Hayer FJ. Androgens and the ageing male and female. Best Practice and Research, Clin Endocrin and Metabol, 2003, 17(2): 223-226.
30 Davis S. Androgen Replacement in Women: A Commentary. JCEM, 1999, 84(6): 1886-1891.
31 Davis SR. The therapeutic use of androgens in women. J St Biochem Mol Biol, 1999, 69:177-184.
32 Deschenes MR. Effects of aging on muscle fibre type size. Sports Med, 2004, 34(12): 809-24.
33 Doherty TJ. Invited review: aging and sarcopenia. J Appl Physiol, 2003, 95(4): 1717-27.
34 Lopez FJ. New approaches to the treatment of osteoporosis. Curr Opin Chem Biol, 2000, 4 (4):383-393.
35 Chen J, Hwang DJ, Bohl CE et al. A selective androgen receptor modulator (SARM) for hormonal male contraception. JPET, 2005, 312: 546–553.

52
36 Negro-Vilar A. Selective Androgen Receptor Modulators (SARMs): A Novel Approach to Androgen Therapy for the New Millennium. JCEM, 1999, 84(10): 3459-3462.
37 Yin D, Gao W, Kearbey JD. Pharmakodynamics of Selective Androgen Receptor Modulators. JPET 2003, 304(3): 1334-1340.
38 Rosen J, Negro-Vilar A. Novel, non-steroidal, selective androgen receptor modulators (SARMs) with anabolic activity in bone and muscle and improved safety profile. J Musculoskelet Neuronal Interac,. 2002, 2(3):222-4.
39 Catlin DH, Hatton CK, Starcevic SH. Issues in detectin abuse of xenobiotic anabolic steroids and testosterone by analysis of athletes´urine. Clinical Chemistry, 1997, 43(7):1280-1288. 40 U.S.A Food and Drug Administration. Surrogate Markers – Their role in regulatory decision progress. 21.08.2003 http://www.fda.gov/cder/Offices/Biostatistics/Chakravarty_376/sld016.htm 41 Rehner G, Daniel H. Biochemie der Ernährung. 2. Auflage, Spektrum Akad. Verlag, 2002. 42 Dorak MT. Real-time PCR.. 1st ed., Taylor and Francis Group, 2006. 43 Darbre P, Yated J, Curtis S, King RJB. Effect of estradiol on human breast cancer cells in culture. Cancer Res, 1983, 43:349-354. 44 Fleige S, Pfaffl MW. RNA integrity and the effect on the real-time qRT-PCR performance. Mol A Med 2006, 27: 126-139.
45 Schroeder A, Mueller O, Stocker S et al.The RIN: an RNA integrity number for assigning integrity values to RNA measurements. BMC Mol Biol, 2006, 31(7): 3.
46 Kirschke H, Barrett AJ, Rawlings ND. Proteinases 1: lysosomal cysteine proteinases. 2nd ed. New York: Oxford University Press; 1998, 13–18.
47 Kugler P, Vornberger G. Renal cathepsin-B activities in rats after castration and treatment with sex hormones. Histochemistry, 1986, 85(2), 157-61
48 Reeds PJ, Hay SM, Dorward PM, Palmer RM. Stimulation of muscle growth by clenbuterol: lack of effect on muscle protein biosynthesis. Br. J. Nutr. 1986,56, 249.
49 Voet D, Voet JG, Pratt CW, in: Lehrbuch der Biochemie (Wiley-VCH). 2002.
50 Penzlin H, Lehrbuch der Tierphysiologie; 7. Auflage. Elsevier, Spektrum Akademischer Verlag, 2005.
51 Vandekerckhove J, Bugaisky G, Buckingham M. Simultaneous expression of skeletal muscle and heart actin proteins in various striated muscle tissues and cells. A quantitative determination of the two actin isoforms. J Biol Chem, Feb 5;261(4), 1986, 1838-1843.
52 Vandekerckhove J, Weber K. Chordate muscle actins differ distinctly from invertebrate muscle actins. The evolution of the different vertebrate muscle actins. J Mol Bio, Dec 25; 126(4), 1978, 783-802.
53 Hunt DW, Henricks DM, Skelly GC, Grimes LW. Use of trenbolone acetate and estradiol in intact and castrate male cattle: effects on growth, serum hormones, and carcass characteristics. J Anm Sci 69, 1991, 2452- 2462.

53
54 Ho JW, Song JZ, Leung YK . Activation of p53 by specific agents in potential cancer therapy. Curr Med Anti-Canc Agents, 2005, 5(2): 131-135. 55 Ishiguro N, Ohzono T, Shingawa T, Horiuchi M, Shingawa M. A spontaneous internal deletion of the c-myb protooncogene enhances transcriptional activation in bovine T lymphoma cells. The Journal of Biological Chemistry, 1994, 269(43): 26822-26829. 56 Kleinova M, Zoellner P, Kahlbacher H, Hochsteiner W, Lindner W. Metabolic profiles of the myotoxin zearalenone and of the growth promoter zeranol in urine, liver, and muscle of heifers. J Agric Food Chem, 2002, 50: 4769-4776. 57 Pfaffl MW, Lange IG, Daxenberger A, Meyer HHD. Tissue-specific expression of estrogen receptors (ER): Quantification of ERα and ERβ mRNA with real-time RT-PCR. APMIS, 2001, 109: 345-355. 58 To YC. The effect of neonatal administration of sex hormones on ribonucleic acid metabolism in the liver of male and female rats. Br J Cancer, 1971, 25: 516-519. 59 Ferrara N. Vascular endothelial growth factor and the regulation of angiogenesis. Recent Prog Horm Res, 2000; 55:15-35; discussion 35-36. 60 Lee S-J and McPherron AC. Myostatin and the control of skeletal muscle mass. Curr Op Gene., 1999, Dev. 9:604–607. 61 McPherron AC, Lawler AM, Lee SJ. Regulation of skeletal muscle mass in mice by a new TGF-beta superfamily member. Nature, 1997, 387: 83–90. 62 Langley B, Thomas M, Bishop A, Sharma M, Gilmour S, Kambadur R. Myostatin inhibits myoblast differentiation by down-regulating MyoD expression. J Biol Chem, 2002, 277:49831-49840.
63 Shinha-Hikim I, Cornford M, Gaytan H, Lee ML, Bashin S. Effects of testotserone supplementation on skeletal muscle fibre hypertrophy and satellite cell in community-dwelling older men. J Clin Endocrinol Metab, 2006, 91:3024-3033.
64 Vandekerckhove J, Bugaisky G, Buckingham M. Simultaneous expression of skeletal muscle and heart actin proteins in various striated muscle tissues and cells. A quantitative determination of the two actin isoforms. J Biol Chem, 1986, 261:1838-1843.
65 Bartoli M, Richard I. Calpains in muscle wasting. Int. J. Biochem. Cell Biol. 2005, 37:2115-2133.
66 Dargelos I, Moyen, C, Dedieu S, Veschambre P, Poussard S, Vuillier-Devillers K, Brustis JJ, Cottin P. Development of an inducible system to assess p94 (CAPN3) function in cultured muscle cells. J. Biotechnol. 2002, 96:271-279.
67 Degterev A, Boyce M, Yuan JY. A decade of caspases. Oncogene 2003, 22:8543-8567.
68 Baxter RC. Insulin-like growth factor (IGF)-binding proteins: interactions with IGFs and intrinsic bioactivities. Am J Physiol Endocrinol Metab, 2000, 278:E967-E976.

54
69 Coolican SA, Samuel DS, Ewton DZ, McWade FJ, Florini JR. The mitogenic and myogenic actions of insulin-like growth factors utilize distinct signaling pathways. J Biol Chem 1997, 272:6653-6662.
70 Florini JR, Ewton DZ, Coolican SA. Growth hormone and the insulin-like growth factor system in myogenesis. Endocr Rev, 1996, 17:481-517.
71 Beauchamp JR, Heslop L, Yu DS, Tajbakhsh S, Kelly RG, Wernig A, Buckingham ME, Partridge TA, Zammit PS. Expression of CD34 and Myf5 defines the majority of quiescent adult skeletal muscle satellite cells. J Cell Biol, 2000, 151:1221-1234.
72 Mitusi S, Ohuchi A, Hotta M, Tsuboi R, Ogawa H. Genes for a range of growth factgors and cyclin-dependent kinase inhibitors are expressed by isolated human hair follicles. Br J Dermatol, 1997, 137: 693-698.
73 Ota Y, Sioth Y, Suzuki S, Ozawa K, Kawano M, Imamura T. Fibroblast growth factor 5 inhibits hair growth by blocking dermal papilla cell activation. Biochem Biophys Res Commun, 2002, 11;290(1):169-76.
74 Schlake T. FGF signals specifically regulate the structure of hair shaft medulla via IGF-binding protein 5. Development, 2005, 132: 2981-2990. 75 Stenn KS, Paus R. Controls of hair follicle cycling. Pharm Rev, 2001, 81 (1). 76 Ensemble Genome Browser. Ensembl release 48, 2007. http://www.ensembl.org 77 National Center for Biotechnology Information. Revised: January 25, 2008. http://www.ncbi.nlm.nih.gov 78 Primer 3 (v0.4.0). Feburary 07, 2007. http://www.frodo.wi.mit.edu/ 79 Livak KJ, Schmittgen TD. Analysis of relative gene expression data using real-time quantitative PCR and the 2(-Delta Delta C(T)) Method. Methods 2001, 25:402- 408.
80 Pfaffl MW. Nucleic acids: mRNA identification and quantification. In: Encyclopaedia of Analytical Science, 2nd ed., 2005, 417-426. 81 Tichopad A, Dilger M, Schwarz G, Pfaffl MW.: Standardized determination of real-time PCR efficiency from a single reaction set-up. Nucleic Acids Res, 2003, 31: e122. 82 Bouffaut JC, Willemart JP. Anabolic activity of trenbolone acetate alone or in association with estrogens. In: Anabolics in Animal Production (E. Meissonier, ed.), 155-179. Soregraph, Levallois, 1993. 83 Garrison JB, Kyprianou N. Novel targeting of apoptosis pathways for prostate cancer therapy. Curr Cancer Drug Targets, 2004 Feb;4(1):85-95 84 Baxter RC. Insulin-like growth factor (IGF)-binding proteins: interactions with IGFs and intrinsic bioactivities. Am J Physiol Endocrinol Metab. 2000, 278 (6): E967-E976.

55
85 Bechet D, Tassa A, Taillandier D. Lysosomal proteolysis in skeletal muscle. J Biochem Cell Biol. 2005, 37: 2098-2114.
86 Florini JR, Ewton DZ, Coolican SA. Growth hormone and the insulin-like growth factor system in myogenesis. Endocr Rev, 1996, 17(5): 481-517.
87 Jones JI, Clemmons DR. Insulin-Like Growth Factors and Their Binding Proteins: Biological Actions. Endocrine Reviews, 1995, 16(1): 3-34
88 Bartoli M, Richard I. Calpains in muscle wasting. Int J Biochem Cell Biol. 2005, 37 (10): 2115-2133.
89 Dargelos E, Moyen C, Dedieu S. Development of an inducible system to assess p94 (CAPN3) function in cultured muscle cells. J Biotech, 2002, 96: 271-279.
90 Stockholm D, Herasse M, Marchand S, Praud C, Roudaut C, Richard I, Sebille A, Beckmann JS. Calpain 3 mRNA expression in mice after denervation and during muscle regeneration. Am J Physiol Cell Physiol, 2001, 280(6):C1561-9.
91 Karstila T, Rechardt L, Honkaniemi J, Gustafsson JA, Wikströms AC, Karpinnen A, Pelton-Huikko M. Immunohistocytochemical localization of glucocorticoid receptor in rat skin. Histochemistry, 1994, 102(4):305-9. 92 Sohn KC, Jang S, Choi DK, Lee YS, Yoon TJ, Jeon EK, Kim KH, Seo YJ, Park JK, Kim CD. Effect of thioredoxin reductase 1 on glucocorticoid receptor activity in human outer root sheath cells. Biochem Biophys Res Commun, 2007, 11;356(11):810-5. 93 Ando Y, Yamaguchi Y, Hamada K, Yoshikawa K, Itami S. Expression of mRNA for androgen receptor, 5α-reductase and 17β-hydroxasteroid dehydrogenase in human dermal papilla cells. Br J Dermatol, 1999, 141:840-845. 94 Mitsui S, Ohuchi A, Hotta M, Tsuboi R, Ogawa H. Genes for a range of grwoth factors and cyclin-dependent kinase inhibitors are expressed by isolated human hair follicles. Br J Dermatol, 1997, 137:693-698. 95 Ohnemus U, Uenala M, Conrad F, Handjiski B, Mecklenburg L, Nakamura M, Inzunza J, Gustafsson JA, Paus R. Hair cycle control by estrogens: catagen induction via estrogen receptor (ER)-α is checked by ERβ signaling. Endocrinology, 2005, 146:1214-1225. 96 Randall VA, Thorton MJ, Hamada K, Messenger AG. Mechanism of androgen action in cultured dermal papilla cells derived from human hair follicle with varying resposes to androges in vivo. J Invest Dermatol, 1992, 98:86S-91S. 97 Winiarska A, Mandt N, Kamp H, Hossini A, Seltmann H, Zouboulis CC, Blume-Peytavi U. Effect of 5α-Dihydrotestosterone and testosterone on apoptosis in human dermal papilla cells. Skin Pharmacol Physiol, 2006, 19:311-321.

56
Acknowledgments Especially I want to thank Prof. Dr. Dr. Heinrich H.D. Meyer who gave me the possibility to do my PhD thesis at the chair of Physiology and who supervised me during this time. I want to thank him for his trust in my work and my ideas, so that I learned to think independently and critically. I also want to thank PD Dr. Michael W. Pfaffl, supervisor of the methodical part of my thesis, for his help with all the questions concerning PCR and for the really good working atmosphere. Many thanks to Dr. Alês Tichopad who help me so much with the statistic and who taught me that there are always several ways to analyse results. Thanks to Dr. Susanne E. Ulbrich who introduced me in histology and always had helpful ideas. Special thanks go to my boyfriend Hermann who supported me during this time and tolerated my moods. Also thanks to my family who always assisted me in my decisions. Warm thanks to my PhD colleagues and all employees at the institute who helped me with all my problems, questions and hair sample collection. Special thanks to the students Arne Christians and Sonja Englert for their help. I am deeply grateful for the financial support of the projects by “TAP Pharmaceutics” and the “Bundesinstitut für Sportwissenschaften”.

57
Scientific communications Original Publications Reiter M, Walf VM, Christians A, Paffl MW, Meyer HHD. Modification of mRNA expression after treatment with anabolic agents and the usefulness for gene expression-biomarkers. Analytica Chimica Acta, 2007, 586:73-81. M. Reiter, M.W. Pfaffl Effects of plate position, plate type and sealing systems on real-time PCR results. Biotechnology and Biotechnological Equipment, 2008, 22/3. Reiter M, Lüderwald S, Pfaffl M.W, Meyer H.H.D First steps toward a new screening method for anabolic androgenic androgens in human hair follicle. Submitted: “Doping Journal” Reiter M, Pfaffl M.W, Schönfelder M, Meyer H.H.D. Gene expression in hair follicle dermal papilla cells after treatment with stanozolol. Submitted: “Biomarkers” M. Reiter, A. Tichopad, I. Riedmaier, M.W. Pfaffl, H.H.D. Meyer Monitoring gene expression in muscle tissue of macaca fascicularis under the influence of testosterone and SARM. Submitted: “Current Drug Discouvery Technologies” Oral presentations Reiter M, Walf VM, Christians A, Pfaffl MW, Meyer HHD. Modification of mRNA expression after treatment with anabolic agents and the usefulness for gene expression-biomarkers. 5th International Symposium on hormone and veterinary drug residue analysis, Universiteit Gent, 16.04-19.04.2006, Antwerp, Belgium. Reiter M, Walf VM, Christians A, Paffl MW, Meyer HHD. Attempts to identify gene expression biomarkers after treatment with anabolic agents. 47. Arbeitstagung der Deutschen Veterinärmedizinischen Gesellschaft e.V., 27.09.2006, Kongresshaus Garmisch-Partenkirchen. Posters Reiter M, Walf VM, Paffl MW, Meyer HHD. Effects of Anabolic Sex Hormones on Gene Expression in Bovine Liver – Differential Gene Expression Profiling via a candidate gene approach qRT-PCR 2nd International qPCR Symposium, Technische Universität München, 05.09-09.09.2005, Freising-Weihenstephan, Germany.

58
Reiter M, Walf VM, Christians A, Paffl MW, Meyer HHD. Modification of Metabolic Enzymes and their Usefulness for Biomarkers, after treatment with Anabolic Agents 5th International Symposium on hormone and veterinary drug residue analysis, Universiteit Gent, 16.04-19.04.2006, Antwerp, Belgium. Reiter M, Walf VM, Christians A, Paffl MW, Meyer HHD. Drug screening via modified gene expression pattern: Effects of anabolic agents on biochemical pathways International Symposium: harmonising the knowledge about biomedical side effects of doping, Technische Universität München, 21.10.2006, München, Germany. Reiter M, Pfaffl MW, Schönfelder M, Meyer HHD. Doping analysis- Gene expression in hair follicle cells as new screening method? 3rd International qPCR Symposium, Technische Universität München, 26.03- 30.3.2007, Freising-Weihenstephan, Germany.

59
Curriculum vitae Martina Reiter Place and date of birth: Rosenheim (Germany), 20.01.1981 Education: PhD thesis (Dr.rer.nat) Zentralinstitut für Ernährungs- und Lebensmittelforschung since 05/2005 Technische Universität München, Germany Project: Modification of metabolic pathways by anabolic agents and identification of gene expression biomarkers Scientific assistant 09/2004-04/2005 Institute of Biological Chemistry and Nutrition, Universität Hohenheim, Germany Project: Antioxidant system and vitamin A in cystic fibrosis Study of sport science 02/2003-04/2004 Justus-Liebig-Universität Giessen, Germany Minors: sport psychology, training strategies Study of Nutrition Science 10/1999- 04/2004 Justus-Liebig-Universität Giessen, Germany Minors: endocrinologie, microbiologie Diploma thesis: Loss of elecrolytes during endurance exercise Diploma degree Matura (final examination at high school) 10/1991- 07/1999 Bundesrealgymnasium Kufstein, Austria Primary school 09/1987- 07/1991 Volksschule Kiefersfelden, Germany

60
APPENDIX Appendix I 61 Appendix II 71 Appendix III 79 Appendix IV 95 Appendix V 114

Appendix I
61

A
oo
(gtfmq
b8msg
b
o©
Kt
1
a
Dbrc
0d
Analytica Chimica Acta 586 (2007) 73–81
Modification of mRNA expression after treatment with anabolicagents and the usefulness for gene expression-biomarkers
Martina Reiter ∗, Vanessa M. Walf, Arne Christians, Michael W. Pfaffl, Heinrich H.D. MeyerPhysiology Weihenstephan, Technische Universitat Munchen, Weihenstephaner Berg 3, 85354 Freising, Germany
Received 9 June 2006; received in revised form 8 September 2006; accepted 30 October 2006Available online 7 November 2006
bstract
With this feasibility study a first step towards a new monitoring system for hormonal treatments was done. Screening of regulation and functionf anabolic sex steroids via modified gene expression of mRNA in various tissues could be a new approach to trace treatments with unknown drugsr newly combined cocktails.
In the study, uterus, liver and muscle tissue from 24 cycling heifers were taken after the animals were treated either with Melengestrol AcetateMGA), Finaplix-H® (200 mg Trenbolone Acetate) or Ralgro® (36 mg Zeranol) for 56 days. In every treatment group always two heifers wereiven 1-fold, 3-fold and 10-fold doses of the standard preparation, the control group without any treatment consisted of two animals. The differentissue gene expression profiles were investigated via the candidate gene approach. Totally 57 candidate genes were selected according to theirunctionality by screening the actual literature and composed to functional groups: angiogenesis, apoptosis, cell cycle, endocrine factors, energyetabolism, inflammatory factors, muscle function, oncogenes, protein metabolism and transcription factors. Gene expression was measured using
uantitative real-time RT-PCR (qRT-PCR) technology.From 24 tested candidate genes in the liver, 17 showed a significant regulation. Eight genes were influenced by MGA, 9 by Finaplix-H®, and 4
y Ralgro®. For the muscle tissue 19 genes were tested with the result that in the neck muscle 11 genes were regulated and in the hind limb musclegenes. In the neck 5 genes were affected by MGA, 6 by Finaplix-H® and 3 by Ralgro®. Only 2 genes were influenced by MGA in the hind limbuscle. Finaplix-H® affected 6 and Ralgro® 4 genes. In the uterus 29 target genes were tested and 13 were significantly influenced by the anabolic
ex steroids. Under Finaplix-H® treatment eight target genes were regulated and Ralgro® and MGA showed a significant regulation in four targetenes.
The highest gene expression changes under anabolic treatment were observed in the uterus. The analyzed genes showed significant regulations
ut further studies, testing different animal husbandry conditions will be needed to identify meaningful expression patterns for the different tissues.With the investigation of the regulation and possible function of anabolic sex steroids via gene expression, a preparatory work for the developmentf an expression pattern for drug screening was made.
2006 Elsevier B.V. All rights reserved.
; Mel
a
eywords: Anabolic agents; Expression profiling; Candidate gene approachranscriptase polymerase chain reaction
. Introduction
In Canada, the USA and other countries, the use of xenobiotic,nabolic sex steroids in farm animals is licensed. Melengestrol
Abbreviations: AM, arithmetic mean; bp, base pairs; CP, crossing point;NA, desoxyribonucleic acid; for, forward primer; RIN, RNA integrity num-er; qRT-PCR, quantitative reverse-transcription polymerase chain reaction; rev,everse primer; RG, reference gene; mRNA, messenger ribonucleic acid; CG,andidate gene∗ Corresponding author. Tel.: +49 8161713867.
E-mail address: [email protected] (M. Reiter).
tlrb
s[Imgt
003-2670/$ – see front matter © 2006 Elsevier B.V. All rights reserved.oi:10.1016/j.aca.2006.10.049
engestrol acetat; Trenbolone acetat; Zeranol; Real-time quantitative reverse
cetate (MGA), trenbolone acetate (TBA) and zeranol are usedo induce better growth rates, reduce fat thickness, and receiveeaner animals with more meat [4,18,24,30]. In the EU theegistration and application of anabolic hormones is forbiddenecause of potential health risks for the consumers [13].
MGA is taken to improve feed efficiency and growth whileuppressing the ovulation and inducing endogenous estradiol15,29,37]. TBA is active after hydrolysis to trenbolone-17beta.
t also acts as anti-glucocorticoid and provokes synthesis ofyofibrillar proteins in muscle. Trenbolone binds to the andro-en receptor with a higher affinity than dihydrotestosterone, tohe progestin receptor and even to the glucocorticoid receptor

7 Chim
[ai
prcata
sbTbadcft
2
2
oFSVfmgdcb[
2
se
2
de(ctaBpwR
2
tEtsc1f
2
ttr
t(lg(B
tac([
a(
rhc
tmaag
a[n
t
eta
4 M. Reiter et al. / Analytica
28,40,41]. Zeranol is derived from the mycotoxin zearalenonend provokes higher absorption rate on the regular nutrition leveln heifers and improves growth rates of cattle [22].
Applying the anabolic agents, changes in the biochemicalathways are notified in organs and tissues. Specific enzymes,eceptors and cytokines can be activated or suppressed on theellular mRNA expression level. Using appropriate specificnd sensitive quantification methods, like quantitative real-ime RT-PCR, such mRNA expression changes are measur-ble.
The aim of this feasibility study was to show how anabolicex steroids, like MGA, TBA and zeranol act in differentovine tissues via mRNA expression of different target genes.he discovered, regulated target genes could then function asiomarkers for the design of characteristic expression patterns ofnabolic agent groups. Gene expression from the following can-idate gene groups were investigated: angiogenesis, apoptosis,ell cycle, endocrine factors, energy metabolism, inflammatoryactors, muscle function, oncogenes, protein metabolism andranscription factors.
. Experimental
.1. Animal experiment
Groups of six Holstein–Friesian heifers were treated eitherrally with 0.5 mg MGA or with the implant preparations ofinaplix-H® (200 mg Trenbolone Acetate; Hoechst Roussel Vet,ommerville, USA) or Ralgro® (36 mg Zeranol; Mallinckrodteterinary Inc., Mundelein, USA). According to the manu-
acturers instruction, the implants were administered to theiddle third of the pinna of the right ear. In every treatment
roup always two heifers were given 1-fold, 3-fold and 10-foldoses of preparation, the control group without any treatmentonsisted of two animals per group. The heifers were agedetween 12 and 16 month with a mean weight of 320 ± 57 kg12,15,24,36].
.2. Sample collection
After 56 days treatment all heifers were slaughtered, tis-ue samples were taken and stored at −80 ◦C until total RNAxtraction.
.3. Total RNA extraction
200 mg of frozen tissue was homogenized in 4 M guani-inium thiocyanate buffer to destroy RNase activity. For thextraction of the RNA an AGS clean protocol was usedAGS RNA-Clean, AGS, Heidelberg, Germany). The prin-ipal of this protocol was phenol/chloroform extraction forotal RNA. To quantify the amount of total RNA extracted,bsorbance was measured with the photometer (Eppendorf
iophotometer, Hamburg, Germany) for each sample. RNAurity was calculated with the 260/280 absorbance ratio. Allorking solutions were diluted to a concentration of 10 ngNA �L−1.(t
r
ica Acta 586 (2007) 73–81
.4. Analysis of RNA quality
RNA integrity and quality control was performed withhe Bioanalyzer 2100 (Agilent Technology, Palo Alto, USA).ukaryotic total RNA Nano Assay (Agilent Technology) was
aken for sample analysis and the RNA integrity number (RIN)erved as RNA quality parameter. Agilent Bioanalyzer 2100 cal-ulated the RIN value based on a numbering system from 1 to0 (1 being the most degraded profile, 10 being the most intact)or all samples [13,31].
.5. Selection of target genes
Target genes, factors and enzymes were selected if supposedo play an important role in the anabolic pathways of the analyzedissues. Following candidate genes were chosen by screening theespective literature.
Endocrine factors consist of the different hormone recep-ors like the androgen receptor (AR), the estrogen receptorsER�, ER�), the growth hormone receptor (GHR), the pro-actin receptor (PRLR), the insulin receptors (IR�, IR�), and thelucocorticoid receptor (GR�). The insulin-like growth factorIGF-1), its receptor (IGF-1-R) and its binding protein (IGF-P3) also belong to this group [28].
The investigation of all factors, which are included in pro-eolysis and protein synthesis is of interest because of thenabolic function. To this protein metabolism group belongsathepsin L (CTSL), cathepsin B (CTSB) and calpastatinCAST), calpain (CAPN3) and tyrosin-amino-transferase (TAT)21,23,32,34,42,43,45].
The group of muscle function includes the fiber proteins actinnd its isoforms (ACTA1, �-actin) and myosin with its isoformsMYHC-2x) [38,47,48].
In adipocytes, anabolic hormones induce lipolyis, whatesults in several candidate enzymes such as enoyl-coA-ydratase (enoylCoA) or acyl-coA-dehydrogenase very longhain (ACADvl) [39].
The enzyme creatinkinase (CK) plays an important role inhe regeneration of ATP. Glycolysis is a major pathway in theuscle and hexokinase (HK) plus lactate-dehydrogenase (LDH)
re involved. Together with aconitase, key enzyme of the citriccid cycle, these genes are summarized as energy metabolismroup [49].
Cyclin-dependend kinase (CDK2), cyclin A and cyclin D1re factors of the cell cycle regulation and induce muscle growth3,25]. Myostatin, a member of the TGF-� family is an antago-ist of this regulation [6].
RNA expression is influenced by different transcription fac-ors, like c-fos protein (c-fos) or c-jun protein (c-jun) [5].
It is supposed that anabolic agents also affect angiogen-sis. The vascular endothelial growth factors (VEGFs) andheir receptor (FLK-1), the fibroblast growth factors (FGFs),ngiopoetin (Angpt1, Angpt2), the matrix metalloproteinases
MMP1,2,14) and their inhibitors (TIMP1,2) are members ofhis functional group.The influence of anabolic agents on pro-inflammatoryesponse and reactions is still unclear. Tumor necrosis factor-�

him
2
i(oFm(gelTcutui
mFm
tc�
goieic2
�
�
�
�
3
3
u(
3
M. Reiter et al. / Analytica C
(TNF-�), interleukin-1� (IL1-�) and cyclo-oxygenase 2 (Cox2)belong to this group.
Factors which are involved in cell death regulation like Fas-L, Caspase3 and bcl-xl were summarized in the apoptosis group[17,19].
Hormones are associated with certain kinds of cancer, espe-cially in the liver. Factors that are supposed to play a role inhepatocellular carcinoma are p53 (tumor suppressor protein) andv-myb and were summarized as oncogenes [7,11,26,33,50].
All selected target genes were composed to functional groupsin Table 1.
2.6. Primer design and primer testing
All primers were designed using published nucleic acidsequences of GenBank (http://www.ncbi.nlm.nih.gov/entrez/query.fcgi). Primer design and optimization was done withHUSAR program at DKFZ (http://www.genius.embnet.dkfz-heidelberg.de/menu/w2h/w2hdkfz/) with regard to primer dimerformation, self-priming formation and primer annealing tem-perature (60 ◦C). Primer sequences of regulated genes aresummarized in Table 1. New designed primers were orderedand synthesized at MWG Biotech (Ebersberg, Germany).Primer testing was performed with 4 random samples anda negative control (RNAse free water) for each primerset.
2.7. One-step quantitative RT-PCR
Quantitative real-time RT-PCR was performed using Super-Script III Platinum SYBR Green One-Step qPCR Kit(Invitrogen, Carlsbad, USA) by a standard protocol, recom-mended by the manufacture. The master mix was prepared asfollows: For one sample 5 �L 2× SYBR Green Reaction Mix,0.5 �L forward primer (10 pmol �L−1), 0.5 �L reverse primer(10 pmol �L−1) and 0.2 �L SYBR Green One-Step EnzymeMix is used. 6.2 �L of the master mix was filled in the special25 �L tubes and 1 ng �L−1 total RNA in 3.8 �L volume wasadded. Tubes were closed, placed into the Rotor-Gene 3000 andAnalysis Software V5.0 was started (Corbett Life Science, Syd-ney, Australia). The following RT-PCR protocol was used: holdstep I (55 ◦C, 10 min), denaturation step (95 ◦C, 5 min), cyclingprogram (95 ◦C, 15 s; 60 ◦C, 30 s; 68 ◦C, 20 s) hold step II (40 ◦C,20 s) and melting curve analysis. Crossing Points (CP) andmelting curves were acquired by using the “comparative quanti-tation” and “melting curve” program of the Rotor-Gene analysissoftware.
2.8. Agarose gel electrophoresis
All real-time RT-PCR products from primer testing were
applied on a high resolution agarose gel and electrophoresiswas conducted at 90 V for 30 min. Agarose gel was then pho-tographed under UV-excitation to enable analysis of fragmentsize, band intensity and integrity (gel data not shown).gs
ica Acta 586 (2007) 73–81 75
.9. Data analysis and statistics
Quantitative real time PCR data were processed apply-ng relative quantification method using the ��CP-method2ΔΔCP) [27]. Expression changes are shown as relative up-r down-regulation compared to three internal reference genes.or normalization of target gene expression the arithmeticean (AM) of the following non regulated reference genes
RG) were taken: (RG1) glyceraldehyde-3-phosphate dehydro-enase (GAPDH), (RG2) �-actin and (RG3) ubiquitin. Forvery sample gene expression of all three RG were ana-yzed and the mean value served as reference gene index.he measurement of the reference genes showed a signifi-ant up-regulation of GAPDH in muscle tissue and of �-actinnder the influence of MGA the uterus tissue. Only the leftwo reference genes (ubiquitin and �-actin in muscle; ubiq-itin and GAPDH in the uterus) were taken for normal-zation.
In Excel (Microsoft, USA) the regression of ��CP on treat-ent dose was calculated in a linear regression model for MGA,inaplix-H® and Ralgro® over all target genes. Significanceinimum was P < 0.05.In the first step of the ��CP-method the crossing point of
he AM of the reference genes (RG) was subtracted from therossing point (CP) of the candidate gene. From the so calculatedCPs the mean value of the repeat determination was taken to
et the �CP of the treatment. From this �CP the mean valuef �CP of the non treated control was subtracted. The results the ��CP value. In this calculation model the optimal PCRfficiency, representing a DNA doubling after each cycle (E = 2),s assumed. Therefore the expression ratio of a candidate geneompared to the control treatment of the analysis is expected asΔΔCP.
CP = CP(AM) − CP(candidate gene)
CP(treatment) = mean �CP value of repeat determination
CP(control) = mean �CP value of control animals
�CP = �CP(treatment) − �CP(control)
. Results
.1. RNA integrity
In the liver, muscle and uterus the mean ± S.D. RIN val-es were 7.72 ± 0.69, 7.57 ± 1.24, and 7.26 ± 1.81, respectivelybox plots shown in Fig. 1).
.2. Primer testing and gel electrophoresis
Primer pairs of 57 genes were used for qRT-PCR analysis toet single peaks and uniform melting curves, as well as a specificingle bands in agarose gel electrophoresis.

76 M. Reiter et al. / Analytica Chimica Acta 586 (2007) 73–81
Table 1Primer sequences of analyzed target genes with primer length (bp) and analyzed tissue (L = liver, M = muscle, U = uterus, for = forward primer, rev = reverse primer)
Group Primer 5′–3′ Size (bp) Tissue
Angiogenesis Angpt 1 for TTC CTC GCT GCT ATT CTG ACT 194 UAngpt 1 rev TGA CAG CAC TCT CAT GCT GTCAngpt2 for AAT TCA GT CTC CAA AAG CAG C 234 UAngpt2 rev TCC ACC CGT TTC CAT GTCFGF2 for AGC CTT GCA ACT CTG CTT GT 210 UFGF2 rev CGA ATT CAG ATC CCT CCT GAFGF7 for CTG CCA AGT TTG CTC TAC AG 294 UFGF7 rev TCC AAC TGC CAG GGT CCT GATFLK-1 for GCT TCT ACC AGG ACA CTG ACA T 144 UFLK-1 rev AAC ACG GAA TCA CCA CCA CAG TTMMP1 for GAG GAG ACG CTC ATT TTG ATG 235 UMMP1 for ACT GGC TGA GTG GGA TTT TGMMP2 for CCC AGA CAG TGG ATG ATG C 237 UMMP2 rev TTG TCC TTC TCC CAG GGT CMMP14 for ACT TGG AAG GGG GAC ACC 232 UMMP14 for AGG GGG CAT CTT AGT GGCTIMP1 for CAT CTA CAC CCC TGC CAT G 231 UTIMP1 rev CAG GGG ATG GAT GAG CAGTIMP2 for GGG TCT CGC TGG ACA TTG 255 UTIMP2 rev TTG ATG TTC TTC TCC GTG ACCVEGF all for CCG TCC CAT TGA GAC CCT G UVEGF120 rev CGG CTT GTC ACA ATT TTT CTT GTC 280VEGF164 rev GCC CAC AGG GAT TTT CTT GC 278VEGF188 rev TGC CCC TTT CCC TTT CCT C 296VEGF for GGT GGA CAT CTT CCA GGA GTA 177 MVEGF rev CTA TGT GCT GGC TTT GGT GAG
Apoptosis bcl-xl for GGC ATT CAG CGA CCT GAC 203 L, Ubcl-xl rev CCA TCC AAG TTG CGA TCCCasp3 for GCA ACG TTT CTA AAG AAG ACC ATA G 64 UCasp3 rev CCA TGG CTT AGA AGC ACA CAA ATA AFas-L for CAT CTT TGG AGA AGC AAA TAG 205 L, UFas-L rev GGA ATA CAC AAA ATA CAG CCC
Cell cycle CDK2 for CTC ATC GAG TCC TGC ACC G 183 MCDK2 rev GTA GTA TTT GCA GCC CAG AAG GCyclin A for GCT ATC CTC GTG GAC TGG TTA 159 MCyclin A rev AAG CAT AGC AGC AGT GCC CACyclin D1 for GAA GAT GAA GGA GAC CAT CCC 190 MCyclin D1 rev TTG TTC TCC TCT GCC ACT GGMyostatin for GCC TGT CAA GAC TCC TGC GA 173 MMyostatin rev TGT TTG AGC CAG TTC TGC AAC AC
Endocrine factors AR for CCT GGT TTT CAA TGA GTA ACC GCA TG 172 M, UAR rev TTG ATT TTT CAG CCC ATC CAC TGG AER alpha for AGG GAA GCT CCT ATT TGC TCC 234 M, UER alpha rev CGG TGG ATG TGG TCC TTC TCTERbeta for GAG ATA TTC TTT GTG TTG GAG TTT 242 UERbeta rev CTT CGT GGA GCT CAG CCT GTGHR for CCA GTT TCC ATG GTT CTT AAT TAT 136 L, UGHR rev TTC CTT TAA TCT TTG GAA CTG GGR alpha for TTC GAA GAA AAA ACT GCC CAG C 190 L, MGR alpha rev CAG TGT TGG GGT GAG TTG TGIGF1 for CCA AAG GCC AGA CCT ACT TG 180 L, M, UIGF1 rev TCC TCA GAT CAC AGC TCC GAIGF1-R for TTA AAA TGG CCA GAA CCT GAG 314 L, UIGF1-R rev ATT ATA ACC AAG CCT CCC ACIGF-BP3 for ACA GAC ACC CAG AAC TTC TCC T 202 L, M, UIGF-BP3 rev AGA AAC CCC GCT TCC TGC CIR alpha for TCC TCA AGG AGC TGG AGG AGT 89 LIR alpha rev TTT CCT CGA AGG CCT GGG GATIR beta for TCC TCA AGG AGC TGG AGG AGT 111 LIR beta rev TAG CGT CCT CGG CAA CAG GPRLR for AAG GAA GGA GAA ACA CTC ATC CA 203 LPRLR rev AGG TTT GCA GGA GGC TCT G

M. Reiter et al. / Analytica Chimica Acta 586 (2007) 73–81 77
Table 1 (Continued )
Group Primer 5′–3′ Size (bp) Tissue
Energy metabolism ACAD vl for ACT TTG ACG GAG TAC GGG TG 198 LACAD vl rev CAA AGT TGT GAA TTT TCT CCC CAconitase for CAT CCG AGT TGG TCT GAT TG 188 UAconitase rev ACA TCC CTC AGG ATC TGT GCK for ATG ACA GAG CAG GAG CAG CA 183 MCK rev ATG GAG ATG ACT CGG AGG TGEnoyl-CoA for GCT GCT GTC AAT GGC TAT GC 202 LEnoyl-CoA rev ACC AGT GAG GAC CAT CTC CAHK for CAA GAC GCA CCC ACA GTA TCC 211 M, UHK rev TCA CCT CCA GCA GCA TTT CCT TLDH for GTG GCT TGG AAG ATA AGT GG 155 M, ULDH rev ACT AGA GTC ACC ATG CTC C
Inflammatory factors Cox2 for CCT GAT GAC TGC CCA ACA C 162 LCox2 rev AAA TTG ATG GGT GAA GTG CTG GIL1 beta for TTC TCT CCA GCC AAC CTT CAT T 198 LIL1 beta rev ATC TGC AGC TGG ATG TTT CCA TTNF alpha for TAA CAA GCC GGT AGC CCA CG 256 LTNF alpha rev GCA AGG GCT CTT GAT GGC AGA
Muscle function ACTA1 for TAT TGT GCT CGA CTC CGG CGA 160 M, UACTA1 rev GTC ACG AAG GAG TAG CCA CGMYHC-2x for GAT CAA TGC TGA GCT GAC GG 173 M, UMYHC-2x rev CAA TGG TTT CAT CCA GAC CTG C
Oncogenes p53 for GAC TTC TCT CGG CGC CTA CC 191 L, Up53 rev TGG TGC ACT CAG AGT CGA TCv-myb for TCA CGT CCC ATA TCC TGT AGC 170 Lv-myb rev CCT GTC CTT TGA GTT CGT TCT CA
Protein metabolism CAPN 3 for GAC TGG AGC TAT GTG GAC AAG 179 MCAPN 3 rev GTC CAA GTC TGA AGC TTG TCGCAST for GAT CAG AAG TGC TGC TCC A 206 LCAST rev GGA CTG TTT CCT CAT CTT ACCCTSB for GAT CTG CAT CCA CAG CAA 192 L, M, UCTSB for ATG GAG TAC GGT CTG CAA CCCTSL for CAC TGG TGC TCT TGA AGG ACA 183 L, M, UCTSL rev TAA GAT TCC TCT GAG TCC AGG CTAT for ACC CTT GTG GGT CAG TGT TC 167 MTAT rev ACA GGA TGG GGA CTT TGC TG
Transcription factors c-Fos for GCT CCA GGC GGA GAC AGA 302 Lc-Fos rev AGG GTG AAG GCC TCC TCA GAc-jun for TCA ACG CCT CGT TCC TCC 278 Lc-jun rev CTC ATC TGT CAC GTT CTT GGG GCA
Reference genes beta Actin for AAC TCC ATC ATG AAG TGT GAC 202 L, Mbeta Actin rev GAT CCA CAT CTG CTG GAA GGGAPDH for GTC TTC ACT ACC ATG GAG AAG G 197 L, UGAPDH rev TCA TGG ATG ACC TTG GCC CAGUbiquitin 3 for AGA TCC AGG ATA AGG GAA GGC AT 198 L, M, UUbiquitin 3 rev GCT CCA CCT CCA GGG TGA T
Others CyP1A1 for CCG ACC TCT ACA GCT TCA C 181 LTTGACATCT
3
ruaTT
3
u
CyP1A1 rev GCC TCCCALR for TTG ACACALR rev CAG GTT
.3. Gene regulation in liver
Seventeen of the 24 tested target genes were significantlyegulated in liver tissue. Under MGA-treatment, 6 genes were
p- and 2 down-regulated. Finaplix-H® induced in nine genesn up-regulation. Under Ralgro® 4 genes were up-regulated.he increases or decreases of cycle number are shown inable 2.iOFd
TTC ACA TGC TCGCC AGG TGG AG 192 LTAG CAT CAG GGT C
.4. Gene regulation in muscles
Of the 19 measured target genes, 11 were significantly reg-lated in the neck muscle and 8 in the hind limb muscle. MGA
nduced an up-regulation of five genes in the neck muscle.ne gene was up-regulated and five were down-regulated underinaplix-H®. Ralgro® induced an up-regulation in two and aown-regulation in one gene. In the hind limb muscle MGA
78 M. Reiter et al. / Analytica Chimica Acta 586 (2007) 73–81
Table 2Expression changes in liver
Group Factor Treatment ��CP Significance
Energy metabolism EnoylCoA MGAFINAPLIX 0.5 **
RALGROACADvl MGA
FINAPLIX 0.6 **
RALGRO
Apoptosis bcl-xl MGA *
FINAPLIX 0.7 ***
RALGROFasL MGA
FINAPLIX 0.4 *
RALGRO 1.4 ***
Endocrine factors IGF1 MGAFINAPLIXRALGRO 1.4 **
IR alpha MGAFINAPLIX 0.9 *
RALGRO 0.1 *
IR beta MGA 0.4 *
FINAPLIXRALGRO
PRLR MGA 0.8 **
FINAPLIXRALGRO
GR alpha MGAFINAPLIXRALGRO 0.9 ***
GHR MGA 0.9 *
FINAPLIX 1.0 **
RALGRO
Inflammatory factors IL1 beta MGAFINAPLIX 0.8 **
RALGROCox2 MGA −1.3 *
FINAPLIXRALGRO
Protein metabolsim CAST MGA 0.5 *
FINAPLIXRALGRO
CTSB MGAFINAPLIX 1.0 ***
RALGROCTSL MGA 1.2 **
FINAPLIXRALGRO
Oncogene factors p53 MGA −0.7 *
FINAPLIXRALGRO
v-myb MGA 1.8 **
FINAPLIX 1.5 *
RALGRO
Transcription factors c-fos MGA 1.2 *
FINAPLIXRALGRO
Linear regression coefficients of dosages regressed on ��CP with correspond-ing significance level. *P < 0.05; **P < 0.01; ***P < 0.001.
Fa
agFgT
3
1uwtigs
4
dgfi
qtia
baoegi
fl
ig. 1. Results of bioanalyzer based RNA integrity rating across all treatmentsnd tissue samples.
nd Finaplix-H® treatment induced an up-regulation in twoenes and four genes were additionally down-regulated underinaplix-H®. Ralgro® could up-regulate three genes and oneene was down-regulated. All regulations are summarized inables 3 and 4.
.5. Gene regulation in uterus
Significant gene expression in uterus tissue was estimated in3 of the 29 tested target genes. Under the treatment of MGA anp-regulation of three genes and a down-regulation of one geneas found. Finaplix-H® provoked an up-regulation of six genes,
wo genes were down-regulated under this treatment. Under thenfluence of Ralgro® only one gene was up-regulated, threeenes were down-regulated. A summary of the regulations ishown in Table 5.
. Discussion
The effects of three anabolic steroids were examined in fourifferent tissues via mRNA gene expression of specific targetenes with the aim to investigate metabolic pathways and tond useful biomarkers.
The expression of all target genes was determined byRT-PCR, a technique, which allows a rapid and reliable quan-ification of ribonucleic acids. By analyzing the CP of each genen each sample, very precise and exact results of the amount ofnalyzed nucleic acids could be calculated [8].
The outcome of gene expression results is strongly influencedy RNA quality. To exclude the possibility of degraded RNA,ll samples were measured using the lab-on-a-chip technologyf Agilent Bioanalyzer. The samples were analyzed by capillarylectrophoresis in a channel network, based on a nano chip. Theood results for RNA quality showed that RNA is stable and
ntact over years by adequate storage [13,31].The target genes showed very different regulations in theunctional groups and individual tissues and the number of ana-yzed genes was yet too less to have precise conclusions of the

M. Reiter et al. / Analytica Chimica Acta 586 (2007) 73–81 79
Table 3Expression changes in neck muscle. Linear regression coefficients of dosagesregressed on ��CP with corresponding significance level
Group Factor Treatment ��CP Significance
Muscle function ACTA1 MGA 0.6 *
FINAPLIX −0.3 *
RALGROMYHC-2x MGA
FINAPLIX −0.9 *
RALGRO
Cell cycle CDK2 MGA 0.8 *
FINAPLIXRALGRO
Cyclin A MGAFINAPLIXRALGRO 1.7 *
Myostatin MGAFINAPLIX −1.6 *
RALGRO
Endocrine factors ER alpha MGA 0.7 **
FINAPLIXRALGRO −0.5 *
GR alpha MGA 0.5 *
FINAPLIX −1.0 *
RALGROIGF-1 MGA
FINAPLIXRALGRO 1.2 *
IGF-BP3 MGA 1.4 *
FINAPLIXRALGRO
Energy metabolism HK MGAFINAPLIX 0.3 *
RALGROLDH MGA
FINAPLIX −0.9 *
*
sreiem
tp
mtw
4p
ins
Table 4Expression changes in hind limb muscle
Group Factor Treatment ��CP Significance
Muscle function MYHC-2xMGAFINAPLIX −1.0 *
RALGRO
Protein metabolism CTSLMGAFINAPLIX 0.8 *
RALGRO 0.9 ***
Cell cyclus Cyclin AMGA 1.5 **
FINAPLIXRALGRO
Endocrine factors
ARMGAFINAPLIX −0.6 *
RALGRO
GR alphaMGA 0.9 **
FINAPLIX −1.1 ***
RALGRO 0.6 *
IGF-1MGAFINAPLIXRALGRO 1.0 **
Energy metabolism
HKMGAFINAPLIX 0.4 *
RALGRO −0.4 *
LDHMGAFINAPLIX −1.4 ***
RALGRO
Li
Mmpmv[
isslrd
4e
dcaoCT
RALGRO
P < 0.05; **P < 0.01; ***P < 0.001.
pecific pathways. The highest gene expression differences wereecognized in the uterus. The changes in mRNA levels can bexpected because this primary sexual organ is fundamentallynfluenced by sexual hormones. Lower gene expression differ-nces, but still significant, could be shown in liver and the twouscles.Although, at this stage the interpretation of the results seems
o be very difficult, but the first physiologic coherences andotential biomarkers could be identified.
To discover the influence of the anabolic steroids on specificetabolic pathways, the candidate gene expressions in the func-
ional groups under the influence of a specific anabolic agentsere analyzed with the following results.
.1. Potential biomarker for MGA induced expressionattern
First biomarkers for MGA treatment were found in the uterus,n the angiogenesis group with metalloproteinase MMP2 (gelati-ase A) that showed a significant down-regulation parallel to aignificant up-regulation of its inhibitor TIMP2. The collagenase
atic
inear regression coefficients of dosages regressed on ��CP with correspond-ng significance level. *P < 0.05; **P < 0.01; ***P < 0.001.
MP2 depends on the extracellular matrix destruction-relatedolecules, like collagens and laminin. Especially MMP2
lays an important role in cell migration, inflammation andetastasis and the use of synthetic inhibitors of MMPs to pre-
ent disease progression, is an attractive therapeutic strategy16,35].
In the liver MGA influenced the candidate gene expressionn the oncogene group. Studies proofed that tumor suppres-or protein p53 shows abnormalities in tumor cells [7,50]. Theignificant down-regulation of p53 in this study could go onine with this results. Additionally v-myc as oncogene was up-egulated what could mirror a possible effect of MGA on theevelopment of hepatocellular carcinoma [44].
.2. Potential biomarker for trenbolone acetate inducedxpression pattern
Apoptosis is a regulated process leading to programmed celleath, induced by a variety of factors. The central effector in theascade is Caspase 3, which can be activated via an extrinsic andn intrinsic pathway [10]. Fas-L is one of the stimulating factorsf the extrinsic pathway. In our study an increase of Fas-L andaspase 3 could be seen in the uterus under the influence ofBA. In the liver Fas-L was also increased and bcl-xl showed
n up regulation under the same treatment. It can be supposed,hat TBA induced the extrinsic pathway of apoptosis and not thentrinsic, but once again further factors have to be analyzed toonfirm this hypothesis.
80 M. Reiter et al. / Analytica Chim
Table 5Expression changes in uterus
Group Factor Treatment ��CP Significance
Muscle function ACTA1 MGAFINAPLIXRALGRO −1.1 *
Protein metabolism CTSL MGAFINAPLIX 1,4 **
RALGRO
Angiogenese MMP2 MGA −1.5 *
FINAPLIXRALGRO
TIMP2 MGA 2.2 **
FINAPLIXRALGRO
Angpt 2 MGAFINAPLIX −6.1 **
RALGRO
Endocrine factors AR MGAFINAPLIX 1.1 *
RALGROER beta MGA
FINAPLIX −3.8 ***
RALGROIGF-BP3 MGA
FINAPLIX 2.5 **
RALGRO
Energy metabolism HK MGAFINAPLIXRALGRO −6.6 ***
Aconitase MGA 3.0 *
FINAPLIX 0.9 *
RALGRO
Apoptosis Fas-L MGA 1.2 *
FINAPLIX 2.4 *
RALGRO 1.2 *
bcl-xl MGAFINAPLIXRALGRO −0.9 *
Caspase 3 MGAFINAPLEX 1.6 *
RALGRO
Li
2naamiift
gtao
aigs
tl
ttthptd
b
4
iwTsf
tbtogp
tgts
mt
bLE
a
pnt
5
inear regression coefficients of dosages regressed on ��CP with correspond-ng significance level. *P < 0.05; **P < 0.01; ***P < 0.001.
The decrease of muscle protein expression (ACTA1, MYHC-x) in muscle and the uterus under the influence of TBA wasot expected because of the supposed anabolic effect. Anabolicgents are expected to retain nitrogen so that it is additionallyvailable for muscle protein synthesis, but only under the treat-ent of the gestagen MGA an increase of �-actin was noticed
s the muscle. A possible explanation might be our analysis ofso-forms in qRT-PCR because various �-actin and myosin iso-orms are abundant (�-actin: smooth muscle, MYHC2a), so thathese factors could be affected by anabolic agents.
In the muscle the candidate genes of the energy metabolism
roup, HK and LDH showed an inverse regulation under thereatment of TBA. HK was up-regulated, LDH down-regulatednd in the uterus aconitase was up-regulated what would pointut an increased glycolysis and citric acid cycle without anet
ica Acta 586 (2007) 73–81
naerob utilization of glycose. This result is approved by thenfluence of TBA on EnoylCoA and ACADvl in liver. Bothenes were significantly up-regulated and confirm the lypolysistimulation of anabolic steroids.
CTSL, factor of the protein metabolism was increased in allissues under all three treatments. CTSB was only increased iniver under the influence of TBA.
In the kidney of rats, an increased of CTSB under estradiolreatment was found, with the inverse effect under testosteronereatment [23]. Studies with CTSL knockout mice have shown,hat it is involved in the epithelial cell differentiation in the skinair, hair follicles and the bone [32,46]. The increasing effect onroteolytic factors was not expected but other studies supposehat CTSL, CTSB and calpains not directly influence the proteinecomposition but rather function as regulating factors [21,34].
All these specified candidate genes can be seen as firstiomarkers for a TBA screening pattern.
.3. Potential biomarkers for zeranol expression pattern
Many studies have shown that IGF1 plays an important rolen muscle development and growth. Mouse lines lacking IGF1ere characterized by underdevelopment of muscle tissue [2].he increase of IGF1 and IR� in liver and IGF1 in musclehowed the stimulating influence of zeranol on these endocrineactors, approved in previous studies [1,9,14,20].
Also zeranol showed an influence on the gene expression inhe apoptosis group. In uterus and liver Fas-L was up-regulatedut bcl-xl showed a down-regulation in uterus. Further genes ofhe apoptosis pathway have to be analyzed to get a clear resultf zeranol regulation in apoptosis but anyhow these candidateenes can be taken as first biomarker for a zeranol screeningattern.
Not all functional groups and gene regulations were men-ioned because until now the coherence between these candidateenes would be a guess. More candidate genes depending tohese groups have to be analyzed to avoid speculations of pos-ible pathways and regulations.
With regard to possible biomarkers, the uterus seems to be theost adequate tissue for screening patterns because it showed
he highest expression coefficients.As MGA-biomarker MMP2, TIMP2, p53 and v-myb could
e considered. A screening pattern for TBA could include Fas-, Caspase3, bcl-xl, ACTA1, MYHC-2x, HK, LDH, Aconitase,noylCoA, ACADvl, CTSB and CTSL.
Biomarker for a zeranol pattern would be Fas-L, bcl-xl, IGF1nd IR�.
Also the candidate genes of the endocrine group have highotential to be included in such patterns but further analysis areeeded to get a clearer insight of their regulation under anabolicreatment.
. Conclusion
This feasibility study clearly showed that the analysis of genexpression via qRT-PCR is a new and promising method to iden-ify effects of anabolic agents in animal tissue. Especially the

Chimi
up
aabs
sa
R
[[
[
[[
[
[
[
[
[
[
[
[
[[[[
[[
[[
[
[
[[
[[
[
[
[[
[
[
[
[[[
[
M. Reiter et al. / Analytica
terus with the highest expression differences, seems to be aromising tissue.
It has to be pointed out that the study conditions like the breed,ge and nutrition of the animals, may affect in the expressions well, so that additional experiments are required to find sta-le biomarkers and metabolic pathways that are unaffected ofurrounding conditions.
The ambitions for the future should be the identification ofpecific gene patterns for groups of anabolic agents in order thatbuses can be uncovered.
eferences
[1] G.R. Adams, Br. J. Sports Med. 34 (6) (2000) 412–413.[2] G.R. Adams, Invited Review, J. Appl. Physiol. 93 (3) (2002) 1159–1167.[3] B. Alberts, D. Bray, J. Lewis, M. Raff, M., K. Roberts, J.D. Watson, in:
Molekularbiologie der Zelle; 3. Auflage, 1. korr. Nachdruck (VCH), 1997.[4] J.K. Apple, M.E. Dikema, D.D. Simms, G. Kuhl, J. Anim. Sci. 69 (1991)
4437–4448.[5] M. Beato, Cell 56 (1989) 335–344.[6] S. Bogdanovich, T.O. Krag, E.R. Barton, L.D. Morris, L.A. Whittemore,
R.S. Ahima, T.S. Khurana, Nature 420 (2002) 418–421.[7] D.G. Brachman, D.E. Halahan, M.A. Beckett, D.W. Yandell, R.R. Weich-
selbaum, Cancer Res. 51 (1991) 6393–6396.[8] S.A. Bustin, A–Z of Quantitative PCR. IUL Biotechnology Series, 2004.[9] S.A. Coolican, D.S. Samuel, D.Z. Ewton, F.J. McWade, J.R. Florini, J.
Biol. Chem. 272 (10) (1997) 6653–6662.10] Cell Signaling Technology, Catalog and technical reference, 2005–2006.11] C.N. DıArville, P.J. Johnson, J. Steroid Biochem. Mol. Biol. 37 (6) (1990)
1007–1012.12] A. Daxenberger, D. Ibarreta, H.H.D. Meyer, Hum. Reprod. Update 7 (3)
(2001) 340–355.13] S. Fleige, M.W. Pfaffl, Mol. A Med. 27 (2006) 126–139.14] D.A. Fryburg, L.A. Jahn, S.A. Hill, D.M. Oliveras, E.J. Barrett, J. Clin.
Invest. 96 (4) (1995) 1722–1729.15] M. Hageleit, A. Daxenberger, W.D. Kraetzl, A. Kettler, H.H.D. Meyer,
AMPIS 108 (2000) 847–854.16] K. Hashizume, T. Takahashi, M. Shimizu, J. Todoroki, A. Shimada, M.
Hirata, T. Sato, A. Ito, J. Reprod. Developm. 49 (1) (2003) 45–53.17] J.W. Ho, J.Z. Song, Y.K. Leung, Curr. Med. Anti-Canc. Agents 5 (2) (2005)
131–135.18] D.W. Hunt, D.M. Henricks, G.C. Skelly, L.W. Grimes, J. Anim. Sci. 69
(1991) 2452–2462.19] N. Ishiguro, T. Ohzono, T. Shingawa, M. Horiuchi, M. Shingawa, J. Biol.
Chem. 269 (43) (1994) 26822–26829.20] B.J. Johnson, M.R. Hathaway, P.T. Anderson, J.C. Meiske, W.R. Dayton,
J. Anim. Sci. 74 (1996) 372–379.
[[[
ca Acta 586 (2007) 73–81 81
21] H. Kirschke, A.J. Barrett, N.D. Rawlings, Protein Profile 2 (14) (1992)1581–1643.
22] M. Kleinova, P. Zoellner, H. Kahlbacher, W. Hochsteiner, W. Lindner, J.Agric. Food Chem. 50 (2002) 4769–4776.
23] P. Kugler, G. Vornberger, Histochemistry 85 (2) (1986) 157–161.24] I.G. Lange, A. Daxenberger, H.H.D. Meyer, AMPIS 109 (2001) 53–65.25] S.J. Lee, A.C. McPherron, Curr. Opt. Genet. Dev. 9 (1999) 604–607.26] M.E. Lippman, in: J.D. Wilson, D.W. Foster (Eds.), Textbook of
Endocrinology, 7th ed., 1985, pp. 1309–1326.27] K.J. Livak, T.D. Schmittgen, Method 25 (2001) 402–408.28] H.H.D. Meyer, Handbook of experimental pharmacology, in: M. Oettel,
E. Schillinger (Eds.), Estrogens and Antiestrogens, vol. 135/II, Springer-Verlag, Berlin, Heidelberg, 1999.
29] H.H.D. Meyer, APMIS 109 (2001) 1–8.30] C. Moran, J.F. Quirke, D.J. Prendiville, S. Bourke, J.F. Roche, J. Anim.
Sci. 69 (1991) 4249–4258.31] O. Mueller, S. Lightfoot, A. Schroeder, Agilent Technologies, 2004. Appli-
cation 5989-1165EN.32] K. Nakashima, T. Komatsu, M. Yamazaki, H. Abe, J. Nutr. Sci. Vitaminol.
51 (4) (2005) 248–253.33] S.A. Ness, Biochem. Biophys. Acta 12788 (1996) F123–F139.34] Y. Ono, K. Kakinuma, F. Torii, A. Irie, K. Nakagawa, S. Labeit, K. Abe, K.
Suzuki, H. Sorimachi, J. Biol. Chem. 279 (4) (Jan 23 2005) 2761–2771.35] A. Pardo, M. Selman, Int. J. Biochem. Cell Biol. 37 (2005) 283–288.36] M.W. Pfaffl, A. Daxenberger, M. Hageleit, H.H.d. Meyer, J. Vet. Med. A
49 (2002) 57–64.37] M.W. Pfaffl, I.G. Lange, H.H.D. Meyer, J. Steroid Biochem. Mol. Biol. 84
(2003) 159–166.38] H. Penzlin, Lehrbuch der Tierphysiologie, 7, Auflage, Elsevier, Spektrum
Akademischer Verlag, 2005.39] T. Pollard, W. Earnshaw, Cell Biology, Saunders, 2002.40] J. Pottier, C. Cousty, R.J. Heitzman, I.P. Reynolds, Xenobiotica 11 (1981)
489–500.41] D. Randall, W. Burggen, K. French, W.H. Eckert, Animal Physiology,
Freeman and Company, 2002.42] P.J. Reeds, S.M. Hay, P.M. Dorward, R.M. Palmer, Br. J. Nutr. 56 (1986)
249.43] I. Richard, C. Roudaut, S. Marchand, S. Baghdiguian, M. Herasse, D.
Stockholm, Y. Ono, L. Suel, N. Bourg, H. Sorimachi, G. Lefranc, M.Fardeau, A. Sebille, J.S. Beckmann, J. Cell Biol. 151 (7) (2000) 1583–1590.
44] F.J. Rose, Environ. Qual. Saf. Suppl. 5 (1976) 227–237.45] H. Sorimachi, S. Ishiura, K. Suzuki, Biochem J. 328 (1997) 721–732.46] D.J. Tobin, K. Foitzki, T. Reinheckel, L. Mecklenburg, V.A. Botchkarev,
C. Peters, R. Paus, Am. J. Pathol. 160 (5) (2002) 1807–1821.47] J. Vandekerckhove, G. Bugaisky, M. Buckingham, J. Biol. Chem. 261 (4)
(Feb 5 1986) 1838–1843.48] J. Vandekerckhove, K. Weber, J. Mol. Biol. 126 (4) (Dec 25 1978) 783–802.49] D. Voet, J.G. Voet, C.W. Pratt, Lehrbuch der Biochemie, Wiley-VCH, 2002.50] P. Zhe, K. Hoguen, J. Bong Kyun, L. Woo Jung, P. Chanil, Cancer 80 (1997)
865–872.

Appendix II
71

1BIOTECHNOL. & BIOTECHNOL. EQ. 22/2008/3
SHORT COMMUNICATIONS
Keywords: real-time qRT-PCR, position effects, plate type, sealing system
IntroductionPolymerase chain reaction (PCR) has become an important tool in molecular diagnostics, so also the range of products for PCR analysis has increased (4). Nowadays various real-time PCR instruments from different providers are available. Two main instrument platforms exist, the plate (96-well, 384-well) or rotor systems (32-well, 36-well, 72-well, 100-well). Additionally the instruments have different light sources, detection systems, thermocycling mechanism and software (2).
Especially for the plate systems various plastics consumables are available. From tubes to strips with caps, 96-well plates, 384-well plates, transparent or white, with adhesive or heat sealing fi lm, the customer has a wide range of possibilities. White PCR plates are often recommended by the manufacturers because of lower autofl uorescence and to achieve better quantifi cation results (5).
It is known that positional effects on plates can appear during a PCR run, which can occur between different wells, columns or rows (7). This can increase the variation of measured fl uorescence and therefore signifi cantly infl uence the resulting PCR quantifi cation.
In this study the effects of plate type and the sealing system on qPCR results should be investigated. Additionally possible positional effects on 96-well plates should be regarded. Two types of 96-well plates (white and transparent) and different sealing systems (self adhesive and heat sealing) were analysed in different real-time PCR instruments: iQ5 (Bio-Rad, Hercules, U.S.A) and ep realplex (Eppendorf, Hamburg, Germany) 96-well platforms.
A fi rst experiment was done to show possible position effects of a 96-well plate and to calculate heterogeneity of a qPCR run. A second experiment was performed to show the differences in qPCR effi ciency between transparent and white plates. In both experiments different sealing systems were used to compare the differences between adhesive and heat sealing fi lms.
Material and MethodsExperiment 1Position and plate effects were analysed using transparent and white semi-skirted, 250μl, twin.tec PCR plate 96 (Eppendorf). Plates were sealed using adhesive PCR fi lm and heat sealing fi lm (Eppendorf). Real-time amplifi cation and quantifi cation was done in the iQ5 (Bio-Rad) and in the Mastercycler ep realplex (Eppendorf) systems. One biological sample was measured in 96 replicates to evaluate the intra-run variability (n=96), analysing one transcript. All measurements were repeated in three plate replicates to evaluate the inter-run differences (n=3).
Experiment 2Infl uence of plate type was analysed in a second experiment, using transparent and white semi-skirted, 200μl, Thermo-Fast 96-well PCR plates (ABgene, Surrey, UK). Plates were cut in three-column peaces, wherefore both the transparent and the white plate parts could be measured in parallel in one PCR run (Fig. 1). Plates were sealed using adhesive PCR fi lm (ABgene) and real-time amplifi cation and quantifi cation was done in the iQ5 real-time system (Bio-Rad). Each column included the standard curve (S1-S6:107-102 copies), the unknown biological sample (U) and a non template control (NTC, RNAse free water). On one plate type the measurement was so repeated
EFFECTS OF PLATE POSITION, PLATE TYPE AND SEALING SYSTEMS ON REAL-TIME PCR RESULTS
M. Reiter, M. Pfaffl Physiology Weihenstephan, TU München, Weihenstephaner Berg 3, D-85354 FreisingCorrespondence to: Martina ReiterE-mail:[email protected]
ABSTRACTReal-time PCR has become an important tool for quantitative nucleic acids analysis. By now, a wide rang of real-time PCR instruments; PCR plastic consumables and sealing systems are available. In this study both transparent and white plates were taken to test possible position and plate effects on quantitative PCR results on different real-time platforms: ep realplex (Eppendorf, Hamburg, Germany) and the iQ5 (Bio-Rad, Palo Alto, USA). Heat and adhesive sealing was used to compare sealing systems. Heterogeneity in Ct values was calculated to show possible effects of plate type and sealing system. Heterogeneity in amplifi cation effi ciency should show possible positional effects of 96-well plates.White plates showed higher amplifi cation effi ciency because of higher fl uorescence refl ection. This had no signifi cant effect on the PCR effi ciency but on the sensitivity of the quantifi cation assay. Constant positional effects concerning wells, columns or rows could not be detected.

2 BIOTECHNOL. & BIOTECHNOL. EQ. 22/2008/3
six times (n=6) within one run. The experiment was repeated three times (n=3).
Fig. 1. Plate setup of experiment 2 for the measurement of transparent and white plates in one run. Adhesive PCR fi lm was taken for sealing. Baseline and threshold adjustment was calculated for each column peace separately by the iQ5 optical system software, version 2.0 (Bio-Rad). S1-S6 contain the standard curve from 107 to 102 start copies, U represents the unknown biological sample and NTC the non-template control consisting of RNAse free water. Column setup was consistent over the entire plate.
Biological sample and standard curveTotal RNA was isolated from m. triceps of macaca fascicularis using TriFast (peqLab Biotechnologie GmbH, Erlangen, Germany). The standardized protocol from the supplier was used for the extraction. To quantify total RNA concentration, optical density (OD) was measured with the Nanodrop (peqLab). Total RNA integrity and quality control was performed with the Bioanalyzer 2100 (Agilent Technology, Palo Alto, USA) (3).For the standard curve of experiment 2 the RT-PCR product of experiment 1 was collected. For DNA extraction and purifi cation Wizard SU Gel and PCR Clean-Up System from Promega (Madison, USA) was used. DNA concentration was measured with the Nanodrop (PeqLab) and the standard curve down to 100 copies was generated.
Reverse transcription and quantitative PCRReverse transcription was done with 1μg total RNA using 5xRT buffer, dNTPs (10mM), random hexamer (50μM) primers and 200 U/μl M-MLV Reverse Transcriptase, RNase H minus (Promega, Madison, U.S.A). PCR was performed using MESA GREEN qPCR MasterMix Plus for SYBR Assay No ROX w/ fl uorescein Kit (Eurogentec, Köln, Germany). Total PCR reaction volume was 15μl. In both experiments cathepsin L (CTSL) transcript was quantifi ed. Pipetting was performed using the CAS-1200 robot and conductive pipette tips using liquid level sensing (LLS) technology (Corbett Life Science, Sydney, Australia).
Data analysis and statisticsIn the iQ5 Ct-values and amplifi cation data were analysed using the Bio-Rad iQ5 optical system software, version 2.0
(Bio-Rad). Ct values were determined with “PCR Base Line Subtracted Curve Fit” analysis method of the software, using fl uorescein normalized data.
In the ep realplex instrument data were analysed using eppendorf realplex software, version 1.5 (Eppendorf). Ct-value was calculated using “Noiseband” algorithm of the instrument software.
Calculation of amplifi cation effi ciency in experiment 1In the fi rst experiment amplifi cation effi ciency was calculated as a value of the second derivative in its local discrete maximum after the amplifi cation data was smoothed with a sigmoid fi t (8) as follows.
Where the a (plateau height), b (slope), n0 (infl exion point of curve), are the obtained parameters of the fi tted smoothing model. The natural logarithm base is described by e, n shows the actual fl uorescence number and y0 shows the ground fl uorescence.
Calculation of PCR effi ciency in experiment 2In the second experiment PCR effi ciency (E) of the qPCR reaction was calculated by the instruments software, on the basis of the slope of the standard curve and the equation:
E= 10-1/slope - 1
Results and DiscussionHeterogeneity in Ct values in experiment 1In both instruments the transparent, adhesive sealed plates showed the highest Ct variations (Table 1). The iQ5 instrument showed lower inter-run standard deviations (S.D=0.28) within the different plate setups compared to the ep realplex (S.D.=0.40);(p-value=0.302). This may be the advantage of fl uorescein normalized Ct data. For the iQ5 instrument the use of special fl uorescein kits is recommended to decrease data variability. In other instruments ROX dye can be taken if problems with high data variations appear.
Heterogeneity in amplifi cation effi ciency in experiment 1No pattern or signifi cant homogenous position effects (wells, columns, rows) could be detected within the different runs and instruments on the 96-well plates in experiment 1 (Fig. 2a, 2b).
The amplifi cation effi ciency (AE) was signifi cantly higher in the white plates than in the transparent plates (p-value=0.001), due to the better fl uorescence refl ection in the white plates. There were no signifi cant differences between the amplifi cation

3BIOTECHNOL. & BIOTECHNOL. EQ. 22/2008/3
TABLE 1Intra-run and inter-run variations were calculated for the Ct values and the amplifi cation effi ciency (AE). Additionally standard deviations (S.D.) and coeffi cients of variation (C.V.) of all runs were determined for the iQ5 and the ep realplex for the transparent, heat sealed plates, (hsEPD), the white, heat sealed plates (hsEPW), the transparent, adhesive sealed plates (asEPD) and the white, adhesive sealed plates (asEPW).
iQ5 intra-run data intra-run data intra-run data inter-run dataCt Ct S.D. C.V. (%) Ct S.D. C.V. (%) Ct S.D. C.V. (%) Ct S.D. C.V. (%)AE AE S.D. C.V. (%) AE S.D. C.V. (%) AE S.D. C.V. (%) AE S.D. C.V. (%) hsEPD Ct 26.35 0.20 0.75 24.60 0.15 0.60 24.56 0.16 0.65 25.17 0.17 0.67AE 75.50 9.88 13.09 86.60 6.46 7.45 73.90 5.74 7.77 78.67 7.36 9.36 hsEPW Ct 26.38 0.16 0.62 24.50 0.18 0.74 24.45 0.32 1.31 25.11 0.22 0.89AE 1213.60 82.02 6.76 1375.20 80.55 5.86 1411.60 139.61 9.89 1333.47 100.73 7.55 asEPD Ct 25.23 0.19 0.76 25.25 0.79 3.12 25.12 0.69 2.74 25.20 0.56 2.21AE 73.20 10.09 13.79 72.10 14.40 19.97 72.50 10.54 14.54 72.60 11.68 16.08 asEPW Ct 24.71 0.14 0.55 25.17 0.19 0.74 25.15 0.17 0.67 25.01 0.16 0.65AE 1261.70 79.62 6.31 1285.20 84.74 6.59 1246.20 98.89 7.94 1264.37 87.75 6.94 EPW 25.06 0.19 0.77 EPD 25.18 0.36 1.44 hs 25.14 0.19 0.78 as 25.10 0.36 1.43
realplex hsEPD Ct 25.11 0.25 1.01 24.56 0.44 1.77 25.15 0.41 1.65 24.94 0.37 1.48AE 122.30 25.00 20.44 120.30 22.33 18.56 133.10 27.01 20.29 125.23 24.78 19.79 hsEPW Ct 24.10 0.48 1.98 23.95 0.38 1.57 22.49 0.17 0.76 23.51 0.34 1.44AE 1911.30 354.10 18.53 2013.10 345.81 17.18 2410.42 162.89 6.76 2111.61 287.60 13.62 asEPD Ct 23.36 0.52 2.23 23.71 0.70 2.96 23.83 0.33 1.40 23.63 0.52 2.20AE 181.55 28.68 15.80 188.30 19.90 10.57 177.80 24.79 13.94 182.55 24.46 13.40 asEPW Ct 22.55 0.49 2.17 22.60 0.34 1.50 22.99 0.23 1.00 22.71 0.35 1.56AE 3003.3 211.679 7.05 2916.20 301.80 10.35 2897.60 218.88 7.55 2939.03 244.12 8.31 EPW 23.11 0.35 1.50 EPD 24.29 0.44 1.84 hs 24.23 0.35 1.46 as 23.17 0.44 1.88

4 BIOTECHNOL. & BIOTECHNOL. EQ. 22/2008/3
effi ciencies between the instruments, comparing transparent and white plates (p-valuetransparent=0.113: p-valuewhite=0.098).
Fig.e 2a/2b. Amplifi cation performance on basis of the Ct values determined with the iQ5 instrument (Figure 2a) and with the ep realplex (Figure 2b), using the transparent and adhesive sealed plate. Grey dashed circles show under-expressed, black solid circles over-expressed fl uorescence levels from the plate mean expression. The size of the circles refl ects the differences from the mean. No homogenous position effects (columns, rows) can be recognised.
The amplifi cation effi ciency (AE) was signifi cantly higher in the white plates than in the transparent plates (p-value=0.001), due to the better fl uorescence refl ection in the white plates.
There were no signifi cant differences between the amplifi cation effi ciencies between the instruments, comparing transparent and white plates (p-valuetransparent=0.113: p-valuewhite=0.098).
Heterogeneity in qPCR effi ciency in experiment 2The results of experiment 2 showed in average 5.2 fold higher fl uorescence levels (relative fl uorescence unit) in the white plates compared to transparent. To see if the higher fl uorescence level also induces higher qPCR effi ciency, the standard curves on white and transparent plates were regarded. No signifi cant differences between PCR effi ciencies (p-value=0.437, n=6) could be seen between transparent (Etransparent=97.5%) and white (Ewhite=96.0%) plates.
White plates showed higher slopes of the standard curve (slopewhite=-3.441) than transparent plates (slopetransparent-3.387); (p-value=0.243). This effect induced lower PCR effi ciencies (Fig. 3).
The y-intercept, representing the theoretical threshold cycle to detect one start molecule, trend to be signifi cant between plate types (p-value=0.078). Y-intercept of the white plates was in average 1.109 cycles lower (y-interceptwhite=33.707 cycles) than in the transparent plates (y-intercepttransparent=34.816 cycles). Implementing the calculated mean PCR effi ciencies of the different plate types and the 1.109 cycles difference, an increase in sensitivity by 2.75 fold (n-fold=1.97534.861/1.96033.707) could be indicated.
Therefore the higher autofl uorescence of white plates has benefi cal effects on qPCR sensitivity but not directly on qPCR effi ciency.
Handling Experiment 2 with adhesive sealing fi lm showed time by time evaporated samples within one run mainly at the boarder positions. The fi xing of the sealing fi lm at the plate boarders with the use of a sealing rubber (ABgene, Surrey, UK) could not avoid sample evaporation. Only the use of a special optical compression pad (Bio-Rad) could keep the adhesive sealing fi lm on the plate.
To avoid evaporation of the samples and contamination of the instrument heat sealing systems should be preferred. With
Fig. 3. Standard curves of experiment 2. SYBR (°) shows the mean effi ciency calculation for column 1-3 (transparent), SYBR 1 (♦) for column 4-6 (white), SYBR2 (+) for column 7-9 (transparent) and SYBR 3 (*) for column 10-12 (white), performed on the Bio-Rad iQ5 real-time cycler.

5BIOTECHNOL. & BIOTECHNOL. EQ. 22/2008/3
the heat sealed plates in experiment 1, evaporation of samples was not recognized in one of the samples.
ConclusionValidity of the fi nal experimental mRNA expression results is dependent on the variability of the measurement system. Total data variation appears in every experiment and consists from error accumulation of the different experimental steps, starting at sampling, storage, nucleic acid extraction, reverse transcription, and quantitative qPCR. Possibilities to reduce error accumulation in reverse transcription and qPCR were already shown by Ståhlberg et al. (6).
In this study it was shown that also the selection of PCR plastics consumables and sealing systems can infl uence data variability and sensitivity of the quantifi cation.
White plates showed higher amplifi cation effi ciency because of higher fl uorescence refl ection. This had no signifi cant effect on the effi ciency but on the sensitivity of the quantifi cation assay. White plates are helpful in detection and quantifi cation of low copy numbers in biological samples or when problems with the PCR dye concentration occur.
The sealing system seems to infl uence the variability of the quantifi cation results. Adhesive PCR fi lm sealing allows evaporation during PCR cycling procedure, resulting in high variations of Ct-values.
Regarding possible plate position effects, only single wells showed over or under estimated values from mean amplifi cation effi ciency but the expected border effects could not be shown statistically. In the ep realplex the 96 single LED systems seem to avoid these random effects, in the iQ5 the collection of well to well differences in the beginning of the run seems to be the crucial software tool.
REFERENCES1. Bio-Rad tech note 5266. Improving reliability and
reproducibility of real-time PCR reactions sealed with clear fi lms. Bio-Rad Laboratories, 2005, Bulletin 5266.
2. Dorak M.T. (2006) Real-time PCR. Bios Advanced Methods, Taylor and Francis Group, N.Y., USA.
3. Fleige S., Pfaffl M.W. (2006). Mol A Med 2006, 27: 126-139.
4. Kaltenboeck B., Wang C. (2005) Adv Clin Chem, 40:219-59.
5. 4titude (2008). FRAMEstar®, 96 and 384 well PCR plates. Available via DIALOG www.4ti.co.uk/new%20site/images/4titude%20-%20Framestar.pdf
6. Ståhlberg A., Håkansson J., Xiang X., Semb H., Kubista M (2004) Clin Chem, 50(3):509-15.
7. Sundberg R., Castensson A., Jazin E (2006) Biostat, 7(1):130-144.
8. Tichopad A., Didier A., Pfaffl M.W. (2004) Molecular and Cellular Probes 18, 45-50.

6 BIOTECHNOL. & BIOTECHNOL. EQ. 22/2008/3

7BIOTECHNOL. & BIOTECHNOL. EQ. 22/2008/3

Appendix III
79

First steps towards a new screening method for anabolic androgenic agents in human hair follicle M. Reiter1, S. Lüderwald2, M.W. Pfaffl1, H.H.D. Meyer1
1Physiology Weihenstephan Technische Universität München Weihenstephaner Berg 3 85354 Freising Germany 2Institute of forensic medicine Universität München Nussbaumstr. 26 80336 München Corresponding author: Martina Reiter Physiology Weihenstephan TU München Weihenstephaner Berg 3 85354 Freising [email protected].:+498161713867 Fax:+498161714204
1

Abstract Never before doping has been such a topic as it is today and the interests in more stringent
and periodic doping controls is very high. The existing doping tests are restricted to methods
based on mass spectrometry, analysing the drug in different tissues like urine, blood or hair.
The idea of this feasibility study in hair follicle was to test a possible new way of detecting
anabolic steroids, based on biomarker measurement for different anabolic agents. It is known
that anabolic steroids can influence mRNA expression of certain genes that results in
androgen specific effects. With specific biomarker expression patterns it should be possible
to foster the existing analysis methods. The hair follicle was chosen because it is known to
be influenced by anabolic steroids, and would be easy to be taken for doping controls.
The first aims were to develop a method which makes it possible to analyse gene
expressions in plucked hair follicle samples via quantitative real-time RT-PCR (qRT-PCR).
Additionally it should be analyzed which cell types of the hair follicle are taken by the
plucking procedure. In a first study samples from untreated women and men were taken to
find gender specific differences and in a second study also samples from weight lifters under
doping conditions could be taken and were compared with a control group. As biomarkers,
different androgen dependent target genes expressed in the hair follicle were analyzed: The
steroid receptor group including the androgen receptor (AR), estrogen receptor (ERα) and
glucocorticoid receptor (GR). Additionally the hair cycle factors, the fibroblast growth factors
FGF7 and FGF2 and interleukin1 beta, (IL1β) were analyzed. FasLigand receptor (FasR),
Bcl-2, Caspases 3 and 8 were measured as apoptosis group. 5α- steroidreductase
(SRD5A2) represented the enzyme group. For a relative quantitation three reference genes
beta-actin (ACTB), glycerolaldehyde-3-phsophate-dehydrogenase (GAPDH) and ubiquitin
(UBQ) were taken. To show which part of the hair follicle was taken by plucking, the hair
follicles were haemalaun-eosin stained.
The hämalaun-eosin stain clearly showed that hair follicle cells from the root sheath could be
taken by plucking but without taking the hair bulb that includes the hair papilla. In the first
study no significant gender dependent differences in the regulation of the measured target
genes could be detected. In the second study a down-regulation of the GR could be
calculated in the treated hair samples and FGF7 was only expressed in treated samples.
These results show first promising differences between treated and untreated samples, a
precondition for the development of a possible screening method for anabolic agents. The
ambitions for the future should be the identification of specific biomarker patterns for
functional groups of anabolic agents, in order that abuses can be uncovered.
Key words: anabolic androgenic agents, hair follicle cells, quantitative real-time RT-PCR
2

Introduction The various doping scandals of the cyclist, especially during the “Tour de France 2007”
clearly showed that doping is a big topic in competitive sport and doping controls need to be
more universal in detecting drug misuse. Beside doping methods that increase the oxygen
transport capacity in blood, especially the use of anabolic androgenic agents (AAS) is very
popular. These substances are supposed to increase muscle mass via nitrogen retention
resulting in a better performance (Hartgens et al., 2004; Kuhn 2002). The International
Olympic Committee (IOC) has already banned the use of AAS by athletes in 1974 and
methods for detecting and identifying these substances are developed continuously. Most of
them are mass-spectrometry based, but there are still problems with the doping control
procedure. Tissues like urine, blood and hair are taken for these analyses. They are easy to
be collected and include the drugs or its metabolites. Taking the existing analysis methods
the question how to screen for unknown designer drugs and its metabolites remains open. It
would be helpful to have additional methods which broaden the existing screening spectrum
(Catlin et al., 1997; Schänzer 1996). The effects of xenobiotic steroids in the organism are
well documented and it is known that these testosterone analoga can act via mRNA
expression in the cell, influencing the expression of different genes (Reiter et al., 2006). In
the hair follicle androgenic hormones act via the dermal papilla but also initiate different
expression pathways in the cells of the inner and outer root sheath (Stenn and Paus 2001).
The idea of this feasibility study was to find a way to extract RNA from cells of hair follicle
samples obtained by plucking the hair of the androgen dependent frontal scalp. The
identification of different target genes could then be a possibility to identify a biomarker
pattern. Taking this androgen specific pattern the intake of illegal drugs like testosterone and
other xenobiotic steroids could be possible.
To make sure that cells of the hair follicle can be extracted by plucking the hair, histological
slices were gained and stained to identify the cell types of the hair follicle.
Possible biomarkers (target genes) which are known to be influenced by anabolic agents and
which are expressed in the dermal papilla or hair follicle were taken and separated in
functional groups: Different studies have mentioned the important role of estrogens in the
hair cycle, especially the estrogen receptor alpha (ERα) that mediates catagen induction of
17β-estradiol in the hair follicle. It could be detected not only in the dermal papilla cells but
also in matrix keratinocytes and inner and outer root sheath (Chanda et al., 2000; Ohnemus
et al., 2005). Two other important receptors of the AAS signaling pathways in the dermal
papillae are the androgen receptor (AR) and the glucocorticoid receptor (GR). Through the
binding to the receptors the androgens induce the mRNA expression of different genes
(Lachgar et al.; 1999; Karstila et al., 1994).
3

Factors that inhibit hair follicle growth are the fibroblast growth factor 2 (FGF2) which is
expressed in the hair follicle and interleukin 1β (IL1β) that is located in the epidermis and
cells of the root sheath. Fibroblast growth factor 7 (FGF7) is the antagonist and induces hair
follicle growth (Mitusi et al., 1997; Ota et al., 2002). Also apoptosis factors play a crucial role
in the catagen phase of the hair growth. Bcl-2 was found to be continuously expressed in the
hair papilla and plays a role as a support and signal center, and apoptosis related receptors
like FasR were analyzed in the follicle epithelium. Also other factors of the extrinsic apoptosis
pathway Caspase 3 and 8 were tested (Stenn and Paus 2001).
5α-reductase (SRD5A) is the enzyme that catalyses the transformation of testosterone to 5α-
dihydrotestosterone, an androgen that is supposed to be a mediator of hair loss. Two
isoenzymes type 1 and type 2 exist whereas type 1 is mainly expressed in dermal papilla
cells, type 2 also in dermal fibroblast. Additionally 5α-reductase type 2 is restricted to beard
and frontal scalp (Itami and Inui 2005; Lachgar et al., 1999; Skalba et al., 2006).
4

Material and Methods
Hair follicle extraction
Frontal scalp hair follicle samples were taken from the androgen dependent upper part of the
head. In the first study five hair follicle samples were taken from women and five samples
from men to find possible gender specific differences. In the second study three samples
from weight lifters that are known to take different anabolic agents (testosterone, trenbolone)
could be taken and three hair samples from untreated man served as control.
To get the hair follicle, five to six hairs were penned in a clamp, plucked and cut to ca. 1 cm
length. The hairs were immediately given in a tube filled with lysis buffer (MasterPure RNA
Purification Kit, Epicentre Biotechnologies, Madison, WI, U.S.A.) and shock frozen in liquid
nitrogen. After freezing the samples were stored at -80°C. To extract the RNA from the hair
samples, the MasterPure RNA Purification Kit and protocol (Epicentre Biotechnologies,
Madison, WI, U.S.A.) was used.
To quantify the amount of the extracted total RNA, optical density (OD) was measured with
the photometer (Eppendorf Biophotometer, Hamburg, Germany). RNA purity was calculated
with the OD260/280 ratio.
RNA quality
To get an idea about the RNA quality of the extracted total RNA, RNA integrity and quality
control was performed with the Bioanalyzer 2100 (Agilent Technology, Palo Alto, USA).
Samples from both studies were analyzed and taken as reference for an average RNA
quality. For sample analysis eukaryotic total RNA Nano Assay (Agilent Technology) was
taken and the RNA Integrity Number (RIN) served as RNA quality parameter (Fleige et al.,
2006).
Primer design and testing
All primers were designed using published nucleic acid sequences of Ensembl Genom
Browser (http://www.ensembl.org) and NCBI (www.ncbi.nlm.nih.gov). Primer 3
(http://frodo.wi.mit.edu/) was taken to design and optimize all prime pairs with regard to
primer dimer formation, self-priming formation and primer annealing temperature at 60°C
(table 1). Designed primers were ordered and synthesized at MWG Biotech (Ebersberg,
Germany). All selected target genes were first established in a cell culture study for HFDPC
(hair follicle dermal papilla cell) samples (Reiter et al., manuscript submitted).
5

Real-time qRT-PCR
Quantitative real-time RT-PCR was performed in the Rotor Gene 6000 (Corbett Life Science,
Sydney, Australia) using SuperScript III Platinum SYBR Green One-Step qPCR Kit
(Invitrogen, Carlsbad, USA) by a standard protocol. Samples were diluted to 10ng/µl and
50ng tRNA in 5µl (Invitrogen, Carlsbad, USA) was added to each sample to protect mRNA of
degradation. 38 ng total RNA were taken for one PCR reaction in a total volume of 10µl.
Crossing points (Ct) and melting curves were acquired by using the “quantitation” and
“melting curve” program of the Rotor-Gene 6000 analysis software.
Only genes with clear and single melting peaks were taken for further data analysis. Samples
with irregular melting peaks were excluded from the calculation. All samples were baseline
corrected and threshold was set manually, using same threshold levels for one gene in all
samples.
Histological stain and immunohistochemistry
Hair samples were incorporated in frozen section medium (Richard-Allan Scientific,
Kalamazoo, USA) and prepared using a cryostat mycrotom HM 505E (Micron, Walldorf,
Germany). 6 µm slices of the hair follicles were fixed on the object holder with 100%, -30°C
frozen ethanol and stained in haematoxylin (Sigma, Germany) for 3 min. The histological
slices were blued with tap water, stained in 1% eosin (Sigma-Aldrich, Munich, Germany) for
7 min, washed with 50-100% ethanol and finally given in rotihistol (Sigma-Aldrich, Munich,
Germany). With EUKITT the cover slips were fixed on the object holder and hardened over
night.
Data Analysis and Statistics Data were processed applying relative quantification method comparable to the ΔΔCt-method
(2ΔΔCt) (Livak et al, 2001). For normalization of target gene (TG) expression the arithmetic
mean of the following non regulated reference genes (RG) were taken for the calculation of a
reference gene index (RGI): In study one (RG1) glyceraldehyde-3-phosphate dehydrogenase
(GAPDH) and (RG2) ubiquitin (UBQ), in study two (RG1) ACTB and (RG2) UBQ. For every
sample gene expression of the two RG were analyzed and the mean value served as
reference gene index.
In Excel (Microsoft, USA) all calculations were done. T-test calculations were used to find
gender specific regulations of the target genes. In study one only ΔCt could be calculated
because no control group existed. In study two ΔΔCt and the expression ratio could be
analyzed.
6

ΔCt = Ct (TG) – Ct (RGI)
ΔΔCt = ΔCt - ΔCt (Control)
Ration = 2-ΔΔCt
7

Results
Histological stain
Under the microscope the slices of the plucked hairs showed a clear hair shaft with
accumulated cells that are supposed to be epithelial cells from the root sheath, especially the
outer root sheath. The whole hair bulb is missing what was expected because by plucking
this part remains to build up a new hair (Figure 1).
RNA concentration and quality of hair follicle samples
Mean total RNA concentration of all samples of the first study was 674.6±520 ng,
741.4±546.6 ng in male and 676.8±509.7 ng in female samples. In the second study mean
RNA concentration was 1144±64.4 ng.
The measured RIN values showed and average value of 7.9 what is high enough to expect
good results in qRT-PCR.
PCR analysis of hair follicle samples
In the first study the reference genes GAPDH and UBQ and in the second study the
reference genes ACTB and UBQ were not significantly regulated and could be taken for
statistical calculation.
In the first study the target genes AR, ERα, FGF2, FGF7, IL1β, SRD5A2, FasR, Bcl-2,
Caspase 8 and 9 were measured, in the second study AR, ERα, FGF7, FasR, Caspase 3
and 8. AR, ERα, FGF2, SRD5A2. The melt curve analysis of AR, ERα, SRD5A2 and
Caspase 8 did not show a specific product. FGF7 only showed a specific product in the
treated samples of study two, in the control samples the melt curve analysis showed no
specific peak (Figure2).
Data analysis and statistics
In study 1 none of the measured target genes showed significant differences (p-value<0.05)
between the male and female samples in the first study. In the second study a significant
down-regulation of 41 % for the GR could be calculated (p-value=0.02). For FGF7 the treated
samples had a mean Ct of 23.9 cycles and a mean ΔCt-value of 4.88. This shows a lower
expression compared to the reference genes.
8

Discussion
Different studies have shown that anabolic agents influence hair growth through the dermal
papilla via regulation of different genes in males and females. The gene expression
regulations induced in the papilla also showed effects on growth factors of root sheath cells
(Obana et al., 2007; Randall et al., 1992; Robia et al., 2003). Analyzing these specific
regulations in hair follicle samples could be a new possibility to identify the intake of
forbidden anabolic agents like testosterone and other xenobiotic.
Histological stains of plucked hair follicle samples clearly showed that cells of the root
sheath, especially the outer root sheath could be gained and used for RNA extraction without
taking a skin biopsy. This is a pre-condition for the use in doping analysis because sampling
has to be simple practicable. Samples from the androgen dependent part of the scalp (frontal
scalp hair) were taken to show possible gender specific differences in gene expression. It
was not possible to gain the hair papilla by plucking as expected. This could explain that AR,
ERα and SRD5A2, target genes that are known to be mainly expressed in the hair papilla
could not be detected.
To get hair follicle samples from weight lifters that own up to take anabolic agents is quite
difficult; therefore only three samples could be analyzed and taken for statistical analysis.
However, first significant differences between the treated and untreated samples could be
detected. A first androgen dependent effect could be seen in the expression of FGF7 that
could only be measured in the samples of the treated weight lifters, all untreated samples
from study one and two did not show a specific product in qRT-PCR analysis.
It is known that androgens can bind and act via the GR what can be confirmed by the
significant down-regulation of the receptor in the second study.
The expression of IL1β and Bcl-2 in the first study and FasR in both studies in the inner and
outer root sheath of the hair follicle could be approved. (Karstila et al., 1994; Sohn et al.;
2007, Stenn and Paus 2001).
Summarizing, the development of a sampling and RNA extraction method for hair follicle
samples and the measurement of first target genes, could be successfully accomplished.
9

Conclusion With this study a first step towards a possible new screening method for anabolic androgenic
agents via gene expression analysis could be done, with the aim to support existing, mass
spectrometry based detection methods. Plucking hairs and taking the RNA from the hair
follicle seems to be a practicable method to analyze different gene expression and find
specific biomarkers. A sampling and extraction method could be successfully developed and
first target genes could be analyzed. Differences in gene expression regulations between the
different genders could not be calculated. It seems that only very high androgen
concentrations significantly influence these gene regulations. This effect could be seen in the
expression of FGF7 and the significant regulation of GR only in samples of androgen treated
athletes, what makes these two target genes to first biomarkers of AAS.
These results show first promising differences between treated and untreated samples, a
precondition for the development of a possible screening method for anabolic agents. The
ambitions for the future should be the identification of specific biomarker patterns for
functional groups of anabolic agents, in order that abuses can be uncovered.
10

References Catlin DH, Hatton CK, Starcevic SH. Issues in detecting abuse of xenobiotic anabolic steroids and
testosterone by analysis of athletes´urine. Clinical Chemistry, 1997, 43:7.
Chanda S, Robinette CL, Couse JF, Smart RC. 17beta-estradiol and ICI-182780 regulate the hair
follicle cycle in mice through an estrogen receptor-alpha pathway. Am J Physiol Endocrinol Metab,
2000, 278(2):E202-10.
Fleige S, Pfaffl MW. RNA integrity and the effect on the real-time qRT-PCR performance. Mol A Med
2006, 27: 126-139.
Hartgens F, Kuipers H. Effects of androgenic-anabolic steroids in athletes. Sports Med, 2004,
34(8):513-54.
Itami S, Inui S. Role of androgen in mesenchymal epithelial interactions in human hair follicle. J Invest
Dermatol Symp Proc, 2005, 10(3):209-11.
Karstila T, Rechardt L, Honkaniemi J, Gustafsson JA, Wikströms AC, Karpinnen A, Pelton-Huikko M.
Immunohistocytochemical localization of glucocorticoid receptor in rat skin. Histochemistry, 1994,
102(4):305-9.
Kuhn CM. Anabolic Steroids. Recent Prog Horm Res, 2002, 57:411-34.
Lachgar S, Charveron M, Sarraute J, Mourard M, Gall Y, Bonafe JL. In vitro main pathways of steroid
action in cultured hair follicle cells: vascular approach. J Invest Dermatol Symp Proc, 1999, 4(3):290-5.
Livak KJ, Schmittgen TD. Analysis of relative gene expression data using real-time quantitative PCR
and the 2(-Delta Delta C(T)) Method. Methods 2001, 25:402- 408.
Mitusi S, Ohuchi A, Hotta M, Tsuboi R, Ogawa H. Genes for a range of growth factgors and cyclin-
dependent kinase inhibitors are expressed by isolated human hair follicles. Br J Dermatol, 1997, 137:
693-698.
Obana N, Chang C, Uno H. Inhibition of hair growth by testosterone in the presence of dermal papilla
cells from the frontal bald scalp of the postpubertal stumptailed macaque. Endocrinology, 197,
138:356-361.
11

Ohnemus U, Uenalan M, Conrad F, Handjiski B, Mecklenburg L, Nakamura M, Inzunza J, Gustafsson
JA, Paus R. Hair cycle control by estrogens: catagen induction via estrogen receptor (ER)-α is
checked by ERβ signalling. Endocrinology, 2005, 146:1214-1225.
Ota Y, Sioth Y, Suzuki S, Ozawa K, Kawano M, Imamura T. Fibroblast growth factor 5 inhibits hair
growth by blocking dermal papilla cell activation. Biochem Biophys Res Commun, 2002,
11;290(1):169-76.
Randall VA, Thornton MJ, Hamada K, Messenger AG. Mechanism of androgen action in cultured
dermal papilla cells derived from human hair follicles with varying responses to androgens in vivo. J
Invest Dermatol, 1992, 98:86S-91S.
Reiter M, Walf VM, Christians A, Pfaffl MW, Meyer HHD. Modification of mRNA expression after
treatment with anabolic agents and its usefulness for gene expression-biomarkers. Anal Chim Acta,
2006, 586(1-2):73-81.
Robia CB, Mitteregger G, Aichinger A, Benesch M, Bamberg E. Effect of testosterone and oestradiol-
17β on canine hair follicle culture. J Vet Med, 2003, 50:225-229.
Schänzer W. Metabolism of anabolic androgenic steroids. Clinical Chemistry, 1996, 42:7.
Skalba P, Dabkowska-Huc A, Kazimierczak W, Samojedny A, Samojedny MP, Chelmicki Z. Content of
5-alpha-reductase (type1 and type2) mRNA in dermal papillae from the lower abdominal region in
women with hirsutism. Clin Exper Dermatol, 2005, 31:564-570.
Sohn KC, Jang S, Choi DK, Lee YS, Yoon TJ, Jeon EK, Kim KH, Seo YJ, Park JK, Kim CD. Effect of
thioredoxin reductase 1 on glucocorticoid receptor activity in human outer root sheath cells. Biochem
Biophys Res Commun, 2007, 11;356(11):810-5.
Stenn KS, Paus R. Controls of hair follicle cycling. Pharm Rev, 2001, 81 (1).
12

Appendix Table 1: List of successfully analyzed target genes and reference genes in the hair follicle
samples. Annealing temperature (AT) and the accession number in NCBI (Acces.Nr.) are
listed.
Figure 1: Slice of the plucked hair with the hair shaft (1) and outer root sheath cells (2) which
are clearly outlined by perifollicular sheath cells (3), stained in blue.
Figure 2: Melt curve of FGF7 in study 2 with the melt temperature on the x-axis and the first
derivative of the melt curve on the y-axis. Control samples (green) do not show a specific
product, treated samples (orange) show a specific melt peak at 83°C.
13

Table 1
Identity Sequenz 5´-3´ Amplicon (nt) AT (°C) Acces. Nr.
IL1β FOR GGA CAG GAT ATG GAG CAA CAA G 121 60 NM000576 REV AAC ACG CAG GAC AGG TAC AG FasR FOR TTC TGC CAT AAG CCC TGT CC 174 60 NM000043 REV CCA CTT CTA AGC CAT GTC CTT C Bcl-2 FOR GAG GAT TGT GGC CTT CTT TGA G 170 60 NM000633 REV ACA GTT CCA CAA AGG CAT CCC GR FOR TTC TGC GTC TTC ACC CTC AC 159 60 AH00275 REV CTG TCT CTC CCA TAT ACA GTC C FGF7 FOR CCT GAG CGA CAC ACA AGA AG 167 60 M60828 REV GCC ACT GTC GCT TCC TTA TT UBQ FOR TGA AGA CTC TGA CTG GTA AGA CC 128 60 NM021009 REV CAT CCA GCA AAG ATC AGC CTC GAPDH FOR GAA GGT GAA GGT CGG AGT CAA 233 60 NM002046 REV GCT CCT GGA AGA TGG TGA TG ACTB FOR AGTCCTGTGGCATCCACGAAAC 78 60 NM01101 REV GCAGTGATCTCCTTCTGCATCC
14

Figure 1
3
2
1
Figure 2
15

Appendix IV
95

Gene expression in hair follicle dermal papilla cells after treatment with stanozolol.
M. Reiter1, M.W. Pfaffl1, M. Schönfelder2, H.H.D. Meyer1
1Physiology Weihenstephan Technische Universität München Weihenstephaner Berg 3 D-85354 Freising Germany 2Institute of Public Health Research Technische Universität München Conollystraße 32 D-80809 Munich Germany Corresponding author: M. Reiter Physiology Weihenstephan TU München Weihenstephaner Berg 3 D-85354 Freising [email protected]
1

Abstract Doping with anabolic agents is a topic in sports where strength is crucial, e.g. sprinting,
weight lifting and many more. Testosterone and its functional analogs are the drugs of choice
taken as pills, creams, tape or injections to increase muscle mass and body performance,
and to reduce body fat. Stanozolol (17β-hydroxy-17α-methyl-5α-androst-2-eno[3,2c]pyrazol) is a testosterone analogue with the same anabolic effect like testosterone but its ring
structure makes it possible to take it orally. Therefore, stanozolol is one of the most
frequently used anabolic steroids.
Common verification methods for anabolic drugs exist, identifying the chemicals in tissues,
like hair or blood samples. The idea of this feasibility study was to search for specific gene
expression regulations induced by stanozolol to identify the possible influence of the
synthetically hormone on different metabolic pathways. Finding biomarkers for anabolic
drugs could be supportive of the existing methods and an additional proof for illegal drug
abuse.
In two separate cell cultures, human HFDPC (hair follicle dermal papilla cells) from a female
and a male donor were treated with stanozolol. In the female cell culture treatment
concentrations of 0nM (control), 1nM, 10nM and 100nM were chosen. Cells were taken 0h,
6h, 24h and 48h after stimulation and totalRNA was extracted. Learning from the results of
the pilot experiment, the male cell culture was treated in 10nM and 100nM concentrations
and taken after 0h, 6h, 24h and 72h. Using quantitative real-time RT-PCR expression of
characteristics of different target genes were analysed.
Totally 13 genes were selected according to their functionality by screening the actual
literature and composed to functional groups: factors of apoptosis regulation were Fas
Ligand (FasL), its receptor (FasR), Caspase 8 and Bcl-2. Androgen receptor (AR) and
estrogen receptor (ERα, ERβ) were summarized in the steroid receptor group. The growth
factor group included the insulin like growth factor receptor (IGF1R) and growth hormone
factor (GHR). Fibroblast growth factor 2 (FGF2) and keratinocyte growth factor (FGF7) were
summarized in the hair cycle factor group. 5α-Steroidreductases (SRD5A1, SRD5A2)
represented the enzyme group. Three reference genes were taken for relative
quantification: ubiquitin (UBQ), glycerinaldehyde-3-phsophate-dehydrogenase (GAPDH), β-
actin (ACTB).
In cell culture 1 AR, FasR, FGF2 showed significant regulations within one treatment time,
significant gene expressions over time were analysed for Caspase 8. In cell culture 2 AR,
FasR and SRD5A2 were significantly regulated within one treatment time.
In this feasibility study first biomarker for a screening pattern of anabolic agents could be
identified providing the rationality to investigate modified, metabolic pathways in the whole
hair follicle.
2

Keywords: anabolic agents, hair follicle dermal papilla cells, gene expression, qRT-PCR,
mRNA
3

Introduction Anabolic androgenic steroids (AAS) are misused by athletes because of their anabolic
properties. Main functions of AAS are stimulation of protein synthesis and an antiglucorticoid
effect which increases muscle mass and strength. They influence the central nervous system
and increase motivation and performance (Duntas et al., 2003; Hartgens et al., 2004;
Hickson et al., 1990; Griggs et al., 1989; Kuhn 2002). The International Olympic Committee
banned the use of synthetic AAS in 1974 by athletes but today doping is still a big topic in
almost all kinds of sport. The world anti doping agency (WADA) encourages drug testing
laboratories to develop methods to detect AAS like testosterone, 17β-nortestosterone and
stanozolol that are the most frequently found steroids in doping samples (Kuhn 2002; Clasing
and Mueller 2006; Schänzer 1996). Common used methods in doping analysis are mass
spectrometry (MS) based techniques, that directly detect the AAS or their metabolites in
different tissues like urine, blood or hair samples. Especially the hair is a very interesting
tissue for drug residue analysis because hormones are detectable over a long time and the
samples are easily to collect by a non invasive manner (Gleixner et al., 1996; Catlin et al.,
1997; Thieme et al., 2000; Ayotte 2006; Anielskie et al., 2005; Gambelunghe et al., 2007).
The intake of AAS influences the organism in many different ways. It can be supposed that
these hormonally provoked changes in the metabolism can be seen on the level of mRNA
gene expression (Reiter et al., 2007). Taking the hair root to analyse these expressions it is
known that androgens act via the dermal papilla cells and influence different kind of growth
factors and enzymes (Stenn and Paus 2001).
The aim of this feasibility study was to investigate regulated target genes in hair follicle cells
to identify possible mRNA gene expression regulations aroused by stanozolol. Target genes
were selected in functional groups to facilitate the identification of possible biomarker for the
different hormones.
4

Materials and Methods
Reagent
The anabolic steroid stanozolol (S, 17β-Hydroxy-17α-methyl-androstano[3,2-c]pyrazole), was
received from Sigma-Aldrich (Taufkirchen, Germany) with cell culture grade purity. For
treatment the reagents was dissolved in 100% ethanol to a concentration 1mg/ml and diluted
with cell culture medium to 1nM, 10nM and 100nM.
Experiment
Two HFDPC (hair follicle dermal papilla cell) cultures, one from a female (cell culture 1) and
one from a male (cell culture 2) donor were treated in different concentrations with the
anabolic steroid stanozolol and taken at different treatment time points.
Cell culture 1
Human HFDPC were ordered from Cell Applications (San Diego, USA). Cells had been
cultivated from skin samples of the temple taken during plastic surgery at a 49 year-old,
female patient. After establishing a primary cell culture the cells were frozen in serum-free
freezing medium and sent cryopreserved (500,000 cells in 1ml). A ready-to-use HFDPC
Medium and Supplement Kit (Cell Applications, San Diego, USA) was taken to cultivate the
cells, containing Basal Medium, FCS (fetal calf serum), growth factors and antibiotics. For
sub cultivation served a kit containing HBSS (HEPES buffered saline solution), trypsin/EDTA
solution and neutralizing solution (Cell Applications, San Diego, USA).
The thawed cells were cultivated in collagen coated T-75 flasks (Cell Applications, San
Diego, USA) containing 15ml HFDPC medium at 37°C in a humidified atmosphere of 5%
CO2 and sub-cultivated at 85% confluence. Cells were frozen and stored at -80°C after each
splitting that was up to the sixth passage. For the experiment cells from third passage were
thawed, given into 12-well plates (ca. 3.4x10⁴/well) and cultivated till 85% confluence. Cells
were cultured in triplicates with 0nM (control-treatment), 1nM, 10nM and 100nM stanozolol
groups on each plate, sampling took place at 0h (control-time), 6h, 24h and 48h.
To remove natural containing steroids for all experiments the FCS was stripped by using
charcoal, as described by Darbre et al. (1983).
Cell culture 2
Human HFDPC cells were ordered from Promo Cell (Heidelberg, Germany). Cells had been
cultivated from skin samples of the temple taken during plastic surgery at a 40 year-old, male
patient. After establishing a primary cell culture the cells were frozen in serum-free freezing
medium and sent cryopreserved (500,000 cells in 1ml). A ready-to-use HFDPC Medium and
5

Supplement Kit (Promo Cell, Heidelberg, Germany), containing Basal Medium, FCS (fetal
calf serum), basic FGF and Insulin was additionally ordered to cultivate the cells. For sub
cultivation served a kit containing HBSS (HEPES buffered saline solution), trypsin/EDTA
solution and neutralizing solution (Promo Cell, Heidelberg, Germany).
Cells were cultivated in T-75 flask with 15ml Medium at 37°C in a humidified atmosphere of
5% CO2 and sub-cultivated at 85% confluence. Collagen coating was not executed because
it was not recommended by the supplier. Cells were frozen and stored at -80°C after each
splitting that was up to the sixth passage. For the experiment the cells from third passage
were given into 12-well plates (ca. 3.4x10⁴/well) and cultivated till 85% confluence. Cells
were cultured in triplicates with 0h (control-treatment), 10nM and 100nM stanozolol groups
on each plate, sampling took place 0h (control-time), 6h, 24h and 72h
For treatment, steroids were removed from FCS, as described by Darbre et al. (1983).
RNA extraction and RNA quality
Total RNA was isolated from HFDPC cells using TriFast (peqLab Biotechnologie GmbH,
Erlangen, Germany). The standardized protocol from the supplier was used for the
extraction. The principal of this protocol was phenol/chloroform extraction for total RNA.
Extracted RNA was dissolved in 10 µl RNAse free water. To quantify the amount of total
RNA extracted, optical density (OD) was measured with the photometer (Eppendorf
Biophotometer, Hamburg, Germany) for each sample.
RNA integrity and quality control was performed with the Bioanalyzer 2100 (Agilent
Technology, Palo Alto, USA). For sample analysis eukaryotic total RNA Nano Assay (Agilent
Technology) was taken and the RNA Integrity Number (RIN) served as RNA quality
parameter (Fleige et al., 2006, Schroeder et al., 2006). In order to the expected high quality
of the total RNA from cell cultures, only a set of selected samples from the 6h treatment was
measured as reference.
Selection of target genes
Target genes (TG) were selected according to their possible role in the anabolic pathways in
the hair follicle. Following TG were chosen as markers by screening the respective literature.
Because of the limited total RNA amount, TG were taken for analysis that seemed to be
highly influenced by steroids and could show possible gene expression regulations.
Factors of apoptosis regulation were Fas receptor ligand (FasL), Fas receptor (FasR),
Caspase 8 and the anti-apototic factor Bcl-2. Androgen receptor (AR) and the estrogen
receptors (ERα, ERβ) were summarized in the steroid receptor group. The growth factor
group included the insulin like growth factor receptor (IGF1R) and growth hormone receptor
6

(GHR). Fibroblast growth factor 2 (FGF2) and keratinocyte growth factor (FGF7) were
summarized in the hair cycle factor group. 5α-Steroidreductases (SRD5A1, SRD5A2)
represented the enzyme group.
Ubiquitin (UBQ), glycerinaldehyde-3-phsophate-dehydrogenase (GAPDH) and β-actin
(ACTB) were taken as reference genes for relative quantification method.
Primer design and testing
All primers were designed using published nucleic acid sequences of “Ensembl Genom
Browser” (http://www.ensembl.org) and NCBI (www.ncbi.nlm.nih.gov). Primer design and
optimization was done with primer design program primer 3 (http://frodo.wi.mit.edu/) with
regard to primer dimer formation, self-priming formation and primer annealing temperature at
60°C. Designed primers were ordered, synthesized and shipped by MWG Biotech
(Ebersberg, Germany). Primer testing was performed with a pooled RNA sample of several
hair samples, as positive control and RNAse free water as negative control (Qiagen, Hilden,
Germany) for each primer set. Generated PCR products were checked for length and primer
dimmer formation by an agarose gel electrophoresis. All primer sequences, their amplicon
size and annealing temperatures are illustrated in Table 1.
Real-time qRT-PCR
Quantitative real-time RT-PCR was performed at the Rotor Gene 6000 (Corbett Life Science,
Sydney, Australia) using SuperScript III Platinum SYBR Green One-Step qPCR Kit
(Invitrogen, Carlsbad, USA) by using standard protocol of the supplier. Samples were diluted
to 10ng/µl. For mRNA protection, 50ng tRNA in 5µl (Invitrogen, Carlsbad, USA) were added
to each sample. 38ng of total RNA were taken for one PCR reaction in a total volume of 10µl.
Threshold cycle (Ct) and melting curves were acquired by using the “quantitation” and
“melting curve” program of the Rotor-Gene 6000 analysis software.
Only genes with clear and single melting peaks were taken for further data analysis. Samples
with irregular melting peaks were excluded from the calculation. All samples were baseline
corrected and threshold was set manually, using same threshold levels for one gene in all
samples.
Data Analysis and Statistics Data were processed applying relative quantification method comparable to the ΔΔCt-method
(2-ΔΔCt) (Livak et al., 2001). Expression changes are shown as relative up- or down-regulation
normalized by three internal reference genes. For normalization of target gene expression
the arithmetic mean (AM) of the following reference genes (RG) were taken: (RG1) GAPDH,
(RG2) ACTB and (RG3) UBQ. The mean values served as reference gene index (RGI). RG
7

were excluded when showing significant regulation by treatment or time. This value was then
taken to do normalization and calculate the ΔCt by subtracting the Ct of the RG-Index (RGI)
from the Ct of the target gene (TG).
RGI (cell culture 1) = AM (CtACTB;CtGAPDH;CtUBQ)
RGI (cell culture 2) = AM (CtGAPDH;CtUBQ)
ΔCt = Ct (RGI) – Ct (TG)
In a second step the normalized gene expression values were set in relation to the control
group (ΔΔCt).
ΔCt (control/treatment) = mean ΔCt value of control treatment
ΔΔCt = ΔCt (treatment) – ΔCt (control/treatment)
To show up- and down-regulations of the TG the ratio was calculated provided that DNA was
doubled per cycle (2ΔΔCt).
Ratio = 2ΔΔCt
Regulations over treatment time were calculated using a 2-Way-Anova with SigmaStat
Software. In Excel (Microsoft, USA) ΔΔCt was calculated and statistical analyses were done
by using the t-test. All data are illustrated by means±standard deviation (SD).
8

Results RNA concentration and RNA integrity
Samples of the cell culture 2 showed a slightly higher mean RNA yield (832±209.9ng)
compared to the samples of the cell culture 1 (767.9±225.2ng). For the 6h treatment samples
average RIN values were quite similar in cell culture 1 (8.8±0.5) and in cell culture 2
(8.6±2.9).
Primer testing and PCR
From 19 designed and tested primer pairs three genes did not showed satisfactory PCR
results, concerning verifiability, melting curve analysis and in agarose gel electrophoresis.
Therefore, FasL, ERα and ERβ were excluded from analysis. All other genes were accepted
for further calculations.
Gene regulation under Stanozolol treatment
Because the reference gene ACTB showed a significant regulation under stanozolol
treatment in cell culture 2, only GAPDH and UBQ were taken for RGI calculation.
Gen expression analysis within one treatment time point (ΔΔCt)
In both cell cultures AR showed a significant down regulation after 24h and FasR an up-
regulation after 6h of stanozolol treatment. In cell culture 1 the regulation of AR was seen in
the 1nM concentration (p=0.047), in cell culture 2 in the 100nM concentration (p=0.014).
FasR was up-regulated at 6h for 10nM concentration in cell culture 1 (p=0.023) and cell
culture 2 (p=0.049). Additionally FGF7 was down-regulated at 0h (100nM, p=0.009, 10nM,
p=0.046) and at 6h (100nM, p=0.03) in cell culture 1, in cell culture 2 SRD5A2 (6h, 100nM,
p=0.028) and FGF2 (0h, 100nM, p=0.010) showed a significant down-regulation (figure 1,
figure 2).
Gen expression over treatment time (2-Way-Anova)
In the 2-Way-Anova one significant combination of Caspase 8 to treatment concentration and
treatment time could be calculated in cell culture 1. Caspase 8 in the 1nM concentration was
significantly different from all other concentrations and significant differences between 0h to
6h and 0h to 48h could be measured for this gene.
9

Discussion In the present study it was tested weather the AAS stanozolol induces specific gene
expression regulations in HFDPC. Taking the indicated target genes, first potential
biomarkers for an expression pattern could be identified. As feasibility study the experiments
were done in cell culture to identify a set of target genes possibly interesting for further
analysis in human hair follicle samples.
As expected, all cell culture samples showed a very high RNA quality, a precondition for
good qRT-PCR results.
Significant regulations over the time period of treatment were supposed to show trends in
gene regulations. The separation in different functional groups could help to identify gene
dependent pathways in the hair papilla. Significant influences of stanozolol on gene
expression could be shown up to an incubation time of 24h. After this time the xenobiotic
steroid seems to have less influence on gene expressions. This kind of time dependent gene
expression regulations were also shown in other studies (Black et al. 1992, Schönfelder and
Einspanier, 2003). Most regulations could be seen at 10nM and 100nM. In both cell cultures
AR and FasR showed the same gene expression characteristics under stanozolol treatment
at the same time point of treatment. FasR additionally showed comparable regulations at the
same hormone concentration. This makes AR and FasR to the first biomarkers for a gene
expression pattern of stanozolol. This could show a first gender specific difference because
in the male cells the effects of the treatment seem to induce regulations earlier (6h) than in
the female samples (24h) (Melchert et al., 1992).
Next to the gender specific effects on gene regulation also the growth phase of the hair
follicle could influence the results. A first hind for this assumption could be the different
regulations of FGF2 and FGF7 in the untreated samples in both cultures. FGF7 is known to
induce the growth phase (anagen phase) in the hair follicle, whereas FGF2 could be taken as
its antagonist by inhibiting the morphogenesis (Stenn and Paul, 2001). In cell culture 1 FGF7
was significantly down-regulated what would show that these cells were taken from a hair
follicle in the catagen phase. In cell culture 2 FGF2 was significantly down-regulated,
indicating the anagen phase. Anyhow the significant regulation of FGF2 was a surprise
because several studies identified this factor in the hair follicle but not in the hair papilla
(Mitusi et al., 1997; Ota et al., 2002; Schlake et al., 2005).
The significant regulation of FasR and Caspase 8 in cell culture 1 showed first influences on
metabolic pathways. The regulation of both factors could indicate a possible influence of
stanozolol on the extrinsic way of apoptosis (Reiter et al., 2006).
The significant regulation of IGF1-R is supposed to be an effect of the HFDPC medium
because this was already analysed in different studies before (Philpott et al., 1994, Weger et
al., 2005, Tang et al., 2003).
10

Conclusion In this feasibility study first steps toward a new screening method via gene expression
analysis in hair follicle were explored. A set of 10 genes was tested in cell culture to identify
possible biomarkers and physiological influences of stanozolol in the hair papilla. Factors like
gender and growth phase of the hair follicle seem to influence gene expression patterns in
the cells. Additionally FGF2 known to be expressed in the hair follicle was identified in the
hair papilla. Anyhow AR and FasR can be taken as first potential biomarkers for a stanozolol
treatment pattern because they showed same regulations at the same time point in male and
female cell cultures.
In the future these measured target genes could be used for further analysis in hair follicle
samples taken from athletes to identify possible treatment with anabolic agents. This could
be supportive of the existing test methods in doping analysis and could be an additional proof
for illegal drug abuse.
11

References
Anielski P, Thieme D, Schlupp A, Grosse J, Ellendorf F, Mueller RK. Detection of testosterone,
nandrolone and precursors in horse hair. Anal Bioanal Chem, 2005, 383(6):903-8.
Ayotte C. Significance of 19-norandrostenedione in athletes´urine samples. Br J Sports Med, 2006,
40:25-29.
Black MA, Lefebvre FA, Pope L, Lefebvre YA, Walker P. Thyroid hormone and androgen regulation of
nerve growth factor gene expression in the mouse submandibular gland. Mol Cell Endocrinol, 1992,
84(1-2):145-54.
Catlin DH, Hatton CK, Starcevic SH. Issues in detecting abuse of xenobiotic anabolic steroids and
testosterone by analysis of athletes´urine. Clinical Chemistry, 1997, 43;7:1280-1288.
Clasing D, Müller RK. Dopingkontrolle 2006. 4., überarbeitete Auflage. Bundesinstitut für
Sportwissenschaften, 2006.
Darbre P, Yated J, Curtis S, King RJB. Effect of estradiol on human breast cancer cells in culture.
Cancer Res, 1983, 43:349-354.
Duntas LH, Parisis C. Doping: a challenge to the endocrinologist. A reappraisal in view of the Olympic
Games of 2004. Hormones, 2003, 2(1):35-42
Fleige S, Pfaffl MW. RNA integrity and the effect on the real-time qRT-PCR performance. Mol A Med
2006, 27: 126-139.
Gambelunghe C, Sommavilla M, Ferranti C, Rossi R, Aroni K, Manes N, Bacci M. Analysis of anabolic
steroids in hair by GC/MS/MS. Biomed Chromatogr, 2007, Feb 12.
Gleixner A, Sauerwein H, Meyer HHD. Detection of anabolic β2-adrenoreceptor agonist clenbuterol in
human sclap hair by HPLC/EIA. Clinical Chem, 1996, 42(11).
Griggs RC, Kingston W, Jozefowicz RF, Herr BE, Forbes G, Halliday D. Effect of testosterone on
muscle and muscle protein synthesis. J Appl Physiol, 1989, 66(1):498-503.
Hartgens F, Kuipers H. Effects of androgenic-anabolic steroids in athletes. Sports Med, 2004,
34(8):513-54.
12

Hickson RC, Czerwinski SM, Falduto MT, Young AP. Glucocorticoid antagonism by exercise and
androgenic-anabolic steroids. Med Sci Sports Exerc, 1990, 22(3):331-40.
Kuhn CM. Anabolic Steroids. Recent Prog Horm Res, 2002, 57:411-34.
Livak KJ, Schmittgen TD. Analysis of relative gene expression data using real-time quantitative PCR
and the 2(-Delta Delta C(T)) Method. Methods 2001, 25:402- 408.
Melchert RB, Herron TJ, Welder AA. The effect of anabolic-androgenic steroids on primary myocardial
cell cultures. Med Sci Sports Exerc, 1992, 24(2):206-12.
Mitusi S, Ohuchi A, Hotta M, Tsuboi R, Ogawa H. Genes for a range of growth factgors and cyclin-
dependent kinase inhibitors are expressed by isolated human hair follicles. Br J Dermatol, 1997, 137:
693-698.
Ota Y, Sioth Y, Suzuki S, Ozawa K, Kawano M, Imamura T. Fibroblast growth factor 5 inhibits hair
growth by blocking dermal papilla cell activation. Biochem Biophys Res Commun, 2002,
11;290(1):169-76.
Philpott MP, Green MR, Kealey T. Human hair growth in vitro. J Dermatol Sci, 1994, 7 Suppl:S55-72.
Review.
Reiter M, Walf VM, Christians A, Pfaffl MW, Meyer HHD. Modification of mRNA expression after
treatment with anabolic agents and its usefulness for gene expression-biomarkers. Anal Chim Acta,
2006, 586(1-2):73-81.
Schänzer W. Metabolism of anabolic androgenic steroids. Clinical Chemistry, 1996, 42:7.
Schlake T. FGF signals specifically regulate the structure of hair shaft medulla via IGF-binding protein
5. Development, 2005, 132: 2981-2990.
Schroeder A, Mueller O, Stocker S et al.The RIN: an RNA integrity number for assigning integrity
values to RNA measurements. BMC Mol Biol, 2006, 31(7): 3.
Schönfleder M, Einspanier R. Expression of hyaluronan synthases and corresponding hyaluronan
receptors is differentially regulated during oocyte maturation in cattle. Biol Repord, 2003, 69 (1):269-
277.
13

Stenn KS, Paus R. Controls of hair follicle cycling. Pharm Rev, 2001, 81 (1).
Tang L, Bernardo O, Bolduc C, Lui H, Madani S, Shapiro J. The expression of insulin-like growth
factor 1 in follicular dermal papillae correlates with therapeutic efficacy of finasteride in androgenetic
alopecia. J Am Acad Dermatol, 2003, 49(2):229-33.
Thieme D, Grosse J, Sachs H, Mueller RK. Analytical strategy for detecting doping agents in hair.
Forensic Science International, 2000, 107:335-345.
Weger N, Schlake T. IGF-1 signalling controls the hair growth cycle in the differentiation of hair shafts.
J Invest Dermatol, 2005, 125:873-882.
14

Table 1: List of used primer pairs, showing the length of the amplicon (nt), the melt
temperature (Tm) and the accession number of the sequence.
Figure 1: Significant gene expression regulations in cell culture 1. The ratio was calculated
by 2ΔΔCt whereby the control was set 1 (upper control line). Data are depicted in bars +
standard deviations. Red asterisks (*) mark the significantly regulated target genes.
Figure 2: Significant gene expression regulations in cell culture 2. The ratio was calculated
by 2ΔΔCt whereby the control was set 1 (upper control line). Data are depicted in bars +
standard deviation. Red asterisks (*) mark the significantly regulated target genes.
15

Table 1
Group Identity Sequence 5´-3´ Amplicon (nt)
Tm (°C)
Acces. Nr.
enzymes SRD5A1 FOR CTT GAG CCA TTG TGC AGT GT 166 58 ENST00000233239 REV GCC TCC CCT TGG TAT TTT GT SRD5A2 FOR TGA ATA CCC TGA TGG GTG GT 181 60 ENST00000233139
REV GGA AAT TGG CTC CAG AAA CAT
A growth factors
GHR FOR ATC CAC CCA TTG CCC TCA AC 246 60 NM00163
REV ATC TCA CAC GCA CTT CAT ATT
CC IGF1R FOR CAT TTC ACC TCC ACC ACC AC 151 60 NM000875 REV AGG CAT CCT GCC CAT CAT AC hair cycle FGF2 FOR AGA AGA GCG ACC CTC ACA TC 237 60 M27968 REV ACT GCC CAG TTC GTT TCA GT KGF/FGF7 FOR CCT GAG CGA CAC ACA AGA AG 167 60 M60828 REV GCC ACT GTC GCT TCC TTA TT apoptosis factors
FasR FOR TTC TGC CAT AAG CCC TGT CC 174 60 NM000043
REV CCA CTT CTA AGC CAT GTC CTT C
bcl2 FOR GAG GAT TGT GGC CTT CTT TGA
G 170 60 NM000633 REV ACA GTT CCA CAA AGG CAT CCC Caspase 8 FOR TGG CAC TGA TGG ACA GGA G 230 60 NM001228 REV GCA GAA AGT CAG CCT CAT CC steroid receptors
AR FOR TTG TCC ATC TTG TCG TCT TCG G237 60 L29496
REV TGT CCA GCA CAC ACT ACA CC reference genes
UBQ FOR TGA AGA CTC TGA CTG GTA AGA CC 128 60 NM021009
REV CAT CCA GCA AAG ATC AGC CTC GAPDH FOR GAA GGT GAA GGT CGG AGT CAA 233 60 NM002046 REV GCT CCT GGA AGA TGG TGA TG ACTB FOR AGTCCTGTGGCATCCACGAAAC 78 60 NM01101 REV GCAGTGATCTCCTTCTGCATCC
16

Figure 1
Gene expression regulations in cell culture 1
treatment groups
Control 100nM 10nM 1nM
2ΔΔ
Ct
0
2
4
6
8
10
12
14
16AR-24-hFasR-6hFGF7-0hFGF7-6h Plot 1 Upper control line
**
*
*
*
17

Figure 2
Gene expression regulations in cell cultrue 2
treatment groups
Control 100nM 10nM
2ΔΔ
Ct
0
2
4
6
8
10
12
14
16AR-24hFGF2- 0hSRD5A2-6hFasR-6hPlot 1 Upper control line
*
* **
18

Appendix V
114

Monitoring gene expression in muscle tissue of macaca fascicularis under the influence of testosterone and SARM
M. Reiter, A. Tichopad, I. Riedmaier, M.W. Pfaffl, H.H.D. Meyer
Physiology Weihenstephan
Technische Universität München
Weihenstephaner Berg 3
85354 Freising
Germany
Corresponding author: Martina Reiter
Physiology Weihenstephan
TU München
Weihenstephaner Berg 3
85354 Freising
Tel.: ++49-8161-713867
Fax: ++49-8161-714204
1

Abstract
The focus of this study was to evaluate data on the gene expression profiles induced by
testosterone and a Selective Androgen Receptor Modulator (SARM, TAP Pharmaceutical
Products Inc., Lake Forest, USA) in androgen sensitive muscle tissue in order to get better
understanding on the molecular mechanisms of action and to identify biomarkers for
SARM function in primate organs.
24 male cynomologous monkeys were separated in four groups, a testosterone group, a
SARM1 and SARM10 group and a control group, each consisting of 6 animals. The
testosterone group was treated i.m. with 3.0 mg/kg Testostoviron®-depot-250 (Schering,
Berlin, Germany) every two weeks; the SARM1 and SARM10 group with 1 mg/kg or 10
mg/kg SARM LGD2941 daily, and the control group stayed untreated.
Muscle biopsies from m. quadriceps and m. triceps were collected at three timepoints,
baseline timepoint before SARM application (control) and on day 16 and finally on day 90
of treatment.
Thirty candidate genes were selected according to their functionality by screening the
actual literature and composed to functional groups: cell cycle, endocrine factors, energy
metabolism, muscle fibre proteins, muscle specific transcription factors, protein
metabolism and satellite cell biology. Biomarkers were identified as genes regulated from
baseline in any of the three treatment groups at day 16 or day 90 using ANOVA with
baseline defined as contrast group. From 23 tested candidate genes, 3 were significantly
regulated in m. quadriceps after 90 day treatment, in m. triceps no significant differences
could be identified. As first biomarkers CTSL, CAPN3 and IGFBP3 could be identified and
first physiological differences between control and treatment samples were discovered.
Both the testosterone and the SARM LGD2941 seem to have same effects after 90 day
treatment, so that a longer-term therapy with theses substances would be recommended.
Keywords: testosterone, selective androgen receptor modulator, expression profiling,
candidate gene approach, qRT-PCR
2

1. Introduction
Due to demographic changes in our population sarcopenia and frailty become major Ctics
in health care profession. Already 30% of those over 60 years are affected. Sarcopenia -
the loss of skeletal muscle mass and strength, in both man and women results in high
incidence of accidental falls and can compromise quality of life. Chronic, age related
afflictions like osteoporosis are linked to sarcopenia. The decrease in the production of
hormones such as testosterone, estradiol, growth hormone, insulin like growth factor 1 and
general decline in muscle protein turnover, as well as neuromuscular alterations, are the
major reasons for the appearance of frailty. This results in weakness, impaired mobility
and poor endurance, factors that lower independence and reduce the quality of life [5, 19,
26, 28].
The muscles are affected by the lower endogenous anabolic hormone levels and muscle
protein turnover. Studies have shown that muscle strength, muscle cross-sectional area
decreases and hypotrophy arises [7, 8, 16]. Androgen replacement therapies are the first-
line therapies for osteoporosis and frailty, not only for men also for women [1, 24].
Particularly for women the therapeutic uses of androgens do not only have beneficial
effects because numerous side effects exist [10, 11, 12, 13, 18].
A promising alternative for androgen replacement therapies, including osteoporosis and
frailty, could be the discovery of selective androgen receptor modulators (SARM). SARM
have the ability to mimic the central and peripheral androgenic and anabolic affects of
testosterone without having the negative side effects of the natural hormone [6]. Further
positive properties of now investigated SARM, like the oral activity, increase in muscle
mass and strength and increase in fat-free mass, are important factors for its use as
medicament [20, 22, 29].
Applying anabolic agents, changes in the biochemical pathways are notified in the organs
and tissues. Expression of specific enzymes, receptors and cytokines can be activated or
suppressed on the cellular mRNA expression level. Using appropriate specific and
sensitive quantification methods, such as the quantitative real-time RT-PCR, even minute
expression changes are measurable as a difference in the respective mRNA.
The aim of this study was to show how a SARM in comparison to testosterone may act in
muscle tissues via mRNA expression of different candidate genes. Sufficient plurality of
regulated candidate genes may then serve as biomarkers to show molecular, myogenic
effects of the treatments.
3

2. Materials and Methods 2.1. Animal experiment
The animal husbandry and tissue collection were done by Covance Laboratories GmbH
(Münster, Germany). Groups of 6 male cynomologous monkeys (macaca fascicularis)
were either injected i.m. with 3.0 mg/kg Testostoviron®-depot-250 (Schering, Berlin,
Germany) in 14 days periods (Testo), or orally treated with 1 mg/kg (SARM1) or 10 mg/kg
(SARM10) LGD2941 (TAP Pharmaceutics, Lake Forest, USA) every day. The control
group without any treatment consisted of 6 animals. All monkeys were 5-6 years old and
had an average body weight of 6 kg.
2.2 Sample collection
Muscle biopsies of m. quadriceps and m. triceps were taken at three time points. Control
samples were taken without prior treatment. Further samples were taken at day 16 and
day 90 of treatment. Biopsy samples were placed in kryotubes before freezing in liquid
nitrogen and stored at –80°C until RNA-extraction.
2.3 Total RNA extraction
50 mg of muscle biopsies on baseline time point (control) and 100 mg on the time points
day 16 and day 90 were colleted. Frozen tissue was homogenized in guanidinium
thiocyanate buffer to destroy RNase activity. For the extraction of the RNA a TriFast clean
protocol was used (PeqLab Biotechnologies, Erlangen, Germany ). The principal of this
protocol was phenol/chloroform extraction for total RNA. To quantify the amount of total
RNA extracted, optical density (OD) was measured with the photometer (Eppendorf
Biophotometer, Hamburg, Germany) for each sample. All RNA stem solutions were diluted
to 100 ng/μl for Bioanalyzer analysis and to 1 ng/μl for PCR analysis.
2.4 Analysis of RNA quality
RNA integrity and quality control was done by capillary electrophoresis in a Bioanalyzer
2100 (Agilent Technology, Palo Alto, USA). Eukaryotic total RNA Nano Assay algorithm
was taken for sample analysis and the RNA Integrity Number (RIN) was used to indicate
4

RNA quality [14, 23]. For optimal RNA quality biopsy storage in kryotubes is
recommended.
2.5 Selection of candidate genes
Candidate genes, factors and enzymes were selected if assumed to play an important role
in the myogenic pathways of the analysed tissues. Following 30 candidate genes (TG)
were chosen by screening literature.
Muscle fibre proteins: myosin (MYHC-2x) and α-actin (ACTA1); muscle specific
transcription factors: myogenin and myogenic differenciation factor (MyoD); protein
metabolism group: cathepsin B (CTSB), cathepsin L (CTSL), calpain3 (CAPN3) and
tyrosin-amino-transferase (TAT); factors of cell cycle regulation: cyclin-dependent kinase 2
(CDK2), Cyclin A, Cyclin D1 and myostatin (GDF8); endo- and paracrine group: androgen
receptor (AR), estrogen receptors (ERα, ERβ), growth hormone receptor (GHR),
glucocorticoid receptor (GR), insulin like growth factor 1 (IGF1), insulin like growth factor
receptor 1 (IGF1R), insulin receptor (IR, transcript1), insulin like growth factor binding
proteins (IGFBP3, IGFBP4); energy metabolism group: hexokinase (HK), lactat-
dehydrogenase (LDH), creatinkinase (CK), glucose transporter 4 (GLUT4) and glycogen
phorphorylase (PYGM); satellite cell group: myogenic factors (Myf5, Myf6) and m-
cadherin (CDH15).
As reference genes (RG) beta-Actin (ACTB), Glycerinaldehyd-3-phosphat-Dehydrogenase
(GAPDH) Cyclophilin A (PPIA), Tyrosin3/trypCthan5-monooxygenase activation protein
(YWHAZ), Ubiquitin C (UBC) and 18S RNA primers were tested.
2.6 Primer design and primer testing
Primers were designed using published nucleic acid sequences of the human genome
GenBank (http://www.ncbi.nlm.nih.gov/entrez/query.fcgi). PPIA and ACTB were taken from
the Human Endogenous Control Gene Panel Kit (TATAA Biocenter, Göteborg, Sweden).
Primer design and optimization was done using primer design program of MWG (MWG,
Ebersberg, Germany) with regard to primer dimer formation, self-priming formation and
primer annealing temperature (60°C). Newly designed primers were ordered and
synthesized at MWG Biotech (Ebersberg, Germany) and Invitrogen (Karlsruhe, Germany).
Primer testing was performed on four muscle samples and a negative control (RNAse free
water) for each primer set.
5

2.7 One-step quantitative RT-PCR
Quantitative real-time RT-PCR was performed using SuperScript III Platinum SYBR Green
One-Step qPCR Kit (Invitrogen, Carlsbad, USA) by a standard protocol, recommended by
the manufacture.
Crossing points (CT) and melting curves were acquired by using the “comparative
quantitation” and “melting curve” program of the Rotor-Gene 3000 analysis software. CT is
the equivalent nomenclature of Cycle of threshold used in Rotor-Gene software.
Only genes with clear melting curves were taken for further data analysis. Samples with
irregular melting peaks were excluded from the calculation.
2.8 Data Analysis and Statistics Statistical descriptions of the expression data as well as statistical tests were produced
with SAS v. 9.1.3 for Windows. The raw data was the CT values obtained from each qPCR
sample. Each qPCR sample was associated with a biopsy sample whereas form each
experimental animal two biopsy samples were analysed. Since the amplification efficiency
was not known, the assumption of identical amplification efficiency 100% was made,
allowing more simple quantification model.
The CT values of each gene were averaged by arithmetic mean for each biopsy samples.
The obtained mean CT values were then translated to normalized expression quantities
using all three reference genes in a form of normalization index. The normalization index
was calculated as an arithmetic mean of the CT values of the three reference genes:
reference index = mean (CTPPIA, CTACTB, CTYWHAZ) (1)
Then, an expression of every target gene was calculated relatively to the expression of the
housekeeping gene as:
normalized expression = 2 reference index/ 2 CT target gene , (2)
The 2 represents the 100% amplification efficiency. The normalized expressions of the
timepoints 16 and 90 days were then divided with the normalized expressions of the
baseline, generating the expression ratio R as:
6

R timepoint/baseline = normalized expression timepoint / normalized expression baselinee (3)
The expression ratio R was then analysed statistically. The Box-whisker plot was
constructed to facilitate visual screening of regulated genes (Figure 1-4).
The objective of the statistical analysis was to disclose genes with significant regulation
between control group and any of the treated groups. It was not intended to perform all
treatment-to-treatment tests for all genes in order to avoid statistical type I error (false
positive difference). Hence, ANOVA model was calculated on the log2 transformed R
values employing the SAS procedure GLM with contrast sentence defining the control
group as the contrast group for all treatment groups, thus adjusting the overall test
confidence level to the number of relevant comparisons only. Further adjustment of the
overall confidence level with respect to number of investigated genes was not performed.
Hence, this study is to be considered as purely explorative whereas significant findings
here indicate candidate biomarkers. Tests generating significant (p<0.05) results were
reviewed based on descriptive parameters of the compared groups and visually by means
of the box-whisker plots to disclose possible outliers. As comparable trends were observed
between the three treatment groups, no further tests were produced.
7

3. Results
3.1 RNA quality of muscle tissue
The mean RIN value of control samples was 6.5 for the m. quadriceps and 6.9 for the m.
triceps samples, representing a total RNA of average quality. The m. quadriceps samples
of day 16 had a mean RIN of 7.1, the m. triceps of 7.6. In day 90 m. quadriceps samples
showed a mean RIN of 6.9, m. triceps samples of 7.6.
Control samples showed a higher 5S RNA peak for all samples which may be a hint for
partly degraded total RNA. Because control biopsy samples were directly frozen in liquid
nitrogen, it is supposed that large RNA was partly damaged but the smaller 5S RNA
remained intact. In samples given into kryotubes before freezing in liquid nitrogen, large
RNA was more intact.
3.2 Primer pairs and primer testing Based on the human genome, primer pairs for 30 TG and 6 RG were developed, 23 TG
and 3 RG were successfully running in qRT-PCR (Table 1). Until now nearly no gene
sequences from macaca fascicularis exist and because these sequences seem to be
different from human, some primer pairs did not anneal.
3.3 qRT-PCR results and data analysis
The calculation of the expression ratios (formula 1) produced non-normally distributed data
with frequent extreme values. Some of the extreme values can be outliers and were
indicated in the box-whisker plot as squares outside the beyond inter quartile range (box).
Nonetheless, no exclusion of extreme values/outliers was performed.
In m quadriceps significant differences between the control and treatment could be
identified after 90 day treatment, including CTSL (p=0.0138), CAPN3 (p=0.0625) and
IGFBP3 (p=0.0280) (Figure 1, 2, 3).
There were no significantly regulated genes found in m. triceps. Possible effect of outliers
was investigated and could not be excluded. Only the three significantly regulated genes
on the time point 90 days in m. quadriceps are hence discussed further. Surprisingly the
expression ratio R deviated from the value one in the control group, showing thus
endogenously induced up-regulation throughout the growth period of the animals. This
8

conclusion is supported by the fact that no pronounced regulation was found on the time
point 16 days.
The control group showed also high variability as compared to the treatment groups as
indicated by the box-whisker plot. This reflects the natural variability of the non-induced
expression in each studied subject. In contrast to the control group, in the treated groups
that showed lower R also smaller variability was observed, possibly supporting the
evidence for induced suppressing effect on the individual’s expression.
9

4. Discussion
Aging is associated with many different processes in the body such as muscle atrophy
which corresponds to a loss of muscle tissue caused by decreases in fibre size and/or a
reduction in the number of fibres. So far it has not been understood if this effect depends
on a reduced availability of mRNA, on an energy deficit due to a loss of mitochondria or on
a decrease in nitrogen supply. [2, 27]. For therapies, anabolic steroids and SARM are
investigated to antagonize these effects. To get more information about factors that
influence these muscle reducing pathways and the effect of anabolic agents on muscle
metabolism, gene expression of selected genes was measured using real-time qRT-PCR.
The RNA quality of all samples was sufficient to get satisfactory results in qRT-PCR.
Only a few gene sequences of macaca fascicularis were available in public gene banks so
the gene sequences of homo sapiens and macaca mulatta were used for primer pair
design. In spite of this problem 23 candidate genes could be successfully amplified.
Only gene expression regulations with comprehensible and coherent results are discussed
to avoid speculations. Significant differences between the control and the treatment groups
could only be seen after 90 day treatment.
In m. quadriceps the control samples already showed an expression with a high statistical
spread in the significantly regulated candidate genes what mirrors natural differences
between gene expressions in the individuals. This spread reduced in the treatment groups,
showing a suppression of the individual expression differences induced by the treatment.
This effect could not only be seen in the significantly regulated genes, also IR in m.
quadriceps showed larger spread in the control than in the treatment groups (Figure 4).
This difference in spread was strongly pronounced in the testosterone group, indicating an
inhibitory effect of testosterone on IR expression.
To identify physiological differences between the control and the treatment, only the
significantly regulated IGFBP3, CTSL and CAPN3 are discussed: In skeletal muscle cell
lines four IGFBPs are released: IGFBP-2, -4, -5, -6. IGFBP3 mainly acting as major carrier
of the IGFs in the circulation. Many studies have also shown an inhibitory effect of IGFBP3
on IGF1 and IGF2, Due to its higher affinity to IGF1, it can also prevent IGF1 - IGF1-R
interactions [3, 15, 17, 21]. In this study, IGFBP3 was down-regulated in the treatment
samples what could show a switch-off effect of the inhibiting IGFBP3. Even if IGF1 was not
significantly up-regulated, a blockage of IGFBP3 could increase its functionality in the
organism.
10

In the protein metabolism of the muscle CTSL is induced early in the catabolic states and
an increase of CTSL expression also characterizes muscle wasting. Anabolic steroids like
testosterone increase protein retention and decrease protein catabolism [4]. In this study
the significant down-regulation of CTSL in the treatment confirms this protein retention
effect.
CAPN3 is a member of the three distinct calpains expressed in the muscle. The ubiquitous
calpains 1 and 2 and CAPN3 are members of the Ca2+-activated cysteine proteases but
CAPN3 is known to show inverse regulations compared to the ubiquitous calpains. Many
studies have proofed that a decrease of CAPN3 in directly related to muscle wasting [2, 9].
No studies exist that show an effect of testosterone on calpain expression. In this study
CAPN3 was significantly down-regulated by the treatment as compared to the control.
Such a down-regulation of CAPN3 could also be seen in conditions related to disuse and
denervation of the muscle, an age-related phenomenon [25]. In this study the daily
agitation of the monkeys was not documented but the animals were kept in cages which
might have induced disuse of the muscle and explain the down-regulation of CAPN3 in this
study.
Conclusion In this study both the anabolic steroid testosterone and the SARM LGD2941 showed
effects on the gene expression in the muscle tissues. Significant influences of the
treatments appeared after 90 days only indicating that the differences between the control
group and the treated groups is rather based on suppression of long term natural
development of the studied factors. First influences of the treatments on the protein
metabolism and the muscle growth could be seen via the significant expression of CTSL,
CAPN3 and IGFBP3. These genes can be taken as the first biomarkers for a gene
expression pattern of anabolic steroids.
Acknowledgments
We are indebted to TAP Pharmaceuticals Inc. Lake Forest, USA who initiated and
supported this study.
11

References 1. Bhasin S, Bagatell CJ, Bremner W.J et al. Therapeutic perspective: Issues in Testosterone Replacement
in Older Men. JCEM 1998, 83 (10): 3435-3436.
2. Bartoli M, Richard I. Calpains in muscle wasting. Int J Biochem Cell Biol 2005, 37 (10): 2115-2133.
3. Baxter RC. Insulin-like growth factor (IGF)-binding proteins: interactions with IGFs and intrinsic
bioactivities. Am J Physiol Endocrinol Metab 2000, 278 (6): E967-E976.
4. Bechet D, Tassa A, Taillandier D et al. Lysosomal proteolysis in skeletal muscle. J Biochem Cell Biol
2005, 37: 2098-2114.
5. Bross R, Storer T, Bashin S. Aging and Muscle loss. TEM 1999, 10(5): 194-198.
6. Chen F, Rodan GA, Schmidt A. Development of selective androgen receptor modulators and their
therapeutic applications. Zhonghua Nan Ke Xue. 2002, 8(3):162-8.
7. D'Antona G, Pellegrino MA, Adami R et al. The effect of ageing and immobilization on structure and
function of human skeletal muscle fibres. J Physiol 2003, 552(2): 499-511.
8. D'Antona G, Lanfranconi F, Pellegrino MA et al. Skeletal muscle hypertrophy and structure and function
of skeletal muscle fibres in male body builders. J Physiol 2006, 570(3): 611-627.
9. Dargelos E, Moyen C, Dedieu S. Development of an inducible system to assess p94 (CAPN3) function in
cultured muscle cells. J Biotech 2002, 96: 271-279.
10. Davis S. Androgen Replacement in Women: A Commentary. JCEM 1999, 84(6): 1886-1891.
11. Davis SR. The therapeutic use of androgens in women. J St Biochem Mol Biol 1999, 69:177-184.
12. Deschenes MR. Effects of aging on muscle fibre type size. Sports Med 2004, 34(12): 809-24.
13. Doherty TJ. Invited review: aging and sarcopenia. J Appl Physiol 2003, 95(4): 1717-27.
14. Fleige S, Pfaffl MW. RNA integrity and the effect on the real-time qRT-PCR performance. Mol A Med
2006, 27: 126-139.
15. Florini JR, Ewton DZ, Coolican SA. Growth hormone and the insulin-like growth factor system in
myogenesis. Endocr Rev 1996, 17(5): 481-517.
16. Frontera WR, Hughes VA, Fielding RA. Aging of skeletal muscle: a 12-yr longitudinal study. J Appl
Physiol 2000, 88: 1321-1326.
17. Jones JI, Clemmons DR. Insulin-Like Growth Factors and Their Binding Proteins: Biological Actions.
Endocrine Reviews 1995, 16(1): 3-34
18. Lopez FJ. New approaches to the treatment of osteoporosis. Curr Opin Chem Biol 2000, 4 (4):383-393.
12

19. Muller M, Grobbee DE, Thijssen JHH. Sex hormones and male health: effects on components of the
frailty syndrome. Trends Endocrinol Metabol 2003, 14(6): 289-296.
20. Negro-Vilar A. Selective Androgen Receptor Modulators (SARMs): A Novel Approach to Androgen
Therapy for the New Millennium. JCEM 1999, 84(10): 3459-3462.
21. Pell JM, Bates PC. Differential actions of growth hormone and insulin-like growth factor I on tissue
protein metabolism in dwarf mice. Endocrinology 1992, 130: 1942-1950.
22. Rosen J, Negro-Vilar A. Novel, non-steroidal, selective androgen receptor modulators (SARM) with
anabolic activity in bone and muscle and improved safety profile. J Musculoskel Neuron Interact 2002,
2(3): 222-224.
23. Schroeder A, Mueller O, Stocker S et al.The RIN: an RNA integrity number for assigning integrity values
to RNA measurements. BMC Mol Biol 2006, 31(7): 3.
24. Snyder PJ, Peachy A, Hannoush P. Effect of Testosterone Treatment on Body composition and Muscle
Strenght in Men Over 65 Years of Age. JCEM 1999, 84(8): 2647-2653.
25. Stockholm D, Herasse M, Marchand S, Praud C, Roudaut C, Richard I, Sebille A, Beckmann JS. Calpain
3 mRNA expression in mice after denervation and during muscle regeneration. Am J Physiol Cell Physiol
2001, 280(6):C1561-9.
26. Van den Beld A, Huhtaniemi IT, Pettersson KS et al. Luteinizing Hormone and Different Genetic
Variants, as Indicators of Frailty in Healthy Elderly Men, JCEM 1998, 84(4): 1334-1339.
27. Welle S, Bhatt K, Thornton C. Polyadenylated RNA, actin mRNA, and myosin heavy chain mRNA in
young and old human skeletal muscle. Am J Physiol 1996, 270(2): E224-9.
28. Yialamas MA, Hayer FJ. Androgens and the ageing male and female. Best Practice and Research, Clin
Endocrin and Metabol 2003, 17(2): 223-226.
29. Yin D, Gao W, Kearbey JD. Pharmakodynamics of Selective Androgen Receptor Modulators. JPET
2003, 304(3): 1334-1340.
13

Legend Table 1: List of primer pairs used for PCR analysis in muscle tissue.
Figure 1: Significant down-regulation of CTSL between control and treated samples. Box-whisker
plot show the expression ratio R between the normalised expression of the timepoint 90 and
baseline. The horizontal line inside the box indicates median and the box indicates the interquertile
range. The full point indicates mean. The whiskers indicate the maximum and minimum and the
squer indicates outliers. The diamond indicates weak outliers. The calculation of the outliers is
based on the box-whisker rule saying that a outlier is a point which falls more than 1.5 times (weak
outlier) or 3 times (strong outlier) the interquartile range above the third quartile or below the first
quartile.
Figure 2: Significant down-regulation for CAPN3 between control and treated samples. Box-
whisker plot show the expression ratio R between the normalised expression of the timepoint 90
and baseline. The horizontal line inside the box indicates median and the box indicates the
interquertile range. The full point indicates mean. The whiskers indicate the maximum and
minimum and the squer indicates outliers. The diamond indicates weak outliers. The calculation of
the outliers is based on the box-whisker rule saying that a outlier is a point which falls more than
1.5 times (weak outlier) or 3 times (strong outlier) the interquartile range above the third quartile or
below the first quartile. Figure 3: Significant down-regulation for IGFBP3 between control and treated samples. Box-
whisker plot show the expression ratio R between the normalised expression of the timepoint 90
and baseline. The horizontal line inside the box indicates median and the box indicates the
interquertile range. The full point indicates mean. The whiskers indicate the maximum and
minimum and the squer indicates outliers. The diamond indicates weak outliers. The calculation of
the outliers is based on the box-whisker rule saying that a outlier is a point which falls more than
1.5 times (weak outlier) or 3 times (strong outlier) the interquartile range above the third quartile or
below the first quartile. Figure 4: IR in the control group shows a high statistical spread which can not be seen in the
treatment groups, especially in the Testo group. Box-whisker plot show the expression ratio R
between the normalised expression of the timepoint 90 and baseline. The horizontal line inside the
box indicates median and the box indicates the interquertile range. The full point indicates mean.
The whiskers indicate the maximum and minimum and the squer indicates outliers. The diamond
14

indicates weak outliers. The calculation of the outliers is based on the box-whisker rule saying that
a outlier is a point which falls more than 1.5 times (weak outlier) or 3 times (strong outlier) the
interquartile range above the third quartile or below the first quartile.
15

Table 1
Group Primer Sequenz 5´- 3´ bp Acces. Nr. muscle fibre proteins
ACTA1 for CAT GGT CGG TAT GGG TCA GAA 21 NM001100
ACTA1 rev CGC GAA GCT CGT TGT AGA AG 20 MYHC-2x for GCA CAT CCA GAG CAG AGA AGA A 22 NM017534 MYHC-2x rev GAC AGT GAC ACA GAA GAG ACC T 22 transcription factors Myogenin for ATC ATC TGC TCA CGG CTG AC 20 NM002479 Myogenin rev TTT CAT CTG GGA AGG CCA CAG A 22 protein metabolism CTSB for ACAATTCCTACAGCGTCTCC 20 L16510 CTSB rev CACCACTTCTGATTCGATTCC 21 CTSL for ACATCCCTAAGCAGGAGAAGGC 22 M20496 CTSL rev CCAGCACACCATGATCCATGTC 22 CAPN3 for TCCAGTTCGTCTGGAAGAGACC 22 AY902237 CAPN3 rev TGTACGTTGGCAGGCAGTCATC 22 cell cycle regulation CyclinD for AAC AAG CTC AAG TGG AAC CTG G 22 NM053056 CyclinD rev CAT GGA GGG CGG ATT GGA AAT 21 Myostatin for AAC TTG ACA TGA ACC CAG GCA C 22 NM005259 Myostatin rev ACG GAT TCA GCC CAT CTT CTC 21 endo- paracrin factors
AR for TTG TCC ATC TTG TCG TCT TCG G 22 L29496
AR rev TGT CCA GCA CAC ACT ACA CC 20 ERbeta for ATG CTC ACT TCT GCG CTG TC 20 NM001437 ERbeta rev CAC ACT TCA CCA TTC CCA CTT C 22
GHR alpha for
ATC CAC CCA TTG CCC TCA AC 20 NM00163
GHR alpha rev
ATC TCA CAC GCA CTT CAT ATT CC 23
IGF-1R for CAT TTC ACC TCC ACC ACC AC 20 NM000875 IGF-1R rev AGG CAT CCT GCC CAT CAT AC 20 IGFBP3 for CAC AGA TAC CCA GAA CTT CTC C 22 M35878 IGFBP3 rev CCA TAC TTA TCC ACA CAC CAG C 22 IGFBP4 for CAA CTT CCA CCC CAA GCA GT 20 NM001552 IGFBP4 rev CTG GTG GCA GTC CAG CTC 18 IR for TCC AGA CAG ATG CCA CCA AC 20 NM000208 IR rev ATC CAG CTC GAA CAG CTC AC 20 IGF1 for TGG ATG CTC TTC AGT TCG TGT G 22 ENSMMUT03165 IGF1 rev TAG AGG GAG TGC AGG AAA CAA G 22 GR for TTC TGC GTC TTC ACC CTC AC 20 AH002750 GR rev CTG TCT CTC CCA TAT ACA GTC C 24 energy metabolism HK for CGC ATC TGC TTG CCT ACT TC 20 NM000189 HK rev AAC TCT CCG TGT TCT GTC CC 20 LDH for TTC AGC CCG ATT CCG TTA CC 20 NM005566 LDH rev CAC CTC ATA AGC ACT CTC AAC C 22 CK for GAC ATC GTC TAC AGT GAA GCC 21 NM001824
CK rev AGT TCA AGC TGA ATT TAC AAG CCT
G 25 PYGM for ACA TCA ACC CCA ACT CAC TCA C 22 AF066859 PYGM rev GCC TTC CCT CCA ATC ATC AC 20 satellite cell biology Myf5 for TGA GAG AGC AGG TGG AGA AC 20 NM005593 Myf5 rev GGC AAC TGG AGA GAG AGA AG 20 Myf6 for GCC AAG TGT TTC CGA TCA TTC C 22 NM002469 Myf6 rev ACT TCT CCA CCA CTT CCT CC 20 reference genes beta-actin for TATAA Biocenter beta-actin rev TATAA Biocenter
16

PPIA for TATAA Biocenter PPIA rev TATAA Biocenter YWHAZ for GCA ACC AAC ACA TCC TAT CAG AC 23 NM145690 YWHAZ rev TTC TCC TGC TTC AGC TTC GTC
17

Figure 1
18

Figure 2
19

Figure 3
20

Figure 4
21