moderator: edward c. cymerys, fsa, maaamedia01.commpartners.com/soa/sanfran2014/140624 v 52...
TRANSCRIPT

52 PD ACA Exchanges: Exchange Director Viewpoint
Moderator:
Edward C. Cymerys, FSA, MAAA
Presenters:
Scott Leitz
Steven Sigal
Leesa Tori

MNsure :Minnesota’s online
health marketplaceSociety of Actuaries
June 24, 2014
presented by Scott LeitzCEO

About MNsure
Minnesota’s state-based insurance marketplace
Established by Legislation passed in May, 2013
Governed by 7 member board of directors appointed by Governor
Went live 10/1
“Minn-sure” not “M,N,Sure”
Minnsure, like Insure. Get it?
2

Minnesota’s Coverage Environment
Starting point:
8.2% uninsured in 2013
67% eligible for Medicaid, 80% of kids eligible
Medicaid expansion state
133% FPG for adults
275% FPG for children
Only state operating a Basic Health Plan
MinnesotaCare: covers adults 133% to 200% FPG
3

Operational Environment
Legacy MAXIS system (30+ years old, COBOL)
Legacy MMIS system (old, MinnesotaCare eligibility engine)
Desire for integrated eligibility system driven by complex web of county interactions and 2 programs administered off two separate systems
Minnesota made the (logical) decision to build an integrated eligibility system as part of exchange rollout
Expectation that this would add complexity
4

Minnesota coverage continuum in 2014

Minnesota’s Marketplace
High rate of employer-sponsored coverage
Consolidated payer market
Nation’s largest high risk pool
Relatively low-cost state in relatively good health
On a relative scale, fair amount of payment innovation
6

How did open enrollment go (operationally)?
To start, we faced what most SBMs faced in the fall:
Imperfect technology causing some individuals to get “stuck” or find that they were unable to enroll
Higher than expected volume to call center, driving long wait times
A high level of need for assistance among people enrolling
– While it might be like Expedia, picking health coverage *is* different than picking a rental car
Learnings along the way
Substantial system improvements along the way7

Improvement During Open Enrollment
December 2013
March 2014
Average 60 second hold time
170 customer service staff
<3% system error rate
98% eligibility success rate
Average 60 minute hold time
60 customer service staff
17% system error rate
70% eligibility success rate
8

How did open enrollment go (marketplace)?
Plans priced competitively
Lowest premiums in the country
Consumers shopped seriously and planfully
Account creation multiple days of shopping selection
SHOP enrollment was very small
Enrollment out of our high risk pool was very high
Transparency of prices revealed a lot about variability of provider pricing
9

Enrollments by Program June 10, 2014
0
20,000
40,000
60,000
80,000
100,000
120,000
140,000
160,000
Oct. 1
Nov. 2
Nov. 30
Dec. 14
Dec. 28
Jan. 4
Jan. 18
Feb. 1
Feb. 8
Feb. 24
Mar. 8
Mar. 24
Apr. 13
Apr. 27
May 11
June
10
MinnesotaCareMedical AssistanceQHP Enrollments completed
49,115 individuals in MinnesotaCare
137,034 individuals in Medical Assistance
51,558 individuals in QHPs
237,707 Total Enrollments
10 Note: Manual QHP enrollments have been included since March 23

individuals and families
229,911 Minnesotans enrolled (as of June 1)
51,004 in qualified health plans
47,743 in MinnesotaCare
131,164 in Medical Assistance (Medicaid)
11

Eligibility of QHP ApplicantsJune 10, 2014
Number of QHP eligible applicants applying for assistance
Not Eligible for APTC
Eligible for APTC
37,826 individuals38,363 individuals
12
Notes: 76,189 persons applied for assistance.These numbers reflect eligible applicants applying for assistance since October 1, 2013.

35%
35%
20%
5%5%
Projected Metal Level Selection
Bronze Silver Gold Platinum Catastrophic
Individual Market: Metal LevelsJune 10, 2014
13
25.9%
33.6%12.3%
27.2%
1.0%
Actual Metal Level Selection

Individual Market: QHP Enrollee Demographics June 10, 2014
9.6%6.4%
18.6%
15.1%19.3%
30.9%
0.2%
Age of Enrollees<18 18-25 26-34 35-4445-54 55-64 65+
14
51.2%48.8%
Gender in QHPs
Female Male

15
Did we succeed on our overarching goal
of reducing uninsured?
Yes!

Change in coverage by Type of Insurance: Minnesota, 9/30/13 to 5/1/14
-0.2%
12.5%
0.9%
20.6%
1.9%
10.5%
-40.6%-50.0%
-40.0%
-30.0%
-20.0%
-10.0%
0.0%
10.0%
20.0%
30.0%
16

Uninsurance rates in Minnesota, 2001 to 2014
6.1%
7.7%7.2%
9.0% 9.0%8.2%
4.8%
0.0%
1.0%
2.0%
3.0%
4.0%
5.0%
6.0%
7.0%
8.0%
9.0%
10.0%
2001 2004 2007 2009 2011 2013 2014
17

18
Some lessons learned and our
next steps

A few (of the many) lessons learned Complexity lead to complexity
An integrated system was going to be more challenging to build, out of the gate
Consumers needed a lot of assistance
Importance of building our network of assisters
Sorting out functions exchanges need to do versus those that can be done by others is an ongoing but important process
Partnerships absolutely critical
Health reform is more than a website
40% reduction in the uninsured in Minnesota19

Vision
Transparency and accountability
Transparency and accountability
Improved consumer experience
Improved consumer experience
More Minnesotans covered
More Minnesotans covered
20

Path forward
• Deloitte Consulting, LLC• Timelines and goalWebsiteWebsite
• No additional state or federal funds• Balanced for 2015
Sustainable Budget
Sustainable Budget
• Advertising and outreach campaigns• Robust grants program• Improved navigator and broker relations
External RelationsExternal Relations
21


ACA Marketplaces: What Happened, What is Happening,
What will Happen
Steven J. SigalChief Financial Officer

2
WHO IS ACCESS HEALTH CT AND WHAT ARE THE MARKETPLACES

3
What Is A Marketplace Under The ACA ?
• An organized marketplace for health care plans to compete and offer services efficiently in the small group and individual markets.
• Assists individuals and families in determining their eligibility for public health programs or federal premium/cost assistance that can lower the cost of private health care coverage.
• Assists individuals and families in comparing plan offerings and prices in a single enrollment experience.
• Partner with Conn. Insurance Department to ensure that plan offerings are in compliance with state and federal laws and regulations, including the ACA and Public Health Services Act

4
Types of Marketplaces: FFM, FPM, SBM

5
Connecticut Exchange—Opportunity
• % of State Residents were Uninsured as of 2012• 286,000 Individuals
• 30,000 under age 17• 145,000 between ages 18 and 34
• Pre‐2014 – about 700,000 Medicaid enrollees
• 2014 ‐Medicaid Eligibility Expansion up to 138% of the Federal Poverty Level for low income (no children) adults. expanded eligibility for other categories as well

6
THE ENROLLMENT PROCESS

7
Consumer Support Services
Website: an easy and simple online marketplace to compare the different health care coverage options, determine subsidy/tax credit eligibility and enroll for coverage.
Call Center: trained professionals available to facilitate enrollment for consumers, determine eligibility for a subsidy, tax credit and public health care programs. Language assistance provided by trained professionals in over 100 languages.
Navigators/ In‐Person Assisters and Brokers: certified professionals available to provide face ‐ face consumer support with enrollment and understanding plan options.

8
Online Snapshots (1 of 4)
Home screen• Explore coverage
• Get more information
• Contact a broker/assister
• Seek an exemption
• Enroll/Start a SHOP plan

9
Online Snapshots: Anonymous Browsing
Browsing• Start the process by
laying out your age, county and income
• Will allow you to explore your eligibility on a program, plan, and tax credit level
• Lets you see if this is a good idea for you and your family before completing the full application

10
Online Snapshots: Eligibility Determination
Eligibility • See what
coverage type and affordability programs you might be eligible for
• Can elect to not to apply tax credits and shop at full cost

11
Online Snapshots: Plan Selection
Level of Coverage
Applicant Information
Plan options
APTC Toggle
Provider Look‐up
Plan Documents

12
Online Snapshots: Plan Comparison
Plan Comparison
• Compare up to 3 plans at one time
• Lays out most important plan information side‐by‐side

13
ENROLLMENT STATISTICS

14
Enrollments by Date of Enrollment (Oct. 2013 - May, 19 2014) all programs

15
Enrollments by Age and Date of Enrollmentas of 5/21/14, all programs
As of July 2012 • 43.6% of CT population over 45 years old• 43.6% of CT population under 35 years old• 12.8% of CT population 35‐44 years oldBackus, K, Mueller, LM (2013) State‐level Bridged Race Estimates for Connecticut, 2012, Connecticut Department of Public Health, Health Statistics & Surveillance, Statistics Analysis & Reporting, Hartford, CT.

16
Enrollments by Age and Date of Enrollmentas of 5/19/14, QHP only
Years

17
Enrollments by Program
1,070
3,506
12,888
17,980
22,249
35,445 37,931
1,295 4,379
15,131
21,182 26,183
39,788 42,534
820 2,044
7,093
18,122
27,263
50,322
60,323
1,099
2,683
8,625
21,984
32,453
57,760
68,984
0
10,000
20,000
30,000
40,000
50,000
60,000
70,000
80,000
Oct Nov Dec Jan Feb March April
QHP Male
QHP Female
Husky Male
Husky Female

18
AFFORDABILITY UPTAKE

19
Enrollment by Affordability Program Eligibility(as of May 19, 2014)

20
QHP Enrollment by Percent of 2014 FPL(as of May 21, 2014)
= Traditional and Expanded Medicaid or QHP (w/ APTC & CSR) non‐5year resident
= Cost Sharing Reduction & APTC / Medicaid Families or Medicaid Children
= APTC only or CHIP children
= QHP only no APTC

21
QHP Enrollment Trend (as of May 21, 2014)
22
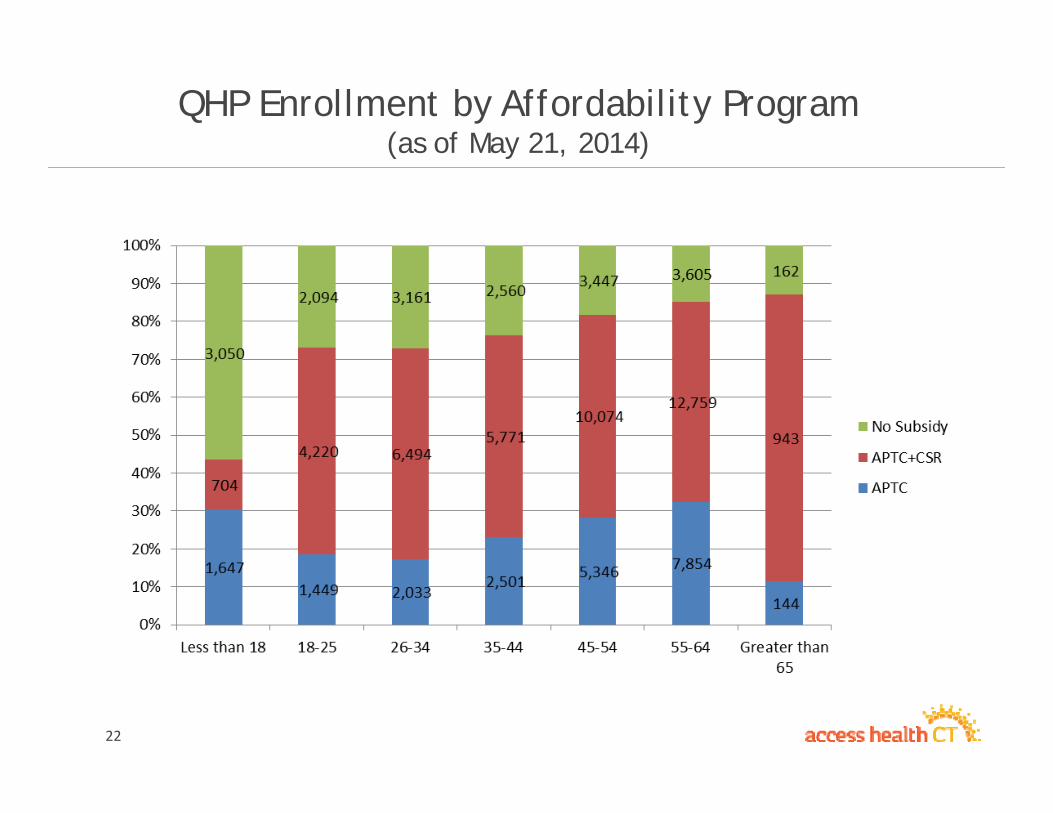
QHP Enrollment by Affordability Program(as of May 21, 2014)

23
ISSUER ENROLLMENT BY AGE

24
Issuer Enrollment by Age

25
CONSUMER ENGAGEMENT: NIPA, CAC, BROKERS & STOREFRONTS

26
Navigators

27
NIPA Outputs - Engagements

Access Health CT – New Britain Storefront

Access Health CT – Broker/Assister Area

Partners in Enrollment

31
AHCT – SUCCESSFUL?

Access Health CT – Success Benchmarks
• 286,000 Uninsured – 8%• Enrollment
– % of Goal• Total: 227% of Goal• Private: 346% of Goal• Paid Premium: 91%
• Satisfaction– 72% “Extremely Likely” or “Very Likely” to Recommend

33
Lessons Learned
• Hire Aggressive, Experienced Staff• Explain Simply and Often• Simplify Enrollment Process• Stay Close to Brokers & Carriers• Don’t Be Afraid to Say “No”

34
AHCT AND MARKETPLACES IN 2015 AND BEYOND

35
AHCT: 2015 and Beyond
• Plans• New Plan designs • New Participating Carriers/Issuers• An expanded stand‐alone dental enrollment process• Auto‐enrollments and new enrollments into 2015
• Technology• Improve the customer experience • Continual enhancement of application (3 year SDLC compressed to 1 year)• Mobile App
• Organization• All‐Payer Claims Database
• Will allow consumers to explore cost to make informed decisions• Will allow consumers to see what plan best meets their health needs
• AHCT Exchange Solutions• Working with other states as they pursue State‐Based Marketplaces
• A renewed push for Small Business enrollment• Increased member education about their coverage• Expansion of product lines in 2017 and beyond

THE WILD AND WACKY WORLD OF EXCHANGES
JUNE 2014
Leesa Tori, Interim Director, Plan Management - Covered CaliforniaSociety of Actuaries Health Conference
0

Agenda
Covered California – California’s State Based Exchange
• What we did
• What we are doing
• What we will do
To make sure we succeed…
1

Guiding PrinciplesEstablished guiding principles for the exchange define both what value we provide to consumers and how we select and manage carriers to deliver it. And use them.
2
• Promote affordability: premium and at point of care
• Value: Quality, Service and Price
• Meaningful product choice (product and network differentiation)
• Ensure statewide coverage
• Providers and delivery systems serving low income/Medi-Cal
• Effective partners for promoting delivery system reforms
• Willingness to commit to 3-year partnership

Major Policy and/or Negotiating Issues from 2014 Plan Year
• Benefit Designso Standardized Benefit Designso Excluded alternate benefits for 2014 - both SHOP and Individual markets
• Assuring “Meaningful Choice” o Kept competitive plans with a variety of networkso Value networks created to keep price points low – what is “adequacy”?
• Concern about HSA plan at lowest or second lowest silvero Eliminated HSA plans at the Silver level and permitted at the Bronze level
• Concern about same plan holding lowest and second lowest silver positiono After negotiations this did not end up happening in 2014
• Covered California considered a situation in which a small niche plan offered the lowest orsecond lowest silver and their subsequent ability to absorb enrollment. What would we do if this situation occurred?
o Only occurred in a limited circumstance where niche plan was the lowest price plan o Second lowest priced silver plan still allowed substantial APTC
3

4

5

6

TOTAL ENROLLMENT VS. BASE SIX MONTH PROJECTIONS
BaseProjection for
3/31/2014
Total Enrolled
(with plan selection) on
4/15/2014
Difference from Base Projection for 3/31/14
Performanceto date
(% of 3/31/14 base projection)
Total Enrollment 580,000 1,395,929 815,929 241%
Subsidy eligible 487,000 1,222,320 735,320 251%
7

ENROLLMENTS WITH COVERED CALIFORNIA PLAN SELECTION BY SERVICE CHANNEL; OPEN ENROLLMENT 2013-14
8
Self538,776
41%
Agent525,633
40%
Service Center Representative
121,6399%
Certified Enrollment Counselor116,484
9%
Plan Based Enroller and
County Eligibility Worker21,910
1%
CEC enrollment increased significantly over the second 3 months. From Oct-Dec, CECs enrolled 3% of total enrollment. In Jan-March, CECs enrolled nearly 12% of total enrollment.
Preliminary data – Draft analysis based on Covered California Enrollment (plan selection) as of April 13, 2014

TEST; LISTEN; LEARN AND ADJUST
9
• Covered California is using a variety of formal and informal listening opportunities to understand the consumer experience, barriers to enrollment and what works for enrolling Californians:
o Data from those who do enroll
o Board meetings
o Advisory groups
o Focus groups
o Regional meetings
o Surveys of Covered California enrollees and partners
o Early research and evaluation findings
• To maximize input, Covered California convenes listening opportunities and leverages work conducted by partners, researchers and foundations

Major Policy and/or Negotiating Issues for 2015• Operating under multi-year partnership arrangement with 10 original carriers
o Rewarded early participation with a multi-year limitation on new entrantso Exceptions granted for Medi-Cal plans and new CA licensees
• Benefit Designso Minor changes to standard benefit designs (legal and regulatory only)o No Alternate Benefit Design for Individual marketso Consider pilot program for SHOP
• Network Configurationo Market noise about value (narrow) networks and access to care concernso We continue to partner with the regulators concerning network adequacy and
approvalso Broader networks could require consumers to face higher premiumso Propose to allow plans to continue their value network strategies and pricing structure
with network changes as required
• Carrier Contracting Policieso Performance Guarantees (for plans or Covered California) due to high volumeso Need to establish benchmarks in steady state – the “new normal”
10

Major Policy and/or Negotiating Issues for 2015 - SHOP
• Operating under multi-year partnership arrangement with six original carriers
• Alternate Benefit Designso Proposed pilot program for SHOP o Share learnings with individual market for future
• Proposed Program Changeo Contiguous tiers to meet market demandso Employer choice of bronze/silver, silver/gold, gold/platinum
• Network Configurationo Broad network PPO with Health Net
• 2015 Carrier Contracting Policyo No major changes to the 2014 model contracto Amendments to be used to address minor issues
11

Three Principles to Live and Work by
TRUST your colleagues are doing their best
FORGIVE when mistakes are made
And
Be WILLING to help solve the problem
12