modelling the mass balance of northwest spitsbergen ... · modelling the mass balance of northwest...
TRANSCRIPT
Annals ifGlaciology 24 1997 © International Glaciological Society
Modelling the mass balance of northwest Spitsbergen glaciers and responses to climate change
KEVIN M. FLEMING/ JULlAN A. DOWDESWELL,2 JOHANNES OERLEMANS3
I Geodynamics Group, Research School if Earth Sciences, The Australian National University, Canberra ACT 0200, Australia 2Centrejor Glaciology, Institute if Earth Studies, University if Wales, Aberystwyth Sr233DB, Wales
3lnstitutejor Marine and Atmospheric Research, Utrecht University, Princetonplein 5, 3584 CC Utrecht, The Netherlands
ABSTRACT. An energy-balance model is used to calculate m ass balance and equilibrium-line altitudes (ELAs) on two northwest Spitsbergen glaciers, Austre BnDggerbreen and Midre Lovenbreen, whose mass balances a re at present negative, and for which greater than 20 year records of mass-balance data are available. The model takes meteorological data, ice-mass area distribution with altitude, and solar radiation as inputs. Modelling uses mean daily meteorological data from a nearby weather station, adjusted for a ltitude. Average net balances modelled for 1980- 89 using models tuned to the decade's average were - 0.44 and - 0.47 m w.e. for Lovenbreen and Br0ggerbreen, respectively, compared with the measured averages of - 0.27 and - 0.36 m. Sensitivity tests on glacier response to greenhouse warming predict a net balance change of -0.61 m year- I per °C temperature rise relative to today, and a rise in ELA of 90 m °C- 1 Modelling of Little Ice Age conditions in Spitsbergen suggests that a 0.6°C cooling or a precipitation increase of23 % would yield zero net mass balance for Lovenbreen and that further cooling would increase net balance by 0.30 m year 1 °C I. Set in the context of similar modelling of southern Norwegian, Alpine and Greenland ice masses, these resu lts support the sugges tion tha t glaciers with a maritime influence (i. e. higher accumulation) are most sensitive to climate change, implying a gradient towards decreasing sensitivity as accumulation decreases eastward and with altitude in Svalbard.
INTRODUCTION
Several modelling studies have suggested that changes in the Earth's climate will be felt first in the Arctic, and to a greater extent tha n elsewhere (e.g. StoulTer and others, 1989; Walsh, 1991; Cattle and Crossley, 1995). Spitsbergen (77-80° N, 10- 22° E ), in particular, is located at the north
ern extremity of the strong meridional transfer of heat linked to the warm-water North Atlantic Drift and to the relatively warm northward-tracking atmospheric depressions. The potential sensitivity of Spitsbergen to climate change is demonstrated by a rise of 4- 5°C in mean annual temperature linked to the termination of the Little Ice Age
cool period early in the 20th century (e.g. Steffensen, 1982; Dowdeswell, 1995). The potential importance of glaciers and small ice caps in general to greenhouse-induced warming and global sea-level rise has been di scussed by several authors (e.g. Meier, 1984, 1990; O erlemans and FOI,tuin, 1992), but the sensitivity of glaciers in the high Arctic to climate change has seldom been modelled (er. Oerlemans and Fortuin, 1992).
The aim of this paper is to model the mass balance of two Spitsbergen glaciers using an energy-ba lance approach in which the components of the surface energy balance are calculated (e.g. O erlemans, 1988, 1991, 1992). The glaciers, Austre Br0ggerbreen and Midre Lovenbreen in the Kongsfjorden area of northwest Spitsbergen (Fig. I), are very suitable for such a study because systematic mass-balance observations have been made annually for more than 20 years and they are withi n 5- 6 km of the meteorological
station at Ny-Alesund (Hagen and Liestol, 1990). Mass
balance modelling is undertaken for three situations: (I) present-day clim ate (1980- 89); (2) various predictions of greenhouse-induced global warming; and (3) the cooler climate of the Little Ice Age. Model results using modern meteorological data as input are first compared with observed mass-balance records for the two Spitsbergen
glaciers. The model is then used to test the sensitivity of the glaciers to future a nd past changes in climate.
STUDY AREA
The IIlodelled glaciers
Austre Br0ggerbreen and l\1idre Lovenbreen are small glaciers with areas of approximately 6 km 2
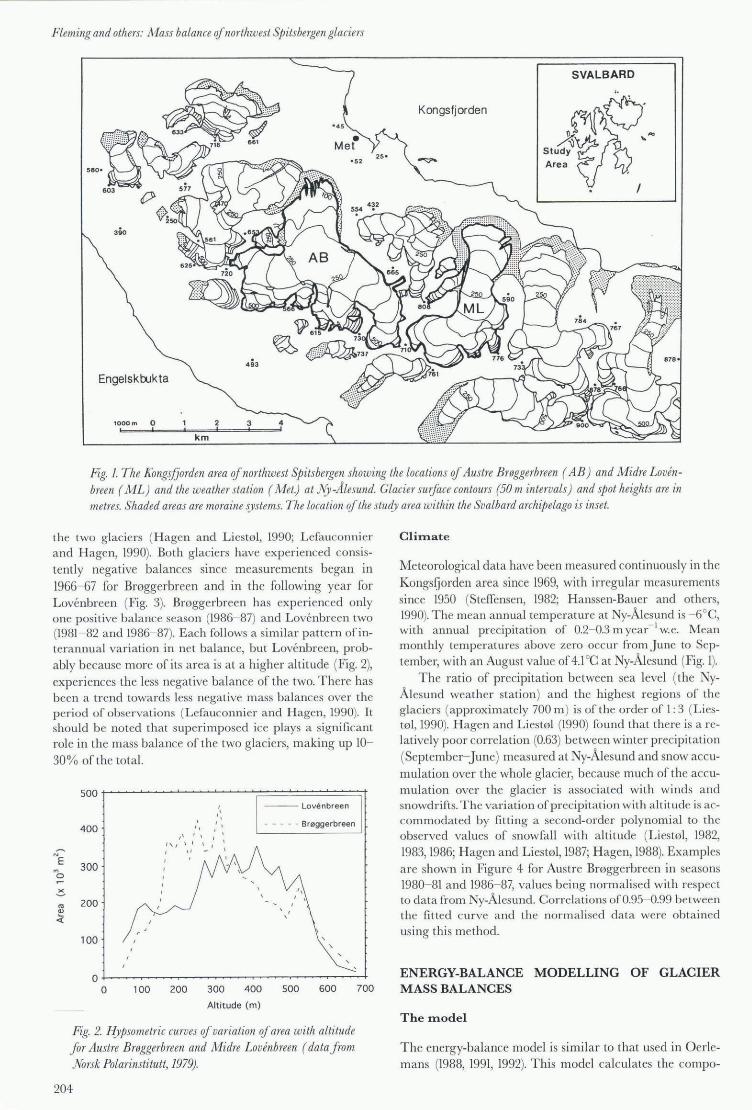
, located 3- 5 km apart on the Broggerhalvoya peninsula in northwest Spitsbergen (Fig. I). A la rge body of glaciological information is available on these glaciers, including surface morphology, ice thickness measured by radio-echo sounding, and studies of their hyd rological and thermal cha racteristics (e.g. Dowdeswell and others, 1984a, b; Lies tol, 1990; Hagen and Scetrang, 1991). Both glaciers span an a lritudinal range between close to 0 and 700 m a.s.l. , although nei ther actually reaches the adjacent fjord. The hypsometry of the two glaciers is somewhat different, Lovenbreen having a larger area at relatively higher elevations (Fig. 2).
Of particular significance for the present study is the long time se ri es of mass-balance data that is available for
203
Fleming and others: Mass balance qf northwest Spitsbelgen glaciers
SVALBARD
" Kongsfj orden r;:)'
A~ ... '" StUdy\) ~ Area VU
• I
300
EngelskbJkta
1000 m 0 3 , , ,
km
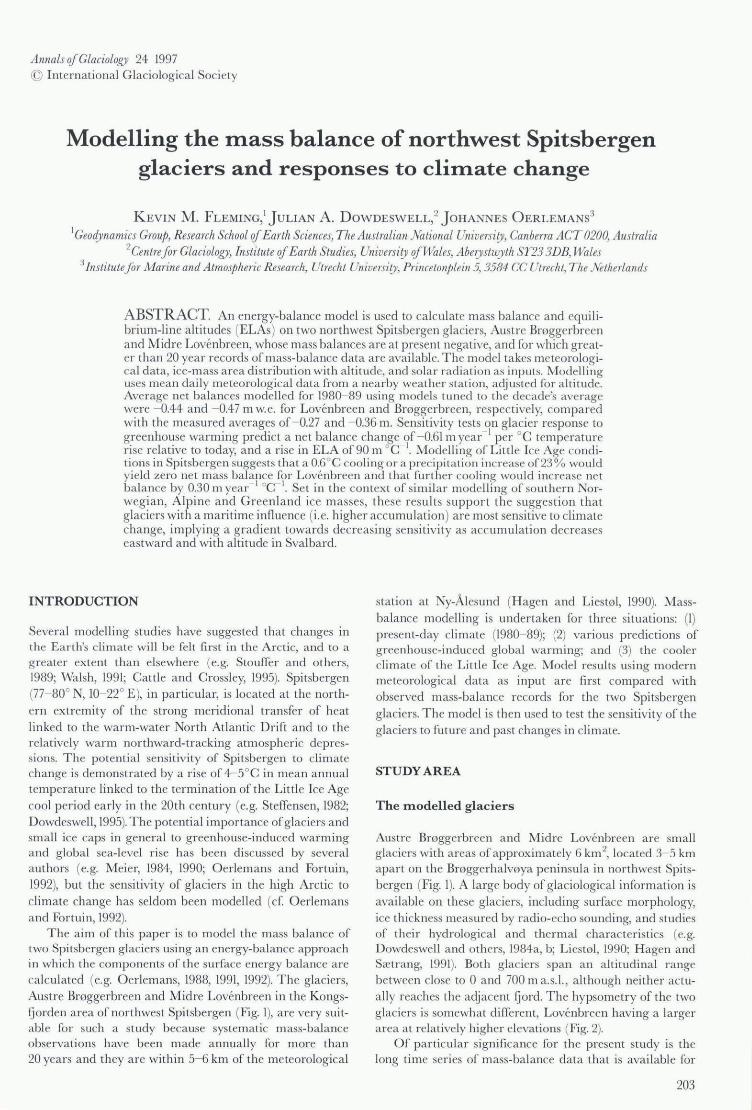
Fig, L The Kongsjjorden area if northwest Spitsbergen showing the Locations if Austre Broggerbreen ( AB) and Midre Lovenbreen ( ML) and the weather station ( Met,) at Ny -ALesund, GLacier surface contours (50 m intervals) and spot heights are in metres. Shaded areas are moraine systems. The location qf the study area within the Svalbard archipelago is inset,
the two glaciers (H agen and Liest01, 1990; Lefauconnier and H agen, 1990), Both glaciers have experienced consistently negative balances since measurements began in 1966- 67 for Br0ggerbreen and in the following year for Lovenbreen (Fig. 3), Bf0ggerbreen has experienced only onc positive balance season (1986- 87) and Lovenbreen two (1981- 82 and 1986- 87), Each follows a similar pattern of interannual va riation in net balance, but Lovenbreen, probably because more of its a rea is a t a higher altitude (Fig, 2), experi ences the less negative balance of the two, There has been a trend towards less negative m ass balances over the period of observations (Lefauconnier and H agen, 1990). It should be noted that superimposed ice plays a significant role in the mass balance of the two glaciers, making up 10-
30 % of the totaL
~
NE "'0
3
'" Q)
4:
400
300
200
l OO
, , , '\ / \
,\ '\ '" \ I \
--- Lovenbree n
- - - - - Bmggerbreen
, , \
O +-~~--~----~~~--~----~~-+
o 100 200 300 400 500 600
Alti tude (m)
Fig, 2. HyjJsometric curves qf variation if area with altitude Jor Austre Broggerbreen and Midre Lovenbreen ( data from N'orsk PoLarinstitutt, 1979).
700
204
Clitnate
Meteorological data have been measured continuously in the
Kongsfj orden area since 1969, with irregula r measurements ince 1950 (Steffensen, 1982; H anssen-Bauer and others,
1990), The mean annual temperatu re at Ny-Alesund is - 6°C, with annual precipitation of 0,2- 0.3 m year- I w,e, Mean month ly temperatures above zero occur from June to September, with an August value of 4.1 °C at Ny-Alesund (Fig, I),
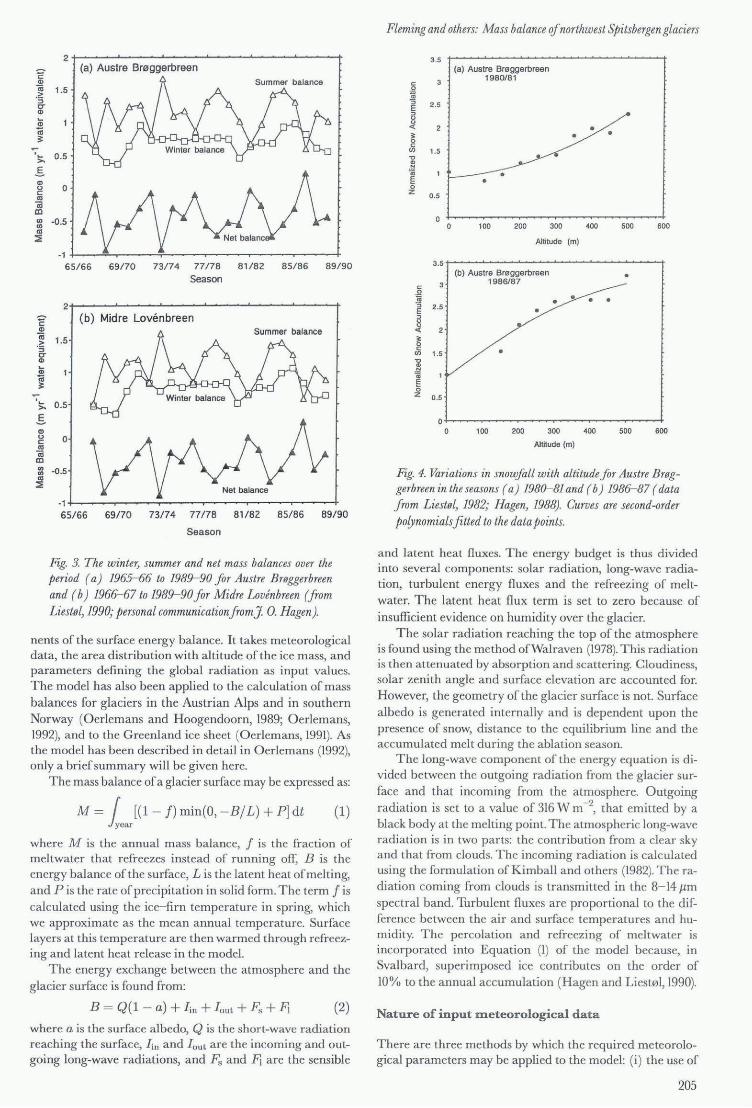
The ratio of precipitation between sea level (the NyAlesund weather station) and the highest regions of the glaciers (approxim ately 700 m ) is of the order of 1 : 3 (Liest01, 1990), H agen and Li est01 (1990) found that there is a relatively poor correla tion (0,63) between winter precipitation (September- June) measured at Ny-Alesund and snow accumulation over the whole glacier, because much of the accumulation over the glacier is associated with winds and snowdrifts. The variation of precipitation with altitude is accommodated by fitting a second-order polynomial to the observed values of snowfall with altitude (L iest01, 1982, 1983, 1986; Hagen and L iest01, 1987; H agen, 1988), Examples a re shown in Figure 4 for Austre Br0ggerbreen in seasons 1980- 81 and 1986- 87, va lues being normalised with respect to da ta from Ny-Alesund. Correlations of 0.95- 0.99 between the fitted curve and the normali sed da ta were obta ined using this method,
ENERGY-BALANCE MODELLING OF GLACIER MASS BALANCES
The Inodel
T he energy-balance model is simi la r to that used in O erlemans (1988, 1991, 1992), T his model calculates the compo-
'>. 0.5
g g 0 as
(ij CC :z -0.5 as
:::E
-1+---~~----~~----~~--~----~------+ 65/66 69/70 73/74 77/78 81/82 85/86 89/90
Season
2+-~--~--~~----~----~----~~----+ E (b) Midre Lovenbreen Cl)
~ 1.5 ·s C" Cl)
~
~ '>. 0 .5
g Cl) o c as ~
o
::l -0.5 as
:::E
-1 +---~T-----~----~----~----~----~ 65/ 66 69170 73/74 77178 81/82 85/ 86 89/90
Season
Fig. 3. The winte", summer and net mass balances over the period (a) 1965-66 to 1989-90 for Austre BTlJggerbreen and (b) 1966- 67 to 1989-90 for Midre Lovenbreen (from Liestel, 1990; personal communicationfrom] 0. Hagen).
nents of the surface energy balance. It takes meteorological data, the area distribution with altitude of the ice mass, and parameters defining the global radiation as input values. The model has also been applied to the calculation of mass balances for glaciers in the Austrian Alps and in southern Norway (Oerlemans and Hoogendoorn, 1989; Oerlemans, 1992), and to the Greenland ice sheet (Oerlemans, 1991). As the model has been described in detail in Oerlemans (1992), only a brief summary will be given here.
The mass balance of a glacier surface may be expressed as:
M=j [(l-j)min(O,-B/L)+P]dt (1) year
where M is the annual mass balance, f is the fraction of meltwater that refreezes instead of running off, B is the energy balance of the surface, L is the latent heat of melting, and P is the rate of precipitation in solid form. The term f is calculated using the ice-firn temperature in spring, which we approximate as the mean annual temperature. Surface layers at this temperature are then warmed through refreezing and latent heat release in the model.
The energy exchange between the atmosphere and the
glacier surface is found from:
B = Q(l - a) + lin + lout + Fs +.F1 (2)
where a is the surface albedo, Q is the short-wave radiation reaching the surface, lin and lout are the incoming and outgoing long-wave radiations, and Fs and .F1 are the sensible
Fleming and others: Mass balance of northwest Spitsbergen glaciers
c: o ~ :; E
" u
:t ;0 o c: en
"0
.~
~ o Z
c: .Q a; :; E " u
:t ;0 g
2.5
1.5
0.5
3.5
2.5
en 1.5 "0
.~
~ o z 0.5
o
(a) Austre Bmggerbreen 1980/81
•
100 200
•
300
Altitude (m)
(b) Austre Bmggerbreen 1986/87
• •
•
•
400
100 200 300 400
Altitude (m)
500 600
•
500 600
Fig. 4. Variations in snouJall with altitude for Austre Breggerbreen in the seasons ( a) 1980- 81 and (b) 1986- 87 (data from Liestel, 1982; Hagen, 1988). Curves are second-order polynomials fitted to the data points.
and latent heat fluxes. The energy budget is thus divided into several components: solar radiation, long-wave radiation, turbulent energy fluxes and the refreezing of meltwater. The latent heat flux term is set to zero because of
insufficient evidence on humidity over the glacier. The solar radiation reaching the top of the atmosphere
is found using the method ofWalraven (1978). This radiation is then attenuated by absorption and scattering. Cloudiness, solar zenith angle and surface elevation are accounted for. However, the geometry of the glacier surface is not. Surface
albedo is generated internally and is dependent upon the presence of snow, distance to the equilibrium line and the accumulated melt during the ablation season.
The long-wave component of the energy equation is divided between the outgoing radiation from the glacier surface and that incoming from the atmosphere. Outgoing radiation is set to a value of 316 W m - 2, that emitted by a black body at the melting point. The atmospheric long-wave radiation is in two parts: the contribution from a clear sky and that from clouds. The incoming radiation is calculated using the formulation of Kimball and others (1982). The radiation coming from clouds is transmitted in the 8-]4 jJ.m spectral band. Turbulent fluxes are proportional to the difference between the air and surface temperatures and humidity. The percolation and refreezing of meltwater is incorporated into Equation (1) of the model because, in Svalbard, superimposed ice contributes on the order of 10% to the annual accumulation (Hagen and Liest01, 1990).
Nature of input meteorological data
There are three methods by which the required meteorological parameters may be applied to the model: (i) the use of
205
Fleming and others: Mass balance of northwest Spitsbergen glaciers
'E 0.5 Cl) (a) Midre Lovenbreen n; > ·S er Ol
0 Q; <ii ~ 0- -
'";- /,0, r -0.5 I:
b <I> 0 u
rf,' c
'" n; Cl ID -1 en en
--....-- Measured net balance '" ::;: - 0- - Daily Data - - 0 - - Annual fit
-1.5 80/81 82/83 84/85 86/87 88/89
Season
'E 0.5 Cl) (b) Austre Bmggerbreen n; q > ·s
/ \ er Cl)
0 Q; / \ n; ~
'";->.
-0.5 I .S-Ol / I tJ..
-0 u c d 10 '" n; ID -1 en en -----.- Measured net balance '" ::;:
- Daily Data - 0-
-1.5 80/81 82/83 84/85 86/87 88/89
Season
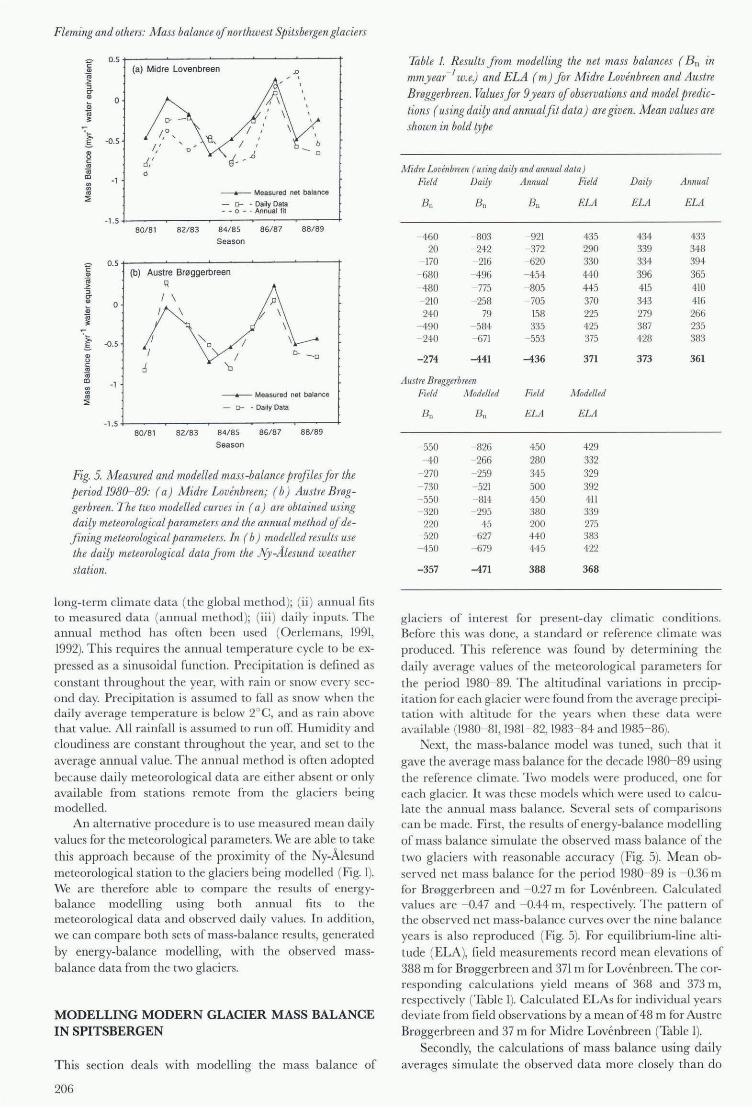
Fig. 5. Measured and modelled mass-balance profilesfor the period 1980-89: (a) Midre Lovenbreen; (b ) Austre Broggerbreen. The two modelled curves in ( a) are obtained using daily meteorological parameters and the annual method of defining meteorological parameters. In (b ) modelled results use the daily meteorological data from the Ny -Alesund weather station.
long-term climate data (the global method); (ii ) annual fits to measured data (annual method ); (iii ) daily inputs. The annual method has often been used (Oerlemans, 1991, 1992). This requires the annual temperature cycle to be expressed as a sinusoidal function. Precipitation is defined as constant throughout the year, with rain or snow every second day. Precipitation is assumed to fall as snow when the daily average temperature is below 2°C, and as rain above that value. All rainfall is assumed to run off. Humidity and cloudiness are constant throughout the year, and set to the average annual value. The annual method is often adopted because daily meteorological data are either absent or only available from stations remote from the glaciers being modelled.
An alternative procedure is to use measured mean daily values for the meteorological parameters. We are able to take this approach because of the proximity of the Ny-Alesund meteorological station to the glaciers being modelled (Fig. I). We are therefore able to compare the results of energybalance modelling using both annual fits to the meteorological data and observed daily values. In addition, we can compare both sets of mass-balance results, generated by energy-balance modelling, with the observed massbalance data from the two glaciers.
MODELLING MODERN GLACIER MASS BALANCE IN SPITSBERGEN
This section deals with modelling the mass balance of
206
Table 1. Results from modelling the net mass balances (En in - / w. e) and ELA (m) for Midre Lovenbreen and Austre mmyear
Broggerbreen. Values for 9 years if observations and model predic-tions (using daily and annualfit data) are given. Mean values are shown in bold type
Midre Lovenbreen ( using daily and annual data ) Field Daily Annual Field Daily Annual
Bll Bll En ELA ELA ELA
460 803 - 921 435 434 433 20 - 242 - 372 290 339 348
- 170 - 216 -620 330 334 394 - 680 - 496 - 454 440 396 365 - 480 - 775 - 805 445 415 410 - 210 - 258 - 705 370 343 416 240 79 158 225 279 266
- 490 - 584 335 425 387 235 - 240 - 671 - 553 375 428 383
-274 -441 -436 371 373 361
Austre Breggerbreen Field Modelled Field Modelled
En En ELA ELA
550 - 826 450 429 - 40 - 266 280 332
- 270 - 259 345 329 - 730 - 521 500 392 - 550 814 450 411
320 295 380 339 220 45 200 275 520 - 627 440 383
- 450 -679 445 422
-357 -471 388 368
glaciers of interest for present-day climatic conditions. Before this was done, a standard or reference climate was produced. This reference was found by determining the daily average values of the meteorological parameters for the period 1980- 89. The altitudinal variations in precipitation [or each glacier were found from the average precipitation with altitude for the years when these data were avai lable (1980- 81,1981-82, 1983- 84 and \985- 86).
Next, the mass-balance model was tuned, such that it gave the average mass balance for the decade 1980- 89 using the reference climate. Two models were produced, one for each glacier. It was these models which were used to calculate the annual mass balance. Several sets of comparisons can be made. First, the results of energy-balance modelling of mass balance simulate the observed mass balance of the two glaciers with reasonable accuracy (Fig. 5). Mean observed net mass balance for the period 1980- 89 is - 0.36 m for Bmggerbreen and - 0.27 m for Lovenbreen. Calculated values are - 0.47 and - 0.44 m, respectively. The pattern of the observed net mass-balance curves over the nine balance years is a lso reproduced (Fig. 5). For equilibrium-line altitude (ELA), field measurements record mean elevations of 388 m for Broggerbreen and 371 m for Lovenbreen. The corresponding calculations yield means of 368 and 373 m, respectively (Table 1). Calculated ELAs for individual years deviate from field observations by a mean of 48 m for Austre Bf0ggerbreen and 37 m for M idre Lovenbreen (Table 1).
Secondly, the calculations of mass balance using daily averages simulate the observed data more closely than do
0.5
E Q)
CO > '5 <Y Q)
~ «i 8 ;0
";- /" .. "- -0.5
E-O>
-,A-
6, ,
<) c:
'" tii -1 CD
'" '" '" :>
80/ 81 82/ 83
0
,
0
, & , , -G o
o Temperature 6 Precipitation o Cloudiness
-- Measured net balance - - - - - Annual fit
84/ 8 5
Season
8 6/8 7 8 8 / 89
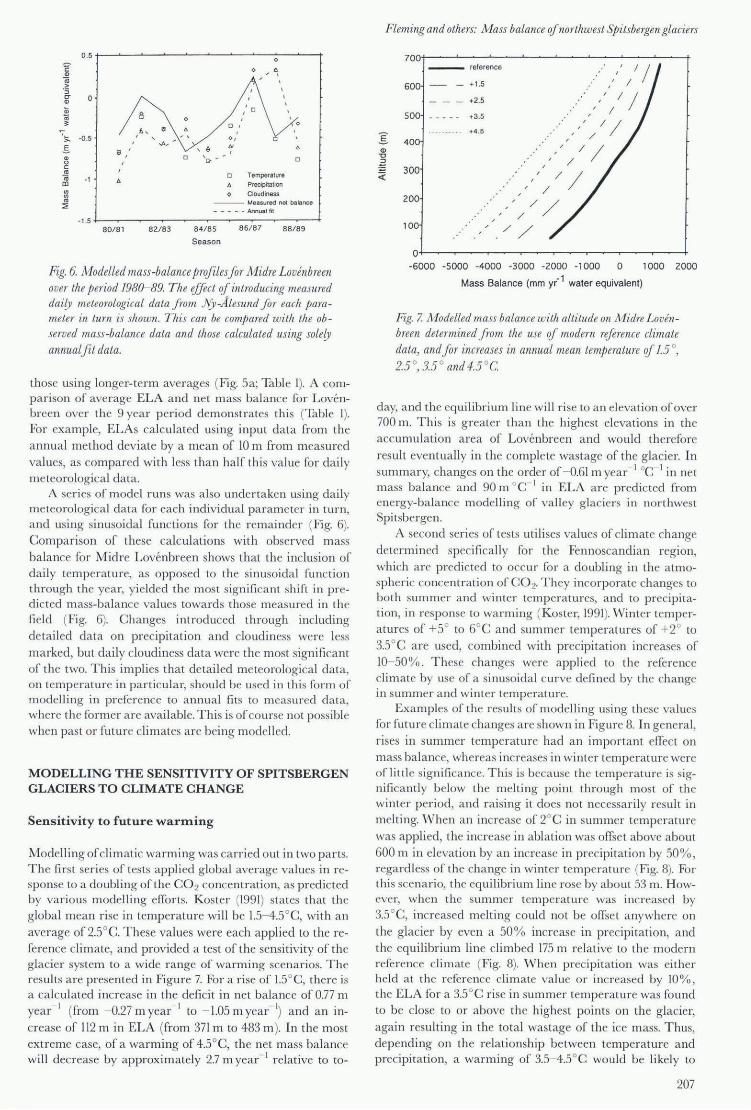
Fig. 6. ModeLLed mass -balance prrifiles for M idre Lovenbreen over the period 1980-89. The effect rif introducing measured daily meteorological data from Nj -Alesund fa?- each parameter in turn is shown. This can be comjJared with the observed mass-balance data and those calculated using solely annualfit data.
those using longer-term averages (Fig. 5a; Table I). A comp a ri son of average ELA and net mass ba lance for Lovenbreen over the 9 year period demonstrates this (Table I). For example, ELAs calcu lated using input da ta from the annual method deviate by a mean of 10 m from measured values, as compared with less than half this value for daily meteorological da ta.
A series of model runs was a lso undertaken using daily meteorological data for each individual p arameter in tu rn, a nd using sinusoida l functions for the remainder (Fig. 6). Compa ri son of these calcula tions with observed m ass balance for Midre Lovenbreen shows that the inclusion of daily temperature, as opposed to the sinusoidal function through the year, yielded the mos t significant shift in pred icted mass-balance values towards those measured in the fi eld (Fig. 6). Changes introduced through including detailed data on precipitation and cloudiness were less
marked, but daily cloudiness data were the mos t significant of the two. This implies tha t detailed meteorological da ta, on temperature in pa rticular, should be used in this form or modelling in preference to annual fits to measUl-ed data, where the former a re avai lable_ This is of course not possible when p ast or future climates a re b eing modelled.
MODELLING THE SENSITIVITY OF SPITSBERGEN GLACIERS TO CLIMATE CHANGE
Sensitiv ity to future warllling
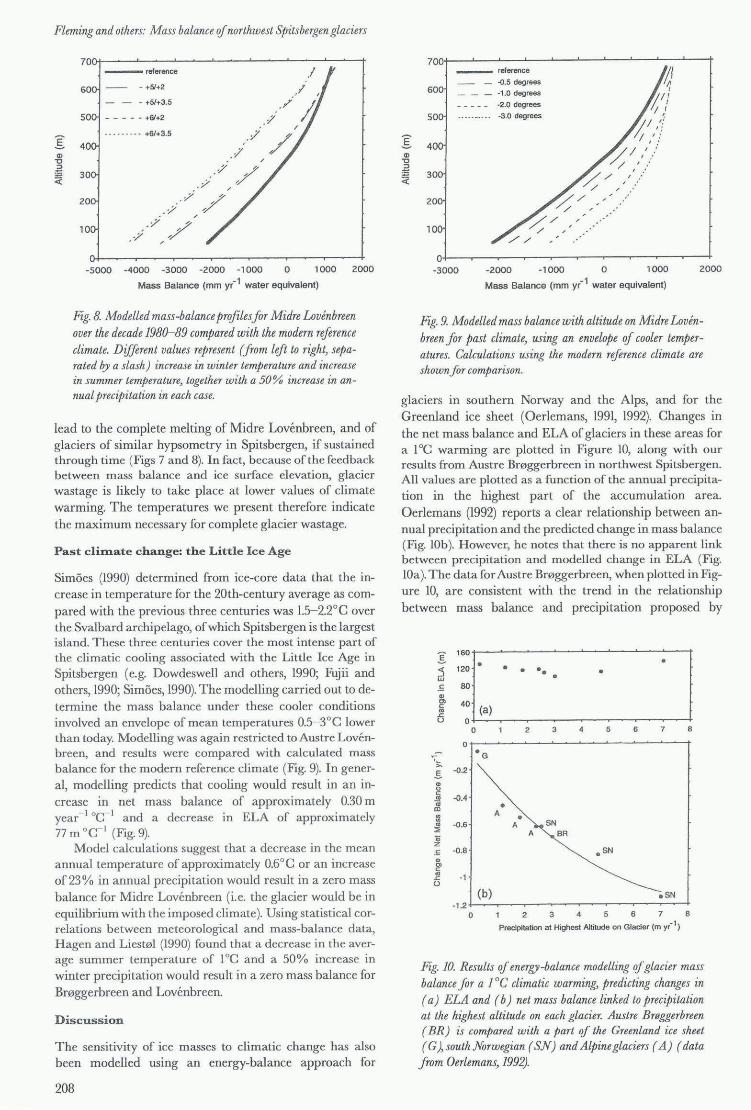
M odelling of climatic wa rming was carried out in two pa rts. The first series of tes ts applied global average values in response to a doubling of the CO 2 concentration, as pred icted by va rious modelling efforts. Koster (1991) sta tes that the global mean rise in temperature will be 1.5-4.5°C, with an
average of 2.5°C. These values were each applied to the reference climate, a nd provided a test of the sensitivity of the glacier system to a wide range of warming scenarios. The results are presented in Figure 7. For a rise of 1.5°C, there is a calculated increase in the deficit in net bala nce of 0.77 m year - I (from - 0.27 m year- 1 to - 1.05 m year- I) and an in
crease of 112 m in ELA (from 371 m to 483 m ). In the most extreme case, of a warming of 4.5°C, the net mass balance will decrease by approximately 2.7 m yea r- I relative to to-
Fleming and others: Mass balance qf northwest Spitsbergen glaciers
I Ql '0
:S ~
700r---~----~--~----~--~--~----~--~ ___ reference
600 +1.5
+2 .5
500 +3.5
+4 ,5
400
300
200
100
O+---~--~--~---~--~---r--~---+
-6000 -5000 -4000 -3000 -2000 -1000 0 1000 2000
Mass Balance (mm yr-1 water equivalent)
Fig. 7. Modelled mass balance with altitude on M idre Lovenbreen determined fro m the use qf modern reference climate data, and for increases in annual mean temperature rif 1.5 °, 2.5 °, 3.5 ° and 4.5 ° C
day, and the equilibrium line will rise to an elevation of over 700 m. This is greater than the highest elevations in the accumulation area of Lovenbreen and would therefore
result eventually in the complete wastage of the glacier. In summa ry, changes on the order of - 0.61 m year- 1 oC 1 in net mass balance and 90 m °c 1 in ELA are predicted from energy-balance modelling of valley glaciers in northwest Spitsbergen.
A second series of tests utili ses values of climate change determined specifically for the Fennoscandian region, which a re predicted to occur for a doubling in the atmospheric concent ration of CO 2, They incorporate changes to
both summer and winter temperatures, and to precipitati on, in response to wa rming (K oster, 1991). Winter tempera tures of +5° to 6°C and summer temperatures of +2 ° to
3.5°C a re used, combined with precipitati on increases of 10- 50%. These changes were applied to the reference cl im ate by use of a sinusoida l curve defined by the ch ange in summer and winter temperature.
Examples of the res ults of modelling using these values for fu ture climate changes are shown in Figure 8. In general, rises in summer temperature had an important effect on mass balance, whereas increases in winter temperature were of little significance. This is because the temperature is significantly below the melting point through most of the winter p eriod, and raising it does not necessarily result in melting. ' !\Then an increase of 2°C in summer temperature was applied, the increase in ablation was offset above about 600 m in elevation by a n increase in precipitation by 50% , regardl ess of the change in winter temperature (Fig. 8). For this scena rio, the equi li brium line rose by about 53 m . H owever, when the summer temperature was increased by 3.5°C, increased melting could not be offse t anywhere on
the glacier by even a 50% increase in precipitation, and the equilibrium line climbed 175 m relative to the modern reference climate (Fig. 8). When precipitation was either held at the reference climate value or increased by 10%, the ELA for a 3.5°C ri se in summer temperature was found to be close to or above the highest points on the glacier,
again resulting in the total wastage of the ice mass. Thus, dep ending on the relationship between temperature and precipitation, a warming of 3.5- 4.5°C would be likely to
207
Fleming and others: Mass balance of northwest Spitsbergen glaciers
-reference
-- - +5'+2
- - - +51+3.5
-----+61+2
- - - - - - - - - +6/+3_5
-5000 -4000 -3000 -2000 -1000 o 1000 2000
Mass Balance (mm y(1 water equivalent)
Fig. 8. Modelled mass-balance profiles Jor Midre Lovenbreen over the decade 1980-89 compared with the modern reference climate. Different values represent (from lift to right, separated by a slash) increase in winter temperature and increase in summer temperature, together with a 50% increase in annual precipitation in each case.
lead to the complete melting of Midre Lovenbreen, and of glaciers of similar hypsometry in Spitsbergen, if sustained through time (Figs 7 and 8). In fact, because of the feedback between mass balance and ice surface elevation, glacier wastage is likely to take place at lower values of climate warming. The temperatures we present therefore indicate the maximum necessary for complete glacier wastage.
Past cliInate change: the Little Ice Age
Simoes (1990) determined from ice-core data that the increase in temperature for the 20th-century average as compared with the previous three centuries was 1.5- 2.2°C over the Svalbard archipelago, of which Spitsbergen is the largest island. These three centuries cover the most intense part of the climatic cooling associated with the Little Ice Age in Spitsbergen (e.g. Dowdeswell and others, 1990; Fujii and others, 1990; Simoes, 1990). The modelling carried out to determine the mass balance under these cooler conditions involved an envelope of mean temperatures 0.5- 3°C lower than today. Modelling was again restricted to Austre Lovenbreen, and results were compared with calculated mass balance for the modern reference climate (Fig. 9). In general, modelling predicts that cooling would result in an increase in net mass balance of approximately 0.30 m year- 1 oC- I and a decrease in ELA of approximately 77 m °C- I (Fig. 9).
Model calculations suggest that a decrease in the mean annual temperature of approximately 0.6°C or an increase of 23 % in annual precipitation would result in a zero mass balance for Midre Lovenbreen (i.e. the glacier would be in equilibrium with the imposed climate). Using statistical correlations between meteorological and mass-balance data, Hagen and Liest,,:!! (1990) found that a decrease in the average summer temperature of 1°C and a 50% increase in winter precipitation would result in a zero mass balance for Bmggerbreen and Lovenbreen.
Discussion
The sensitivity of ice masses to climatic change has also been modelled using an energy-balance approach for
208
700+--~~~~-~--L-~-~-~-~--t
400
300
_ reference
_ _ -0.5 degrees
___ -1.0 degrees
-2_0 degrees _______ ___ -3_0 degrees
~! I
0+-~--~--~--~~--~--~~--~--4
-3000 -2000 -1000 o 1000 2000
Mass Balance (mm y(1 water equivalent)
Fig. 9. Modelled mass balance with altitude on Midre Lovenbreen Jor past climate, using an envelope of cooler temperatures. Calculations using the modern reference climate are shownfor comparison.
glaciers in southern Norway and the Alps, and for the Greenland ice sheet (Oerlemans, 1991, 1992). Changes in the net mass balance and ELA of glaciers in these areas for a 1°C warming are plotted in Figure 10, along with our results from Austre Bmggerbreen in northwest Spitsbergen. All values are plotted as a function of the annual precipitation in the highest part of the accumulation area. Oerlemans (1992) reports a clear relationship between annual precipitation and the predicted change in mass balance (Fig. lOb). However, he notes that there is no apparent link between precipitation and modelled change in ELA (Fig. lOa). The data for Austre Bmggerbreen, when plotted in Figure 10, are consistent with the trend in the relationship between mass balance and precipitation proposed by
. .. ~ ::j. :. I ::~i_(a_)~ ___ ~ __ ~ __ ~ __ ~ __ ~ __ ~ __ -4
.~
.s -0.2
'" o c: co -OA
~ ~
:li1 -0_6
a; z _5: -O_B OD Cl c: ~ -1 CJ
o
(b)
• A
A
2 3 4 5 6 7 B
. SN
A BR
.SN -1.2+--------~-~-~----+
o 2 3 4 5 6 7 B
Precipitation at Highest Altitude on Glacier (m y,l)
Fig. 10. Results of energy-balance modelling of glacier mass balance Jor a 1°C climatic warming, predicting changes in ( a) ELA and (b) net mass balance linked to precipitation at the highest altitude on each glacier. Austre Breggerbreen ( BR) is compared with a part of the Greenland ice sheet (G), south Norwegian (SN) and Alpine glaciers (A) (data from Oeriemans, 1992).
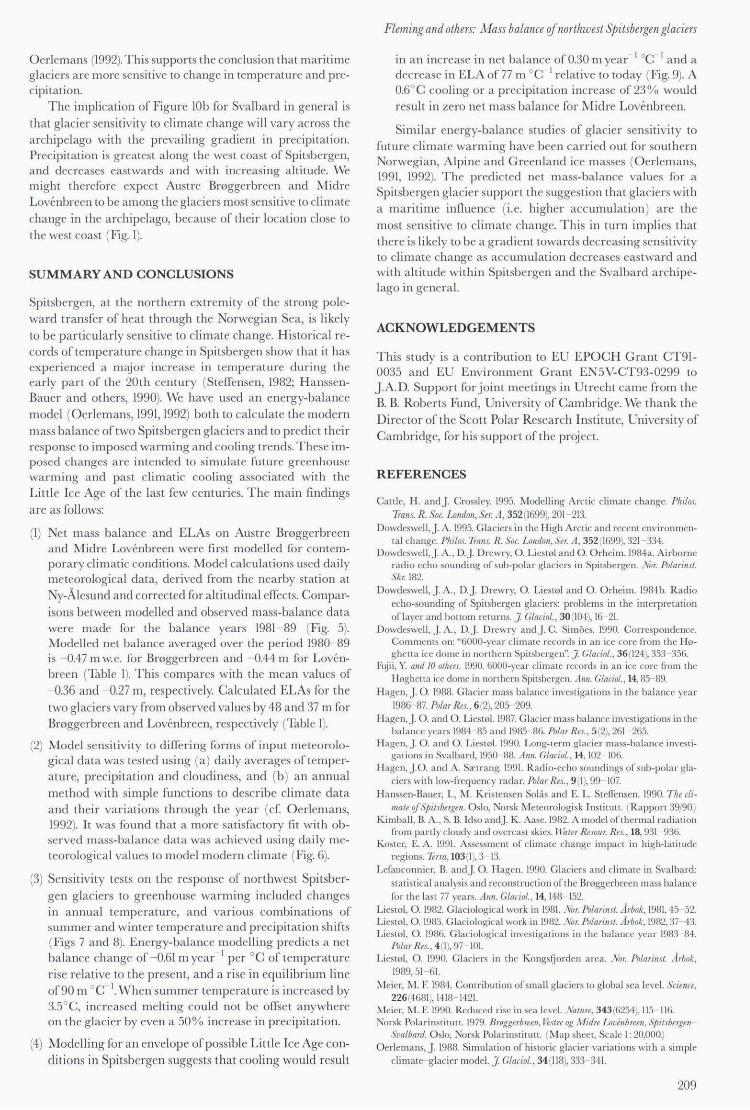
O erlemans (1992). This supports the conclusion that maritime glaciers are more sensitive to change in temperature and precipitation.
The implication of Figure lOb for Svalbard in general is
that glacier sensitivity to climate change will vary ac ross the a rchipelago with the prevailing gradient in precipitation. Precipitation is greatest along the west coast of Spitsbergen, and decreases eastwards and with increas ing altitude. We might therefore expect Austre Br0ggerbreen and Midre Lovenbreen to be among the glaciers most sensitive to climate
change in the archipelago, because of their location close to
the west coast (Fig. 1).
SUMMARY AND CONCLUSIONS
Spitsbergen, at the northern extremity of the strong poleward transfer of heat through the Norwegian Sea, is likely to be pa rticula rly sensitive to climate change. Historical records of temperature change in Spitsbergen show that it has experienced a major increase in temperature during the early part of the 20th century (Steffensen, 1982; H anssenBauer and others, 1990). We have used an energy-balance model (O erlem ans, 1991, 1992) both to calculate the modern mass balance of two Spitsbergen glaciers and to predict their response to imposed warming and cooling trends. These imposed changes are intended to simulate future greenhouse warming and past climatic cooling associated with the Little Ice Age of the last few centuries. The main findings
a re as follows:
(I) Net mass balance and ELAs on Austre Broggerbreen and Midre Lovenbreen were first modelled for contempora ry clim atic conditions. Model calculations used dail y meteorological data, derived from the nearby station at Ny-Alesund and corrected for altitudinal effects. Comparisons between modelled and observed mass-balance data were made for the balance years 1981- 89 (Fi g. 5). Modelled net balance averaged over the period 1980- 89 is - 0.47 m w.e. for Broggerbreen and - 0.44 m for Lovcnbreen (Table I). This compares with the mean values of - 0.36 and - 0.27 m, respectively. Calculated ELAs for the
two glaciers vary from observed values by 48 and 37 m for Br0ggerbreen and Lovenbreen, respectively (Table I).
(2) M odel sensitivi ty to differing form s of input meteorological data was tes ted using (a ) daily averages of tempera ture, precipitation and cloudiness, and (b) an annual method with simple fun ctions to describe climate data and their variations through the year (cf. O erlemans, 1992). It was found that a more satisfactory fit with observed mass-balance data was achieved using daily meteorological values to model modern climate (Fig. 6).
(3) Sensitivity tests on the response of northwest Spitsbergen glaciers to g reenhouse warming included changes in annual temperature, and various combinations of summer and winter temperature and precipita tion shifts (Figs 7 and 8). Energy-balance modelling predicts a net balance change of - 0.61 m year I per QC of temperature
ri se relative to the present, and a rise in equilibrium line of 90 m QC- I. When summer temperature is increased by 3.5
QC, increased melting could not be offse t anywhere
on the glacier by even a 50 % increase in precipit ation .
(4) Modelling for an envelope of possible Little Ice Age conditions in Spitsbergen suggests that cooling would result
Fleming and others: Mass balance r.if northwest Spitsbelgen glaciers
in an increase in net ba lance of 0.30 m year I QC I a nd a decrease in ELA of 77 m QC I relative to today (Fig. 9). A 0.6
QC cooling or a precipitation increase of 23 % would
result in zero net mass balance for Midre Lovenbreen.
Simil ar energy-bala nce studies of glacier sensitivity to future climate warming have been carri ed out for southern Norwegian, Alpine and Greenland ice m asses (O erlemans, 1991, 1992). The predicted net mass-balance values for a Spitsbergen glacier support the suggestion that glaciers with a maritime influence (i.e. higher acc umulation ) a re the most sensitive to climate change. This in turn impli es that there is likely to be a g radient towards dec reasing sensitivity to climate change as acc umul ation decreases eastward and with altitude within Spitsbergen and the Svalbard a rchipelago in general.
ACKNOWLEDGEMENTS
This study is a contribution to EU EPOCH Grant CT91-0035 and EU Environment Grant EN5V-CT93-0299 to J.A.D. Support for joint mee tings in Utrecht came from the B. B. Roberts Fund, University of Cambridge. We thank the
Director of the Scott Polar Research Institute, University of Cambridge, for his support of the proj ect.
REFERENCES
Cattle, H . a ndJ Crossley. 1995. Modelling Arctic cl imate change. Philos. Trans. R. Soc. London, Ser. A, 352 (1699), 201 - 213.
Dowdeswc1I ,J A. 1995. Glaciers in the High Arctic and recent environmenta l change. Philos. Trans. R. Soc. London, Ser. 11 , 352 (1699), 321- 33'k
Dowdeswell , j. A. , Dj. Drewry, o.. Lies tol and 0. o.rheim. 1984a. Ai rborne rad io echo sounding of sub-pola r glaciers in Spitsbergcn. Nor. Polarinst. Skr. 182.
Dowdeswell, J A. , DJ D rewr y, o.. Li estol and 0. o.rheim . 1984b. R adio echo-sounding of Spitsbergen glaciers: problems in the interpretation of laye r and bottom returns. J. Glacial. , 30(104), 16 21.
Dowdeswc1l, j. A., Dj. Drewry andj. C. Simoes. 1990. Correspondence. COInnlcn ls o n: "6000-year c1 inl ate records in a n ice core fro lll the Hoghe tta ice dome in northern Spitsbe rgcn'~] Glacial. , 36 (124), 353 356.
FtUii , Y. and 10 olhers. 1990. 6000-yea r cl imate records in an ice core from the Hoghetta ice dome in northern Spitsbergen. Ann. Glacial. , 14, 85- 89.
H agen, J 0.. 1988. Glacier mass ba lance investigat ions in the ba lance yea r 1986- 87. Polar Res. , 6(2), 205- 209.
Hagen,]. 0. and o.. Lies tol. 1987. Glacier mass ba lance investigations in the ba lance years 1984- 85 and 1985- 86. Polar Res., 5(2), 261- 265.
Hagen, .J. 0. and 0. Liestol. 1990. Long-term glacier mass-balance investigations in Svalbard, 1950 88. Ann. Glacial. , 14, 102- 106.
H agcn, j.o.. and A. S;:ctrang. 1991. R adio-echo soundings of sub-pola r glaciers with low-frequency radar. Polar Res., 9 (1), 99 107.
H anssen-Baucr, I. , M. Kristensen Solas and E. L. StefTensen. 1990. T he climate qfSpitsbergen. o.slo, Norsk M ctcorologisk I nstitu tt. (Rapport 39/90.)
Kimball, B. A. , S. B. Idso andj. K. Aase. 1982. A model of thermal radiation fro m pa rtl y cloud y a nd overcast ski es. r11ater ResolJr. Res., 18,931 936.
Koster, E. A. 1991. Assessment of climate cha nge impact in high-latitude regions Terra, 103(1), 3 13.
Lefauconnier, B. a nd]. 0.. H agen. 1990. Glaciers a nd cl imate in Svalbard:
statistical ana lysis and reconstruction ofth c Broggerbreen mass ba lance for the last 77 yea rs. Ann. Glacial., 14, 148 152.
Liestol , o.. 1982. G lac iological work in 1981. Nor. Polar/nsl. Arbok, 1981, 45 52. Liestol, o.. 1983. Glaciological wo rk in 1982. Nor. Polarillst. Arbok, 1982, 37- '1·3. Licstol, o.. 1986. Glaciologica l investi gations in the balance year 1983- 84.
Polar ReI. , 4 (1), 97- 101. Liestol , o.. 1990. Gl ac iers in the KongsQorden a rea. Nor. Polar/nst. Arbok,
1989,51- 61. Meier, M. F. 1984. Contribution of small glaciers to global sea level. Sc/ellce,
226 (4681), 1418- 1421. Meier, M . F. 1990. Reduced ri se in sea level. Nature, 343(6254), 115- 11 6. Norsk Pola rinstitutl. 1979. Broggerbreell, Ve.flre og !lfidre Lovenbreen, S/ritsbergen
Svalbard. o.slo, Norsk Pola rinstitutt. (M ap shee t, Sca le I : 20,000.) o.erl cmans, ]. 1988. Simula tion of hi storic glacier vari ations with a simple
clim ate- glac ier model. J. Glaciol. , 34 (11 8), 333 3'H.
209

Fleming and others: Mass balance qf northwest Spitsbergenglaciers
Oeriemans, j. 1991. The mass balance of the Greenland ice sheet: sensitivity to climate change as revealed by energy-balance modelling. Halacene, 1 (I), 40- 49.
O eriemans, j. 1992. Climate sensitivity of glaciers in southern Norway: application of an energy-ba lance model to Niga rdsbreen, Hell stugubreen and Alfotbreen. ] GLacial., 38(129), 223- 232.
Oeriemans, j. andj. P. F. Fortuin. 1992. Sensitivity of glaciers and small ice caps to greenhouse warming. Science, 258 (5079), 115- 117.
O crlemans, j. and N. C. Hoogendoorn. 1989. M ass-ba lance gradients and
clim atic change. J. Glacial., 35(121), 399- 405.
210
Simoes, j. C. 1990. E nvironmenta l interpretation from Svalbard ice cores. (Ph.D. thesis, Uni versity of Cambridge.)
Steffensen, E. L. 1982. The climate at Norwegian Arctic stations. Klima ( Det Narske lvfetearalagiske lnstitutt) 5, 30- 44.
Sto uffer, R.j. , S. Manabe ancl K. Bryan. 1989. Interhemispheric asymmetry in climate response to a gradual increase of a tmospheric carbon d iox ide. Nature, 342 (6250), 660--662.
Walraven, R . 1978. Calculating the position of the Sun. SoL. Energy, 20,393-397.
Walsh, j. E. 1991. The Arctic as a bellwether. Nature, 352 (6330), 19-20.