modelling the cost of community health services in sierra ...€¦ · the community health planning...
TRANSCRIPT

i
Modelling the Cost of Community Health Services in Sierra Leone: the Results of Piloting
a New Planning and Costing Tool
30 September, 2016 Maternal, Newborn and Child Health Working Paper UNICEF Health Section, Program Division
unite for children

ii
Modelling the Cost of Community Health Services in Sierra Leone: the Results of Piloting a New Planning and Costing Tool © United Nations Children’s Fund (UNICEF), New York, 2012 Knowledge Management and Implementation Research Unit, Health Section, Program Division UNICEF 3 UN Plaza, New York, NY 10017 September 2016 The Community Health Planning and Costing Tool is a UNICEF tool that was developed by Management Sciences for Health (MSH), under contract 43188968 funded by UNICEF, New York. All trademarks and service marks, including Microsoft, MS, the XL design (the Microsoft Excel logo), and the logos of Microsoft Corporation, are the exclusive property of Microsoft Corporation. Use of the Community Health Planning and Costing Tool requires a license of appropriate spreadsheet software, such as Microsoft Excel available by license from Microsoft Corporation. The Community Health Planning and Costing Tool is not a product of, or endorsed by, Microsoft Corporation. The designations in this tool do not imply an opinion on legal status of any country or territory, or of its authorities, or the delimitation of frontiers. This is a working document. It has been prepared to facilitate the exchange of knowledge and to stimulate discussion. The findings, interpretations and conclusions expressed in this paper are those of the authors and do not necessarily reflect the policies or views of UNICEF or of the United Nations. The text has not been edited to official publication standards, and UNICEF accepts no responsibility for errors. The designations in this publication do not imply an opinion on legal status of any country or territory, or of its authorities, or the delimitation of frontiers.
COVER PHOTO: “Community Health Workers in Kono District,” Colin Gilmartin (Management Sciences for Health)

iii
Modelling the Cost of Community Health Services in
Sierra Leone The Results of Piloting a New Planning and
Costing Tool
Colin Gilmartin, Kemi Tesfazghi, Christopher Villatoro, and David Collins
Keywords: Community Health Services, Sierra Leone, Costing, Finance, Planning
Comments may be addressed by email to Jerome Pfaffman ([email protected])
MATERNAL, NEWBORN AND CHILD HEALTH
WORKING PAPER
September 2016

iv
Acknowledgements This study was conducted by Management Sciences for Health (MSH) with funding from UNICEF/NY.
Primary collaboration was provided by UNICEF Sierra Leone and the Ministry of Health and Sanitation (MOHS). In addition, key partners in conducting this analysis were World Hope International (WHI) and the International Rescue Committee (IRC). MSH staff collected information on CHW program costs and conducted interviews with MOHS staff and NGO staff in Freetown and MOHS staff, NGO staff, Community Health Workers (CHWs), and CHW supervisors in Bombali and Kono Districts.
We wish to thank the following people from the MOHS who were instrumental in carrying out this analysis. From the Freetown MOHS office: Dr. Joseph Kandeh, Foday Sawi Lahai, Anitta Kamara, Elizabeth Musa, Mara Kardas-Nelson, Richard Musa, and Albert Vandy. From Bombali District: Dr. Brima Osaio Kamara and Bundu Conteh. From Kono District: Dr. Manso S. Dumbuya, Moses P. Kortu, and Alieu Banguro. Special thanks are due to Brima Bangura and Momoh Koyanday from WHI and John Kpaleyea and Sahr Fillie from the IRC. We also wish to thank Jerome Pfaffmann, Dr. Nuzhat Rafique, and Dr. Kebir Hassen from UNICEF for their support and technical contributions in shaping this study.
We also would like to thank the members of the MSH project support team for their valuable feedback and suggestions on the pilot design. The Malawi piloting team was comprised of William Newbrander, Sara Wilhelmsen, and Sarah Davey. The Sierra Leone team was comprised of Colin Gilmartin, Christopher Villatoro, and Kemi Tesfazghi. The overall project was directed by David Collins and supported by Kevin Gunter. Special thanks are extended to Zina Jarrah, an independent consultant, for the development of the Community Health Planning and Costing Tool and for her guidance on its use.

v
Table of Contents Acknowledgements ................................................................................................................................ iv
Executive Summary ............................................................................................................................... vii
Acronym List .......................................................................................................................................... ix
Background: Importance of Costing and Community Health Services ................................................... 1
Country Introduction: Sierra Leone’s Health Situation and Health Care System ................................... 2
Community Health Services ................................................................................................................ 4
Methodology ........................................................................................................................................... 7
Findings ................................................................................................................................................. 11
Bombali District ................................................................................................................................. 12
Kono District ...................................................................................................................................... 16
Comparison of Bombali and Kono Districts ...................................................................................... 20
Bottlenecks to Service Delivery............................................................................................................. 22
Discussion.............................................................................................................................................. 26
Conclusions ........................................................................................................................................... 26
Annexes ................................................................................................................................................. 30
Annex 1. CHW Scope of Work (June 2012) ...................................................................................... 30
Annex 2. CHW Scope of Work (Draft – June 24, 2016) ................................................................ 31
Annex 3. National Package of Community Health Services ............................................................. 34
Annex 4. Bombali District Population and Health Service Structure (2015-2025) .......................... 40
Annex 5. Bombali District - Numbers and Percentages of Services by Program and Number of CHW Hours Required (2015-2025) ................................................................................................... 42
Annex 6. Bombali District - Summary of Costs by Input and by Program (2015-2025), USD .......... 46
Annex 7. Bombali District – Actual and Projected Numbers of Services (2015-2015) .................... 50
Annex 8. Kono District Population and Health Service Structure (2015-2025) ............................... 55
Annex 9. Kono District - Numbers and Percentages of Services by Program and Number of CHW Hours Required (2015-2025)............................................................................................................. 57
Annex 10. Kono District - Summary of Costs by Input and by Program (2015-2025), USD .............. 61
Annex 11. Kono District – Actual and Projected Numbers of Services (2015-2015) ........................ 65
Annex 12. Key Informants ................................................................................................................. 69
Annex 13. References ....................................................................................................................... 70

vi

vii
Executive Summary There is growing evidence on the benefits of community health services (CHS) and the importance of community health workers (CHWs) in achieving access to universal health coverage. However, there is minimal information on the costs and required financing for effective, integrated community health worker (CHW) programs. It has become clear that there is a need for a methodology and tool to facilitate the planning and costing of comprehensive packages of community health services to ensure they are impactful, adequately financed, and sustained. UNICEF engaged Management Sciences for Health (MSH) to develop a methodology and tool for planning and costing CHS and this tool was piloted in Malawi and Sierra Leone in 2016. In Sierra Leone, CHWs play a critical role in extending access to health services, particularly in underserved and hard-to-reach areas, through support from the state government, UNICEF, non-governmental organizations, among other stakeholders. Recognizing the important role CHWs play in delivering high-impact services, the Government of Sierra Leone (GoSL) is currently revising its 2012 National CHW Policy with plans to scale-up the provision of a comprehensive set of CHS in all communities across the country with the overall objective of reducing maternal and child morbidity and mortality. As of August 2016, the MOHS was in the process of finalizing the 2016 National CHW Policy. With the proposed introduction of the revised National CHW Strategy in 2016, there will be significant changes to the National CHW Program including increased geographic coverage of CHWs, an expanded package of CHS, greater emphasis on CHW supervision and training, and increased financial incentives for CHWs, supervisors, and program support personnel. Given the proposed changes to the CHW program, Sierra Leone served as an ideal country to pilot the new methodology and tool with the understanding that the results could be beneficial in improving and expanding CHS, as well as understanding the cost implications of the proposed policy changes. In February and March 2016, a team of MSH staff and consultants collaborated with the MOHS, UNICEF/Sierra Leone, and other stakeholders to collect data for piloting the methodology and tool. MSH staff conducted interviews and collected data at all levels of the health system, including visits to health facilities in two districts where facility staff, CHW supervisors, and CHWs were interviewed. MSH staff then analyzed the data using the tool. The piloting was successful and the relevant lessons learned have been incorporated in the final version of the methodology and tool. The exercise provided an invaluable analysis of the cost of CHS in Sierra Leone. The time and resources available for the study were limited and therefore results are not definitive and do not represent the country as a whole. However, there were many relevant findings, which include the following: • With the proposed introduction of the revised National CHW Strategy in 2016, there will be
significant changes to the National CHW Program. These programmatic changes include increased geographic coverage of CHWs, expanded package of CHS, greater emphasis on CHW supervision and training, and increased financial incentives provided to CHWs, Peer Supervisors, and program support personnel. These changes will in turn impact the total costs of the program.
• There were significant variations in the package of CHS offered in both districts in 2015 as CHWs in Bombali District did not provide integrated community case management (iCCM) treatments and the majority of services provided were for MNCH (ANC and PNC promotional home visits)

viii
and iCCM referrals. In Kono District in 2015, the majority of services were for iCCM and MNCH. By 2025, the majority of services would be for iCCM and adult malaria case management.
• Based on utilization estimates of services, it appears that CHS were under-utilized in 2015. In Bombali District, CHWs spent an estimated five percent of their time (based on an estimated 20 working hours per week) providing nine of the 42 services included in the package of CHS in 2015. In Kono District, CHWs spent an estimated eight percent of their time providing 10 of the 42 services included in the package of CHS in 2015.
• Given the modelled increases in services for 2016-2025, it estimated that CHWs would need to spend considerably more time (beyond the number of working hours) to provide the package of services at the modelled coverage rates by 2025.
• The issue of stock-outs of medicines and commodities at both the community and health facility level represent a significant bottleneck which, unless resolved, will limit the success and impact of the proposed expansion of the National CHW program. Solutions for addressing this bottleneck should be further explored and additional quantification should be conducted in all districts implementing the National CHW program.
• The average total cost per capita in 2015 for the two districts was USD 3.92 in Bombali District and USD 2.48 in Kono District. With the projected increases in coverage and utilization, in addition to the introduction of revised National CHW Policy, the cost per capita would decrease to USD 3.81 in Bombali District1 and increase to USD 4.07 in Kono District.
• In 2015, the main cost drivers of the CHW programs in Bombali and Kono Districts were program management and equipment. With the projected increases in coverage and utilization, as well as the programmatic changes resulting from the introduction of the revised National CHW Policy, the main cost drivers of the CHW programs in Bombali and Kono Districts would be for medicines, supplies, and commodities as well as for management and CHW salaries (i.e. financial incentives).
• In 2015, the majority of programs costs were for iCCM services and disease prevention and control in Bombali and Kono Districts. In 2025, with the projected increases in coverage and utilization, the majority of program costs would be for iCCM, adult malaria case management, and other services (e.g. house-to-house visits and community mapping conducted by CHWs).
As noted in the discussion section, the costs of expanding CHS in the two districts relate mainly to increases in medicines, supplies and commodities. These costs may not all be incremental, since, to some, degree they may be replacing the medicines, supplies and commodities that are currently provided at health facilities. If that is the case, the expansion of services may reduce health system unit costs and household costs and contribute to the delivery of more cost-effective services at both the community and health facility levels.
1 The cost per capita in Bombali appears to fall because a significant amount of start-up costs were included in 2015.

ix
Acronym List ACT Artemisinin Based Combination Therapy
AIDS Acquired Immunity Deficiency Syndrome
ANC Antenatal Care
ARI Acute Respiratory Infection
BEmONC Basic Emergency Obstetric and Neonatal Care
BPEHS Basic Package of Essential Health Services
CEBS Community Events Based Surveillance
CHWs Community Health Workers
CHC Community Health
CHP Community Health Post
CHS Community Health Service
CMAM Community-Based Management of Acute Malnutrition
DHMT District Health Management Team
DMO District Medical Officer
DPC Disease Prevention and Control
EVD Ebola Virus Disease
FANC Focused Antenatal Care
Fefol Iron and Folate
FHCI Free Health Care Initiative
FP Family Planning
GoSL Government of Sierra Leone
HIV Human Immune-Deficiency Virus
HMIS Health Management Information System
iCCM Integrated Community Case Management
IDSR Integrated Disease Surveillance Reporting
IEC Information, Education and Communication
IPTp Intermittent Preventive Treatment for Pregnant Women
IRC International Rescue Committee
ITN Insecticide Treated Net
IYCF Infant and Young Child Feeding

x
LLIN Long Lasting Insecticide Net
MAM Moderate Acute Malnutrition
MCH Maternal and Child Health
MCHP Maternal and Child Health Post
MDGs Millennium Development Goals
M+E Monitoring and Evaluation
MNCH Maternal, newborn, and child health
MOHS Ministry of Health and Sanitation
MSH Management Sciences for Health
MUAC Mid-Upper Arm Circumference
NGO Non-Governmental Organization
NIDS National Immunization Days
ORS Oral Rehydration Salts
PHU Peripheral Health Unit
PMTCT Prevention of Mother to Child Transmission
RDT Rapid Diagnostic Tests
RH Reproductive Health
RMNCH Reproductive, maternal, and child health
RUTF Ready-to-Use Therapeutic Food
SAM Severe Acute Malnutrition
SECHN State Enrolled Community Health Nurses
SFP Supplementary Feeding Program
SIAPS Systems for Improved Access to Pharmaceuticals and Services Program
SLDHS Sierra Leone Demographic and Health Survey
TB Tuberculosis
TBA Traditional Birth Attendant
UNDP United Nations Development Programme
UNICEF United Nations Children’s Fund
USAID United States Agency for International Development
VDC Village Development Committee
WHI World Hope International
WHO World Health Organization

1
Background: Importance of Costing and Community Health Services
There is growing evidence on the benefits of community health services (CHS) as a key strategy to promote healthy behavior and improve access to high-impact maternal, newborn, and child health interventions from pregnancy to adolescence. Much less is known, however, of the financing needs for effective, comprehensive CHS and, without this information, programs are often under-funded and financially unsustainable. Additionally, opportunities to include CHS financing in insurance packages or in new global funding mechanisms (such as the Global Fund to Fight AIDS, Tuberculosis, and Malaria) are frequently missed.
Adequate financing can only be achieved if costs are known. While certain elements of CHS (e.g. malaria case management and prevention, family planning, reproductive health, and iCCM) have been costed individually, there is little or no information on the cost of comprehensive CHS. Effective CHS depend on a sound overall health platform which ensures that all key elements (e.g. training, equipment, medicines and supplies, management and supervision, transport, financing, information systems, quality control, demand generation, governance, etc.) function well. These resources must be combined efficiently to maximize outputs and outcomes while ensuring high-quality service provision. Demand generation is particularly important as health services are not cost-effective unless they are well-utilized. Equally important is the use of financial and non-financial incentives for CHWs to ensure they are motivated and well-performing as programs with high rates of CHW attrition are generally neither cost-effective nor sustainable.
Recognizing the need to assist countries in the development and scale-up of effective CHS, Management Sciences for Health (MSH), through funding and technical contributions from the United Nations International Children's Emergency Fund (UNICEF), has developed a methodology and tool to support the creation of CHS investment cases. MSH has piloted this methodology and tool in Malawi and Sierra Leone, countries which were selected given the important role that CHWs play within each of the country’s health system. The purpose of this piloting was to test the methodology and tool in real situations with the understanding that the results could be beneficial in improving and expanding CHS, as well as understanding the cost implications of the proposed policy changes by the Sierra Leone Ministry of Health and Sanitation (MOHS)
The following report details the results and findings of the pilot study conducted in Sierra Leone in February – March 2016. The results of this study serve to support the MOHS and partners across a range of countries in the development of comprehensive community health strategies. The lessons learned from the piloting have been incorporated in the final version of the methodology and Community Health Planning and Costing Tool and guidelines, which are available from UNICEF and MSH.

2
Country Introduction: Sierra Leone’s Health Situation and Health Care System Health Situation
Prior to the outbreak of the Ebola virus disease (EVD) in 2014, Sierra Leone had made considerable progress toward achieving its Millennium Development Goals (MDGs). Following the 2010 launch of its Free Health Care Initiative (FHCI), which abolished user fees for children under five years of age as well as for pregnant and breast-feeding women, the country reportedly experienced marked reductions in childhood and maternal mortality as well as increased access for family planning, skilled birth attendance, and nutrition services1 in the face of some of the highest rates of infant, child and maternal mortality rates worldwide.ii An overview of the country’s key health indicators are included below in Table 1.
Table 1. Overview of Health Indicators in Sierra Leone 2
Indicator National Value (2013)
Total fertility rate 4.9 births per woman
Contraceptive prevalence rateiii 16.6%
Antenatal care coverage: at least one visit with a skilled provider 97.1%
Antenatal care coverage: four or more visits with any health care provider 76.0%
Births assisted by a skilled provider 60%
Maternal mortality ratio 1,165 per 100,000 live births
Adolescent birth rate 125.1 per 1,000 women ages 15-19
Under five mortality rate 156 per 1,000 live births
Infant mortality rate 92 per 1,000 live births
Neonatal mortality rate 39 deaths per 1,000 live births
Under-5 children sleeping under an insecticide treated net (ITN) 49.0%
Source: Sierra Leone Demographic and Health Survey 2013
However, as the EVD outbreak intensified and interruptions to the delivery of health services increased, the public’s confidence in the health system grew weak and previous gains toward improving health outcomes and achieving the MDGs were reversed in the context of unprecedented economic effects.iv 3 While most peripheral health units (PHUs) remained functional during the EVD outbreak,v attendance and national coverage for maternal and child health services decreased significantly, as evidenced by a 14 percent reduction in antenatal care (ANC) visits, a seven percent reduction in women attendance, and a 43 percent reduction in under-five treatment for malaria ii 2013 indictors: Infant mortality: 92 deaths per 1,000 live births; Under-five mortality: 156 under-five deaths per 1,000 live births; Maternal mortality: 1,165 maternal deaths per 100,000 live births. Source: Sierra Leone Demographic and Health Survey 2013. iii Percentage of currently married women age 15-49 using any method of contraception. iv Between 2013 and 2015, Sierra Leone’s Human Development Index ranking dropped from 177 to 181. v Sierra Leone Health Facility Assessment 2015: Impact of the EVD Outbreak on Sierra Leone’s Primary Health Care System

3
between May 2014 and January 2015.4 Supportive supervision visits to CHWs declined during this period as financial and human resources were diverted to address the EVD epidemic, with many CHWs enlisting as contact tracers, social mobilizers, and surveillance monitors.5 CHWs that were previously trained on iCCM also stopped providing rapid diagnostic tests (RDTs) for malaria and provided presumptive treatment (based on signs and symptoms) for fever, due to the no-touch policy put in place by the MOHS.6
As outlined in its National Post Ebola Recovery Strategy (2015-2017), the country’s key post-EVD objectives are to restore access to basic health care, restore trust among the population, and strengthen its fragile health system. Some of the most significant challenges facing the health system include a significant shortage of skilled health workers, frequent stock-outs of essential drugs and medicines, and sub-standard quality of care for basic health services. Fifty-four percent of all health positions remain vacant and an estimated 50 percent of all health professionals are based in Freetown serving an estimated 16 percent of the population.7 Among the country’s 1,185 PHUs, only 35 percent reported having the basic equipment required for service delivery and only 28 percent of the 14 essential medicines were available where needed.8
Health System Overview
Sierra Leone’s health system is comprised of a network of 1,280 health facilities which deliver health services throughout the country’s four regions and 13 health districts. The country’s health system is structured in three tiers: 1) regional and national hospitals for secondary and tertiary care; 2) district hospitals for secondary care; and 3) PHUs for first line, primary health care.
Primary health care is delivered at four levels (three levels of PHUs and the community level through CHWs). PHUs are sub-categorized according to defined functions and catchment population sizes: Community Health Centers (CHCs), Community Health Posts (CHPs), and Maternal and Child Health Posts (MCHPs). At the community level, CHWs are responsible for providing a range of preventive and curative services.
At the central level, the MOHS focuses on policy formulation, including setting standards and quality assurance, resource mobilization, capacity development, technical support, and the provision of nationally coordinated services (e.g. epidemic control, monitoring and evaluation of overall sector performance, and training). At the district level, the District Health Management Team (DHMT) is responsible for the implementation of national health policies and district-level planning and management including the overall planning, implementation, coordination, monitoring and evaluation, and supervision of the district health services (including at the PHU level) under the leadership of the District Medical Officer (DMO). At the district level, routine health data is managed by the district health information system 2 (DHIS-2) and is used for decision making at all levels; however, reporting is often delayed and incomplete.
An overview of the health services provided at each level of the health system is included below in Table 2.

4
Table 2. Overview of Sierra Leone’s Health System
Level Description
Regional Hospital
Regional hospitals are situated within provincial capital towns and provide the full package of services available in district hospitals in addition to specialty and referral services, additional diagnostic imaging services, and treatment of cancers and rare diseases. Regional hospitals are staffed with specialists and are equipped with more complex equipment.
District Hospital
District hospitals serve the entire district with catchment populations of approximately 500,000 people, providing primary care, secondary medical care, emergency medical services, and comprehensive obstetric and neonatal care (CEmONC). District hospitals receive referrals from primary health care facilities, have more than 100 beds, and are staffed with doctors, midwives, nurses, nutritionists, among other categories of health workers.
Community Health Center (CHC)
CHCs are located at the Chiefdom level and serve a catchment population of 10,000 to 20,000 persons. CHCs provide Basic Emergency Obstetric and Neonatal Care (BEmONC), treatment of some sever childhood illnesses, laboratory and pharmacy services same services, screening and referrals for some non-communicable diseases, and surveillance and treatment of epidemic-prone diseases. CHCs are staffed with a community health officer (CHO), State Enrolled Community Health Nurses (SECHN), Maternal and Child Health (MCH) Aides, an epidemiological disease control assistant, and an environmental health assistant.
Community Health Post (CHP)
CHPs are located in small towns and serve a catchment population of 5,000 to 10,000 persons. CHPs address some pregnancy complications and complicated deliveries, treatment of some severe childhood diseases, and surveillance for epidemic-prone diseases. CHPs are staffed by SECHNs and MCH Aides and may have a midwife on staff.
Maternal and Child Health Post (MCHP)
MCHPs are considered the closest health facility to the community and typically serve a population of fewer than 5,000 persons. Staffed by MCH Aides, MCHPs provide a range of basic services including antenatal care, routine deliveries, immediate postnatal and antenatal care, routine vaccination, treatment of childhood illnesses and malnutrition, basic first aid, community outreach services, and surveillance for epidemic-prone diseases. MCHPs are typically staffed by MCH Aides who are supported by community health workers including traditional birth attendants (TBAs).
Community
At the community level, CHWs provide a range of preventive and curative services including community sensitization on priority health topics, iCCM for diarrhea, malaria, and pneumonia, antenatal and postnatal promotional visits, and referrals, among other services. As per the 2012 National CHW Policy, CHWs typically serve a population of between 100 and 500 persons, which can vary depending on the size of the community.
Community Health Services National Community Health Worker Policy and Program Overview
Recognizing the critical role that CHWs play in extending access to health services, particularly in underserved and hard-to-reach areas, the GoSL, in 2012, introduced its National CHW Policy. In addition to consolidating decades of vertical community health programs, the policy set the

5
foundation for the National CHW Program while outlining the guiding principles of CHWs, defining the package of health services, and setting the standards for CHW training, supervision, and reporting (see Annex 1 for the 2012 CHW scope of work).
Building upon efforts in 2012, the 2016 National CHW Policy aims to strengthen and harmonize different community-based programs to provide comprehensive primary health care at the community level. The revised policy provides a detailed scope of work for CHWs (see Annex 2) and guidance for the coordination and implementation of the National CHW Program, supervision for CHWs, remuneration for CHWs, and training requirements. Through this policy, the MOHS aims to scale-up the provision of a comprehensive set of CHS in all communities across the country with the overall objective of reducing maternal and child morbidity and mortality. As of August 2016, the MOHS was in the process of finalizing the 2016 National CHW Policy.
There are considerable differences between the 2012 and 2016 National CHW Policies which will result in significant changes to the National CHW Program. In particular, the 2016 National CHW Policy (draft July 2016) will increase the geographic coverage of CHWs, expand the package of health services that CHWs provide, and place greater emphasis on CHW supervision and training, while increasing the financial incentives provided to CHWs and Peer Supervisors and harmonizing financial incentives provided to program support personnel from the MOHS and implementing partner NGOs. A summary of the key programmatic changes are provided below. For the purpose of this pilot, MSH modelled all policy changes to demonstrate the corresponding implications on total program costs.
• Geographic coverage: As per the 2012 National CHW Policy, CHWs focused primarily on hard-to-reach areas, defined as communities that are more than five km (or one hour’s walk) from a health facility, and CHWs were to serve a population of 100 to 500 people. As per the 2016 policy, CHWs will serve the entire population including persons living adjacent to the PHU. The ratio of hard-to-reach CHWs (i.e. those beyond three km from the PHU) is one to 250 persons and the ratio of CHWs within three km of the PHU is one to 1,000 persons. It is expected that with this policy change, the number of CHWs will increase significantly. According to the MOHS, an estimated 10,500 hard-to-reach CHWs and 4,500 CHWs (within three km of the PHU) will be trained nationally; however, it will be the responsibility of each DHMT to determine the required number of CHWs to implement this policy.
• Package of CHS: As per the 2012 policy, CHWs primarily conducted community sensitization and advocacy; conducted home visits (including ANC and PNC promotional visits); provided growth monitoring and iCCM services (i.e. assessment and treatment of diarrhea, malaria, and pneumonia); and provided referrals. However, the package of health services was not standardized across districts. The 2016 policy will harmonize and expand the package of CHS to include adult malaria case management; family planning (e.g. refills of oral contraceptives and provision of male condoms); the provision of intermittent preventive therapy for pregnant women (IPTp) during second and third ANC promotional visits; and integrated-disease surveillance and reporting, among other health services. A complete list of the revised package of CHS can be found in Annex 2.
• Training: The 2012 policy recommended a basic 10-day standardized CHW training program and refresher training twice every year; however, training curricula varied by district depending on

6
the availability of funding and the implementing partner NGO which supported the CHW program. The 2016 National CHW Policy specifies that CHWs will complete three eight-day training modules in the first year (24 days total) followed by an annual refresher training lasting five days. The Peer Supervisors will receive the same training as the CHWs in addition to a five-day standard supervisor training followed by one annual four-day refresher training.
• Supervision: The 2016 policy places greater emphasis on supervision compared to the 2012
National CHW Policy which primarily emphasized data collection from CHWs and allowed peer supervisors to simultaneously serve as CHWs and provide health services.9 The 2016 National CHW Policy aims to ensure that CHWs receive supportive supervision to ensure the provision of high-quality services. Peer supervisors will no longer serve as CHWs and will only provide supervision to CHWs, serving as a link between CHWs and PHU staff. CHWs will be supervised by PHU In-Charges, Chiefdom Supervisors, implementing partner NGO staff, DHMT CHW Focal Points, and personnel from the National CHW Hub office in Freetown.
• Financial incentives: The 2012 policy recommended that each CHW receives a standard
minimum motivation package. As evidenced in Bombali and Kono districts, CHWs received 15,000 SLL per month for transport reimbursement while Peer Supervisors received 100,000 SLL per month. As per the 2016 policy, CHWs will receive a minimum of 100,000 SLL per month in addition to transport reimbursement (100,000 SLL per month for those living in hard-to-reach areas and 50,000 SLL per month for those living within three km from the PHU). Peer Supervisors will receive 150,000 SLL per month in addition to 100,000 in transport and communications credit (250,000 SLL total per month). Services provided by CHWs are to be free-of-charge and all medicines are to be sourced from PHU staff (via District Medical Stores) during CHW monthly meetings. The MOHS will also seek to harmonize non-financial incentives and equipment for CHWs, Peer Supervisors, and program support personnel.
In addition to these key policy changes, financial incentives will also be increased for MOHS personnel at the district, chiefdom, and PHU levels to ensure high-quality supervision of CHWs. According to the Directorate of Primary Health, District CHW Focal persons will receive 500,000 SLL per month, Chiefdom Supervisors will receive 150,000 SLL per month, and PHU In-Charges will receive 100,000 SLL per month. This represents a significant increase within districts (e.g. Kono District) which did not previously provide financial incentives to MOHS staff. MOHS Regional Coordinators will conduct quarterly visits to the district level; MOHS DHMT personnel will conduct three-day supervision visits to the PHU and community levels every month; both PHU and Peer supervisors will conduct regular supervision visits and facilitate monthly meetings at the PHU. According to the MOHS, Chiefdom Supervisors are expected to receive motorcycles and fuel allowances to facilitate program coordination and supervision.
An overview of the CHW coordination and supervision structure is shown in Figure 1. It is important to note that implementing partner NGOs will continue to support the MOHS in overall program coordination and supervision efforts.

7
Figure 1. National CHW Program Coordination and Supervision Structure10
2016 Package of Community Health Services
The national minimum package of CHS is aimed at addressing the priority health areas of reproductive, maternal, and child health (RMNCH) and disease prevention and control. These services include antenatal (ANC) and postnatal (PNC) promotional visits to pregnant and post-partum women and newborns, the identification and treatment of non-severe cases of diarrhea, pneumonia, and malaria (iCCM), malnutrition screening, and community integrated disease surveillance (IDSR), among key services. CHWs are also tasked with general activities (e.g. conducting routine house visits and providing referrals to the PHU). A detailed scope of work listing the national minimum package of CHS is included in Annex 2 and the list of the national package of CHS is included in Annex 3.
Methodology Data for this analysis were collected at three levels of the health system: first, at the central level from the MOHS, UNICEF and implementing partner NGOs; second, at the district level from the MOHS DHMT and implementing partner NGOs; and third, at the PHU and community level from PHU

8
personnel, Peers Supervisors, and CHWs. Semi-structured questionnaires were used for interviews with the CHWs and their supervisors. Actual service and cost data were collected for 2015. The data collection visit took place in February and March 2016.
For the purpose of this pilot, actual data were collected in districts based upon preferences and input from the MOHS and UNICEF. The MOHS and UNICEF selected CHW programs in two districts which are managed by international non-governmental organizations (NGOs): World Hope International (WHI) and the International Rescue Committee (IRC). WHI began implementation of its CHW program in 2012 while the IRC began implementation in 2006. These two programs provide key interventions from the national package, in particular iCCM and MNCH services.
While other community-based programs are currently being implemented throughout the country, they were excluded from this pilot as they are relatively vertical (i.e. disease-focused), small-scale, (including some with only 25 to 50 CHWs), and some provide salaries to CHWs who are employed full-time. These programs were not, therefore, considered to be representative of the National CHW Program and were therefore excluded from the analysis.
Central Level Data Collection
The main purpose of the data collection at the central level was to gather data on the services, expenditures, standards, and norms of community-based services. This was done through two exercises:
1. An expert panel meeting which convened representatives from the MOHS, UNICEF, and key implementing partner NGOs. This served as an opportunity to determine and validate the package of CHS, incidence and utilization rates, and service delivery norms (including the package of CHS, required medicines and commodities, and estimated time spent per service).
2. Using a standardized data collection tool, implementing partner NGO national office staff provided data on the numbers of services provided as well as expenditure data for the year of the study (2015) and two prior years. In addition, the MOHS provided data on the costs of management and supervision of CHW programs. Both NGO and MOHS personnel also provided information on key bottlenecks affecting the program.
District Level Data Collection
District level data was collected from the two sample districts - Bombali and Kono. The time and resources available for the study were limited and therefore MSH staff only collected data from two districts. For the purposes of piloting the tool and methodology, a larger sample was not necessary. The two districts were selected with guidance from the MOHS CHW Hub Office and UNICEF according to the following criteria:
1. Ongoing implementation of the National CHW Program and CHS package; 2. Maturity of the CHW program, i.e., long-running, more established versus a newly
established CHW program; and 3. Different implementation arrangements, i.e., NGO implementing through primary support
from NGO personnel versus NGO implementing in close collaboration with MOHS structures.

9
The main purpose of the data collection at the district level was to gather additional relevant costs of the CHW program, including those incurred by implementing partner NGOs at the district level and by the MOHS District Health Office (DHO). The DHMT plays a leading and supervisory role in the CHW program, led by the CHW Focal Person. The GoSL pays the salaries of these staff and these staff costs are included in this costing study based on the estimated time each spends supporting the CHW program. DHMT staff provided detailed information on DHMT staff time spent on CHW supervision and management, reporting, meetings, and trainings. Additionally, they provided salary estimates for each DHMT staff involved with the CHW program. All data were collected via oral interviews and information was captured electronically.
PHU and Community Level Data Collection
Data collection at the PHU and community level served as a ‘reality check’ for information collected at the central and district levels, providing on-the-ground context for the costing study and bottleneck analysis. Through semi-structured interviews with CHWs, data collectors obtained information on CHWs’ time, availability, and activities as well as information related to the types of CHS provided, the frequency of meetings and trainings, financial and non-financial incentives received, etc. Through interviews with Chiefdom Supervisors and PHU In-Charges, data collectors obtained information on time spent on CHW program management and supervision, standard treatment protocols of CHS, incentives, and bottlenecks hampering the delivery and/or quality of CHS. Data collectors conducted one-on-one interviews with Chiefdom Supervisors and PHU In-Charges and conducted joint focus group discussions with CHWs and Peer Supervisors.vi Within the two districts, the PHUs were selected based on the following criteria:
1. Proximity – i.e. time required to access the PHU in the context of weather and road conditions;
2. Representation – ideally CHWs providing a range of services within the CHS package with varying catchment population sizes and geography; and
3. Availability of staff (CHWs and their supervisors) to participate in interviews.
Based on these criteria, five PHUs were selected: three PHUs in Bombali district and two PHUs in Kono district (see Table 3). With this small sample, it is recognized that the districts and health facilities cannot be considered completely representative of the country as a whole but it is believed that they are sufficiently representative to both pilot the tool and methodology and for results to be useful to the MOHS in considering the costs of developing and scaling up the National CHW Program.
vi At the time of this study, in both Bombali and Kono Districts, Peer Supervisors also served as CHWs.

10
Table 3. Summary of Data Collection Points in Bombali and Kono Districts
District PHUs CHWs Peer Supervisors
PHU In-Charges
Chiefdom supervisors
DHMT Staff
Bombali
District Health Office 2
Mosongu CHC 2 5 0 1
Kapethe CHP 7 3 1 1
Kayonkoro CHP 1 7 1 1
Kono
District Health Office 2 Motema CHC 5 1 1 0
Woama CHP 10 1 1 0
Total 25 17 4 3 4
Data Analysis
In total 53 people were interviewed in the two districts - 25 CHWs, 17 peer supervisors, four PHU In-Charges, three chiefdom supervisors, and four DHMT staff. All data were collected via oral interviews using pre-designed questionnaires and the information was captured electronically using MS Excel.
Following data collection in each district, responses from interviewees were compared with the information collected during the expert panel meeting to ensure that responses were consistent for standard treatment protocols and time spent per health intervention. The data collectors also compiled information on human resource availability and time spent, supervision structures, supply chain systems, availability of medicines, health information systems, and costs associated with the current CHW program (e.g. cost of medicines, supplies, equipment, trainings, salaries, supervision, etc.). The data collectors also identified and synthesized bottlenecks reported at all levels of the health system.
The data was analyzed using the Community Health Planning and Costing Tool. The spreadsheet-based tool helps planners and managers to determine the costs and finances of comprehensive CHS packages. The tool allows users to calculate the costs and financing elements linked to all aspects of the CHS packages, including service delivery, training, supervision, and management from community to central levels.
Limitations
This analysis was conducted to pilot the new methodology and tool. It was anticipated that the district models and results would be useful for the GoSL, UNICEF, implementing partner NGOs, and other stakeholders. However, there are several limitations that need to be taken into account when reviewing the results. These are mainly due to the lack of time and resources to collect and analyze more data. The main limitations are as follows:
• Data were collected for two districts and interviews were conducted with 25 CHWs, 17 peer supervisors and a total of 11 PHU In-Charges, Chiefdom Supervisors and DHMT staff. A total of five PHUs were visited. This sample size was sufficient for piloting the approach and tool but would not be sufficient for providing a comprehensive analysis of CHS in Sierra Leone.

11
• The two sampled districts were not selected randomly and may not have been representative of the country as a whole.
• The average cost per service across all services is not shown since that is greatly affected by the mix of services and can lead to false conclusions regarding efficiency.
• Issues of data quality (i.e. incorrect and/or both under- or over-reporting) could have impacted this analysis. It is unknown if other services were provided by CHWs but not reported.
Findings The findings of the analysis are outlined in the following tables and descriptions. The findings are presented first for Bombali District and then for Kono District and lastly, compared across the two districts.
For the baseline year of 2015, MSH used actual service and cost data obtained by the MOHS and implementing partner NGOs in both Bombali and Kono Districts. However, at the request of the MOHS, MSH modelled the introduction of the revised 2016 National CHW Strategy (see Annex 2 for the revised CHW scope of work) and the corresponding programmatic changes beginning in 2016, although, in reality, the implementation of this policy has been delayed. With the proposed policy changes, a number of new services will be introduced into the package of CHS that had either not previously been provided or reported on in 2015 (see Annex 3 for the complete list of CHS). These include:
• The introduction of IPTp for second and third ANC promotional visits;vii • iCCM assessment and treatments for diarrhea, malaria, and pneumonia (and the removal of
the no-touch policy); • Reporting of births, under-five deaths, and maternal deaths; • Integrated disease surveillance reporting; • Male condom distribution and refills of oral contraceptives; • Malaria case management services for adults; • Infant and young child feeding (IYCF) and referrals for micronutrients; • Participation in campaigns (e.g. measles, national immunization days, Welbodi weeks, Polio
campaigns, long lasting insecticide net [LLIN] distribution)viii; and • Quarterly house visits and community mapping.
For the purpose of modelling, the numbers of services provided in the baseline year of 2015 and the years 2016-2025 were based on the following assumptions:
• 2015: Coverage rate at baseline of all services in the package (reported actual number of services in 2015 divided by the expected number of services in 2015);
vii According to the MOHS National CHW Strategy, CHWs should receive IPTp during the first and second ANC promotional visits (see Annex 2). However, according to the World Health Organization guidelines on IPTp (2014), pregnant women should receive IPTp during the second and third ANC visits. viii For the purpose of the modelling, it is assumed that all CHWs will regularly participate in mobilizing people within their respective communities for campaigns.

12
• 2016-2025: Coverage rate increased by 20 percent per year for the majority services in the package (with the exception of third ANC promotional visits as well as refills of male condom distribution and oral contraceptives which remained at three percent coverage);
• For all services with reported 100 percent coverage in 2015, no increase is calculated. Once a service in the package reaches 100 percent coverage, no further increase is calculated; and
• Presumptive treatment for fever (as mandated by the MOHS with the no-touch policy) was phased out in 2016. Also, beginning in 2016, the second and third ANC promotional visits included the provision of IPTp.
For the modelling, a 20 percent annual coverage increase was used for most services from 2016-2025; however, the coverage rate could be set at any increased rate, with population growth being the only variance. The rates used do not represent targets set by the GoSL, MOHS, or implementing partner NGOs and were determined by MSH for the purpose of piloting the tool.
The estimates of actual resources for each year are based on three main components:
• Costs related to CHWs and supervisors training, relevant equipment, meetings and payments, which vary with the numbers of CHWs and supervisors;
• Costs related to medicines, supplies and commodities, which vary with the numbers of services; and
• Costs related to management and management equipment and other costs which are treated as fixed costs.
Since each district is believed to be fully covered by CHS with the introduction of the revised National CHW Policy in 2016, it was assumed that for the modelling, no additional geographic scaling-up was needed between 2016-2015. Therefore, the increases in service coverage only represent the expanded utilization of CHS and existing CHWs.
Bombali District In the baseline year of 2015, Bombali District had a population of 506,838 of which an estimated 33 percent (168,092 persons) lived in the coverage area served by the CHWs (see Annex 4 for a breakdown of the population).ix In total, WHI supported 650 trained CHWs and 100 Peer Supervisors which served catchment populations of 88 PHUs in 13 chiefdoms.
Although CHWs had been trained on providing a comprehensive package of CHS (e.g. iCCM, ANC and PNC promotional visits, referrals, etc.), in reality CHWs only provided a limited number of non-curative services. This was due to issues of planning (i.e. the unavailability of medicines and commodities for CHWs) and a directive by the MOHS for CHWS to immediately refer iCCM cases to the PHU, following the outbreak of the EVD epidemic.
In 2015, CHWs reported providing a total of 110,317 individual health services (see Annex 5 for details on the services provided by CHWs). Figures were reported for nine of the 42 services included in the CHS package; however, it is unknown if other services were provided by CHWs but not
ix WHI provided the 2015 estimate of the Bombali District population and the population living in the CHW coverage area.

13
reported. The majority of the services provided by CHWs were for iCCM referrals, ANC and PNC promotional visits, and malnutrition screening and follow-up of children with moderate acute malnutrition.
Comparisons of actual and expected numbers of services show that, in some cases, the actual number of services provided by CHWs was far less than the total expected number of cases (see Annex 7 for details on the actual and projected services). For example, for first and second ANC promotional visits and first and second PNC promotional visits, CHWs provided more services than the expected number of services (based on the assumption that all pregnant women living in the coverage area would require ANC and PNC promotional visits once during and after a pregnancy, respectively). The number of iCCM treatments was lower than expected as CHWs only provided referrals for children presenting with signs of diarrhea, malaria, and pneumonia and did not provide curative treatment. CHWs provided follow-up visits for 100 percent of the estimated children ages 6-59 months with severe acute malnutrition, based on the expected incidence rate.x 11 Ninety-four percent of children ages 6-59 months living in the coverage area were screened for malnutrition, based on the expectation that each child would be screened once per year. All of the expected utilization rates of the corresponding services are shown in Annex 3.
In summary, the coverage rates of services were relatively high with the exception of iCCM. Coverage rates which were higher than the expected coverage rates (based on the expected utilization rates of each service) could be due to a number of factors. These include incorrect coverage population estimates, inaccurate recording and/or reporting of data, or because of a higher number of services provided (possibly due to the provision of services beyond an optimal level or due to populations outside of the coverage area accessing services).
Beginning in 2016 with the introduction of the revised National CHW Policy, it is expected that 100 percent of Bombali District’s population would be served by CHWs. Based on the recommended coverage ratios provided by the MOHS, an estimated 1,249 CHWs would be needed to serve the catchment populations of all 106 PHUs in the 14 Chiefdoms.xi An estimated 125 Peer Supervisors would be needed in Bombali District, in accordance with MOHS guidelines of one Peer Supervisor per 10 CHWs. For the purpose of this modelling, the number of CHWs and Peer Supervisors would not increase in future years with the expected population growth.xii
For the majority of services,xiii the numbers of services for years 2016-2025 represent an average coverage increase of 20 percent per year of the total expected utilization of services (based on the target population and the normative incidence and intervention rates). These increases were capped at 100 percent of the expected utilization levels. These annual increments result in a substantial increase from the current numbers of services, with 4.04 million expected services by 2025 (a
x According to the 2010 Report on the Nutritional Situation of Sierra Leone, 1.4 percent of children 6-59 months in Sierra Leone had MUAC <11.5. xi This estimate is based on the MOHS recommended ratio of CHWs per population. According to a national population survey conducted in 2014,in Bombali District an estimated 53 percent of the population lives within three km from a PHU and 47 percent lives more than three km from a PHU. xii This should be considered for future planning in order to adhere to the proposed MOHS guidelines of the ratio of CHWs to population. xiii This excludes third ANC visits as well as refills of male condom distribution and oral contraceptives which remained at three percent coverage.

14
significant overall increase from the baseline number of services of 110,317 in 2015). A significant number of services in 2025 would be for iCCM and for adult malaria case management which were not provided in 2015.
The programmatic breakdown of services emphasizes the dominance of MNCH and iCCM services, with 43 and 56 percent of all services, respectively, in 2015 (Figure 3). However, in 2025, MNCH services represent only eight percent of all services while iCCM services remain at 56 percent of all services. Adult malaria case management would make up 29 percent of all services in 2025.
Figure 2. Bombali District - Total Number of Services, by Program (2015-2025)
In 2015, CHWs spent five percent of their time (based on an estimated 20 working hours per week) providing services in 2015. However, it is possible that some of their services were not recorded or reported. With the modelled increases in services, it would appear that CHWs would need to work more than the available number of working hours in 2025 to provide the package of services (See Annex 5).
All services provided by CHWs are categorized as promotional, preventive, or curative. In 2015, 25 percent of services provided were promotional, 20 percent were preventive, and 55 percent were curative. By 2025, with projected coverage increases, 25 percent of services will be promotional, 20 percent will be preventive, and 55 percent will be curative.
It should be noted that comparisons of the numbers of services provided should be made with caution as each service is counted as “one” interaction and corresponds to different times and costs. For instance, the reporting of a maternal death counts as one service and would require an estimated 20 minutes of a CHW’s time. However, diarrhea diagnosis and treatment for a child (age 2-59 months) counts as one service and would require an estimated 30 minutes of a CHW’s time in addition to the costs of ORS and zinc for treating the child. For the purpose of this modelling, CHW participation in campaigns has been calculated based on the numbers of campaigns per year. For example, polio campaigns are expected to occur three times per year, each lasting four days. If a
-
500,000
1,000,000
1,500,000
2,000,000
2,500,000
3,000,000
3,500,000
4,000,000
4,500,000
2015 2016 2017 2018 2019 2020 2021 2022 2023 2024 2025
Num
ber o
f ser
vice
s
MNCH iCCM DPC TB/HIV RH/FP Malaria Nutrition Campaigns Other

15
CHW participated in all three campaigns during a year, the number of services would be represented as three.
The total cost of the amount of resources used for the services reported in 2015 was USD 659,263 which equates to USD 3.92 per capita. Based on the expected coverage scenarios, the total program cost would be 2.41 million by 2025 (USD 3.81 per capita). See Annex 6 for a summary of cost by input and by program.
The main cost driver of the Bombali District CHW program in 2015 was program management (41.1 percent) followed by trainings (16.5 percent) and equipment (16.3 percent). By 2025, the costs of management would reduce to 12.2 percent of the total costs while the costs of medicines would increase from zero to 43.8 percent of total program costs. Many of the changes in programmatic cost drivers are due to the introduction of the revised National CHW Policy in 2016 (and the corresponding programmatic changes) and the increase in variable costs, particularly for medicines, supplies, and commodities which are based on the numbers of services provided by CHWs. The large increase in recurrent costs in 2016 is due to the planned introduction of training for CHWs, supervisors, and program managers. See Figure 3 for the CHS recurrent costs by input.
Figure 3. Bombali District - Community Health Program Recurrent Costs, by Input, USD (2015-2025)
In 2015, the majority of program costs were for iCCM (34.8 percent), Disease Prevention and Control (32.9 percent), and MNCH (24.1 percent). By 2025, the majority of program costs would be for iCCM (51.1 percent), adult malaria case management (21.2 percent), and other programs (20.1%) which include house-to-house visits and community mapping conducted by CHWs. See Figure 4 for the recurrent costs by program.
$0
$500,000
$1,000,000
$1,500,000
$2,000,000
$2,500,000
$3,000,000
2015 2016 2017 2018 2019 2020 2021 2022 2023 2024 2025
CHW Salaries EquipmentMedicines, supplies, commodities SupervisionTraining ManagementOther Program Costs

16
Figure 4. Bombali District - Community Health Program Recurrent Costs, by Program, USD (2015-2025)
For the purpose of this report, funding commitments and analysis of program financing have not been included; however, this information is available in the models.
Kono District In the baseline year of 2015, Kono District had a population of 533,104 of which an estimated 38 percent (200,127 persons) lived in the coverage area served by the CHWs (see Annex 8 for a breakdown of the population of Kono District).xiv In total, IRC supported 743 trained CHWs and 85 Peer Supervisors which served catchment area populations of 68 PHUs s in 14 Chiefdoms.
In 2015, CHWs reported providing a total of 191,386 individual health services (see Annex 9 for details on the number of services provided by CHWs in Kono District). Figures were reported for 10 of the 42 services included in the package of CHS; however, it is unknown if other services were provided by CHWs but not reported. The majority of the services provided by CHWs were for iCCM assessments and treatments, malnutrition screening, and ANC and PNC promotional visits. CHWs in Kono District provided iCCM services in accordance with the no-touch policy (i.e. the provision of presumptive treatment based on signs and symptoms).
In some cases, the actual number of services provided by CHWs was less than the total expected number of cases. For example, only 19 percent of children ages 6-59 months with severe malnutrition were referred to a health facility by CHWs.xv CHWs provided diarrhea treatment for 13 percent of children ages 2-59 months and provided malaria treatment for 36 percent of children
xiv IRC provided the 2015 estimate of the Bombali District population (source: the World Health Organization and the Kono DHMT). IRC also provided the 2015 estimate of the population living in the CHW coverage area in Kono District. xv According to the 2010 Report on The Nutritional Situation of Sierra Leone, 5.8% (5.3-6.4% 95% C.I.) of children aged 6-59 months had a MUAC < 12.5 cm.
$0
$500,000
$1,000,000
$1,500,000
$2,000,000
$2,500,000
$3,000,000
2015 2016 2017 2018 2019 2020 2021 2022 2023 2024 2025
MNCH iCCM DPC TB/HIV RH/FP Malaria Nutrition Campaigns Other

17
ages 2-59 months with fever. For the first and second ANC promotional visits, CHWs reached 89 percent and 36 percent of the estimated pregnant women living in the coverage area, respectively. For first (within 24 hours of birth) and second (within seven days of birth) PNC visits, CHWs reached 57 percent and 41 percent of pregnant women and their newborns. However, CHWs reached an estimated 100 percent of the estimated children ages 2-59 months for pneumonia diagnosis and treatment. Also, 100 percent of children ages 6-59 months living in the coverage area were screened for malnutrition, based on the expectation that each child would be screened once per year.
In summary, the coverage rates of services varied. Coverage rates which were higher than the expected coverage rates could be due to a number of factors. These include incorrect coverage population estimates, inaccurate recording and/or reporting of data, or because of a higher number of services provided (possibly due to the provision of services beyond an optimal level or due to populations outside of the coverage area accessing services).
Beginning in 2016 with the introduction of the revised National CHW Policy, it is expected that 100 percent of Kono District’s population would be served by CHWs including persons living in Koidu Township. Based on the recommended coverage ratios provided by the MOHS, an estimated 1,346 CHWs would be needed to serve the all 15 chiefdoms and the catchment populations of all 85 PHUs.xvi An estimated 135 Peer Supervisors would be needed in Kono District, in accordance with MOHS guidelines of one Peer Supervisor per 10 CHWs. For the purpose of this modelling, the number of CHWs and Peer Supervisors would not increase in future years with the expected population growth.
For the majority of services,xvii the numbers of services for years 2016-2025 represent an average coverage increase of 20 percent per year of the total expected utilization of services based on the target population and the normative incidence and intervention rates (see Annex 3 for the list of expected utilization rates for each service). These increases were capped at 100 percent of the expected utilization levels. These annual increments result in a substantial increase from the current numbers of services, with 4.25 million expected services by 2025 (an overall increase of 2,222 percent from the baseline number of services of 191,386 in 2015). A significant number of services in 2025 would be for iCCM and for adult malaria case management, which were not provided in 2015. See Annex 9 for details on the number of and percentage of services by program.
xvi This estimate is based on the MOHS recommended ratio of CHWs per population. According to a national population survey conducted in 2014, in Kono District, an estimated 451 percent of the population lives within three km from a PHU and 49 percent lives more than three km from a PHU. xvii This excludes third ANC promotional visits as well as refills of male condom distribution and oral contraceptives which remained at three percent coverage.

18
Figure 5. Kono District - Total Number of Services, by Program (2015-2025)
The programmatic breakdown of services emphasizes the dominance of iCCM and MNCH services, with 77 and 23 percent of all services, respectively, in 2015 (see Annex 11 for details on the actual and projected services). However, in 2025, iCCM services represent 56 percent of all services while MNCH services represent seven percent of all services. Adult malaria case management services would make up 29 percent of all services in 2025.
In 2015, CHWs spent eight percent of their time (based on an estimated 20 working hours per week) providing services in 2015. However, it is possible that some of their services were not recorded or reported on. Nevertheless, with the modelled increases in services for 2016-2025, it would appear that CHWs would need to spend more time (beyond the number of working hours) to provide the package of services at the modelled coverage rates by 2025 (see Annex 9 for details).
All services provided by CHWs are categorized as promotional, preventive, or curative. At baseline, nine percent of services provided were promotional, 15 percent were preventive, and 77 percent were curative. By 2025, with projected coverage increases, 25 percent of services will be promotional, 20 percent will be preventive, and 55 percent will be curative.
It should be noted that comparisons of the numbers of services provided should be made with caution as each service is counted as “one” interaction and corresponds to different times and costs.
The total cost of the amount of resources used for the services reported in 2015 was USD 495,332 which comes to USD 2.48 per capita. Based on the expected coverage scenarios, the total program costs would be 2.7 million by 2025 (USD 4.07 per capita). See Annex 10 for a summary of costs by input and by program.
The main cost drivers of the Kono District CHW program in 2015 were program management (55.6 percent) followed by equipment (13.1 percent) and medicines, supplies, and commodities (nine percent). By 2025, the costs of management would reduce to 16.8 percent of the total costs while
-
500,000
1,000,000
1,500,000
2,000,000
2,500,000
3,000,000
3,500,000
4,000,000
4,500,000
2015 2016 2017 2018 2019 2020 2021 2022 2023 2024 2025
Num
ber o
f Ser
vice
s
MNCH iCCM DPC TB/HIV RH/FP Malaria Nutrition Campaigns Other

19
the costs of medicines would increase to 41.2 percent of total program costs. Many of the changes in programmatic cost drivers are due to the introduction of the revised National CHW Policy in 2016 (and the corresponding programmatic changes) and the increase in variable costs of medicines, supplies, and commodities which increase based on the numbers of services provided by CHWs. The large increase in recurrent costs in 2016 is due to the planned introduction of training for CHWs, supervisors, and program managers. See Figure 6.
Figure 6. Kono District - Community Health Program Recurrent Costs, by Input, USD (2015-2025)
In 2015, the majority of program costs were for iCCM (71.7 percent) and disease prevention and control (19 percent) MNCH). By 2025, the majority of program costs would be for iCCM (50.6 percent), adult malaria case management (21 percent), and other services (20.4 percent) which include house-to-house visits and community mapping conducted by CHWs. See Figure 7.
$0
$500,000
$1,000,000
$1,500,000
$2,000,000
$2,500,000
$3,000,000
2015 2016 2017 2018 2019 2020 2021 2022 2023 2024 2025
CHW Salaries EquipmentMedicines, supplies, commodities SupervisionTraining ManagementOther Program Costs

20
Figure 7. Kono District - Community Health Program Recurrent Costs, by Program, USD (2015-2025)
For the purpose of this report, funding commitments and an analysis of program financing have not been included; however, this information is available in the district models.
Comparison of Bombali and Kono Districts There were considerable differences among the two districts in terms of their 2015 coverage populations, the numbers and types of services provided, as well as the CHW program structure. These differences impacted the cost per capita and total program costs in each of the districts.
In 2015, Bombali District had a significantly larger coverage populationxviii and incurred higher costs for CHW training and program start-up expenses. Kono District incurred higher costs for medicines (as CHWs continued to presumptively treat children for diarrhea, malaria, and pneumonia); however, total program costs were considerably less than in Bombali District. As a result, the 2015 cost per capita in Bombali District was USD 3.92 in 2015 and USD 2.48 in Kono District.
By 2025, the cost per capita reduced to USD 3.81 in Bombali District and increased to USD 4.07 in Kono District. While the 2025 coverage populations were relatively similar among the districts,xix the management costs in Kono District were considerably higher than in Bombali District (USD 455,046 in Kono District and USD 292,990 in Bombali District). Higher management costs in Kono District are largely attributed to those incurred by the implementing partner NGO.
In Bombali and Kono districts, there were differences in CHW program management and supervision structures in place in 2015 which also contributes to differences in supervision and management costs. In 2015 in Bombali District, WHI provided financial incentive payments to MOHS personnel at
xviii The coverage population in Bombali District was 168,092 in 2015 and 631,165 in 2025. The coverage population in Kono District was 200,127 in 2015 and 663,874 in 2025. xix 2025 coverage populations: Bombali District: 631,165; Kono District: 663,874.
$0
$500,000
$1,000,000
$1,500,000
$2,000,000
$2,500,000
$3,000,000
2015 2016 2017 2018 2019 2020 2021 2022 2023 2024 2025
MNCH iCCM DPC TB/HIV RH/FP Malaria Nutrition Campaigns Other

21
the District, Chiefdom, and PHU levels for CHW supervision and management. In addition, WHI provided financial incentives (i.e. salaries) to its Field Monitors. In Kono District, the IRC only provided financial incentives (i.e. salaries) to its own staff (IRC CHW Supervisors) for supervision and management of CHWs and did not provide any financial incentives to MOHS personnel. However, with the introduction of the revised National CHW Policy, MOHS staff at the District, Chiefdom, and PHU levels would receive the same financial incentives in both districts in 2016.
Table 4. CHW Program Support Personnel and Financial Incentives (2015-2016)
Bombali District Kono District 2015 Personnel &
Financial Incentives 2016 Personnel &
Financial Incentives 2015 Personnel &
Financial Incentives 2016 Personnel &
Financial Incentives 1 DHMT CHW Focal
Person (6 M SLL/year)
1 DHMT CHW Focal Person
(6 M SLL/year)
1 DHMT CHW Focal Person
No incentive
1 DHMT CHW Focal Person
(6 M SLL/year) 13 Chiefdom Supervisors
(1.8 M SLL/year) 14 Chiefdom Supervisors
(1.8 M SLL/year) 0 Chiefdom Supervisors 15 Chiefdom Supervisors
(1.8 M SLL/year)
13 WHI Field Monitors (20,174,013 SLL/year)
14 WHI Field Monitors (20,174,013 SLL/year)
13 IRC CHW Supervisors (28,251,113 SLL per year)
13 IRC CHW Supervisors (28,251,113 SLL per year)
88 PHU In-Charge (1.2 M SLL/year)
106 PHU In-Charge (1.2 M SLL/year)
68 PHU In-Charge No incentive
85 PHU In-Charge (1.2 M SLL/year)
100 Peer Supervisors (1.2 M SLL/year)
125 Peer Supervisors (3 M SLL/year)
85 Peer Supervisors (1.2 M SLL/year)
135 Peer Supervisors (3 M SLL/year)
650 CHWs (180,000 SLL/year)
1,249 CHWsxx
--
275 CHWs within 3km from PHU
(1.8 M SLL/year)
974 CHWs more than 3km from PHU
(2.4 M SLL/year)
743 CHWs (180,000 SLL/year)
1,346 CHWsxxi
--
278 CHWs within 3km from PHU
(1.8 M SLL/year)
1,068 CHWs more than 3km from PHU
(2.4 M SLL/year)
The time spent by MOHS personnel also varied considerably across the two districts in 2015, according to normative data collected using semi-structured questionnaires. For the purpose of modelling, an average reported time and salary were applied for each staff position. In 2015, the District CHW Focal Points in Bombali and Kono Districts spent an estimated 70 and 30 percent of their time on CHW program support, respectively. In Bombali District, it was reported that the District Logistic Officer spent an estimated 15 percent of their time on CHW program support; however, in Kono District, there was no reported support by a District Logistic Officer. xx Based on 2016 estimates for Bombali District, there will be 974 hard-to-reach CHWs and 275 CHWs living within 3 km of the PHU. As per the 2016 policy, CHWs will receive a minimum of 100,000 SLL per month in addition to transport reimbursement (100,000 SLL per month for those living in hard-to-reach areas and 50,000 SLL per month for those living within three km of the PHU). xxi Based on 2016 estimates for Kono District, there will be 1,068 hard-to-reach CHWs and 278 CHWs living within 3 km of the PHU.

22
In 2016, with the introduction of the revised National CHW Policy, it is expected that in Kono District, MOHS personnel will contribute considerably more time for CHW program management. For the purpose of modelling, the time of key positions (e.g. District CHW Focal Persons and PHU In-Charges) will also increase. Also, in accordance with MOHS recommendations, the role of Chiefdom Supervisors will be introduced in Kono District in 2016.
Salary and time estimates for MOHS personnel at the National level were provided by the CHW Hub at the Directorate of Primary Health Care (MOHS). Time and salary estimates remained constant for these personnel between 2015 and 2025.
Table 5. CHW Program Support Personnel and Time Spent (2015-2016)
Bombali District Kono District 2015 Personnel &
Time Spent 2016 Personnel &
Time Spent 2015 Personnel &
Time Spent 2016 Personnel &
Time Spent District CHW Focal Point
(salary estimate provided)
70%
District CHW Focal Point (salary estimate
provided) 70%
District CHW Focal Person (grade 5)
30%
District CHW Focal Person (grade 5)
70%
District - Malaria point person
(grade 5) 15%
District - Malaria point person
(grade 5) 15%
District Health Sister (grade 6)
5%
District Health Sister (grade 6)
5%
District Health Sister (grade 7)
5%
District Health Sister (grade 7)
5%
District Health Sister (grade 6)
5%
District Health Sister (grade 6)
5% District M+E
(grade 4) 5%
District M+E (grade 4)
5%
District M+E Officer 1 (grade 4)
10%
District M+E Officer 1 (grade 4)
10% District Logistic Officer
(grade 7) 15%
District Logistic Officer (grade 7)
15%
District M+E Officer 2 (grade 4)
10%
District M+E Officer 2 (grade 4)
10% District Pharmacist
(grade 7) 15%
District Pharmacist (grade 7)
15% -- --
Chiefdom Supervisor (grade 6)
45%
Chiefdom Supervisor (grade 6)
45% --
Chiefdom Supervisor (grade 6)
45% PHU In-Charge
(blended rate of grades 4-5)
38%
PHU In-Charge (blended rate of
grades 4-5) 38%
PHU In-Charge (blended rate of
grades 4-5) 12%
PHU In-Charge (blended rate of
grades 4-5) 38%
Bottlenecks to Service Delivery A number of bottlenecks were identified through the interviews conducted at all levels of the system with CHW program stakeholders, program managers, supervisors, and CHWs. Interview questions focused on supply and demand-side bottlenecks related to the CHW program. The results of the

23
bottleneck analysis for the two districts are described below and organized by determinants of coverage.xxii 12
Initial Utilization
Initial utilization can be measured by comparing the numbers of initial contacts (e.g. first visits) with the expected utilization levels for those services. According 2015 data in Bombali and Kono Districts, the initial utilization of CHS varied. In Bombali District, both first ANC and PNC promotional visits had high utilization (i.e. more than 100 percent of expected coverage); however, iCCM treatments were not provided, only referrals. In Kono District, first ANC promotional visits were well-utilized (89 percent of expected coverage) while PNC promotional visits within three days of birth) had only 57 percent coverage. The coverage for pneumonia diagnosis and treatment was also high (more than 100 percent of utilization) while presumptive malaria treatment and diarrhea treatment were relatively low (36 and 13 percent, respectively).
Continuous Utilization
Continuous utilization is measured when a service requires a specific follow-up intervention, such as a positive RDT requiring malaria treatment. While 2015 Health Management Information System (HMIS) data is available on key indicators such as the number of women completing all ANC and PNC visits at a health facility and the number of referrals for malnourished children, this data is not disaggregated by health facility and therefore cannot be attributed to the promotional efforts of or referrals from CHWs. Moreover, based on the 2015 data provided by implementing partner NGOs in Bombali and Kono Districts, it was not possible to determine the number of CHW referrals that received follow-up care at the health facility.
Effective Coverage
This requires data related to the outcome of the intervention, such as a successful delivery at a facility following an ANC promotional visit conducted by a CHW. This is also a feasible indicator to measure for certain services; however, due to limited data and time, it was not possible to measure this bottleneck in the two districts.
Geographical Access
According to the 2012 National CHW Policy, one CHW should serve a population of between 100-500 people in hard-to-reach areas. Based on 2015 data provided by implementing partner NGOs in Bombali and Kono Districts, both CHW programs appear to adhere to this policy.xxiii In Bombali District, the average ratio of CHW per total coverage population was one CHW to 259 persons. In Kono District, the average ratio of CHW per total coverage population was one CHW to 269 persons. However, based on interviews conducted with CHWs, many reported that they cover more than the recommended 500 persons.
xxii This bottleneck analysis aligns with UNICEF’s approach of using an adapted Tanahashi model for the bottleneck analysis. xxiii Based on 2015 data, in Bombali there were 650 CHWs (738 including Peer Supervisors) serving a catchment population of 168,092 persons: one CHW per 259 persons. In Kono District there were 743 CHWs (828 including Peer Supervisors) for 200,127 persons: one CHW per 269 persons

24
Based on the 2015-16 Georeferenced Census of CHWs conducted by UNICEF, more than 80 percent of CHWs nationally cover between 0-500 people and less than 10 percent of CHWs cover more than 1,000 people.13 However, 70 percent of CHWs interviewed did not know the number of people living in their coverage area.14 Reliable data was unavailable for Bombali and Kono Districts. Based on this study, more than 90 percent of CHWs live in the community where they work.15 Among the 10 percent who did not live in the community where they worked, some reported having to travel as much between two and five km to get to the community they work in most days.16 In Bombali and Kono Districts, more than 90 percent of CHWs in Bombali and Kono districts lived in the communities where they work.17
According to the 2016 National CHW Policy, CHWs will serve the entire population including persons living adjacent to the PHU. One hard-to-reach CHW (i.e. those beyond three km from the PHU) should serve 250 persons and a CHW within three km of the PHU should serve 1,000 persons. To meet this requirement, an estimated 1,249 CHWs will be required in Bombali District which comprises 974 hard-to-reach CHWs and 275 CHWs living within three km of the PHU.xxiv In Kono District in 2016, an estimated 1,346 CHWs will be required, comprised of 1,068 hard-to-reach CHWs and 278 CHWs living within three km of the PHU.xxv These estimates, which may be revised by the DHMT in each of the districts, represent a significant increase in the number of CHWs in place in 2015.
Human Resources
According to the 2012 National CHW Policy, all CHWs should complete the recommended 10-day standardized CHW training program and complete refresher trainings twice per year. It was reported that in 2015, CHWs in Bombali District completed a refresher training on maternal, newborn, and child health as well as a second training on Ebola messaging, social mobilization, contact tracing, and surveillance. The majority of CHWs in Kono District completed a training on the no-touch policy and another on Community Events Based Surveillance (CEBS). Although CHWs reported participating in monthly meetings and receiving regular supervision visits, it is possible that CHWs did not receive adequate training to update and/or acquire relevant skills and knowledge.
However, with the introduction of the revised National CHW Policy in 2016, all CHWs will complete three eight-day training modules in the first year (24 days total) followed by an annual refresher training lasting five days. The peer supervisors will receive the same training as the CHWs in addition to a five-day standard supervisor training followed by an annual four-day refresher training.
Increased programmatic investments in the supportive supervision of CHWs will also help to ensure the provision of high-quality services.
xxiv This estimate was calculated based on the Sierra Leone census data for Bombali District which indicated that 53 percent of the population lives within 3 km from a PHU and 47 percent live outside of 3 km of the PHU. xxv This estimate was calculated based on the Sierra Leone census data for Kono District which indicated that 51 percent of the population lives within 3 km from a PHU and 49 percent live outside of 3 km of the PHU.

25
Commodities
To deliver an intervention at adequate coverage levels, stock-outs of medicines and commodities should be minimal. In both Bombali and Kono Districts, it was reported that stock-outs at the community level were a significant challenge in 2015.
In Bombali District in 2015, CHWs did not receive any medicines or commodities for curative services (e.g. iCCM treatments); it was reported that this was due to the unavailability of medicines and commodities for CHWs as well as based on a directive from the MOHS to refer all suspected iCCM cases to the health facility, following the outbreak of the EVD epidemic. In Kono District in 2015, the IRC reported considerable levels of stock-outs among CHWs (see Table 6).
Table 6. Stock-Outs of Medicines and Commodities Among CHWs in Kono District (2015)xxvi
Indicator Value (2015) % of CHWs with ACT 25 stock-out 55.80% % of CHWs with ACT 50 stock-out 40.20% % of CHWs with Zinc stock-out 62% % of CHWs with ORS stock-out 61.90% % of CHWs with Antibiotics stock-out 46.20%
According to interviews conducted, CHWs should be regularly supplied with medicines and supplies to facilitate the provision of preventive and curative services. CHWs are expected to receive 30 percent of the drugs and supplies allocated to each PHU, with 70 percent remaining for use by the PHU staff.
However, in reality, stock-outs of essential medicines are a challenge at all levels of the health system. According to a 2016 report by the USAID Systems for Improved Access to Pharmaceuticals and Services (SIAPS), only four (28 percent) of 14 essential medicines are available at facilities and only one percent of facilities have the full list in stock.18 Of the five national priority medicines, only 17 percent of health facilities had all five in stock, with an average availability of 71 percent.19 According to a 2015 Sierra Leone Health Facility Assessment report by the MOHS and UNICEF, 67 percent of PHUs had two out of the three essential child health drugs (artemisinin-based combination therapy and either amoxicillin or Co-trimoxazole].20
Economic Access
A patient’s financial situation and both actual and perceived economic costs can also affect access to CHS. For this analysis, no economic access bottlenecks were identified as interviews were not conducted with patients or beneficiaries of CHWs.
The bottleneck analysis was only intended to identify the bottlenecks and, if possible, to quantify them (the latter was not possible for all indicators due to time and data constraints). An analysis of causality, the identification and costing of possible solutions and the selection of a solution are a
xxvi Source: International Rescue Committee CHW Program Data - Kono District (2015).

26
separate process conducted outside the planning and costing analysis. However, when a solution is determined, the cost of that solution should be included in the cost analysis.
Discussion The results of this pilot provide estimates of the costs and required financing to expand the coverage and utilization of CHS in Bombali and Kono Districts in Sierra Leone. In the models developed for the two districts, it was assumed that the revised National CHW Policy would be introduced in 2016. As a result, the CHW programs in these districts would experience increased geographic coverage of CHS, an expanded package of CHS, significant investments in CHW training and supervision, and increased financial incentives for CHWs, supervisors, and program support personnel. Based on modelled increases in expected service coverage in years 2016-2025, the estimated costs of medicines, supplies and commodities would also increase.
The “true” incremental costs in the models relate to the medicines, supplies and commodities; however, these may not, in fact, be incremental costs. If the expanded package of CHS will replace services provided at health facilities then there should be no additional cost of medicines, supplies and commodities, since they are currently being used at the health facilities. Therefore, the only true incremental costs would be those related to services not currently obtained at the health facilities and these should have a significant positive impact on morbidity and mortality. As it assumed that CHS are provided free-of-charge and are provided in close proximity to the coverage populations, this should result in a reduction of the economic burden of households in terms of out-of-pocket costs, productivity losses due to illness, and productivity losses due to premature mortality.
If the medicines, supplies, and commodities corresponding to the services included in the package of CHS in these two districts are offset by reductions of the same quantity at the health facility, then the only change is the shifting of the cost and budget from the health facility to the CHW program. A reduction in the number of services at the health facility will allow staff and equipment to be used to expand other necessary services that cannot be provided at the community level. Moreover, it is possible that the provision of CHS could be more cost-effective compared to those delivered at the health facility.
Also, if the medicines, supplies, and commodities are replacing those used at a health facility, the only additional costs relate to the cost of transporting them to the community, which are likely to be minimal and offset by the savings to the households.
Conclusions This analysis and the piloting of both the methodology and tool proved useful for modelling the scale-up of Sierra Leone’s National CHW Program as well for future modelling of CHW programs in other countries.
As previously stated, the time and resources available for the study were limited and therefore results are not definitive and do not represent the country as a whole. However, there were many relevant findings:

27
• With the proposed introduction of the revised National CHW Strategy in 2016, there will significant changes to the National CHW Program. These programmatic changes included increased geographic coverage of CHWs, expanded package of CHS, greater emphasis on CHW supervision and training, and increased financial incentives provided to CHWs, Peer Supervisors, and program support personnel. These changes will in turn impact the total costs of the program.
• Based on service utilization estimates, it appears that CHS were under-utilized in 2015. In Bombali District, CHWs spent an estimated five percent of their time (based on an estimated 20 working hours per week) providing nine of the 42 services included in the package of CHS in 2015. In Kono District, CHWs spent an estimated eight percent of their time providing 10 of the 42 services included in the package of CHS in 2015.
• There were significant variations in the package of services offered in both districts in 2015 as CHWs in Bombali District did not provide iCCM treatments and the majority of services provided were for MNCH (ANC and PNC promotional home visits) and iCCM referrals. In Kono District in 2015, the majority of services were for iCCM (including presumptive treatment of diarrhea, pneumonia, and malaria) and MNCH. By 2025, the majority of services would be for iCCM and adult malaria case management.
• Given the modelled increases in services for 2016-2025, it estimated that CHWs would need to spend considerably more time (beyond the number of working hours) to provide the package of services at the modelled coverage rates by 2025.
• The issue of stock-outs of medicines and commodities at both the community and health facility level represent a significant bottleneck which, unless resolved, will limit the success and impact of the proposed expansion of the National CHW program. Solutions for addressing this bottleneck should be further explored and additional quantification should be conducted in all districts implementing the National CHW program.
• The average total cost per capita in 2015 for the two districts was USD 3.92 in Bombali District and USD 2.48 in Kono District. With the projected increases in coverage and utilization, in addition to the introduction of revised National CHW Policy, the cost per capita would decrease to USD 3.81 in Bombali Districtxxvii and increase to USD 4.07 in Kono District.
• In 2015, the main cost drivers of the CHW programs in Bombali and Kono Districts were program management and equipment. With the projected increases in coverage and utilization, as well as the programmatic changes resulting from the introduction of the revised National CHW Policy, the main cost drivers of the CHW programs in Bombali and Kono Districts would be for medicines, supplies, and commodities as well as management and CHW salaries (i.e. financial incentives).
• In 2015, the majority of programs costs were for iCCM services and disease prevention and control in Bombali and Kono Districts. In 2025, with the projected increases in coverage and
xxvii The cost per capita in Bombali appears to fall because a significant amount of start-up costs were included in 2015.

28
utilization, the majority of program costs would be for iCCM, adult malaria case management, and other services (e.g. house-to-house visits and community mapping conducted by CHWs).
As noted in the discussion section, the costs of expanding CHS in the two districts relate mainly to increases in medicines, supplies and commodities. These costs may not all be incremental, since, to some, degree they may be replacing medicines, supplies and commodities that are currently provided at facilities. If that is the case, the expansion of services may reduce health system unit costs and household costs and contribute to the delivery of more cost-effective services at both the community and health facility levels.

29

30
Annexes Annex 1. CHW Scope of Work (June 2012)i The following scope of work was extracted from the 2012 National CHW Policy (June 2012) Conduct community sensitization and advocacy for: • Mobilising communities for appropriate environmental sanitation and hygiene practices • Mobilising communities to set up and support community owned emergency referral system
including setting up a fund • Adolescent Sexual and Reproductive Health • Child protection issues • Use of scheduled outreach services to the communities • Linking up with Village Development Committees (VDCs) Conduct home visits to promote: • Use of Insecticide Treated Mosquito Nets (ITNs) • Household water treatment • Hand washing with soap at the household. • Appropriate hygiene and sanitation practices, including: food hygiene, disposal of excreta +for
child, etc.) • Birth preparedness for pregnant women • Skilled postnatal care for both mother and new-borns • Initiation of breastfeeding within first hour of delivery and appropriate temperature
management for the newborn • Exclusive breastfeeding for children 0-5 complete months • Adequate nutrition 6-11 months • Timely utilization of immunization services • Build capacity of the family members to appropriately take care of newborns, U5 children,
pregnant women and other vulnerable persons • Build capacity of the family members to recognize and act on danger signs (especially for
newborns, pregnant/postnatal women and U5 children) Provide: • Oral Rehydration Therapy and Zinc for diarrhoea management • Artemisin-based Combination Therapy for malaria • Antibiotics for U5 pneumonia • Screening services for acute malnutrition, including MUAC measurements • Growth monitoring to identify early referrals • Family planning methods including condoms and oral contraceptive pills • Fefol, deworming tablets, Vitamin A, ORS, Ivermectin • Defaulter tracing for Immunization, Vitamin A, Severe Acute Malnutrition treatment Report: • Vital events such as births, deaths including possible maternal deaths, outbreak or epidemics, • persistent cough, passing of frequent stools • Their (CHWs) activities in the community

31
Annex 2. CHW Scope of Work (Draft – June 24, 2016) i The harmonized official Scope of Work of the National CHW Program is as follows:
General • Conduct community mapping to understand their communities and identify CHW’s target
population • Actively participate and potentially lead community mobilisation and engagement for health.
This includes participation in key community and national campaigns and the involvement in local health structures, such as Facility Management Committees and Village Development Committees.
• Identification and prompt referral of cases and conditions for management at health facilities • Conduct biannual routine house visits to households in the catchment area to: Update the community mapping including their demography Apply interpersonal communication skills to reinforce key health behaviours for families and
households including early care seeking when one is sick. Assess the health situation of households including availability, use and/or practice of
healthy behaviours and identify gaps. Conduct dialogue with families and communities and help in identifying solutions for
identified gaps and follow their implementation.
Reproductive, Maternal, Neonatal, and Child Health: • Pre-pregnancy counselling on the importance and availability of family planning methods and
distribution of condoms and refill of oral contraceptive pills • Identify pregnant women as early as possible through 1) self-reporting of mothers or their family
members 2) Active surveillance through routine house visits and 3) notification by PHUs, TBAs and other stakeholders in the community
• Conduct three Antenatal home visits: first early in pregnancy, second mid-pregnancy and third late in pregnancy to: Educate and counsel the pregnant women and her spouse/family on the following
issues: The importance of focused antenatal care at PHUs by skilled health workers;
ensure that the pregnant women visits PHU for FANC Maternal Nutrition The importance of the use of LLITN Encourage HIV testing and PMTCT as needed Hand washing and use of toilets Use of family planning methods and referral to closest facility for use Essential new-born care (excusive breast feeding, Hygienic cord care,
thermal care, Immunization) Danger signs during pregnancy Preventive and promotive behaviors for maternal, neonatal, child health,
including WASH, IYCF, FP, immunization Educate and Screen for danger signs (oedema, fever, persistent headache etc.) during
pregnancy and refer to PHUs if identify one Birth preparedness and planning for delivery at health facility Provide IPT to pregnant women, specifically distribution of SP for all pregnant women at
1st and 2nd visitxxviii • Accompany labouring women to the PHU for delivery and facilitate birth registration xxviii According to the World Health Organization guidelines on IPTp (2014), pregnant women should receive IPTp during the second and third ANC visits. Source: http://www.who.int/malaria/publications/atoz/iptp-sp-updated-policy-brief-24jan2014.pdf?ua=1

32
• Conduct three Postnatal Home visits for both the mother and the baby on the 1st, 3rd and 7th days after delivery to: Educate and counsel the mother and her family/spouse on the following:
Essential newborn care practices (including feeding the colostrum, exclusive breast feeding for up to 6 months, thermal care—skin to skin contact and delayed bathing, and hygienic cord care.
The importance of the use of family planning methods, specifically post-partum family planning methods
Maternal nutrition On danger signs for new mothers and newborns and need for immediate
PHU treatment if one occurs Hand washing and the use of toilet Vaccination for the child
Educate and screen for danger signs on both the mother (Excessive or offensive lochia, fever etc.) and the newborn (fever, not able to breast feed etc.)and refer to PHUs if identify one
Follow up to ensure implementation of essential newborn care practices and that the baby is started on vaccination
• iCCM: Identification and treatment of pneumonia, diarrhea, and malaria (with RDT) in children
aged 2 to 59 months and referral of severely ill children and complications. Identification and treatment of malaria (with RDT) in older children and adults (entire
population) Follow-up care for patients who are on treatment and who have finished treatment
• Assess breast feeding practices for younger infants (0 to 2 months) to help on appropriate breast feeding practices.
• Screen 6 to 59 months children for MAM and SAM (MUAC) and refer to health facility Provide in-community support for adherence to MAM & SAM referrals to health facility Provide in-community support for adherence to SFP and CMAM treatment Assessing patients for in-home feeding practices including the RUTF doses Provide in-community follow-up support after SFP and CMAM discharge
• Three infant home visits on 1st month, 5th month and 9th month to ensure vaccination and appropriate feeding
• Report birth, maternal and under five deaths in the community • Social mobilization for specialized campaigns and PHU’s outreach services in their communities
(examples: Welbodi Weeks, MCH Week, National Immunization Day)
Disease Prevention and Control: Community-IDSR (CBS): Surveillance and reporting of any events related to the following diseases / conditions based on community-level case definitions for: • Acute Flaccid Paralysis (Polio) • Acute Watery Diarrhoea (Cholera) • Clustered deaths • Guinea Worm • Maternal Death • Measles • Neonatal Tetanus • Neonatal Death • Suspected Ebola • Yellow Fever

33
Additionally, the CHW will be required to report any unusual events or rumours affecting the health of community member(s)
CHWs will be expected to report immediately if any of the above occurs to their Peer Supervisor, by phone. They will also be required to document all events in a paper register, to be kept at home. When CHWs can provide treatment (such as in the case of acute water diarrhea), they will be expected to. Where they are not able to, they will refer the patient immediately to the closest facility. Additionally, CHWs will be expected to support community engagement activities in response to outbreaks.
Sensitization of communities about: • TB risk factors, signs and symptoms, referral for testing (to PHUs and TB- CHWs) • HIV risk factors, signs and symptoms, referral for testing (to PHUs and HIV- CHWs)

34
Annex 3. National Package of Community Health Services The following table details the national package of CHS, related programs, target population, and normative numbers of episodes/interventions (i.e. utilization rates) per year
No. Service / Intervention Program Target population Incidence Rate
Incidence Rate Source/Explanation
1 ANC promotional visit 1 (1st trimester) MNCH Pregnant Women 1.0 1 visit per pregnancy 2 ANC promotional visit 2 (2nd trimester)
**this will be phased out in 2016 and replaced with service number 40
MNCH Pregnant Women 1.0 1 visit per pregnancy
3 ANC promotional visit 3 (3rd trimester) **this will be phased out in 2016 and replaced with service number 41
MNCH Pregnant Women 1.0 1 visit per pregnancy
4 Referral of pregnant women with danger signs
MNCH Pregnant Women 0.15 15% of pregnancies experience complications (Source: UNICEF Sierra Leone)
5 Accompany pregnant women for delivery
MNCH Pregnant Women 1.0 1 visit per pregnancy
6 PNC promotional visit (within 24 hours of birth)
MNCH Postpartum Women 1.0 1 postnatal visit
7 PNC promotional visit (within 3 days of birth)
MNCH Postpartum Women 1.0 1 postnatal visit
8 PNC promotional visit (within 7 days of birth)
MNCH Postpartum Women 1.0 1 postnatal visit
9 Neonatal referrals MNCH Neonate (<1 month) 0.10 Estimate 10 Reporting of maternal deaths MNCH Postpartum Women 0.012 According to DHS 2013, the maternal
mortality ratio (MMR) during the seven-year period before the survey (2006-2012) is estimated as 1,165 maternal deaths per 100,000 live births.

35
11 Reporting of births MNCH Children <1 1.0 1 report per birth 12 Reporting of under-five deaths MNCH Children <5 0.156 Expressed in terms of 156 deaths per
1,000 live births (Source: DHS 2013)
13 Assessment (iCCM) iCCM Children 2-59 months 6.0 Estimate 14 Malaria/fever diagnosis (RDT) iCCM Children 2-59 months 4.2 (Source: World Malaria Report 2008) 15 Fever - presumptive treatment (no-
touch policy / no RDT) **this will be phased out in 2016
iCCM Children 2-59 months 4.2 (Source: World Malaria Report 2008)
16 Malaria treatment (confirmed RDT) iCCM Children 2-59 months 3.255 77.52% of fever cases (see above: 4.2) tested in the community were positive. (Source:2015 Sierra Leone HMIS)
17 Pneumonia diagnosis + treatment iCCM Children 2-59 months 0.46 (Source: Rudan IL, Boschi-Pinto C, Biloglav Z, Mulholland K, Campbell H. 2008. Epidemiology and etiology of childhood pneumonia. Bull World Health Organ 86:408-416.)
18 Diarrhea treatment iCCM Children 2-59 months 3.70 (Source: Fisher Walker, C, Perin, J, Aryee, M, Boschi-Pinto, C and Black, R. Diarrhea incidence in low- and middle-income countries in 1990 and 2010: a systematic review. BMC Public Health 2012, 12:220)
19 Referral after iCCM assessment (no touch policy)
iCCM Children 2-59 months 6.0 Estimate
20 Follow-up visit to patient's house (after 2 days)
iCCM Children 2-59 months 6.0 Estimate (see above)
21 Community Integrated Disease Surveillance Reporting (routine)
DPC Community 12.0 Estimated 12 monthly paper-based reports submitted per year
22 Suspected Ebola reporting (7 event triggers)
DPC Community 0.033 This is an extrapolation from the 2015 CEBS evaluation: 50 CHMs (assumed to cover 5,000 people each) have reported 3,432 alerts/triggers in five months in

36
2014. This figure is annualized and divided in to the number of people the 50 CHMs have covered. (Source: MOHS 2015 Community Events Based Surveillance Report)
23 Male condom distribution RH/FP Males 15-49 12.0 1 visit per month (12 condoms per month). According to UNFPA (2016), 20% of adult males 15-49 will are expected to need 12 condoms/month. (Source: UNFPA 2016)
24 Refills of oral contraceptives RH/FP Female Rep Age 4.0 Three month cycles of oral contraceptives (once every three months). (Source: UNFPA 2016)
25 Malaria/fever diagnosis (RDT) - Adults Malaria (5 years+) Adults >5 1.2 According to national consumption data, adults consume 1.2 RDTs per year. (Source: Sierra Leone National Malaria Control Program)
26 Malaria treatment (confirmed RDT) - Adults
Malaria (5 years+) Adults >5 1.0 According to the NMCP, adults will experience one case of malaria per year. (Source: Sierra Leone National Malaria Control Program)
27 Follow-up visit - management of children with Severe Acute Malnutrition
Nutrition Children 6-59 months 0.014 At the national level, 1.4% of children 6-59 months had MUAC of <11.5. (Source: UNICEF. Report –The Nutritional Situation in Sierra Leone. October 2010.)
28 Severe Malnutrition (SAM) referral Nutrition Children 6-59 months 0.014 See above
29 Follow-up visit - management of children with Moderate Acute Malnutrition (MAM)
Nutrition Children 6-59 months 0.058 At the national level, 5.8% (5.3- 6.4% 95% C.I.) of children aged 6-59 months had a MUAC < 12.5cm. (Source: UNICEF. Report –The Nutritional Situation in Sierra Leone. October 2010.)

37
30 Infant and young child feeding (IYCF) - includes referral for multi-micronutrients (6-59 months)
Nutrition Children 6-59 months 0.504 It is estimated that children with SAM and MAM (see above incidence rates) will receive 7 visits per year. (Source: MOHS)
31 Mobilization for measles campaign (once per year for 5 days)
Campaign mobilization
Community 1.0 1 campaign per year (Source: MOHS)
32 National Immunization Days (4 times per year for 4 days)
Campaign mobilization
Community 4.0 4 campaigns per year (Source: MOHS)
33 Welbodi Week (twice per year for 5 days each)
Campaign mobilization
Community 2.0 2 campaigns per year (Source: MOHS)
34 Polio campaigns (3 times per year for 4 days)
Campaign mobilization
Community 4.0 4 campaigns per year (Source: MOHS)
35 LLIN distribution (3 nets per household) Campaign mobilization
Community 0.333 1 campaign every three years (Source: MOHS)
36 LF / Onchocerciasis campaign (1 time per year for 5 days)
Campaign mobilization
Community 1.0 1 campaign per year (Source: MOHS)
37 House-to-house visits (quarterly) Other Community 4.0 4 visits per year (once per quarter) Source: MOHS CHW Strategy (2016)
38 Community mapping Other Household 1.0 1 community mapping per community served by the CHW. (Source: MOHS CHW Strategy [2016])
39 Malnutrition screening MNCH Children 6-59 months 1.0 Each child 6-59 months should be screened for malnutrition at least once per year. (Source: MOHS)
40 ANC promotional visit 2 (2nd trimester) w/ IPTp **this will be phased into the CHS package in 2016
MNCH Pregnant Women 1.0 1 visit per pregnancy
41 ANC promotional visit 3 (3rd trimester) w/ IPTp **this will be phased into the CHS package in 2016
MNCH Pregnant Women 1.0 1 visit per pregnancy

38
42 Referral after iCCM assessment (w/out no touch policy) **this will be phased into the CHS package in 2016
iCCM Children 2-59 months 0.06 An estimated 10% of iCCM cases assessed (see above) are referred to the health facility. (Source: Collins, D et al. “The costs of integrated community case management (iCCM) programs: a multi-country analysis.” Journal of Global Health (2014): 4(2). doi: 10.7189/jogh.04.020407.)

39

40
Annex 4. Bombali District Population and Health Service Structure (2015-2025)
Indicator Baseline 2015 2016 2017 2018 2019 2020 2021 2022 2023 2024 2025
Sub-national population, if applicable
506,838
518,080
529,571
541,317
553,323
565,596
578,141
590,964
604,071
617,470
631,165
Annual population growth rate 2.2% 2.2% 2.2% 2.2% 2.2% 2.2% 2.2% 2.2% 2.2% 2.2% 2.2% % population targeted by community services 33% 100% 100% 100% 100% 100% 100% 100% 100% 100% 100%
Total population covered by community services
168,092
518,080
529,571
541,317
553,323
565,596
578,141
590,964
604,071
617,470
631,165
Average household size (persons per household)
5.9
5.9
5.9
5.9
5.9
5.9
5.9
5.9
5.9
5.9
5.9
Indicator Baseline 2015 2016 2017 2018 2019 2020 2021 2022 2023 2024 2025
All
168,092
518,080
529,571
541,317
553,323
565,596
578,141
590,964
604,071
617,470
631,165
Community
750
1,249
1,249
1,249
1,249
1,249
1,249
1,249
1,249
1,249
1,249
Household
28,490
87,810
89,758
91,749
93,784
95,864
97,990
100,163
102,385
104,656
106,977
All Male
83,177
256,362
262,048
267,861
273,802
279,875
286,082
292,428
298,913
305,544
312,320
All Female
84,915
261,718
267,523
273,456
279,521
285,721
292,059
298,536
305,158
311,926
318,845
Neonate (<1 month)
887
2,733
2,793
2,855
2,918
2,983
3,049
3,117
3,186
3,257
3,329
Children <1
10,639
32,790
33,517
34,261
35,021
35,798
36,592
37,403
38,233
39,081
39,948
Children 2-59 months
25,287
77,937
79,665
81,432
83,238
85,084
86,972
88,900
90,872
92,888
94,948
Children >1 to <5
15,520
47,834
48,895
49,979
51,088
52,221
53,379
54,563
55,773
57,010
58,275
Children 6-59 months
23,543
72,562
74,171
75,816
77,497
79,216
80,974
82,769
84,605
86,482
88,400

41
Children <5
26,159
80,624
82,412
84,240
86,108
88,018
89,971
91,966
94,006
96,091
98,222
Children <15
53,906
166,144
169,829
173,596
177,446
181,382
185,405
189,517
193,721
198,017
202,409
Adolescents 10-19
39,356
121,301
123,991
126,741
129,553
132,426
135,363
138,366
141,434
144,572
147,778
Youth 15-24
33,662
103,752
106,053
108,405
110,810
113,267
115,780
118,348
120,973
123,656
126,398
Adults >5
141,933
437,456
447,159
457,077
467,215
477,577
488,170
498,998
510,065
521,379
532,943
Adults >15
96,883
298,606
305,229
311,999
318,919
325,993
333,223
340,614
348,169
355,891
363,785
Male Adult
47,616
146,759
150,014
153,341
156,742
160,219
163,773
167,405
171,118
174,913
178,793
Males 15-49
39,977
39,977
39,977
39,977
39,977
39,977
39,977
39,977
39,977
39,977
39,977
Female Adult
49,267
151,847
155,215
158,658
162,177
165,774
169,451
173,209
177,051
180,978
184,992
Female Rep Age
41,068
126,578
129,385
132,255
135,188
138,187
141,252
144,385
147,587
150,861
154,207
Fem + Male Rep Age
88,684
273,337
279,399
285,596
291,930
298,406
305,025
311,790
318,705
325,774
333,000
Pregnant Women
6,259
19,291
19,719
20,156
20,603
21,060
21,527
22,005
22,493
22,992
23,502
Postpartum Women
6,174
19,029
19,451
19,882
20,323
20,774
21,235
21,706
22,187
22,679
23,182
Newborns
6,236
19,221
19,647
20,083
20,528
20,984
21,449
21,925
22,411
22,908
23,416

42
Annex 5. Bombali District - Numbers and Percentages of Services by Program and Number of CHW Hours Required (2015-2025)
Baseline 2015 2016 2017 2018 2019 2020 2021 2022 2023 2024 2025
Services by Category Promotional
26,231
379,495
506,810
639,596
778,033
922,313
940,194
958,464
977,142
996,235
1,015,749
Preventive 22,123
231,540
350,706
473,903
603,293
735,954
751,945
768,291
784,997
802,076
819,532
Curative 61,963
439,614
819,455
1,215,931
1,629,585
1,976,333
2,020,181
2,064,980
2,110,784
2,157,601
2,205,451
Total 110,317
1,050,649
1,676,970
2,329,430
3,010,911
3,634,599
3,712,320
3,791,734
3,872,923
3,955,911
4,040,732
Services by Program Baseline 2015 2016 2017 2018 2019 2020 2021 2022 2023 2024 2025
Maternal, newborn, and child health
46,989
181,304
205,042
228,735
254,410
279,006
285,196
291,522
297,987
304,597
311,353
iCCM
61,963
446,582
833,699
1,237,772
1,659,350
2,014,365
2,059,061
2,104,719
2,151,406
2,199,123
2,247,892 Disease prevention and control
-
3,006
6,012
9,018
12,023
15,029
15,029
15,029
15,029
15,029
15,029
TB/HIV
-
-
-
-
-
-
-
-
-
-
- Reproductive health and family planning
-
111,134
111,471
111,815
112,167
112,527
112,895
113,271
113,655
114,048
114,450
Malaria (5 years+)
-
192,481
393,500
603,342
822,298
1,050,669
1,073,974
1,097,796
1,122,143
1,147,034
1,172,475
Nutrition
1,365
11,929
20,085
28,598
37,478
46,738
47,775
48,834
49,917
51,024
52,156

43
Campaign mobilization
-
15,404
15,404
15,404
15,404
15,404
15,404
15,404
15,404
15,404
15,404
Other
-
88,809
91,756
94,746
97,780
100,860
102,986
105,159
107,381
109,652
111,973
Total
110,317
1,050,649
1,676,970
2,329,430
3,010,911
3,634,599
3,712,320
3,791,734
3,872,923
3,955,911
4,040,732
Services by Program (%) Baseline 2015 2016 2017 2018 2019 2020 2021 2022 2023 2024 2025
Maternal, newborn, and child health 43% 17% 12% 10% 8% 8% 8% 8% 8% 8% 8%
iCCM 56% 43% 50% 53% 55% 55% 55% 56% 56% 56% 56% Disease prevention and control 0% 0% 0% 0% 0% 0% 0% 0% 0% 0% 0% TB/HIV 0% 0% 0% 0% 0% 0% 0% 0% 0% 0% 0% Reproductive health and family planning 0% 11% 7% 5% 4% 3% 3% 3% 3% 3% 3% Malaria (5 years+) 0% 18% 23% 26% 27% 29% 29% 29% 29% 29% 29% Nutrition 1% 1% 1% 1% 1% 1% 1% 1% 1% 1% 1% Campaign mobilization 0% 1% 1% 1% 1% 0% 0% 0% 0% 0% 0% Other 0% 8% 5% 4% 3% 3% 3% 3% 3% 3% 3%
Total 100% 100% 100% 100% 100% 100% 100% 100% 100% 100% 100% Total Time on Services by Program (hours)
Maternal, newborn, and child health
19,398
80,933
94,570
108,014
122,783
136,574
139,603
142,702
145,866
149,101
152,408
iCCM
12,496
122,920
231,474
344,784
463,004
565,135
577,675
590,484
603,582
616,970
630,652 Disease prevention and control
-
1,502
3,003
4,505
6,006
7,508
7,508
7,508
7,508
7,508
7,508
TB/HIV
-
-
-
-
-
-
-
-
-
-
- Reproductive health and family planning
-
18,522
18,579
18,636
18,695
18,755
18,816
18,879
18,943
19,008
19,075
Malaria (5 years+)

44
- 48,120 98,375 150,835 205,575 262,667 268,494 274,449 280,536 286,758 293,119
Nutrition
341
2,373
3,775
5,239
6,766
8,357
8,543
8,732
8,926
9,124
9,326
Campaign mobilization
-
303,923
303,923
303,923
303,923
303,923
303,923
303,923
303,923
303,923
303,923
Other
-
2,108,443
2,156,186
2,204,965
2,254,802
2,305,725
2,356,756
2,408,917
2,462,234
2,516,738
2,572,447
Total
32,236
2,686,737
2,909,885
3,140,902
3,381,553
3,608,645
3,681,318
3,755,594
3,831,517
3,909,130
3,988,458
Baseline
2015 2016 2017 2018 2019 2020 2021 2022 2023 2024 2025
CHW's time spent as a % of time available 5% 207% 224% 242% 260% 278% 283% 289% 295% 301% 307% Number of CHWs 650 1249 1249 1249 1249 1249 1249 1249 1249 1249 1249 Number of CHWs direct supervisors 100 125 125 125 125 125 125 125 125 125 125

45

46
Annex 6. Bombali District - Summary of Costs by Input and by Program (2015-2025), USD Cost by Input (USD)
2015 2016 2017 2018 2019 2020 2021 2022 2023 2024 2025
CHW Salaries 20,077
486,096
486,096
486,096
486,096
486,096
486,096
486,096
486,096
486,096
486,096
Equipment 107,627
329,332
292,722
304,577
310,840
331,563
317,476
293,236
304,063
311,355
319,707
Medicines, supplies, commodities
3
211,927
384,423
564,344
752,219
947,874
968,047
988,658
1,009,731
1,031,271
1,053,285
Supervision 20,592
64,349
64,349
64,349
64,349
64,349
64,349
64,349
64,349
64,349
64,349
Training 108,617
749,698
161,535
161,535
161,535
161,535
161,535
161,535
161,535
161,535
161,535
Management 271,015
292,990
292,990
292,990
292,990
292,990
292,990
292,990
292,990
292,990
292,990
Start-up Costs
108,617
741,480
-
-
-
-
-
-
-
-
-
Other Program Costs
22,716
27,985
27,985
27,985
27,985
27,985
27,985
27,985
27,985
27,985
27,985
Total 659,263
2,903,857
1,710,100
1,901,876
2,096,014
2,312,392
2,318,479
2,314,850
2,346,750
2,375,580
2,405,948
Recurrent Cost by Program (USD)
2015 2016 2017 2018 2019 2020 2021 2022 2023 2024 2025
All Community Health Programs
Maternal, newborn, and child health
132,596
57,787
40,084
39,003
38,987
38,492
38,464
38,127
38,281
38,582
38,813

47
iCCM 191,415
465,054
552,998
767,972
956,974
1,152,231
1,157,814
1,162,956
1,188,688
1,206,758
1,228,473
Disease prevention and control
181,357
16,894
11,298
10,754
10,445
10,142
10,034
9,846
9,788
9,798
9,726
TB/HIV -
-
-
-
-
-
-
-
-
-
-
Reproductive health and family planning
-
136,391
87,344
80,240
75,435
71,685
71,220
70,189
70,068
70,216
70,232
Malaria (5 years+)
-
170,179
220,979
308,902
392,975
474,131
479,846
481,709
489,828
499,980
509,370
Nutrition 45,278
16,227
10,814
10,281
9,957
9,719
9,649
9,502
9,477
9,488
9,480
Campaign mobilization
-
163,762
97,175
82,947
72,603
64,752
62,991
60,779
59,399
58,266
57,042
Other -
1,136,084
689,409
601,778
538,638
491,240
488,461
481,742
481,221
482,492
482,812
Total 550,646
2,162,377
1,710,100
1,901,876
2,096,014
2,312,392
2,318,479
2,314,850
2,346,750
2,375,580
2,405,948
Cost by Input (USD)
2015 2016 2017 2018 2019 2020 2021 2022 2023 2024 2025
CHW Salaries 3.0% 16.7% 28.4% 25.6% 23.2% 21.0% 21.0% 21.0% 20.7% 20.5% 20.2% Equipment 16.3% 11.3% 17.1% 16.0% 14.8% 14.3% 13.7% 12.7% 13.0% 13.1% 13.3% Medicines, supplies, commodities
0.0% 7.3% 22.5% 29.7% 35.9% 41.0% 41.8% 42.7% 43.0% 43.4% 43.8%
Supervision 3.1% 2.2% 3.8% 3.4% 3.1% 2.8% 2.8% 2.8% 2.7% 2.7% 2.7% Training 16.5% 25.8% 9.4% 8.5% 7.7% 7.0% 7.0% 7.0% 6.9% 6.8% 6.7% Management 41.1% 10.1% 17.1% 15.4% 14.0% 12.7% 12.6% 12.7% 12.5% 12.3% 12.2% Other Program Costs
3.4% 1.0% 1.6% 1.5% 1.3% 1.2% 1.2% 1.2% 1.2% 1.2% 1.2%

48
Total 100.0% 100.0% 100.0% 100.0% 100.0% 100.0% 100.0% 100.0% 100.0% 100.0% 100.0% All Community Health Programs
2015 2016 2017 2018 2019 2020 2021 2022 2023 2024 2025
Maternal, newborn, and child health
24.1% 2.7% 2.3% 2.1% 1.9% 1.7% 1.7% 1.6% 1.6% 1.6% 1.6%
iCCM 34.8% 21.5% 32.3% 40.4% 45.7% 49.8% 49.9% 50.2% 50.7% 50.8% 51.1% Disease prevention and control
32.9% 0.8% 0.7% 0.6% 0.5% 0.4% 0.4% 0.4% 0.4% 0.4% 0.4%
TB/HIV 0.0% 0.0% 0.0% 0.0% 0.0% 0.0% 0.0% 0.0% 0.0% 0.0% 0.0% Reproductive health and family planning
0.0% 6.3% 5.1% 4.2% 3.6% 3.1% 3.1% 3.0% 3.0% 3.0% 2.9%
Malaria (5 years+) 0.0% 7.9% 12.9% 16.2% 18.7% 20.5% 20.7% 20.8% 20.9% 21.0% 21.2%
Nutrition 8.2% 0.8% 0.6% 0.5% 0.5% 0.4% 0.4% 0.4% 0.4% 0.4% 0.4% Campaign mobilization 0.0% 7.6% 5.7% 4.4% 3.5% 2.8% 2.7% 2.6% 2.5% 2.5% 2.4%
Other 0.0% 52.5% 40.3% 31.6% 25.7% 21.2% 21.1% 20.8% 20.5% 20.3% 20.1% Total 0.0% 0.0% 0.0% 0.0% 0.0% 0.0% 0.0% 0.0% 0.0% 0.0% 0.0% 100.0% 100.0% 100.0% 100.0% 100.0% 100.0% 100.0% 100.0% 100.0% 100.0% 100.0%

49

50
Annex 7. Bombali District – Actual and Projected Numbers of Services (2015-2015)
Indicator Baseline 2015 2016 2017 2018 2019 2020 2021 2022 2023 2024 2025
Total Services 110,317 1,050,649 1,676,970 2,329,430 3,010,911 3,634,599 3,712,320 3,791,734 3,872,923 3,955,911 4,040,732 ANC promotional visit 1 (1st trimester)
6,259 19,291 19,719 20,156 20,603 21,060 21,527 22,005 22,493 22,992 23,502
ANC promotional visit 2 (2nd trimester)
6,259 - - - - - - - - - -
ANC promotional visit 3 (3rd trimester)
- - - - - - - - - - -
Referral of pregnant women with danger signs
- 579 1,183 1,814 2,472 3,159 3,229 3,301 3,374 3,449 3,525
Accompany pregnant women for delivery
- 3,858 7,888 12,094 16,482 21,060 21,527 22,005 22,493 22,992 23,502
PNC promotional visit (within 24 hours of birth)
- 3,806 7,780 11,929 16,258 20,774 21,235 21,706 22,187 22,679 23,182
PNC promotional visit (within 3 days of birth)
6,174 19,029 19,451 19,882 20,323 20,774 21,235 21,706 22,187 22,679 23,182
PNC promotional visit (within 7 days of birth)
6,174 19,029 19,451 19,882 20,323 20,774 21,235 21,706 22,187 22,679 23,182
Neonatal referrals 85 273 279 286 292 298 305 312 319 326 333 Reporting of maternal deaths
- 44 91 139 189 242 247 253 258 264 270
Reporting of births - 6,558 13,407 20,557 28,017 35,798 36,592 37,403 38,233 39,081 39,948 Reporting of under-five deaths
- 2,515 5,143 7,885 10,746 13,731 14,035 14,347 14,665 14,990 15,323

51
Assessment (iCCM) 26,030 171,076 270,468 374,186 482,368 510,504 521,832 533,403 545,235 557,328 569,688 Malaria/fever diagnosis (RDT)
- 65,467 133,837 205,209 279,679 357,353 365,282 373,382 381,664 390,129 398,781
Fever - presumptive treatment (no-touch policy / no RDT)
- - - - - - - - - - -
Malaria treatment (confirmed RDT)
- 50,737 103,724 159,037 216,751 276,949 283,094 289,371 295,790 302,350 309,056
Pneumonia diagnosis + treatment
- 7,170 14,658 22,475 30,631 39,139 40,007 40,894 41,801 42,728 43,676
Diarrhea treatment - 57,673 117,904 180,779 246,384 314,811 321,796 328,932 336,228 343,685 351,307 Referral after iCCM assessment (no touch policy)
35,933 - - - - - - - - - -
Follow-up visit to patient's house (after 2 days)
- 93,524 191,196 293,155 399,541 510,504 521,832 533,403 545,235 557,328 569,688
Weekly Community Integrated Disease Surveillance Reporting (routine)
- 2,998 5,995 8,993 11,990 14,988 14,988 14,988 14,988 14,988 14,988
Suspected Ebola reporting (7 event triggers)
- 8 16 25 33 41 41 41 41 41 41
Male condom distribution
- 95,945 95,945 95,945 95,945 95,945 95,945 95,945 95,945 95,945 95,945
Refills of oral contraceptives
- 15,189 15,526 15,871 16,223 16,582 16,950 17,326 17,710 18,103 18,505
Malaria/fever diagnosis (RDT) - Adults
- 104,989 214,636 329,095 448,526 573,092 585,804 598,798 612,078 625,655 639,532
Malaria treatment (confirmed RDT) -
- 87,491 178,864 274,246 373,772 477,577 488,170 498,998 510,065 521,379 532,943

52
Adults Follow-up visit - management of children with Severe Acute Malnutrition
- 203 415 637 868 1,109 1,134 1,159 1,184 1,211 1,238
Severe Malnutrition (SAM) referral
- 203 415 637 868 1,109 1,134 1,159 1,184 1,211 1,238
Follow-up visit - management of children with Moderate Acute Malnutrition
1,365 4,209 4,302 4,397 4,495 4,595 4,696 4,801 4,907 5,016 5,127
Infant and young child feeding (IYCF) - includes referral for multi-micronutrients (6-59 months)
- 7,314 14,953 22,927 31,247 39,925 40,811 41,716 42,641 43,587 44,553
Mobilization for measles campaign (once per year for 5 days)
- 1,249 1,249 1,249 1,249 1,249 1,249 1,249 1,249 1,249 1,249
National Immunization Days (4 times per year for 4 days)
- 4,996 4,996 4,996 4,996 4,996 4,996 4,996 4,996 4,996 4,996
Welbodi Week (twice per year for 5 days each)
- 2,498 2,498 2,498 2,498 2,498 2,498 2,498 2,498 2,498 2,498
Polio campaigns (3 times per year for 4 days)
- 4,996 4,996 4,996 4,996 4,996 4,996 4,996 4,996 4,996 4,996
LLIN distribution (3 nets per household)
- 416 416 416 416 416 416 416 416 416 416
LF / Onchocerciasis - 1,249 1,249 1,249 1,249 1,249 1,249 1,249 1,249 1,249 1,249

53
campaign (1 time per year for 5 days) House-to-house visits (quarterly)
- 999 1,998 2,998 3,997 4,996 4,996 4,996 4,996 4,996 4,996
Community mapping
- 87,810 89,758 91,749 93,784 95,864 97,990 100,163 102,385 104,656 106,977
Malnutrition screening
22,038 72,562 74,171 75,816 77,497 79,216 80,974 82,769 84,605 86,482 88,400
ANC promotional visit 2 (2nd trimester) w/ IPTp
- 19,291 19,719 20,156 20,603 21,060 21,527 22,005 22,493 22,992 23,502
ANC promotional visit 3 (3rd trimester) w/ IPTp
- 14,468 16,761 18,140 20,603 21,060 21,527 22,005 22,493 22,992 23,502
Referral after iCCM assessment (w/out no touch policy)
- 935 1,912 2,932 3,995 5,105 5,218 5,334 5,452 5,573 5,697

54

55
Annex 8. Kono District Population and Health Service Structure (2015-2025)
Baseline 2015 2016 2017 2018 2019 2020 2021 2022 2023 2024 2025
Sub-national population, if applicable
533,104
544,928
557,015
569,369
581,998
594,907
608,102
621,589
635,376
649,469
663,874
Annual population growth rate 2.2% 2.2% 2.2% 2.2% 2.2% 2.2% 2.2% 2.2% 2.2% 2.2% 2.2% % population targeted by community services 38% 100% 100% 100% 100% 100% 100% 100% 100% 100% 100% Total population covered by community services
200,127
544,928
557,015
569,369
581,998
594,907
608,102
621,589
635,376
649,469
663,874
Average household size (persons per household)
5.9
5.9
5.9
5.9
5.9
5.9
5.9
5.9
5.9
5.9
5.9
Baseline 2015 2016 2017 2018 2019 2020 2021 2022 2023 2024 2025
All
200,127
544,928
557,015
569,369
581,998
594,907
608,102
621,589
635,376
649,469
663,874
Community
824
1,349
1,349
1,349
1,349
1,349
1,349
1,349
1,349
1,349
1,349
Household
33,920
92,361
94,409
96,503
98,644
100,832
103,068
105,354
107,691
110,079
112,521
All Male
99,029
269,648
275,629
281,742
287,991
294,379
300,908
307,582
314,404
321,378
328,506
All Female
101,098
275,280
281,386
287,627
294,007
300,528
307,194
314,007
320,972
328,091
335,368
Neonate (<1 month)
1,056
2,874
2,938
3,003
3,070
3,138
3,207
3,278
3,351
3,426
3,502
Children <1
12,666
34,489
35,254
36,036
36,836
37,653
38,488
39,341
40,214
41,106
42,018
Children 2-59 months
30,106
81,975
83,794
85,652
87,552
89,494
91,479
93,508
95,582
97,702
99,868
Children >1 to <5
18,478
50,313
51,429
52,569
53,735
54,927
56,145
57,391
58,664
59,965
61,295
Children 6-59 months
28,030
76,322
78,015
79,745
81,514
83,322
85,170
87,059
88,990
90,964
92,981

56
Children <5
31,144
84,802
86,683
88,606
90,571
92,580
94,633
96,732
98,878
101,071
103,312
Children <15
64,179
174,754
178,630
182,592
186,642
190,781
195,013
199,338
203,760
208,279
212,899
Adolescents 10-19
46,857
127,587
130,417
133,310
136,266
139,289
142,378
145,536
148,764
152,064
155,436
Youth 15-24
40,078
109,128
111,549
114,023
116,552
119,137
121,780
124,481
127,242
130,064
132,949
Adults >5
168,983
460,126
470,332
480,764
491,427
502,327
513,469
524,857
536,499
548,398
560,562
Adults >15
115,347
314,081
321,047
328,168
335,447
342,887
350,492
358,266
366,212
374,335
382,638
Male Adult
56,691
154,364
157,788
161,288
164,865
168,522
172,260
176,080
179,986
183,978
188,059
Males 15-49
47,596
47,596
47,596
47,596
47,596
47,596
47,596
47,596
47,596
47,596
47,596
Female Adult
58,657
159,716
163,259
166,880
170,581
174,365
178,232
182,185
186,226
190,357
194,579
Female Rep Age
48,895
133,137
136,090
139,109
142,194
145,348
148,572
151,867
155,236
158,679
162,198
Fem + Male Rep Age
105,586
287,501
293,878
300,397
307,059
313,870
320,832
327,947
335,222
342,657
350,257
Pregnant Women
7,452
20,291
20,741
21,201
21,671
22,152
22,643
23,145
23,658
24,183
24,720
Postpartum Women
7,350
20,015
20,459
20,912
21,376
21,850
22,335
22,830
23,337
23,854
24,383
Newborns
7,425
20,217
20,665
21,124
21,592
22,071
22,561
23,061
23,572
24,095
24,630

57
Annex 9. Kono District - Numbers and Percentages of Services by Program and Number of CHW Hours Required (2015-2025) Services by Category
Baseline 2015
2016 2017 2018 2019 2020 2021 2022 2023 2024 2025
Promotional 16,506
409,357
542,049
680,441
824,724
972,878
991,433
1,010,399
1,029,794
1,049,611
1,069,866
Preventive 28,105
243,671
369,036
498,696
634,868
774,484
791,302
808,492
826,066
844,029
862,391
Curative 146,775
492,562
885,050
1,294,709
1,722,099
2,078,764
2,124,864
2,171,993
2,220,177
2,269,418
2,319,742
Total 191,386
1,145,590
1,796,134
2,473,847
3,181,692
3,826,125
3,907,599
3,990,885
4,076,037
4,163,058
4,251,999
Services by Program
Baseline 2015
2016 2017 2018 2019 2020 2021 2022 2023 2024 2025
Maternal, newborn, and child health
44,536
190,700
213,595
236,350
261,094
282,391
288,653
295,053
301,599
308,287
315,127
iCCM 146,775
499,891
900,032
1,317,683
1,753,409
2,118,770
2,165,755
2,213,792
2,262,905
2,313,094
2,364,381
Disease prevention and control
-
3,239
6,479
9,718
12,957
16,196
16,196
16,196
16,196
16,196
16,196
TB/HIV -
-
-
-
-
-
-
-
-
-
-
Reproductive health and family planning
-
130,207
130,561
130,923
131,294
131,672
132,059
132,454
132,859
133,272
133,694
Malaria (5 years+)
-
202,455
413,892
634,608
864,912
1,105,119
1,129,632
1,154,685
1,180,298
1,206,476
1,233,236
Nutrition 75
9,059
18,411
28,230
38,475
49,160
50,250
51,365
52,504
53,669
54,859

58
Campaign mobilization
-
16,601
16,601
16,601
16,601
16,601
16,601
16,601
16,601
16,601
16,601
Other -
93,437
96,563
99,734
102,951
106,216
108,452
110,738
113,075
115,463
117,905
Total 191,386
1,145,590
1,796,134
2,473,847
3,181,692
3,826,125
3,907,599
3,990,885
4,076,037
4,163,058
4,251,999
Services by Program (%)
Baseline 2015
2016 2017 2018 2019 2020 2021 2022 2023 2024 2025
Maternal, newborn, and child health
23% 17% 12% 10% 8% 7% 7% 7% 7% 7% 7%
iCCM 77% 44% 50% 53% 55% 55% 55% 55% 56% 56% 56% Disease prevention and control 0% 0% 0% 0% 0% 0% 0% 0% 0% 0% 0% TB/HIV 0% 0% 0% 0% 0% 0% 0% 0% 0% 0% 0% Reproductive health and family planning 0% 11% 7% 5% 4% 3% 3% 3% 3% 3% 3% Malaria (5 years+) 0% 18% 23% 26% 27% 29% 29% 29% 29% 29% 29% Nutrition 0% 1% 1% 1% 1% 1% 1% 1% 1% 1% 1% Campaign mobilization 0% 1% 1% 1% 1% 0% 0% 0% 0% 0% 0% Other 0% 8% 5% 4% 3% 3% 3% 3% 3% 3% 3% Total 100% 100% 100% 100% 100% 100% 100% 100% 100% 100% 100%
Total Time on Services by Program (hours)
Maternal, newborn, and child health
13,314
85,128
96,360
107,252
119,394
127,039
129,856
132,735
135,679
138,688
141,766
iCCM 44,802
146,887
256,961
371,847
491,701
594,427
607,608
621,085
634,864
648,945
663,333

59
Disease prevention and control
-
1,618
3,236
4,854
6,473
8,091
8,091
8,091
8,091
8,091
8,091
TB/HIV -
-
-
-
-
-
-
-
-
-
-
Reproductive health and family planning
-
21,701
21,760
21,821
21,882
21,945
22,010
22,076
22,143
22,212
22,282
Malaria (5 years+)
-
50,614
103,473
158,652
216,228
276,280
282,408
288,671
295,074
301,619
308,309
Nutrition 19
1,624
3,292
5,048
6,880
8,790
8,985
9,185
9,388
9,597
9,809
Campaign mobilization
-
327,527
327,527
327,527
327,527
327,527
327,527
327,527
327,527
327,527
327,527
Other -
2,217,733
2,267,977
2,319,308
2,371,757
2,425,345
2,479,019
2,533,882
2,589,964
2,647,292
2,705,888
Total 58,134
2,852,832
3,080,587
3,316,309
3,561,841
3,789,443
3,865,504
3,943,251
4,022,731
4,103,970
4,187,006
Baseline 2015
2016 2017 2018 2019 2020 2021 2022 2023 2024 2025
CHW's time spent as a % of time available
8% 204% 220% 237% 254% 271% 276% 282% 287% 293% 299%
Number of CHWs 743 1346 1346 1346 1346 1346 1346 1346 1346 1346 1346
Number of CHWs direct supervisors
85 135 135 135 135 135 135 135 135 135 135
CHWs per supervisor 8.7 10.0 10.0 10.0 10.0 10.0 10.0 10.0 10.0 10.0 10.0

60

61
Annex 10. Kono District - Summary of Costs by Input and by Program (2015-2025), USD Cost by Input (USD) 2015 2016 2017 2018 2019 2020 2021 2022 2023 2024 2025
CHW Salaries 22,949 525,710 525,710 525,710 525,710 525,710 525,710 525,710 525,710 525,710 525,710 Equipment 65,076 346,910 308,011 320,233 308,011 349,294 334,688 308,011 320,233 308,011 337,072 Medicines, supplies, commodities
44,570 233,978 414,081 601,934 798,088 1,002,360 1,023,569 1,045,252 1,067,420 1,090,074 1,113,227
Supervision 17,503 69,496 69,496 69,496 69,496 69,496 69,496 69,496 69,496 69,496 69,496 Training 23,536 807,471 173,469 173,469 173,469 173,469 173,469 173,469 173,469 173,469 173,469 Management 275,574 455,046 455,046 455,046 455,046 455,046 455,046 455,046 455,046 455,046 455,046 Start-up Costs 23,536 799,253 - - - - - - - - - Other Program Costs 22,588 27,856 27,856 27,856 27,856 27,856 27,856 27,856 27,856 27,856 27,856
Total 495,332 3,265,721 1,973,671 2,173,745 2,357,677 2,603,232 2,609,835 2,604,841 2,639,231 2,649,664 2,701,878 Recurrent Cost by Program (USD)
2015 2016 2017 2018 2019 2020 2021 2022 2023 2024 2025
All Community Health Programs
Maternal, newborn, and child health
24,268 64,833 44,818 42,680 41,559 39,947 39,924 39,595 39,740 39,761 40,281
iCCM 338,108 539,360 636,539 870,059 1,065,942 1,283,796 1,290,387 1,295,410 1,324,079 1,332,783 1,366,646 Disease prevention and control
89,440 19,169 13,068 12,400 11,865 11,618 11,490 11,277 11,200 11,089 11,116
TB/HIV - - - - - - - - - - - Reproductive health and family planning
- 169,184 110,340 100,937 93,693 89,388 88,765 87,470 87,228 86,716 87,288

62
Malaria (5 years+) - 188,826 249,793 347,806 436,987 529,492 535,715 537,847 546,451 553,456 567,569
Nutrition 19,981 15,682 10,803 10,361 10,019 9,916 9,843 9,694 9,662 9,599 9,656 Campaign mobilization - 189,086 114,620 97,695 84,647 76,035 73,955 71,373 69,701 67,850 66,870
Other - 1,280,329 793,689 691,807 612,965 563,041 559,757 552,174 551,171 548,409 552,452 Total
471,796
2,466,468
1,973,671
2,173,745
2,357,677
2,603,232
2,609,835
2,604,841
2,639,231
2,649,664
2,701,878 Cost by Input (USD) 2015 2016 2017 2018 2019 2020 2021 2022 2023 2024 2025
CHW Salaries 4.6% 16.1% 26.6% 24.2% 22.3% 20.2% 20.1% 20.2% 19.9% 19.8% 19.5% Equipment 13.1% 10.6% 15.6% 14.7% 13.1% 13.4% 12.8% 11.8% 12.1% 11.6% 12.5% Medicines, supplies, commodities
9.0% 7.2% 21.0% 27.7% 33.9% 38.5% 39.2% 40.1% 40.4% 41.1% 41.2%
Supervision 3.5% 2.1% 3.5% 3.2% 2.9% 2.7% 2.7% 2.7% 2.6% 2.6% 2.6% Training 4.8% 24.7% 8.8% 8.0% 7.4% 6.7% 6.6% 6.7% 6.6% 6.5% 6.4% Management 55.6% 13.9% 23.1% 20.9% 19.3% 17.5% 17.4% 17.5% 17.2% 17.2% 16.8% Other Program Costs 4.6% 0.9% 1.4% 1.3% 1.2% 1.1% 1.1% 1.1% 1.1% 1.1% 1.0%
Total 100.0% 100.0% 100.0% 100.0% 100.0% 100.0% 100.0% 100.0% 100.0% 100.0% 100.0% All
Community Health Programs
2015 2016 2017 2018 2019 2020 2021 2022 2023 2024 2025
Maternal, newborn, and child health
5.1% 2.6% 2.3% 2.0% 1.8% 1.5% 1.5% 1.5% 1.5% 1.5% 1.5%
iCCM 71.7% 21.9% 32.3% 40.0% 45.2% 49.3% 49.4% 49.7% 50.2% 50.3% 50.6% Disease prevention and control
19.0% 0.8% 0.7% 0.6% 0.5% 0.4% 0.4% 0.4% 0.4% 0.4% 0.4%
TB/HIV 0.0% 0.0% 0.0% 0.0% 0.0% 0.0% 0.0% 0.0% 0.0% 0.0% 0.0%

63
Reproductive health and family planning
0.0% 6.9% 5.6% 4.6% 4.0% 3.4% 3.4% 3.4% 3.3% 3.3% 3.2%
Malaria (5 years+) 0.0% 7.7% 12.7% 16.0% 18.5% 20.3% 20.5% 20.6% 20.7% 20.9% 21.0%
Nutrition 4.2% 0.6% 0.5% 0.5% 0.4% 0.4% 0.4% 0.4% 0.4% 0.4% 0.4% Campaign mobilization 0.0% 7.7% 5.8% 4.5% 3.6% 2.9% 2.8% 2.7% 2.6% 2.6% 2.5%
Other 0.0% 51.9% 40.2% 31.8% 26.0% 21.6% 21.4% 21.2% 20.9% 20.7% 20.4% Total 100.0% 100.0% 100.0% 100.0% 100.0% 100.0% 100.0% 100.0% 100.0% 100.0% 100.0%

64
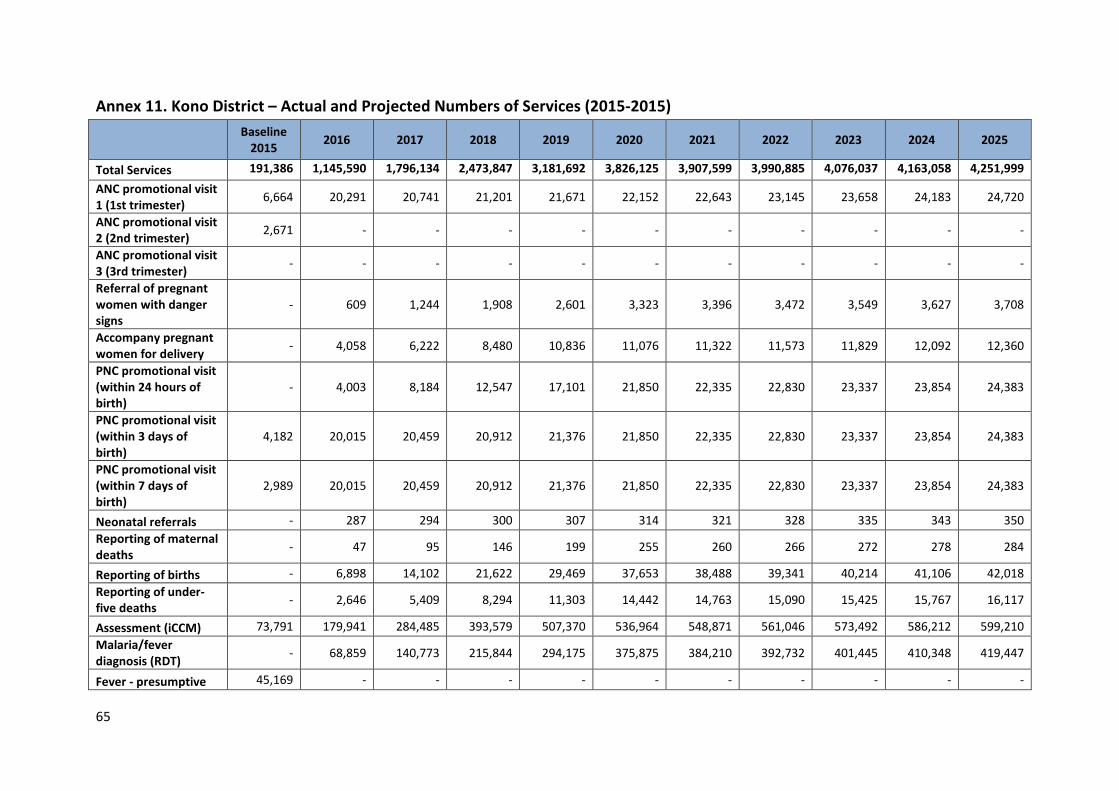
65
Annex 11. Kono District – Actual and Projected Numbers of Services (2015-2015)
Baseline
2015 2016 2017 2018 2019 2020 2021 2022 2023 2024 2025
Total Services 191,386 1,145,590 1,796,134 2,473,847 3,181,692 3,826,125 3,907,599 3,990,885 4,076,037 4,163,058 4,251,999 ANC promotional visit 1 (1st trimester) 6,664 20,291 20,741 21,201 21,671 22,152 22,643 23,145 23,658 24,183 24,720
ANC promotional visit 2 (2nd trimester) 2,671 - - - - - - - - - -
ANC promotional visit 3 (3rd trimester) - - - - - - - - - - -
Referral of pregnant women with danger signs
- 609 1,244 1,908 2,601 3,323 3,396 3,472 3,549 3,627 3,708
Accompany pregnant women for delivery - 4,058 6,222 8,480 10,836 11,076 11,322 11,573 11,829 12,092 12,360
PNC promotional visit (within 24 hours of birth)
- 4,003 8,184 12,547 17,101 21,850 22,335 22,830 23,337 23,854 24,383
PNC promotional visit (within 3 days of birth)
4,182 20,015 20,459 20,912 21,376 21,850 22,335 22,830 23,337 23,854 24,383
PNC promotional visit (within 7 days of birth)
2,989 20,015 20,459 20,912 21,376 21,850 22,335 22,830 23,337 23,854 24,383
Neonatal referrals - 287 294 300 307 314 321 328 335 343 350 Reporting of maternal deaths - 47 95 146 199 255 260 266 272 278 284
Reporting of births - 6,898 14,102 21,622 29,469 37,653 38,488 39,341 40,214 41,106 42,018 Reporting of under-five deaths - 2,646 5,409 8,294 11,303 14,442 14,763 15,090 15,425 15,767 16,117
Assessment (iCCM) 73,791 179,941 284,485 393,579 507,370 536,964 548,871 561,046 573,492 586,212 599,210 Malaria/fever diagnosis (RDT) - 68,859 140,773 215,844 294,175 375,875 384,210 392,732 401,445 410,348 419,447
Fever - presumptive 45,169 - - - - - - - - - -

66
treatment (no-touch policy / no RDT) Malaria treatment (confirmed RDT) - 53,366 109,099 167,279 227,985 291,303 297,763 304,367 311,120 318,020 325,071
Pneumonia diagnosis + treatment 13,849 37,709 38,545 39,400 40,274 41,167 42,080 43,013 43,968 44,943 45,939
Diarrhea treatment 13,966 60,662 124,014 190,148 259,154 331,128 338,471 345,978 353,654 361,497 369,513 Referral after iCCM assessment (no touch policy)
- - - - - - - - - - -
Follow-up visit to patient's house (after 2 days)
- 98,370 201,105 308,349 420,249 536,964 548,871 561,046 573,492 586,212 599,210
Weekly Community Integrated Disease Surveillance Reporting (routine)
- 3,230 6,461 9,691 12,922 16,152 16,152 16,152 16,152 16,152 16,152
Suspected Ebola reporting (7 event triggers)
- 9 18 27 36 44 44 44 44 44 44
Male condom distribution - 114,230 114,230 114,230 114,230 114,230 114,230 114,230 114,230 114,230 114,230
Refills of oral contraceptives - 15,976 16,331 16,693 17,063 17,442 17,829 18,224 18,628 19,041 19,464
Malaria/fever diagnosis (RDT) - Adults
- 110,430 225,759 346,150 471,770 602,792 616,163 629,828 643,799 658,078 672,674
Malaria treatment (confirmed RDT) - Adults
- 92,025 188,133 288,458 393,142 502,327 513,469 524,857 536,499 548,398 560,562
Follow-up visit - management of children with Severe Acute Malnutrition
- 214 437 670 913 1,167 1,192 1,219 1,246 1,273 1,302
Severe Malnutrition (SAM) referral 75 267 437 670 913 1,167 1,192 1,219 1,246 1,273 1,302

67
Follow-up visit - management of children with Moderate Acute Malnutrition
- 885 1,810 2,775 3,782 4,833 4,940 5,049 5,161 5,276 5,393
Infant and young child feeding (IYCF) - includes referral for multi-micronutrients (6-59 months)
- 7,693 15,728 24,115 32,866 41,994 42,926 43,878 44,851 45,846 46,862
Mobilization for measles campaign (once per year for 5 days)
- 1,346 1,346 1,346 1,346 1,346 1,346 1,346 1,346 1,346 1,346
National Immunization Days (4 times per year for 4 days)
- 5,384 5,384 5,384 5,384 5,384 5,384 5,384 5,384 5,384 5,384
Welbodi Week (twice per year for 5 days each)
- 2,692 2,692 2,692 2,692 2,692 2,692 2,692 2,692 2,692 2,692
Polio campaigns (3 times per year for 4 days)
- 5,384 5,384 5,384 5,384 5,384 5,384 5,384 5,384 5,384 5,384
LLIN distribution (3 nets per household) - 449 449 449 449 449 449 449 449 449 449
LF / Onchocerciasis campaign (1 time per year for 5 days)
- 1,346 1,346 1,346 1,346 1,346 1,346 1,346 1,346 1,346 1,346
House-to-house visits (quarterly) - 1,077 2,154 3,230 4,307 5,384 5,384 5,384 5,384 5,384 5,384
Community mapping - 92,361 94,409 96,503 98,644 100,832 103,068 105,354 107,691 110,079 112,521 Malnutrition screening 28,030 76,322 78,015 79,745 81,514 83,322 85,170 87,059 88,990 90,964 92,981
ANC promotional visit 2(2nd trimester) w/ - 20,291 20,741 21,201 21,671 22,152 22,643 23,145 23,658 24,183 24,720

68
IPTp ANC promotional visit 3 (3rd trimester) w/ IPTp
- 15,218 17,630 19,081 21,671 22,152 22,643 23,145 23,658 24,183 24,720
Referral after iCCM assessment (w/out no touch policy)
- 984 2,011 3,083 4,202 5,370 5,489 5,610 5,735 5,862 5,992

69
Annex 12. Key Informants MOHS
Joseph Kandeh, Director of the CHW Hub, Directorate of Primary Health Care Elizabeth Musa, Primary Care Health Officer Mara Kardas-Nelson, Policy Advisor (seconded from Partners in Health) Richard J. Musa, CHW Regional Coordinator - East Albert Vandy, CHW Regional Coordinator - South Mohamed Marah, Monitoring and Evaluation Officer Brima Osaio Kamara, District Medical Officer – Bombali District Bundu Conteh, CHW Focal Person – Bombali District Manso S. Dumbuya, District Medical Officer – Kono District Alieu Banguro, Monitoring and Evaluation Officer – Kono District Moses P. Kortu, CHW Focal Person – Kono District
MOHS Partners UNICEF: Nuzhat Rafqique, Country Health Officer Kebir Hassan, Health Specialist Ngozi Kennedy, Health Specialist World Hope International: Brima Bangura, CHW Coordinator Momoh Koyanday, Health Officer International Rescue Committee: John Kpaleyea, Health Program Manager Sahr Fillie, CHW Coordinator - Kono District John Snow International: Marc Cunningham, Monitoring and Evaluation Advisor Laurentiu Stan, Chief of Party Luigi Ciccio, Technical Director

70
Annex 13. References 1 Government of Sierra Leone. National Ebola Recovery Strategy for Sierra Leone. 2015-2017. https://ebolaresponse.un.org/sites/default/files/sierra_leone_-_national_recovery_strategy_2015-2017.pdf. 2 Statistics Sierra Leone (SSL) and ICF International. 2014. Sierra Leone Demographic and Health Survey 2013. Freetown, Sierra Leone and Rockville, Maryland, USA: SSL and ICF International. 3 UNDP. Human Development Index Report. 2015. http://hdr.undp.org/sites/default/files/2015_human_development_report.pdf 4 Government of Sierra Leone and UNICEF. Sierra Leone Health Facility Assessment 2015: Impact of the EVD Outbreak on Sierra Leone’s Primary Health Care System. December 2015. 5 Ibid. 6 Ibid. 7 Ibid. 8 Ibid. 9 Government of Sierra Leone Ministry of Health and Sanitation. National CHW Policy – Draft. July 27, 2016. 10 Ibid. 11 UNICEF. Report –The Nutritional Situation in Sierra Leone. October 2010. https://www.humanitarianresponse.info/sites/www.humanitarianresponse.info/files/assessments/smart_nutrition_survey_final.pdf 12 Tanahashi T. Health services coverage and its evaluation. Bulletin of the World Health Organisation 1978; 56:295–303. 13 UNICEF. 2015-16 Georeferenced Census of CHWs in Sierra Leone. 2016 14 Ibid. 15 Ibid. 16 Ibid. 17 Ibid. 18 USAID Systems for Improved Access to Pharmaceuticals and Services and Management Sciences for Health. Sierra Leone Pharmaceutical Background (Draft). 2015.

71
19 Ibid. 20 Government of Sierra Leone and UNICEF. Sierra Leone Health Facility Assessment 2015: Impact of the EVD Outbreak on Sierra Leone’s Primary Health Care System. December 2015.