modelling and analysis of south indian temple structures
TRANSCRIPT
Modelling and analysis of South Indian temple structuresunder earthquake loading
JETSON A RONALD1, ARUN MENON2,* , ANUMOLU MEHER PRASAD2, DEVDAS MENON2
and GUIDO MAGENES3
1Aon Benfield, Bangalore, India2Department of Civil Engineering, Indian Institute of Technology Madras, Chennai 600 036, India3Department of Civil Engineering and Architecture, University of Pavia, Via A. Ferrata 1, 27100 Pavia, PV,
Italy
e-mail: [email protected]; [email protected]; [email protected]; [email protected];
MS received 5 June 2017; revised 20 November 2017; accepted 4 January 2018; published online 11 May 2018
Abstract. The gopuram (multi-tiered entrance gateway) and the mandapam (pillared multi-purpose hall) are
two representative structural forms of South Indian temples. Modelling and seismic analysis of a typical 9-tier
gopuram and, 4- and 16-pillared mandapam of the 16th century AD Ekambareswar Temple in Kancheepuram,
South India, are discussed. The seismic input is based on a probabilistic seismic hazard analysis of the
archaeological site. Two modelling strategies, namely lumped plasticity and distributed plasticity modelling, and
three analysis approaches, namely linear dynamic, non-linear, static and dynamic analyses were adopted for the
seismic assessment of the gopuram. Unlike slender masonry towers, the vulnerable part of the gopuram could be
at the upper levels, which is attributable to higher mode effects, and reduction in cross section and axial stresses.
Finite element and limit analysis approaches were adopted for the assessment of the mandapam. Potential
collapse mechanisms were identified, and the governing collapse of lateral load, calculated based on limit
theory, was compared with the seismic demand as a safety check. Simple relations, as a means of rapid
preliminary seismic assessment, are proposed for the mandapam.
Keywords. Dravidian temple structures; gopuram; mandapam; seismic vulnerability assessment.
1. Introduction
1.1 The Dravidian style of temple architecture
The configuration of the Hindu temple can be traced to the
early Buddhist rock-cut sacred spots (chaitya) and monas-
teries (vihara), seen in Ajanta (2nd c. BC) for instance,
while the earliest structural temples can be traced to the
Gupta (e.g., Vishnu temple in stone, Deogarh, 500 AD;
brick temple, Bhitargaon, 550 AD) and the Chalukya period
from the 6th c. AD (e.g., Lad Khan and Durga temples,
Aihole). Aihole in South India along with Pattadakal is
considered as the experimental ground for the temple
structure, where the transition from the northern Nagara
style (identified by the shikara, the tower-like structure
crowning the garba griha, the sanctum sanctorum) to the
southern Dravidian style (identified by the vimana, stepped
pyramidal structure ending in a dome over the garbagriha),
in turn called the Vesara style, can be observed. The Dra-
vidian style later evolved in South India under the Pallava,
Chola, Pandya, Vijayanagara and Nayak dynasties until
18th c. AD. In its final form, every tier of the vimana is
defined by horizontal mouldings, a derivative of the over-
hangs of thatch roof over bamboo huts. Described as the
Dharmaraja vimana, which evolved during the Pallava rule
(circa 7th c. AD), this was clearly based on the form of a
Buddhist vihara. The Pallava shore temples of Mamalla-
puram, the Kailashnath (7th-8th c. AD) and Vaikunta
Perumal Temples in Kancheepuram (720 AD), the Viru-
paksha Temple in Pattadakal (740 AD) of the Chalukyas
and the Chola Brihadeswara Temples at Thanjavur and
Gangaikondacholapuram (11th c. AD) are few examples.
1.2 Description of the gopuram
The multi-tiered archetypal entrance gateway in the Dra-
vidian temple, the gopuram, was a feature introduced by the
Pandyas in 14th c. AD in order to confer architectural status
to structurally insignificant ancient shrines. A gopuram,
typically rectangular in plan, rises as a truncated pyramid,
which is crowned by a structure resembling the Buddhist*For correspondence
1
Sådhanå (2018) 43:74 � Indian Academy of Sciences
https://doi.org/10.1007/s12046-018-0831-0Sadhana(0123456789().,-volV)FT3](0123456789().,-volV)
chaitya with finials over its ridge. Structures such as the
gopuram of the Meenakshi Temple in Madurai (1600 AD),
Ranganathaswamy Temple in Srirangam (17th c. AD) and
Ekambareswar Temple in Kancheepuram, built by
Vijayanagara rulers in 16th c. AD, are ubiquitous and rep-
resentatives of the highly evolved Dravidian temple archi-
tecture. Among the several gopuram in a temple, the tallest
is referred to as Rajagopuram (‘‘raja’’ meaning king). The
structure serves as a landmark as it can be sighted from
great distances. The principal function of the gopuram is to
serve as a prominent entrance gateways to the premises,
typically in the four cardinal directions. It is essentially a
masonry tower, composed of an odd number of stories with
a structural configuration similar to a bell tower or a min-
aret. Their structural responses are comparable. Several
researchers have investigated the response of such towers to
seismic loads [1–7].
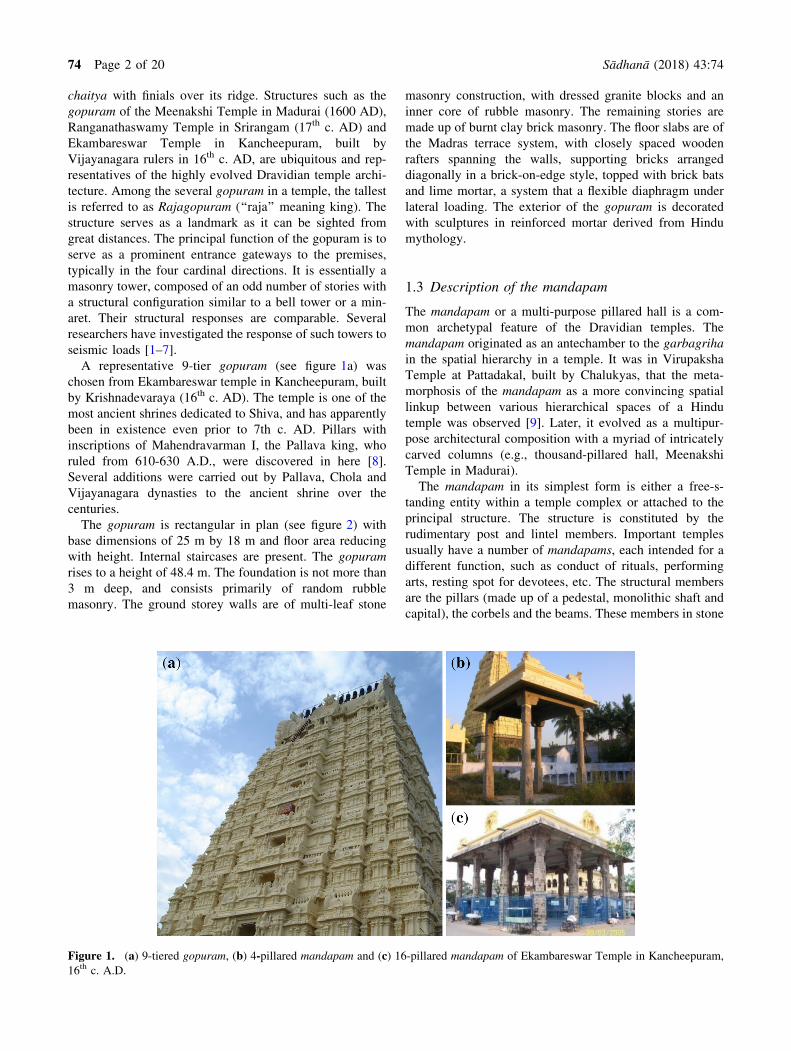
A representative 9-tier gopuram (see figure 1a) was
chosen from Ekambareswar temple in Kancheepuram, built
by Krishnadevaraya (16th c. AD). The temple is one of the
most ancient shrines dedicated to Shiva, and has apparently
been in existence even prior to 7th c. AD. Pillars with
inscriptions of Mahendravarman I, the Pallava king, who
ruled from 610-630 A.D., were discovered in here [8].
Several additions were carried out by Pallava, Chola and
Vijayanagara dynasties to the ancient shrine over the
centuries.
The gopuram is rectangular in plan (see figure 2) with
base dimensions of 25 m by 18 m and floor area reducing
with height. Internal staircases are present. The gopuram
rises to a height of 48.4 m. The foundation is not more than
3 m deep, and consists primarily of random rubble
masonry. The ground storey walls are of multi-leaf stone
masonry construction, with dressed granite blocks and an
inner core of rubble masonry. The remaining stories are
made up of burnt clay brick masonry. The floor slabs are of
the Madras terrace system, with closely spaced wooden
rafters spanning the walls, supporting bricks arranged
diagonally in a brick-on-edge style, topped with brick bats
and lime mortar, a system that a flexible diaphragm under
lateral loading. The exterior of the gopuram is decorated
with sculptures in reinforced mortar derived from Hindu
mythology.
1.3 Description of the mandapam
The mandapam or a multi-purpose pillared hall is a com-
mon archetypal feature of the Dravidian temples. The
mandapam originated as an antechamber to the garbagriha
in the spatial hierarchy in a temple. It was in Virupaksha
Temple at Pattadakal, built by Chalukyas, that the meta-
morphosis of the mandapam as a more convincing spatial
linkup between various hierarchical spaces of a Hindu
temple was observed [9]. Later, it evolved as a multipur-
pose architectural composition with a myriad of intricately
carved columns (e.g., thousand-pillared hall, Meenakshi
Temple in Madurai).
The mandapam in its simplest form is either a free-s-
tanding entity within a temple complex or attached to the
principal structure. The structure is constituted by the
rudimentary post and lintel members. Important temples
usually have a number of mandapams, each intended for a
different function, such as conduct of rituals, performing
arts, resting spot for devotees, etc. The structural members
are the pillars (made up of a pedestal, monolithic shaft and
capital), the corbels and the beams. These members in stone
Figure 1. (a) 9-tiered gopuram, (b) 4-pillared mandapam and (c) 16-pillared mandapam of Ekambareswar Temple in Kancheepuram,
16th c. A.D.
74 Page 2 of 20 Sådhanå (2018) 43:74

may be connected to each other through a tenon-mortise
joint, with or without lime mortar at the interface. In South
Indian architecture, the stone members merely rest against
each other with no interlocking mechanism. Wide cornices
and sunshades resting on the beams are seen in some
mandapams, which are held in place, by the weight of
overlying merlons or parapets. Typical pillar spacing varies
from 2 m to 3 m. The roof of the mandapam is made up of
stone slabs spanning between beams, packed with lime
mortar.
Four typical mandapams at Ekambareswar temple were
considered for the study. These consist of 16-pillared and
4-pillared structures, each 3 m and 7 m in height. A 3 m
high 4-pillared mandapam and a 7 m high 16-pillared
mandapam are shown in figure 1(b)_(c).
1.4 Seismic vulnerability of historical structures
Inadequacies in historical masonry buildings in active
seismic regions in India were noticed in the Bhuj earth-
quake in 2001 [10]. Although seismic hazard of South India
is lower than the north, the heritage value of these struc-
tures demands detailed assessment to identify highly vul-
nerable heritage stock and to develop risk mitigation
strategies.
Common problems in masonry towers (e.g., gopurams)
under seismic loading emerge from material characteristics,
slenderness effect, lack of redundancy and the construction
typology. These structures, which are often slender and tall,
being flexible, could attract lower seismic forces. But their
increased height increases the lever arm for overturning
moment due to lateral forces and hence, the slenderness
effect could have adverse consequences. Inclination of
ancient towers, primarily due to differential soil settlement,
is common. Hence, the resulting secondary stress could be
large [2]. Multi-leaf construction is a common typology,
often resorted to so as to increase wall thickness and
counter gravity loads. With homogenous infill and adequate
interconnections between veneers, such a system could be
stable under static loads, but not necessarily under dynamic
loads. Increased thickness implies higher mass, not higher
resistance. Disintegration of the infill masonry and deteri-
oration of the interconnection between veneers are very
common in ancient masonry walls leading to increased
vulnerability under lateral loads.
In mandapams, the lime mortar that provides an interface
between pillars, corbels and beams offer no resistance to
tension. Hence, during ground motion they are expected to
behave like dry masonry structures. Mandapams are com-
parable to the Roman classical single drum columns with
architraves (e.g., Parthenon Pronaos, Greece). The slen-
derness effect of the monolithic pillar makes the structural
behaviour of the mandapam considerably different from
that of classical multi-drum Greek temple structures.
Studies on the porch of Parthenon [11, 13] reveal that
seismic response of such structures is sensitive to the
structural configuration, as well as ground motion param-
eters, with their dynamic behaviour being highly non-lin-
ear. Collapse of these structures is mainly due to instability
rather than exceedance of material strength [11, 12, 14].
Hence, assessment methods that give due importance to the
geometry are required.
2. Methodology adopted
The structural system of the gopuram was reconstructed
based on inputs from temple architects, and details were
verified with in-situ inspections. The seismic input at the
archaeological site was defined through a parallel study.
Probabilistic Seismic Hazard Assessment (PSHA) and
stochastic site response analysis based on in-situ and lab-
oratory, geophysical and geotechnical experiments to
(a) (b)
Figure 2. Typical configuration of a gopuram in plan: (a) ground storey, (b) upper stories.
Sådhanå (2018) 43:74 Page 3 of 20 74

characterize the sub-soil were carried out to define the
seismic input in terms of acceleration spectra and suites of
acceleration records to perform time-history analysis. A 3D
finite element (FE) model of the gopuram was developed
for gravity and response spectrum analyses, while non-
linear analyses, both static and dynamic, were performed
using a lumped mass model, with distributed plasticity. The
seismic vulnerability of mandapams was studied by two
approaches: linear FE approach and a simplified non-linear
approach based on limit analysis.
Ambient vibration tests were executed to identify the
fundamental frequency of the mandapams, and subse-
quently, the findings were used to calibrate FE models.
However, during the simulation very high frequency values
were obtained for the models with elastic modulus (E) es-
timated from experimental tests on material samples. Sub-
sequently, the E value was reduced to around 1/10th its
original, in order to match ambient vibration test results,
suggesting FE continuum modelling for dry masonry is not
appropriate. Researchers have come to similar conclusions
on FE modelling of dry masonry towers in Bayon temple,
Cambodia [15].
Several challenges are encountered in structural assess-
ment of historical buildings due to: (1) lack of material
characterization and peculiarities of the materials used, (2)
poor understanding of ancient construction practices,
especially sequence of construction, (3) existing damages
and difficulty in diagnosing these, and (4) lack of code
provisions for structural assessment. Often these setbacks
render sophisticated analysis less reliable. Simplified anal-
ysis is generally adopted as an alternative, or prior to rig-
orous analysis for recurrent structures mainly to identify the
most vulnerable configurations and to prioritize retrofitting
schemes [16]. Such approaches are effective for symmet-
rical structures with simple configurations. A similar
approach has been adopted here. The structures selected for
the present study are representative samples of recurrent
forms in South Indian temples. A simplified procedure
based on limit analysis has been proposed, which gives
factor of safety as a function of the peak ground accelera-
tion (PGA).
3. Definition of the seismic input at Kancheepuram
3.1 PSHA of the archaeological site
Indian seismicity is characterized by a relatively high fre-
quency of large earthquakes and a relatively low frequency
of moderate ones. The zoning map of India divides the
country into four seismic zones, namely zone II (MSK
intensity VI), III (MSK VII), IV (MSK VIII) and V (MSK
IX or more). The assigned effective PGA corresponding to
the Maximum Considered Earthquake (MCE) are 0.36 g
(zone V), 0.24 g (IV), 0.16 g (III) and 0.10 g (II) [17]. Since
the occurrence of recent moderate earthquakes in
Peninsular India, such as the Mw 6.4 Latur earthquake
(1993) and the Mw 5.5 Pondicherry earthquake (2001),
Peninsular India has been considered to be moderately
active. PSHA at the archaeological site in Kancheepuram
was performed using an earthquake catalogue for the region
from 1507-2007 AD. More information on the hazard
analysis can be obtained from [18] and [19].
PGA for different return periods are tabulated (table 1)
and the uniform hazard acceleration spectra are shown in
figure 3 (a)–(b). From deaggregation analysis of PSHA
results, the controlling earthquake at Kancheepuram, for the
PGA with 475-year return period is an event of magnitude
Mw 4.0-5.2 and hypocentral distance 17-31 km. Suites of
seven natural acceleration records on rock sites from
worldwide strong motion databases were identified by
imposing spectrum-compatibility criterion between the
mean spectrum of the selected records and the uniform
hazard spectrum from the PSHA study [20, 21] stipulates at
least seven records for average response quantities from
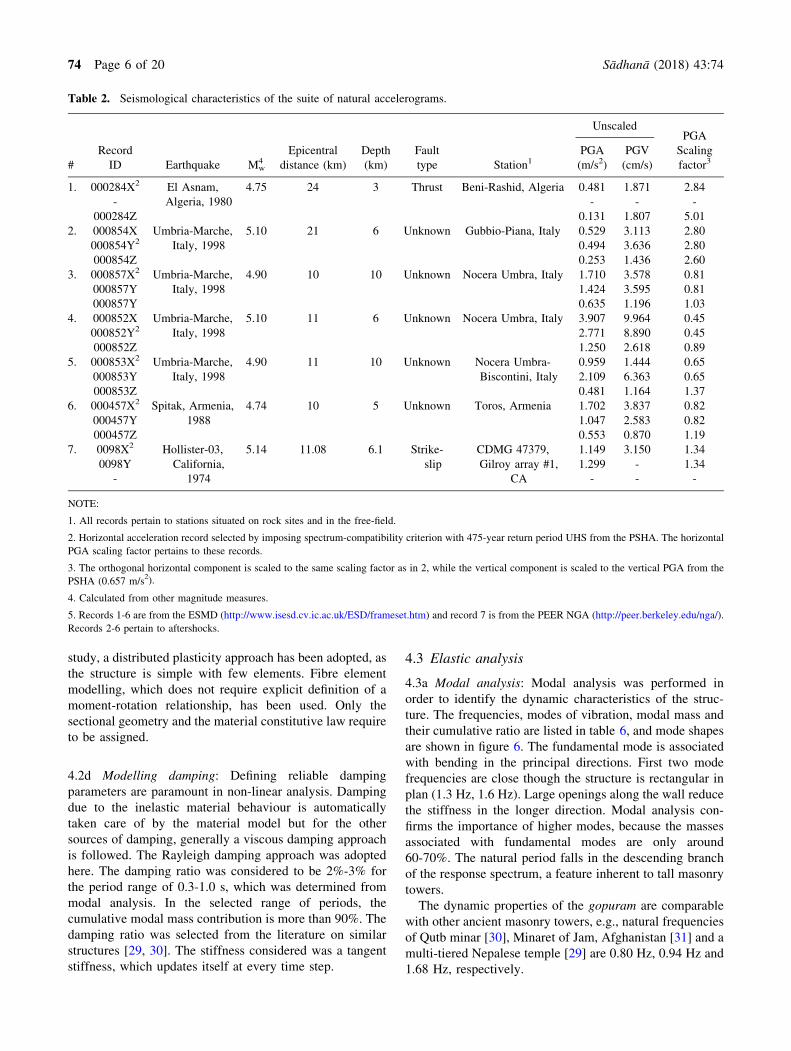
non-linear time-history analyses. Scaling factors used to
match the PGA (e.g., for the 2475-year return period) vary
between 0.45 and 2.8 (refer table 2). The records selected
for the 2475-year return period event are shown in figure 4.
3.2 Experimental investigations
Sub-soil characterization at the site was carried out using
invasive (standard SPT) and non-invasive geophysical
procedures (MASW technique). The most important
dynamic parameter, which affects the damage levels in the
structure i.e., the fundamental frequency of the site, was
estimated experimentally (see table 3). Dynamic impe-
dances that characterize the soil have been computed for
soil-structure interaction (SSI) analysis, considered in the
assessment of the gopuram. Dynamic spring (stiffness)
constants and dashpot (damping) constants have been cal-
culated based on the geometry of the foundation as well as
Table 1. Peak ground accelerations from PSHA compared to IS
code [17, 19].
Probability of
exceedance
Return
period
(Years)
PSHA
IS – 1893-1
(2002)
PHA*
(g)
PVA*
(g)
PHA
(g)
PVA
(g)
2% in 50 years 2475 0.141 0.067 0.16 0.11
5% in 50 years 975 0.105 0.049 - -
10% in 50
years
475 0.080 0.037 0.08 0.05
40% in 50
years
95 0.041 0.021 - -
* PHA – peak horizontal ground acceleration; PVA – peak vertical ground
acceleration
74 Page 4 of 20 Sådhanå (2018) 43:74

mechanical properties of the subsoil, as reported in table 4,
using the dynamic impedance model [22].
4. Analysis of the gopuram
4.1 Material model
A limited number of tests were carried out for estimating
the mechanical properties of the construction materials of
the gopuram. These tests were conducted on samples pro-
cured from the distressed portions of similar structures in
the temple. Dynamic identification with ambient vibration
is not appropriate for large structures, such as the gopuram,
due to high background noise. Recourse to forced dynamic
tests with harmonic vibration is required, considering the
size and complexity of the structure, which could not be
executed in the current study. Since the objective of the
study was to understand the global behaviour of the struc-
ture, the macro-modelling approach was adopted. Homog-
enization of masonry was carried out on the lines of
available models in the literature [23–26]. However, none
of these are specific to historical masonry, but focus on
typical masonry constructions in India. Based on the lim-
ited mechanical tests performed on material samples,
elastic properties of brick and stone masonry were con-
servatively assumed (refer table 5). The tensile strength of
the masonry was ignored due to ageing effects and deteri-
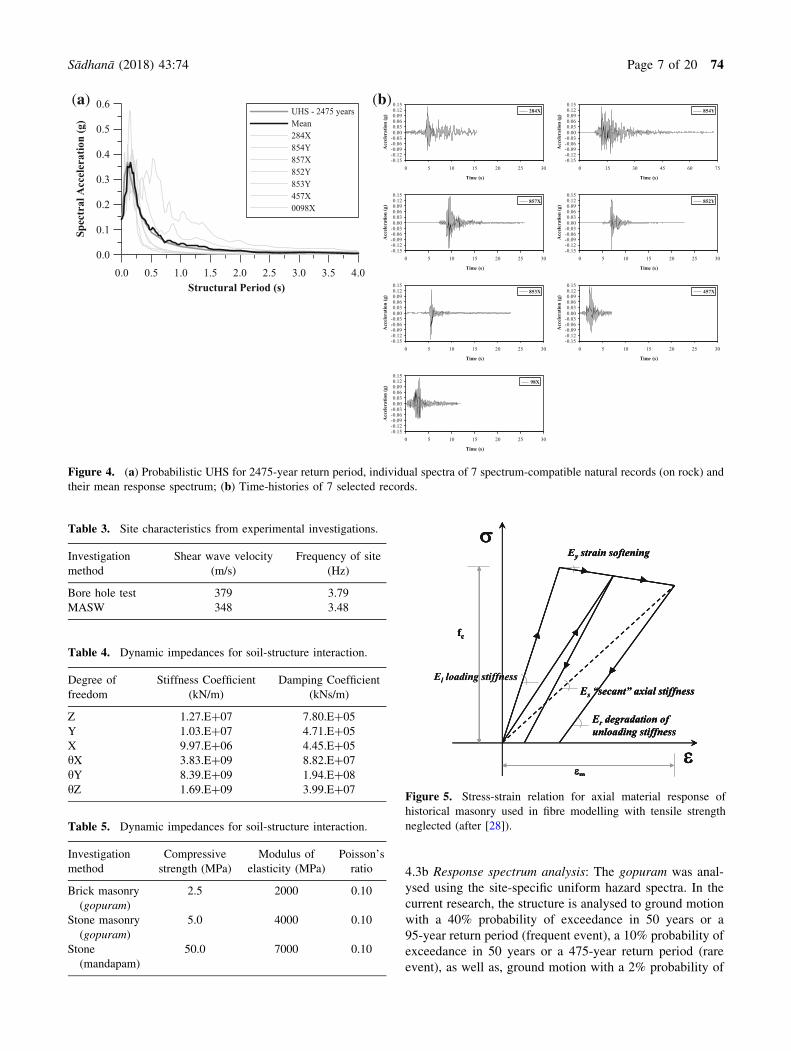
oration. The material model used in the study was proposed
by [27] and [28] for masonry towers, which is based on the
premise that compression failure mode is not purely brittle.
As seen in figure 5, the model is capable of capturing both
negative and degrading stiffness. Degradation depends on
the maximum plastic strain occurring during the loading
history. Local collapse for a single fibre is defined when a
certain value of maximum strain in compression is reached,
after which the fibre cannot contribute anymore to the
sectional resistance.
4.2 Structural modelling
4.2a 3D Finite Element Model: Gravity load analysis and
response spectrum analyses were carried out using 3D FE
model. Only members meant to carry loads were modelled.
The floor diaphragms are very flexible and poorly con-
nected to the walls, hence not modelled. Openings in the
walls were modelled. The foundation was modelled using
the dynamic spring and damping constants to account for
SSI. FE modelling was carried out on an ABAQUS 6.6.4
platform. C3D10, a 3D tetrahedron continuum element with
10 nodes and quadratic displacement behaviour was used in
the model. Each node has three degrees of freedom in the
nodal x, y and z directions. The tetrahedron element was
preferred because of the irregular geometry of the structure.
4.2b Lumped mass model: 3D models become difficult to
deal with when the type of analysis to be performed is
iterative or when a large number of analyses have to be
carried out. A lumped mass or ‘‘stick’’ model is effective
for symmetric structures and is used as an alternative to 3D
FE models. 3D beam-column elements capable of
accounting for geometric and material non-linearity were
used. A limitation of this element is that shear deformations
are ignored. However, shear response may be not a domi-
nating mechanism in these tall slender structures. The mass
of the structure is represented by single-node lumped mass
elements, characterised by three translational and three
rotational inertia values. Non-linear analysis was performed
with this model.
4.2c Modelling inelasticity: Two approaches are commonly
used to study the inelastic behaviour of structures viz.
concentrated plasticity and distributed plasticity approa-
ches. The former works well for capacity designed struc-
ture, or for structures where locations of inelastic regions
are known apriori. Such a choice is impractical in historical
masonry structures. The latter overcomes this difficulty, but
they could be computationally demanding. In the present
0.00 0.25 0.50 0.75 1.00 1.25 1.50 1.75 2.00Structural Period (s)
0.000.050.100.150.200.250.300.350.400.45
Spec
tral
Acc
eler
atio
n (g
)
DBE - Rock site [BIS-1893-1, 2002]MCE - Rock site [BIS-1893-1, 2002]UHS T = 95 yearsUHS T = 475 yearsUHS T = 975 yearsUHS T = 2475 years
(a) ( )
0.00 0.25 0.50 0.75 1.00 1.25 1.50 1.75 2.00Structural Period (s)
0.000.050.100.150.200.250.300.350.400.45
Spec
tral
Acc
eler
atio
n (g
)
DBE - Rock site [BIS-1893-1, 2002]MCE - Rock site [BIS-1893-1, 2002]UHS T = 95 yearsUHS T = 475 yearsUHS T = 975 yearsUHS T = 2475 years
(b)
Figure 3. Uniform hazard spectra compared to the elastic response spectra from [17] for (a) horizontal ground motion; (b) verticalground motion [19].
Sådhanå (2018) 43:74 Page 5 of 20 74
study, a distributed plasticity approach has been adopted, as
the structure is simple with few elements. Fibre element
modelling, which does not require explicit definition of a
moment-rotation relationship, has been used. Only the
sectional geometry and the material constitutive law require
to be assigned.
4.2d Modelling damping: Defining reliable damping
parameters are paramount in non-linear analysis. Damping
due to the inelastic material behaviour is automatically
taken care of by the material model but for the other
sources of damping, generally a viscous damping approach
is followed. The Rayleigh damping approach was adopted
here. The damping ratio was considered to be 2%-3% for
the period range of 0.3-1.0 s, which was determined from
modal analysis. In the selected range of periods, the
cumulative modal mass contribution is more than 90%. The
damping ratio was selected from the literature on similar
structures [29, 30]. The stiffness considered was a tangent
stiffness, which updates itself at every time step.
4.3 Elastic analysis
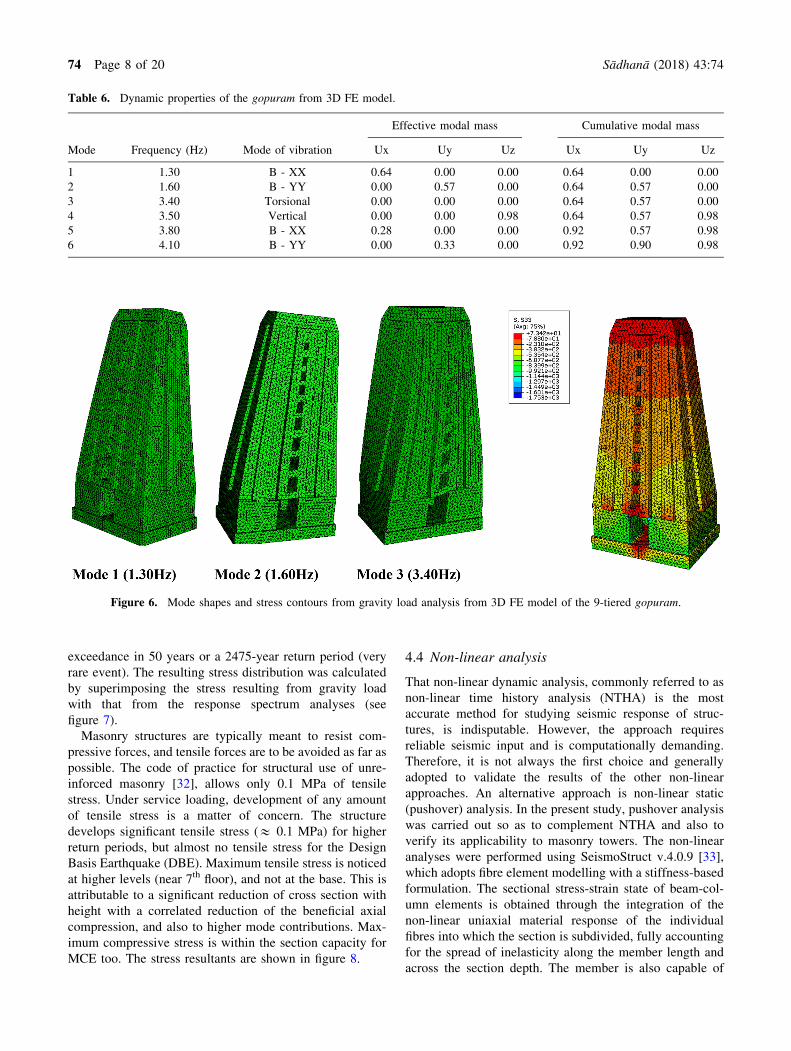
4.3a Modal analysis: Modal analysis was performed in
order to identify the dynamic characteristics of the struc-
ture. The frequencies, modes of vibration, modal mass and
their cumulative ratio are listed in table 6, and mode shapes
are shown in figure 6. The fundamental mode is associated
with bending in the principal directions. First two mode
frequencies are close though the structure is rectangular in
plan (1.3 Hz, 1.6 Hz). Large openings along the wall reduce
the stiffness in the longer direction. Modal analysis con-
firms the importance of higher modes, because the masses
associated with fundamental modes are only around
60-70%. The natural period falls in the descending branch
of the response spectrum, a feature inherent to tall masonry
towers.
The dynamic properties of the gopuram are comparable
with other ancient masonry towers, e.g., natural frequencies
of Qutb minar [30], Minaret of Jam, Afghanistan [31] and a
multi-tiered Nepalese temple [29] are 0.80 Hz, 0.94 Hz and
1.68 Hz, respectively.
Table 2. Seismological characteristics of the suite of natural accelerograms.
#
Record
ID Earthquake Mw4
Epicentral
distance (km)
Depth
(km)
Fault
type Station1
UnscaledPGA
Scaling
factor3PGA
(m/s2)
PGV
(cm/s)
1. 000284X2 El Asnam,
Algeria, 1980
4.75 24 3 Thrust Beni-Rashid, Algeria 0.481 1.871 2.84
- - - -
000284Z 0.131 1.807 5.01
2. 000854X Umbria-Marche,
Italy, 1998
5.10 21 6 Unknown Gubbio-Piana, Italy 0.529 3.113 2.80
000854Y2 0.494 3.636 2.80
000854Z 0.253 1.436 2.60
3. 000857X2 Umbria-Marche,
Italy, 1998
4.90 10 10 Unknown Nocera Umbra, Italy 1.710 3.578 0.81
000857Y 1.424 3.595 0.81
000857Y 0.635 1.196 1.03
4. 000852X Umbria-Marche,
Italy, 1998
5.10 11 6 Unknown Nocera Umbra, Italy 3.907 9.964 0.45
000852Y2 2.771 8.890 0.45
000852Z 1.250 2.618 0.89
5. 000853X2 Umbria-Marche,
Italy, 1998
4.90 11 10 Unknown Nocera Umbra-
Biscontini, Italy
0.959 1.444 0.65
000853Y 2.109 6.363 0.65
000853Z 0.481 1.164 1.37
6. 000457X2 Spitak, Armenia,
1988
4.74 10 5 Unknown Toros, Armenia 1.702 3.837 0.82
000457Y 1.047 2.583 0.82
000457Z 0.553 0.870 1.19
7. 0098X2 Hollister-03,
California,
1974
5.14 11.08 6.1 Strike-
slip
CDMG 47379,
Gilroy array #1,
CA
1.149 3.150 1.34
0098Y 1.299 - 1.34
- - - -
NOTE:
1. All records pertain to stations situated on rock sites and in the free-field.
2. Horizontal acceleration record selected by imposing spectrum-compatibility criterion with 475-year return period UHS from the PSHA. The horizontal
PGA scaling factor pertains to these records.
3. The orthogonal horizontal component is scaled to the same scaling factor as in 2, while the vertical component is scaled to the vertical PGA from the
PSHA (0.657 m/s2).
4. Calculated from other magnitude measures.
5. Records 1-6 are from the ESMD (http://www.isesd.cv.ic.ac.uk/ESD/frameset.htm) and record 7 is from the PEER NGA (http://peer.berkeley.edu/nga/).
Records 2-6 pertain to aftershocks.
74 Page 6 of 20 Sådhanå (2018) 43:74
4.3b Response spectrum analysis: The gopuram was anal-
ysed using the site-specific uniform hazard spectra. In the
current research, the structure is analysed to ground motion
with a 40% probability of exceedance in 50 years or a
95-year return period (frequent event), a 10% probability of
exceedance in 50 years or a 475-year return period (rare
event), as well as, ground motion with a 2% probability of
0.0 0.5 1.0 1.5 2.0 2.5 3.0 3.5 4.0Structural Period (s)
0.0
0.1
0.2
0.3
0.4
0.5
0.6
Spec
tral
Acc
eler
atio
n (g
)
UHS - 2475 yearsMean284X854Y857X852Y853Y457X0098X
-0.15-0.12-0.09-0.06-0.030.000.030.060.090.120.15
0 5 10 15 20 25 30
Time (s)
Acc
eler
atio
n (g
)
284X
-0.15-0.12-0.09-0.06-0.030.000.030.060.090.120.15
0 15 30 45 60 75
Time (s)
Acc
eler
atio
n (g
)
854Y
-0.15-0.12-0.09-0.06-0.030.000.030.060.090.120.15
0 5 10 15 20 25 30
Time (s)
Acc
eler
atio
n (g
)
857X
-0.15-0.12-0.09-0.06-0.030.000.030.060.090.120.15
0 5 10 15 20 25 30
Time (s)
Acc
eler
atio
n (g
)
852Y
-0.15-0.12-0.09-0.06-0.030.000.030.060.090.120.15
0 5 10 15 20 25 30
Time (s)
Acc
eler
atio
n (g
)
853X
-0.15-0.12-0.09-0.06-0.030.000.030.060.090.120.15
0 5 10 15 20 25 30
Time (s)
Acc
eler
atio
n (g
)
457X
-0.15-0.12-0.09-0.06-0.030.000.030.060.090.120.15
0 5 10 15 20 25 30
Time (s)
Acc
eler
atio
n (g
)98X
(a) (b)
Figure 4. (a) Probabilistic UHS for 2475-year return period, individual spectra of 7 spectrum-compatible natural records (on rock) and
their mean response spectrum; (b) Time-histories of 7 selected records.
Table 3. Site characteristics from experimental investigations.
Investigation
method
Shear wave velocity
(m/s)
Frequency of site
(Hz)
Bore hole test 379 3.79
MASW 348 3.48
Table 4. Dynamic impedances for soil-structure interaction.
Degree of
freedom
Stiffness Coefficient
(kN/m)
Damping Coefficient
(kNs/m)
Z 1.27.E?07 7.80.E?05
Y 1.03.E?07 4.71.E?05
X 9.97.E?06 4.45.E?05
hX 3.83.E?09 8.82.E?07
hY 8.39.E?09 1.94.E?08
hZ 1.69.E?09 3.99.E?07
Table 5. Dynamic impedances for soil-structure interaction.
Investigation
method
Compressive
strength (MPa)
Modulus of
elasticity (MPa)
Poisson’s
ratio
Brick masonry
(gopuram)
2.5 2000 0.10
Stone masonry
(gopuram)
5.0 4000 0.10
Stone
(mandapam)
50.0 7000 0.10
El loading stiffness
Ey strain softening
Er degradation of unloading stiffness
Es “secant” axial stiffness
fc
El loading stiffness
Ey strain softening
Er degradation of unloading stiffness
Es “secant” axial stiffness
fc
Ey strain softening
Er degradation of unloading stiffness
Es “secant” axial stiffness
fc
Figure 5. Stress-strain relation for axial material response of
historical masonry used in fibre modelling with tensile strength
neglected (after [28]).
Sådhanå (2018) 43:74 Page 7 of 20 74
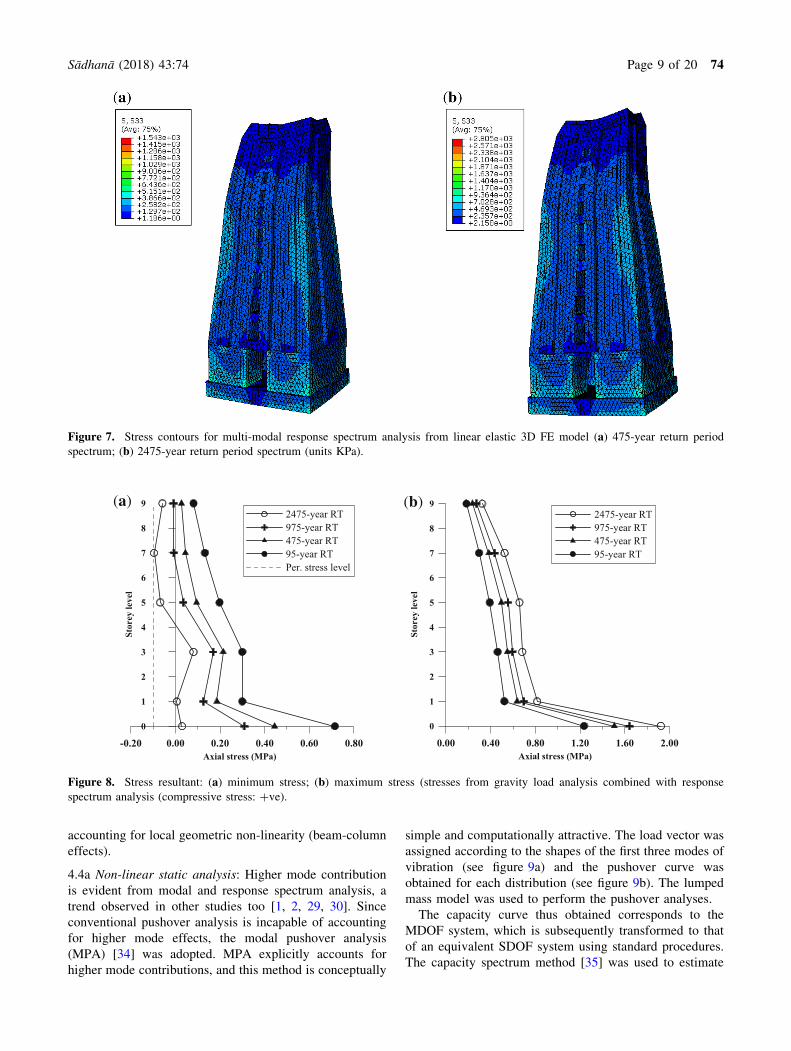
exceedance in 50 years or a 2475-year return period (very
rare event). The resulting stress distribution was calculated
by superimposing the stress resulting from gravity load
with that from the response spectrum analyses (see
figure 7).
Masonry structures are typically meant to resist com-
pressive forces, and tensile forces are to be avoided as far as
possible. The code of practice for structural use of unre-
inforced masonry [32], allows only 0.1 MPa of tensile
stress. Under service loading, development of any amount
of tensile stress is a matter of concern. The structure
develops significant tensile stress (& 0.1 MPa) for higher
return periods, but almost no tensile stress for the Design
Basis Earthquake (DBE). Maximum tensile stress is noticed
at higher levels (near 7th floor), and not at the base. This is
attributable to a significant reduction of cross section with
height with a correlated reduction of the beneficial axial
compression, and also to higher mode contributions. Max-
imum compressive stress is within the section capacity for
MCE too. The stress resultants are shown in figure 8.
4.4 Non-linear analysis
That non-linear dynamic analysis, commonly referred to as
non-linear time history analysis (NTHA) is the most
accurate method for studying seismic response of struc-
tures, is indisputable. However, the approach requires
reliable seismic input and is computationally demanding.
Therefore, it is not always the first choice and generally
adopted to validate the results of the other non-linear
approaches. An alternative approach is non-linear static
(pushover) analysis. In the present study, pushover analysis
was carried out so as to complement NTHA and also to
verify its applicability to masonry towers. The non-linear
analyses were performed using SeismoStruct v.4.0.9 [33],
which adopts fibre element modelling with a stiffness-based
formulation. The sectional stress-strain state of beam-col-
umn elements is obtained through the integration of the
non-linear uniaxial material response of the individual
fibres into which the section is subdivided, fully accounting
for the spread of inelasticity along the member length and
across the section depth. The member is also capable of
Table 6. Dynamic properties of the gopuram from 3D FE model.
Mode Frequency (Hz) Mode of vibration
Effective modal mass Cumulative modal mass
Ux Uy Uz Ux Uy Uz
1 1.30 B - XX 0.64 0.00 0.00 0.64 0.00 0.00
2 1.60 B - YY 0.00 0.57 0.00 0.64 0.57 0.00
3 3.40 Torsional 0.00 0.00 0.00 0.64 0.57 0.00
4 3.50 Vertical 0.00 0.00 0.98 0.64 0.57 0.98
5 3.80 B - XX 0.28 0.00 0.00 0.92 0.57 0.98
6 4.10 B - YY 0.00 0.33 0.00 0.92 0.90 0.98
Figure 6. Mode shapes and stress contours from gravity load analysis from 3D FE model of the 9-tiered gopuram.
74 Page 8 of 20 Sådhanå (2018) 43:74
accounting for local geometric non-linearity (beam-column
effects).
4.4a Non-linear static analysis: Higher mode contribution
is evident from modal and response spectrum analysis, a
trend observed in other studies too [1, 2, 29, 30]. Since
conventional pushover analysis is incapable of accounting
for higher mode effects, the modal pushover analysis
(MPA) [34] was adopted. MPA explicitly accounts for
higher mode contributions, and this method is conceptually
simple and computationally attractive. The load vector was
assigned according to the shapes of the first three modes of
vibration (see figure 9a) and the pushover curve was
obtained for each distribution (see figure 9b). The lumped
mass model was used to perform the pushover analyses.
The capacity curve thus obtained corresponds to the
MDOF system, which is subsequently transformed to that
of an equivalent SDOF system using standard procedures.
The capacity spectrum method [35] was used to estimate
Figure 7. Stress contours for multi-modal response spectrum analysis from linear elastic 3D FE model (a) 475-year return period
spectrum; (b) 2475-year return period spectrum (units KPa).
-0.20 0.00 0.20 0.40 0.60 0.80Axial stress (MPa)
0
1
2
3
4
5
6
7
8
9
Stor
ey le
vel
2475-year RT975-year RT475-year RT95-year RTPer. stress level
0.00 0.40 0.80 1.20 1.60 2.00Axial stress (MPa)
0
1
2
3
4
5
6
7
8
9
Stor
ey le
vel
2475-year RT975-year RT475-year RT95-year RT
(a) (b)
Figure 8. Stress resultant: (a) minimum stress; (b) maximum stress (stresses from gravity load analysis combined with response
spectrum analysis (compressive stress: ?ve).
Sådhanå (2018) 43:74 Page 9 of 20 74
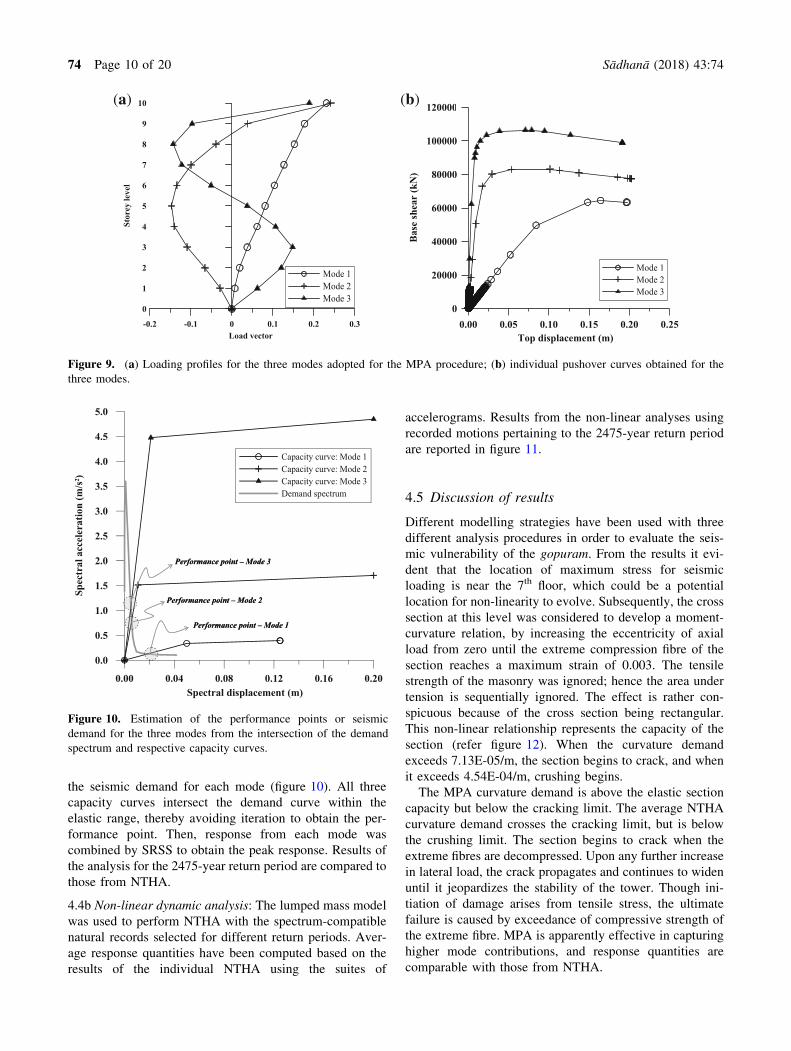
the seismic demand for each mode (figure 10). All three
capacity curves intersect the demand curve within the
elastic range, thereby avoiding iteration to obtain the per-
formance point. Then, response from each mode was
combined by SRSS to obtain the peak response. Results of
the analysis for the 2475-year return period are compared to
those from NTHA.
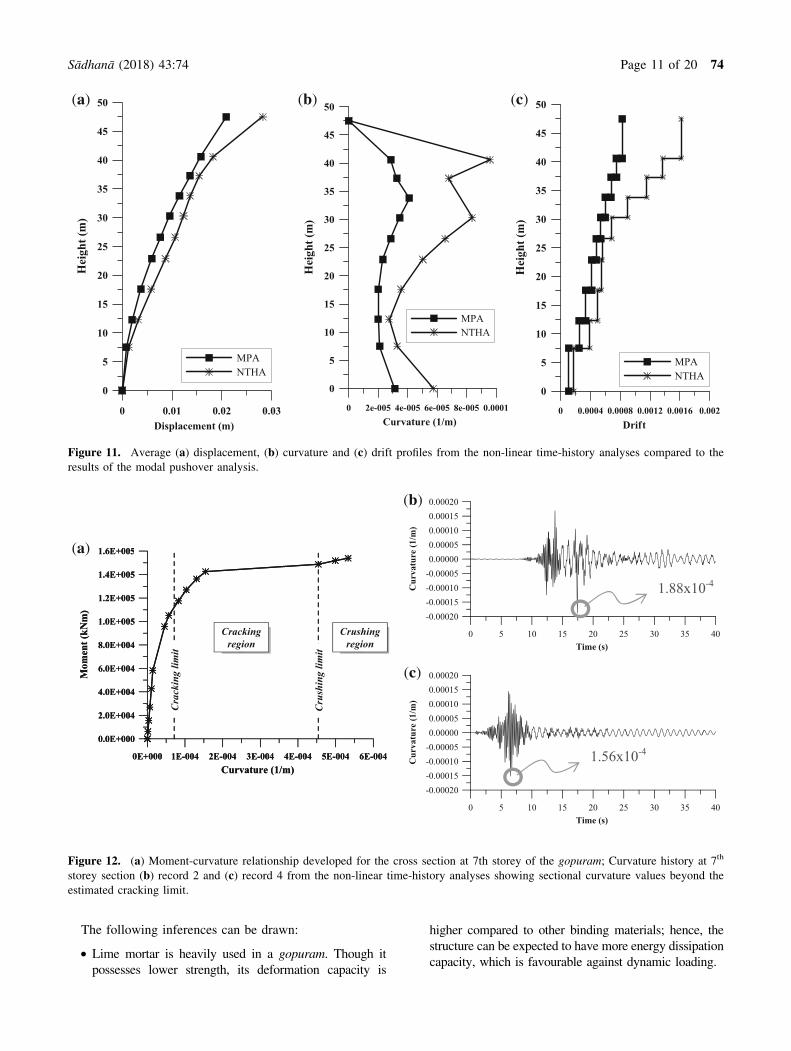
4.4b Non-linear dynamic analysis: The lumped mass model
was used to perform NTHA with the spectrum-compatible
natural records selected for different return periods. Aver-
age response quantities have been computed based on the
results of the individual NTHA using the suites of
accelerograms. Results from the non-linear analyses using
recorded motions pertaining to the 2475-year return period
are reported in figure 11.
4.5 Discussion of results
Different modelling strategies have been used with three
different analysis procedures in order to evaluate the seis-
mic vulnerability of the gopuram. From the results it evi-
dent that the location of maximum stress for seismic
loading is near the 7th floor, which could be a potential
location for non-linearity to evolve. Subsequently, the cross
section at this level was considered to develop a moment-
curvature relation, by increasing the eccentricity of axial
load from zero until the extreme compression fibre of the
section reaches a maximum strain of 0.003. The tensile
strength of the masonry was ignored; hence the area under
tension is sequentially ignored. The effect is rather con-
spicuous because of the cross section being rectangular.
This non-linear relationship represents the capacity of the
section (refer figure 12). When the curvature demand
exceeds 7.13E-05/m, the section begins to crack, and when
it exceeds 4.54E-04/m, crushing begins.
The MPA curvature demand is above the elastic section
capacity but below the cracking limit. The average NTHA
curvature demand crosses the cracking limit, but is below
the crushing limit. The section begins to crack when the
extreme fibres are decompressed. Upon any further increase
in lateral load, the crack propagates and continues to widen
until it jeopardizes the stability of the tower. Though ini-
tiation of damage arises from tensile stress, the ultimate
failure is caused by exceedance of compressive strength of
the extreme fibre. MPA is apparently effective in capturing
higher mode contributions, and response quantities are
comparable with those from NTHA.
0.00 0.05 0.10 0.15 0.20 0.25Top displacement (m)
0
20000
40000
60000
80000
100000
120000
Bas
e sh
ear
(kN
)
Mode 1Mode 2Mode 3
-0.2 -0.1 0 0.1 0.2 0.3Load vector
0
1
2
3
4
5
6
7
8
9
10
Stor
ey le
vel
Mode 1Mode 2Mode 3
(a) (b)
Figure 9. (a) Loading profiles for the three modes adopted for the MPA procedure; (b) individual pushover curves obtained for the
three modes.
0.00 0.04 0.08 0.12 0.16 0.20Spectral displacement (m)
0.0
0.5
1.0
1.5
2.0
2.5
3.0
3.5
4.0
4.5
5.0
Spec
tral
acc
eler
atio
n (m
/s2 )
Capacity curve: Mode 1Capacity curve: Mode 2Capacity curve: Mode 3Demand spectrum
Performance point – Mode 3
Performance point – Mode 2
Performance point – Mode 1
Performance point – Mode 3
Performance point – Mode 2
Performance point – Mode 1
Figure 10. Estimation of the performance points or seismic
demand for the three modes from the intersection of the demand
spectrum and respective capacity curves.
74 Page 10 of 20 Sådhanå (2018) 43:74
The following inferences can be drawn:
• Lime mortar is heavily used in a gopuram. Though it
possesses lower strength, its deformation capacity is
higher compared to other binding materials; hence, the
structure can be expected to have more energy dissipation
capacity, which is favourable against dynamic loading.
0 0.01 0.02 0.03Displacement (m)
0
5
10
15
20
25
30
35
40
45
50
Hei
ght (
m)
MPANTHA
0 2e-005 4e-005 6e-005 8e-005 0.0001Curvature (1/m)
0
5
10
15
20
25
30
35
40
45
50
Hei
ght (
m)
MPANTHA
0 0.0004 0.0008 0.0012 0.0016 0.002Drift
0
5
10
15
20
25
30
35
40
45
50
Hei
ght (
m)
MPANTHA
(a) (b) (c)
Figure 11. Average (a) displacement, (b) curvature and (c) drift profiles from the non-linear time-history analyses compared to the
results of the modal pushover analysis.
0E+000 1E-004 2E-004 3E-004 4E-004 5E-004 6E-004Curvature (1/m)
0.0E+000
2.0E+004
4.0E+004
6.0E+004
8.0E+004
1.0E+005
1.2E+005
1.4E+005
1.6E+005
Mom
ent (
kNm
)
Crac
king
lim
it
Cru
shin
g lim
it
Cracking region
Cracking region
Crushing region
Crushing region
0E+000 1E-004 2E-004 3E-004 4E-004 5E-004 6E-004Curvature (1/m)
0.0E+000
2.0E+004
4.0E+004
6.0E+004
8.0E+004
1.0E+005
1.2E+005
1.4E+005
1.6E+005
Mom
ent (
kNm
)
Crac
king
lim
it
Cru
shin
g lim
it
Cracking region
Cracking region
Crushing region
Crushing region
0 5 10 15 20 25 30 35 40Time (s)
-0.00020-0.00015-0.00010-0.000050.000000.000050.000100.000150.00020
Cur
vatu
re (1
/m)
0 5 10 15 20 25 30 35 40Time (s)
-0.00020-0.00015-0.00010-0.000050.000000.000050.000100.000150.00020
Cur
vatu
re (1
/m)
1.88x10⁻⁴
1.56x10⁻⁴
(a)
(b)
(c)
Figure 12. (a) Moment-curvature relationship developed for the cross section at 7th storey of the gopuram; Curvature history at 7th
storey section (b) record 2 and (c) record 4 from the non-linear time-history analyses showing sectional curvature values beyond the
estimated cracking limit.
Sådhanå (2018) 43:74 Page 11 of 20 74
• The failure of the structure evolves from material
failure, and instability should not be an issue because
of its favourable configuration (pyramidal). The natural
frequency (1.30-1.60 Hz) is well-separated from the
fundamental soil frequency (3.48-3.79 Hz), indicating
no possibility of resonance.
• Response spectrum analyses suggest that tensile
stresses can be expected in the upper parts of the
gopuram for 975 and 2475-year return period ground
motion (very rare events). in the latter, tensile stress
beyond the conventional limit of 0.1 MPa was
observed at the 7th storey level.
• In agreement with linear dynamic analysis, both static
(MPA) and dynamic non-linear analyses (NTHA)
indicate non-linear deformations at the 7th storey.
Hence, it is evident that the upper levels of the
structure are more vulnerable than the base, where a
concentration of curvature is expected (see fig-
ure 12(b)–(c). This is attributable to an unfavourable
combination of reduced cross-sectional area, low axial
compressive stress and higher mode effects.
• MPA approach captures the non-linear behaviour of
the tower efficiently in comparison to conventional
pushover analyses. However, due to low level of
inelastic demand in the current case, there is insuffi-
cient ground to conceive MPA as an alternative to
NTHA, when seismic input is unavailable in an
appropriate form (i.e., natural records).
• The survival of such structures in the region over the
centuries can be attributed to the low historical
seismicity (relatively low magnitude earthquakes at
long distances) from the archaeological site.
5. Analysis of the mandapam
5.1 Ambient vibration tests
Ambient vibration tests provide a useful check on the
natural frequencies of the structure as predicted by the FE
model. The ambient vibrations of the 4- and 16-pillared
short mandapams at Ekambareswar temple were recorded
using a digital seismograph. A Lennarz 3D/5s geophone
was used as a transducer, while data acquisition was carried
out with an A/D PCMCIA National Instruments (16-bit
resolution, maximum sampling rate 200 kHz). The sensi-
tivity of the 3D/5s is 400 V7 (m/s) in the frequency band
0.2-100 Hz. Data acquisition was using single receiver
points, recording few minutes of ambient vibrations,
avoiding as much as possible, any movement or vibration
close to the receiver. The data was processed by computing
amplitude spectra, and the ratio between the horizontal and
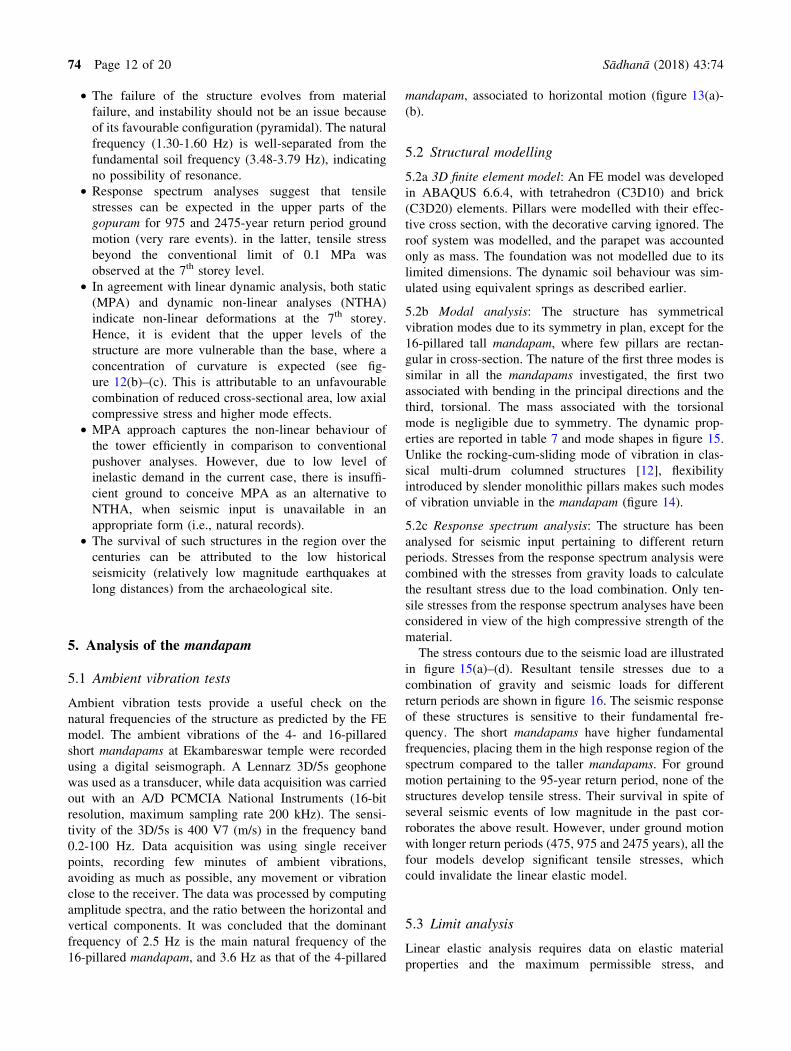
vertical components. It was concluded that the dominant
frequency of 2.5 Hz is the main natural frequency of the
16-pillared mandapam, and 3.6 Hz as that of the 4-pillared
mandapam, associated to horizontal motion (figure 13(a)-
(b).
5.2 Structural modelling
5.2a 3D finite element model: An FE model was developed
in ABAQUS 6.6.4, with tetrahedron (C3D10) and brick
(C3D20) elements. Pillars were modelled with their effec-
tive cross section, with the decorative carving ignored. The
roof system was modelled, and the parapet was accounted
only as mass. The foundation was not modelled due to its
limited dimensions. The dynamic soil behaviour was sim-
ulated using equivalent springs as described earlier.
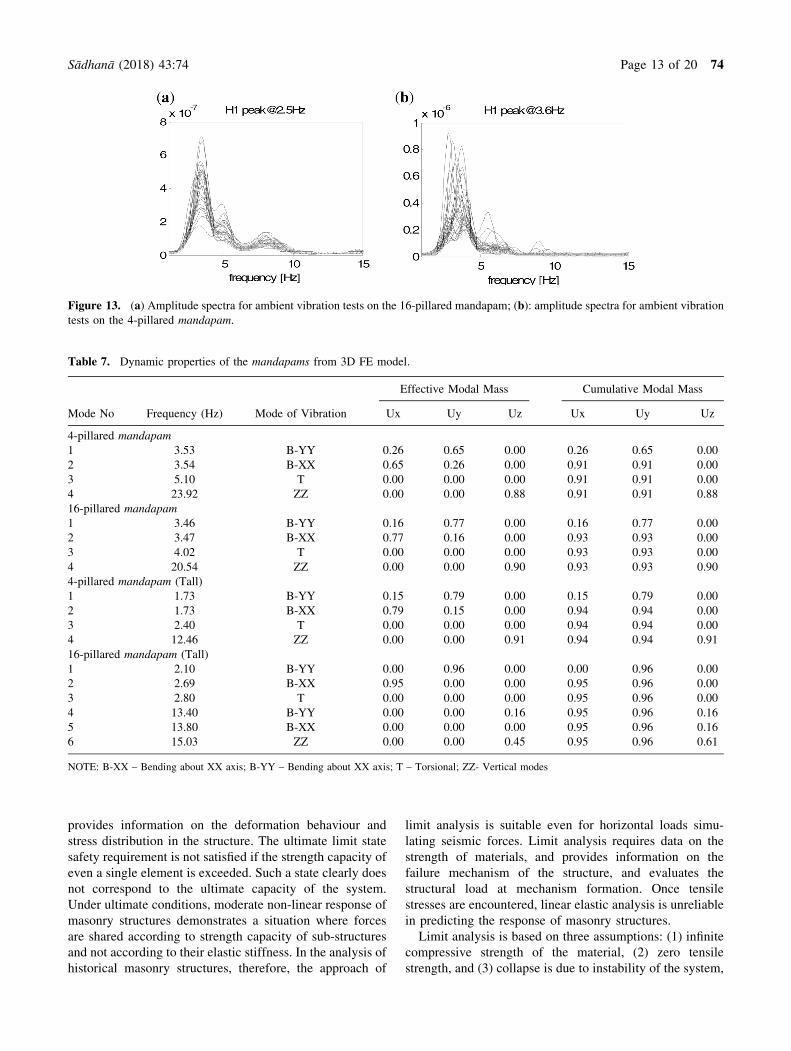
5.2b Modal analysis: The structure has symmetrical
vibration modes due to its symmetry in plan, except for the
16-pillared tall mandapam, where few pillars are rectan-
gular in cross-section. The nature of the first three modes is
similar in all the mandapams investigated, the first two
associated with bending in the principal directions and the
third, torsional. The mass associated with the torsional
mode is negligible due to symmetry. The dynamic prop-
erties are reported in table 7 and mode shapes in figure 15.
Unlike the rocking-cum-sliding mode of vibration in clas-
sical multi-drum columned structures [12], flexibility
introduced by slender monolithic pillars makes such modes
of vibration unviable in the mandapam (figure 14).
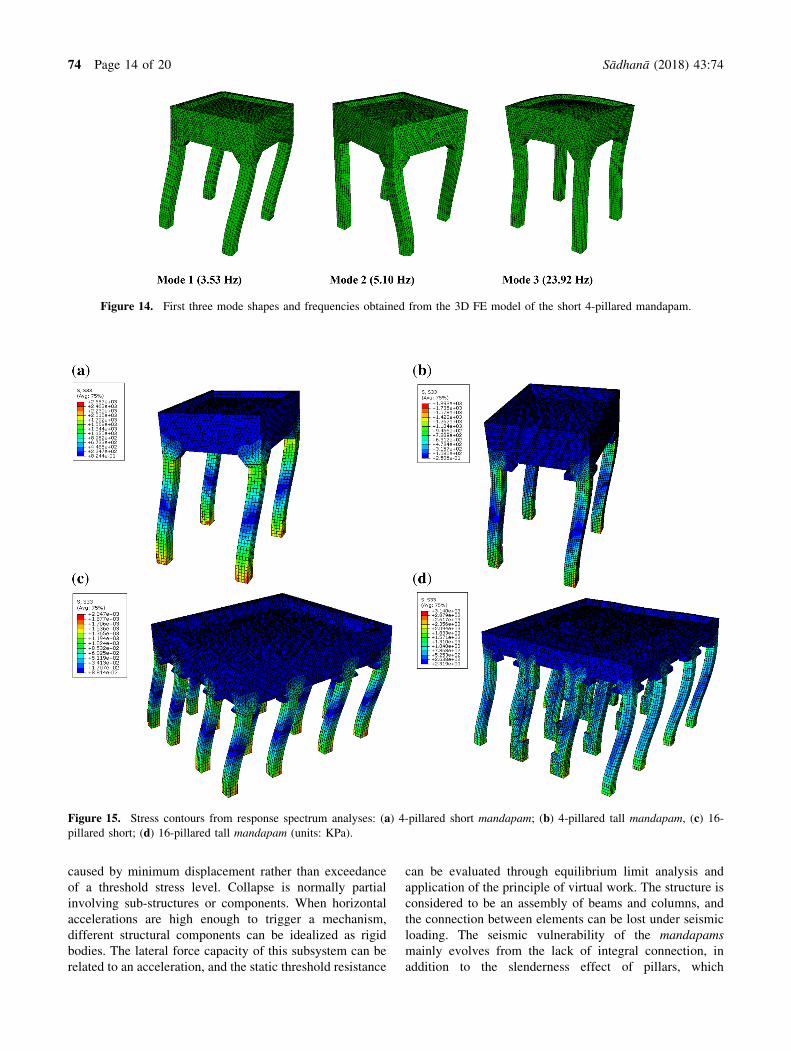
5.2c Response spectrum analysis: The structure has been
analysed for seismic input pertaining to different return
periods. Stresses from the response spectrum analysis were
combined with the stresses from gravity loads to calculate
the resultant stress due to the load combination. Only ten-
sile stresses from the response spectrum analyses have been
considered in view of the high compressive strength of the
material.
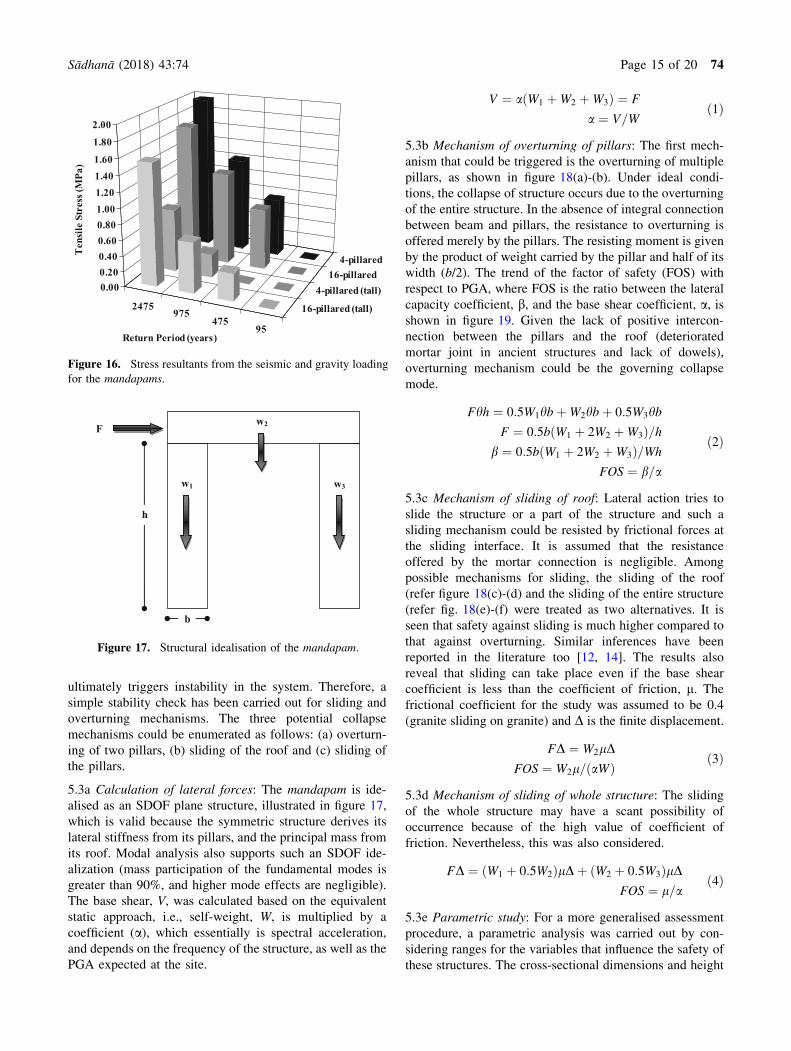
The stress contours due to the seismic load are illustrated
in figure 15(a)–(d). Resultant tensile stresses due to a
combination of gravity and seismic loads for different
return periods are shown in figure 16. The seismic response
of these structures is sensitive to their fundamental fre-
quency. The short mandapams have higher fundamental
frequencies, placing them in the high response region of the
spectrum compared to the taller mandapams. For ground
motion pertaining to the 95-year return period, none of the
structures develop tensile stress. Their survival in spite of
several seismic events of low magnitude in the past cor-
roborates the above result. However, under ground motion
with longer return periods (475, 975 and 2475 years), all the
four models develop significant tensile stresses, which
could invalidate the linear elastic model.
5.3 Limit analysis
Linear elastic analysis requires data on elastic material
properties and the maximum permissible stress, and
74 Page 12 of 20 Sådhanå (2018) 43:74
provides information on the deformation behaviour and
stress distribution in the structure. The ultimate limit state
safety requirement is not satisfied if the strength capacity of
even a single element is exceeded. Such a state clearly does
not correspond to the ultimate capacity of the system.
Under ultimate conditions, moderate non-linear response of
masonry structures demonstrates a situation where forces
are shared according to strength capacity of sub-structures
and not according to their elastic stiffness. In the analysis of
historical masonry structures, therefore, the approach of
limit analysis is suitable even for horizontal loads simu-
lating seismic forces. Limit analysis requires data on the
strength of materials, and provides information on the
failure mechanism of the structure, and evaluates the
structural load at mechanism formation. Once tensile
stresses are encountered, linear elastic analysis is unreliable
in predicting the response of masonry structures.
Limit analysis is based on three assumptions: (1) infinite
compressive strength of the material, (2) zero tensile
strength, and (3) collapse is due to instability of the system,
Figure 13. (a) Amplitude spectra for ambient vibration tests on the 16-pillared mandapam; (b): amplitude spectra for ambient vibration
tests on the 4-pillared mandapam.
Table 7. Dynamic properties of the mandapams from 3D FE model.
Mode No Frequency (Hz) Mode of Vibration
Effective Modal Mass Cumulative Modal Mass
Ux Uy Uz Ux Uy Uz
4-pillared mandapam
1 3.53 B-YY 0.26 0.65 0.00 0.26 0.65 0.00
2 3.54 B-XX 0.65 0.26 0.00 0.91 0.91 0.00
3 5.10 T 0.00 0.00 0.00 0.91 0.91 0.00
4 23.92 ZZ 0.00 0.00 0.88 0.91 0.91 0.88
16-pillared mandapam
1 3.46 B-YY 0.16 0.77 0.00 0.16 0.77 0.00
2 3.47 B-XX 0.77 0.16 0.00 0.93 0.93 0.00
3 4.02 T 0.00 0.00 0.00 0.93 0.93 0.00
4 20.54 ZZ 0.00 0.00 0.90 0.93 0.93 0.90
4-pillared mandapam (Tall)
1 1.73 B-YY 0.15 0.79 0.00 0.15 0.79 0.00
2 1.73 B-XX 0.79 0.15 0.00 0.94 0.94 0.00
3 2.40 T 0.00 0.00 0.00 0.94 0.94 0.00
4 12.46 ZZ 0.00 0.00 0.91 0.94 0.94 0.91
16-pillared mandapam (Tall)
1 2.10 B-YY 0.00 0.96 0.00 0.00 0.96 0.00
2 2.69 B-XX 0.95 0.00 0.00 0.95 0.96 0.00
3 2.80 T 0.00 0.00 0.00 0.95 0.96 0.00
4 13.40 B-YY 0.00 0.00 0.16 0.95 0.96 0.16
5 13.80 B-XX 0.00 0.00 0.00 0.95 0.96 0.16
6 15.03 ZZ 0.00 0.00 0.45 0.95 0.96 0.61
NOTE: B-XX – Bending about XX axis; B-YY – Bending about XX axis; T – Torsional; ZZ- Vertical modes
Sådhanå (2018) 43:74 Page 13 of 20 74
caused by minimum displacement rather than exceedance
of a threshold stress level. Collapse is normally partial
involving sub-structures or components. When horizontal
accelerations are high enough to trigger a mechanism,
different structural components can be idealized as rigid
bodies. The lateral force capacity of this subsystem can be
related to an acceleration, and the static threshold resistance
can be evaluated through equilibrium limit analysis and
application of the principle of virtual work. The structure is
considered to be an assembly of beams and columns, and
the connection between elements can be lost under seismic
loading. The seismic vulnerability of the mandapams
mainly evolves from the lack of integral connection, in
addition to the slenderness effect of pillars, which
Figure 14. First three mode shapes and frequencies obtained from the 3D FE model of the short 4-pillared mandapam.
Figure 15. Stress contours from response spectrum analyses: (a) 4-pillared short mandapam; (b) 4-pillared tall mandapam, (c) 16-pillared short; (d) 16-pillared tall mandapam (units: KPa).
74 Page 14 of 20 Sådhanå (2018) 43:74
ultimately triggers instability in the system. Therefore, a
simple stability check has been carried out for sliding and
overturning mechanisms. The three potential collapse
mechanisms could be enumerated as follows: (a) overturn-
ing of two pillars, (b) sliding of the roof and (c) sliding of
the pillars.
5.3a Calculation of lateral forces: The mandapam is ide-
alised as an SDOF plane structure, illustrated in figure 17,
which is valid because the symmetric structure derives its
lateral stiffness from its pillars, and the principal mass from
its roof. Modal analysis also supports such an SDOF ide-
alization (mass participation of the fundamental modes is
greater than 90%, and higher mode effects are negligible).
The base shear, V, was calculated based on the equivalent
static approach, i.e., self-weight, W, is multiplied by a
coefficient (a), which essentially is spectral acceleration,
and depends on the frequency of the structure, as well as the
PGA expected at the site.
V ¼ a W1 þW2 þW3ð Þ ¼ F
a ¼ V=Wð1Þ
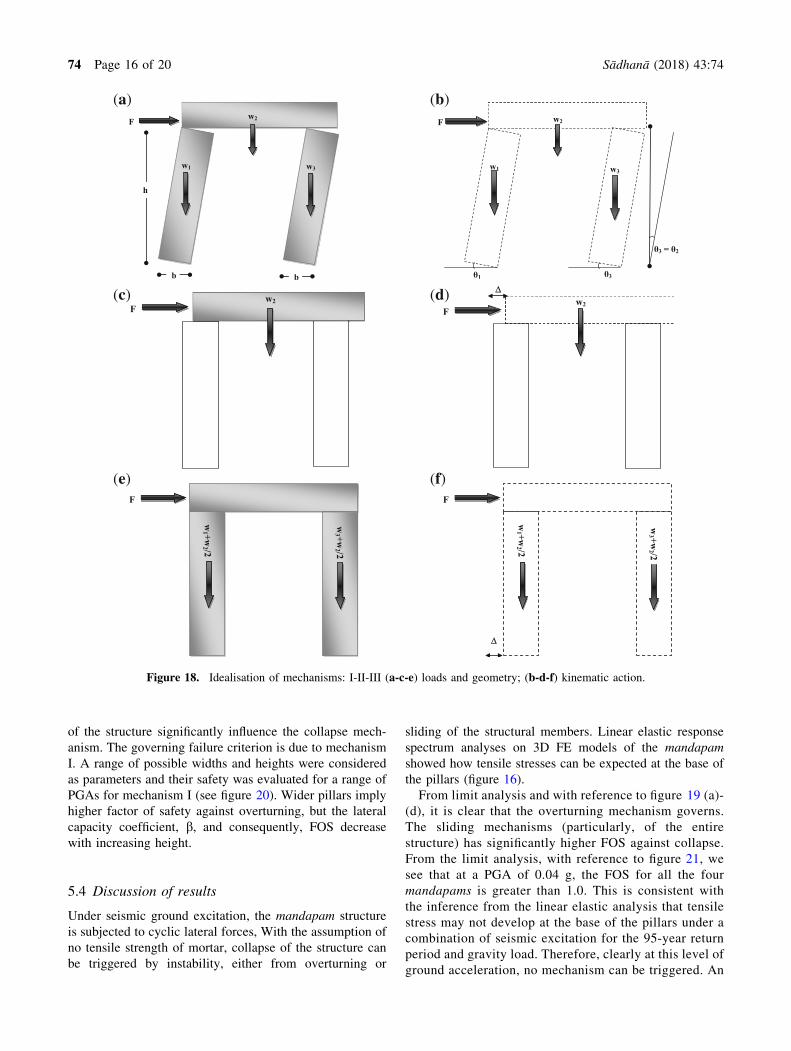
5.3b Mechanism of overturning of pillars: The first mech-
anism that could be triggered is the overturning of multiple
pillars, as shown in figure 18(a)-(b). Under ideal condi-
tions, the collapse of structure occurs due to the overturning
of the entire structure. In the absence of integral connection
between beam and pillars, the resistance to overturning is
offered merely by the pillars. The resisting moment is given
by the product of weight carried by the pillar and half of its
width (b/2). The trend of the factor of safety (FOS) with
respect to PGA, where FOS is the ratio between the lateral
capacity coefficient, b, and the base shear coefficient, a, isshown in figure 19. Given the lack of positive intercon-
nection between the pillars and the roof (deteriorated
mortar joint in ancient structures and lack of dowels),
overturning mechanism could be the governing collapse
mode.
Fhh ¼ 0:5W1hbþW2hbþ 0:5W3hb
F ¼ 0:5b W1 þ 2W2 þW3ð Þ=hb ¼ 0:5b W1 þ 2W2 þW3ð Þ=Wh
FOS ¼ b=a
ð2Þ
5.3c Mechanism of sliding of roof: Lateral action tries to
slide the structure or a part of the structure and such a
sliding mechanism could be resisted by frictional forces at
the sliding interface. It is assumed that the resistance
offered by the mortar connection is negligible. Among
possible mechanisms for sliding, the sliding of the roof
(refer figure 18(c)-(d) and the sliding of the entire structure
(refer fig. 18(e)-(f) were treated as two alternatives. It is
seen that safety against sliding is much higher compared to
that against overturning. Similar inferences have been
reported in the literature too [12, 14]. The results also
reveal that sliding can take place even if the base shear
coefficient is less than the coefficient of friction, l. Thefrictional coefficient for the study was assumed to be 0.4
(granite sliding on granite) and D is the finite displacement.
FD ¼ W2lD
FOS ¼ W2l= aWð Þð3Þ
5.3d Mechanism of sliding of whole structure: The sliding
of the whole structure may have a scant possibility of
occurrence because of the high value of coefficient of
friction. Nevertheless, this was also considered.
FD ¼ W1 þ 0:5W2ð ÞlDþ W2 þ 0:5W3ð ÞlDFOS ¼ l=a
ð4Þ
5.3e Parametric study: For a more generalised assessment
procedure, a parametric analysis was carried out by con-
sidering ranges for the variables that influence the safety of
these structures. The cross-sectional dimensions and height
2475975
47595
16-pillared (tall)
4-pillared (tall)16-pillared
4-pillared
0.000.200.400.600.801.001.201.401.60
1.80
2.00
Ten
sile
Str
ess (
MPa
)
Return Period (years)
Figure 16. Stress resultants from the seismic and gravity loading
for the mandapams.
w1 w3
h
b
w2F
Figure 17. Structural idealisation of the mandapam.
Sådhanå (2018) 43:74 Page 15 of 20 74
of the structure significantly influence the collapse mech-
anism. The governing failure criterion is due to mechanism
I. A range of possible widths and heights were considered
as parameters and their safety was evaluated for a range of
PGAs for mechanism I (see figure 20). Wider pillars imply
higher factor of safety against overturning, but the lateral
capacity coefficient, b, and consequently, FOS decrease
with increasing height.
5.4 Discussion of results
Under seismic ground excitation, the mandapam structure
is subjected to cyclic lateral forces, With the assumption of
no tensile strength of mortar, collapse of the structure can
be triggered by instability, either from overturning or
sliding of the structural members. Linear elastic response
spectrum analyses on 3D FE models of the mandapam
showed how tensile stresses can be expected at the base of
the pillars (figure 16).
From limit analysis and with reference to figure 19 (a)-
(d), it is clear that the overturning mechanism governs.
The sliding mechanisms (particularly, of the entire
structure) has significantly higher FOS against collapse.
From the limit analysis, with reference to figure 21, we
see that at a PGA of 0.04 g, the FOS for all the four
mandapams is greater than 1.0. This is consistent with
the inference from the linear elastic analysis that tensile
stress may not develop at the base of the pillars under a
combination of seismic excitation for the 95-year return
period and gravity load. Therefore, clearly at this level of
ground acceleration, no mechanism can be triggered. An
w1
w2F
w3
b
h
b
w1 w3
w2F
θ3θ1
θ3 = θ2
w2F
w2F
Δ
F
w1 +w
2 /2
w3 +w
2 /2
F
Δ
w1 +w
2 /2
w3 +w
2 /2
(a) (b)
(c) (d)
(e) (f)
Figure 18. Idealisation of mechanisms: I-II-III (a-c-e) loads and geometry; (b-d-f) kinematic action.
74 Page 16 of 20 Sådhanå (2018) 43:74

0 0.04 0.08 0.12 0.16 0.2 0.24PGA (g)
0
1
2
3
4
5
6
7
F.O
.S.
Mechanism - 1Mechanism - 2Mechanism - 3
0 0.04 0.08 0.12 0.16 0.2 0.24PGA (g)
0
1
2
3
4
5
6
7
F.O
.S.
Mechanism - 1Mechanism - 2Mechanism - 3
0 0.04 0.08 0.12 0.16 0.2 0.24PGA (g)
0
1
2
3
4
5
6
7
F.O
.S.
Mechanism - 1Mechanism - 2Mechanism - 3
0 0.04 0.08 0.12 0.16 0.2 0.24PGA (g)
0
1
2
3
4
5
6
7
F.O
.S.
Mechanism - 1Mechanism - 2Mechanism - 3
(b)(a)
(d)(c)
Figure 19. Check for stability: (a) 4-pillared short mandapam; (b) 16-pillared short mandapam; (c) 4-pillared tall mandapam and
(d) 16-pillared tall mandapam.
0 0.04 0.08 0.12 0.16 0.2 0.24PGA (g)
0.00
0.25
0.50
0.75
1.00
1.25
1.50
1.75
2.00
F.O
.S.
b = 0.30mb = 0.35mb = 0.40mb = 0.45m
0 0.04 0.08 0.12 0.16 0.2 0.24PGA (g)
0.00
0.25
0.50
0.75
1.00
1.25
1.50
1.75
2.00
F.O
.S.
b = 0.40mb = 0.45mb = 0.50mb = 0.55m
0 0.04 0.08 0.12 0.16 0.2 0.24PGA (g)
0.00
0.25
0.50
0.75
1.00
1.25
1.50
1.75
2.00
F.O
.S.
b = 0.50mb = 0.55mb = 0.60mb = 0.65m
0 0.04 0.08 0.12 0.16 0.2 0.24PGA (g)
0.00
0.25
0.50
0.75
1.00
1.25
1.50
1.75
2.00
F.O
.S.
b = 0.60mb = 0.65mb = 0.70mb = 0.75m
(a) (b)
(c) (d)
Figure 20. Parametric study on influence of pillar height and cross-sectional width on safety factors estimated for the overturning
mechanism: (a) pillar height 3 m; (b) pillar height 4 m; (c) pillar height 5 m and (d) pillar height 6 m.
Sådhanå (2018) 43:74 Page 17 of 20 74

FOS slightly less than 1.0 for the overturning mechanism
is seen for a PGA of 0.08 g for the 4-pillared tall man-
dapam. According to the linear elastic analysis, tensile
stress should not be expected at the base of the pillars
even for this level of PGA. The decompressed state of the
extreme fibre in a cross section of a structural member
could be the inception of a mechanism within a rigid
body idealisation. Collapse is ultimately due to insta-
bility. However, beyond the initiation of cracking, linear
elastic analysis fails to adequately represent the struc-
tural behaviour, especially in historical masonry.
The inferences from the present investigation on man-
dapam are in line with the conclusions of similar studies in
the literature [12, 14, 15, 36]. Some of the salient inferences
can be enumerated as follows.
• The current study, like others in the literature e.g., [15],
suggests that FE approach for modelling the seismic
response of dry historical masonry structures may not
be appropriate, and results from FE approach can be
misleading unless they are properly interpreted. This
could be an effective tool if FE models are validated
with appropriate field testing for dynamic
identification.
• The structure could be sensitive to ground motion
parameters (especially frequency content, as seen in
the case of the short 4-pillared mandapam). Psycharis
[36] point out that the period of the ground excitation
will have a significant effect on the threshold accel-
eration and mode of collapse and that high frequency
motion is much more dangerous for dry masonry
columned structures.
• The survival of similar structures in the region over
several centuries could be attributed to the relatively
low seismicity of the region, as inferred in the case of
the gopuram. These structures seem to be capable of
resisting low return period ground motion (e.g., no
tensile stress in 95-year return period ground motion).
Numerical simulations on column-architrave structures
[11] have shown that significant permanent deforma-
tion occurs only for ground motion with PGA * 0.6 g.
However, the frequency of the excitation is a very
important indicator of the vulnerability.
• Shorter mandapam can be more vulnerable than taller
ones as they are stiffer, with their frequencies falling in
the plateau of the response spectrum. The supporting
pillars are not very wide and this increases their
vulnerability as evinced from the parametric study
using limit analysis approach.
• The collapse of the structure is due to instability of the
system. The identified collapse mechanisms are over-
turning and sliding mechanisms, and limit analysis
reveals that the former always governs. This is
attributable to the fact that sliding resistance is a
function of the coefficient of friction (l for granite is
around 0.4-0.6), whereas overturning resistance
depends on the geometry of the structure. Lack of
positive connection (dowels) and presence of weak
mortar joints between structural members, and the
slenderness of pillars make the structure vulnerable to
lateral loads.
6. Conclusions
Structural analysis of historical constructions is carried out
for a better understanding of structural behaviour and/or to
be able to arrive at residual capacity while carrying out
structural assessment and to arrive at a strengthening
strategy, if warranted. Since the subject of conservation is
predominantly steered by archaeologists and architects,
seldom a quantitative approach is adopted. Engineers also
are reluctant in analysing such structures due to the inap-
plicability of modern structural standards to these struc-
tures. In this context, the research presented in this article
demonstrates the possibility of a quantitative approach even
for historical constructions. The adopted methods have to
be chosen, essentially with recourse to first principles, and
the outcome undoubtedly requires validation for reliable
application. Experimental validation, expect for the use of
measured fundamental frequency of the mandapam to
adopt the right type of model, is beyond the scope of the
current research. When it comes to modelling massive
constructions in historical masonry, it has been observed
that structural geometry, including boundary conditions
overrides material strength in being able to predict the
structural behaviour, which is particularly true for historical
masonry [37].
An initial attempt at understanding the seismic behaviour
of the gopuram and the mandapam, monumental structures
representative of Dravidian temple architecture is pre-
sented. Different analysis approaches lead to comparable
inferences on the seismic response of the gopuram, despite
0 0.04 0.08 0.12 0.16 0.2 0.24PGA (g)
0.00
0.25
0.50
0.75
1.00
1.25
1.50
1.75
2.00
F.O
.S.
4-pillared short16-pillared short4-pillared tall16-pillared tall
95 y
rs.
475
yrs.
975
yrs.
2475
yrs
.
Figure 21. Comparison of F.O.S. trends from overturning mech-
anism for the 4 mandapams to PGA corresponding to return
periods (95. 475, 975 and 2475 years).
74 Page 18 of 20 Sådhanå (2018) 43:74
significant idealisation. Non-linear deformations due to
seismic loading can be expected at the 7th storey level
under ground motion corresponding to a 2475-year return
period (PGA 0.14 g), whereas response should be essen-
tially elastic under the 475-year return period earthquake
(PGA 0.08 g). Collapse of such a structure would primarily
be due to material failure; i.e., increasing load eccentricity
would lead to progressive cracking of the section due to
tensile stresses, and consequent compression failure of
extreme section fibres.
With regard to the seismic assessment of the mandapam,
the study reveals that the vulnerability of the mandapam is
mainly due to the lack of proper interconnection between
structural members. Recourse to limit analysis to model the
mandapam was made owing to the unrealistic behaviour
resulting by the deformable continuum in the FE models.
Collapse due to overturning mechanisms will govern its
response under seismic loading. The short 4-pillared man-
dapam is apparently the most vulnerable. The accentuated
response under seismic excitation is attributed to its high
fundamental frequency.
The role of seismic retrofitting of a mandapam is to
ensure interconnection between structural members,
thereby making the structure safe against earthquakes. As
far as retrofitting of heritage structures are concerned, the
intervention has to be minimal, fully reversible and it
should not adversely affect aesthetics. Integral action can
be ensured by inserting stainless steel or titanium dowels
connecting the beams, corbels and pillars. However,
some important remarks made by others researches
[11, 12] regarding the applicability of this procedure to
multi-drum temples in Greece are noteworthy: (a) this
approach does not improve the response significantly,
and (b) inserting the rods rules out the possibility of
sliding which play a major role in increasing the damping
(due to friction). Nevertheless, the insertion of a stiff
element between components of the mandapam might
play a better role compared to multi-drum classical col-
umns. This approach has to be adequately verified with
numerical and laboratory studies before any recommen-
dations can be given.
Acknowledgements
Seismic vulnerability assessment of monumental structures
at the archaeological site of Ekambareswar temple,
Kancheepuram was carried out within the framework of a
3-year research project funded by the Department of
Science and Technology, Government of India and Min-
istry of Foreign Affairs, Italy, entitled ‘Seismic Risk
Assessment of Historical Centres in South India’ in
collaboration with Indian Institute of Technology Madras
and University of Pavia, Italy. The role of the Governmen-
tal Institutions is greatly appreciated.
References
[1] Riva P, Perotti F, Guidoboni E and Boschi E 1998 Seismic
analysis of the Asinelli tower and earthquakes in Bologna.
Soil Dyn. Earthq. Eng. 17: 525550
[2] Menon A, Lai C, Macchi G and Pavese A 2006 Non-linear
dynamic analyses for seismic assessment of ancient masonry
towers. In: Proceedings of V International Conference on
Structural Analysis of Historical Constructions (ed. Lour-
enco, P.B. et al), New Delhi, India
[3] Jaishi B, Ren W-X, Zong Z-H and Maskey P N 2003
Dynamic and seismic performance of old multi-tiered tem-
ples in Nepal. Eng. Struct. 25(14): 1827–1839
[4] Pena F, Lourenco P B and Mendes N 2008 Seismic assess-
ment of the Qutb minar in Delhi, India. In: Proceedings of
14th World Conference on Earthquake Engineering, October
12-17, 2008, Beijing, China
[5] Sezen H, Acarb R, Dogangunb A and Livaoglu R 2008
Dynamic analysis and seismic performance of reinforced
concrete minarets. Eng. Struct. 30(8): 2253–2264
[6] Dogangun A, Acar R, Sezen H, Livaoglu R 2008 Investi-
gation of dynamic response of masonry minaret structures.
Bull. Earthq. Eng. 6(3): 505–517
[7] Clemente P, Saitta F, Buffarini G, Platania L 2015 Stability
and seismic analyses of leaning towers: The case of the
minaret in Jam. Struct. Des. Tall Spec. Build. 24(1): 40–58
[8] Mahalingam T V 1970 XII. Engineering - The south Indian
temple - Medium of construction. Indian. J. History of Sci-
ence, 5(2): 309–314
[9] Grover S 1980 The architecture of India: Buddhist and
Hindu. New Delhi: Vikas Publishing House Pvt. Ltd.
[10] D’Ayala D and Kansal A 2004 An analysis of the seismic
vulnerability of the architectural heritage of Bhuj, Gujarat,
India. In: Proceedings of Structural Analysis of Historical
Constructions, Modena C, Lourenco P B and Roca P (eds.),
pp. 1069–1078
[11] Psycharis I N, Lemos J V, Papastamatiou D Y, Zambas C
and Papantonopoulos C 2003 Numerical study of the seismic
behaviour of a part of the Parthenon Pronaos. Earthq. Eng.
Struct. Dyn. 32(13): 2063–2084
[12] Konstantinidis D and Makris N 2005 Seismic response
analysis of multi-drum classical columns. Earthq. Eng.
Struct. Dyn. 34(10): 1243–1270
[13] Ambraseys N and Psycharis I N 2011 Earthquake stability of
columns and statues. J. Earthq. Eng. 15(5): 685–710
[14] Giordano A, De Luca A, Mele E and Romano A 2007 A
simple formula for predicting the horizontal capacity of
masonry portal frames. Eng. Struct. 29(9): 2109–2123
[15] Maeda T, Sugiura Y and Hirai T 2008 FEM modeling of the
towers in Bayon temple in Cambodia based on micro-tremor
measurements. Adv. Eng. Softw. 39(4): 346–355
[16] Lourenco P B and Roque A 2006 Simplified indexes for the
seismic vulnerability of ancient masonry buildings. Constr.
Build. Mater. 20(4): 200–208
[17] IS-1893-Part 1, 2002 Indian standard criteria for earthquake
resistant design of structures, 5th Revision. New Delhi:
Bureau of Indian Standards
[18] Lai C G, Menon A, Corigliano M, Ornthamarrath T, Sanchez
H L and Dodagoudar G R 2009 Probabilistic seismic hazard
assessment and stochastic site response analysis at the
Sådhanå (2018) 43:74 Page 19 of 20 74
archaeological site of Kancheepuram in Southern India. In:
Research Report EUCENTRE 2009/01, IUSS Press, Pavia,
p. 250
[19] Corigliano M, Lai C G, Menon A, Ornthammarath T 2012
Seismic input at the archaeological site of Kancheepuram in
Southern India. Nat. Hazards 63(2): 845–866
[20] Dall’Ara A, Lai C G and Strobbia C 2006 Selection of
spectrum-compatible real accelerograms for seismic
response analyses of soil deposits. In: Proceedings of 1st
European Conference on Earthquake Engineering and
Seismology, Geneva, Switzerland
[21] CEN-EN 1998-1, 2005 Eurocode-8: Design of structures for
earthquake resistance: Part 1: General rules for seismic
action and rules for buildings. European Committee for
Standardization, Brussels
[22] Gazetas G 1991 Ch. 15: Foundation vibrations. In: Foun-
dation Engineering Handbook, Fang HY (ed.). Van New
York: Nostrand Reinhold, pp. 553–593
[23] Kaushik H B, Rai D C and Jain S K 2007 Stress-strain
characteristics of clay brick masonry under uniaxial com-
pression. J. Mater. Civ. Eng. ASCE 19(9): 728–739
[24] Gumaste K S, Nanjunda Rao K S, Venkatarama Reddy B V
and Jagadish K S 2007 Strength and elasticity of brick
masonry prisms and wallettes under compression. Mater.
Struct. 40: 241–253
[25] Sarangapani G, Venkatarama Reddy B V and Jagadish K S
2002 Structural characteristics of bricks, mortar and
masonry. J. Struct. Eng. (India) 29(2): 101–107
[26] Pande GN, Liang J X andMiddleton J 1989 Equivalent elastic
moduli for brick masonry. Comput. Geotechn. 8: 243–265
[27] Casolo S 2001 Significant ground motion parameters for
evaluation of the seismic performance of slender masonry
towers. J. Earthq. Eng. 5(2): 187–204
[28] Casolo S and Pena F 2007 Rigid element model for in-
plane dynamics of masonry walls considering hysteretic
behaviour and damage. Earthq. Eng. Struct. Dyn. 21(2):
193–211
[29] Jaishi B, Ren W-X, Zong Z-H and Maskey P N 2003
Dynamic and seismic performance of old multi-tiered tem-
ples in Nepal. Eng. Struct. 25(14):1827–1839
[30] Pena F, Lourenco PB and Mendes N 2008 Seismic assess-
ment of the Qutb minar in Delhi, India. In: Proceedings of
14th World Conference on Earthquake Engineering, October
12-17, 2008, Beijing, China
[31] Menon A, Lai C G and Macchi G 2004 Seismic hazard
assessment of the historical site of Jam in Afghanistan and
stability analysis of the minaret. J. Earthq. Eng. 8(Sp. 1):
251–294
[32] IS 1905 1987 Code of practice for structural use of unrein-
forced masonry. New Delhi: Bureau of Indian Standards
[33] SeismoSoft 2008 SeismoStruct (version 4.0.9) – A computer
program for static and dynamic nonlinear analysis of framed
structures (online). Available from URL: http://www.seis
mosoft.com
[34] Chopra AK and Goel RK 2002 A modal pushover analysis
procedure for estimating seismic demands for buildings.
Earthq. Eng. Struct. Dyn. 31: 561–582
[35] Fajfar P 1999 Capacity spectrum method based on inelastic
demand spectra. Earthq. Eng. Struct. Dyn. 28: 979–993
[36] Psycharis I N, Papastamatiou D Y and Alexandris A P 2000
Parametric investigation of the stability of classical columns
under harmonic and earthquake excitations. Earthq. Eng.
Struct. Dyn. 29(8): 1093–1109
[37] Heyman J 1995 The stone skeleton: Structural engineering of
masonry architecture. UK: Cambridge University Press,
p. 172
74 Page 20 of 20 Sådhanå (2018) 43:74