modelingthetransportphenomenaandstructuralchanges...
TRANSCRIPT

Modeling the transport phenomena and structural changesduring deep fat frying
Part II: model solution & validation
R. Yamsaengsung a, R.G. Moreira b,*
a Department of Chemical Engineering, Faculty of Engineering, Prince of Songkla University, Hat Yai, Thailand 90110b Department of Biological and Agricultural Engineering, Texas A&M University, College Station, TX 77843-2117, USA
Received 4 May 2001; accepted 2 July 2001
Abstract
A fundamental two-dimensional model to predict the heat and mass transfer that occur during the frying and cooling process of
tortilla chips was solved using finite element technique. The assembly of elements method with each element being four-noded
quadrilateral elements was used to obtain a two-dimensional distribution. The Gauss–Legendre method was used for the numerical
integration of each of the integrals. The system of non-linear equations (including contributions from all elements) was solved using
FORTRAN Power Station 4.0. A good agreement between experimental and predicted data was obtained. The parameters that were
studied included water saturation, oil saturation, temperature during frying and cooling. Change in structure (shrinkage and ex-
pansion) was also verified and agreed well with the experimental data. Sensitivity analysis showed that the higher frying temperature
the faster drying rate and a faster increase in the temperature and pressure of the product. More oil was absorbed at a lower frying
temperature. The thicker the product the lesser the oil content. Oil absorption appeared to seize once the temperature of the product
begins to increase and a crust begins to form. The cooling temperature had the most influence on oil absorption. The cooling
temperature that was nearest to the temperature of the fried product led to the least amount of oil absorption. � 2002 Elsevier
Science Ltd. All rights reserved.
1. Introduction
Immersion frying, or deep fat frying, may be definedas the process of cooking foods by immersing them in anedible oil or fat, which is at a temperature above theboiling point of water, typically 150–200 �C. Variousmodels in recent years have been proposed to study themass and energy transport phenomena during the fryingprocess. However, the frying models developed so fardid not address the combined relationship between rawmaterials and frying conditions on the structural chan-ges (shrinkage and thickness expansion) and subsequentoil absorption of fried products. Many undesirablechanges that occur in foods during deep fat frying couldbe minimized, and the process could be better controlledif the product quality could be accurately predicted.Further work is needed to study the phenomenon of
crust formation, shrinkage, puffing and to model theporosity and textural changes during the frying process.
The objectives of this research were: (1) to solve themathematical model described in Yamsaengsung andMoreira (2001) using finite element technique, (2) toverify the model against experimental results, and (3) touse the model to perform sensitivity analysis to find: (a)the effect of oil temperature and cooling temperature,the initial moisture content, and the tortilla chip thick-ness on the moisture content, oil content, temperature,and pressure profiles during the frying and coolingprocess, and (b) to characterize spatially the process ofcrust formation and oil uptake as a function of thefrying and cooling temperature, the initial moisturecontent, and the tortilla chip thickness.
2. Numerical solution
The finite element formulation for solving the setof coupled partial differential equations is taken from
Journal of Food Engineering 53 (2002) 11–25
www.elsevier.com/locate/jfoodeng
*Corresponding author. Tel.: +1-979-847-8794; fax: +1-979-847-
3932.
E-mail address: [email protected] (R.G. Moreira).
0260-8774/02/$ - see front matter � 2002 Elsevier Science Ltd. All rights reserved.
PII: S0260-8774 (01 )00135-2

Lewis, Morgan, Thomas, and Seetharamu (1996). Lee’sthree level time-stepping scheme was applied to producea series of algebraic equations. For detailed explanationon the numerical solution the reader is referred toYamsaengsung (2000).
2.1. Two-dimensional model
To obtain the distribution of the water saturation, Sw,oil saturation, So, temperature, T, and pressure, P, in theradial (x-direction) and y-direction, a two-dimensionalanalysis of the problem was completed. The assembly ofelements method was used with each element being four-noded quadrilateral elements. Quadrilateral elementsare useful when considering shrinkage and expansion,when the elements become non-rectangular. The Gauss–Legendre method (Reddy, 1993) was used for thenumerical integration of each of the integrals. Each ofthe input parameters was updated locally and appliedto that particular element. The system of non-linearequations (including contributions from all elements)was solved using FORTRAN Power Station 4.0. Fig. 1
illustrates the discretization of a domain using four-noded quadrilateral elements for a 5 rows� 7 columnsmodel. Table 1 shows an example of the nodal coordi-nates for a 14� 7 element that was used to model a27:6 mm� 1:27 mm tortilla. More elements were as-signed in the thickness direction, because there is a lar-ger temperature and water saturation gradient in thatdirection.
2.2. Boundaries
Fig. 2 depicts the setup of the open and closedboundaries. Oil transfer at the surface by capillarypressure, Eq. (31) (Part I – Yamsaengsung & Moreira,2001), was applied to the boundary only during thecooling process. The moisture content and the structureof the tortilla chip were assumed to remain constantduring cooling, while the pressure and temperature wereassumed to decrease toward the ambient conditions.Therefore, moisture transport at the boundary was zeroduring cooling, and Tamb for Eq. (33) (Part I – Yamsa-engsung & Moreira, 2001) was equal to Tcooling. More-over, the mesh was assigned to be more concentrated
Fig. 1. Discretization of a 4� 6 domain using four-noded quadrilateral elements.
Table 1
Location of nodes used to model a 27.6 mm radius � 1.27 mm thickness tortilla
Coordinates Location of nodes (in mm)
x (radius) 0.00 2.00 10.00 18.00 24.00 27.60
y (thickness) 0.00 0.10 0.20 0.30 0.36 0.42 0.46 0.50
0.54 0.56 0.58 0.60 0.61 0.62 0.63
12 R. Yamsaengsung, R.G. Moreira / Journal of Food Engineering 53 (2002) 11–25

near the surface where there was a rapid change inSw; So, T, and P.
2.3. Solving the set of coupled non-linear equations
First of all, initial conditions were assigned. Then,local variables were calculated based on the nodalvariables and the size of the elements. The stiffnessmatrices K and C and the load vector J for each elementwere determined from the local Sw; So; T , and P variables(Yamsaengsung, 2000):
K ¼
K11 K12 K13 K14
K21 K22 K23 K24
K31 K32 K33 K34
K41 K42 K43 K44
26664
37775; U ¼
SwSoT
P
26664
37775;
C ¼
C11 C12 C13 C14
C21 C22 C23 C24
C31 C32 C33 C34
C41 C42 C43 C44
26664
37775; J ¼
JwJoJPJT
26664
37775:
ð1Þ
The matrices and vectors were then assembled to formthe global matrices and the global vectors to set-up Eq.(2):
KðUÞU þ CðUÞ oUot
þ JðUÞ ¼ 0: ð2Þ
Finally, Eq. (3) was solved to obtain the nodal variablesat time n+1.
Unþ1 ¼ � Kn
3
�þ Cn
2Dt
��1 KnUn
3
�þ KnUn�1
2Dtþ Jn
�: ð3Þ
If the new variables failed to meet the specified tolerance(large difference between variables from time n to nþ 1),the time step was decreased by half and the variableswere recalculated. If convergence was not met afterseveral iterations, the solution was considered divergentand new parameters or mesh distribution were consid-ered. If the new variables met the tolerance limit, theprogram continued and time was updated.
2.4. Structural changes
Eqs. (34) through (37) from Part I (Yamsaengsung &Moreira, 2001), were used to recalculate the diameterand thickness (in the y-direction) of the tortilla chip as afunction of the water saturation after each time step.The shrinkage factor was applied to approximately theouter 13% of the tortilla chip, with the rest of the in-ternal nodes (x-coordinates) fixed at the same coordi-nates. This was done to increase stability of the internalnodes (maintain small DSw;DSo;DT , and DP ) as theprogram proceeded from one time step to the next.For the expansion process, the factor was used for Sw <0:20, because there was no puffing observed until thecorresponding water saturation (less than 14% mois-ture content wet basis (w.b.)) (see Table 4 – Part I –Yamsaengsung & Moreira, 2001).
2.5. Convergences and mesh refinement
Mesh refinement is used to check for convergence ofthe numerical results. The input parameters used in thisstudy is shown in Tables 2 and 3. The input data are for1.27 mm thick tortilla chips fried at 190 �C. The numberof nodes that were analyzed included 80, 96, 120, and144 nodes. Table 4 gives the CPU time required for eachof the node selected. Fig. 3 illustrates the effect ofchanging the number of nodes on Sw; So; T , and P. Fromthese plots, the results for various number of nodesagree well. It takes 100 s per time step for the 144 nodessetup while it takes only 12 s per time step for the 80nodes setup. Thus, it is sufficient to use just 80 nodes forthe calculations of the 1.27 mm thick chips.
3. Results and discussions
3.1. Validation
Several frying conditions were set according to theexperiments performed by Chen and Moreira (1997) andKawas and Moreira (2000). All moisture contents are inw.b. unless specified.
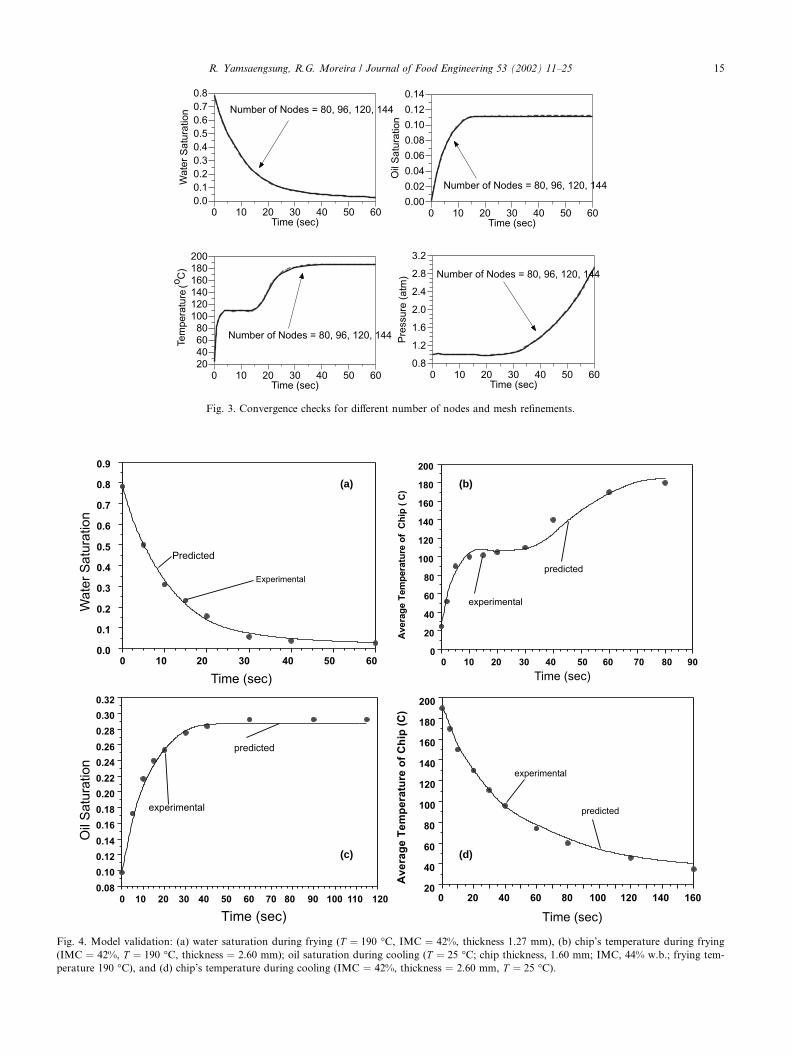
3.1.1. During fryingFig. 4(a) shows the water saturation profile of a 1.27
mm thick tortilla chip with an initial moisture content(IMC) of 42% fried at 190 �C. The figure shows goodagreement between the predicted model and the exper-imental data. The predicted curve resembles typicaldrying curves. Most of the water is lost during about thefirst 10–20 s of frying. This period is described by afalling rate period in which the rate of moisture lossdecreases and the slope of the drying curve decreases.Finally, once the equilibrium is reached, the slope isnearly zero.
Fig. 2. Symmetric portion of tortilla chip with open and closed
boundaries. Approximated drawing of actual mesh distribution.
R. Yamsaengsung, R.G. Moreira / Journal of Food Engineering 53 (2002) 11–25 13

The experimental temperature profile is shown alongwith the predictive profile in Fig. 4(b). It indicates ashort sensible heating period until the product temper-ature reaches the boiling point of water (approximately100 �C). Following the sensible heating period, the sam-ple enters a constant temperature period in which allof the heat is used to evaporate water from the product
(i.e., latent heat). After water has been removed tonearly equilibrium, the temperature at that particularregion begins to increase up to the temperature of the oilbath (approximately 190 �C).
While the temperature at the center of the productmay still be in the proximity of 100 �C, the temperaturenear the edges (crust) is already above 100 �C. This edge
Table 2
Input parameters for frying
Parameter Symbol Value Units
Latent heat of vapor k 2:2567� 106 J/kg
True densitya qs 1300.0 kg=m3
Water density qw 1000.0 kg=m3
Oil densityb qo 879.0 kg=m3
Vapor densityc qv 0.598 kg=m3
Air densityc qa 1.30 kg=m3
Bulk densityd qeff 587:287þ 1017:34M kg=m3
Water intrinsic permeabilitye kwi 5� 10�14 m2
Gas intrinsic permeabilitye kai 10� 10�14 m2
Oil intrinsic permeability Koi 0:05ðkwiÞ m2
Irreducible water saturation Sir 0.0299 –
Vapor diffusivity in air Dva 2:6� 10�5 m2
Water thermal conductivityf ka 0.64 W/m K
Oil thermal conductivityg ko 0.17 W/m K
Gas thermal conductivityf ka 0.026 W/m K
Heat capacity Cp Table 2 (Part I) J/kg K
Water viscosityh lw 0:988� 10�3 Pa s
Vapor viscosityh lv 0:1195� 10�4 Pa s
Gas viscosityh la 0:1704� 10�4 Pa s
Oil viscosityb lo lref exp½Ea=RT � Pa s
Heat transfer coefficienti h 285 W=m2K
Mass transfer coefficient hmv 0.0001–0.0031 m/sa (Kawas, 2000).b (Tseng, Moreira, & Sun, 1996).c (Perry, 1973).dChen (1996).e (Ni, 1997).f (Choi & Okos, 1986).g (Lewis, 1987).h (ASHRAE, 1997).i (Moreira, Castell-Perez, & Barrufet, 1999).
Table 4
CPU time required for various number of nodes
Number of nodes 80 96 120 144
Discretization 9� 7 11� 7 14� 7 17� 7
CPU (seconds per step) 12 24 36 100
Table 3
Input parameters for cooling
Parameter Symbol Value Units
Surface oil saturation for 25 �C Sol 0.28 –
Surface oil saturation for 80 �C Sol 0.205 –
Oil relative permeability kor 0.01 –
Oil intrinsic permeability for 25 �C kir kwi � 0:18 m2
Oil intrinsic permeability for 80 �C kir kwi � 0:125 m2
Heat transfer coefficient for air h 25 W=m2K
14 R. Yamsaengsung, R.G. Moreira / Journal of Food Engineering 53 (2002) 11–25
(a) (b)
(c) (d)
Fig. 4. Model validation: (a) water saturation during frying (T ¼ 190 �C, IMC ¼ 42%, thickness 1.27 mm), (b) chip’s temperature during frying
(IMC ¼ 42%, T ¼ 190 �C, thickness ¼ 2.60 mm); oil saturation during cooling (T ¼ 25 �C; chip thickness, 1.60 mm; IMC, 44% w.b.; frying tem-
perature 190 �C), and (d) chip’s temperature during cooling (IMC ¼ 42%, thickness ¼ 2.60 mm, T ¼ 25 �C).
Fig. 3. Convergence checks for different number of nodes and mesh refinements.
R. Yamsaengsung, R.G. Moreira / Journal of Food Engineering 53 (2002) 11–25 15

region is the crust region, which contains very littlemoisture and has physical properties much differentthan the high moisture core region. As frying proceeds,the crust region increases in thickness and moves to-wards the center of the product.
3.1.2. During coolingDuring the cooling process, when the chips are re-
moved from the fryer, the oil content increases sharply,reaching a maximum value at about 160 s, i.e., when thechips temperature is reduced to the ambient temperature(Moreira et al., 1999). Since nearly 64% of the oil isabsorbed during cooling, the mechanism of oil absorp-tion may be related to the capillary pressure differenceand the interfacial tension between the oil and the gaswithin the pores (Moreira et al., 1999). Hence, the oiltransport due to capillary pressure term is includedduring the cooling process.
From the previous experiments (Chen, 1996), it hasbeen shown that less oil absorption occurs when theambient temperature is closer to the temperature of theproduct at the instant it has been removed from the fryer(i.e., 190 �C). Fig. 4(c) compares the predicted and ex-perimental results for cooling at 27 �C. To make acomparison with the experimental data, the original oilcontent was set at 8.0% w.b., or an oil saturation valueof 0.097. Oil saturation was uniformly distributed forthis particular case. For tortilla chips fried at 190 �C,the amount of oil absorption predicted during fryingalone was around 0.11. The total amount of oil ab-sorbed after cooling was about 27% w.b. or about 0.28oil saturation.
The temperature history of the tortilla chips duringthe cooling process was compared to data from Chen(1996) at 27 �C. Fig. 4(d) shows that even after 160 s, thetemperature of the tortilla chip still does not reachthe ambient temperature. This is due to the thickness ofthe tortilla chip. Further cooling would force the pro-duct temperature towards the ambient temperature.
The temperature drops rapidly during the first part ofthe cooling process with the chip cooling at a lowertemperature having a less dramatic temperature drop.This rapid decrease in temperature also leads to a rapiddecrease in the internal pressure of the tortilla chip re-sulting in about 0.28 oil saturation (27% OC w.b.).
3.1.3. Structural changesDuring frying, the tortilla chip undergoes both
shrinkage in the radial direction and expansion in thethickness due to gas bubble expansion inside the tortillachip. Fig. 5 shows the thickness (y) at each radial posi-tion (x) of the chip during frying. Most of the shrinkageoccurs after 5 s of frying and most of the expansionoccurs after 20 s of frying, or at very low water satu-ration. Expansion was occurring at about the time thecrust was forming. The formation of the crust greatly
reduces the rate of moisture transfer and causes an in-crease in pressure inside the chips. Thus, this pressurebuildup leads to an expansion of the pores, which resultsin a crispy final product. When the expansion factor wasnot included, the pressure increased even more dra-matically and the solution sometimes diverged. The re-sults presented here help to explain some of the heat andmass transfer phenomenon that are uncovered by pre-vious experimental research.
3.2. Sensitivity analysis
Since the heat and mass transfer equations weresolved using a two-dimensional plane geometry, theprofiles of water saturation, oil saturation, temperatureand pressure can be studied using two- and three-di-mensional plots. The two-dimensional plots are useful inshowing these time dependent variables as a function ofthe radius (x-direction) and the thickness (y-direction)of the tortilla. Three-dimensional plots help in illus-trating the dramatic changes in values along the tortillaplane, such as a sharp drop in temperature from oneregion to the next. MATLAB 5.2.1 (Mathworks,Natick, MA) was used to render these plots. The two-dimensional plots are created by rotating the originalthree-dimensional plots to show just the cross-sectionarea of the tortilla chip. Only cases where there is dis-tinct water saturation, oil saturation, temperature andpressure profiles are discussed below.
3.2.1. Water saturation profile during fryingFig. 6 shows the two-dimensional profile of water
saturation for the 1.27 and 2.60 mm tortilla chips. Thesix subplots represent the cross-sectional profile of thetortilla chip at various frying time. The x-axis representsthe radial distance in mm and the y-axis represents thethickness also in mm. The dark blue color represents
Fig. 5. Shrinkage and expansion of tortilla chips during frying (IM-
C ¼ 42% w.b. and oil temperature 190 �C).
16 R. Yamsaengsung, R.G. Moreira / Journal of Food Engineering 53 (2002) 11–25
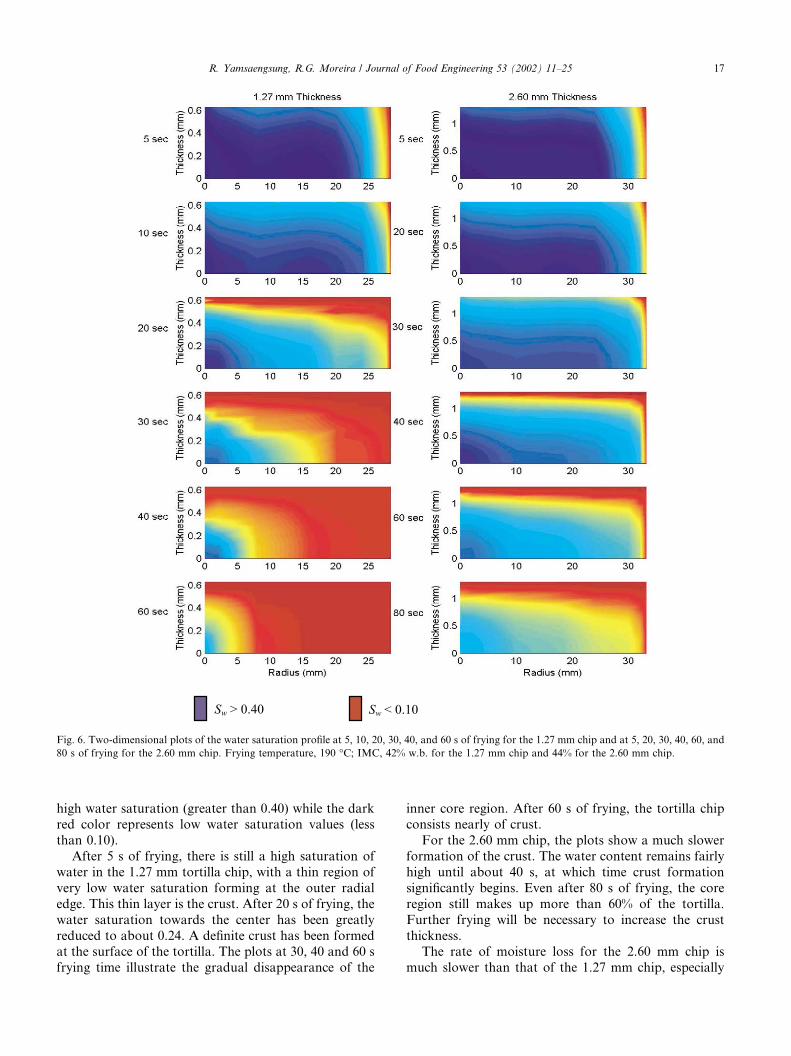
high water saturation (greater than 0.40) while the darkred color represents low water saturation values (lessthan 0.10).
After 5 s of frying, there is still a high saturation ofwater in the 1.27 mm tortilla chip, with a thin region ofvery low water saturation forming at the outer radialedge. This thin layer is the crust. After 20 s of frying, thewater saturation towards the center has been greatlyreduced to about 0.24. A definite crust has been formedat the surface of the tortilla. The plots at 30, 40 and 60 sfrying time illustrate the gradual disappearance of the
inner core region. After 60 s of frying, the tortilla chipconsists nearly of crust.
For the 2.60 mm chip, the plots show a much slowerformation of the crust. The water content remains fairlyhigh until about 40 s, at which time crust formationsignificantly begins. Even after 80 s of frying, the coreregion still makes up more than 60% of the tortilla.Further frying will be necessary to increase the crustthickness.
The rate of moisture loss for the 2.60 mm chip ismuch slower than that of the 1.27 mm chip, especially
Fig. 6. Two-dimensional plots of the water saturation profile at 5, 10, 20, 30, 40, and 60 s of frying for the 1.27 mm chip and at 5, 20, 30, 40, 60, and
80 s of frying for the 2.60 mm chip. Frying temperature, 190 �C; IMC, 42% w.b. for the 1.27 mm chip and 44% for the 2.60 mm chip.
R. Yamsaengsung, R.G. Moreira / Journal of Food Engineering 53 (2002) 11–25 17
when the water saturation was less than 0.20. This maybe due to the crust formation that reduces the rate ofmoisture transfer. It takes 20 s to reduce the water sat-uration value from 0.147 to 0.049 for the thinner chip,while it takes 40 s to reduce the water saturation from0.172 to 0. 093 for the thicker chip. It takes signifi-cantly longer for the thicker chip to produce a two-dimensional profile similar to that of the thinner chip (at20 s for the 1.27 mm chip and at 60 s for the 2.60 mmchip).
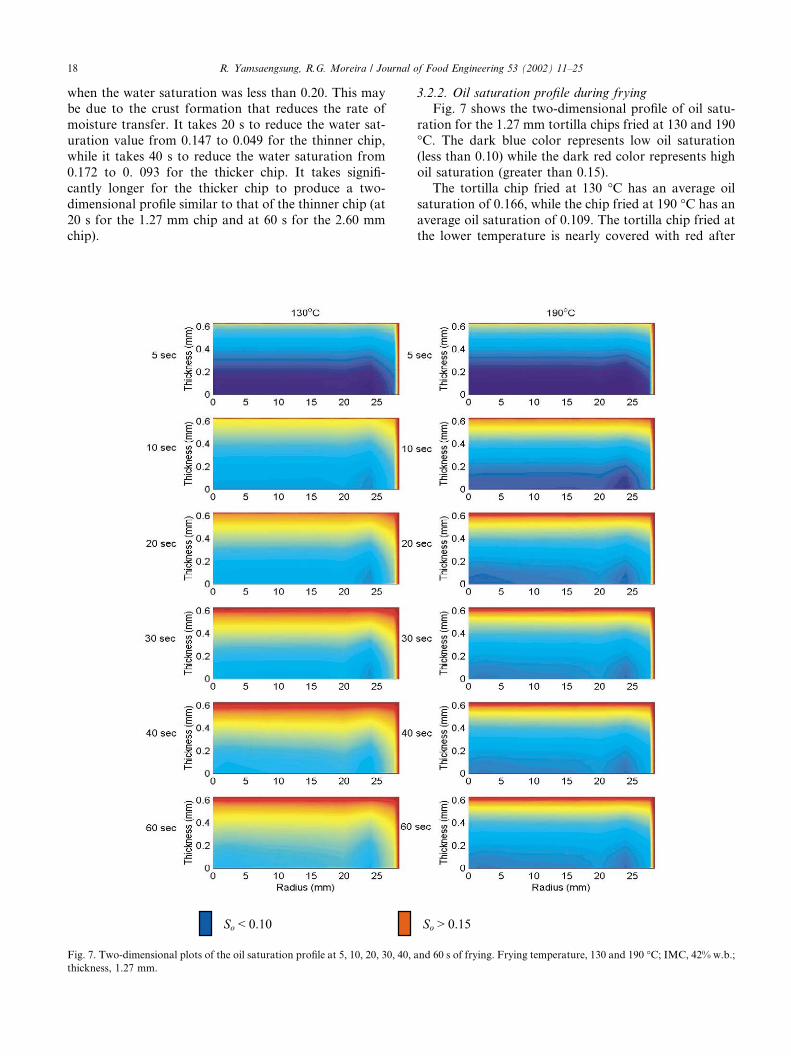
3.2.2. Oil saturation profile during fryingFig. 7 shows the two-dimensional profile of oil satu-
ration for the 1.27 mm tortilla chips fried at 130 and 190�C. The dark blue color represents low oil saturation(less than 0.10) while the dark red color represents highoil saturation (greater than 0.15).
The tortilla chip fried at 130 �C has an average oilsaturation of 0.166, while the chip fried at 190 �C has anaverage oil saturation of 0.109. The tortilla chip fried atthe lower temperature is nearly covered with red after
Fig. 7. Two-dimensional plots of the oil saturation profile at 5, 10, 20, 30, 40, and 60 s of frying. Frying temperature, 130 and 190 �C; IMC, 42% w.b.;
thickness, 1.27 mm.
18 R. Yamsaengsung, R.G. Moreira / Journal of Food Engineering 53 (2002) 11–25

30 s of frying indicating high oil saturation in all regionswith the most being toward the exterior. On the otherhand, the chip fried at the higher temperature has oilsaturation above 0.15 only along the surface and theedges with the interior remaining below 0.10. The quickpressure buildup inside the tortilla chip may have helpedto prevent the capillary diffusion of oil (see Fig. 9).
Oil absorption for the 130 �C chip begins to slowdown after about 30 s, while oil absorption slows downaround 18 s for the 190 �C chip (note that the color
gradient does not change significantly after 30 and 18 s,respectively).
3.2.3. Temperature profile during fryingFig. 8 shows the three-dimensional profile for the
temperature distribution of the 1.27 mm tortilla chipsfried at 190 �C. The dark blue color represents lowtemperature (about 100 �C) while the dark red colorrepresents high temperature (greater than 180 �C). Thefigure illustrates the gradual increase in the temperature
Fig. 8. Three-dimensional plots of the temperature profile at 5, 10, 20, 30, 40, and 60 s of frying. Frying temperature, 190 �C; IMC, 42% w.b.;
thickness, 1.27 mm.
R. Yamsaengsung, R.G. Moreira / Journal of Food Engineering 53 (2002) 11–25 19

starting along the outer edge and moving towards thecenter as frying time increase. The average temperaturechip reaches 180 �C around 60 s.
Since the temperature of a region within the tortillachip was allowed to increase after reaching a watersaturation of 0.18, the temperature rises significantlyafter 18 s. The figure yields a substantial red and darkorange area after these frying times. After 20 s of fryingit can be seen that the temperature of interior core re-gion (blue) remains near the boiling point while thetemperature in the receding crust region (dark red) iswell above this value. This corresponds well to 20 s,
where the outer region has a very low water saturationwhile the interior core has a substantial amount of watersaturation.
By looking at the three-dimensional perspective of thetemperature profile, it is easy to see the sharp contrast intemperatures between the crust and the core region.These regions of sudden increase in temperature pro-duce a noticeable folding in the plot.
3.2.4. Pressure profile during fryingFig. 9 demonstrates the two-dimensional profile for
the pressure distribution for tortilla chips with initial
Fig. 9. Two-dimensional plots of the pressure profile at 5, 10, 20, 30, 40, and 60 s of frying. Frying temperature, 190 �C; thickness, 1.27 mm; IMC,
27% and 42%.
20 R. Yamsaengsung, R.G. Moreira / Journal of Food Engineering 53 (2002) 11–25

moisture content of 27% and 42% fried 190 �C. The darkblue color represents a high-pressure region (above 1atm), while the light blue color represents a low-pressureregion (approximately 1 atm). The colors that tendtoward red in the color spectrum represent pressuresbelow 1 atm. These plots show a gradual increasein pressure, but a sharp difference between the differ-ent regions of the chip is not very detectable. Thecolor scheme for both chip thickness slowly changesfrom greenish blue to light blue, and finally to darkblue.
The average pressure for the 42% IMC tortilla chipreached 2.84 atm after 60 s of frying, while the averagepressure for the 27% IMC mm chip reached 3.0 atmafter 30 s of frying (Yamsaengsung, 2000). The pressureswithin both chips remained near 1 atm for most of thefrying and dramatically increase once the water satura-tion is below 0.10. Plots of the first 30 s of frying show aslight gradient in the pressure profile. This gradient mayinclude regions where pressure is above and below 1atm. Therefore, the average pressure at some particulartime may be below 1 atm. The same is true for the 27%IMC tortilla chip. These regions of lower pressure maycontribute to the capillary pressure difference and to oilabsorption.
From this figure, the pressure inside the chip with27% IMC increases rapidly around 10 s of frying (whenSw ¼ 0:10). The 27% IMC chip is usually removed fromthe fryer after about 30 s (i.e., when the equilibriummoisture content is reached). If the chip is left in thefryer for a longer period of time, it will likely burn andits physical and textural properties would be unaccept-able. Thus, the pressure of the 27% IMC chip after 30 sis considered just for modeling purposes and does notreflect the idealized process. Moreover, as mentionedbefore, the pressure buildup may be overly exaggeratedbecause it does not account for pressure inside indi-vidual pores and the external puffing of these pores.Nonetheless, the pressure history does demonstrate theimportance of including structural changes within themodel.
Oil absorption continues for the first 20 s of frying forthe 42% IMC chip and for the first 10 s for the 27% IMCchip (Table 7). After these frying times, the plots showthe development of patches of dark blue regions (pres-sure above 1 atm). Even though the colors are distinct,the actual pressure difference between the lightly darkand the very dark blue is less than 0.05 atm. From theassumptions, the pressure of a particular region in-creases when the water saturation is very low (less than0.02). Since the pressure is correlated to the temperaturethrough the saturated vapor pressure curve, a slightincrease in temperature (when above the boiling pointof water) leads to a very large increase in pressure.Therefore, the pressure profile appears much morechaotic than the temperature profile (Fig. 8).
Even though these profiles are useful for demon-strating the pressure distribution within the tortilla chip,it still does not account for the large range of pressurewithin each pore of the chip. Thus, a microscopic modelthat accounts for the formation of individual pores maybe more useful for predicting the pressure profile.
3.2.5. Oil saturation profile during coolingFig. 10 shows the two-dimensional profile for the oil
distribution for 1.60 mm chips cooled at 25 and 80 �C.The dark blue color represents a low oil saturation re-gion (less than 0.10), while the dark orange to red rep-resents a high oil saturation region (greater than 0.20).The plots of both of these cooling temperatures show aslight gradient from the edge to the center of the chip.As time progresses, the color scheme slowly changesfrom dark blue, to yellow, and finally to orange and red.However, since the final oil content of the chip cooled at25 �C is higher (0.291 versus 0.208), it has a strongerintensity of orange and red.
The oil movement appears to enter faster from theedge of the chip before saturating the top surface of thechip. This phenomenon is difficult to understand. Dur-ing the first part of cooling, the oil saturation along thesurface may delay initial oil movement into the product.Once this oil migrates further into the center of theproduct, then more surface oil is transferred across thetop surface. Oil absorption continues until all the sur-face oil is absorbed or drains off the surface. The lateroccurs when the equilibrium temperature and the pres-sure are being approached. The relationship of oiltransfer with the product temperature and pressure willbe discussed in the next two sections.
3.2.6. Crust formationThe formation of the crust is important in giving the
fried product its color, flavor, and its crispy texture.Moreover, it has been noted that most of the oil ab-sorbed lies in the crust layer. The crust limits waterdiffusion from the center of the tortilla leading to apressure buildup inside the tortilla chip and to poreexpansion. These air pockets give the chips its crunchysound when bitten into.
Table 5 compares the characteristics of each of theseregions. The water present in the crust region is from theimmobile bound water of zone I and a small amount ofmultilayer water is from zone II (see Part I – Yamsa-engsung & Moreira, 2001). Thus, this water is what re-mains at equilibrium. In addition, since water in thecrust region is in vapor form, the type of mass diffusionhere is only from capillary diffusion.
3.2.6.1. Effect of frying temperature. Table 6 shows thesimulation results for crust thickness formation as afunction of the frying temperature. For this analysis, thecrust was defined as any region with moisture content
R. Yamsaengsung, R.G. Moreira / Journal of Food Engineering 53 (2002) 11–25 21

less than 0.05 (w.b.) (Sw ¼ 0:07). The chips fried at 190�C begin to form crust fastest, as expected. The crust
begins to form after 20 s of frying. After 60 s of frying, ittakes up about 76.2% of the tortilla thickness. On the
Fig. 10. Two-dimensional plots of the oil saturation profile at 0, 5, 20, 30, 60, and 120 s of cooling. Cooling temperature, 25 and 80 �C; IMC, 42%
w.b.; thickness, 1.60 mm; frying temperature, 190 �C.
Table 5
Physical and thermal properties of the crust and the core regions
Characteristics Crust region Core region
Temperature >100 �C Approximately 100 �CMoisture content <0.05 MC w.b. Highly saturated
Type of water Zone I and zone II Zone III
Type of diffusion Capillary Capillary and convective
Thermal conductivity Eq. (43)a Eq. (42)a
a From Yamsaengsung, (2000).
22 R. Yamsaengsung, R.G. Moreira / Journal of Food Engineering 53 (2002) 11–25

other hand, chips fried at 130 and 160 �C have cruststhat take up only 20.6 and 36.8% of the entire thickness,respectively. Even though the chips fried at a highertemperature have a larger crust, it has lower total oilsaturation. Fig. 7 shows that the 130 �C chip has moreoil saturated along the outer crust. Furthermore, thefaster temperature and pressure buildup inside the 190�C chip may play a role in reducing the amount of oilabsorbed.
3.2.6.2. Effect of IMC. Table 7 shows the result of crustformation as a function of the IMC. The 27% IMCchip began forming crust much faster than the 42%chip. After 20 s of frying, the lower IMC chip had de-veloped 20.6% crust, while it takes the 42% chip about40 s to form the same crust thickness. After 60 s offrying, the entire 27% IMC chip had become 100%crust, while the 42% IMC chip still maintain about23.8% core region. Since the lower IMC tortilla chipheats up faster and reaches the lower moisture contentfaster, its crust formation is, as expected, quicker. Inaddition, even though the lower IMC chip had a largerpercentage of crust formed, it absorbed less oil overall.Again, the faster temperature and pressure increase in-terior of the crust may reduce the amount of oil ab-sorbed.
3.2.7. Shrinkage and expansionTable 8 shows the simulation results for thickness (y)
at each radial position (x) of the chip at the initial andfinal frying time. The original thickness of the tortillachip was 1.27 mm and the frying temperature was 190
�C. The initial IMC was 42%. Fig. 11 illustrates the fullcross-section of the tortilla chip at various frying time,where the darker shades represent lower water satura-tion. The chips shrink during the first 5 s of frying andstarts to expand at 20 s of frying as the water saturationis reduced to the equilibrium valor.
4. Conclusions
1. A finite element method was used to solve the setsof partial differential equations to describe the fry-ing process of tortilla chips. The mathematical modelwas a complex set of non-linear partial differentialequations describing heat and mass transfer duringfrying. A discretization consisting of 9� 7 elements(80 nodes) was used to model a 27:6 mm� 1:27 mm
Table 6
Crust thickness for 1.27 mm tortilla chip fried at 130, 160 and 190 �C; IMC, 42% w.b.
Time (s) 130 �C 160 �C 190 �C
Crust (mm) % of Chip Crust (mm) % of Chip Crust (mm) % of Chip
0 – – – – – –
20 – – – – 0.02 1.6
30 – – 0.14 11.1 0.14 11.1
40 – – 0.26 20.6 0.26 20.6
50 0.02 1.6 0.26 20.6 0.66 52.4
60 0.20 20.6 0.46 36.8 0.96 76.2
Table 7
Effect of the initial moisture content on crust thickness for 1.27 mm chip fried at 190 �C
Time (s) 27% IMC 42% IMC
Crust (mm) % of Chip Sw So Crust (mm) % of Chip Sw So
0 – – 0.451 0.000 – – 0.783 0.000
10 0.06 4.8 0.105 0.051 – – 0.331 0.070
20 0.26 20.6 0.055 0.054 0.02 1.6 0.147 0.099
30 0.46 36.5 0.037 0.054 0.14 11.1 0.077 0.108
40 0.96 76.2 0.034 0.054 0.26 20.6 0.049 0.109
50 1.26 100.0 0.024 0.054 0.66 52.4 0.037 0.109
60 1.26 100.0 0.022 0.054 0.96 76.2 0.029 0.109
Table 8
Initial and final dimensions of 1.27 mm tortilla fried at 19 �C for 60 s;
IMC, 42% w.b.
Initial coordinates Final coordinates
x (mm) y (mm) x (mm) y (mm)
0.00 0.63 0.00 1.26
2.00 0.63 2.00 1.26
8.00 0.63 8.00 0.95
16.00 0.63 14.55 0.76
20.00 0.63 18.18 0.69
24.00 0.63 21.82 0.64
27.60 0.63 25.06 0.63
28.20 0.63 25.64 0.63
28.32 0.63 25.74 0.63
R. Yamsaengsung, R.G. Moreira / Journal of Food Engineering 53 (2002) 11–25 23

tortilla chip. This setup resulted in good convergenceof the numerical results at low CPU time.
2. The higher frying temperature leads to faster mois-ture loss from the product. The lower frying temper-ature leads to more oil absorption. Oil is concentratedmostly along the outer edge of the tortilla chip, butdoes penetrate towards the center of the chip. Thehigher the initial moisture content of the product,the higher is the oil absorption. The thicker tortillachip takes longer to reach the equilibrium moisturecontent, but absorbs less oil.
3. During cooling, most of the oil is concentrated alongthe surface. The cooling temperature has the largesteffect on oil absorption. Higher cooling temperatureslead to lower oil absorption because of lower capil-lary pressure difference.
4. Most of the shrinkage occurs after 5 s of frying andmost of the expansion occurs after 20 s of frying, orat very low water saturation. Expansion occurs atabout the time the crust is forming. The crust greatlyreduces the rate of moisture transfer and causes an in-crease in pressure inside the chips. When the expan-sion factor was not included, the pressure increased
even more dramatically and the mathematical solu-tion sometimes diverged.
References
Parsons, R. (Ed.). (1997). ASHRAE handbook. Fundamentals. Atlanta:
ASHRAE, Inc.
Chen, Y. (1996). Simulation of a deep-fat frying process for tortilla
chips. M.S. Thesis, Texas A&M University, College Station, TX.
Chen, Y., & Moreira, R. G. (1997). Modeling of a batch deep-fat
frying process for tortilla chips. Transactions of Institute of
Chemical Engineers, 75(C), 181–190.
Choi, Y., & Okos, M. R. (1986). Physical and chemical properties of
foods. St Joseph, MI: ASAE.
Kawas, M. L., (2000). Characterization of product quality attributes of
tortilla chips during the frying process. M.S. Thesis, Texas A&M
University, College Station, TX.
Kawas, M. L. & Moreira, R. G. (2000). Characterization of product
quality attributes of tortilla chips during the frying process. Journal
of Food Engineering, 47(2), 97–107.
Lewis, M. J. (1987). Physical properties of foods and food processing
systems. Deerfield Beach, FL: VCH.
Lewis, R. W., Morgan, K., Thomas, H. R., & Seetharamu, K. N.
(1996). The finite element method in heat transfer analysis. New
York: Wiley.
Fig. 11. Shrinkage and expansion of the 1.27 mm tortilla chip at different frying time. Frying temperature, 190 �C. Figures are not drawn to scale.
24 R. Yamsaengsung, R.G. Moreira / Journal of Food Engineering 53 (2002) 11–25

Moreira, R. G., Castell-Perez, M. E., & Barrufet, M. A. (1999). Deep-
fat frying of food-fundamentals and applications. Gaithersburg,
MD: Aspen Publishers.
Ni, H. (1997). Multiphase moisture transport in porous media under
intensive microwave heating. Ph.D. Dissertation, Cornell Univer-
sity, Ithaca, NY.
Perry, R. H. (1973). Chemical engineer’s handbook. New York: Mc-
Graw-Hill.
Reddy, J. N. (1993). An introduction to the finite element method. St.
Louis, MO: McGraw-Hill.
Tseng, Y., Moreira, R. G., & Sun, X. (1996). Total frying-use time
effects on soybean-oil deterioration and on tortilla chip quality.
International Journal of Food Science and Technology, 31,
287–294.
Yamsaengsung, R. (2000). Modeling the transport phenomena and
structural changes during deep fat frying. Ph.D. Dissertation,
Texas A&M University, College Station, TX.
Yamsaengsung, R., & Moreira, R. G. (2001). Modeling the transport
phenomena and structural changes during deep fat frying. Part I:
model develeopment. Journal of Food Engineering.
R. Yamsaengsung, R.G. Moreira / Journal of Food Engineering 53 (2002) 11–25 25