modeling whistler wave generation regimes in - hal
TRANSCRIPT
Annales Geophysicae (2004) 22: 3561–3570SRef-ID: 1432-0576/ag/2004-22-3561© European Geosciences Union 2004
AnnalesGeophysicae
Modeling whistler wave generation regimes in magnetosphericcyclotron maser
D. L. Pasmanik1, A. G. Demekhov1, V. Y. Trakhtengerts1, and M. Parrot2
1Institute of Applied Physics RAS, Ulyanov Street 46, Nizhny Novgorod 603950, Russia2LPCE/CNRS, Orleans, France
Received: 19 March 2003 – Revised: 30 March 2004 – Accepted: 18 May 2004 – Published: 3 November 2004
Abstract. Numerical analysis of the model for cyclotron in-stability in the Earth’s magnetosphere is performed. Thismodel, based on the self-consistent set of equations of quasi-linear plasma theory, describes different regimes of wavegeneration and related energetic particle precipitation. As thesource of free energy the injection of energetic electrons withtransverse anisotropic distribution function to the interactionregion is considered. A parametric study of the model is per-formed. The main attention is paid to the analysis of genera-tion regimes for different characteristics of energetic electronsource, such as the shape of pitch angle distributions and itsintensity. Two mechanisms of removal of energetic electronsfrom a generation region are considered, one is due to theparticle precipitation through the loss cone and another oneis related to the magnetic drift of energetic particles.
It was confirmed that two main regimes occur in this sys-tem in the presence of a constant particle source, in the caseof precipitation losses. At small source intensity relaxationoscillations were found, whose parameters are in good agree-ment with simplified analytical theory developed earlier. Ata larger source intensity, transition to a periodic generationoccurs. In the case of drift losses the regime of self-sustainedperiodic generation regime is realized for source intensityhigher than some threshold. The dependencies of repetitionperiod and dynamic spectrum shape on the source parameterswere studied in detail. In addition to simple periodic regimes,those with more complex spectral forms were found. In par-ticular, alteration of spikes with different spectral shape cantake place. It was also shown that quasi-stationary generationat the low-frequency band can coexist with periodic modula-tion at higher frequencies.
On the basis of the results obtained, the model for expla-nation of quasi-periodic whistler wave emissions is verified.
Key words. Magnetospheric physics (plasma waves and in-stabilities; energetic particles, precipitating; energetic parti-cles, trapped)
Correspondence to:D. L. Pasmanik([email protected])
1 Introduction
Quasi-periodic (QP) whistler emissions are the wide bandemissions that are observed inside or near the plasma-pause (see, for example, Helliwell (1965); Sato etal. (1974); Hayakawa and Sazhin (1992); Sazhin andHayakawa (1994)). They are characterized by a periodicmodulation of wave intensity with typical periods from sev-eral seconds up to a few minutes. Generation of QP emis-sions is usually accompanied by precipitation of energeticparticles, which are also modulated by the same period.
One of the possible mechanisms of such periodic mod-ulation is connected to geomagnetic pulsations of a corre-sponding period (Sato et al., 1974). But experimental datashow that generation of QP emissions may occur in the ab-sence of such disturbances (Oguti et al., 1991). It is believedthat in the latter case, whistler waves are generated by thecyclotron instability in a region with enhanced cold plasmadensity. The free energy for wave excitation is supplied tothe interaction region by the energetic electrons with trans-verse anisotropic distribution function. The source of theseparticles may be related to their magnetic drift to the interac-tion region or to a local acceleration mechanism, such as themagnetic tube compression.
Particles can be removed from the interaction region bytwo mechanisms: precipitation of energetic particles via theloss cone and drift of particles away from the interaction re-gion across the magnetic field lines.
Drift removal of energetic particles is most effective forinteraction in a duct that is outside the plasmasphere or ifthe cross section of the interaction region is rather small.This mechanism was taken into account in the flow cyclotronmaser (FCM) model developed byDemekhov and Trakht-engerts(1994). Periodic regimes of whistler wave generationobtained in this model were used for explanation of pulsatingauroras.
In the case of interaction inside the plasmasphere or inrather large areas of enhanced cold plasma density, losses ofenergetic particles due to precipitation are dominant. Sucha mechanism was considered in a simplified, self-consistent
3562 D. L. Pasmanik et al.: Modeling whistler wave generation regimes
model of cyclotron interaction byBespalov and Trakht-engerts(1976) and Davidson(1979), where the so-calledtwo-level approximation was used. The results obtained onthe basis of this model allow one to explain general proper-ties and characteristic time scales of whistler wave genera-tion, but this model does not take into account the evolutionof wave spectrum and energetic particle distribution.
In this paper, we present results of numerical analysis ofboth cases mentioned above. The FCM model is general-ized with loss cone precipitation taken into account. Weperformed extensive numerical analysis of this model usingvarious combinations of parameters for both removal mech-anisms to find which generation regimes are possible in sucha system. We analyze the properties of these generationregimes as dependent on the system parameters, such as char-acteristics of the energetic particle source and wave damping.Peculiarities of the wave spectra corresponding to each gen-eration regime are discussed. The results obtained should beuseful for interpretation of many available experimental datafor QP emissions.
2 Description of the model
As it was mentioned above, we assume in our model thatQP emissions are generated in the region with enhanced coldplasma density, where the cyclotron resonance condition issatisfied for most of the energetic particles (see below). Out-side this region, the development of cyclotron instability isimpossible and the distribution of energetic electrons mayremain anisotropic. The magnetic drift of such particles intothe region with dense plasma serves as the source of free en-ergy for wave generation.
To describe the cyclotron instability development in thisregion we use the self-consistent set of equations of quasi-linear plasma theory for the distribution functionF(µ, v, t)
of energetic electrons and whistler wave spectral energy den-sity ε(ω, t). To study processes with characteristic time-scales greater than periods of oscillations of waves and parti-cles between mirror points (which is true for QP emissions),it is possible to use equations averaged over these oscilla-tions (Bespalov and Trakhtengerts, 1986). Below we shallconsider only a low-frequency bandω�ωB , whereωB isthe electron gyrofrequency. In this case pitch angle diffusiondominates over the energy diffusion and equations of quasi-linear theory can be written in the following form (Bespalovand Trakhtengerts, 1986):
∂F
∂t+ VD
∂F
∂x=
1
Tb
∂
∂µµD
∂F
∂µ− δ · F (1)
∂ε
∂t=
2
Tg
(0 − | ln R|) ε . (2)
Hereµ= sin2 2L, 2L is the equatorial pitch angle,v is theelectron velocity,Tb is the bounce oscillations period,Tg isthe period of wave-packet oscillations, andR is the effective
reflection coefficient, describing wave energy loss. The co-efficientD of pitch angle diffusion and the amplification0of whistler waves on the pass between conjugate ionospheresare defined below.
The second term on the left-hand side of Eq. (1), whereVD is the velocity of magnetic drift, andx is the coordinateacross the magnetic field lines, describes the drift of energeticparticles. Energetic particle losses due to their precipitationvia the loss cone are taken into account by the last term inEq. (1), where
δ =
{0 µ ≥ µc
(Tb/4)−1 0 ≤ µ ≤ µc(3)
andµc is the loss cone boundary.In this paper we restrict our consideration to the case of
ducted whistler wave propagation, in which the waves prop-agate parallel to the geomagnetic field (i.e.k‖B). Takinginto account oblique electromagnetic whistler waves wouldnot change the obtained results quantitatively. Direction find-ing studies confirm that whistler waves propagating at smallangles in the near-equatorial region are typical in the nearplasmapause region (seeHayakawa et al.(1986); Hayakawaand Sazhin(1992)). Quasi-electrostatic or unducted elec-tromagnetic whistlers require a more complicated analy-sis, which is beyond the scope of this paper. In the caseof longitudinal wave propagation, we can assume quasi-homogeneous distribution of the wave energyε across theinteraction region and average the kinetic Eq. (1) over thecross section of this region:
∂8
∂t=
1
Tb
∂
∂µµD
∂8
∂µ+ J − δ · 8 (4)
J = (VD/S0)
∫ y2
y1
(Fin − Fout) dy , (5)
where8=S−10
∫Fds, S0 is the area of the duct cross section,
J is the effective source,Fin and Fout are the distributionfunctions of electrons entering and leaving the duct, respec-tively, andy1 and y2 are the boundaries of the interactionregion in the direction transverse toVD.
Taking into account that the energy diffusion is negligi-ble in the considered frequency rangeω�ωB , we can sim-plify the analysis of this model by using a distribution witha narrow energy spectrum, parameterized by the character-istic energyW0=mv2
0/2. The use of this approximation ispossible due to the fact that the inhomogeneous geomagneticfield provides a spread in resonant energies: a wave with agiven frequencyω interacts with particles whose velosity isv>vmin(ω, µ), wherevmin is determined from the cyclotronresonance condition in the equatorial plane (see Appendixand the integration limits in Eqs. (6) and (7) below). Dueto that, the growth rate of ducted whistler waves is deter-mined by integral parameters of the energy distribution, suchas characteristic energy (Bespalov and Trakhtengerts, 1976;Demekhov and Trakhtengerts, 1994). This approximation al-lows us to obtain correct integral characteristics, such as the

D. L. Pasmanik et al.: Modeling whistler wave generation regimes 3563
particle flux and the wave amplification without analyzingthe evolution of the particle energy spectrum. Hereafter,8
will denotes the distribution function overµ, i.e. the distri-bution integrated over its narrow energy spread nearW0.
Applying these simplifications to the full expressions forthe diffusion coefficient and the wave amplification (Be-spalov and Trakhtengerts, 1986), we obtain the following ex-pressions (Demekhov and Trakhtengerts, 1994):
D = D∗ · (2 − µ)−1/2
1∫µ
ε(ξ − µ)−1/2dξ (6)
0 = 0∗ ·1 − ξ
√2 − ξ
ξ∫0
(µ
∂8
∂µ−
ω
ωBL
8
)(ξ − µ)−1/2dµ , (7)
where
D∗ =32
√2π2e2LR0
3m2c2v0β∗
, 0∗ =πaω2
pLv0
ωBLc2ncL
(8)
ξ = 1 − ω0/ω, β∗ =
(ωpLv0
ωBLc
)2
, ω0 = ωBL/β∗ , (9)
whereωB andωp are the electron gyrofrequency and plasmafrequency, respectively, the subscriptL refers to the valuesin the equatorial plane,e andm are the electron charge andmass, andc is the velocity of light in free space. The parame-terβ∗, proportional to the cold plasma density and character-istic particle energy, determines which fraction of particlesare in resonance: the number of resonant particles increaseswith an increase inβ∗, and forβ∗�1 almost all particles areresonant; the valueω0 corresponds to the lowest frequency ofwhistler waves interacting with electrons having the energyW0. The parabolic approximation for both the magnetic fieldB and cold plasma density distributionnc along the geomag-netic field line near the equatorial region was used, i.e. theproportionalitync∝B was used:
B
BL
=nc
ncL
=
(1 +
z2
a2
), (10)
where z is the coordinate along the magnetic field line,a=
√2R0L/3 is the characteristic scale of the Earth’s mag-
netic field at the magnetic shellL, andR0 is the Earth’s ra-dius.
A more detailed explanation of how the expressions forwave amplification (7) and diffusion coefficient (6), obtainedfrom the full formulation of Bespalov and Trakhtengerts(1986), is given in the Appendix.
3 Numerical results
In this section, we present the results of numerical analysis ofthe model described above. The main attention was paid to
study the dependence of the generation regime on the proper-ties of the energetic particle source (i.e. characteristics of thedistributionFin of drifting particles), such as the shape andamplitude of pitch angle distribution, and on the frequencydependence of the wave dampingR(ω).
The following values for other parameters were used in oursimulations: L=4.4 (fBL≈10.3 kHz),ncL=55 cm−3, andW0=45 keV.
As it was mentioned above, two different mechanisms ofenergetic particle removal from the generation region aretaken into account in the kinetic equation (4). In this paperwe analyse these mechanisms separately, i.e. two cases arestudied: (1) where only losses due to precipitation are signif-icant (in this caseFout≡0 ), and (2) where only drift lossesare taken into account (in this caseδ≡0).
3.1 The case of losses due to precipitation
We performed extensive numerical analysis of this case us-ing various combinations of parameters. According to resultsobtained, the crucial parameter determining the generationregime in the system is the intensity of source, i.e. the num-ber of particles supplied in time unit. A variation in othercharacteristics of the particle source and wave damping af-fect the generation regime much lesser. Thus, for this casewe discuss only the dependence of generation regime on thesource intensity. In particular examples presented below, thesource with moderate pitch angle anisotropy was used:
Fin(µ) = C√
µ, (11)
where the valueC is defined by the normalization condition∫ 1
0Fin
dµ√
1 − µ= n0 (12)
andn0 is energetic electron density. It is convenient to char-acterize the intensity of the source by the value
J0 = v0
∫ 1
0Findµ . (13)
It is equal to the flux of precipitating electrons provided bythe source in the stationary state (i.e. when the number ofprecipitating particles is equal to that supplied by the source).
As a dimensionless characteristic of the source inten-sity, one can use the valuej0=(ντJ )−1, whereτJ =N/J0 isthe time scale of energetic particle supply,N is the num-ber of energetic electrons in the magnetic flux tube, andν=2| ln R|/Tg is the wave damping rate.
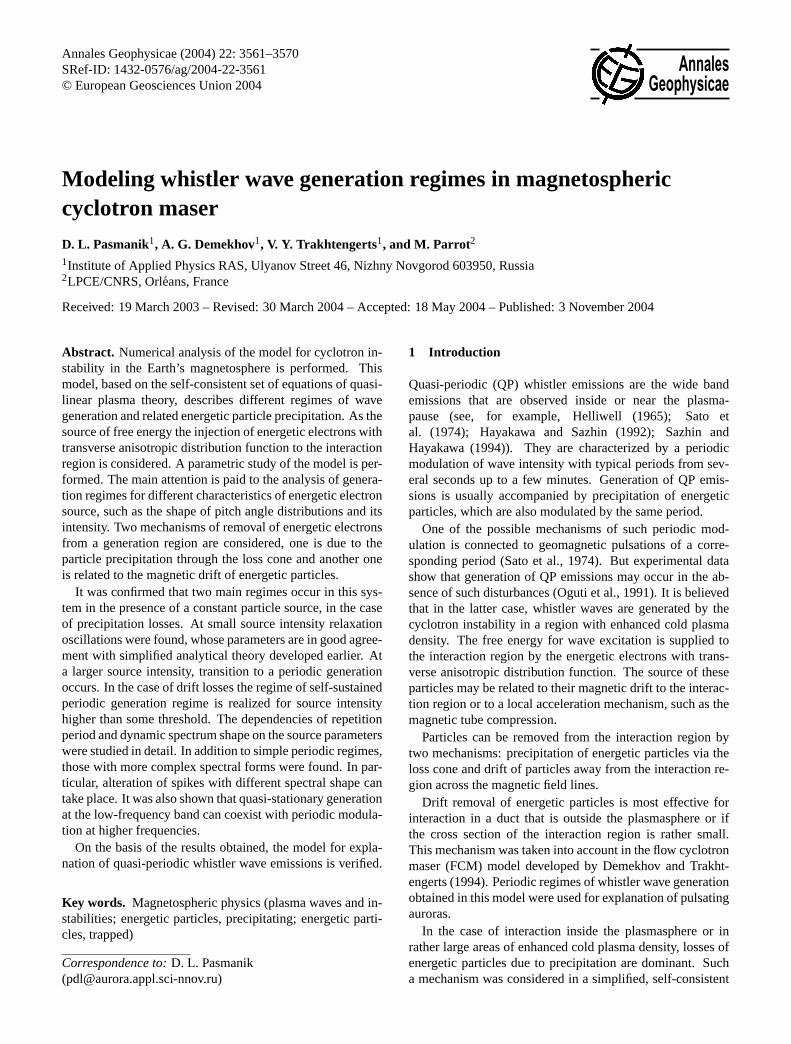
In the case of a weak source, the regime of relaxation os-cillations in wave generation takes place. In this regime, af-ter the system reaches the threshold of the cyclotron insta-bility, several spikes in the wave intensity with diminishingamplitude are generated. After that, the system goes into thestationary generation regime. An example of such a gener-ation regime is presented in Fig. 1. The wave spectrogramis shown on the left panel, and the snapshots of electron dis-tribution function corresponding to the minimum and maxi-mum wave intensity are shown on the right panel.
3564 D. L. Pasmanik et al.: Modeling whistler wave generation regimes
Fre
que
ncy,
Hz
Time
pT
/H
z2
1st flash minimum
1st flash maximum
3rd flash minimum
Source
8
6
4
2
0
F,
arb
. u
nits
0 0.2 0.80.60.4 1
m
Fig. 1. Relaxation oscillations regime in the model with losses due to precipitation. Spectrogram of the wave intensity is on the left panel andsnapshots of pitch angle distribution of energetic electrons in the duct (solid lines) and distribution in the source defined by Eq. (11) (dashedline) are on the right panel, time marks for snapshots are given in the corresponding color at the top of the spectrogram. System parametersareL=4.4,ncL=55 cm−3, W0=45 keV, lnR=2ω/ω0, J0=106 cm−2s−1.
1E+ 5 1E+ 6 1E+ 7
J, cm -2s-1
10.00
100.00
T, s
ec
Tw o- level appoxim at ion
Num erical resu lt
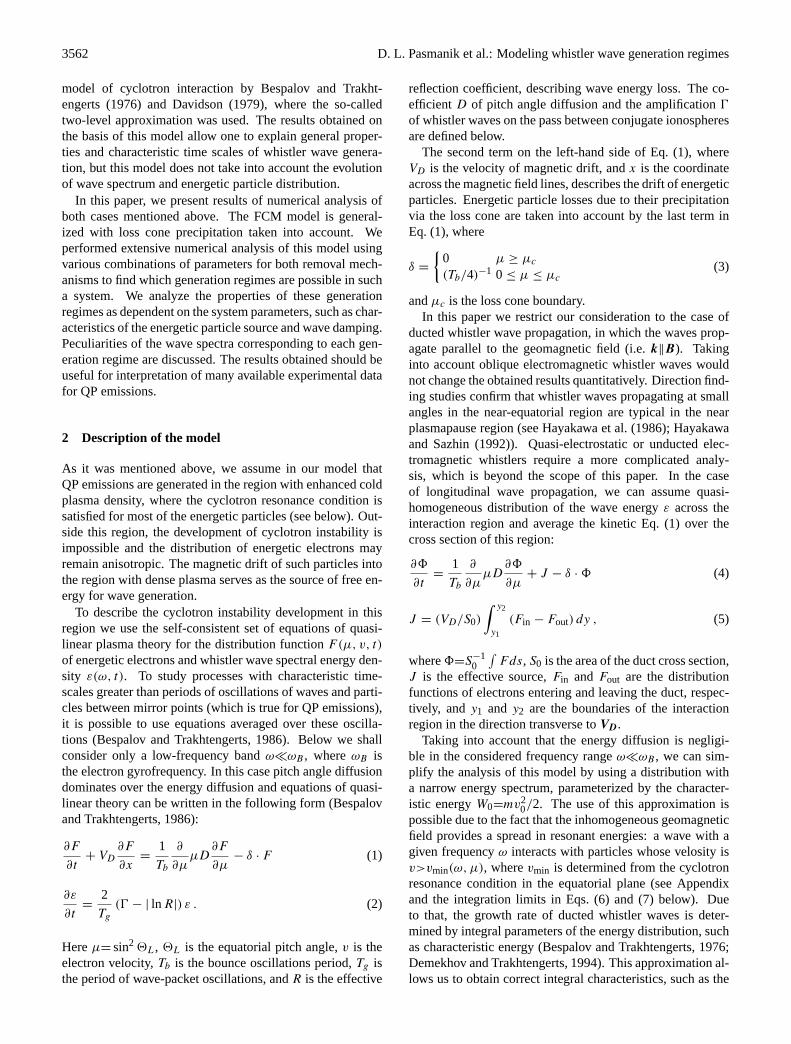
Fig. 2. Dependence of period of relaxation oscillations on the inten-sity of the energetic particle source. Results from simplified “two-level approximation” model and from numerical analysis of the fullsystem Eqs. (1) and (2) are presented. The same system parametervalues (except the source intensity) as in Fig. 1 were used.
As one can see, this generation regime is characterized byalmost constant shapes of the wave spectrum and electronpitch angle distribution, whose amplitudes change in time.With an increase in the source intensity, both the oscillationperiod and the characteristic relaxation time decrease.
A simplified analytical model for such a generation regimehas been developed byBespalov and Trakhtengerts(1976)(see also the reviewBespalov and Trakhtengerts, 1986). Toobtain this model, the so-called two-level approximation isused, where the shapes of wave spectrum and electron pitchangle distribution remain constant in the process of cyclotroninstability development. This assumption allows one to ob-tain from Eq. (1) the system of ordinary differential equationsfor new variables: the numberN of energetic electrons in themagnetic flux tube and the wave energy densityE. Analysisof this simplified model yields the following expression forthe period of relaxation oscillations:
T = 2π
√N0/J0
ln R/Tg
, (14)
whereN0 is the average number of trapped energetic elec-trons in the magnetic flux tube with a unit cross section atthe ionospheric level. We performed a comparison of this re-sult from the simplified model with the results obtained fromthe numerical solution of the full system Eqs. (1)–(2). Asone can see from Fig. 2 these two approaches are in goodagreement.
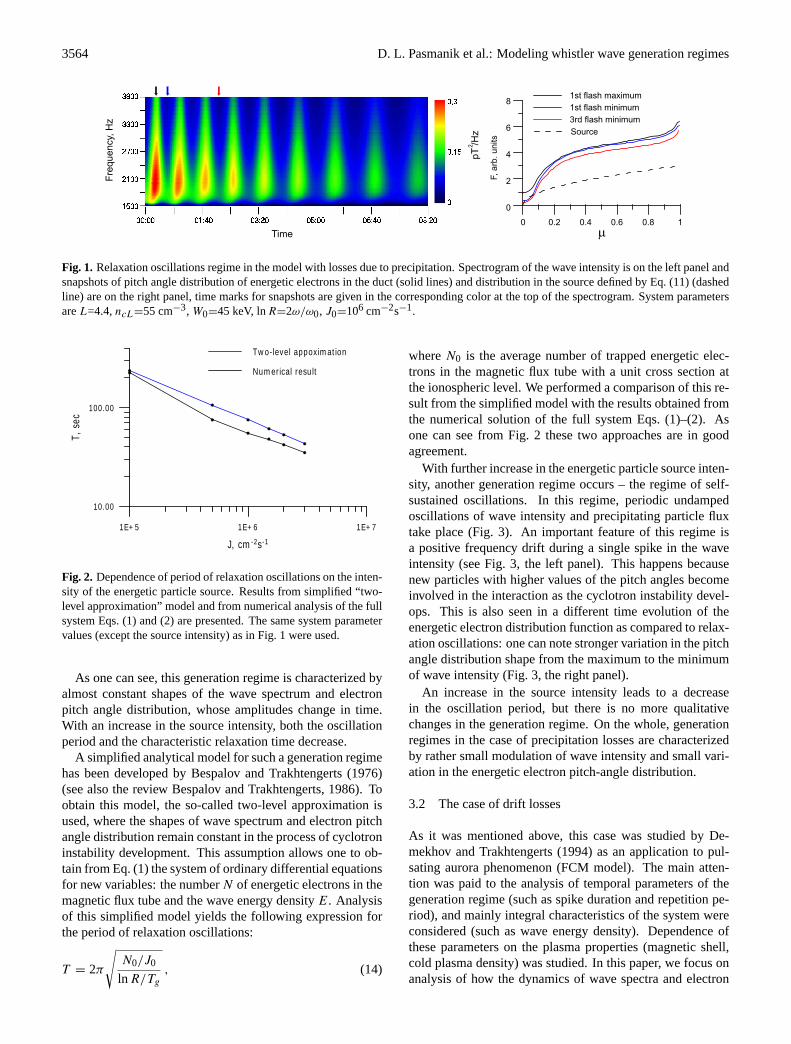
With further increase in the energetic particle source inten-sity, another generation regime occurs – the regime of self-sustained oscillations. In this regime, periodic undampedoscillations of wave intensity and precipitating particle fluxtake place (Fig. 3). An important feature of this regime isa positive frequency drift during a single spike in the waveintensity (see Fig. 3, the left panel). This happens becausenew particles with higher values of the pitch angles becomeinvolved in the interaction as the cyclotron instability devel-ops. This is also seen in a different time evolution of theenergetic electron distribution function as compared to relax-ation oscillations: one can note stronger variation in the pitchangle distribution shape from the maximum to the minimumof wave intensity (Fig. 3, the right panel).
An increase in the source intensity leads to a decreasein the oscillation period, but there is no more qualitativechanges in the generation regime. On the whole, generationregimes in the case of precipitation losses are characterizedby rather small modulation of wave intensity and small vari-ation in the energetic electron pitch-angle distribution.
3.2 The case of drift losses
As it was mentioned above, this case was studied byDe-mekhov and Trakhtengerts(1994) as an application to pul-sating aurora phenomenon (FCM model). The main atten-tion was paid to the analysis of temporal parameters of thegeneration regime (such as spike duration and repetition pe-riod), and mainly integral characteristics of the system wereconsidered (such as wave energy density). Dependence ofthese parameters on the plasma properties (magnetic shell,cold plasma density) was studied. In this paper, we focus onanalysis of how the dynamics of wave spectra and electron
D. L. Pasmanik et al.: Modeling whistler wave generation regimes 3565
Fre
qu
ency
, H
z
Time
2
F,
arb
. u
nits
pT
/H
z
8
6
4
2
0
0 0.2 0.80.60.4 1
m
flash minimum
flash maximum
Source
Fig. 3. Regime of self-sustained oscillations in the case of losses due to precipitation. The source of energetic particles is 10 times greaterthen in Fig. 1 (J0=107cm−2s−1), all other parameters and time marks legend are the same as in Fig. 1.
Frequency
, H
z
Time
pT
/H
z2
0 0.1 0.30.2
m
3
2
1
0
F,
arb
. u
nits
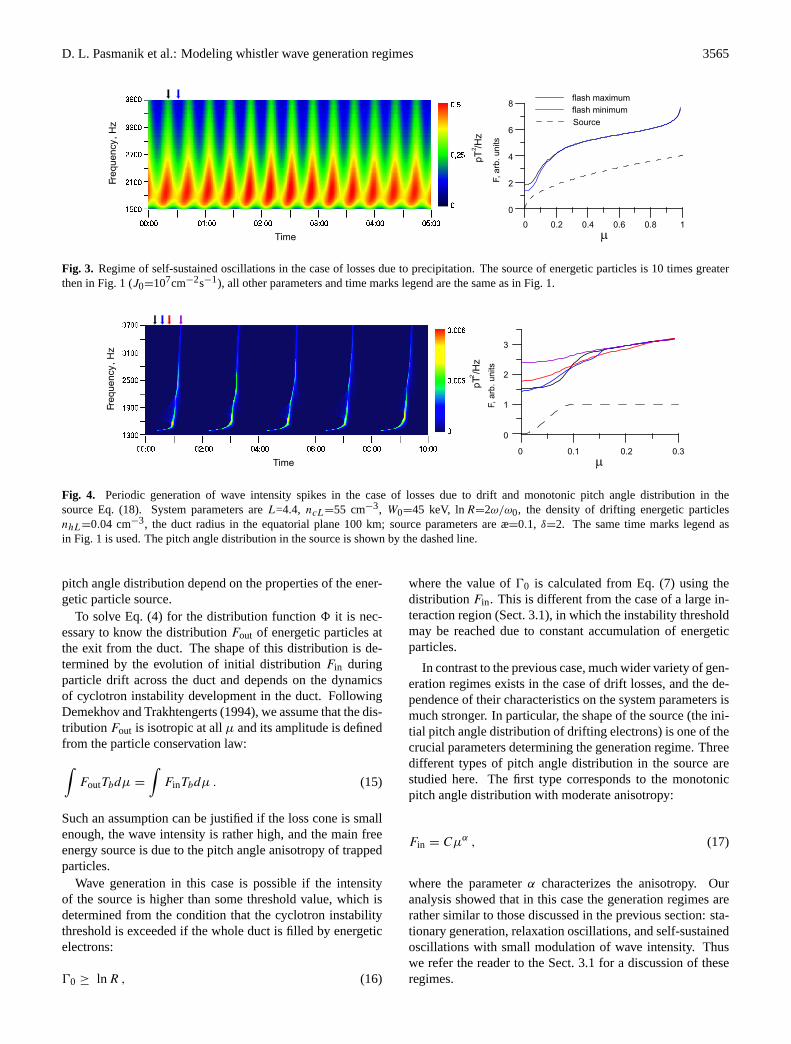
Fig. 4. Periodic generation of wave intensity spikes in the case of losses due to drift and monotonic pitch angle distribution in thesource Eq. (18). System parameters areL=4.4, ncL=55 cm−3, W0=45 keV, lnR=2ω/ω0, the density of drifting energetic particlesnhL=0.04 cm−3, the duct radius in the equatorial plane 100 km; source parameters are æ=0.1, δ=2. The same time marks legend asin Fig. 1 is used. The pitch angle distribution in the source is shown by the dashed line.
pitch angle distribution depend on the properties of the ener-getic particle source.
To solve Eq. (4) for the distribution function8 it is nec-essary to know the distributionFout of energetic particles atthe exit from the duct. The shape of this distribution is de-termined by the evolution of initial distributionFin duringparticle drift across the duct and depends on the dynamicsof cyclotron instability development in the duct. FollowingDemekhov and Trakhtengerts(1994), we assume that the dis-tributionFout is isotropic at allµ and its amplitude is definedfrom the particle conservation law:∫
FoutTbdµ =
∫FinTbdµ . (15)
Such an assumption can be justified if the loss cone is smallenough, the wave intensity is rather high, and the main freeenergy source is due to the pitch angle anisotropy of trappedparticles.
Wave generation in this case is possible if the intensityof the source is higher than some threshold value, which isdetermined from the condition that the cyclotron instabilitythreshold is exceeded if the whole duct is filled by energeticelectrons:
00 ≥ ln R , (16)
where the value of00 is calculated from Eq. (7) using thedistributionFin. This is different from the case of a large in-teraction region (Sect. 3.1), in which the instability thresholdmay be reached due to constant accumulation of energeticparticles.
In contrast to the previous case, much wider variety of gen-eration regimes exists in the case of drift losses, and the de-pendence of their characteristics on the system parameters ismuch stronger. In particular, the shape of the source (the ini-tial pitch angle distribution of drifting electrons) is one of thecrucial parameters determining the generation regime. Threedifferent types of pitch angle distribution in the source arestudied here. The first type corresponds to the monotonicpitch angle distribution with moderate anisotropy:
Fin = Cµα , (17)
where the parameterα characterizes the anisotropy. Ouranalysis showed that in this case the generation regimes arerather similar to those discussed in the previous section: sta-tionary generation, relaxation oscillations, and self-sustainedoscillations with small modulation of wave intensity. Thuswe refer the reader to the Sect. 3.1 for a discussion of theseregimes.
3566 D. L. Pasmanik et al.: Modeling whistler wave generation regimes
Frequency
, H
z
Time
pT
/H
z2
0 0.1 0.30.2
m
12
8
4
0
F,
arb
. u
nits
10
6
2
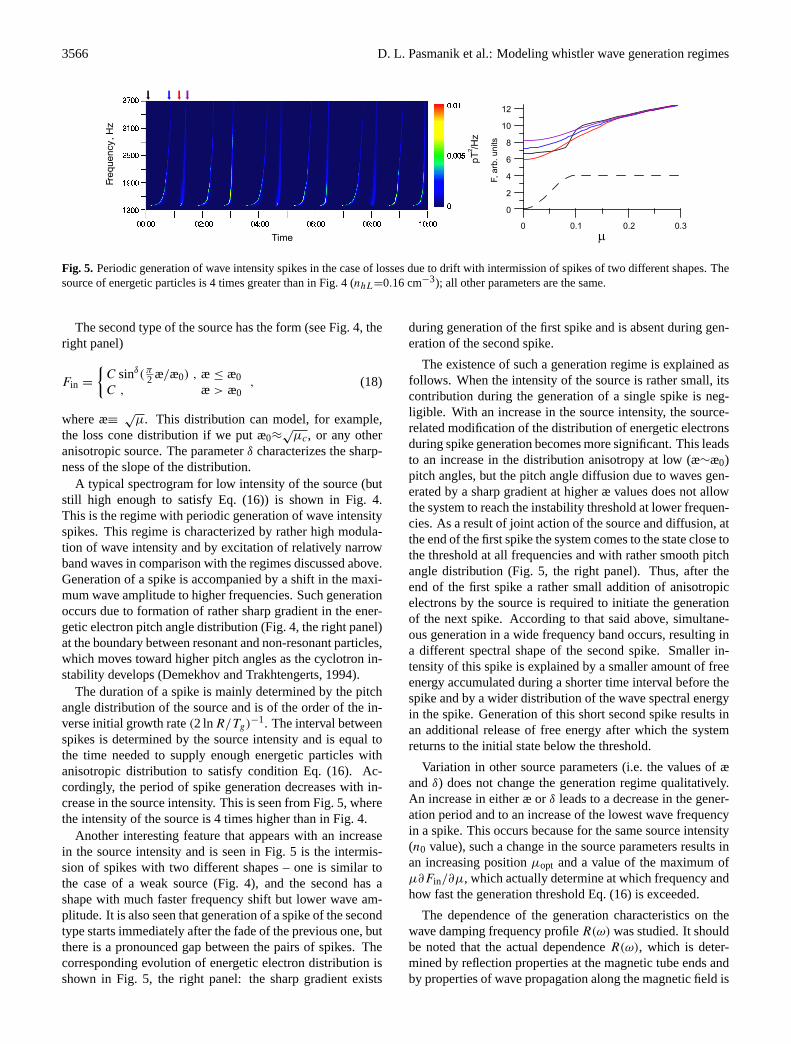
Fig. 5. Periodic generation of wave intensity spikes in the case of losses due to drift with intermission of spikes of two different shapes. Thesource of energetic particles is 4 times greater than in Fig. 4 (nhL=0.16 cm−3); all other parameters are the same.
The second type of the source has the form (see Fig. 4, theright panel)
Fin =
{C sinδ(π
2 æ/æ0) , æ≤ æ0C , æ> æ0
, (18)
where æ≡√
µ. This distribution can model, for example,the loss cone distribution if we put æ0≈
õc, or any other
anisotropic source. The parameterδ characterizes the sharp-ness of the slope of the distribution.
A typical spectrogram for low intensity of the source (butstill high enough to satisfy Eq. (16)) is shown in Fig. 4.This is the regime with periodic generation of wave intensityspikes. This regime is characterized by rather high modula-tion of wave intensity and by excitation of relatively narrowband waves in comparison with the regimes discussed above.Generation of a spike is accompanied by a shift in the maxi-mum wave amplitude to higher frequencies. Such generationoccurs due to formation of rather sharp gradient in the ener-getic electron pitch angle distribution (Fig. 4, the right panel)at the boundary between resonant and non-resonant particles,which moves toward higher pitch angles as the cyclotron in-stability develops (Demekhov and Trakhtengerts, 1994).
The duration of a spike is mainly determined by the pitchangle distribution of the source and is of the order of the in-verse initial growth rate(2 lnR/Tg)
−1. The interval betweenspikes is determined by the source intensity and is equal tothe time needed to supply enough energetic particles withanisotropic distribution to satisfy condition Eq. (16). Ac-cordingly, the period of spike generation decreases with in-crease in the source intensity. This is seen from Fig. 5, wherethe intensity of the source is 4 times higher than in Fig. 4.
Another interesting feature that appears with an increasein the source intensity and is seen in Fig. 5 is the intermis-sion of spikes with two different shapes – one is similar tothe case of a weak source (Fig. 4), and the second has ashape with much faster frequency shift but lower wave am-plitude. It is also seen that generation of a spike of the secondtype starts immediately after the fade of the previous one, butthere is a pronounced gap between the pairs of spikes. Thecorresponding evolution of energetic electron distribution isshown in Fig. 5, the right panel: the sharp gradient exists
during generation of the first spike and is absent during gen-eration of the second spike.
The existence of such a generation regime is explained asfollows. When the intensity of the source is rather small, itscontribution during the generation of a single spike is neg-ligible. With an increase in the source intensity, the source-related modification of the distribution of energetic electronsduring spike generation becomes more significant. This leadsto an increase in the distribution anisotropy at low (æ∼æ0)pitch angles, but the pitch angle diffusion due to waves gen-erated by a sharp gradient at higher æ values does not allowthe system to reach the instability threshold at lower frequen-cies. As a result of joint action of the source and diffusion, atthe end of the first spike the system comes to the state close tothe threshold at all frequencies and with rather smooth pitchangle distribution (Fig. 5, the right panel). Thus, after theend of the first spike a rather small addition of anisotropicelectrons by the source is required to initiate the generationof the next spike. According to that said above, simultane-ous generation in a wide frequency band occurs, resulting ina different spectral shape of the second spike. Smaller in-tensity of this spike is explained by a smaller amount of freeenergy accumulated during a shorter time interval before thespike and by a wider distribution of the wave spectral energyin the spike. Generation of this short second spike results inan additional release of free energy after which the systemreturns to the initial state below the threshold.
Variation in other source parameters (i.e. the values of æandδ) does not change the generation regime qualitatively.An increase in either æ orδ leads to a decrease in the gener-ation period and to an increase of the lowest wave frequencyin a spike. This occurs because for the same source intensity(n0 value), such a change in the source parameters results inan increasing positionµopt and a value of the maximum ofµ∂Fin/∂µ, which actually determine at which frequency andhow fast the generation threshold Eq. (16) is exceeded.
The dependence of the generation characteristics on thewave damping frequency profileR(ω) was studied. It shouldbe noted that the actual dependenceR(ω), which is deter-mined by reflection properties at the magnetic tube ends andby properties of wave propagation along the magnetic field is
D. L. Pasmanik et al.: Modeling whistler wave generation regimes 3567
Frequency
, H
z
Time
pT
/H
z2
3
2
1
0
F,
arb
. u
nits
0 0.1 0.30.2
m
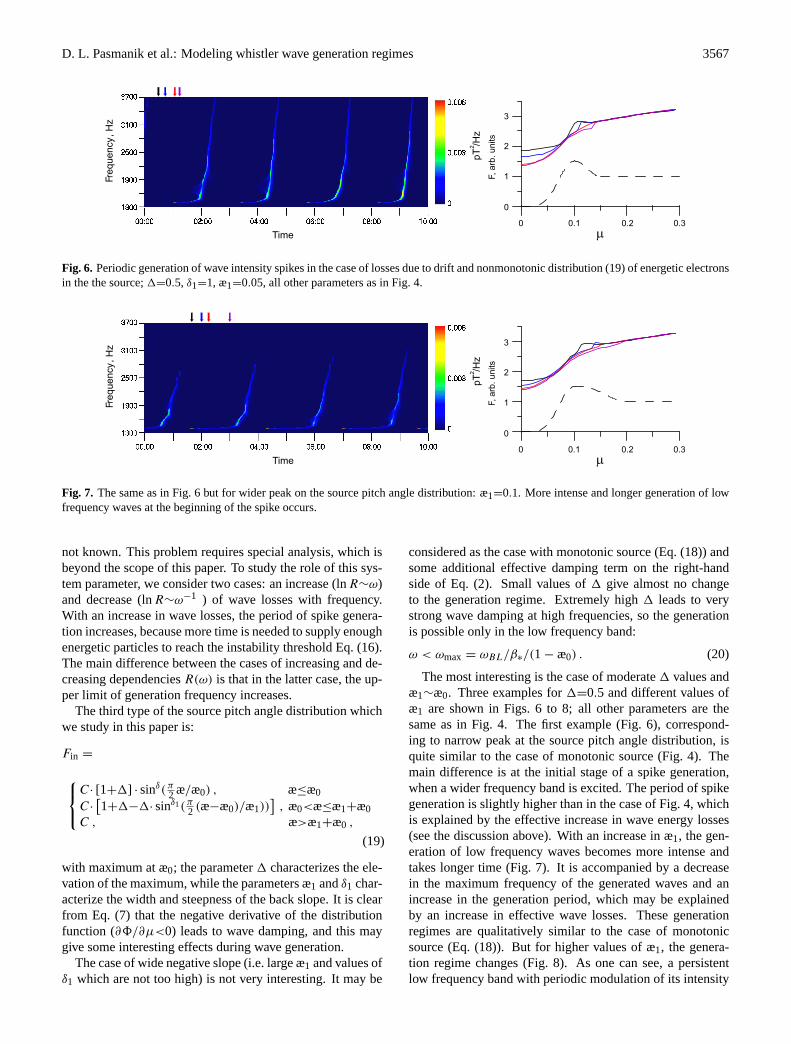
Fig. 6. Periodic generation of wave intensity spikes in the case of losses due to drift and nonmonotonic distribution (19) of energetic electronsin the the source;1=0.5, δ1=1, æ1=0.05, all other parameters as in Fig. 4.
Fre
qu
en
cy
, H
z
Time
pT
/H
z2
3
2
1
0
F, arb
. units
0 0.1 0.30.2
m
Fig. 7. The same as in Fig. 6 but for wider peak on the source pitch angle distribution: æ1=0.1. More intense and longer generation of lowfrequency waves at the beginning of the spike occurs.
not known. This problem requires special analysis, which isbeyond the scope of this paper. To study the role of this sys-tem parameter, we consider two cases: an increase (lnR∼ω)and decrease (lnR∼ω−1 ) of wave losses with frequency.With an increase in wave losses, the period of spike genera-tion increases, because more time is needed to supply enoughenergetic particles to reach the instability threshold Eq. (16).The main difference between the cases of increasing and de-creasing dependenciesR(ω) is that in the latter case, the up-per limit of generation frequency increases.
The third type of the source pitch angle distribution whichwe study in this paper is:
Fin =
C· [1+1] · sinδ(π2 æ/æ0) , æ≤æ0
C·[1+1−1· sinδ1(π
2 (æ−æ0)/æ1))]
, æ0<æ≤æ1+æ0C , æ>æ1+æ0 ,
(19)
with maximum at æ0; the parameter1 characterizes the ele-vation of the maximum, while the parameters æ1 andδ1 char-acterize the width and steepness of the back slope. It is clearfrom Eq. (7) that the negative derivative of the distributionfunction (∂8/∂µ<0) leads to wave damping, and this maygive some interesting effects during wave generation.
The case of wide negative slope (i.e. large æ1 and values ofδ1 which are not too high) is not very interesting. It may be
considered as the case with monotonic source (Eq. (18)) andsome additional effective damping term on the right-handside of Eq. (2). Small values of1 give almost no changeto the generation regime. Extremely high1 leads to verystrong wave damping at high frequencies, so the generationis possible only in the low frequency band:
ω < ωmax = ωBL/β∗/(1 − æ0) . (20)
The most interesting is the case of moderate1 values andæ1∼æ0. Three examples for1=0.5 and different values ofæ1 are shown in Figs. 6 to 8; all other parameters are thesame as in Fig. 4. The first example (Fig. 6), correspond-ing to narrow peak at the source pitch angle distribution, isquite similar to the case of monotonic source (Fig. 4). Themain difference is at the initial stage of a spike generation,when a wider frequency band is excited. The period of spikegeneration is slightly higher than in the case of Fig. 4, whichis explained by the effective increase in wave energy losses(see the discussion above). With an increase in æ1, the gen-eration of low frequency waves becomes more intense andtakes longer time (Fig. 7). It is accompanied by a decreasein the maximum frequency of the generated waves and anincrease in the generation period, which may be explainedby an increase in effective wave losses. These generationregimes are qualitatively similar to the case of monotonicsource (Eq. (18)). But for higher values of æ1, the genera-tion regime changes (Fig. 8). As one can see, a persistentlow frequency band with periodic modulation of its intensity
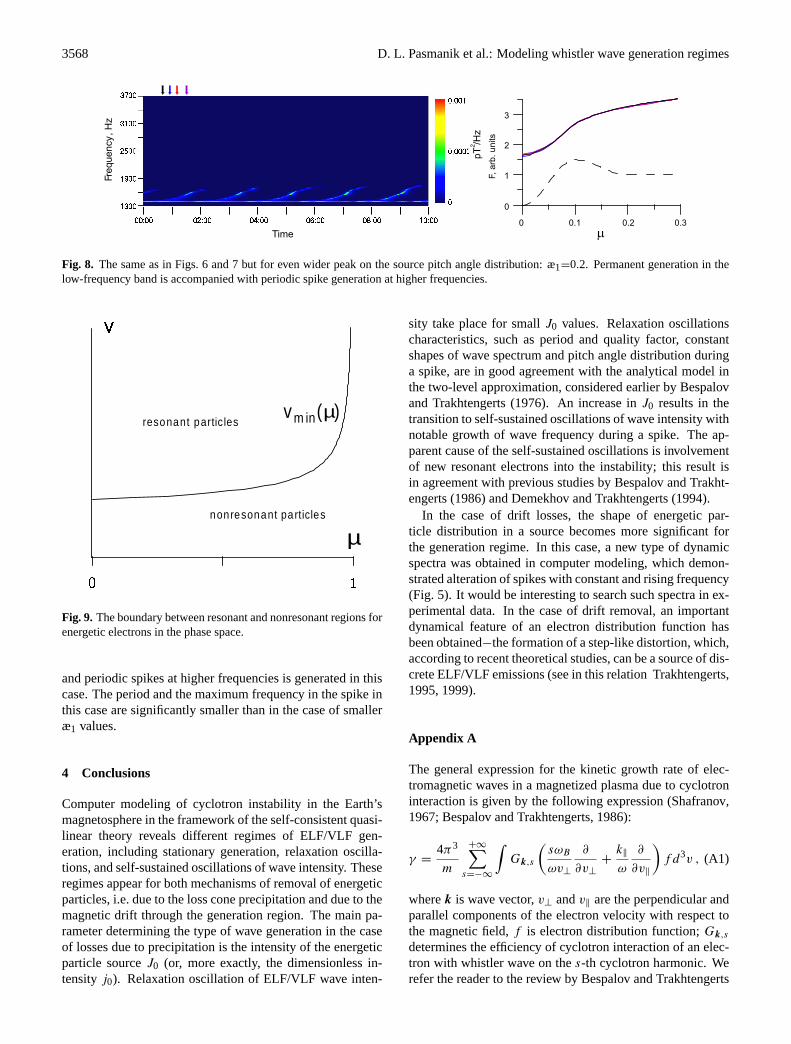
3568 D. L. Pasmanik et al.: Modeling whistler wave generation regimes
Fre
qu
en
cy
, H
z
Time
pT
/H
z2
3
2
1
0
F, arb
. units
0 0.1 0.30.2
m
Fig. 8. The same as in Figs. 6 and 7 but for even wider peak on the source pitch angle distribution: æ1=0.2. Permanent generation in thelow-frequency band is accompanied with periodic spike generation at higher frequencies.
� �
µ
�
vm in(µ)resonant partic les
nonresonant particles
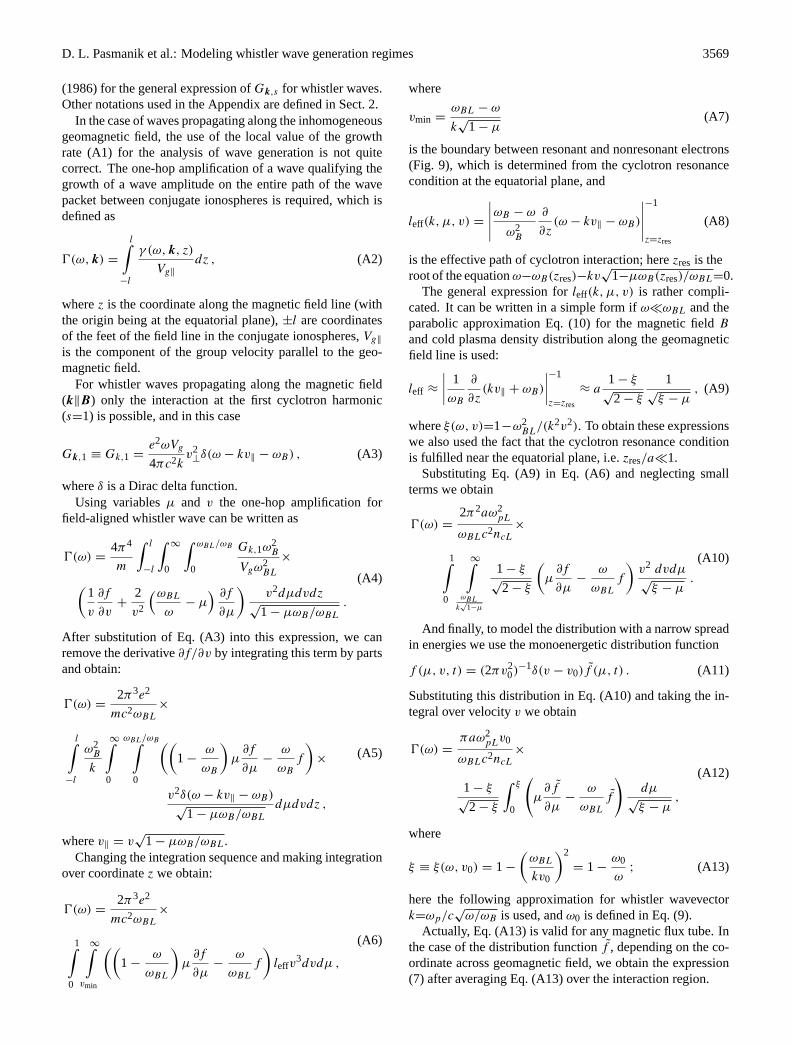
Fig. 9. The boundary between resonant and nonresonant regions forenergetic electrons in the phase space.
and periodic spikes at higher frequencies is generated in thiscase. The period and the maximum frequency in the spike inthis case are significantly smaller than in the case of smalleræ1 values.
4 Conclusions
Computer modeling of cyclotron instability in the Earth’smagnetosphere in the framework of the self-consistent quasi-linear theory reveals different regimes of ELF/VLF gen-eration, including stationary generation, relaxation oscilla-tions, and self-sustained oscillations of wave intensity. Theseregimes appear for both mechanisms of removal of energeticparticles, i.e. due to the loss cone precipitation and due to themagnetic drift through the generation region. The main pa-rameter determining the type of wave generation in the caseof losses due to precipitation is the intensity of the energeticparticle sourceJ0 (or, more exactly, the dimensionless in-tensityj0). Relaxation oscillation of ELF/VLF wave inten-
sity take place for smallJ0 values. Relaxation oscillationscharacteristics, such as period and quality factor, constantshapes of wave spectrum and pitch angle distribution duringa spike, are in good agreement with the analytical model inthe two-level approximation, considered earlier byBespalovand Trakhtengerts(1976). An increase inJ0 results in thetransition to self-sustained oscillations of wave intensity withnotable growth of wave frequency during a spike. The ap-parent cause of the self-sustained oscillations is involvementof new resonant electrons into the instability; this result isin agreement with previous studies byBespalov and Trakht-engerts(1986) andDemekhov and Trakhtengerts(1994).
In the case of drift losses, the shape of energetic par-ticle distribution in a source becomes more significant forthe generation regime. In this case, a new type of dynamicspectra was obtained in computer modeling, which demon-strated alteration of spikes with constant and rising frequency(Fig. 5). It would be interesting to search such spectra in ex-perimental data. In the case of drift removal, an importantdynamical feature of an electron distribution function hasbeen obtained−the formation of a step-like distortion, which,according to recent theoretical studies, can be a source of dis-crete ELF/VLF emissions (see in this relationTrakhtengerts,1995, 1999).
Appendix A
The general expression for the kinetic growth rate of elec-tromagnetic waves in a magnetized plasma due to cyclotroninteraction is given by the following expression (Shafranov,1967; Bespalov and Trakhtengerts, 1986):
γ =4π3
m
+∞∑s=−∞
∫Gk,s
(sωB
ωv⊥
∂
∂v⊥
+k‖
ω
∂
∂v‖
)f d3v , (A1)
wherek is wave vector,v⊥ andv‖ are the perpendicular andparallel components of the electron velocity with respect tothe magnetic field,f is electron distribution function;Gk,s
determines the efficiency of cyclotron interaction of an elec-tron with whistler wave on thes-th cyclotron harmonic. Werefer the reader to the review byBespalov and Trakhtengerts
D. L. Pasmanik et al.: Modeling whistler wave generation regimes 3569
(1986) for the general expression ofGk,s for whistler waves.Other notations used in the Appendix are defined in Sect. 2.
In the case of waves propagating along the inhomogeneousgeomagnetic field, the use of the local value of the growthrate (A1) for the analysis of wave generation is not quitecorrect. The one-hop amplification of a wave qualifying thegrowth of a wave amplitude on the entire path of the wavepacket between conjugate ionospheres is required, which isdefined as
0(ω, k) =
l∫−l
γ (ω, k, z)
Vg‖
dz , (A2)
wherez is the coordinate along the magnetic field line (withthe origin being at the equatorial plane),±l are coordinatesof the feet of the field line in the conjugate ionospheres,Vg‖
is the component of the group velocity parallel to the geo-magnetic field.
For whistler waves propagating along the magnetic field(k‖B) only the interaction at the first cyclotron harmonic(s=1) is possible, and in this case
Gk,1 ≡ Gk,1 =e2ωVg
4πc2kv2⊥δ(ω − kv‖ − ωB) , (A3)
whereδ is a Dirac delta function.Using variablesµ and v the one-hop amplification for
field-aligned whistler wave can be written as
0(ω) =4π4
m
∫ l
−l
∫∞
0
∫ ωBL/ωB
0
Gk,1ω2B
Vgω2BL
×
(1
v
∂f
∂v+
2
v2
(ωBL
ω− µ
) ∂f
∂µ
)v2dµdvdz
√1 − µωB/ωBL
.
(A4)
After substitution of Eq. (A3) into this expression, we canremove the derivative∂f/∂v by integrating this term by partsand obtain:
0(ω) =2π3e2
mc2ωBL
×
l∫−l
ω2B
k
∞∫0
ωBL/ωB∫0
((1 −
ω
ωB
)µ
∂f
∂µ−
ω
ωB
f
)×
v2δ(ω − kv‖ − ωB)√
1 − µωB/ωBL
dµdvdz ,
(A5)
wherev‖ = v√
1 − µωB/ωBL.Changing the integration sequence and making integration
over coordinatez we obtain:
0(ω) =2π3e2
mc2ωBL
×
1∫0
∞∫vmin
((1 −
ω
ωBL
)µ
∂f
∂µ−
ω
ωBL
f
)leffv
3dvdµ ,
(A6)
where
vmin =ωBL − ω
k√
1 − µ(A7)
is the boundary between resonant and nonresonant electrons(Fig. 9), which is determined from the cyclotron resonancecondition at the equatorial plane, and
leff(k, µ, v) =
∣∣∣∣∣ωB − ω
ω2B
∂
∂z(ω − kv‖ − ωB)
∣∣∣∣∣−1
z=zres
(A8)
is the effective path of cyclotron interaction; herezres is theroot of the equationω−ωB(zres)−kv
√1−µωB(zres)/ωBL=0.
The general expression forleff(k, µ, v) is rather compli-cated. It can be written in a simple form ifω�ωBL and theparabolic approximation Eq. (10) for the magnetic fieldB
and cold plasma density distribution along the geomagneticfield line is used:
leff ≈
∣∣∣∣ 1
ωB
∂
∂z(kv‖ + ωB)
∣∣∣∣−1
z=zres
≈ a1 − ξ
√2 − ξ
1√
ξ − µ, (A9)
whereξ(ω, v)=1−ω2BL/(k2v2). To obtain these expressions
we also used the fact that the cyclotron resonance conditionis fulfilled near the equatorial plane, i.e.zres/a�1.
Substituting Eq. (A9) in Eq. (A6) and neglecting smallterms we obtain
0(ω) =2π2aω2
pL
ωBLc2ncL
×
1∫0
∞∫ωBL
k√
1−µ
1 − ξ√
2 − ξ
(µ
∂f
∂µ−
ω
ωBL
f
)v2 dvdµ√
ξ − µ.
(A10)
And finally, to model the distribution with a narrow spreadin energies we use the monoenergetic distribution function
f (µ, v, t) = (2πv20)−1δ(v − v0)f (µ, t) . (A11)
Substituting this distribution in Eq. (A10) and taking the in-tegral over velocityv we obtain
0(ω) =πaω2
pLv0
ωBLc2ncL
×
1 − ξ√
2 − ξ
∫ ξ
0
(µ
∂f
∂µ−
ω
ωBL
f
)dµ
√ξ − µ
,
(A12)
where
ξ ≡ ξ(ω, v0) = 1 −
(ωBL
kv0
)2
= 1 −ω0
ω; (A13)
here the following approximation for whistler wavevectork=ωp/c
√ω/ωB is used, andω0 is defined in Eq. (9).
Actually, Eq. (A13) is valid for any magnetic flux tube. Inthe case of the distribution functionf , depending on the co-ordinate across geomagnetic field, we obtain the expression(7) after averaging Eq. (A13) over the interaction region.
3570 D. L. Pasmanik et al.: Modeling whistler wave generation regimes
A similar technique is used to obtain Eq. (6) for diffusioncoefficient. It includes averaging of the general expression(seeBespalov and Trakhtengerts(1986)) over the bounce os-cillations of electrons and the use of approximation forleff(A9).
Acknowledgements.This work was supported by Russian Founda-tion for Basic Research (grant No. 02-02-17109) and INTAS (grantNo. 99-00502). D. L. Pasmanik and A. G. Demekhov was partiallysupported by the Commission on young scientists of the RussianAcademy of Science.
Topical Editor T. Pulkkinen thanks two referees for their help inevaluating this paper.
References
Bespalov, P. A. and Trakhtengerts, V. Y.: The dynamics of the cy-clotron instability in a magnetic trap, Fizika Plazmy, 2, 397–406,1976.
Bespalov, P. A. and Trakhtengerts, V. Y.: The cyclotron instability inthe Earth radiation belts, in: Reviews of Plasma Physics, editedby Leontovich, M. A., vol. 10, Plenum, New York, 155–192,1986.
Davidson, G. T.: Self-modulated VLF wave-electron interactions inthe magnetosphere: A cause of auroral pulsations, J. Geophys.Res., 84, 6517–6523, 1979.
Demekhov, A. G. and Trakhtengerts, V. Y.: A mechanism of for-mation of pulsating aurorae, J. Geophys. Res., 99, 5831–5841,1994.
Hayakawa, M. and Sazhin, S. S.: Mid-latitude and plasmaspherichiss: A review, Planet. Space Sci., 40, 1325–1338, 1992.
Hayakawa, M., Ohmi, N., Parrot, M., and Lefeuvre, F.: Directionfinding of ELF hiss emissions in a detached plasma region of themagnetosphere, J. Geophys. Res., 91, 135–141, 1986.
Helliwell, R. A.: Whistlers and Related Ionospheric Phenomena,Stanford Univ. Press, Palo Alto, California, 1965.
Oguti, T., Hayashi, K., Yamamoto, T., Ishida, I., Higuchi, T., andNishitani, T.,: Absence of hydromagnetic waves in the magne-tospheric equatorial region conjugate with pulsating auroras, J.Geophys. Res., 96, 13 711–13 715, 1991.
Sato, N., Hayashi, K., Kokubun, S., Oguti, T., and Fukunishi,H.: Relationship between quasi-periodiv VLF-emission and geo-magnetic pulsation, J. Atmos. Terr. Phys., 36, 1515–1526, 1974.
Sazhin, S. S. and Hayakawa, M.: Periodic and quasiperiodic VLFemissions, J. Atmos. Terr. Phys., 56, 735–753, 1994.
Shafranov, V. D.: Electromagnetic waves in plasma, in: Reviewsof Plasma Physics, edited by Leontovich, M. A., vol. 3, 140,Consultants Bureau, New York, 1967.
Trakhtengerts, V. Y.: Magnetosphere cyclotron maser: Back-ward wave oscillator generation regime, J. Geophys. Res., 100,17 205–17 210, 1995.
Trakhtengerts, V. Y.: A generation mechanism for chorus emission,Ann. Geophys., 17, 95–100, 1999.