modeling low carbon scenarios for the european power · pdf filem o dell ing the lowest - cost...
TRANSCRIPT
NTNU investment model for European power Study I Study II Study III Conclusions
Modeling low carbon scenarios for theEuropean power sector
Christian Skar and Asgeir Tomasgard
NTNU � Trondheim
Norwegian University of
Science and Technology
Department of Industrial Economics and Technology Management
CREE model forum April, 2016

NTNU investment model for European power Study I Study II Study III Conclusions
EMPIRE
EMPIRE: European Model for Power system Investments with Renewable Energy
Capacity expansion model for the European power market
Investments are made under uncertainty about operational conditions
Embedded calculation of hourly optimal system operation
Five year time steps
Developed at NTNU
NTNU investment model for European power Study I Study II Study III Conclusions
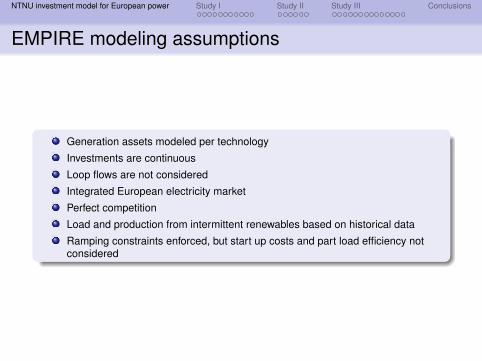
EMPIRE modeling assumptions
Generation assets modeled per technology
Investments are continuous
Loop flows are not considered
Integrated European electricity market
Perfect competition
Load and production from intermittent renewables based on historical data
Ramping constraints enforced, but start up costs and part load efficiency notconsidered
NTNU investment model for European power Study I Study II Study III Conclusions
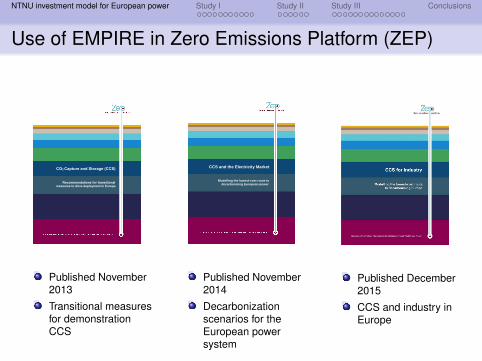
Use of EMPIRE in Zero Emissions Platform (ZEP)
1
CO2 Capture and Storage (CCS)
Recommendations for transitional measures to drive deployment in Europe
Published November2013
Transitional measuresfor demonstrationCCS
CCS and the Electricity Market Modelling the lowest-cost route to decarbonising European power
Published November2014
Decarbonizationscenarios for theEuropean powersystem
Published December2015
CCS and industry inEurope
NTNU investment model for European power Study I Study II Study III Conclusions
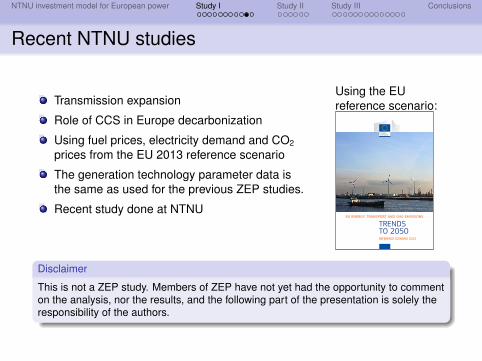
Recent NTNU studies
Transmission expansion
Role of CCS in Europe decarbonization
Using fuel prices, electricity demand and CO2
prices from the EU 2013 reference scenario
The generation technology parameter data isthe same as used for the previous ZEP studies.
Recent study done at NTNU
Using the EUreference scenario:
EU ENERGY, TRANSPORT AND GHG EMISSIONS
TRENDS TO 2050REFERENCE SCENARIO 2013
Disclaimer
This is not a ZEP study. Members of ZEP have not yet had the opportunity to commenton the analysis, nor the results, and the following part of the presentation is solely theresponsibility of the authors.
NTNU investment model for European power Study I Study II Study III Conclusions
Decarbonizing European power (carbon price)
ReferenceSkar, C., G. L. Doorman, G. A. Pérez-Valdés, and A.Tomasgard. 2016. “A multi-horizon stochastic programmingmodel for the European power system.” CenSES WorkingPaper, March 2016.
NTNU investment model for European power Study I Study II Study III Conclusions
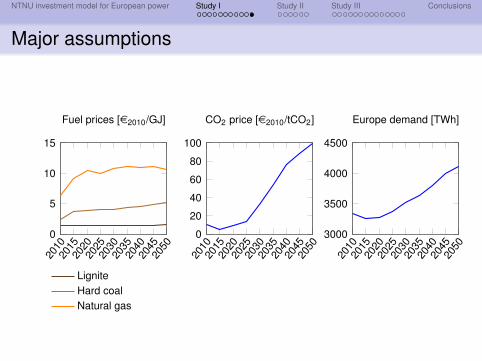
Major assumptions20
1020
1520
2020
2520
3020
3520
4020
4520
50
0
5
10
15
Fuel prices [e2010/GJ]
LigniteHard coalNatural gas
2010
2015
2020
2025
2030
2035
2040
2045
2050
0
20
40
60
80
100
CO2 price [e2010/tCO2]
2010
2015
2020
2025
2030
2035
2040
2045
2050
3000
3500
4000
4500
Europe demand [TWh]
NTNU investment model for European power Study I Study II Study III Conclusions
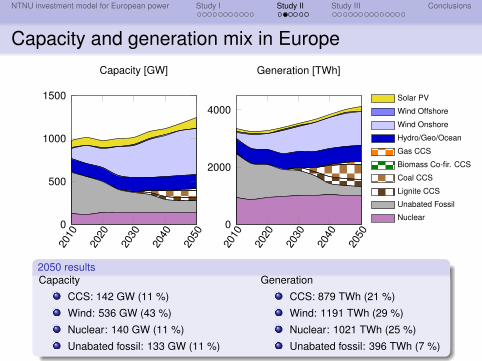
Capacity and generation mix in Europe20
10
2020
2030
2040
2050
0
500
1000
1500
Capacity [GW]
2010
2020
2030
2040
2050
0
2000
4000
Generation [TWh]
Solar PV
Wind Offshore
Wind Onshore
Hydro/Geo/Ocean
Gas CCS
Biomass Co-fir. CCS
Coal CCS
Lignite CCS
Unabated Fossil
Nuclear
2050 resultsCapacity
CCS: 142 GW (11 %)
Wind: 536 GW (43 %)
Nuclear: 140 GW (11 %)
Unabated fossil: 133 GW (11 %)
Generation
CCS: 879 TWh (21 %)
Wind: 1191 TWh (29 %)
Nuclear: 1021 TWh (25 %)
Unabated fossil: 396 TWh (7 %)
NTNU investment model for European power Study I Study II Study III Conclusions
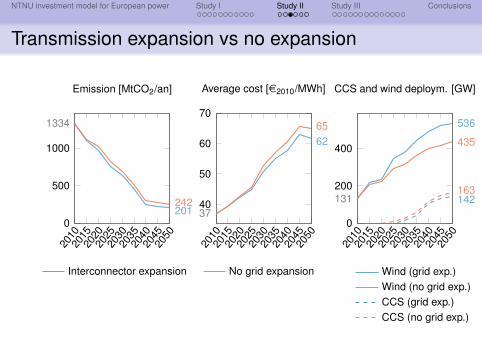
Transmission expansion vs no expansion20
1020
1520
2020
2520
3020
3520
4020
4520
50
0
500
1000
1334
201242
Emission [MtCO2/an]
Interconnector expansion No grid expansion
2010
2015
2020
2025
2030
2035
2040
2045
2050
40
50
60
70
37
6265
Average cost [e2010/MWh]
2010
2015
2020
2025
2030
2035
2040
2045
2050
0
200
400
131 142163
536
435
CCS and wind deploym. [GW]
Wind (grid exp.)Wind (no grid exp.)CCS (grid exp.)CCS (no grid exp.)
NTNU investment model for European power Study I Study II Study III Conclusions
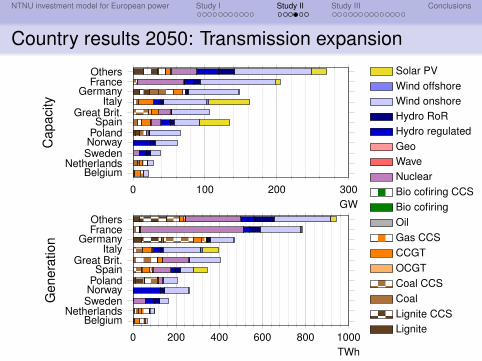
Country results 2050: Transmission expansion
0 100 200 300GW
OthersFrance
GermanyItaly
Great Brit.Spain
PolandNorwaySweden
NetherlandsBelgium
Cap
acity
Solar PVWind offshoreWind onshoreHydro RoRHydro regulatedGeoWaveNuclearBio cofiring CCSBio cofiringOilGas CCSCCGTOCGTCoal CCSCoalLignite CCSLignite
0 200 400 600 800 1000TWh
OthersFrance
GermanyItaly
Great Brit.Spain
PolandNorwaySweden
NetherlandsBelgium
Gen
erat
ion
NTNU investment model for European power Study I Study II Study III Conclusions
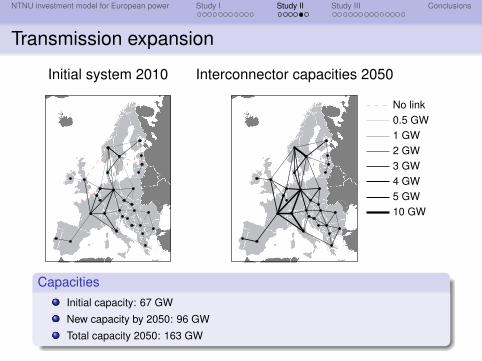
Transmission expansion
Initial system 2010 Interconnector capacities 2050
No link0.5 GW1 GW2 GW3 GW4 GW5 GW10 GW
CapacitiesInitial capacity: 67 GW
New capacity by 2050: 96 GW
Total capacity 2050: 163 GW
NTNU investment model for European power Study I Study II Study III Conclusions
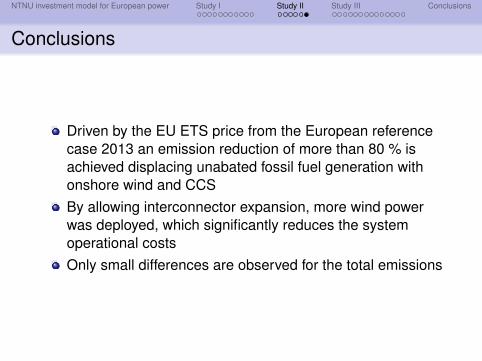
Conclusions
Driven by the EU ETS price from the European referencecase 2013 an emission reduction of more than 80 % isachieved displacing unabated fossil fuel generation withonshore wind and CCSBy allowing interconnector expansion, more wind powerwas deployed, which significantly reduces the systemoperational costsOnly small differences are observed for the total emissions

NTNU investment model for European power Study I Study II Study III Conclusions
The role of CCS in Europe and support policies
ReferenceSkar, C., G. L. Doorman, G. Guidati, C. Soothill, and A.Tomasgard. 2016. “Modeling transitional measures to driveCCS deployment in the European power sector.” CenSESWorking Paper, March 2016.

NTNU investment model for European power Study I Study II Study III Conclusions
Carbon catpure and storage cost and technologicaldata
CCS assumptions
2025 2030 2035 2040 2045 2050Capital cost [e2010/kW]Lignite CCS 2600 2530 2470 2400 2330 2250Coal CCS 2500 2430 2370 2300 2230 2150Gas CCS 1350 1330 1310 1290 1270 1250Efficiency [%]Lignite CCS 37 39 40 41 42 43Coal CCS 39 40 41 41 42 43Gas CCS 52 54 56 57 58 60CCS T&S cost [e2010/tCO2] 19 18 17 15 14 13
NTNU investment model for European power Study I Study II Study III Conclusions
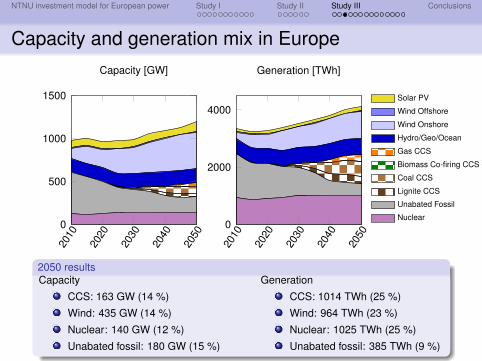
Capacity and generation mix in Europe20
10
2020
2030
2040
2050
0
500
1000
1500
Capacity [GW]
2010
2020
2030
2040
2050
0
2000
4000
Generation [TWh]
Solar PV
Wind Offshore
Wind Onshore
Hydro/Geo/Ocean
Gas CCS
Biomass Co-firing CCS
Coal CCS
Lignite CCS
Unabated Fossil
Nuclear
2050 resultsCapacity
CCS: 163 GW (14 %)
Wind: 435 GW (14 %)
Nuclear: 140 GW (12 %)
Unabated fossil: 180 GW (15 %)
Generation
CCS: 1014 TWh (25 %)
Wind: 964 TWh (23 %)
Nuclear: 1025 TWh (25 %)
Unabated fossil: 385 TWh (9 %)

NTNU investment model for European power Study I Study II Study III Conclusions
CO2 emissions, power price and 2050 annual costs20
1020
1520
2020
2520
3020
3520
4020
4520
50
0
500
1000
1334
243
Emission [MtCO2/an]
Baseline
2010
2015
2020
2025
2030
2035
2040
2045
2050
60
80
100
45
80
Power price [e2010/MWh]
Baseli
ne
0
50
100
150
200
250
300
2050 costs [bne2010/an]
Capital andfix. O&MFuel andvar. O&MEUACCS T&S
NTNU investment model for European power Study I Study II Study III Conclusions
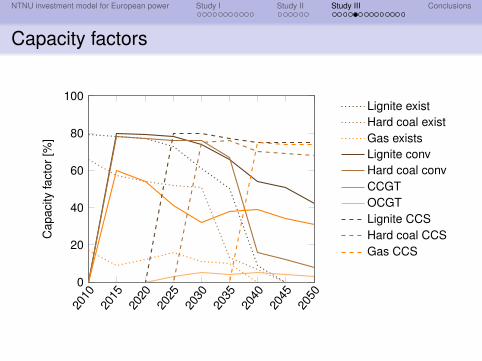
Capacity factors
2010
2015
2020
2025
2030
2035
2040
2045
2050
0
20
40
60
80
100
Cap
acity
fact
or[%
]
Lignite existHard coal existGas existsLignite convHard coal convCCGTOCGTLignite CCSHard coal CCSGas CCS
NTNU investment model for European power Study I Study II Study III Conclusions
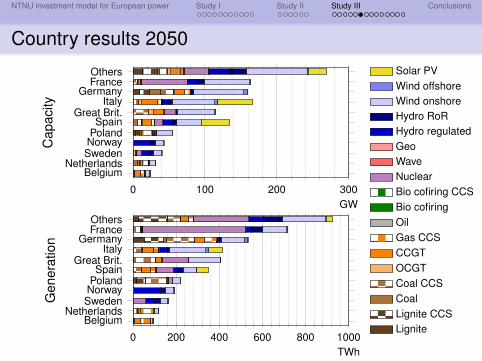
Country results 2050
0 100 200 300GW
OthersFrance
GermanyItaly
Great Brit.Spain
PolandNorwaySweden
NetherlandsBelgium
Cap
acity
Solar PVWind offshoreWind onshoreHydro RoRHydro regulatedGeoWaveNuclearBio cofiring CCSBio cofiringOilGas CCSCCGTOCGTCoal CCSCoalLignite CCSLignite
0 200 400 600 800 1000TWh
OthersFrance
GermanyItaly
Great Brit.Spain
PolandNorwaySweden
NetherlandsBelgium
Gen
erat
ion

NTNU investment model for European power Study I Study II Study III Conclusions
Motivation
What if we cannot use CCS?
Nuclear has a public relations issue in EuropeOnly leaves renewable energies as low carbon solutionWhat is the cost?
NTNU investment model for European power Study I Study II Study III Conclusions
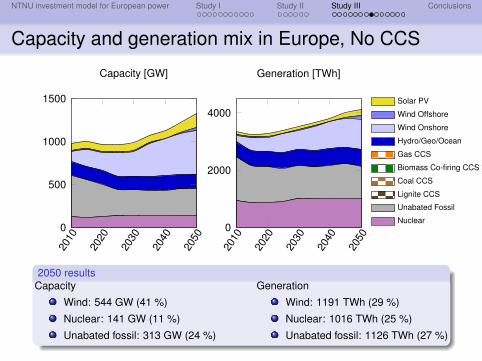
Capacity and generation mix in Europe, No CCS20
10
2020
2030
2040
2050
0
500
1000
1500
Capacity [GW]
2010
2020
2030
2040
2050
0
2000
4000
Generation [TWh]
Solar PV
Wind Offshore
Wind Onshore
Hydro/Geo/Ocean
Gas CCS
Biomass Co-firing CCS
Coal CCS
Lignite CCS
Unabated Fossil
Nuclear
2050 resultsCapacity
Wind: 544 GW (41 %)
Nuclear: 141 GW (11 %)
Unabated fossil: 313 GW (24 %)
Generation
Wind: 1191 TWh (29 %)
Nuclear: 1016 TWh (25 %)
Unabated fossil: 1126 TWh (27 %)

NTNU investment model for European power Study I Study II Study III Conclusions
Comparison: CO2 emissions, power price and 2050annual costs
2010
2015
2020
2025
2030
2035
2040
2045
2050
0
500
1000
1334
243
496
Emission [MtCO2/an]
BaselineNoCCS
2010
2015
2020
2025
2030
2035
2040
2045
2050
60
80
100
45
8088
Power price [e2010/MWh]
Baseli
neNoC
CS
0
50
100
150
200
250
300
2050 costs [bne2010/an]
Capital andfix. O&MFuel andvar. O&MEUACCS T&S
NTNU investment model for European power Study I Study II Study III Conclusions
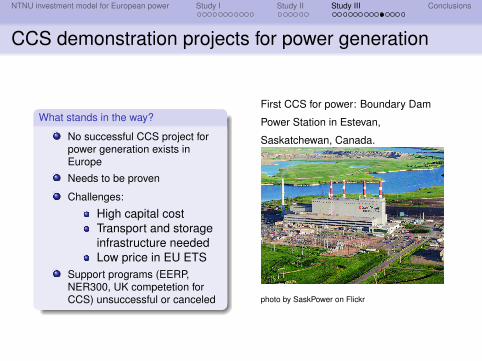
CCS demonstration projects for power generation
What stands in the way?
No successful CCS project forpower generation exists inEurope
Needs to be proven
Challenges:
High capital costTransport and storageinfrastructure neededLow price in EU ETS
Support programs (EERP,NER300, UK competetion forCCS) unsuccessful or canceled
First CCS for power: Boundary Dam
Power Station in Estevan,
Saskatchewan, Canada.
photo by SaskPower on Flickr

NTNU investment model for European power Study I Study II Study III Conclusions
Transitional measures to inscentivize demonstrationprojects
Demonstration CCS
Project Capital cost Efficiency Post-demo
Capital cost Efficiency
Until 2020 [e2010/kW] [%] 2025 [e2010/kW] [%]Lignite CCS 2600 31 2600 37Coal CCS 2500 33 2500 39Gas CCS 1350 48 1350 52
Schemes evaluated
Capital grants
Feed-in premiums
Emission performance standard

NTNU investment model for European power Study I Study II Study III Conclusions
Capital grants (CAPEX support)
Design: given share of the capital costs covered
Different levels tried
Result: a support level of 2000 e2010/kW needed to spurinvestments
Result: 4.1 GW of lignite CCS deployed. Cost: 6.5 bne(2015NPV)

NTNU investment model for European power Study I Study II Study III Conclusions
Feed-in premiums (OPEX support)
TypeFlat SRMC End Gas Lignite Total 2015 NPV LCOS
[e/MWh] [%] [GW] [GW] [GW] [bne] [e/MWh]45.0 2030 No deployment50.0 2030 1.9∗ 1.9 6.6 40.055.0 2030 5.0∗ 5.0 20.9 43.730.0 2050 No deployment35.0 2050 5.0 5.0 12.6 31.3
20.0 2030 No deployment25.0 2030 4.1 4.1 6.2 15.810.0 2050 No deployment15.0 2050 2.8 2.8 4.0 15.017.5 2050 4.1 4.1 6.6 17.520.0 2050 5.0 5.0 9.4 20.020.0 2030 No deployment
(L) 15.0 (G) 32.5 2050 1.2 2.8 4.1 6.9 18.8(L) 17.5 (G) 32.5 2050 0.9 4.1 5.0 8.7 18.8
SRMC: short-run marginal costFuel + variable O&M + carbon price + CCS transport and storageDetermines the dispatch!(L) – lignite CCS, (G) – natural gas CCS

NTNU investment model for European power Study I Study II Study III Conclusions
Emission performance standard from 201520
1020
1520
2020
2520
3020
3520
4020
4520
50
0
500
1000
1334
243107
Emission [MtCO2/an]
Baseline 450 gen EPS
225 Euro EPS 225 gen EPS
2010
2015
2020
2025
2030
2035
2040
2045
2050
60
80
100
45
91
8077
Power price [e2010 /MWh]
2010
2015
2020
2025
2030
2035
2040
2045
2050
0
100
200
300
163
339
CCS deployment [GW]
Specific emissions for unabated generation
Coal: 786 gCO2/kWh
Gas CCGT: 336 gCO2/kWh
Gas OCGT: 505 gCO2/kWh
NTNU investment model for European power Study I Study II Study III Conclusions
Conclusions
CCS can be a major contributor to cost-efficientdecarbonization of European powerWithout CCS decarbonization will be more expensive –even for less emission reductionSupport schemes needed to secure deployment ofdemonstration CCS
CAPEX support can help CCS with low fuel costsOPEX support needed for gas CCS
Emissions performance standard (EPS) is an effectiveemission reduction mechanism
A limit of 225 gCO2/kWh for generators drive down emissionsResults in a transitional period with high prices
NTNU investment model for European power Study I Study II Study III Conclusions
Thank you for your attention
Questions?