modeling and experimental validation of nickel-based super...
TRANSCRIPT
Modeling and Experimental validation of Nickel-based super alloy (Inconel 625) made
using Selective Laser Melting
Md Ashabul Anam, Deepankar Pal, Brent Stucker
Department of Industrial Engineering,
J. B. Speed School of Engineering, University of Louisville, Louisville, KY 40292
Abstract
The formation of constituent phases in Selective Laser Melting of Inconel 625 is a function of
local temperatures, hold times at those temperatures, local cooling rates and local compositions
in the melt pool. These variables are directly correlated with input process parameters such as
beam power, scan speed, hatch spacing, beam diameter and thermo-mechanical characteristics of
the powder bed. The effect of these process parameters must be understood in order to properly
control the machines and predict the properties of parts being fabricated. To understand the
effects, IN625 coupons using eight different sets of processing parameters have been fabricated
and microstructure and mechanical properties were compared. These properties will be then used
to validate a dislocation density based crystal plasticity finite element model (DDCP-FEM).
Introduction:
Inconel 625, a nickel based super alloy is characterized by having high tensile, creep and rupture
strength and is widely used because of its excellent fatigue and good oxidation resistance
properties. However, excessive tool wear and low material removal rate make it difficult to
manufacture by conventional machining methods at room temperature. Selective laser melting
(SLM) therefore becomes a good solution for complex IN625 parts. SLM involves directional
solidification concepts as well as novel prospects for microstructure control through the
development of scanning strategies or related process variables such as local temperature, hold
time at temperature, local cooling rate and local compositions in the melt-pool. These features
produce solidification cooling rate and thermal gradient phenomena which contribute to
microstructure and microstructural architecture development and resulting mechanical properties
[1-2]. The effect of each process parameter on the resulting microstructure and mechanical
properties must be understood in order to properly control the machines and predict the
properties of the parts being fabricated.
To predict the mesoscopic effect such as local and global strength, modified grain morphologies
and other layer by layer interfacial characteristics on the end part, a homogenized form of the
Dislocation Density based Crystal Plasticity Finite Element Model (DDCP-FEM) will be used.
Information from an IN625 CCT diagram along with build part geometry information from the
STL file and thermo-mechanical boundary conditions of the SLM process will be used as input
parameters to the model.
To validate the model a series of experiments on IN625 with SLM need to be performed. These
experiments include IN625 powder characterization, parameter optimization for successful
coupon fabrication, capturing temperature distributions near the molten pool, microstructural
characterization and mechanical testing. Mechanical test and microstructural results will be used
to create a structure-property correlation which will be matched with the model.
463
Materials and experimental procedures
IN625 powder characterization:
In this experiment IN625 powders from EOS have been used. Analysis has been done on the
powder and necessary information gathered to inform the model, including physical and
chemical properties, particle size distribution and density. Chemical composition is shown in
table 1. This composition was verified through EDS analysis. To obtain the particle size
distribution, a Microtrac S3000 particle size analyzer was used. The mean diameter of the
particles is 37.8 microns (mean dia. of volume dist.) with a standard deviation of 12.37 microns,
70 percent of the particles below 40 microns which indicates particles are distributed within a
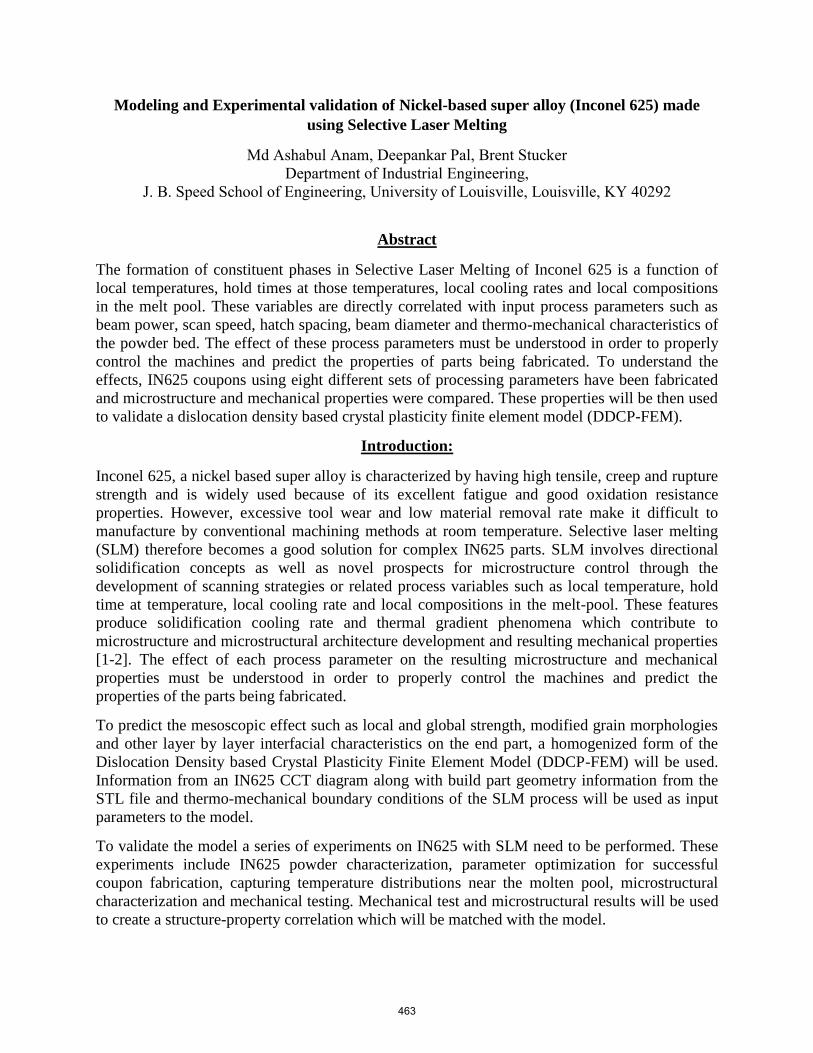
narrow size range and are suitable for SLM processing. Figure 1 shows the morphology of IN625
powder which was captured using scanning electron microscopy (FEI Nova Nano SEM). Both
20 and 40 micron layer thickness have been used to check optimality. Table 3 shows the powder
density measurements which are critical parameter to know as they influence flowability. The
bulk density was found to be 4.351 gm/cc where the tapped density was 5.072 gm/cc. The
Hausner ratio and Carr’s index were also calculated to determine the flow properties of the
powder. The Hausner ratio was 1.166 (< 1.25 indicates that the powder is free flowing). The
Carr’s index was 14.216 which indicates that the powder has good flow properties.
Table 1: Chemical Composition (Wt.%) of IN625 powder
Ni Cr Mo Nb Fe Ti Al Co C Ta Si,Mn P,S
bal.≥
58.00
20.00-
23.00
8.00-
10.00
3.15-
4.15
≤
5.00
≤
0.40
≤
0.40
≤
1.00
≤
0.10
≤
0.05
each ≤
0.50
each ≤
0.015
*Obtained from EOS material data sheet
Table 2: Particle Size Analysis:
Instrument: Microtrac S3000
Summary Value Unit
Mean Dia. of the Volume distribution * 37.78 µm
Mean Dia. of the Number distribution ** 20.05 µm
Mean Dia. of the Area distribution † 31.8 µm
Calculated Specific Surface Area, CS†† 1.89E-01 M²/CC
Standard Deviation, SD 12.37 µm
Table 3: Density measurement:
Material In625 powder
Bulk density , ρB 4.351 gm/cc
Tapped density , ρT 5.072 gm/cc
Hausner Ratio, H, (ρT/ρB) 1.166
Carr Index, C 14.216
464
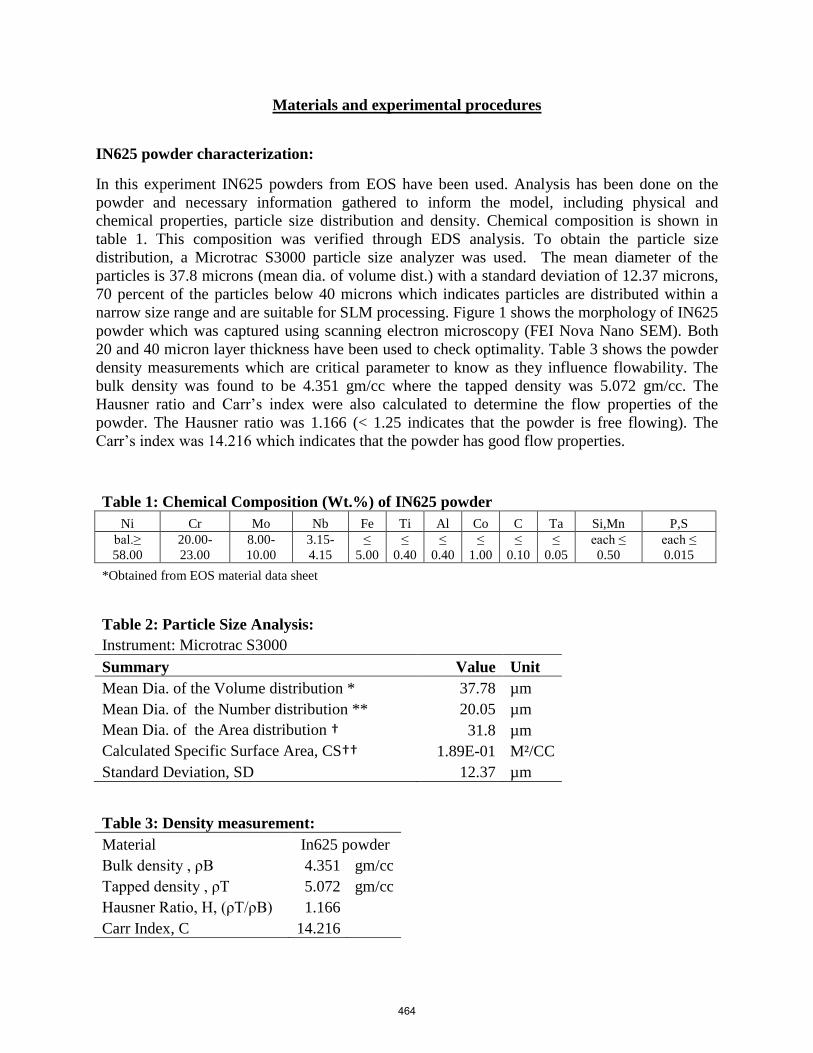
Test coupon fabrication with varying processing parameters:
IN625 test coupons of 5*5*5 mm³ were fabricated using an EOS M270 DMLS machine in
nitrogen atmosphere. Different processing conditions such as scan speed, laser power and scan
strategy have been used to experimentally characterize variance in microstructural and
mechanical behavior. Two sets of parameters defined by constant energy density and varying
energy density were used. Each set contains 4 subsets of parameters of varying laser power
and/or scan speed. Parameter sets are shown in Table 4. Tensile and fatigue bars were also
fabricated for mechanical testing and validation. Both 20 and 40 micron layer thicknesses were
used to build the coupons and the density of as-built parts were compared.
Table 4: Processing parameters of IN625 for an EOS M270 machine:
Parameter set Subset Laser
Power (W)
Scan
Speed
(mm/s)
Spacing
(mm)
1
Constant
Energy
Density
1 195 800 0.1
2 170 697 0.1
3 145 594 0.1
4 120 492 0.1
2
Constant
Laser power,
Varying
Energy
Density
1 195 1100 0.1
2 195 1000 0.1
3 195 900 0.1
4 195 700 0.1
Figure1. SEM image of IN625 powder
465

Density measurement technique:
Density was measured using an Archimedes method. Masses of each coupon in air and water
were measured independently 3 times using an electronic balance with ±1mg accuracy.
Similarly, average masses were calculated by taking means of masses in air and water for each
coupon and denoted using and respectively. The average masses were inserted into the
equation below to obtain coupon density , where is the density of water [6]. Temperature
correction was applied for calculating .
Microstructural characterization:
As-built parts were processed for microstructural characterization. Standard metallographic
specimen preparation methods were followed during specimen preparation. Polished samples
were electrolytically etched for approx. 10 sec. in 7.5 % Oxalic acid solution. Microstructures of
vertical cross sections (Y-Z plane) of 16 samples (8 samples each of 20 and 40 micron layer
thickness) were observed using optical microscopy. Melt-pool overlap, variation and grain size
were the points of interest in the microstructural analysis.
Results and Discussion:
Comparison of density of parts made using 20 and 40 micron layer thickness:
To identify the layer thickness effect, test coupons built using 20 and 40 micron layer thickness
were compared. This comparison was based on as-built part density for coupons fabricated using
195W laser power and 800 mm/s scan speed. Figure 2 below shows the density comparison
between samples of 20 and 40 micron layer thickness.
Figure 2: Density of coupons manufactured using 20 and 40 micron layer thickness with laser
power 195W and scan speed 800mm/s
8.2500
8.3000
8.3500
8.4000
8.4500
8.5000
8.5500
8.6000
40 micron layer samples 20 micron layer samples
Den
sity
(g
m/c
c)
Density for different layer thickness (40 vs 20 µm)
466

From the above figure it can be seen that there is a high variability in density of 40 micron layer
samples where for 20 micron the density data are quite consistent. Based on this initial screening
study, a decision cannot be made on which layer thickness provides higher density. If the three
40 micron outlier data points (marked as red bar) are excluded, however, parts made using 20
µm layer thickness have a consistently higher density than 40 µm layer parts. Thus, further
studies are required to determine whether experimental error led to these outlier data points and
whether there is indeed a large scatter in density. One reason to question these results is that fully
dense IN625 parts have a theoretical density of 8.44 gm/cc [7], which is close to the density of
20 micron SLM parts, giving a theoretical average 8.42 gm/cc, or 99.76%, density.
Image Analysis – Variation of Melt-pool:
Distribution of melt pool has been analyzed using optical microscopy Figure 3.a. shows
micrographs of vertical cross-sections (Y-Z plane) of samples with 20 micron layer thickness
where figure 3.b. shows the same micrograph produced by 40 micron layer thickness. Laser
power was 195W and scan speed was 800 mm/s in both cases.
It is quite clear from the above micrographs that the patterns of melt-pools of 40µm layers are
different from 20µm layers. For 20µm, melt pools are regular in shape and overlap each other
significantly whereas for 40µm, melt pool shape is irregular and are less overlapped. 20µm layer
thickness parts would be expected to have a higher density and better mechanical properties than
40µm layer parts as a result. Fatigue and tensile test bars were manufactured to compare
mechanical properties. In addition, melt-pool comparisons were done for other 20 and 40 micron
layer thickness coupons for the other 7 processing parameters and in general there was better
melt-pool distribution and overlap for 20 micron than 40 micron layer thickness coupons. Melt-
pool overlap was calculated through image analysis for all eight processing parameters and a
comparison is shown in figure 4.
Figure 3.a. Vertical cross-section for layer
thickness 20 micron, Laser Power 800W, Scan
speed 800mm/s.
Figure 3.b. Vertical cross-section for layer
thickness of 40 micron, Laser Power 800W,
Scan speed 800mm/s.
467

Figure 4: Average melt-pool overlap in test samples in Z-direction.
Figure 5: % Average melt-pool overlap in test samples.
Figure 4 above, shows avg. melt-pool overlap in build direction (Z-axis). It is distinguishable
that most of the processing parameters with 20 micron layer thickness have higher melt-pool
overlap than 40 micron except the first one (195W,800 mm/s) but from figure 5, for the same
parameter set (195W, 800mm/s), a higher percentage of melt-pool overlap was found for 20
micron than 40 micron layer thickness. The difference between figure 4 and figure 5 arise due to
0
5
10
15
20
25
30
35
40
45
50
Av
g. M
elt-
po
ol
Ov
erla
p (
µm
)
Laser Power (W)\Scan Speed(mm/s)
Avg. Melt-pool Overlap for Various Processing
Parameters
Average overlap, 40 micron layer
Average overlap, 20 micron layer
0
5
10
15
20
25
30
35
40
45
% A
vg
. M
elt-
po
ol
Ov
erla
p
Laser Power (W)\Scan Speed(mm/s)
% Avg. Melt-pool Overlap for Various Processing
Parameters
% Overlap, 40 micron layer
% Overlap, 20 micron layer
468
uneven melt-pool size. For example, a 30 micron overlap can cast different parcentage overlap
value depending on overall melt-pool depth.
Figure 4 also shows a gradual decrease in overlap as the laser power and scan speed decrease.
Also at high power (195 W) and high scan speed (1000 mm/s) overlap was less. This is due to
excessively high scan speed. The sample prepared using this parameter is expected to have lower
density and less tensile and fatigue strength. Although at constant laser power (195W), melt-pool
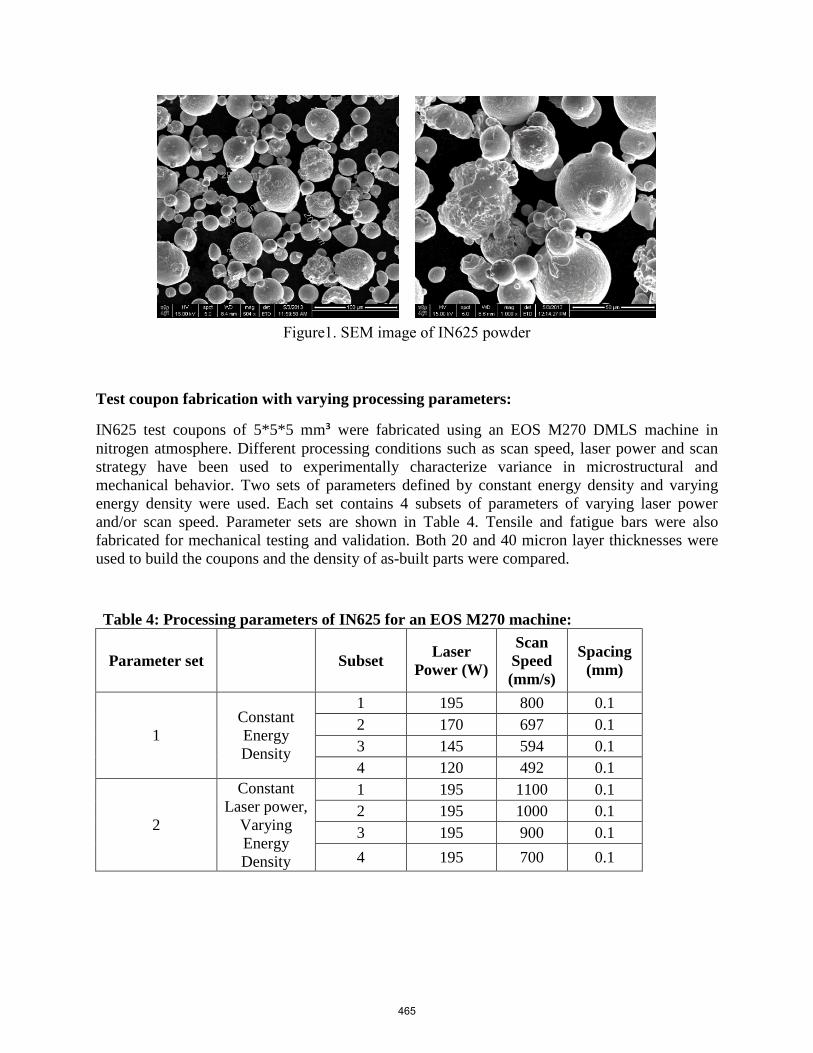
overlap increased with the decrease of scan speed. From the melt-pool data it can be inferred that
195W/800mm/s, 195W/700mm/s and 170w/697mm/s, associated with 20 micron layer thickness,
are the three parameter sets which provide highly dense parts with higher melt-pool overlap.
Figure 6 (a,b,c) shows verticle cross-sections of these 3 parameter sets. As the variability is high
in melt-pool overlap data in figure 4, it is obvious that more experimental data is required before
drawing a conclusion based on overlap data. Also mechanical testing (fatigure, tensile) need
finished to support any conclusions.
Fig. 6 (a,b,c) LOM image of vertical section of 20 micron layer thickness of (a) 190W/800mm/s,
(b) 170W/697mm/s, (c) 190W/700mm/s
Mechanical testing and validation:
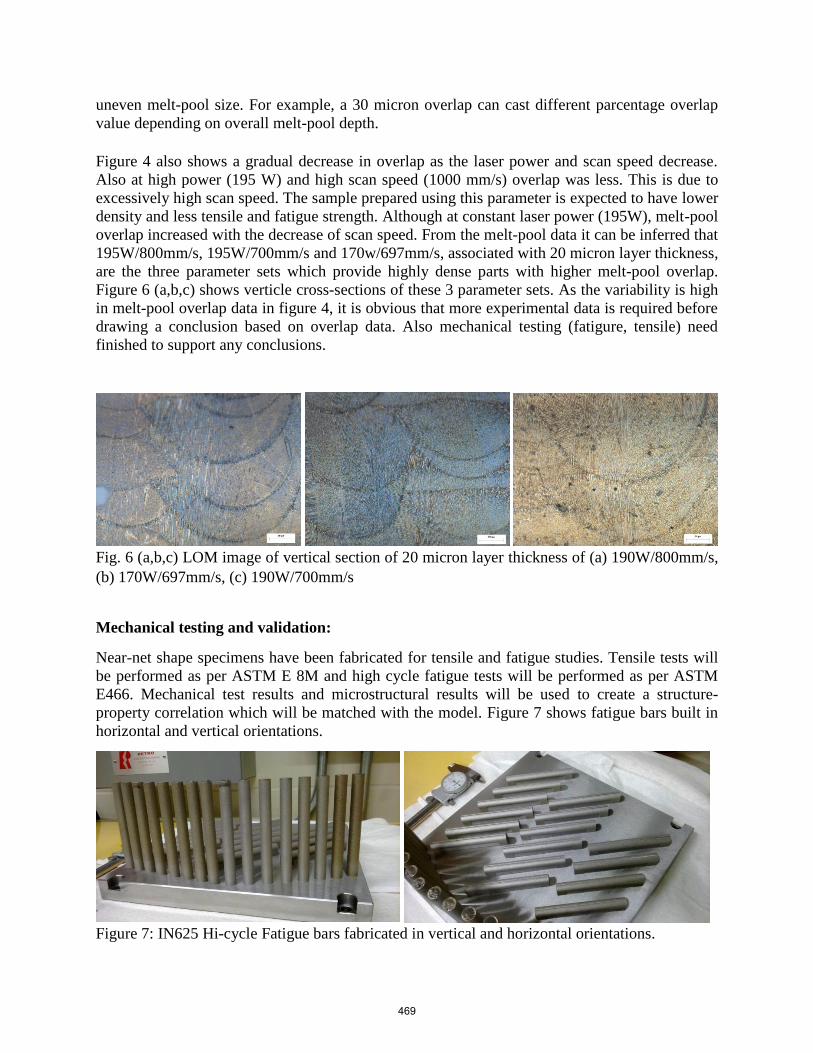
Near-net shape specimens have been fabricated for tensile and fatigue studies. Tensile tests will
be performed as per ASTM E 8M and high cycle fatigue tests will be performed as per ASTM
E466. Mechanical test results and microstructural results will be used to create a structure-
property correlation which will be matched with the model. Figure 7 shows fatigue bars built in
horizontal and vertical orientations.
Figure 7: IN625 Hi-cycle Fatigue bars fabricated in vertical and horizontal orientations.
469
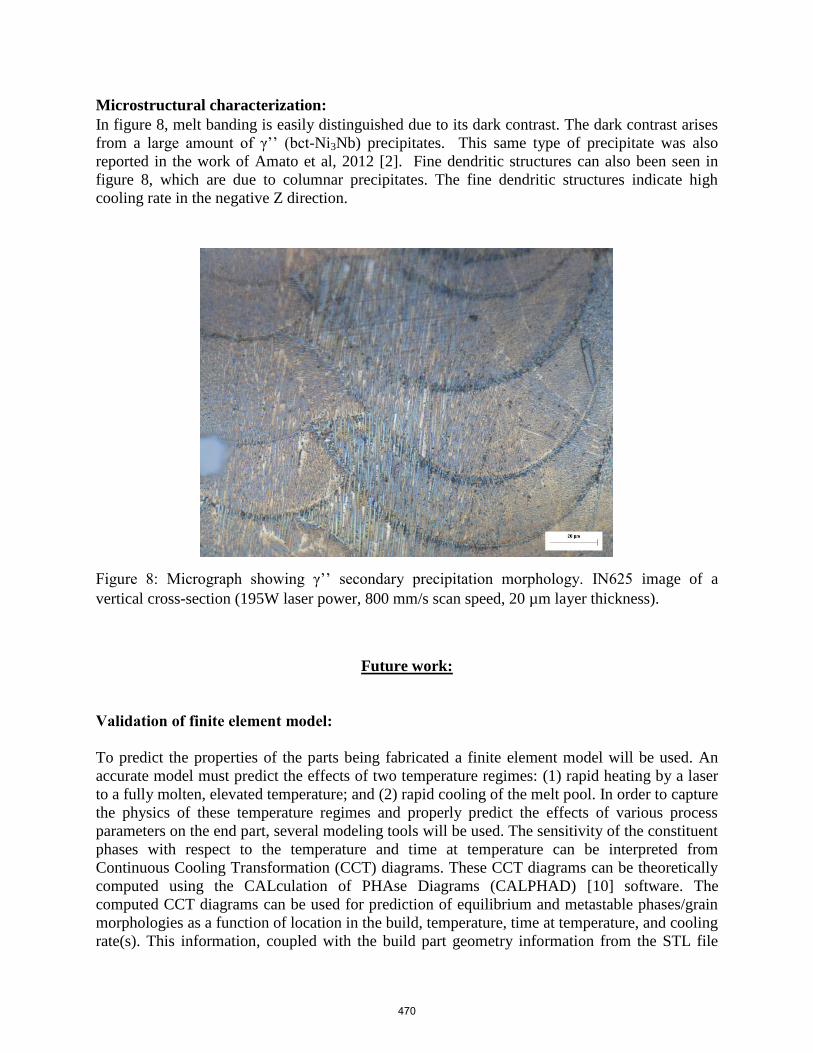
Microstructural characterization:
In figure 8, melt banding is easily distinguished due to its dark contrast. The dark contrast arises
from a large amount of γ’’ (bct-Ni3Nb) precipitates. This same type of precipitate was also
reported in the work of Amato et al, 2012 [2]. Fine dendritic structures can also been seen in
figure 8, which are due to columnar precipitates. The fine dendritic structures indicate high
cooling rate in the negative Z direction.
Figure 8: Micrograph showing γ’’ secondary precipitation morphology. IN625 image of a
vertical cross-section (195W laser power, 800 mm/s scan speed, 20 µm layer thickness).
Future work:
Validation of finite element model:
To predict the properties of the parts being fabricated a finite element model will be used. An
accurate model must predict the effects of two temperature regimes: (1) rapid heating by a laser
to a fully molten, elevated temperature; and (2) rapid cooling of the melt pool. In order to capture
the physics of these temperature regimes and properly predict the effects of various process
parameters on the end part, several modeling tools will be used. The sensitivity of the constituent
phases with respect to the temperature and time at temperature can be interpreted from
Continuous Cooling Transformation (CCT) diagrams. These CCT diagrams can be theoretically
computed using the CALculation of PHAse Diagrams (CALPHAD) [10] software. The
computed CCT diagrams can be used for prediction of equilibrium and metastable phases/grain
morphologies as a function of location in the build, temperature, time at temperature, and cooling
rate(s). This information, coupled with the build part geometry information from the STL file
470

and thermo-mechanical boundary conditions of the DMLS process, will be used as input
parameters for a homogenized form of the Dislocation Density based Crystal Plasticity Finite
Element Model (DDCP-FEM) [11-16] to predict mesoscopic effects such as local and global
strengths, modified grain morphologies, and dislocation densities.
Extraction of heat flux at molten pool boundary:
The temperature distribution at the molten pool boundary during solidification is a key to
effective modeling of DMLS. Experimentally a FLIR thermal camera recording at 200 frames
per second (fps) and resolution of 25 microns will be utilized. Similar work was reported by
Rodriguez et al. for EBM processing [17]. Analytically, best practices will be used to estimate
the heat flux based upon known models and solutions in the literature. Numerically, the
experimental and analytical information will be integrated into a finite element model to predict
the heat flux boundary conditions in a dynamic manner based upon process parameter inputs.
The temperature information will be used as the boundary conditions needed to solve the
thermomechanical DDCP-FEM problem.
Acknowledgements
The authors thank the staff at the University of Louisville Rapid Prototyping Center for help with
with fabrication of test coupons. This research was supported by the National Institute of
Standards and Technology (NIST), through a collaboration grant (number 70NANB12H262).
NIST DMLS facilities were used to fabricate the mechanical test bars.
Reference:
[1] Amato, K.N., Gaytan, S.M., Murr, L.E., Martinez, E., Shindo, P.W., Hernandez, J., Collins,
S., and Medina, F. Acta Materialia, Volume 60(5), pp. 2229–2239.
[2] Amato, K. N., Hernandez, J., Murr, L. E., Martinez, E., Gaytan, S.M., and Shindo, P.W.
Comparison of Microstructures and Properties for a Ni-Base Superalloy (Alloy 625) Fabricated
by Electron and Laser Beam Melting , Journal of Materials Science Research, Volume 1(2), pp.
3-41.
[3] Shankar, V.,Rao, Shankara, Mannan, S.L., ”Microstructure and Mechanical Properties of
Inconel 625 Superalloy” Journal of Nuclear Materials 288 (2001) 222-223.
[4] Metallography of Superalloys , G.F. Vander Voort, Buehler Ltd., October 2003 .
[5] Metals Handbook Ninth Edition , Volume 9 , pp. 305 – 309 . ASM International , Materials
Park, OH . 1985
471
[6] Starr T.L., Rafi K., Stucker B., Scherzer C.M. (2012). “Controlling phase composition in
selective laser melted stainless steels.” Proceedings of 2012 Solid Freeform Fabrication
Symposium, the University of Texas, Austin.
[7] Spierings, A. B., Schneider, M., & Eggenberger, R. (2011). Comparison of density
measurement techniques for additive manufactured metallic parts.Rapid Prototyping
Journal, 17(5), 380-386.
[8] IN625 measured data by National Bureau of Standards.
[9] Paul, C.P, Ganesh, P., Mishra, S.K., Bhargava, P., Negi, J., Nath, A.K., “Investigating laser
rapid manufacturing for Inconel-625 components” Journal of Optics & Laser Technology 39
(2007) 800–805
[10] Gibson, I., Rosen, D.W., and Stucker, B. Additive Manufacturing Technologies: Rapid
Prototyping to Direct Digital Manufacturing. Springer, 2009.
[11] Pal, D., Behera, S. and Ghosh, S. Crystal Plasticity Modeling of Creep and Microtwinning
in Nickel based Superalloys, United States National Congress on Computational Mechanics,
Columbus, OH, July 2009.
[12] Pal, D. and Stucker, B.E. Dislocation Density Based Finite Element Modeling of Ultrasonic
Consolidation, Solid Freeform Fabrication Symposium Proceedings, 2010, Austin, TX, August
2010.
[13] Pal, D. and Stucker, B.E. Dislocation Density Based Finite Element Modeling of Ultrasonic
Consolidation (updated approach), Solid Freeform Fabrication Symposium Proceedings, 2010,
Austin, TX, August 2011.
[14] Pal, D. Dislocation Density-Based Finite Element Method Modeling of Ultrasonic
Consolidation (update approach, detailed formulation), PhD Thesis, Utah State University,
August 2011.
[15] Pal, D., and Stucker, B.E. Some Studies on Dislocation Density Based Finite Element
Modeling of Ultrasonic Consolidation, Proceedings of the 5th
International conference on
Virtual and Rapid Prototyping, Leiria, Portugal, 2011.
[16] Pal, D., and Stucker, B.E. Modeling of Ultrasonic Consolidation Using a Dislocation
Density Based Finite Element Framework, Virtual and Physical Prototyping Journal, Volume
7(1), pp. 65-79.
[17] Rodriguez , E., Medina, F., Espalin, D., Terrazas, C., Muse, D., Henry, C., MacDonald, E.,
Wicker, B. Rayan, “Integration of a Thermal Imaging Feedback Control System in Electron
Beam Melting” proceeding at The University of Texas at El Paso, El Paso, TX 79968, USA,
2012
472

Notation:
* Represents the center of gravity of the distribution. Strongly influenced by coarse particles.
** Is calculated using the volume distribution data and is weighted to the small particles. This
data is related to population
† The area mean is a type of "average" that is less weighted than mv by the presence of coarse
particles and therefore shows smaller particle size. Mean dia. Represents a particle surface
measurement.
††Calculated CS does not reflect porosity or unique topographic characteristics of particles.
473