mobile network big data for development: applications and...
TRANSCRIPT
Mobile network big data for development: Applications and policy
issues
Rohan Samarajiva & Sriganesh Lokanathan
Yuan Ze University, Taiwan, 8 January 2015
This work was carried out with the aid of a grant from the International Development Research Centre, Canada and the Department for International Development UK..

Catalyzing policy change through research to improve
people’s lives in the emerging Asia Pacific by
facilitating their use of hard and soft infrastructures
through the use of knowledge, information and
technology
Our mission
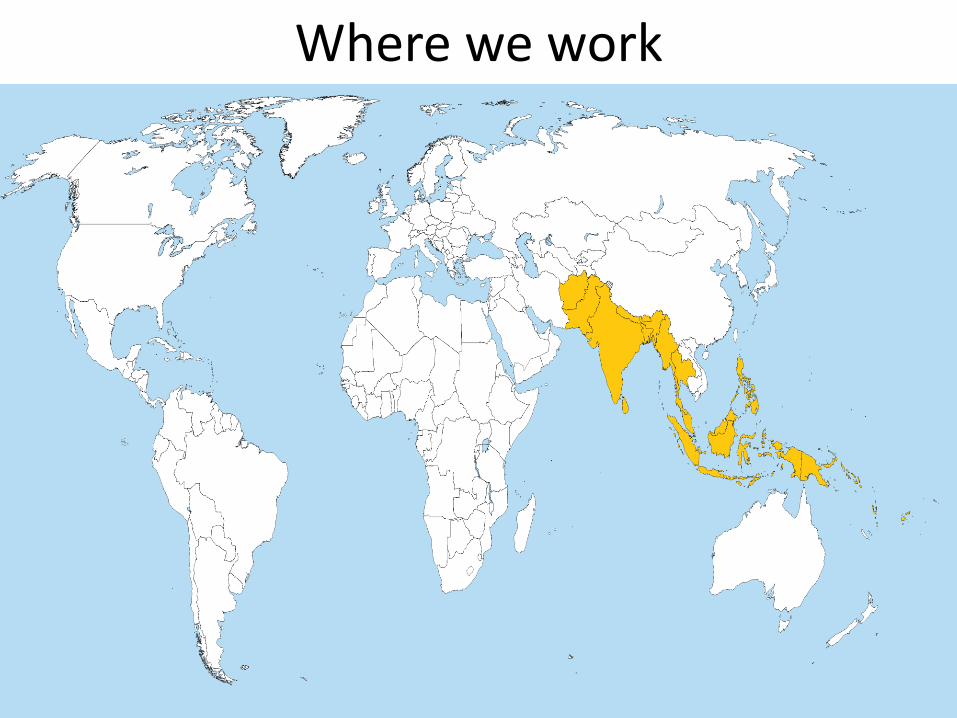
Where we work

Why big data? Why now?
• Proximate causes
– Increased “datafication”: Very large sets of schema-less (unstructured, but processable) data now available
– Advances in memory technology: No longer is it necessary to archive most data and work with small subset
– Advances in software: Hadoop, Mapreduce
4
But more than that . . .
• James Beniger’s Control revolution (1986) provides theoretical context
– Speed up of transportation caused crisis of control; remedied by early ICTs (telegraph, time zones)
– As mass production brought down unit costs, another crisis of control emerged; this time remedied by mass media & advertising
– Now, a crisis of control over attention; data analytics & micro targeting of audiences
5

Private & public purposes
• Data analytics in use within companies since 1990s
– American Express was using Cray Supercomputers in 1990s
• Big push by IBM, Cisco, etc. to use big data for smart cities in 2000s
– Rio as prototype in 2010; but used mostly video feeds and GPS
– These models rely on proprietary software and installed-for-purpose sensors
6
Is there an alternative approach?
• Can we have smart cities on the cheap?
• Transaction-generated data
– Ubiquitous mobiles can make every citizen a sensor
– If prepaid travel cards such as Octopus & Oyster in place and public transport is popular, they too can serve as sensors
– Open-source analytics; cheap hardware
7

But we need to take care
• Humans changing their behavior (Google flu trends)
• Problems of representativeness
8

Bias in big data why mobile network big data in developing countries
• Streetbump is a Boston crowdsourcing + big data application that uses the natural movement of citizens to improve street maintenance
– Data generated from an app downloaded to a smartphone “mounted” in a car
• Can Streetbump be transplanted in Colombo at this time?
– Feature phones >> Smartphones
• “Something better than nothing” may not apply
– Bias toward roads traversed by smartphone owners In conditions of limited resources, may skew resource allocation
9

Mobile network big data are more inclusive, especially in our cities
Mobile SIMs/100 Internet users/100 Facebook users/100
Myanmar 13 1 4
Bangladesh 67 7 6
Pakistan 70 11 8
India 71 15 9
Sri Lanka 96 22 12
Philippines 105 39 41
Indonesia 122 16 29
Thailand 138 29 46
10Source: ITU Measuring Information Society 2014; Facebook advtg portal
Myanmar mobile SIMs/100 was 22.6 by September 2014
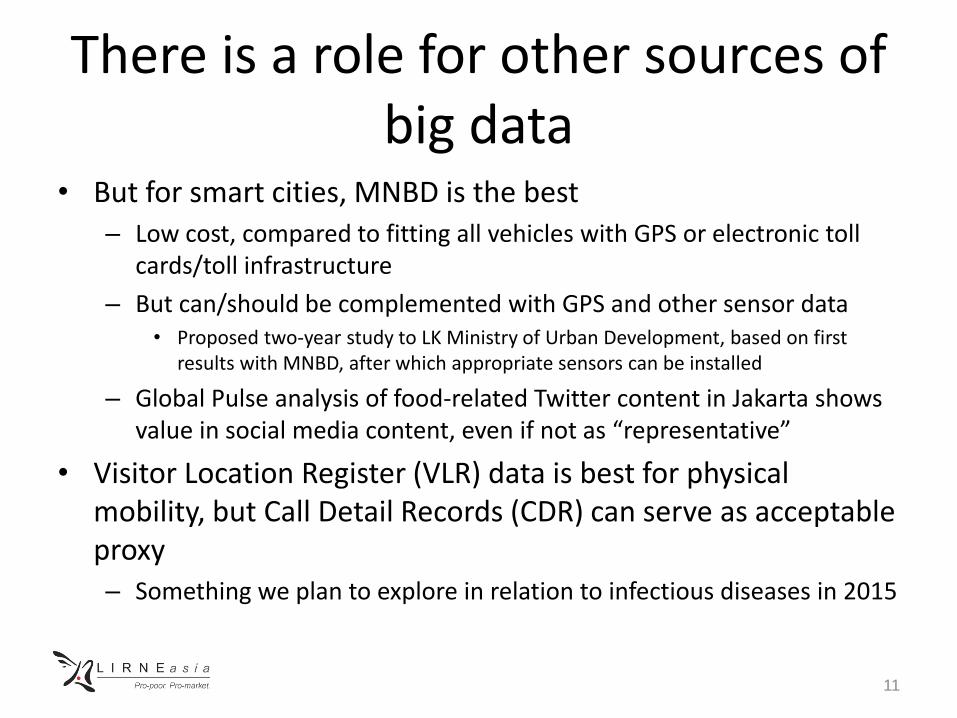
There is a role for other sources of big data
• But for smart cities, MNBD is the best– Low cost, compared to fitting all vehicles with GPS or electronic toll
cards/toll infrastructure
– But can/should be complemented with GPS and other sensor data• Proposed two-year study to LK Ministry of Urban Development, based on first
results with MNBD, after which appropriate sensors can be installed
– Global Pulse analysis of food-related Twitter content in Jakarta shows value in social media content, even if not as “representative”
• Visitor Location Register (VLR) data is best for physical mobility, but Call Detail Records (CDR) can serve as acceptable proxy– Something we plan to explore in relation to infectious diseases in 2015
11

Mobile network big data + other data rich, timely insights
12
Mobile network big data(CDRs, Internet access
usage, airtime recharge records)
Construct behavioral
variables
(i) Mobility variables(ii) Social variables(iii) Consumption
variables
Other data sources
(i) Census data(ii) HIES data(iii) Survey maps(iv) Transportation
schedules(v) ++++
Insights
(i) Urban & transportation planning
(ii) Crisis management & DRR
(iii) Health monitoring & planning
(iv) Poverty mapping(v) Financial
inclusion
Analytics
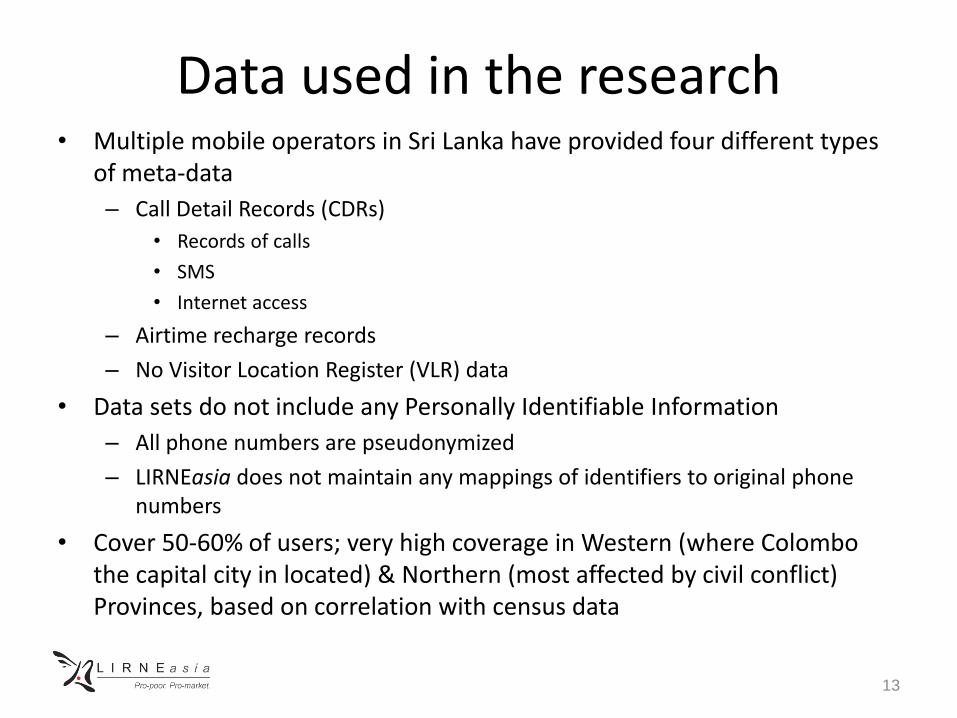
Data used in the research• Multiple mobile operators in Sri Lanka have provided four different types
of meta-data
– Call Detail Records (CDRs)
• Records of calls
• SMS
• Internet access
– Airtime recharge records
– No Visitor Location Register (VLR) data
• Data sets do not include any Personally Identifiable Information
– All phone numbers are pseudonymized
– LIRNEasia does not maintain any mappings of identifiers to original phone numbers
• Cover 50-60% of users; very high coverage in Western (where Colombo the capital city in located) & Northern (most affected by civil conflict) Provinces, based on correlation with census data
13

UNDERSTANDING CHANGES IN POPULATION DENSITY
14

Population density changes in Colombo region: weekday/ weekendPictures depict the change in population density at a particular time relative to midnight
15
We
ek
da
yS
un
da
y
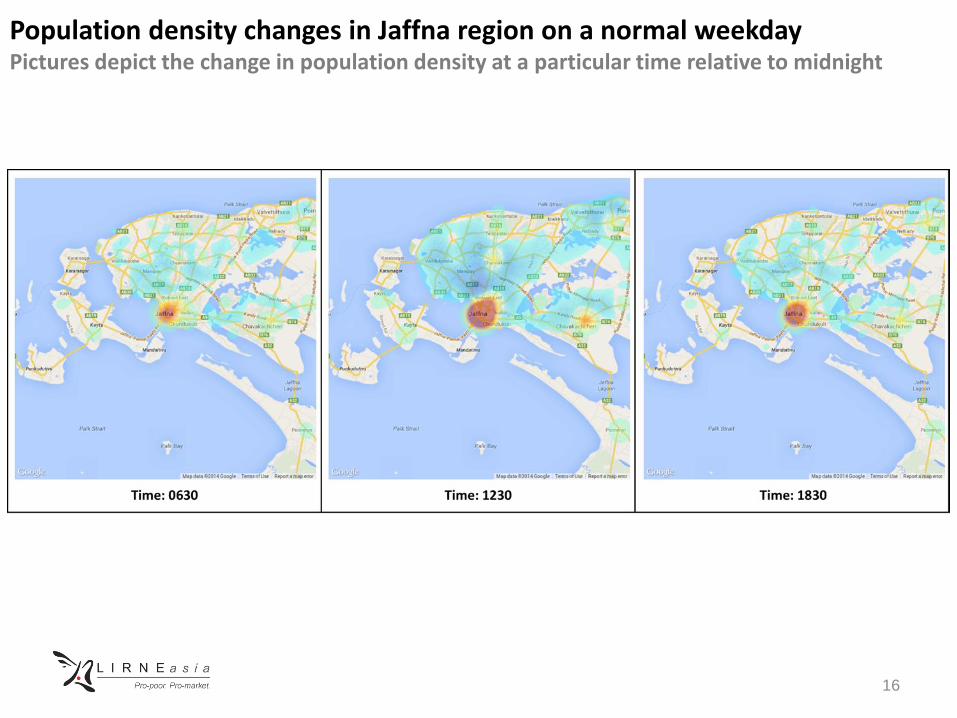
Population density changes in Jaffna region on a normal weekdayPictures depict the change in population density at a particular time relative to midnight
16
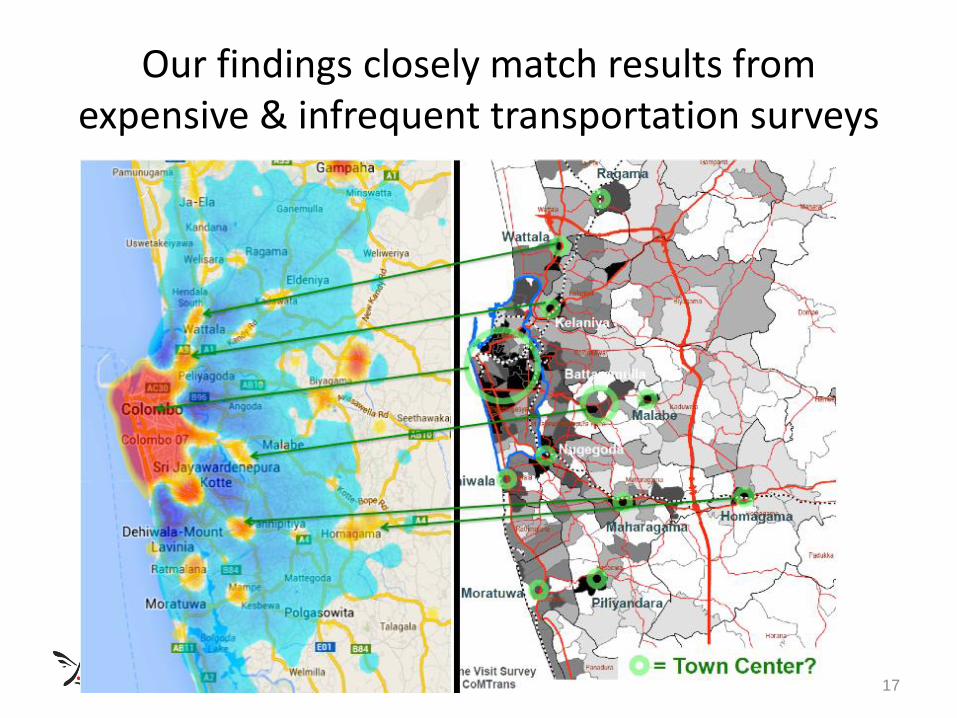
Our findings closely match results from expensive & infrequent transportation surveys
17

UNDERSTANDING WHERE PEOPLE LIVE AND WORK
18

Methodology
• Based on extracted average diurnal mobility pattern for population, choose time frames for home and work– Home time: 2100 to 0500
– Work time: 1000 to 1500
• Calculate a home and work location for each SIM:– Match cell towers to Divisional Secretariat Division (DSD)
– Count each DSD at most once per day.
– Pick the DSD with the largest number of “hits”
– For work consider only weekdays that are not public holidays
19
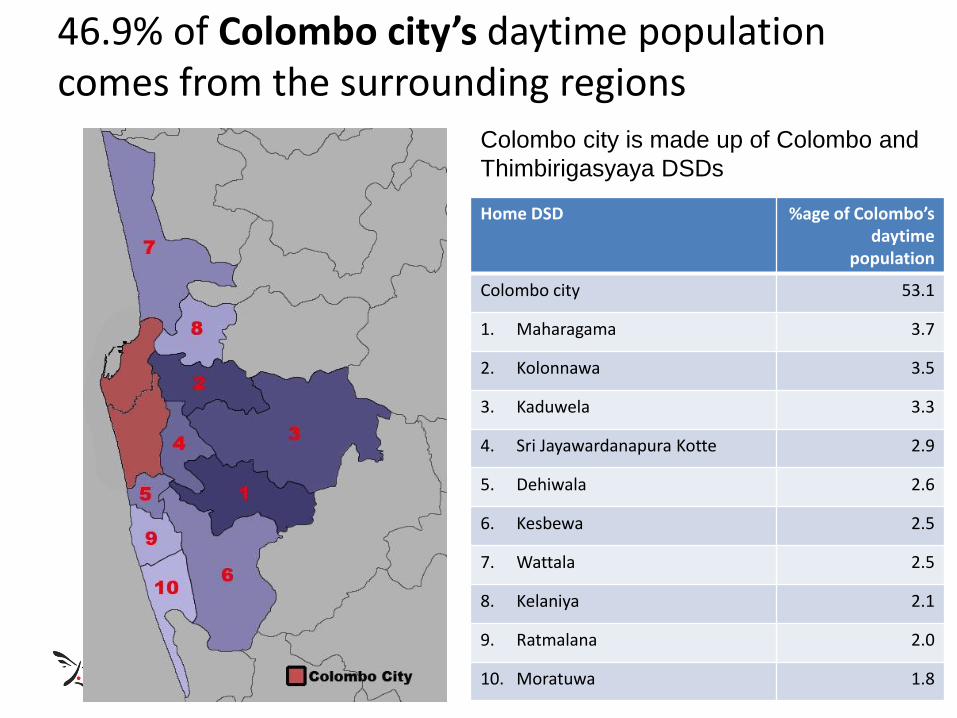
46.9% of Colombo city’s daytime population comes from the surrounding regions
20
Home DSD %age of Colombo’s daytime
population
Colombo city 53.1
1. Maharagama 3.7
2. Kolonnawa 3.5
3. Kaduwela 3.3
4. Sri Jayawardanapura Kotte 2.9
5. Dehiwala 2.6
6. Kesbewa 2.5
7. Wattala 2.5
8. Kelaniya 2.1
9. Ratmalana 2.0
10. Moratuwa 1.8
Colombo city is made up of Colombo and
Thimbirigasyaya DSDs
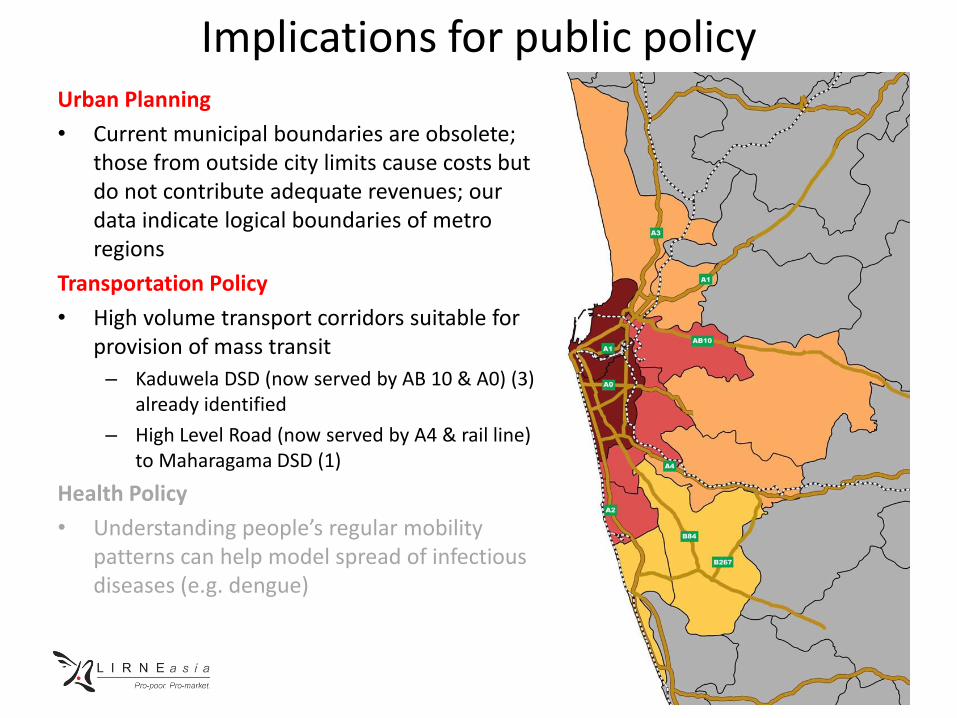
Implications for public policyUrban Planning
• Current municipal boundaries are obsolete; those from outside city limits cause costs but do not contribute adequate revenues; our data indicate logical boundaries of metro regions
Transportation Policy
• High volume transport corridors suitable for provision of mass transit
– Kaduwela DSD (now served by AB 10 & A0) (3) already identified
– High Level Road (now served by A4 & rail line) to Maharagama DSD (1)
Health Policy
• Understanding people’s regular mobility patterns can help model spread of infectious diseases (e.g. dengue)
22

MODELING TRAVEL
23

Understanding temporal variations in trips
24
Volume of peopleLow High

Mobility visualization for Colombo District identifies transport corridors
Source: COMTRANS report,2013, Ministry of
Transport17HighLow

Implications for public policy
Transportation & Urban Policy• CDR analysis can give us rough insights on principal transport
corridors• Then, with cooperation of mobile operators and additional
computing power, we can zoom in on priority corridors to do detailed analysis using Visitor Location Register (VLR) data
Health Policy• Understanding people’s regular mobility patterns can help
model spread of infectious diseases (e.g. dengue)

UNDERSTANDING LAND USE CHARACTERISTICS
27

Hourly loading of base stations reveals distinct patterns
• We can use this insight to group base stations into different groups, using unsupervised machine learning techniques
28
Type Y: ?Type X: ?
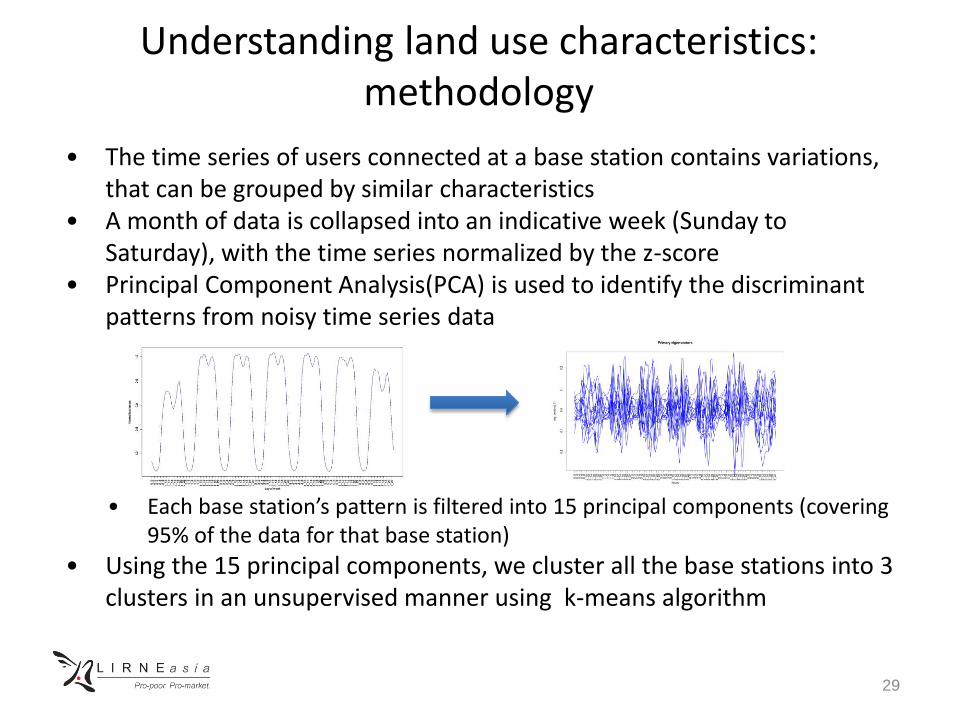
Understanding land use characteristics: methodology
• The time series of users connected at a base station contains variations, that can be grouped by similar characteristics
• A month of data is collapsed into an indicative week (Sunday to Saturday), with the time series normalized by the z-score
• Principal Component Analysis(PCA) is used to identify the discriminant patterns from noisy time series data
• Each base station’s pattern is filtered into 15 principal components (covering 95% of the data for that base station)
• Using the 15 principal components, we cluster all the base stations into 3 clusters in an unsupervised manner using k-means algorithm
29
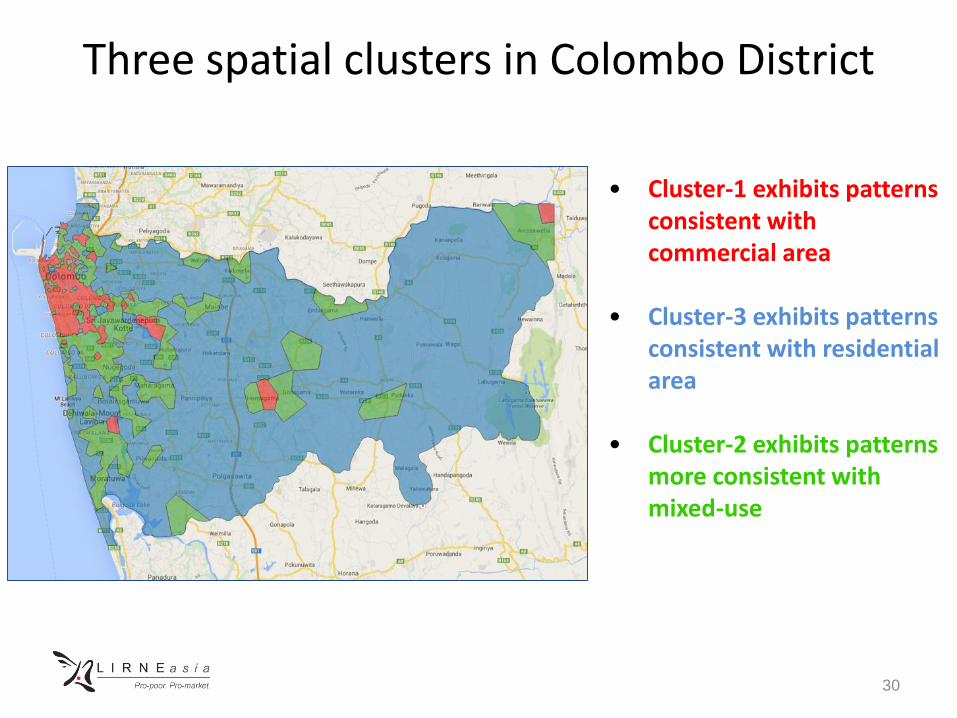
Three spatial clusters in Colombo District
30
• Cluster-1 exhibits patterns consistent with commercial area
• Cluster-3 exhibits patterns consistent with residential area
• Cluster-2 exhibits patterns more consistent with mixed-use

Our results show Central Business District (CBD) in Colombo city has expanded
31

Small area in NE corner of Colombo District classified as belonging to Cluster 1?
32
Seethawaka Export
Processing Zone
Photo ©Senanayaka Bandara - Panoramio

Internal variations in mixed use regions: More commercial or more residential?
33Blue dots: more residential than commercial Red dots: more commercial than residential

Plans & reality
1985 Plan 2013 reality
34
2020 UDA Plan
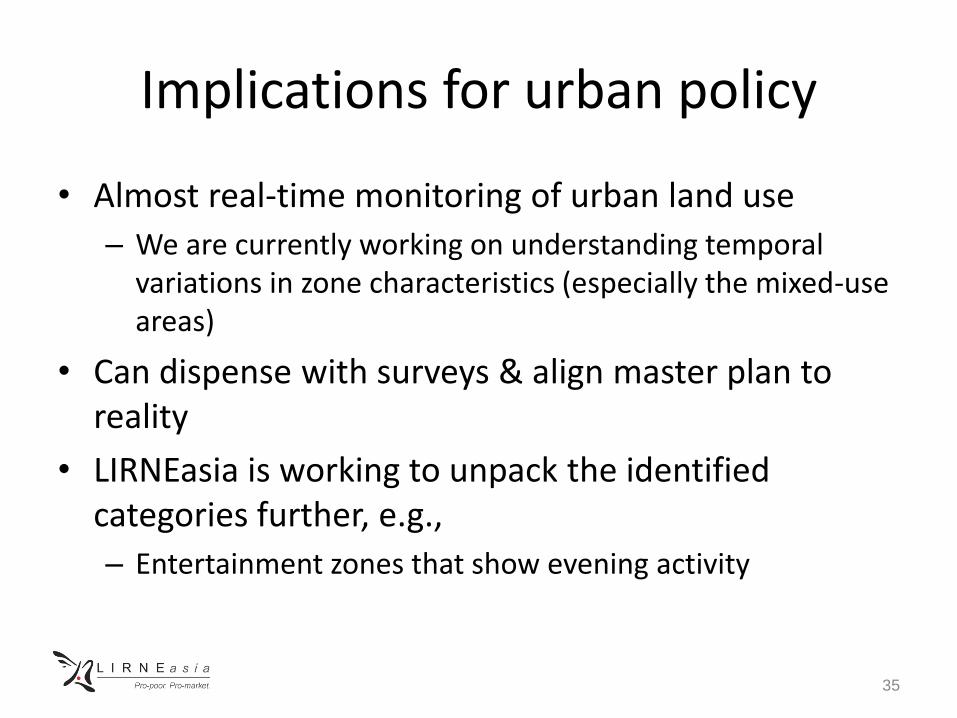
Implications for urban policy
• Almost real-time monitoring of urban land use
– We are currently working on understanding temporal variations in zone characteristics (especially the mixed-use areas)
• Can dispense with surveys & align master plan to reality
• LIRNEasia is working to unpack the identified categories further, e.g.,
– Entertainment zones that show evening activity
35

UNDERSTANDING COMMUNITIES
36
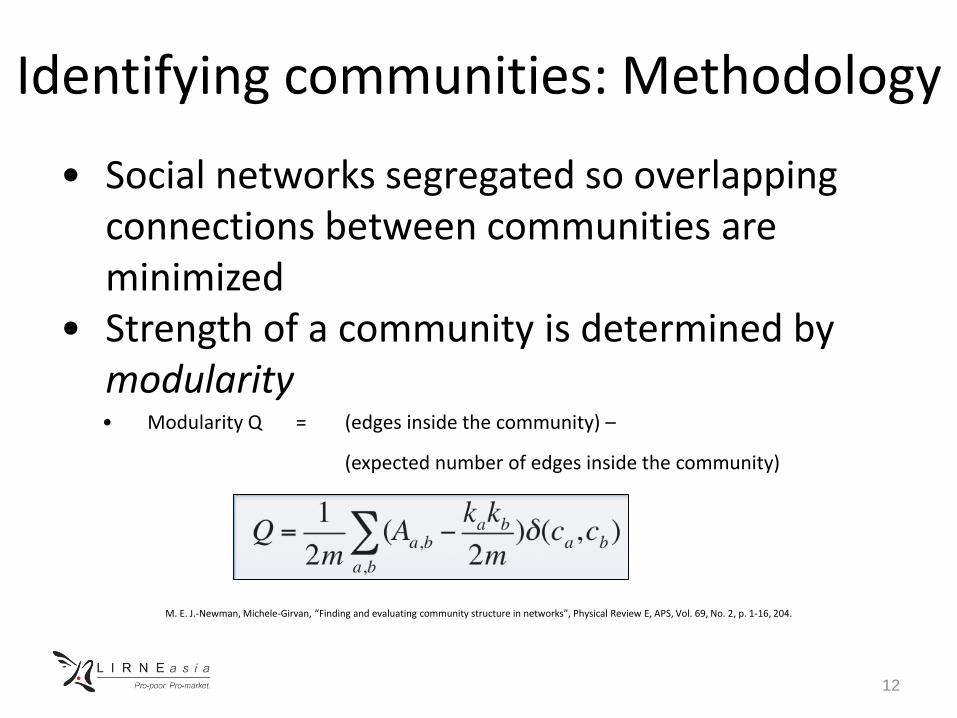
Identifying communities: Methodology
• Social networks segregated so overlapping connections between communities are minimized
• Strength of a community is determined by modularity• Modularity Q = (edges inside the community) –
(expected number of edges inside the community)
M. E. J.-Newman, Michele-Girvan, “Finding and evaluating community structure in networks”, Physical Review E, APS, Vol. 69, No. 2, p. 1-16, 204.
12
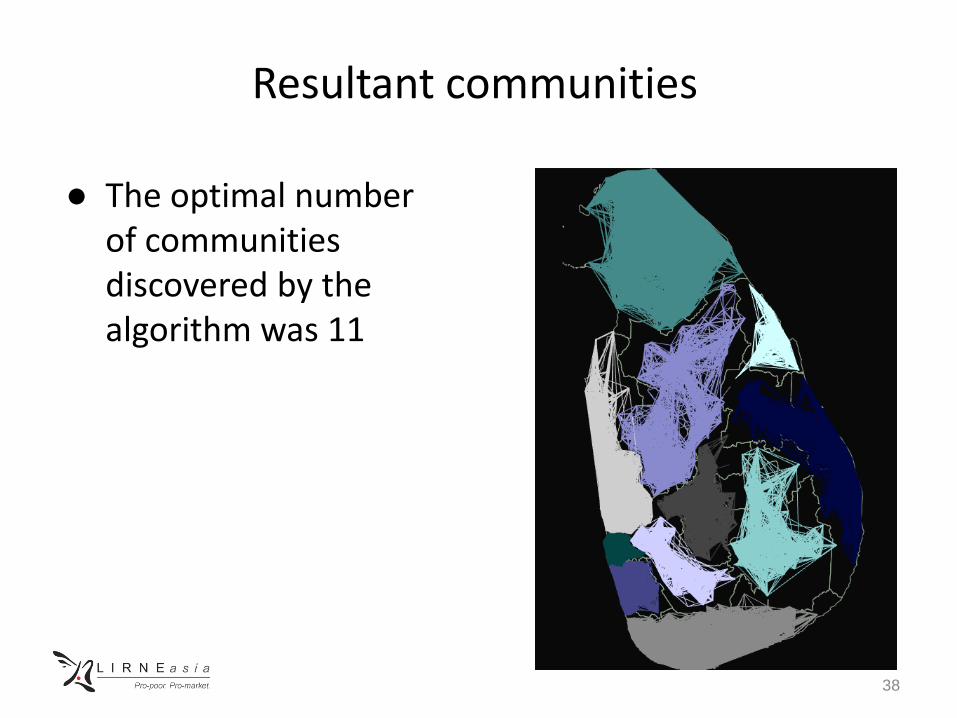
Resultant communities
● The optimal number of communities discovered by the algorithm was 11
38

How do these communities mesh with existing administrative boundaries?
● Southern & Northern provinces mesh the best
● Surprisingly, also Uva, hitherto thought to have a district aligned with Central plantations & other with Southern Province
● Eastern Province most intriguing
● Trinco on its own
● Polonnaruwa in NCP (predominantly Sinhala) tied to Batticaloa (Tamil/Muslim) and Ampara (Muslim/Sinhala) districts through rice economy
● Rest suggests administrative
boundaries have been transcended 14
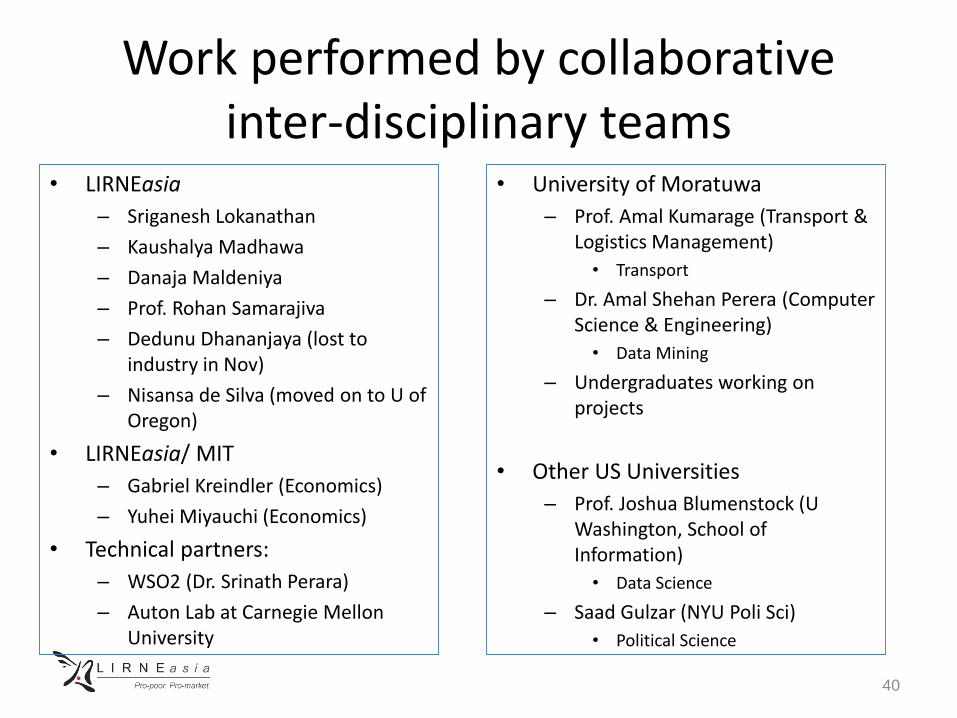
Work performed by collaborative inter-disciplinary teams
• University of Moratuwa
– Prof. Amal Kumarage (Transport & Logistics Management)
• Transport
– Dr. Amal Shehan Perera (Computer Science & Engineering)
• Data Mining
– Undergraduates working on projects
• Other US Universities
– Prof. Joshua Blumenstock (U Washington, School of Information)
• Data Science
– Saad Gulzar (NYU Poli Sci)
• Political Science
40
• LIRNEasia
– Sriganesh Lokanathan
– Kaushalya Madhawa
– Danaja Maldeniya
– Prof. Rohan Samarajiva
– Dedunu Dhananjaya (lost to industry in Nov)
– Nisansa de Silva (moved on to U of Oregon)
• LIRNEasia/ MIT
– Gabriel Kreindler (Economics)
– Yuhei Miyauchi (Economics)
• Technical partners:
– WSO2 (Dr. Srinath Perara)
– Auton Lab at Carnegie Mellon University

Addressing challenges
41
Challenge Solution(s)Negotiating access to data • Win-win; insights/ techniques for public
policy outputs can be leveraged for operator’s business interests
• Pro-active action by operator(s) rather than reactive to growing government interest in using such data
Minimizing harms from data sharing • Development of self-regulatory guidelines for operators
Skills • Assemble interdisciplinary teams that are superior to what consultants can offer
Research policy • Policy enlightenment as step 1
DRAFT GUIDELINES FOR THIRD-PARTY USE OF MOBILE NETWORK BIG DATA
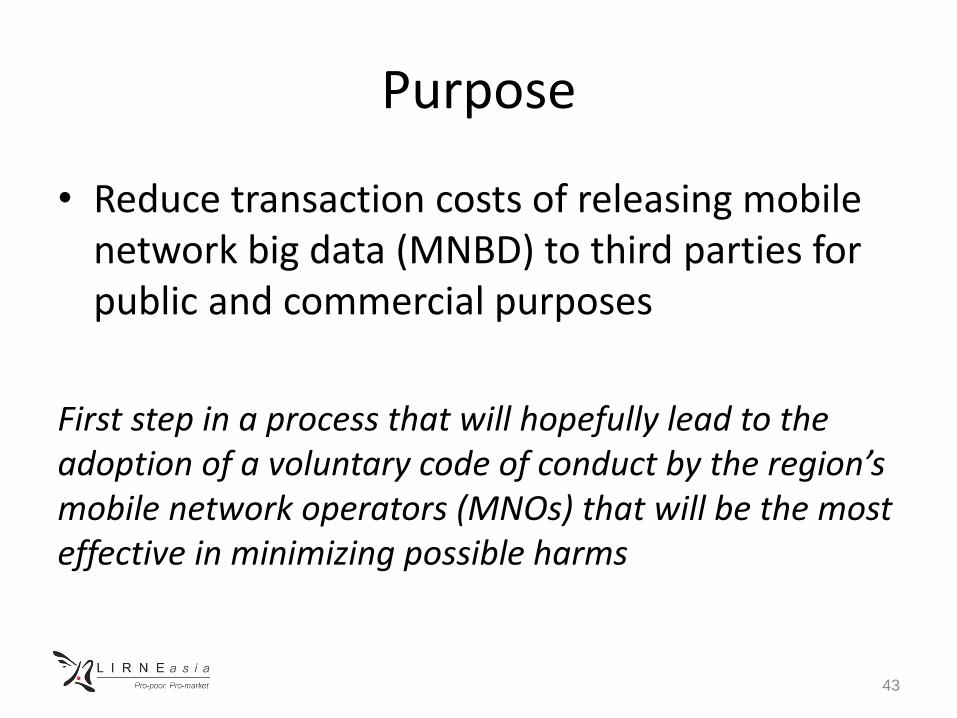
Purpose
• Reduce transaction costs of releasing mobile network big data (MNBD) to third parties for public and commercial purposes
First step in a process that will hopefully lead to the adoption of a voluntary code of conduct by the region’s mobile network operators (MNOs) that will be the most effective in minimizing possible harms
43

Method
• Potential harms have been identified through
– the literature (Annex 1) and
– engagement with ongoing analysis of MNBD at LIRNEasia
Anchored on my work on utility transaction-generated data since 1991
44

Privacy and other harms, from the ground up
• Guidelines address harms that have emerged in society and recognized as worthy of remedy in the Common Law and not on abstract principles.
• Solove (2008: 174) argues that privacy as an abstract concept is difficult to pin down, since it “involves a cluster of protections against a group of different but related problems.”
• He identifies 16 privacy problems, grouped into four general types: – Information collection;
– Information processing;
– dissemination; and
– invasion
45

Considered harms
• Privacy (9 out 16 recognized in the Common Law in multiple countries)
– Surveillance
– Aggregation
– Identification, individual and group
– Insecurity
– Secondary use
– Exclusion
– Breach of confidentiality
– Disclosure
– Increased accessibility
• Anti-competitive effects
• Marginalization
46
47
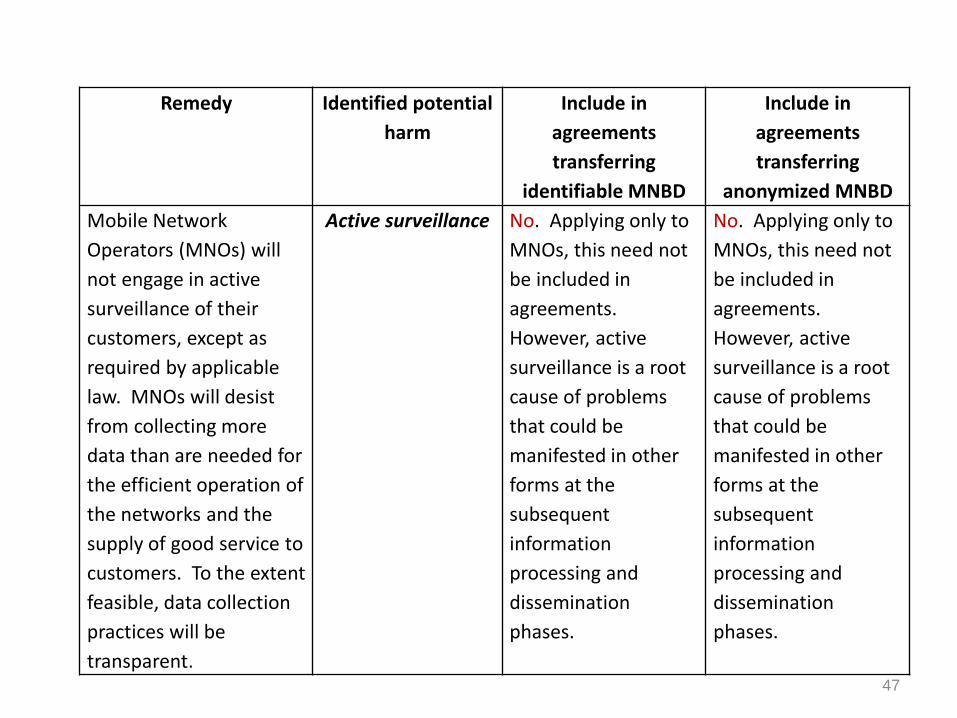
Remedy Identified potential
harm
Include in
agreements
transferring
identifiable MNBD
Include in
agreements
transferring
anonymized MNBD
Mobile Network
Operators (MNOs) will
not engage in active
surveillance of their
customers, except as
required by applicable
law. MNOs will desist
from collecting more
data than are needed for
the efficient operation of
the networks and the
supply of good service to
customers. To the extent
feasible, data collection
practices will be
transparent.
Active surveillance No. Applying only to
MNOs, this need not
be included in
agreements.
However, active
surveillance is a root
cause of problems
that could be
manifested in other
forms at the
subsequent
information
processing and
dissemination
phases.
No. Applying only to
MNOs, this need not
be included in
agreements.
However, active
surveillance is a root
cause of problems
that could be
manifested in other
forms at the
subsequent
information
processing and
dissemination
phases.

48
Remedy Identified
potential harm
Include in
agreements
transferring
identifiable MNBD
Include in
agreements
transferring
anonymized MNBD
Best efforts will be
made to prevent de-
anonymization.
Working groups may be
formed with data users
to monitor the state of
knowledge in
techniques of
anonymization and de-
anonymization.
De-anonymization No Yes
49
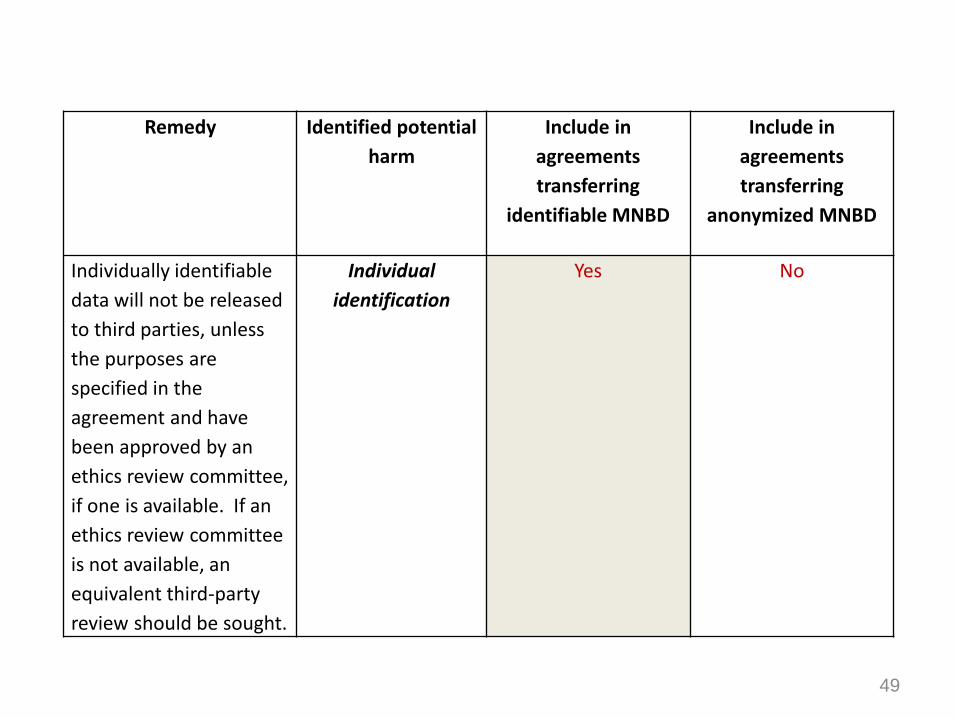
Remedy Identified potential
harm
Include in
agreements
transferring
identifiable MNBD
Include in
agreements
transferring
anonymized MNBD
Individually identifiable
data will not be released
to third parties, unless
the purposes are
specified in the
agreement and have
been approved by an
ethics review committee,
if one is available. If an
ethics review committee
is not available, an
equivalent third-party
review should be sought.
Individual
identification
Yes No
50
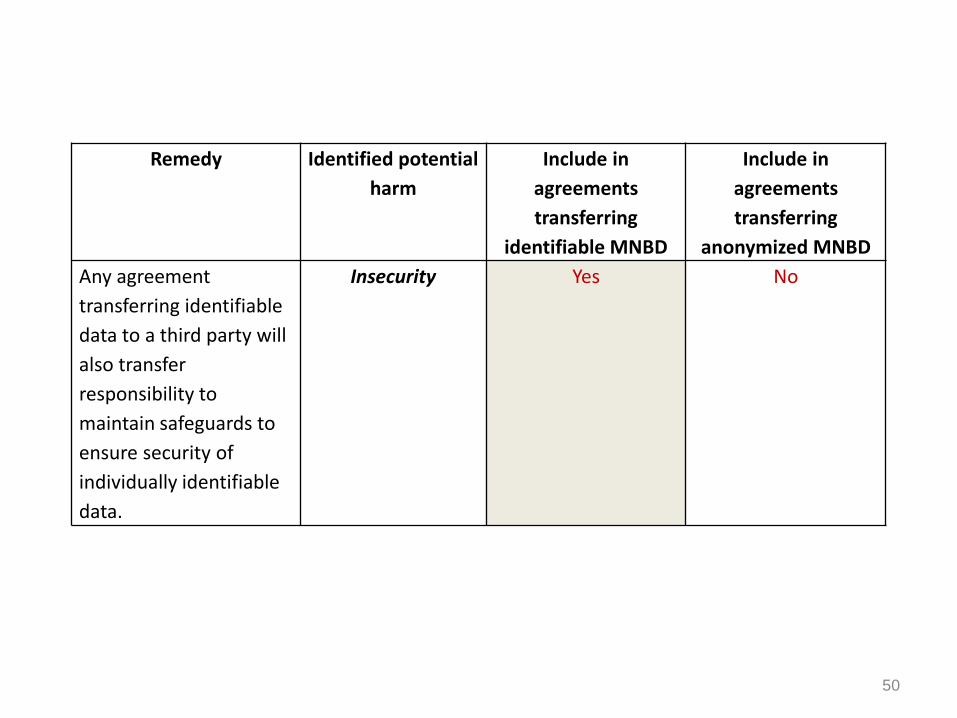
Remedy Identified potential
harm
Include in
agreements
transferring
identifiable MNBD
Include in
agreements
transferring
anonymized MNBD
Any agreement
transferring identifiable
data to a third party will
also transfer
responsibility to
maintain safeguards to
ensure security of
individually identifiable
data.
Insecurity Yes No

51
Remedy Identified
potential harm
Include in
agreements
transferring
identifiable MNBD
Include in
agreements
transferring
anonymized MNBD
The agreement
governing the transfer
will include provisions
to minimize risks posed
by increased
accessibility when data
are released to third
parties.
Increased
accessibility
Yes Yes
52
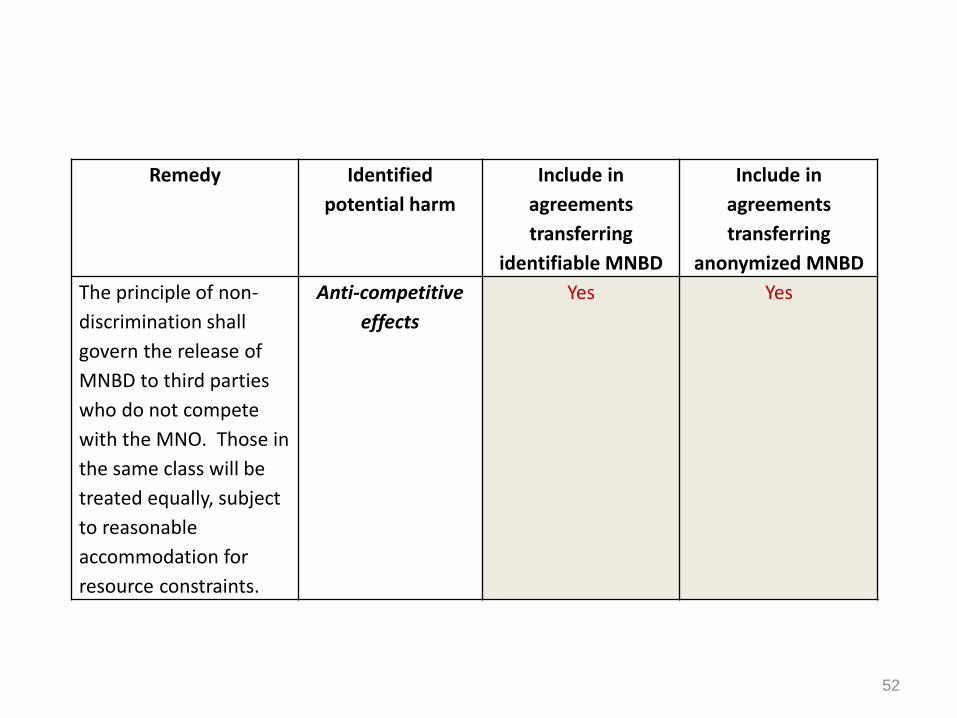
Remedy Identified
potential harm
Include in
agreements
transferring
identifiable MNBD
Include in
agreements
transferring
anonymized MNBD
The principle of non-
discrimination shall
govern the release of
MNBD to third parties
who do not compete
with the MNO. Those in
the same class will be
treated equally, subject
to reasonable
accommodation for
resource constraints.
Anti-competitive
effects
Yes Yes