mobile financial and banking services development in africa
TRANSCRIPT
African
Develop
ment Ba
nk Grou
p
Mobile Financial and BankingServices Development in Africa
Working
Pape
r Serie
s
Christian Lambert NGUENA
Indus
triali
se A
frica
n° 32
3
July 2
019
3
tri

Working Paper No 323
Abstract
Using a new database for mobile financial & banking services across countries, we analyze pro-poor and inclusive growth in developing countries and show the importance of mobile financial & banking development. This paper uses several econometric techniques to investigate mobile finance & banking benchmarking, determinants, and real impacts on inclusive growth in developing countries in Africa. The statistical benchmarking analysis reveals that there is a positive link between mobile banking development and economic development. Estimation of our model, using different specification and estimation techniques, shows the same result: a positive impact of mobile finance & banking development on both pro-poor
and inclusive economic growth. These main findings suggest that policies to boost mobile finance & banking development in Africa should be viewed as measures that would yield fruit in the medium to long terms. Moreover, we find determinants of mobile finance & banking to be: banking sector domestic credit, human capital, remittances, credible monetary policy, infrastructure, and trade. Since mobile banking development matters for pro-poor and inclusive growth, African governments should pursue good performance in terms of these determinants by implementing specific and robust economic policies.
Rights and Permissions
All rights reserved.
The text and data in this publication may be reproduced as long as the source is cited. Reproduction for commercial purposes is forbidden. The WPS disseminates the findings of work in progress, preliminary research results, and development experience and lessons, to encourage the exchange of ideas and innovative thinking among researchers, development practitioners, policy makers, and donors. The findings, interpretations, and conclusions expressed in the Bank’s WPS are entirely those of the author(s) and do not necessarily represent the view of the African Development Bank Group, its Board of Directors, or the countries they represent.
Working Papers are available online at https://www.afdb.org/en/documents/publications/working-paper-series/
Produced by Macroeconomics Policy, Forecasting, and Research Department
Coordinator Adeleke O. Salami
This paper is the product of the Vice-Presidency for Economic Governance and Knowledge Management. It is part of a larger effort by the African Development Bank to promote knowledge and learning, share ideas, provide open access to its research, and make a contribution to development policy. The papers featured in the Working Paper Series (WPS) are those considered to have a bearing on the mission of AfDB, its strategic objectives of Inclusive and Green Growth, and its High-5 priority areas—to Power Africa, Feed Africa, Industrialize Africa, Integrate Africa and Improve Living Conditions of Africans. The authors may be contacted at [email protected].
Correct citation: Nguena, C. L. (2019), Mobile Banking and Financial Services Development in Africa, Working Paper Series N° 323, African Development Bank, Abidjan, Côte d’Ivoire.

1
Mobile Financial and Banking Services Development in Africa
Christian Lambert Nguena 1
JEL classification: G21, R1, O4
Keywords: Mobile finance & banking, Africa, principal component analysis, financial innovation, financial inclusion
1 Senior Lecturer and Researcher at the University of Dschang [contact: [email protected]]. This research paper was improved by comments received from participants at the 72nd Annual Conference of the International Institute of Public Finance ((IIPF).

2
1. Introduction
It is empirically and theoretically established that an important part of growth is supported by
investment and business performance. For this major factor of economic development, we
emphasize the importance of a healthy and developed financial system. In Africa, the main
concerns are the inclusion and depth aspects of the financial system, which tend to largely
explain the lower level of the contribution of the supply side of the economy (Ndebbio, 2004;
Meisel and Mvogo, 2007; Nguena and Tsafack, 2015). In general, mobile financial & banking
services offer great potential to improve financial inclusion of the poor through inclusive
financial services, particularly digital payment services (Gutierrez and Singh, 2013). With its
main advantages being instantaneity, freedom from having to hold cash, privacy, security,
perceived ease of use, compatibility, and social influence, mobile baking is assumed to be more
adapted to African behavior and could therefore improve the inclusiveness of the financial
sector and unleash investments and economic development.
In sub-Saharan Africa, 75 percent of the population does not have access to any form
of formal financial services. This situation, which contributes to the success of informal finance
options like rotating savings and credit associations (ROSCAS), is too important to be ignored.
There exists a well-documented literature on the positive link between the level of development
of the financial system and economic development (Roubini and Sala-i-Martin, 1992; King and
Levine, 1993a,1993b; Easterly, 1993; Gertler and Rose, 1994; Levine , 1997; Beck and others,
2000; Khan and Senhadji, 2000; Thiel, 2001; Wachtel, 2001; Christopoulos and Tsionas, 2004;
Levine, 2004; Deisting and others 2012; Lansana, 2012; Mbate, 2013).
Alongside such evidence, the importance of informal financial institutions is also well
established in the literature (see the seminal paper by Besley, 1996). There have been many
recommendations even from formal financial institutions to forge strategic links with informal
financial institutions (Aliber, 2002). Possible reasons for the failure of the traditional financial
system in terms of greater inclusion are mainly: long distances to the nearest bank, low levels
of trust, and unwillingness to allow a third party like a bank to manage their very limited
disposable income (Aliber, 2002).
Mobile finance & banking (also known as M-Banking, mbanking, SMS Banking) is a
term used for making account transactions, payments, credit applications, and other banking
transactions through a mobile device such as a mobile phone, with or without a link to a
traditional banking account. The advantage is that mobile financial services can work without
a link to a traditional banking account, while mobile banking services are connected to a

3
banking account. These new modes of carrying out financial transactions constitute what we
call financial innovation. Mobile finance & banking has experienced fast growth globally.
According to Telecom Trends International Inc., there are now 1.3 billion mobile phones being
used around the world, a growth trend which has emerged over the past 20 years, compared to
the more than 2.5 billion landlines built over the last century. The number of mobile phones is
expected to be 4.5 billion by 2016, compared to 1.5 billion television sets in use today. Mobile
banking is currently the largest trend after micro-finance, gaining more than 90 million
customers over the past 30 years. Based on this large potential, it is rational to ask the question
of how mobile finance & banking can be used to facilitate economic development, on the one
hand, and how to mobilize funds for use in economic development (e.g., through microfinancial
institutions), on the other hand. More specifically, how can these new financial modes help, in
term of financial inclusiveness and thus improve the reduction of poverty with inclusive
growth.
The mobile phone revolution is the origin of change in many Africans’ lives, providing
not just telecommunications but also access to basic financial services in the form of phone-
based money transfers and storage (Jonathan and Camilo, 2008; Ondiege, 2010; Demombynes
and Thegeya, 2012; Nguena, 2012, 2015). In fact, the substantial penetration rates of mobile
telephony, which is transforming cell phones into pocket-banks in Africa, provide
opportunities for countries on the continent to increase affordable and cost-effective means of
bringing on board a large portion of the population that, until recently, had been excluded from
formal financial services for decades (Tchouto and Nguena, 2015).
This transformation has been appealing not only for banks and micro financial
institutions (MFIs) but also to financial regulators and governments, as well as development
partners providing support to ameliorate the lives of Africans via sustained growth and poverty
reduction policies. The Economist (2008) described the phenomenon with the following
sentence: “A device that was a yuppie toy not so long ago has now become a potent for
economic development in the world’s poorest countries.” In line with Aker and Mbiti (2010,
p. 208), at the Connect Africa summit in 2007, Paul Kagame, president of Rwanda asserted:
“In ten short years, what was once an object of luxury and privilege, the mobile phone has
become a basic necessity in Africa.” These perceptions have been investigated by Asongu
(2014), who finds mobile phone penetration mitigates African inequality, due to its positive
correlation with informal financial sector development (Asongu, 2013).
Against this background, while mobile banking has grown at a breathtaking pace in
certain countries (e.g., Kenya), most African nations still need to take full advantage of the

4
many benefits procured by these mobile banking services. One current policy challenge is to
understand why some African countries are more advanced in mobile phone penetration and
mobile banking than others. There is a wealth of literature to substantiate the relevance of this
empirical problem statement.
As emphasized by Maurer (2008), and confirmed in subsequent work (Jonathan and
Camilo, 2008; Thacker and Wright, 2012), academic research on the adoption and
socioeconomic effects of mobile banking (payments) systems in the developing world is scarce.
From a broad point of view, most studies on mobile banking have been theoretical and
qualitative in nature (Maurer, 2008; Jonathan and Camilo, 2008; Merritt, 2010; Thacker and
Wright, 2012; Asongu, 2013, 2014). Moreover, the few existing empirical works hinge on
country-specific and micro-level data (collected from surveys) for the most part (Demombynes
and Thegeya, 2012). The purpose of this study is to fill the existing gap by empirically testing
if mobile banking development matters for pro-poor and inclusive growth in African
developing countries.
This paper’s specific objectives are: (i) to empirically determine the impact of mobile
banking development on pro-poor and inclusive economic growth, and (ii) to empirically
estimate the determinants of mobile banking development in Africa. To the best of our
knowledge, this paper is unique and breaks new ground, using newly available data from the
World Bank on mobile phone penetration and mobile banking. Apart from some stylized facts
about African countries, it is an in-depth study of the distinguishing features of mobile banking,
i.e.,mobile phone usage to pay bills, mobile phone usage to pay/receive money, and Internet
usage per capita. Additionally, an aspect of capitalism is taken into account by considering the
economic freedom index.
The contribution of this paper to the literature is threefold. First, we deviate from the
mainstream literature on African mobile usage, which is based on qualitative and
microeconomic assessments (Maurer, 2008; Jonathan and Camilo, 2008; Merritt, 2010;
Thackerand Wright, 2012; DemombynesandThegeya, 2012). The paper therefore complements
the existing literature with a macroeconomic empirical assessment of the impact of mobile
banking development on pro-poor and inclusive growth. It also examines the determinants of
the burgeoning mobile banking phenomenon. Second, this study uses the only mobile banking
data available, first published by the World Bank in 2013. Our analysis thus differs from recent
studies that have used mobile penetration as a proxy for mobile banking (Ondiege, 2010;
Asongu, 2013). Instead, we construct indicators of mobile finance & banking such as mobile
phone usage in the payment of bills, mobile usage in the sending/receiving of money, and

5
Internet usage per capita. Third, the coexistence of a less-developed financial system, which is
generally a more bank-based system than a market-based system, on one hand, and increasing
and rapid adoption of financial innovations, on the other hand, increases the importance of this
study for the economic welfare of practically all African countries.
Our empirical analysis highlights the following results: a positive impact on the mobile
banking index in both pro-poor and inclusive economic growth. These main findings suggest
that policies to boost mobile finance & banking development in Africa should be viewed as
measures that would yield positive gains in the medium to long run. Moreover, we find
determinants of mobile banking to be: banking sector domestic credit, human capital,
remittances, credible monetary policy, infrastructure, and trade. Therefore, since mobile
banking development matters for pro-poor and inclusive growth, African governments should
pursue good performance by implementing supportive policies in these determinant areas.
The rest of the paper is organized as follows: the second section presents the literature
review on mobile finance & banking development, growth, poverty, and income distribution;
the third section focuses on stylized facts and benchmarking; the fourth section is dedicated to
the econometric methodology; the fifth section presents and discusses the results; and the sixth
section concludes the study.
2. Mobile Finance & Banking Development, Growth, Poverty, and Income Distribution:
Selected Literature Review
2.1 Mobile finance & banking development and pro-poor and inclusive growth
There are few studies that have investigated the role of mobile finance & banking development
for economic development and poverty reduction.
Since a seminal paper by Hardy (1980), which investigates the impact of telephones
per capita on economic growth, a growing number of studies have attempted to identify
telecommunications as an essential component of economic infrastructure, fostering
productivity and economic growth. The implications of telecommunications infrastructure for
economic development have evolved out of both direct and indirect benefits to economic
growth from telecommunications expansion. For example, a more efficient flow of information
reduces communication and transaction costs, and faster information diffusion enhances
market efficiency and competition as well as the potential for technological catch-up.
In the literature, the relationship between telecommunications investment and
economic growth has been examined in various ways. Several studies have employed time-

6
series analysis, such as Granger causality tests and modified Sims tests, and have focused on
the strength and direction of the causal relationship between telecommunications infrastructure
investment and economic growth. For instance, Cronin and others (1991, 1993a, 1993b) and
Wolde-Rufael (2007) confirm a two-way causal relationship in the United States between
telecommunications infrastructure investment and economic growth. In a similar study,
however, Beil and others (2005) conduct Granger-Sims causality tests for a time series of 50
years in the United States and find a one-way causality from economic growth to
telecommunications investment. Dutta (2001) applies Granger causality tests for a cross section
of 30 developing and industrialized countries for three different years, and finds a bi-directional
causality for both developing and industrialized countries. Perkins and others (2005) also
identify a bi-directional causality in South Africa using a PSS F-test (Pesaran and others, 2001).
A few other studies have attempted to quantify the impact of telecommunications on
economic growth by incorporating telecommunications infrastructure investment explicitly
into a macro (aggregate) production function or a cross-country growth framework. Madden
and Savage (2000) extend Mankiw and others (1992) to develop a supply-side growth model
where “teledensity” (the number of main telephone lines per 100 persons) and the share of
telecommunications investment in national income are controlled for as telecommunications
capital proxies. Their results from data on 43 countries, over the 1975–1990 period, suggest a
significant, positive, cross-country relationship between telecommunications capital and
economic growth.
In another study, Roller and Waverman (2001) endogenize telecommunications
infrastructure into aggregate economic activity. They first specify a micro model of the demand
for and supply of telecommunications infrastructure, and jointly estimate the micro model with
the macro production function. They find a significant causal relationship between
telecommunications infrastructure and aggregate output. Datta and Agarwal (2004) extend the
cross-country growth framework of Barro (1991) and Levine and Renelt (1992) to examine the
effects of telecommunications infrastructure on economic growth; they find a positive impact
and conclude there is a necessity to invest in telecommunications infrastructure. In a dynamic
panel model built on Islam (1995), they control for lagged, real gross domestic product (GDP)
per capita to test for convergence, while testing separately the direction of causality between
the teledensity and economic growth using the first-lagged values of teledensity.
Previous studies attest to the fact that telecommunications infrastructure investment is
positively correlated with economic growth, but far fewer studies have investigated how mobile
telecommunications has played a specific role in economic growth, especially in a region where

7
a disproportionate rate of growth in mobile telecommunications exists, relative to the level of
land-line telephony. The growth of mobile telephony in Africa, especially in sub-Saharan
Africa, epitomizes such a case. Due to the highly investment-intensive nature of land-line
telecommunications infrastructure deployment, Africa accounted for less than 2 percent of the
main telephone lines worldwide in 2006, while Asia had a 48 percent share (International
Telecommunication Union (ITU), 2007).
However, the breakthroughs in mobile phone technology in the last decade, combined
with relatively cheap mobile phone infrastructure, have led to Africa’s achieving a significant
annual growth in mobile telephone penetration. For instance, the number of mobile subscribers
in Africa surpassed the number of land lines in 2001 (Gray, 2006), and the number of mobile
subscribers in the region increased by 46.2 percent between 2001 and 2005 (ITU, 2007).
Mobile penetration in Africa by the end of 2006 was 22.0 subscribers per 100 persons, while
in Asia it was 29.3. And Africa was the only region where mobile telephone services generated
more revenue than land-line telephone services in 2005, accounting for more than 60 percent
of total telecommunications revenue in the region (ITU, 2007). The growth in mobile telephone
subscriptions in sub-Saharan African countries is shown in figure A.1 in the appendix.
Vodafone Group (2005) reported that, in a typical developing country, an increase of
10 mobile phones per 100 people boosts GDP growth by 6 percent. Ovum (2006) reports that
the mobile services industry contributed US$7.8 billion towards GDP in India. Enriquez and
others (2007) estimate the contribution of mobile operators and mobile-related companies and
report that, in China, mobile-related companies contribute twice as much to GDP as mobile
operators. Deloitte (2008) reports that in all six countries analyzed (Bangladesh, Malaysia,
Pakistan, Serbia, Thailand, and Ukraine) mobile phones have a significant impact on GDP. Lee
and others (2012) find that mobile cellular phone expansion is an important determinant of the
rate of economic growth in sub-Saharan Africa.
Using interactive quantile regressions, Asongu and Odhiambo (2017) examined the
correlations between mobile banking and inclusive development (quality of growth, inequality,
and poverty) among individuals in 93 developing countries for the year 2011. They found that
increasing mobile banking dynamics to certain threshold levels would increase (decrease)
quality of growth (inequality) in quantiles at the high-end of inclusive development
distributions, for the most part. As policy, encouraging the growth of mobile banking
applications would be a substantial tool to use in responding to immiserizing growth,
inequality, and poverty in developing countries.

8
Overall, studies with an explicit focus on mobile finance & banking development,
especially of Africa, are relatively scarce in the literature. Additionally, the majority of studies
focus on the impact of telecommunications, mobile telephony, 3G technology, mobile data
services, and mobile phone penetration on economic growth, instead of focusing on mobile
finance & banking development and pro-poor and inclusive growth. The need to empirically
verify our research question for African countries is an important contribution to the existing
literature.
2.2 Determinants of mobile finance &banking
Innovation and adoption of new technologies have attracted so much attention in the literature;
and this has generated many models and theories, which are believed to affect the innovation
adoption. For example, the Theory of Reasoned Action (TRA), the Theory of Planned
Behavior (TPB), and the Technology Acceptance Model (TAM) have been used in many
studies in developed countries. Among the research studies on innovation are studies that focus
on mobile banking and electronic banking. In addition to these theoretical models, which are
mainly based on a micro approach, there are two main theoretical lines along which the
determinants of mobile banking can be discussed: the first line takes into consideration the
macroeconomic environment of the country, and the second line presents some statistics on the
proliferation of mobile telephony in Africa.
The first line is based on the characteristics of the macroeconomic context in which
mobile banking is practiced in Africa. The macroeconomic environment is linked and favorable
to the development of mobile banking for the following reasons: First, from an international
perspective, Africa is generally less internationally connected and has a less developed banking
and financial system. Therefore, the virtual connection offered by mobile telecommunications
to households is an excellent alternative tool for banking and finance. Second, increasing levels
of fund transfers from abroad to Africa can be mobilized by a well-established mobile banking
sector, given a higher level of mobile penetration. Third, mobile banking can help boost
investment activities. This first line of theoretical discussion is the main focus of our
investigation.
Mobile money is now a common platform for banks, the underserved, and the unbanked
population. Its acceptability highly depends on how individuals perceive innovation attributes
such as simplicity, convenience, security, cost, flexibility, and accessibility (Porteous, 2007).
The different perceptions of an innovation have a direct impact on intended usage and actual

9
usage of the innovation (Venkatesh, 2000). Mobile banking is a new technology in many parts
of the world and can thus be adopted or rejected by users depending on the factors that affect
perceptions (Ngugi and others, 2010). The development of a new service or technology in
mobile banking has been studied for many years by academicians.
In a global context of various financial innovations, Fox and Vandroogenbroeck (2017)
study the recent incursion of telecom operators into the financial sphere, particularly in Africa,
in order to account for the outsized development of mobile banking, and to determine whether
the traditional banking system is challenged by these new actors. They also highlight the
characteristics of mobile banking in Africa, with an emphasis on the differences with developed
countries. However, they use comparison and a vast empirical literature approach, rather than
an econometric investigation, to attain their objectives.
In a first attempt, Gutierrez and Singh (2013) use individual data on 37,000 individuals
in 35 countries to explore factors associated with mobile banking usage. They find that a
supporting regulatory framework is associated with a higher usage of mobile banking by the
general population as well as by the unbanked.
Using a survey and a research model, based on the technology acceptance model, to
determine the factors that affect the adoption of mobile banking in New Zealand, Malhotra
(2011) highlights perceived risk (information and service quality, financial risk, security risk
concerns, psychological risk factors, size and design issues, speed and efficiency, and usage
costs), as a major inhibitor of the adoption of mobile banking, while perceived trust and
perceived usefulness do not significantly affect adoption. Abdinoor and Mbamba (2017) assess
consumers’ adoption of mobile financial services in Tanzania using the TAM and find that
mobile financial service adoption is positively related to individual awareness, perceived
usefulness, and perceived benefit but is negatively related to cost effects. Nevertheless, the
study shows that the demographic characteristics of respondents (sex, age, and income level)
are among the factors that determine the adoption of mobile financial services.
Maradung (2013) investigates the factors affecting the adoption of mobile money
services in the banking and financial industries of Botswana, in light of the TAM and
demographic variables (age of individuals, income, education level, bank account).The results
show that gross income and ownership of bank accounts, age of individuals (with more young
people than older people), gender (with more males than females), and employment status (with
more employed individuals than unemployed) are the main determinants of the preference to
use mobile money services. However, the education level of individuals does not have any
effect on the preference to use mobile money services to access banking and financial services.

10
Dzokoto and Mensah (2011) investigate the adoption of mobile money transfers using data
from interviews conducted with 35 low-income clients, 35 middle-class clients, 25 merchants,
and 25 market women who are mobile money vendors in Ghana. They find that customers
value mobile money as safe, fast, and convenient services and that the major challenges to its
adoption are lack of trust and technological literacy.
Tiwari and others (2007) critically examine the phenomenon of mobile commerce in a
given business field in order to identify the potential benefits. The study focuses on the
application and uses of mobile banking in Germany. The acceptance of mobile banking by
customers is surveyed between June 28, 2005 and July 21, 2005 in Hamburg. A total of 488
individuals, between 18 and 65 years of age, answered a three-page questionnaire giving
information on their perceived preferences and willingness to pay for 17 different financial
services offered for mobile banking. The services are bundled into 3 groups: mobile
accounting, mobile brokerage, and mobile financial information. The survey findings
unambiguously show that the rate of usage and adoption of mobile banking is remarkable. The
banks studied are found to be increasingly persuaded to include mobile services in their product
portfolios (Tiwari and others, 2007).
In South Africa, M-Pesa, born from a Vodacom and Nedbank partnership, did not live
up to expectations. In 2011, it had registered just over 100,000 users, which is far from the 10
million (out of the 13 million unbanked population) that it expected to register in three years
after being launched (AllAfrica.com, 2011). Despite its partnership with local banks to offer
mobile banking services, it did not experience a breakthrough and adoption by the local
population. According to the CEO of Vodacom at the time, the failure of M-Pesa in South
Africa can be attributed to the fact that the South African banking sector is more developed
(AllAfrica.com, 2011).
A study to investigate the factors that affect the adoption of mobile banking by Korir
(2012) is guided by four factors: covering age, cost, education, and the security of the platform
under survey. The study targets a sample of 400 respondents in the Garissa District who are
customers of Kenya Commercial Bank, Ltd. The authors find that there is a need for banks to
develop a technically reliable and easy to understand mobile banking system that is cost
effective for their customers—the study reveals that some of these customers admit that the
cost of accessing mobile banking services is high. The author also finds that many behavioral
implications have not been considered in depth regarding perception and attitude (Korir, 2012).
Thando (2013) examines the perception and adoption of mobile payment platforms
(MPP) by entrepreneurs in Zimbabwe. The author uses a database of 1,842 registered agents

11
of the MPP that is supplied by Green Mobile in Zimbabwe. Of the 1,842 agents, 558 are
informal entrepreneurs. These informal agents facilitate registration by customers to use the
MPP. The author finds that most informal entrepreneurs have positive perceptions of the
service provider. However, he suggests that the service providers need to put in more effort
and time in educating the entrepreneurs about the functioning and added benefits of using the
platform (Thando, 2013).
Gakure and others (2013) undertake a descriptive analysis of the factors that contribute
to the performance of Mkesho in the Nairobi Region. According to the survey, the Mkesho
Account was launched by M-Pesa and Equity as an accessible and affordable bank account that
allows users to deposit and withdraw money from their account using an M-Pesa Account from
their handset. The main objective of the study is to investigate the factors that account for the
low adoption of Mkesho services by subscribers. The total number of registered users of
Mkesho during the survey period in May 2013 was about 700,000 people, which formed the
survey population. The study samples a total of 100 respondents, representing 0.0142 percent
of the population. The results show that 80 percent of the respondents do not use the Mkesho
services and only 20 percent of the subscribers use the service. This implies that most
customers had ceased to use the services of Mkesho, thus leading to a decline in the service.
The findings also identify the presence of other competitive and substitute products like
Mshwari, which are simple and easy to use. The lack of awareness about Mkesho by consumers
was a cause for the low adoption of the Mkesho service. This shows that there are more
underlying factors that affect the adoption of mobile technology besides perception and
attitudes.
This section explored the different theories advanced to explain the factors of mobile
banking penetration. As highlighted above, a multitude of research models have been proposed
to better predict the development of these services. However, it is found that there is still a lot
to be discovered on the determinants of these technologies, especially in Africa, using a macro
approach. First, a common aspect of a majority of these studies is that they use a micro
approach and/or a one-country focus to identify the determinants of mobile banking. Second,
the context of application of these studies is sometimes a continent other than Africa. Third,
the macro environment is ignored in the majority of methodologies applied and the literature
focuses more on the micro environment. Consequently, studies inform us more on the micro
factors of mobile banking development, and less on the macro factors, such as economic policy,
external flows, human development, institutional economy, economic development, and
business and capitalism. Fourth, the methodologies used are generally observation theories,

12
surveys, and statistical analyses, with fewer studies using an econometric analysis approach for
their empirical investigation.
3. Mobile Finance & Banking in Africa: Stylized Facts, Statistical Issues, and
Benchmarking
Developing countries, including African countries, could use the opportunity of mobile
banking to provide financial services to the unbanked individuals, given that the number of
mobile phones is more than the number of bank accounts. Africa ranked among the largest
continents in mobile penetration, with a higher growth rate of mobile phone subscribers,
whereas it has a lower number of bank branches. Mobile banking is a cheap way to offer
financial services in Africa. The fast-growing smartphone market in Africa, with prices
bottoming out and with more phone possibilites, is directly correlated with the growth of
mobile banking. As for broadband, connectivity is limited and has still not reached many areas
in Africa, and Internet usage is much lower compared to mobile phone diffusion.
The advancement of mobile communications and wireless technologies has led to a
rapid development in the sector of banking services using mobile phones. A good system with
much potential has the capacity to attract many customers who opt for banking services through
their mobile phones. The dynamism in the present era of technology, when many more options
are available, makes the mobile banking system attract more customers to use mobile banking
services. Recently, Africa has witnessed a very high growth in cellular phones usage, with
around 650 million customers in 2012. The lower access rate of formal banking highlighted
above, and the important volume of immigrant transfers, has contributed to unleashing the
increasingly effective and potential demand of financial services innovation. The banking
services started slowly in 2000 in Zambia, South Africa (which launched the biometrical
payment system in 2012), and the Philippines. Other countries have introduced innovations,
such as Kenya with the launch of M-PESA (a money transfer through SMS) and M-Shwari (a
banking service without folders) in 2007.
Interestingly, the provision rate of mobile banking (2.7 percent) appears to be less than
that of traditional banking (5 percent) in this case. However, the development of mobile
banking can improve communication and information exchange, formal savings, remittances
and reduce operating costs. More interestingly, informal finance, which appears to be important
in the African context, can be reabsorbed by the formal system and allows for data availability,
good investment, and well-informed governmental financial policy implementation.

13
However, recent studies of mobile banking adoption reveal that the adoption of mobile
banking services is still very low compared to the other banking channels (Wessels and
Drennan, 2010; Laukkanen and Kiviniemi, 2010; Zhou and others, 2010). Although, there are
many advantages of mobile banking, when compared with developed countries like the United
States, the United Kingdom, and Finland, the adoption of mobile banking in Africa is in its
infancy. Mobile banking has recently attained greater significance in Africa and there is a lack
of empirical studies related to the adoption of mobile banking and mobile phone penetration.
Additionally, there are no theoretical studies applied to the African context on the subject.
In order to present the results of our benchmarking exercise, it is important to recognize
that mobile penetration is a necessary but insufficient condition for mobile banking. Mobile
penetration is influenced by regulation in the mobile phone market, whereas mobile banking is
influenced by regulations in the banking industry. The figures in the appendix show that the
two are, of course, symbiotic and positively related.
Moreover, there is a mitigated link between mobile banking development indices and
pro-poor and inclusive growth in Africa. As shown in the figures in the appendix, depending
on the proxy of mobile banking development, there is either a positive or negative link with
pro-poor and inclusive growth.
Considering this information and conjectures, we need to carry out an econometric
assessment of the situation.
4. Data, Model, and Econometric Strategy
4.1 Data
Within the population of African countries, we examine a sample of 49 sub-Saharan African
countries, using data from the African Development Indicators (ADI), Governance
Development Indicators (GDI), and Financial Development and Structure Database (FDSD) of
the World Bank (WB).The mobile banking data is from the World Bank and the index of
economic freedom is from the Heritage Foundation. Other databases from the Gates
Foundation and Mastercard Foundation are not suitable to our investigation and were not
available for African countries.
Tables A.3 and A.4 along with A.6 in the appendix provide more details about a clear
and precise description of the data sources, the databases used, and the variables. In order to
construct our dependent variable, we used the principal component analysis.
Principal Component Analysis

14
The potentially high degree of substitution between Internet users, mobile bills, and mobile
send/received variables imply that some information could be redundant. Therefore, we employ
Principal Component Analysis (PCA) to mitigate the redundancy of common information in
the dependent variables. PCA is a widely employed statistical technique that is used to reduce
a large group of correlated variables into a smaller set of uncorrelated variables, which
represent a substantial degree of variation in the original dataset. These common factors are
called principal components (PCs). The criterion used to retain common factors is from Kaiser
(1974) and Jolliffe (2002), who recommend only PCs which have eigenvalues greater than the
mean value (greater than one). The underlying logic for using PCA is that, given the potentially
high correlation (degree of substitution) between mobile banking and mobile phone
penetration, more general policy implications may be obtained if the dependent variables are
represented by a common factor.
Without going into depth about the PCA technique, as it can be seen from table A.5 in
the appendix that the first PC, of both mobile bills and mobile send and received, accounts for
around 80 percent of the variation in all three constituents, while it accounts for 69 percent for
Internet users. The criteria applied to determine how many common factors to keep are taken
from Kaiser (1974) and Jolliffe (2002). Kaiser recommends dropping factors with an
eigenvalue less than one.
4.2 Models and methodology
In order to check the impact of mobile banking development on pro-poor and inclusive growth
and the determinants of mobile banking, we will use two different models.
The first model is based on the Cobb-Douglas function as follows:
{(𝑃𝑟𝑜𝑃𝑜𝑜𝑟&𝐼𝑛𝑐𝑙𝑢𝑠𝑖𝑣𝑒𝐺𝑟𝑜𝑤𝑡ℎ)𝑖,𝑡 = 𝛼0 + 𝛼1(𝑀𝑜𝑏𝑖𝑙𝑒𝐵𝑎𝑛𝑘𝑖𝑛𝑔)𝑖,𝑡 + 𝛼2𝑓(𝑋𝑖,𝑡) + 𝜀𝑖,𝑡
𝜀𝑖,𝑡 ~ 𝑖𝑖𝑑𝑁(0, 𝜎𝜀2)
(1)
where the left-hand-side includes variables on pro-poor and inclusive economic growth,
such as GDP per capita growth, poverty index, and GINI growth. The right-hand-side includes
variables on mobile banking (mobile banking index, mobile bills, mobile sent/received,
Internet users) and other control variables identified in the literature as fundamental factors of
inclusive and pro-poor economic growth. These include technological innovation; economic

15
policy; business and bank; economic development and physical capital; external flows; human
development; institutional and knowledge economy areas.
The estimation approach for the first model follows the study conducted by
Andrianaivo and Kpodar (2011), which are among the few panel data studies that focus on the
effects of mobile Information and Communication Technologies (ICT) on economic growth.
In these papers, the issue of reverse causality between mobile telecoms expansion and
economic growth is addressed by specifying a dynamic panel data model and estimating the
parameters using either the Generalized Method of Moments (GMM) technique or Least
Squares Dummy Variables (LSDV).
The econometric approach undertaken is the dynamic panel data estimation method
introduced by Arellano and Bond (1991). The choice of this approach is motivated by two main
factors. First, this technique allows the potential endogeneity of mobile banking data to be
addressed by using the lags of these variables as instruments. Second, a panel data technique
allows the best exploitation of the information contained in the dataset such as the cross-
country variation in the sample (at a given point in time, different countries are characterized
by different levels of mobile banking) and the time-series variation (for each country, mobile
data usage substantially varies over time).
For the mobile finance and banking development determinants model, due to the cross-
sectional structure of our data, we follow the theoretical model and the empirical specification
previously presented in the literature for this data structure (Andrés, 2006).The box in the
appendix presents the main lines for discussing the determinants of mobile banking.
i
n
c
cc
p
h
hhi YXMobileBank 1
21
10 (2)
Overall, for this second model, the dependent variable includes the “mobile banking
index,” “Internet users,” “mobile phone usage in the payment of bills,” and “mobile phone
usage in the sending/receiving of money,” respectively. As in the first model, independent
variables ( is a vector of determinants; is the set of control variables) are made up of
characteristics identified in the literature and concern technological innovation (Gutierrez and
Singh, 2013); economic policy; business and bank; economic development and physical
capital; external flows; household development; and institutional economy. All variables are
expressed in logarithm form, and to ensure a robustness analysis, we implement several
estimations of different specifications. is the constant; is the error term.

16
In order to estimate this model as explained above, we use the cross-sectional
estimation method. We choose this estimation method and this sample for the following main
reasons:
The data used concern only a specific point in time, with multiple variables at the time
of the data snapshot. First, the data can better help answer questions such as “Are there
systematic factors that are associated with mobile banking development?” Second, time
is assumed to have a random effect that produces only variance, not bias.
African countries generally have homogeneous characteristics and allow us to expect
that we can avoid outliers, which are data points with extreme values that could have a
negative effect on our estimators.
5. Presentation and Discussion of Estimation Results
In this section, we present and discuss the results of our main empirical investigations
concerning mobile banking development and pro-poor and inclusive growth, and we further
examine the determinants of mobile banking development.
5.1 Mobile finance & banking development, and pro-poor and inclusive growth
The results presented in table A.1 in the appendix show that there is an overall positive impact
of mobile banking development on pro-poor & inclusive growth. More specifically, mobile
banking impacts positively on GDP per capita with a higher rate when we consider our index.
Independent of the mobile banking proxy used, the sign is positive. Additionally, there is a
negative impact of both the mobile banking index and other proxies on GINI and poverty index.
When we consider the economic freedom index, there is a positive impact on GDP per capita
and a negative impact on GINI growth.
The control variables also have the expected signs, with exceptions in the case of net
interest margin, return on asset for GDP per capita growth, and public investment for GINI
growth. This may imply that business and bank activities/profits are not useful when we
consider its importance in terms of pro-poor and inclusive growth, and that states focusing on
increasing investment cannot help but have good results in terms of the reduction of
inequalities.
Overall, our estimates have the expected signs and we can therefore extrapolate the
usefulness of mobile banking development in the case of Africa. What about the determinants
of mobile finance & banking sector development in Africa?

17
5.2 Mobile finance & banking determinants
Table A.2 in the appendix presents results for the four different models when we consider four
different proxy variables for mobile finance &banking.
When we consider the estimation using the mobile banking development indices we
built with principal component analysis, we find that domestic credit, human capital, education,
remittances, trade openness, credible monetary policy, and infrastructure are key determinants
of mobile banking development in Africa. Human development is the strongest positive
determinant since its impact coefficient is the highest (1.968), followed by urban population
(0.455), infrastructure (0.155), domestic credit (0.097), education (0.040), credible monetary
policy (0.015), trade openness (0.010) and remittances (0.001).
Knowledge level and active population are relevant as human capital indicators in terms
of mobile banking development in Africa. Infrastructure development appears to be a mobile
banking development determinant since mobile phones function with a higher
telecommunications infrastructure and people are more comfortable when they are dealing with
good institutional infrastructure. A credible monetary policy appears to be important and is
therefore legitimized as contributing to mobile finance & banking development in Africa.
The urban population is also instrumental to mobile finance & banking development in
Africa. We can see that the urban population is a positive determinant of mobile banking when
we consider the estimation with a mobile banking index. This can be explained by the fact that
this variable is closely related to and thus drives the demand for mobile banking assets in
African countries. From a theoretical point of view, it is not surprising that domestic credit
positively impacts our dependent variable. By having higher financial capacity compared to
credit, the willingness to use mobile financial and banking services increases. Trade openness
and remittances are determinants of mobile banking development in Africa because those two
activities tend to increase financial capacity.
Some variables seem to hamper mobile finance & banking development, depending on
the economic environment. These variables are: net interest margin, return of asset, and bank
density. This could be explained by the fact that the way the traditional market is working and
gaining profitability seems to reduce the potential and development of the mobile banking
sector. This ambiguous empirical result might mean that the hypothesis of banking
development as a catalyzer of mobile banking should is relative since it seems to be relatively
detrimental. In fact, we can see that the banking sector is more developed than the financial
sector in Africa but we still have a low depth of mobile banking.

18
Focusing more on developing financial markets than on developing banks is imperative
in this context and should be encouraged by a clear government policy. This finding is a
contribution to the recent literature on financial development in Africa because previous works
have not highlighted this result. It is important to mention that this result does not imply the
implementation of policies against the existence of traditional banks because banks in Africa
are pioneers of mobile banking and financial services development. The finding suggests that
the government should now focus more on financial market development in order to boost
mobile banking and financial services development in Africa.
Financial markets and stock markets are less developed in almost all African countries.
A study by Beck and others (2011) shows that more banking development and less stock market
development is a key feature of the financial structure—this could be another reason why
several African countries have a weak mobile banking market since their financial structure is
more bank-based than market-based. In fact, we can see that this financial structure failed to
improve the mobile banking depth in Africa. For almost all these countries, there are several
public and private banks but the mobile banking depth remains low yet stable. Hence, policy
makers who are willing to boost mobile banking in Africa should strongly consider
strengthening the development of stock markets.
When we consider the mobile billing index, the determinants of mobile banking
development, in order of importance are: human development (2.045), infrastructure (0.144),
credible monetary policy (0.094), trade openness (0.045) and remittances (0.022). These results
are closely related to the ones obtained using the constructed index of mobile banking
development. The more interesting marginal information we have is the fact that human
development becomes a stronger determinant than before. The impact of trade openness,
credible monetary policy, and remittances impact are also higher relative to the previous
estimation. All of these results are consistent with the existing literature.
When we consider the Internet users index, the determinants are, in order: human
development (5.21), credible monetary policy (1.055), infrastructure (0.293), remittances
(0.122), and trade openness (0.045).
Finally, when we consider the mobile sent/received index, we have the following
determinants: human development (1.682), domestic credit (1.467), credible monetary policy
(0.253), infrastructure (0.082), remittances (0.048) and trade openness (0.002). Related to the
results presented in the paragraph above, there is a determinant specific to this proxy, which is
domestic credit. Domestic credit is therefore a factor of sending and receiving money using a
mobile phone, and not of bills payment using a mobile phone or Internet usage.

19
Overall, one determinant appears to be consistent to all our models, namely human
development. This determinant is positively and significantly related to mobile banking
development independent of the method used and proxy used. More interestingly, it presents
the highest impact relative to other determinants as highlighted by the results of this
investigation.
5.3 Robustness check
In order to verify that our results are robust and consistent with Young and Kroeger (2015), we
implement additional estimations by replacing some variables with their proxy, and by
changing the specification and estimation method. When changing the specification, we are
guided by the maximization of the number of observations relative to that of the main
estimation. Practically, it consists of either adding control variables, which might affect the
dependent variable, or removing some other control variables, with the aim of maximizing the
number of observations.
As can be seen in table A.1, for example, for the economic policy explanatory variables,
instead of using trade openness, CMP, and public investment, we use financial openness alone
to verify the robustness of our estimation. We do the same for business and bank proxies:
instead of considering interest rate spread and return on assets, as in the main estimation, we
use net interest margin, domestic credit, bank density, and return on equity. For economic
development and capital proxies, we use population growth, urban population, infrastructure,
and GDP per capita growth in place of GDP growth; for external flows, we replaced foreign
investment with foreign aid and remittances; for human development proxies, net transfers
have been replaced by human development, household expenditure, and domestic savings; for
institutional economy, governance is considered in place of education. Additionally, for our
robustness check, we moved among the three proxies of mobile banking and financial
development in Africa, which are mobile billing, mobile sent/received, and Internet users.
Our results are irrefutable since we have the same sign and significant variables as in
the main results discussed. By replacing some variables with their proxy, we were able to verify
whether we obtain the same result, independent of the fact that we use different measures for
the same variable. Overall, from the estimation results, we find that results remain unchanged
in terms of sign and significance of coefficients. Our findings also remain unchanged when
controlling for mobile finance & banking development with alternative indices.

20
6. Conclusion and Policy Recommendation
This paper uses a new database on mobile finance & banking across countries and several
econometric techniques to investigate the impact of mobile finance & banking on pro-poor &
inclusive growth, and identifies the main determinants of mobile finance &banking
development in Africa.
We begin by using a theoretical framework and highlighting stylized facts. Mainly, the
statistical analysis reveals that there is a positive link between mobile finance & banking
development and pro-poor & inclusive growth in Africa.
The estimation of our model of pro-poor & inclusive growth, using different
specifications, shows a positive impact of mobile finance & banking indices on both pro-poor
and inclusive economic growth in Africa.
Based on the result of this first analysis, the paper goes further by undertaking several
econometric analyses, which yield the following key findings. Concerning mobile banking
development determinants, we find that domestic credit, human capital, remittances, trade
openness, CMP, and infrastructure are key determinants of mobile banking development in
Africa, independent of the proxy used. Human development is the strongest positive
determinant since its impact coefficient is the highest. The CMP is also important and is
therefore legitimated as contributing to mobile finance & banking development in Africa.
Overall, African governments in their pursuit of good performance, in terms of mobile
banking development, should implement policies mainly oriented toward domestic credit
access facilitation, human capital development, remittances facilitation, trade openness, CMP,
and infrastructure development.

21
Appendix
Figure A.1: Mobile sent/received and mobile phone penetration in Africa
Figure A.2: Mobile bills and mobile phone penetration in Africa
Source: Author’s calculation. Source: Author’s calculation.
Figure A.3: Internet users and mobile phone penetration in Africa
Figure A.4: Mobile sent/received and mobile bills in Africa
Source: Author’s calculation. Source: Author’s calculation.
Figure A.5: Mobile sent/received and mobile banking in Africa
Figure A.6: Mobile bills and mobile banking in Africa
Source: Author’s calculation. Source: Author’s calculation.
y = 0,0633x + 5,0142R² = 0,024
0
10
20
30
40
50
60
70
0 20 40 60 80 100 120 140 160
Mo
bile
ban
kin
g (s
ent/
rece
ived
)
Mobile phone penetration
Mobilebanking(sent/received) = f(Mobilephonepenetration)Linear(Mobilebanking(sent/received) = f(Mobilephonepenetration))
y = -0,0137x + 4,0675R² = 0,0077
0
5
10
15
20
25
30
0 20 40 60 80 100 120 140 160
Mo
bile
Ban
kin
g (m
ob
ile b
ills)
Mobile phone penetration
Mobilebanking(mobilebills) =f(Mobilephonepenetration)
Linear(Mobilebanking(mobilebills) =f(Mobilephonepenetration))
y = 0,0015x - 0,0857R² = 0,0014
-2
-1
0
1
2
3
4
5
0 20 40 60 80 100 120 140 160
Inte
rnet
use
rs
Mobile phone penetration
Mobilebanking= f(mobilepenetration)
Linear(Mobilebanking= f(mobilepenetration))
y = 1,666x + 3,1734R² = 0,4047
0
10
20
30
40
50
60
70
0 5 10 15 20 25 30
Mo
bile
sen
t/re
ceiv
ed
Mobile bills
Mobilesent/received =f(mobilebills)
Linear(Mobilesent/received =f(mobilebills))
y = 0,0888x - 0,7672R² = 0,8181
-2
-1
0
1
2
3
4
5
0 10 20 30 40 50 60 70
Mo
bile
sen
t/re
ceiv
ed
Mobile banking
Mobilesent/received = f(Mobilebanking)
Linear(Mobilesent/received = f(Mobilebanking))
y = 0.2324x - 0.7633R² = 0.8181
-2
-1
0
1
2
3
4
5
6
0 5 10 15 20 25 30
Mo
bile
bill
s
Mobile banking
Mobilebills =f(Mobilebanking)
Linear(Mobilebills =f(Mobilebanking))

22
Figure A.7: Mobile banking and pro-poor growth in Africa
Figure A.8: Mobile bills and pro-poor GDP in Africa
Source: Author’s calculation. Source: Author’s calculation.
Figure A.9: Mobile sent/received and pro-poor GDP in Africa
Figure A.10: Mobile banking and pro-poor GDP in Africa
Source: Author’s calculation. Source: Author’s calculation.
Figure A.11: Mobile bills and pro-poor GDP in Africa Figure A.12: Mobile banking and pro-poor GDP in Africa
Source: Author’s calculation. Source: Author’s calculation.
y = 0,0235x + 2,5369R² = 7E-05
-10
-5
0
5
10
15
-2 -1 0 1 2 3 4 5
GD
P p
er c
apit
a gr
ow
th
Mobile banking
GDP percapitagrowth =f(Mobilebanking)
Linear(GDP percapitagrowth =f(Mobilebanking))
y = -0,0177x + 2,5813R² = 0,0004
-10
-5
0
5
10
15
0 5 10 15 20 25 30GD
P p
er c
apit
a
Mobile bills
GDP percapita =f(Mobilebills)
Linear(GDP percapita =f(Mobilebills))
y = 0,0061x + 2,4848R² = 0,0007
-10
-5
0
5
10
15
0 10 20 30 40 50 60 70GD
P p
er c
apit
a
Mobile sent/received
GDP percapita =f(Mobilesent/received)
Linear(GDP percapita =f(Mobilesent/received))
y = -0,3887x + 4,7669R² = 0,0175
-10
-5
0
5
10
15
20
-2 -1 0 1 2 3 4 5
GD
P g
row
th
Mobile banking
GDPgrowth =f(Mobilebanking)
Linear(GDPgrowth =f(Mobilebanking))
y = -0,0604x + 4,9725R² = 0,004
-10
-5
0
5
10
15
20
0 5 10 15 20 25 30
GD
P g
row
th
Mobile bills
GDPgrowth=f(Mobile bills)
Linear(GDPgrowth=f(Mobile bills))
y = -0,0392x + 5,1313R² = 0,0257
-10
-5
0
5
10
15
20
0 10 20 30 40 50 60 70
GD
P g
row
th
Mobile sent/received
GDPgrowth =f(Mobilesent/received)
Linear(GDPgrowth =f(Mobilesent/received))

23
Table A.1: Impact of mobile finance & banking on pro-poor & inclusive growth (panel data estimation) GDP Per Capita growth GINI growth Poverty
Mobile Banking Development &Technological innovation
Internet users 0.175** 0.043*** --- -0.01*** -0.01*** --- -0.52** ---
(0.015) (0.000) (0.000) (0.000) (0.008)
Mobile billing 0.042** --- --- --- -0.97** --- -0.053** --- (0012) (0.021) (0.019) Mobile S/R --- 0.007* --- 0.01*** --- --- --- ---
(0.086) (0.000)
Mobile banking -2.65 0.422*** 1.729*** --- --- -0.68** --- -0.001 (0.375) (0.000) (0.000) (0.009) (0.348) Economic freedom 1.058*** 0.175*** --- -0.009*** 0.124 --- 0.14 --- (0.000) (0.000) (0.000) (0.245) (0.702) Economic policy
Trade openness 1.05*** --- 0.315 -2.377 -3.008 -0.22*** 0.031 -0.008**
(0.000) (0.112) (0.433) (0.199) (0.008) (0.342) (0.022)
Financial openness 0.458 --- 0.155 --- --- -0.411 --- 0.086 (0.428) (0.455) (0.183) (0.175)
Money Supply -0.11* --- 0.191* --- --- 0.529 --- -1.001 (0.071) (0.076) (0.806) (0.444) CMP 0.055** --- 0.102* --- --- -0.078** --- -0.177 (0.004) (0.058) (0.016) (0.753) Public Investment -1.01 --- -0.971 --- --- 1.22*** --- 0.01***
(0.239) (0.354) (0.000) (0.007)
Business / Bank
Net Interest Margin
-1.22** -0.89* -2.65 2.067 -0.093 -1.42** 1.083 0.78***
(0.003) (0.052) (0.185) (0.709) (0.808) (0.015) (0.301) (0.001)
Domestic credit -2.030 0.104 -2.68 --- --- -1.68*** --- -2.15**
(0.249) (0.688) (0.184) (0.000) (0.035)
Interest Rate Spread
--- --- 1.058 --- --- 3.082 --- 1.452 (0.866) (0.113) (0.682)
Bank Density 10.6*** 3.89** 2.96** --- --- 1.022 --- 0.175 (0.000) (0.012) (0.025) (0.529) (0337) Return on Assets -1.55 0.632 -9.6*** --- --- 0.328 --- 1.002 (0.539) (0.556) (0.008) (0.193) (0.997) Return on Equity 0.150 -0.04 0.78** --- --- -0.017 --- -1.447 (0.470) (0.585) (0.013) (0.670) (0.887)
Economic development & capital
Infrastructure 5.009 0.21 1.435* -2.099 -1.093 -0.86*** -0.409 -1.55**
(0.922) (0.235) (0.064) (0.222) (0.603) (0.000) (0.189) (0.026)
Population growth --- 1.62 -35.18 --- --- 0.448 --- 0.117 (0.804) (0.105) (0.341) (0.102) Urban population --- 12.0*** 17.27*** --- --- 1.547 --- 0.448 (0.000) (0.000) (0.391) (0.993)
External Flows
Foreign Investment
0.289 --- 1.09** 0.306 0.139 -0.496* 0.089 -1.008 (0.133) (0.029) (0.312) (0.362) (0.062) (0.721) (0.229)
Foreign Aid --- 0122 2.099 0.185 -0.051 -0.002 -1.04 -0.018 (0.288) (0.422) (0.285) (0.502) (0.989) (0.955) (0.575) Remittances --- --- 0.009 -0.187 -0.75*** -0.060 -0.009** 0.001 (0.339) (0.431) (0.000) (0.814) (0.017) (0.113)
Human Development
Human Development
0.056 2.099 -0.081 --- 0.045 --- 1.89 --- (0.427) (0.449) (0.966) (0.272) (0.978)
Household expenditure
--- --- 1.007 0.054 --- --- --- --- (0.109) (0.839)
Domestic Savings --- --- -0.001 --- -0.341 -0.286 -0.504 -0.777 (0255) (0.152) (0.221) (0.348) (0.969)
Net transfer --- --- 0.089 --- --- -3.098 --- -1.55 (0.599) (0.822) (0.333) Institutional Economy
Education -0.099 0.006 -1.449 2.51*** --- -1.49*** --- -0.646***
(0.437) (0.111) (0.118) (0.000) (0.000) (0.002)
Governance --- --- 1.001 -3.627 0.922 -17.8*** 1.001 -2.05***
(0.221) (0.736) (0.934) (0.003) (0.444) (0.001)
Constant -28.65 -432*** -468*** -85.8*** -216*** -96.68 -12.6** 88.12 (0.375) (0.000) (0.000) (0.000) (0.000) (0.109) (0.018) (0.447) LSDV R² 0.981 0.903 0.985 0.901 0.809 0.999 0.706 0.802 Within R² 0.859 0.805 0.960 0.801 0.801 0.850 0.622 0.702 LSDV Fisher 41.9*** 42.4*** 98.06*** 29.95*** 29.5*** 37.5*** 18.9*** 24.7***
Cross Sections 6 30 6 37 38 22 18 22 Observations 25 190 25 251 238 145 109 145
Source: Author’s calculations. Note: OLS with HACSE: Ordinary Least Squares with Heteroscedascticity and Autocorrelation Consistent Standard Errors. LSDV: Least Squares Dummy Variable. *; **; ***: denote significance levels at 10%, 5% and 1%, respectively.

24
Table A2: Determinants of Mobile finance & banking (cross-sectional estimation)
Mobile billing Mobile sent/received Internet users Mobile banking Financial openness --- 0.044 --- -2.058 --- 0.045 --- -0.001 (0.225) (0.805) (0.205) (0.119) Economic policy
Trade openness 0.045** --- 0.002** --- 0.045** --- 0.010** --- (0.010) (0.050) (0.027) (0.013) CMP 0.094** --- 0.253* --- 1.055** --- 0.015** --- (0.014) (0.072) (0.048) (0.043) Public Investment 0.0004 --- -0.059 --- 0.001 --- -0.006 --- (0.991) (0.811) (0.257) (0.621)
Business/ Bank
Net Interest Margin --- -0.361 --- -0.060 --- 0.175 --- -0.050**
(0.378) (0.879) (0.448) (0.021)
Domestic credit --- -0.284 --- 1.467** --- 1.022 --- 0.097*
(0.204) (0.035) (0.809) (0.078)
Interest Rate Spread -0.208 --- 0.102 --- 1.001 --- 2.006 --- (0.124) (0.805) (0.560) (0.117) Bank Density --- -0.708 --- -0.403 --- -0.008 --- -0.205**
(0.120) (0.277) (0.608) (0.034)
Return of Assets 1.069 --- 1.855 --- 0.001 --- -1.009* ---
(0.205) (0.907) (0.308) (0.066) Return of Equity --- -0.170 --- 0.022 --- -1.008 --- -0.051 (0.338) (0.723) (0.905) (0.109)
Economic develop-ment& capital
GDP growth 0.122 --- 0.078 --- --- -0.001 0.044 --- (0.669) (0.244) (0.803) (0.477) Population growth --- 1.099 --- 1.001 --- 0.924 --- 0.305 (0.144) (0.703) (0.334) (0.112) Urban population --- 0.802 --- 1.077 --- 1.001 --- 0.455*
(0.338) (0.201) (0.129) (0.072)
Infrastructure --- 0.144** --- 0.082* --- 0.293** --- 0.155*
(0.018) (0.065) (0.042) (0.084)
GDP per capita growth
--- 0.008 --- 0.177 -0.000 --- --- 1.054 (0.188) (0.933) (0.449) (0.117)
External Flows
Foreign Investment -1.007 --- -1.089 --- 0.001 --- -0.042 --- (0.233) (0.924) (0.155) (0.415) Foreign Aid --- 0.071 --- 0.048 --- -0.188 --- 0.001 (0.577) (0.199) (0.805) (0.408) Remittances --- 0.022** --- 0.048*** --- 0.122* --- 0.001**
(0.039) (0.000) (0.075) (0.028)
Net transfer 1.093 --- 1.008 --- --- 1.098 1.001 --- (0.445) (0.551) (0.228) (0.198) Human Develo- pment
Human Development --- 2.045* --- 1.682** 5.21** 4.65** --- 1.968**
(0.056) (0.048) (0.013) (0.020) (0.012)
Household expenditure
--- 1.244 --- 1.0001 --- 0.009 --- 0.018 (0.533) (0.444) (0.210) (0.227)
Domestic Savings --- 0.008 --- 0.166 -0.003 --- --- 1.077 (0.288) (0.222) (0.589) (0.447)
Institutio-nal economy
Education -0.024 --- 0.065 --- --- -0.369 -0.003 0.040*
(0.277) (0.279) (0.364) (0.527) (0.052)
Governance --- 0.100 --- 0.044 -0.369 --- --- --- (0.277) (0.111) (0.304)
Constant -0.572 11.07* 3.711 15.78** -2.72*** -3.14*** -0.98*** 1.320 (0.413) (0.077) (0.650) (0.031) (0.000) (0.007) (0.000) (0.107)
Adjusted R² 0.420 0.608 0.489 0.169 -0.169 0.397 0.030 -0.197 Fisher 5.87*** 3.869 45.1*** 0.935 1.393 5.31*** 3.80** 3.108**
RAMSEY RESET 1.968 n.a 1.083 4.79** 0.336 1.800 0.571 0.230 (0.179) (0.375) (0.031) (0.721) (0.204) (0.572) (0.797) Observations 20 8 17 18 18 20 34 20
Source: Author’s calculations. Note: *,**,***: denote significance levels of 10%, 5%, and 1% respectively. The regressions are based on heteroscedasticity consistent standard errors.

25
TABLE A.3: MOBILE FINANCE & BANKING DEVELOPMENT IMPACT ON INCLUSIVE / PRO-POOR
ECONOMIC GROWTH
Variables category Proxy
Mobile Finance & Banking Development (4) Internet users per capita, Mobile Billing, Mobile S/R, Mobile Banking
Economic policy (5) CMP, Trade openness, financial openness, public investment, M3
Business/Bank(6) Investment incentives (Domestic credit, NIM, IRS, Bank density, ROA, ROE)
Economic development and physical capital (3) Market size, market growth, market structure
(Infrastructure, Popg, Population)
Institutional Economy (3) Governance, Education (SSE).
External Flows (3) FDI, Development Assistance, Remittances
Human development (4) Net transfer, HDI, HHCExp, Domestic savings
Source: Author’s calculations. Note: CMP: Credible Monetary Policy. Mobile S/R: Mobile phone used to send and receive money. M3: Money Supply. GFCF: Gross Fixed Capital Formation. NIM: Net Interest Margin. IRS: Interest Rate Spread. ROA: Return on Assets. ROE: Return on Equity. GDPg: GDP growth. Popg: Population growth. SSE: Secondary School Enrollment. Ubanpop: Urban population. FDI: Foreign Direct Investment. HDI: Human Development Index. HHCExp: Household Consumption Expenditure. TABLE A.4: MOBILE FINANCE & BANKING DETERMINANTS
Variables category Proxy
Economic policy (4) CMP, Trade openness, financial openness, public investment.
Business/Bank (7) Investment incentives (Domestic credit, NIM, IRS, Bank density, ROA, ROE)
Economic development and physical capital (6) Market size, market growth, market structure
(Infrastructure, GDPg, GDP per capita growth, Inequality, Popg, Population)
Institutional Economy (3) Governance, Education (SSE).
External Flows (3) FDI, Development Assistance, Remittances
Human development (4) Net transfer, HDI, HHCExp, Domestic savings
Source: Author’s constructions. Note: CMP: Credible Monetary Policy. M3: Money Supply. GFCF: Gross Fixed Capital Formation. NIM: Net Interest Margin. IRS: Interest Rate Spread. ROA: Return on Assets. ROE: Return on Equity. GDPg: GDP growth. Popg: Population growth. SSE: Secondary School Enrollment. Ubanpop: Urban population. FDI: Foreign Direct Investment. HDI: Human Development Index. HHCExp: Household Consumption Expenditure. Table A.5: PCA result for the construction of the mobile finance & banking index
Principal
Components
Component Matrix (Loadings) Proportion Cumulative
Proportion
Eigen
Value
MBills MSR Internet First PC 0.805 0.809 0.690 0.896 0.896 1.596 Second PC -0.805 0.809 0.690 0.156 1.000 0.386
Source: Author’s constructions. Note: PC: Principal Component. MBill: Mobile phone used to pay bills. MSR: Mobile phone used to send and receive money. Internet: Internet users (per capita).
26
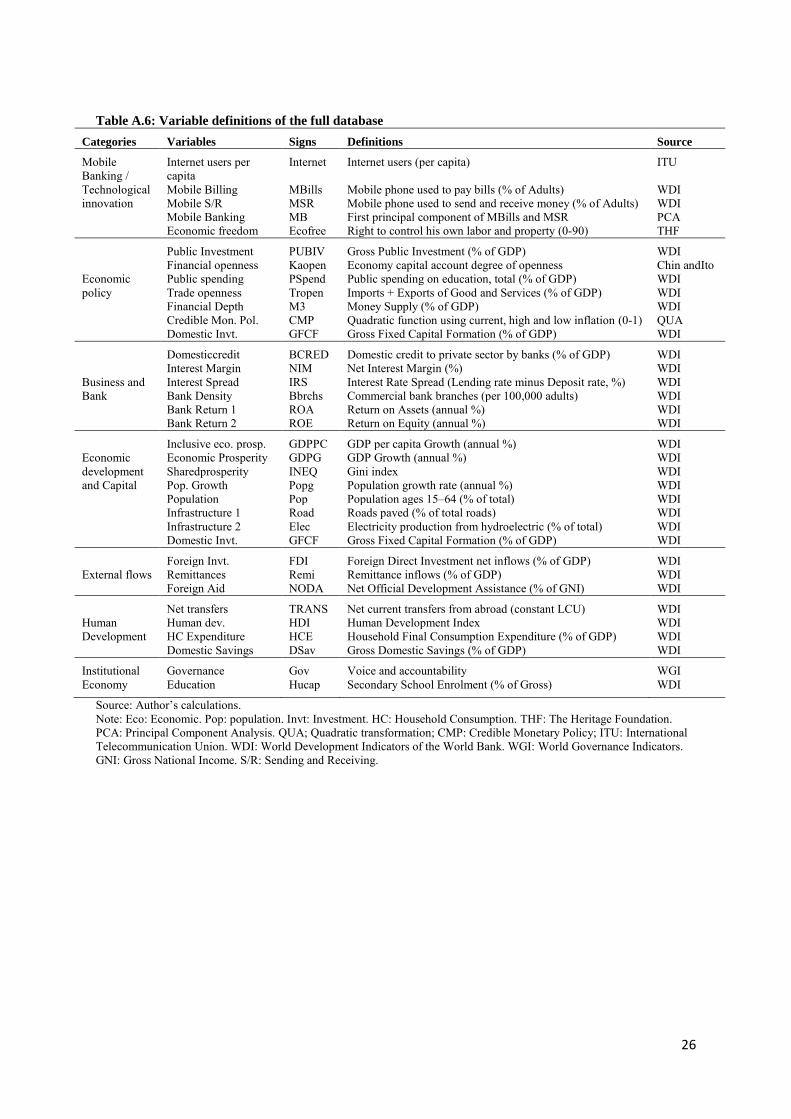
Table A.6: Variable definitions of the full database
Categories Variables Signs Definitions Source
Mobile Banking / Technological innovation
Internet users per capita
Internet Internet users (per capita) ITU
Mobile Billing MBills Mobile phone used to pay bills (% of Adults) WDI Mobile S/R MSR Mobile phone used to send and receive money (% of Adults) WDI Mobile Banking MB First principal component of MBills and MSR PCA Economic freedom Ecofree Right to control his own labor and property (0-90) THF
Economic policy
Public Investment PUBIV Gross Public Investment (% of GDP) WDI Financial openness Kaopen Economy capital account degree of openness Chin andIto Public spending PSpend Public spending on education, total (% of GDP) WDI Trade openness Tropen Imports + Exports of Good and Services (% of GDP) WDI Financial Depth M3 Money Supply (% of GDP) WDI Credible Mon. Pol. CMP Quadratic function using current, high and low inflation (0-1) QUA Domestic Invt. GFCF Gross Fixed Capital Formation (% of GDP) WDI
Business and Bank
Domesticcredit BCRED Domestic credit to private sector by banks (% of GDP) WDI Interest Margin NIM Net Interest Margin (%) WDI Interest Spread IRS Interest Rate Spread (Lending rate minus Deposit rate, %) WDI Bank Density Bbrchs Commercial bank branches (per 100,000 adults) WDI Bank Return 1 ROA Return on Assets (annual %) WDI Bank Return 2 ROE Return on Equity (annual %) WDI
Economic development and Capital
Inclusive eco. prosp. GDPPC GDP per capita Growth (annual %) WDI Economic Prosperity GDPG GDP Growth (annual %) WDI Sharedprosperity INEQ Gini index WDI Pop. Growth Popg Population growth rate (annual %) WDI Population Pop Population ages 15–64 (% of total) WDI Infrastructure 1 Road Roads paved (% of total roads) WDI Infrastructure 2 Elec Electricity production from hydroelectric (% of total) WDI Domestic Invt. GFCF Gross Fixed Capital Formation (% of GDP) WDI
External flows
Foreign Invt. FDI Foreign Direct Investment net inflows (% of GDP) WDI Remittances Remi Remittance inflows (% of GDP) WDI Foreign Aid NODA Net Official Development Assistance (% of GNI) WDI
Human Development
Net transfers TRANS Net current transfers from abroad (constant LCU) WDI Human dev. HDI Human Development Index WDI HC Expenditure HCE Household Final Consumption Expenditure (% of GDP) WDI Domestic Savings DSav Gross Domestic Savings (% of GDP) WDI
Institutional Economy
Governance Gov Voice and accountability WGI Education Hucap Secondary School Enrolment (% of Gross) WDI
Source: Author’s calculations. Note: Eco: Economic. Pop: population. Invt: Investment. HC: Household Consumption. THF: The Heritage Foundation. PCA: Principal Component Analysis. QUA; Quadratic transformation; CMP: Credible Monetary Policy; ITU: International Telecommunication Union. WDI: World Development Indicators of the World Bank. WGI: World Governance Indicators. GNI: Gross National Income. S/R: Sending and Receiving.

27
Box: Determinants of Mobile Banking
There are two main lines of discussion about the determinants of mobile banking. The first line takes into consideration the macroeconomic environment of the country; the second line presents some statistics on the proliferation of mobile telephony in Africa. The first line covers the characteristics of the macroeconomic context in which mobile banking is involved in Africa. The macroeconomic environment is favorable to the development of mobile banking because of the following reasons: First, from an international perspective, generally, we have in Africa a less internationally connected and developed banking and financial system. Therefore, the virtual connection offered by mobile telecommunications to households is an excellent alternative tool for banking and finance. Second, the context of an increasing level of fund transfers from abroad to Africa can be mobilized by well-established mobile banking, given a higher level of mobile penetration. Thirdly, it can help boost the investment activities.
The second line of discussion presents a picture of the proliferation of mobile banking with some statistics. The story of the growth of mobile phones in Africa is one of a massive and unexpected change in communications technology (Mbiti and Weil, 2011). From being virtually unconnected in the 1990s, more than 60 percent of Africa now has mobile phone coverage, and there are currently over ten times as many mobiles as landline phones in use (Aker and Mbiti, 2010). Aker and Mbiti have further stressed how African mobile phone coverage has progressed at a staggering rate over the past decade. In 1999, only 11 percent of the African population had mobile phone coverage, primarily in Southern (Kenya and South Africa) and Northern (Egypt, Algeria, Libya, Morocco, and Tunisia) Africa. By 2008, 60 percent of the population (477 million) could get a signal and an area of 11.2 million square kilometers (equivalent to the United States and Argentina combined) had mobile phone coverage. It was projected that by 2012, most villages in Africa would have coverage, with only a handful of countries relatively unconnected. Kenya has undergone a remarkable information and communication technology (ICT) revolution. By the 1990s, less than 3 percent of Kenyan households owned a telephone, and less than 1 in 1000 Kenyan adults had mobile phone service (Demombynes and Thegeya, 2012). However, by 2011, 93 percent of Kenyan households owned a mobile phone. The M-PESA mobile-banking network is largely credited for this dramatic change.
Source: Based on a literature review by the author.

28
The number of fixed telephone suscriptions in Africa is very low: Libya is the country with more subscriptions and has 11.3 per 100 inhabitants.
However, Internet usage is higher, especially in the northern and southern countries, where the Internet users reach even the 56.8 per 100 inhabitants like Morocco.
But nothing compared to Mobile Cellular subscriptions, higher than the 130 per 100 inhabitants in the north, west and south of the continent, like in South Africa or Botswana.

29
References
Abdinoor, A. and U. O. L., Mbamba 2017, Factors Influencing Consumers’ Adoption of
Mobile Financial Services in Tanzania, Cogent Business & Management, 4(1), 1-19.
Aker, J., and I. Mbiti, 2010, “Mobile Phones and Economic Development in Africa,” Journal
of Economic Perspectives, Vol. 24 (3), pp. 207–232.
Alesina, A., and D. Rodrik, 1994, “Distributive Politics and Economic Growth,” Quarterly
Journal of Economics,Vol. 109 (2), pp. 465–490.
Aliber, M., 2002. “Informal finance in the informal economy : promoting decent work among
the working poor,” ILO Working Papers 993576903402676, International Labour
Organization.
AllAfrica.com, 2011, “M-Pesa Disappoints for Vodacom SA,” AllAfrica.com, 28 June 2014.
https://allafrica.com/stories/201106030236.html
Andrés, A. R., 2006, “Software Piracy and Income Inequality,” Applied Economic Letters,
Vol. 13 (2), pp. 101–105.
Andrianaivo, M., and K. Kpodar, 2011, “ICT, Financial Inclusion, and Growth: Evidence
from African Countries,” IMF Working Paper 11/73 (Washington: International
Monetary Fund).
Arellano and Bond, 1991, “Some Tests of Specification for Panel Data: Monte Carlo
Evidence and an Application to Employment Equations”, The Review of Economic
Studies, Volume 58, Issue 2, April 1991, Pages 277–297
Asongu, S.A., 2013, “How Has Mobile Phone Penetration Stimulated Financial Development
in Africa?,” Journal of African Business, Vol. 14 (1), pp. 7–18.
———, 2014, “The Impact of Mobile Phone Penetration on African Inequality,”
International Journal of Social Economics, Vol. 42 (8), pp.706–716.
Asongu, S.A., and N.M. Odhiambo, 2017, “Mobile Banking Usage, Quality of Growth,
Inequality and Poverty in Developing Countries,” African Governance and
Development Institute, available online at www.afridev.org.
Auerbach, P., and J.U. Siddiki, 2004, “Financial Liberalization and Economic Development:
An Assessment,” Journal of Economic Surveys, Vol. 18 (3), pp. 231–265.
Barro, R., 1991 “Economic Growth in a Cross Section of Countries,” Quarterly Journal of
Economics, Vol.106 (2), pp.407–443.
Beck, T., Levine, R. E., et Loayza, N. 2000, “Finance and the sources of growth”, Journal of
financial economics 58 (1-2): 261-300.

30
Beck, T., Munzele M. S., Faye, I., Triki, T., 2011, Financing Africa: Through the Crisis and
Beyond. The World Bank, ISBN 978-0-8213-8797-9.
Beil, R., G. Ford, and J. Jackson, 2005 “On the Relationship between Telecommunications
Investment and Economic Growth in the United States,” International Economic
Journal, Vol.19 (1), pp. 3–9.
Besley, T. and A. R., Levenson, 1996, “The Role of Informal Finance in Household Capital
Accumulation: Evidence from Taiwan”. The Economic Journal, Vol. 106, No. 434
(Jan., 1996), pp. 39-59.
Christopoulos D. K. and Tsionas E. G., 2004, “Financial Development and Economic
Growth: Evidence from panel unit root cointegration tests”, Journal of Development
Economics, Vol. 73, PP. 55-74.
Cronin, F., E. Colleran, P. Herbert, and S. Lewitzky, 1993a “Telecommunications and
Economic Growth: The Contribution of Telecommunications Infrastructure
Investment to Aggregate and Sectoral Productivity,” Telecommunications Policy,
Vol.17 (9), pp. 677–690.
Cronin, F., E. Parker, E. Colleran, and M. Gold, 1991, “Telecommunications Infrastructure
and Economic Growth: An Analysis of Causality,” Telecommunications Policy, Vol.
15 (6), pp. 529–535.
———, 1993b, “Telecommunications Infrastructure Investment and Economic
Development,” Telecommunications Policy, Vol.17 (6), pp. 415–430.
Datta, A., and S. Agarwal, 2004, “Telecommunications and Economic Growth: A Panel Data
Approach,” Applied Economics, Vol. 36 (15), pp. 1649–1654.
Deininger, K., and L. Squire, 1998, “A New Data Set Measuring Income Inequality,” The
World Bank Economic Review, Vol. 10 (3), pp. 565–91.
Deisting, F., F. Makhlouf, and A. Naamane, 2012, «Développement financier, flux financiers
et croissance économique», Centre d’Analyse Théorique et de Traitement des données
économiques, University of Pau, Working Paper Series No. 10 (Pau, France: CATT).
Deloitte, 2008, “Economic Impact of Mobile Communications in Serbia, Ukraine, Malaysia,
Thailand, Bangladesh, and Pakistan,” Report prepared for Telenor ASA. January
2008.
Demombynes, G., and A. Thegeya, 2012, “Kenya’s Mobile Revolution and the Promise of
Mobile Savings.” World Bank Policy Research Working Paper, No. 5988
(Washington: World Bank).

31
Dutta, A., 2001, “Telecommunications and Economic Activity: An Analysis of Granger
Causality,” Journal of Management Information System, Vol. 17 (4), pp. 71–95.
Dzokoto, V. A., and E.C. Mensah, 2011, “Making Sense of a New Currency: An Exploration
of Ghanaian Adaptation to the New Ghana Cedi,” Journal of Applied Business and
Economics, Vol. 10 (5), pp. 11–15.
Easterly, W., 1993. “How Much Do Distortions Affect Growth”, Journal of Monetary
Economics, Vol 32, N°4, pp. 187-212.
Enriquez, L., S. Schmitgem, and G. Sun, 2007, “The True Value of Mobile Phones to
Developing Markets.” Research in Brief. McKinsey Quarterly (February).
Fox, M. and Vandroogenbroeck, N., 2017. “Les nouveaux modèles de mobile banking en
Afrique : un défi pour le système bancaire traditionnel”, Gestion 2000, 34(5), 337-360
Gakure, R., E. Anene, I.K. Arimi, J. Mutulu, and P.G. Kiara, 2013, “Factors Contributing to
Low M-kesho Adoption among Subscribers,” International Journal of Social Sciences
and Entrepreneurship, Vol. 1 (6), pp. 84–97.
Gertler, M., and A. Rose, 1994, “Finance, Public Policy, and Growth” in Financial Reform:
Theory and Experience», ed. by G. Caprio, I. Atiyas, and J. Hanson (New York:
Cambridge University Press).
Goudie, A., and P. Ladd, 1999, “Economic Growth, Poverty, and Inequality,” Journal of
International Development, Vol. 11 (2), pp. 177–195.
Gray, V., 2006, “The Un-wired Continent: Africa’s Mobile Success Story,” International
Telecommunication Union, Geneva, Switzerland.
Gutierrez, E. and S. Singh, 2013, “What Regulatory Frameworks Are More Conducive to
Mobile Banking?: Empirical Evidence from Findex Data,” World Bank Policy
Research Working Paper, No. 6652 (Washington: World Bank).
Hardy, Andrew P., 1980, “The Role of the Telephones in Economic Development,”
Telecommunications Policy, Vol. 4 (4), pp. 278–286.
International Telecommunication Union (ITU), 2007, “Telecommunication/ICT Markets and
Trends in Africa” (Geneva: ITU).
Islam, N., 1995 “Growth Empirics: A Panel Data Approach,” Quarterly Journal of
Economics, Vol. 110 (4), pp. 1127–1170.
Jolliffe, I.T., 2002, Principal Component Analysis, 2nd ed. (New York: Springer).
Jonathan, D., and T. Camilo, 2008, “Mobile Banking and Economic Development: Linking
Adoption, Impact, and Use,” Asian Journal of Communication, Vol. 18 (4), pp. 318–
322.

32
Khan, M. S. and Senhadji. A. S., 2000. “Financial Development and Economic Growth : An
Overview”, IMF Working Paper, N°209.
Kaiser, H. F., 1974, “An Index of Factorial Simplicity,” Psychometrika, Vol. 39, pp. 31–36.
King, R.G., and R. Levine, 1993a, “Finance and Growth: Schumpeter Might Be Right,”
Quarterly Journal of Economics, Vol. 108 (3), pp. 717–737.
———, 1993b, “Finance, Entrepreneurship, and Growth: Theory and Evidence,” Journal of
Monetary Economics, Vol. 32 (3), pp. 513–542.
Korir, G., 2012, “Factors Influencing Mobile Banking in Kenya: A Case Study of Kenya
Commercial Bank in Garissa” (thesis; Nairobi: University of Nairobi).
Kuznets, S., 1955, “Economic Growth and Income Inequality,” American Economic Review,
Vol. 45 (1), pp.1–28.
Lansana, B., 2012, «Cointégration et causalité entre croissance économique et développement
financier: Pays de la CEDEAO et de l’UEMOA», International Research Journal of
Finance and Economics, ISSN 1450-2887, Issue 91.
Laukkanen, T., and V. Kiviniemi, 2010, “The Role of Information in Mobile Banking
Resistence,” International Journal of Bank Marketing, Vol. 28 (5), pp. 372–388.
Lee, S.H., J. Levendis and L. Gutiérrez, 2012, “Telecommunications and Economic Growth:
An Empirical Analysis of Sub-Saharan Africa” Applied Economics, Vol. 44 (4), pp.
461–469.
Levine R. (1997), “Financial Development and Economic Growth: Views and Agenda”,
Journal of Economic Literature, Vol. 35.
Levine, R., 2004, “Finance and Growth: Theory and Evidence,” NBER Working Paper
Series, No. 10766, National Bureau of Economic Research, (Cambridge,
Massachusetts: NBER).
Levine, R., and D. Renelt, 1992 “A Sensitivity Analysis of Cross-Country Growth
Regressions,” American Economic Review, Vol. 82 (4), pp. 942–963.
Madden, G., and S. Savage, 2000, “Telecommunications and Economic Growth,”
International Journal of Social Economics, Vol. 27 (7), pp. 893–906.
Malhotra, R., 2011. “Factors Affecting the Adoption of Mobile Banking in New Zealand”,
Thesis, University of Nairobi.
Mankiw, N., D. Romer, and D. Weil, 1992, “A Contribution to the Empirics of Economic
Growth,” Quarterly Journal of Economics, Vol. 107 (2), pp. 407–437.
Maradung, P., 2013. “Factors Affecting the Adoption of Mobile Money Services in the
Banking and Financial Industries of Botswana”. Thesis, North West University.

33
Maurer, B., 2008, “Retail Electronic Payments Systems for Value Transfers in the
Developing World,” Department of Anthropology, University of California.
Mbate, M., 2013, “Domestic Debt, Private Sector Credit, and Economic Growth in Sub-
Saharan Africa,” African Development Review, Vol. 25 (4), pp. 434–446.
Mbiti, I., and D.N. Weil, 2011, “Mobile Banking: The Impact of M-Pesa in Kenya,” NBER
Working Paper Series, No.17129, National Bureau of Economic Research,
(Cambridge, Massachusetts: NBER).
Meisel, L., and J.P. Mvogo, 2007, «Quelle politique de développement financier en zone
franc ?», Agence Française de développement (AFD), Octobre 2007, N°=23.
Merritt, C., 2010, “Mobile Money Transfer Services: The Next Phase in the Evolution in
Person-to-Person Payments,” Federal Reserve Bank of Atlanta, Retail Payments Risk
Forum White Paper.
Ndebbio, J.E.U., 2004, “Financial Deepening, Economic Growth, and Development:
Evidence from Selected SSA Countries,” African Economic and Research
Consortium, Research Paper 142 (Nairobi: AERC).
Nguena, C. L., 2012, “Rethinking Pro-Growth Monetary Policy in Africa: Monetarist versus
Keynesian Approach,” Africa Economic Brief , 4(6), pp. 1–8.
———, 2015, “Boosting Investment and Business Environment in Africa Today: Mobile
Banking as an Optimal Strategy for Financial Inclusion,” Available online at
http://nguena.blogspot.com/2015/02/boosting-investment-and-business_13.html.
Nguena, C. L., and R.T. Nanfosso, 2015, “Importance des Politiques Financières dans la
Croissance Economique en Zone CEMAC: Approche en Données de Panel,” African
Development Review, Vol. 27 (1), pp. 52–66.
Ngugi, B., M. Pelowski, and J.G. Ogembo, 2010, “M-pesa: A Case Study of the Critical
Early Adopters’ Role in the Rapid Adoption of Mobile Money Banking in Kenya,”
Electronic Journal on Information Systems in Developing Countries (EJISDC), Vol.
43 (3), pp. 1–16.
Ondiege, P., 2010, “Mobile Banking in Africa: Taking the Bank to the People,” Africa
Economic Brief, Vol. 1 (8), pp. 1–16.
Ovum, 2006. “Report on economic benefits of mobile services in India” – a case study for the
GSM association.
Pagano, M., 1993, “Financial Markets and Growth: An Overview,” European Economic
Review, Vol. 37 (2–3), pp. 613–622.

34
Perkins, P., J. Fedderke, and J. Luiz, 2005, “An Analysis of Economic Infrastructure
Investment in South Africa,” South African Journal of Economics, Vol. 73 (2), pp.
211–228.
Pesaran, M., Y. Shin, and R. Smith, 2001 “Bounds Testing Approaches to the Analysis of
Level Relationships,” Journal of Applied Econometrics, Vol.16 (3), pp. 289–326.
Porteous, D., 2007, “Just How Transformational is M-Banking?”Bankable Frontier
Associates LLC, commissioned by Finmark Trust.
Ravallion, M., and S. Chen, 1997, “What Can New Survey Data Tell Us about Recent
Changes in Distribution and Poverty?”World Bank Economic Review, Vol. 11 (2), pp
357–382.
———, 2003, “Measuring Pro-Poor Growth,” World Bank Policy Research Working Paper
No. 2666 (Washington: World Bank).
Röller, L., and L. Waverman, 2001, “Telecommunications Infrastructure and Economic
Development: A Simultaneous Approach,” American Economic Review, Vol. 91 (4),
pp. 909–923.
Roubini, R., and X. Sala-i-Martin, 1992, “Financial Repression and Economic Growth,”
Journal of Development Economics, Vol. 29 (1), pp. 5–30.
Tchouto, L., and C. L. Nguena, 2015, “Innovation financière et développement durable au
Cameroun : pourquoi le développement du mobile banking est-il important ?,” AAYE
Policy Research Working Paper Series, No. 15/029 (Yaounde : Association of African
Young Economists).
Thacker, K.U.M., and G.A.N. Wright, 2012, “Building Business Models for Money,”
MicroSave Briefing Note No.116, available online at
http://www.microsave.net/files/pdf/1352116537_BN_116_Building_Business_Model
s_for_Mobile_Money.pdf.
Thando, M., 2013, “Perceptions and Adoption of Mobile Payment Platforms by
Entrepreneurs in Zimbabwe’s Informal Economy” (thesis; Johannesburg: University
of the Witwatersrand).
The Economist, 2008, “Halfway There: How to Promote the Spread of Mobile Phones among
the World’s Poorest,”
http://www.economist.com/node/11465558?story_id=11465558.
Thiel, M., 2001. “Finance and Economic Growth: A Review of Theory and available
Evidence”, European Union, Directorate General for Economic and Financial Affairs,
N°158.

35
Tiwari, R., and S. Buse, 2007, The Mobile Commerce Prospects: A Strategic Analysis of
Opportunities in the Banking Sector (Hamburg: Hamburg University Press).
Venkatesh, V., and F.D. Davis, 2000, “A Theoretical Extension of the Technology
Acceptance Model: Four Longitudinal Field Studies,” Management Science, Vol. 45
(2), pp. 186–204.
Vodafone Group, 2005, “Africa: The Impact of Mobile Phones.” Vodafone Policy Paper
Series, No. 2.
Wachtel, P., 2001. “Growth and Finance: What do we know and How do we know it”,
International Finance, Vol 4, N°3, pp. 335-362.
Wessels, L., and J. Drennan, 2010, “An Investigation of Customer Acceptance of M-
Banking,” International Journal of Bank Marketing, Vol. 28 (7), pp. 547–568.
Wolde-Rufael, Y., 2007, “Another Look at the Relationship between Telecommunications
Investment and Economic Activity in the United States,” International Economic
Journal, Vol. 21 (2), pp. 199–205.
Young, C. and K., Kroeger, 2015. “Model Uncertainty and Robustness: A Computational
Framework for Multi-Model Analysis”, http://p-
curve.com/Supplement/Supplement_pcurve2.pdf
Zhou, T., Y. Lu, and B. Wang, 2010, “Integrating TTF and UTAUT to Explain Mobile
Banking User Adoption,” Computers in Human Behavior, Vol. 26 (4), pp. 760–767.