moat analytics onboarding guide...2019 oracle data cloud moat analytics onboarding guide | 10 an ftp...
TRANSCRIPT

©2019 Oracle Data Cloud Moat Analytics Onboarding Guide
MOAT ANALYTICS ONBOARDING GUIDE

©2019 Oracle Data Cloud Moat Analytics Onboarding Guide | 2
REAL-TIME ANALYTICS
How Will Moat Analytics Help You?
■ Attention & Viewability Collect and leverage the attention metrics that matter across desktop, mobile, and mobile in-app
■ Transparency Get greater transparency and accountability throughout the digital advertising ecosystem
■ Real-Time Optimization Optimize campaigns to any metric or combination of metrics in real time
■ Industry Benchmarks Quickly understand your brand’s relative performance to the industry
■ Brand Effectiveness Connect Moat Metrics to your 1st party data for a complete picture
■ Instant Presentations Export data, graphs, and heat maps directly to PowerPoint, Excel, or CSV
Unique Features
CAMPAIGN PERFORMANCESite-level analytics by campaign, creative, site, and more
FORMATInsights by format including ad size or type
TRENDSCreate instant trend graphs and exports
BENCHMARKS Stay current with aggregated quarterly benchmarks
MOAT BRAND SCOREAd effectiveness score and benchmarks
CUSTOMIZABLE TEMPLATESObtain presentation-ready templates in real time
ALERTSKnowledgeable campaign performance notifications
VIEWABILITY DIAGNOSTICInsightful breakdown of key viewability metrics
MOAT LIVEFollow and analyze real-time campaign data

©2019 Oracle Data Cloud Moat Analytics Onboarding Guide
SECTION 1
CREATING ALERTS IN THE DASHBOARD

©2019 Oracle Data Cloud Moat Analytics Onboarding Guide | 4
1. Initial Setup
Moat Analytics offers you the ability to
set up alerts in your dashboard. Alerts
can be set to notify you of changes in
your Moat data.
Creating Alerts in the Dashboard
2. Recommended Alerts
Moat offers several recommended
alerts, as well as the ability to create
custom alerts.
3. Customize Alerts
Simply select the alert type, scope,
and metrics you would like included
in the alert.
3
2
1
SETTING UP ALERTS

©2019 Oracle Data Cloud Moat Analytics Onboarding Guide | 5
4
5
4. Set Up Dimension Filters
Moat Alerts allows you to get very
granular with dimension filters and
send alerts to any recipient.
5. Preview Email Alerts
Before creating, you can preview
how email alerts will appear when
the parameters are met.
Creating Alerts in the Dashboard
ANY QUESTIONS?
Reach out to your Account Manager or [email protected]

©2019 Oracle Data Cloud Moat Analytics Onboarding Guide
SECTION 2
CREATING EXPORTS IN THE DASHBOARD

©2019 Oracle Data Cloud Moat Analytics Onboarding Guide | 7
Creating Exports in the Dashboard
EXPORTING DATA FROM MOAT ANALYTICS
Moat offers you two options for
exporting data: Fixed Date Range
& Recurring Exports
1. Navigate to the desired tile; click
‘Exports’ in the upper right-hand corner.
2. Select the ‘Export CSV’ tab.
3. From within the Export CSV view,
select between ‘Fixed Date Range’
and ‘Recurring Export.’
Fixed Date Range Exports
Select ‘Fixed Date Range’ under Report Type
1. Under Dimensions, include desired
Dimensions by selecting the
checkboxes. Select specific entries
within a dimension using the drop-
down menus.
2. To export data at the current view
of the dimensions and metrics, click
‘Current View.’
3. After Dimensions are chosen,
select the desired Metrics using the
checkboxes on the right-hand side.
Note: More granular requests equate
to a larger file size and longer load time.
4. Navigate to the bottom of the Export
window and click ‘Export CSV’ for a
one-time export.
5. To save as a template, click ‘Save.’
Saved exports will remain in the
user’s default folders.
1
2
3
2
4
5
3
1

©2019 Oracle Data Cloud Moat Analytics Onboarding Guide | 8
Recurring Exports
Select ‘Recurring Export’ under
Report Type
1. To create a recurring export, select
‘Recurring Export’ under the Export
Type and select the desired frequency:
‘Daily, Weekly, or Monthly.’
2. Once all desired Dimensions and
Metrics have been selected, specify
the destination for the report. Under
Destinations, click ‘Create New.’
3. To deliver the report by email, click the
‘Type’ dropdown and select ‘Email’ for
delivery to email. The other options for
export destinations include FTP and
SFTP (File Transfer Protocol and Secure
File Transfer Protocol). They are each
created in the exact same process.
4. Enter the desired recipient’s email
address and click ‘Save.’ The recurring
export will now be set. Any recurring
reports set up in the past for a given tile
will appear under “Saved Exports” and
can be edited or deleted at any time.
1
23
4
5
Creating Exports in the Dashboard
File-naming Conventions
In terms of naming conventions for the exports, the best
practice is adding macros that will autopopulate so the
recipients can know the date range for the reporting.
For reference, these are the macros we can use:
■ {start_date:%Y%m%d}
■ {end_date:%Y_%m_%d}
The part after the colon is completely customizable;
insert the date as desired. Here is an example of the
naming conventions:
Moat_ClientName_Export{start_date:%m_%d_%Y}-{end_
date:%m_%d_%Y}

©2019 Oracle Data Cloud Moat Analytics Onboarding Guide | 9
EXPORT FAQS
Question 1: Can the dashboard provide
reporting broken out by weeks, months,
or quarters?
Yes, both the Fixed Date Range Exports
and Recurring Exports can be grouped by
the following intervals: day, week, month,
or quarter. This feature can be found by
selecting the ‘Date’ checkbox and toggling
on the desired grouping option from the
drop-down menu.
Question 2: When are recurring
monthly and weekly exports delivered?
Users can set a starting date for all
recurring exports.
Question 3: Can recurring exports
be edited?
Recurring exports can be edited by going
into the export tab in the UI, scrolling
down to Saved Exports, and clicking the
‘Edit’ button beside it. The edit function
allows the user to add/delete dimensions,
metrics, or change the frequency and
name of the export. Please make sure to
click the ‘Save’ button.
Question 4: Can recurring exports
be deleted?
Recurring exports can be deleted by going
into the export tab in the UI, scrolling
down to the export, and clicking the
‘Delete’ button beside it.
1
2
3
4
Creating Exports in the Dashboard

©2019 Oracle Data Cloud Moat Analytics Onboarding Guide | 10
An FTP is used as a location to transfer files
between a client and server on a network.
Typically an FTP is used when:
■ Clients want to write a script to ingest large
files directly into their systems programmatically
■ Clients want their organizations to be able to
access these files (rather than just the select
few in an email)
■ Clients want to host files on their own servers
Clients should have their own credentials to set
up the destination of their FTP exports. Otherwise,
Moat can set up an FTP manually.
To set the FTP destination:
1. Select ‘Export’ > then ‘Export CSV’ from
the dashboard.
2. Choose ‘Recurring Export.’
3. Scroll down to ‘+ Create New.’
4. Fill out the fields below with the
necessary credentials.
5. Name the export and click ‘Save.’
Amazon’s Simple Storage Service is a popular cloud
storage service. It is used to store and retrieve any
amount of data from anywhere on the web. Clients
sometimes use S3 over FTP to store data for a
number of reasons, including cost and security.
To set the S3 destination:
1. Select ‘Export’ and then ‘Export CSV’ from
the dashboard.
2. Choose ‘Recurring Export.’
3. Scroll down to ‘+ Create New.’
4. Select ‘S3’ as ‘Type.’
5. Fill out the fields below with credentials (note:
‘Bucket’ and ‘Key Pattern’ are optional fields).
6. Name the export and click ‘Save.’
7. Users can access their recurring exports using
the clients of their choice. Enter the credentials
to gain access to the export.
Creating Exports in the Dashboard
ADDITIONAL EXPORT DELIVERY METHODS
S3FTP

©2019 Oracle Data Cloud Moat Analytics Onboarding Guide | 11
Creating Exports in the Dashboard
MOAT LIVE
Moat Live is a real-time dashboard that highlights how well different ads are performing across both display
and video. Moat Live is password-protected and offers both a real-time and summary viewing option.
Exporting Data from Moat Live
1. Navigate to the desired tile; click
‘Exports’ in the upper right-hand corner.
2. Select the ‘Export to Moat Live’ tab.
3. Within the Export to Moat Live
view, select an Advertiser and/or
Campaign view.
4. Manually enter or Auto-Generate
a password.
5. Select Export to Moat Live to view
the dashboard.
Real-Time View provides a visual overview of real-time activity as users view and interact with creatives.
This view offers a breakdown by device segments, impression velocity, engagements, completions, top sizes
or sections, and a complete creative gallery (across display).
Summary View provides a visual overview of campaign or advertiser performance to date. This view looks
at total exposure time, total engagements, total completions, a summary of audience device segments, top
overall sizes or sections, and a complete creative gallery (across display).

©2019 Oracle Data Cloud Moat Analytics Onboarding Guide | 12
EXPORT TO POWERPOINT
Users can see screenshots of the display creatives and heatmaps based on user engagement within the
creatives. These can be found by selecting the ‘Creative’ level in the drop-down menu beneath Advertiser:
Attention Metrics
■ Hovers – When a user breaks the frame of the creative with his or her cursor in a desktop environment.
■ Interactions – When a user hovers over the creative and remains active within the frame of the ad for
at least half a second in the desktop environment.
■ Clicks – When a user performs any sort of mouse-down activity on the creative on a desktop. This does
not have to be a click-through to be recorded.
■ Touches – When a user touches within the frame of the creative on a mobile device.
The technology Moat uses to capture screenshots and heatmaps is separate from how Moat tracks and
measures data. Thus, regardless of whether or not screenshots and heatmaps are present in your dashboard,
your creative data will be accurate.
Creating Exports in the Dashboard

©2019 Oracle Data Cloud Moat Analytics Onboarding Guide | 13
Predictive Heatmaps
Predictive heatmaps appear when not enough activity is recorded for the creative in question. Moat
generates these heatmaps using our image-sourcing technology, based on Moat algorithms and the
creative aesthetics, to determine where we would likely see user attention.
Manually Uploading Creatives
To manually upload a creative image, click on the camera icon above ‘Pending Screenshot’ for the creative
you are trying to update. After that, drag the creative into the picture field. Refresh the page and the
dashboard will display your creative.
Industry-Wide Limitations on Collecting Screenshots and Heatmaps
■ Hostile iFrame rate – Can prevent from capturing the creatives that ran and evaluating how users
interacted with these creatives.
■ Minimum activity thresholds – Can hinder the ability to generate heatmaps based on user activity
without a statistically significant amount of user data.
■ HTML5 Creatives – Can obstruct the ability to collect screenshots and user data if creatives of this type
are not served through DFP.
Creating Exports in the Dashboard

©2019 Oracle Data Cloud Moat Analytics Onboarding Guide
SECTION 3
VIEWABILITY DIAGNOSTICS
©2019 Oracle Data Cloud Moat Analytics Onboarding Guide | 15
Viewability Diagnostics
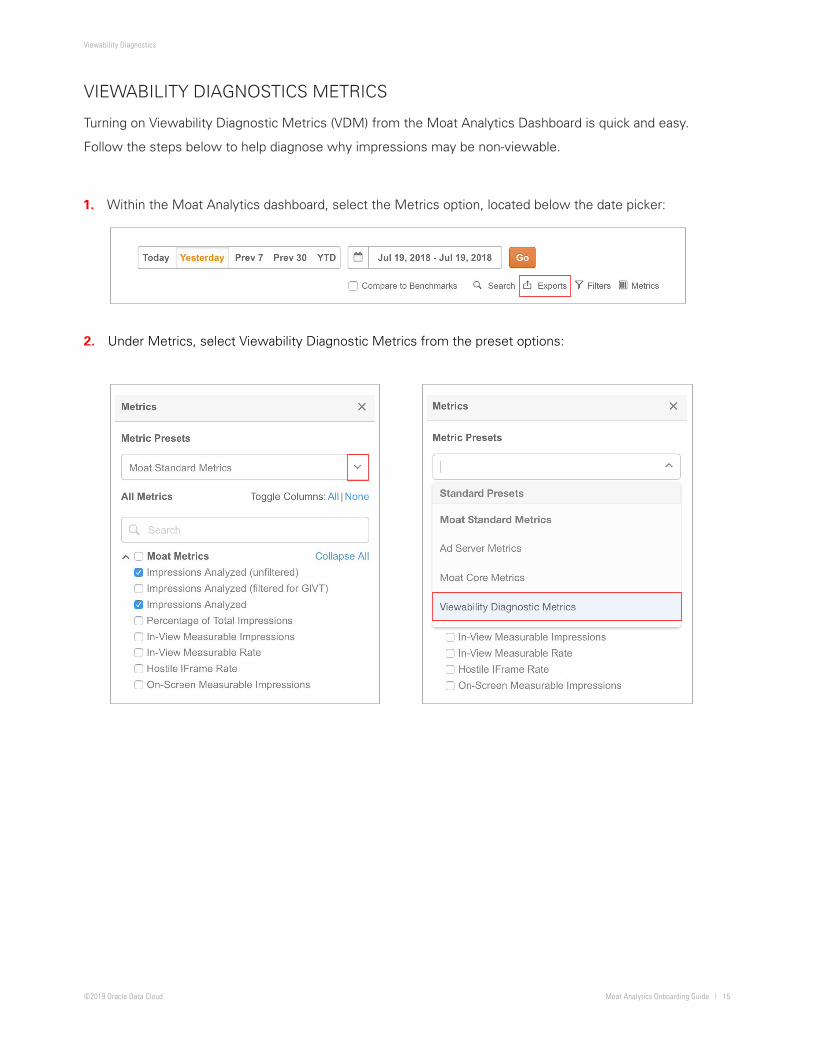
VIEWABILITY DIAGNOSTICS METRICS
Turning on Viewability Diagnostic Metrics (VDM) from the Moat Analytics Dashboard is quick and easy.
Follow the steps below to help diagnose why impressions may be non-viewable.
1. Within the Moat Analytics dashboard, select the Metrics option, located below the date picker:
2. Under Metrics, select Viewability Diagnostic Metrics from the preset options:

©2019 Oracle Data Cloud Moat Analytics Onboarding Guide | 16
Viewability Diagnostics
The Moat Analytics dashboard allows users to take a deeper dive into viewability.
The viewability diagnostic chart allows you the ability to granularly understand performance across a given:
■ Site
■ Placement
■ Size
■ Advertiser
■ Browser
To see the chart in the dashboard, click on any metric in the row you want to drill into, and select the
Viewability Diagnostics tab. This information is easily exportable from the dashboard in either the image
or PowerPoint form.

©2019 Oracle Data Cloud Moat Analytics Onboarding Guide | 17
Viewability Diagnostics
Once the Viewability Diagnostic Metrics are enabled, metrics will show the symptoms that are impacting viewability.
The Viewability Diagnostics identify four core reasons for missing a viewable impression, which are
illustrated in the impression funnel below:
Out-of-Focus RateThe percent of impressions where the tab containing the ad was never brought into the foreground.
Was the browser tab containingthe ad in focus (i.e., not
minimized or backgrounded)?
Out-of-Sight RateThe percent of impressionswhere the ad was in aforegrounded tab, but thevisitor did not see anyportion of the ad.
Was at least some portion of the ad visible?
Missed Opportunity (Area) RateThe percent of impressionswhere the visitor saw part of the ad but did not see at least 50% of the ad.
Was more than 50%of the ad visible?
Missed Opportunity (Time) RateThe percent of impressions where the visitor saw at least 50% of the ad but did not view the ad for at least a second.
If the answer to all of the above questions is yes, then the ad has met
the criteria to be In-View! Those impressions that fell short and did not
become viewable will fall under one of the four diagnostic metrics.
Was the advisible for at
least onecontinuous
second?
ViewableImpression!
YES
NO
YES
NO
YES
NO
YES
NO

©2019 Oracle Data Cloud Moat Analytics Onboarding Guide
SECTION 4
INVALID TRAFFIC OVERVIEW

©2019 Oracle Data Cloud Moat Analytics Onboarding Guide | 19
Invalid Traffic Overview
What is Invalid Traffic?
Per the MRC, Invalid Traffic, or IVT, is generally defined as traffic that does not meet certain ad serving
quality or completeness criteria, or otherwise does not represent legitimate ad traffic that should be included
in measurement counts. This includes all impressions that are classified under General Invalid Traffic and
Sophisticated Invalid Traffic.
It is important to note the difference between the two types, as General Invalid Traffic tends to be list based
and easier to detect; whereas Sophisticated Invalid Traffic can point to fraudsters intentionally manipulating
end points to avoid detection. General Invalid Traffic can be identified through means of filtration or
standardized parameter checks. Sophisticated Invalid Traffic is more difficult to detect and requires advanced
deterministic analytics and human intervention to identify and analyze the end point. Moat is continually
improving our proprietary methods to detect both General and Sophisticated Invalid Traffic.
Types of General Invalid Traffic
TYPE DEFINITION EXAMPLE
Spider Rate The percentage of total unfiltered impressions that were determined to originate from known spiders according to the IAB/ABC International Spiders and Bots List.
Spiders represent non-human activity on the web. Although some are considered to be ‘good,’ ‘bad’ spiders can be masquerading as legitimate users.
Data Center Traffic Rate
The percentage of total unfiltered impressions that were determined to originate from a data center.
The end user IP address is identified as a known data center or cloud computing provider.
Excessive Activity Rate
The percentage of impressions that were determined to be delivered to users with invalid levels of activity.
User activity is detected by Moat’s tag that is more frequent than possible by a human.
©2019 Oracle Data Cloud Moat Analytics Onboarding Guide | 20
Invalid Traffic Overview
What are the MRC Guidelines?
The MRC requires that all measurement organizations should employ elements from both detection and
filtration techniques, while minimizing the potential for their use to signal the detection methodologies to
perpetrators of IVT. More information can be found in the FAQ.
Front-end detection techniques should be employed with caution because they are particularly prone to
telegraphing detection techniques, in most cases, to the traffic source because of an element of blocking
that becomes apparent. As such, they tend to become less effective over time without additional research
and development into new detection methodologies.
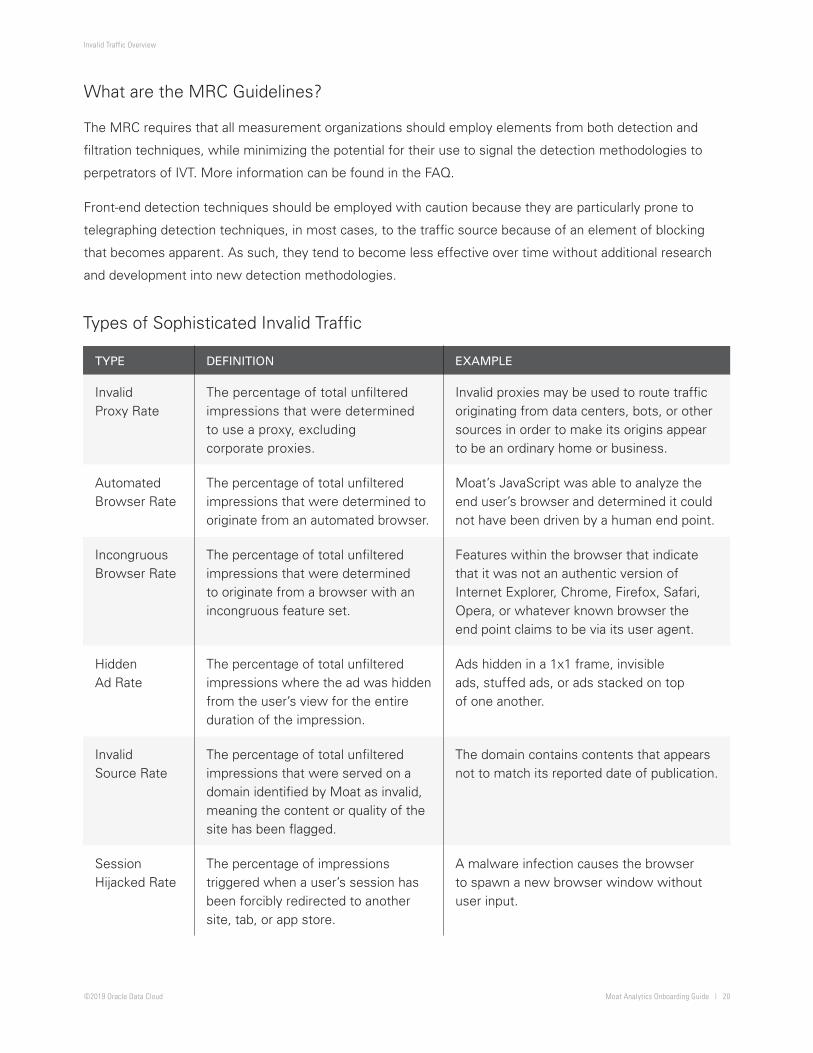
Types of Sophisticated Invalid Traffic
TYPE DEFINITION EXAMPLE
Invalid Proxy Rate
The percentage of total unfiltered impressions that were determined to use a proxy, excluding corporate proxies.
Invalid proxies may be used to route traffic originating from data centers, bots, or other sources in order to make its origins appear to be an ordinary home or business.
Automated Browser Rate
The percentage of total unfiltered impressions that were determined to originate from an automated browser.
Moat’s JavaScript was able to analyze the end user’s browser and determined it could not have been driven by a human end point.
Incongruous Browser Rate
The percentage of total unfiltered impressions that were determined to originate from a browser with an incongruous feature set.
Features within the browser that indicate that it was not an authentic version of Internet Explorer, Chrome, Firefox, Safari, Opera, or whatever known browser the end point claims to be via its user agent.
Hidden Ad Rate
The percentage of total unfiltered impressions where the ad was hidden from the user’s view for the entire duration of the impression.
Ads hidden in a 1x1 frame, invisible ads, stuffed ads, or ads stacked on top of one another.
Invalid Source Rate
The percentage of total unfiltered impressions that were served on a domain identified by Moat as invalid, meaning the content or quality of the site has been flagged.
The domain contains contents that appears not to match its reported date of publication.
Session Hijacked Rate
The percentage of impressions triggered when a user’s session has been forcibly redirected to another site, tab, or app store.
A malware infection causes the browser to spawn a new browser window without user input.

©2019 Oracle Data Cloud
Contact your Oracle Data Cloud account team.
Oracle Data Cloud
Oracle Data Cloud helps marketers use data to capture consumer attention and drive results. Used by 199 of the 200 largest advertisers, our Audience, Context and Measurement solutions extend across the top media platforms
and a global footprint of more than 100 countries. We give marketers the data and tools needed for every stage of the marketing journey, from audience planning to pre-bid brand safety, contextual relevance, viewability
confirmation, fraud protection, and ROI measurement. Oracle Data Cloud combines the leading technologies and talent from Oracle’s acquisitions of AddThis, BlueKai, Crosswise, Datalogix, Grapeshot, and Moat.
The technology in the Moat Analytics Tag uses the OMID Client Library. The OMID Client Library allows the Technology to communicate with the IAB Open Measurement SDK available at https://iabtechlab.com/standards/open-
measurement-sdk/. The OMID Client Library is a separately-licensed third-party open-source component of the Technology. Company’s use of the OMID Client Library is subject to the Apache License, Version 2.0, which can be
found at http://www.apache.org/licenses/LICENSE-2.0.