mixing time: a cfd approach - bakker.org · mixing xvii mixing time: a cfd approach lanre m....
TRANSCRIPT
MIXING XVII
Mixing Time: A CFD Approach
Lanre M. Oshinowo, André Bakker, Elizabeth MarshallFluent Inc., 10 Cavendish Court, Lebanon, NH 03766 USA
17th Biennial North American Mixing Conference
Banff, Alberta
August 15-20, 1999

MIXING XVII
Overview
� Description and background of mixing time� Mixing tank modeling using CFD� Estimating the mixing time� Case studies: Experimental validation� Mixing time results
� Steady and unsteady flow fields
� Summary and Conclusions
MIXING XVII
Mixing Time
� Mixing time is the time taken to homogenize the liquid contents of the tank after a step change in composition
� The transport of a tracer helps to understand the degree of homogeneity in the agitated tank� Circulation time used to gauge the bulk motion induced
by the impeller(s)� Mixing (or blend) time can be used to evaluate the
mixing equipment design to obtain ideal mixing

MIXING XVII
Mixing Time: Complications
� Typically, correlations of mixing time data are used� Mixing time depends on a large number of
variables:� Impeller type, diameter and Reynolds number� Scale� Feed location and the location of probes� Multiple impellers� Internals� Fluid properties, etc.
� Difficulties establishing a set of correlations for the wide range of variables, most importantly, scale
� Can lead to inaccuracies in mixing time prediction

MIXING XVII
Mixing Time: CFD Approach
� Utilize CFD for the prediction of mixing time by eliminating the guesswork in tank configuration, scale, and fluid properties
� Leverage the flexibility to change tank scale, flow regimes/impeller location and number of impellers
� Evaluate a method of predicting mixing time
MIXING XVII
CFD Modeling of Mixing Tanks
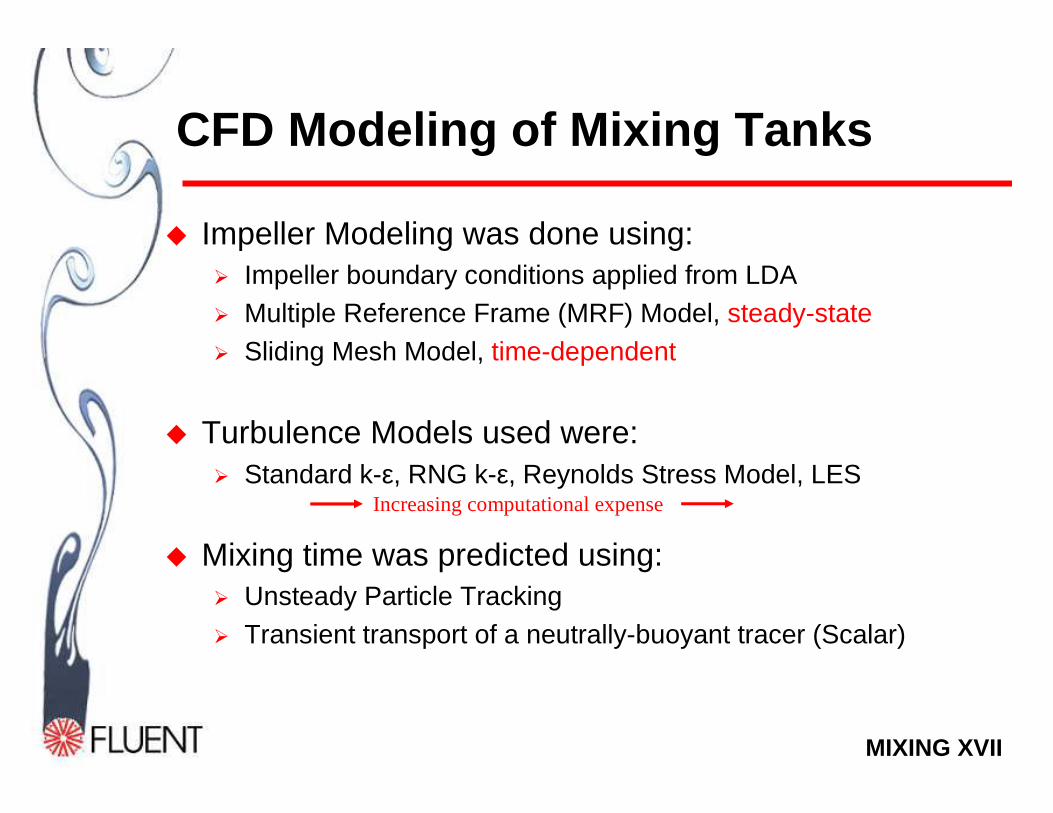
� Impeller Modeling was done using:� Impeller boundary conditions applied from LDA� Multiple Reference Frame (MRF) Model, steady-state� Sliding Mesh Model, time-dependent
� Turbulence Models used were:� Standard k-ε, RNG k-ε, Reynolds Stress Model, LES
� Mixing time was predicted using:� Unsteady Particle Tracking� Transient transport of a neutrally-buoyant tracer (Scalar)
Increasing computational expense
MIXING XVII
Flow Regimes
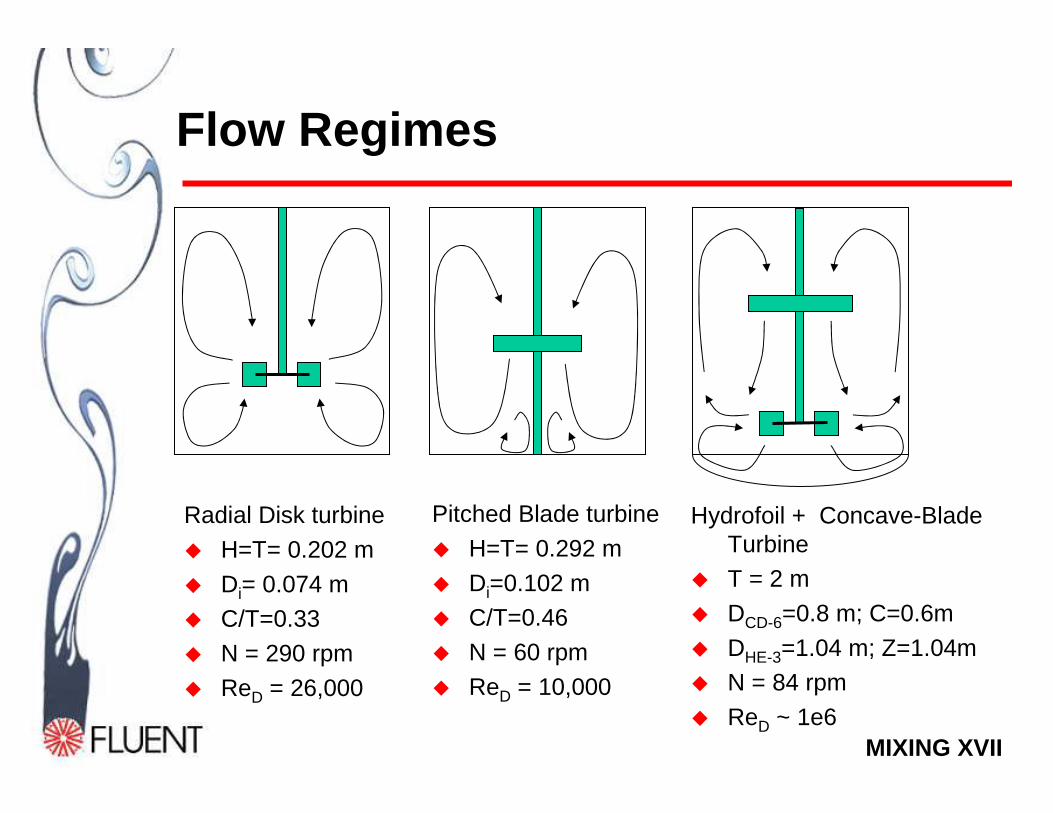
Radial Disk turbine
� H=T= 0.202 m
� Di= 0.074 m� C/T=0.33
� N = 290 rpm
� ReD = 26,000
Pitched Blade turbine
� H=T= 0.292 m
� Di=0.102 m� C/T=0.46
� N = 60 rpm
� ReD = 10,000
Hydrofoil + Concave-Blade Turbine
� T = 2 m
� DCD-6=0.8 m; C=0.6m
� DHE-3=1.04 m; Z=1.04m� N = 84 rpm
� ReD ~ 1e6

MIXING XVII
Validating the Radial Disk Turbine Influence of Turbulence Models
+90mm
Radial coordinate, mm
w/vtip
LDA data : Z. Jaworski, K. N. Dyster and A. W. NienowUniversity of Birmingham, UK
Normalized tangential velocity profiles at the mid-baffle position
Np=4.64 (4.85)NQ=0.67 (0.7)

MIXING XVII
Validating the Pitched Blade Turbine
LDALDA PIVPIV CFDCFD
Velocity vector field in mixing tankData Source: Myers, K.J., Ward, R.W. & Bakker, A. (1997) J. Fluids Eng. v.119, p.623
MIXING XVII
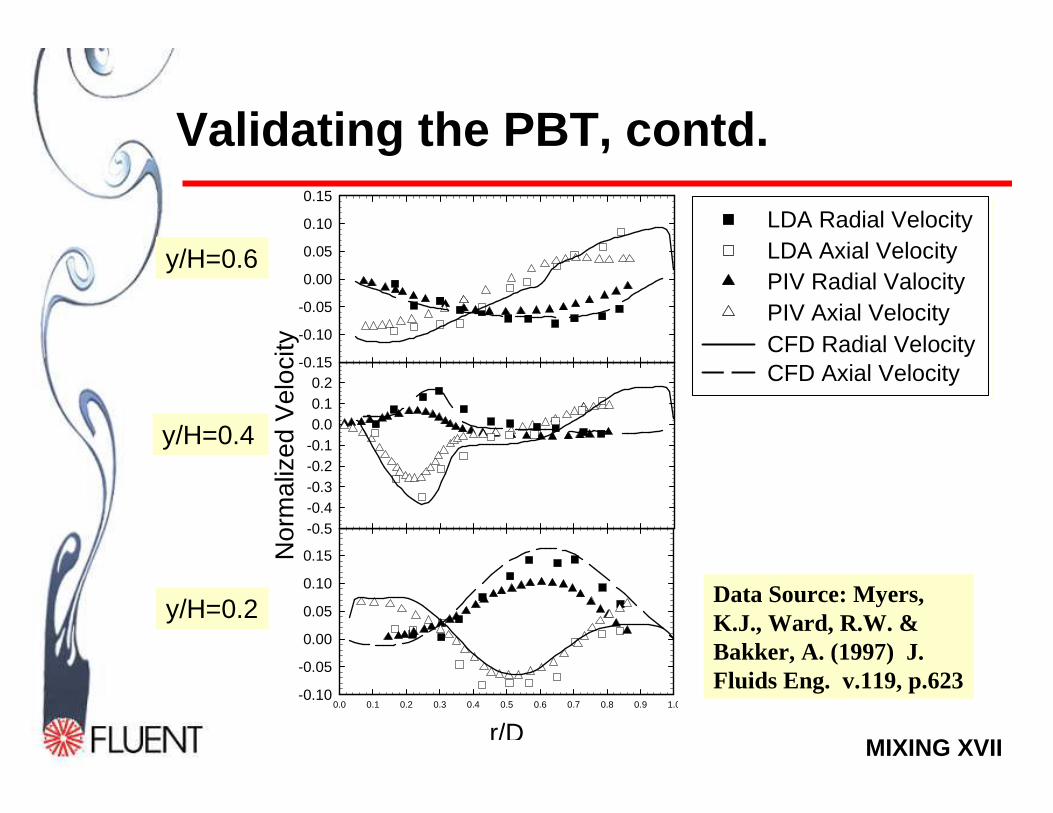
LDA Radial Velocity LDA Axial VelocityPIV Radial ValocityPIV Axial VelocityCFD Radial VelocityCFD Axial Velocity
Validating the PBT, contd.
r/D0.0 0.1 0.2 0.3 0.4 0.5 0.6 0.7 0.8 0.9 1.0
-0.10
-0.05
0.00
0.05
0.10
0.15Nor
mal
ized
Vel
ocity
-0.5-0.4-0.3-0.2-0.10.00.10.2
-0.15
-0.10
-0.05
0.00
0.05
0.10
0.15
y/H=0.6
y/H=0.4
y/H=0.2Data Source: Myers, K.J., Ward, R.W. & Bakker, A. (1997) J. Fluids Eng. v.119, p.623

MIXING XVII
Mixing Time Calculations
� Unsteady particle tracking� Release of a number of neutrally-buoyant particles� Turbulent dispersion of particles accounted for� Particle concentration sampled at various times
� Transport of a tracer � Small amount of liquid tracer added near liquid surface� Concentration of tracer monitored as a function of time� Similar to experimental techniques
� Flow field required can be steady, frozen unsteadyor unsteady

MIXING XVII
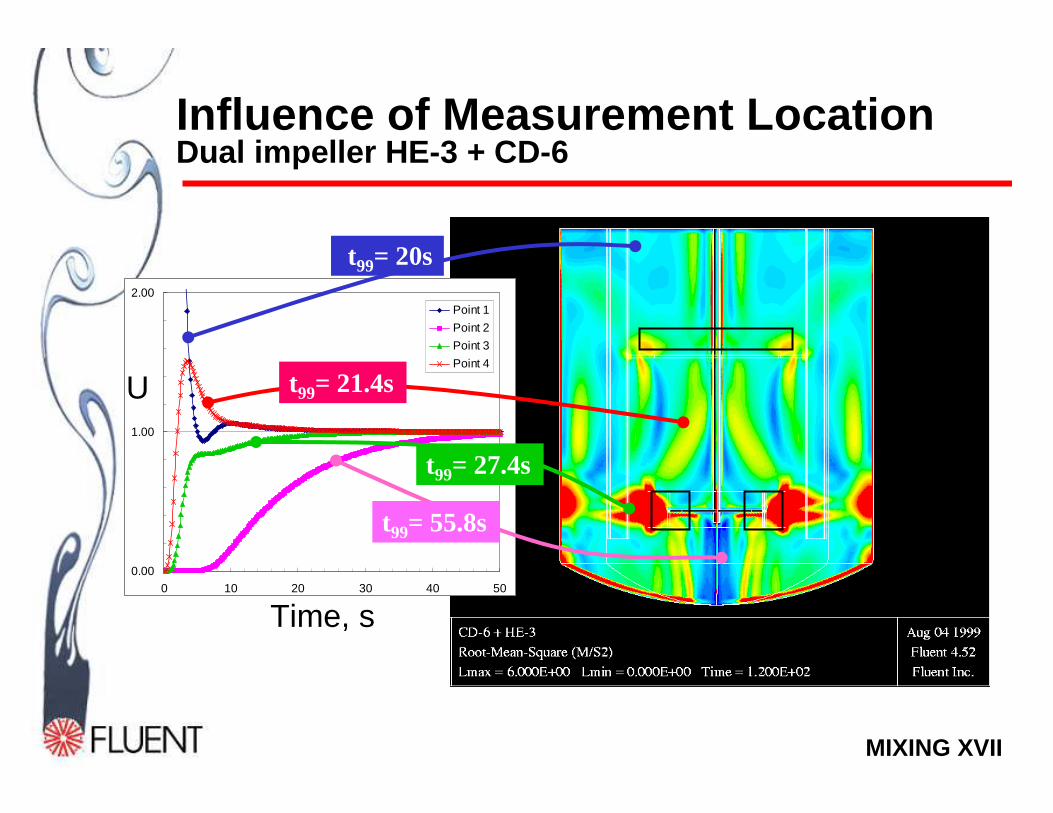
Time-varying Concentration
� Multiple locations can be sampled simultaneously to show concentration changes in many locations in the tank
� Mixing time, t99, is the time taken for the uniformity, U, to reach 0.99, where
� The t99 is determined at various locations in the tank and averaged to obtain the mixing time
( )∞
∞ −−=C
tCCU
)(1
MIXING XVII
Influence of Measurement LocationDual impeller HE-3 + CD-6
0.00
1.00
2.00
0 10 20 30 40 50
Point 1
Point 2
Point 3
Point 4
U
Time, s
t99= 20s
t99= 21.4s
t99= 27.4s
t99= 55.8s
MIXING XVII
Time, s0 5 10 15 20 25
U
0.2
0.4
0.6
0.8
1.2
0.0
1.0
FIX-RSMMRF-RSMMRF-RNGMRF-k-e
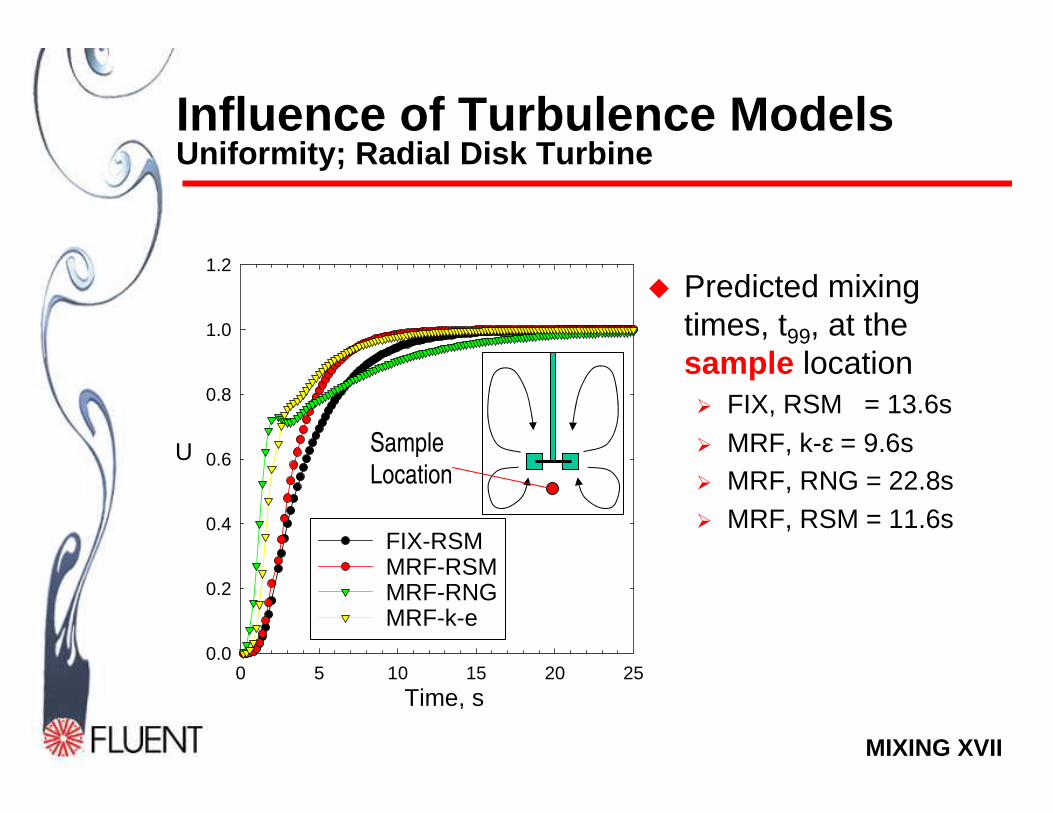
Influence of Turbulence ModelsUniformity; Radial Disk Turbine
� Predicted mixing times, t99, at the sample location� FIX, RSM = 13.6s
� MRF, k-ε = 9.6s� MRF, RNG = 22.8s� MRF, RSM = 11.6s
Sample
Location

MIXING XVII
Time, s
0 20 40 60 80 100 120
U
0.2
0.4
0.6
0.8
0.0
1.0
FIX: t99=112sMRF: t99=54s
Influence of Impeller Modeling
Time, s
0 5 10 15 20
U
0
1
2
3
4
FIX: t99=11.6sMRF: t99=10.0s
Time, s
0 5 10 15 20
U
0.0
0.5
1.0
1.5
2.0
MRF: t99=12.2sFIX: t99=21.4s
Radial Turbine
Dual Impeller (CD-6+HE-3)
PBT
� Modeling impeller with velocity data predicts greater t99

MIXING XVII
Mixing Time Correlations
� Fasano, J.B., Bakker, A. & Penney, W.R. (1994)
( )5.099
1ln
−−=
Z
T
T
DaN
Ut b
Impeller Style a b
Radial Disk6 blades
1.06 2.17
Pitched4 blades
0.641 2.19
High-efficiency3 blades
0.272 1.67
� Prochazka and Landau (1961), Moo-Young et al (1972), Sano & Usui (1985), RaghavRao and Joshi (1988)

MIXING XVII
Comparison to Correlations
t 9 9 ( C o r r . ) t 9 9 ( C F D )
R T 8 ( ± 3 0 % ) 1 0 . 5 ± 0 . 9
P B T 7 2 ( ± 3 0 % ) 6 1 . 5 ± 9 . 3
H E - 3 + C D - 6 1 5 ( ± 3 0 % ) 3 2 ± 3 4 . 7( 1 7 .6 ,1 3 . 6 ,1 2 . 8 , 8 4 )
Time in seconds
� The CFD mixing time results were the average of multiple locations in the tank
� The dual impeller systems shows the influence of locally poor mixing on the average mixing time in the tank

MIXING XVII
Mixing Time Calculations in an Unsteady Flow Field
� The sliding mesh model was used to set up the transient motions of the impeller in the tank.
� Two turbulence model approaches were evaluated:� Reynolds-Averaged Navier-Stokes turbulence model,
i.e., Standard k-ε, RNG k-ε, Reynolds Stress Model� Large Eddy Simulation or LES
MIXING XVII
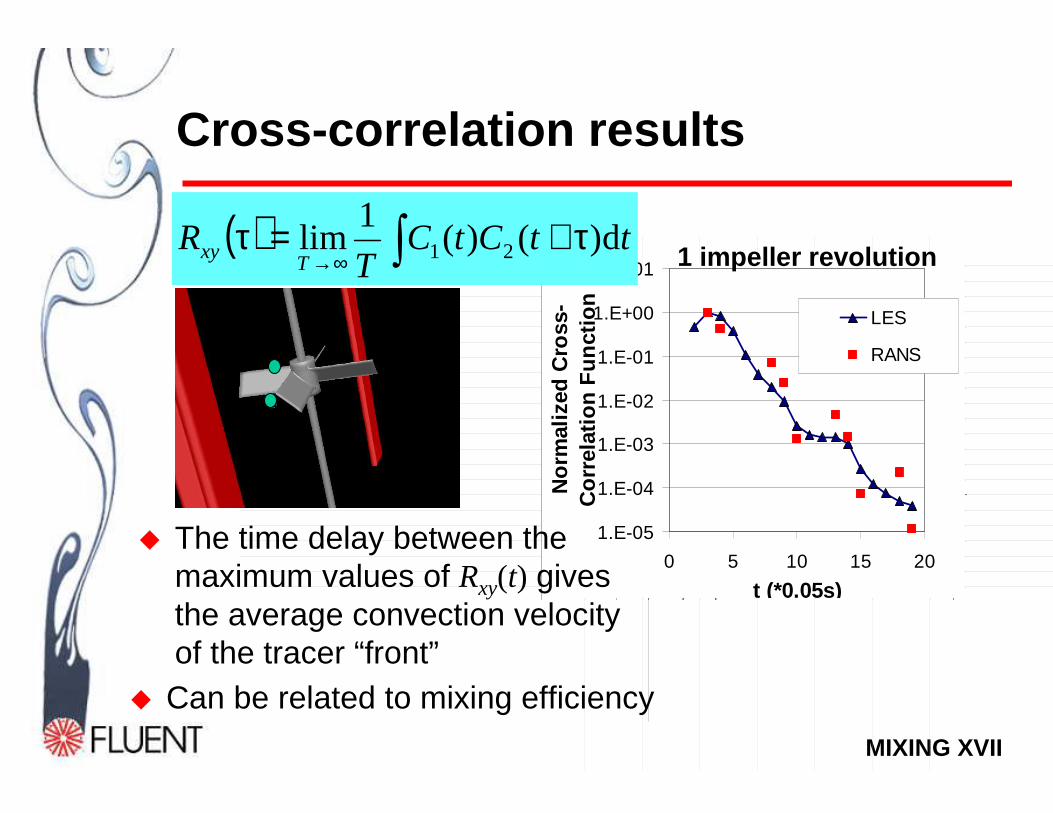
Cross-correlation results
30
35
40
45
50
1.E-05
1.E-04
1.E-03
1.E-02
1.E-01
1.E+00
1.E+01
0 5 10 15 20
t (*0.05s)N
orm
aliz
ed C
ross
-C
orr
elat
ion
Fu
nct
ion
LES
RANS
1 impeller revolution( ) ∫ τ+=τ
∞→ttCtC
TR
Txy d)()(
1lim 21
� The time delay between the maximum values of Rxy(t) gives the average convection velocity of the tracer “front”
� Can be related to mixing efficiency
MIXING XVII
Summary
� Mixing time can predicted using CFD in a variety of tank configurations
� Unsteady tracer CFD calculations on a steady-state flow field gave good comparisons with correlations of experimental data
� Modeling the presence of the impeller is important for improving mixing time predictions
� Both RANS-based and LES turbulence modeling can be used with an unsteady sliding mesh model to calculate the transport of the tracer