mix telematics investor presentation
TRANSCRIPT

MiX TelematicsInvestor PresentationJune 2021

Forward-Looking Statements
Safe Harbor Statement
2
This presentation includes “forward-looking statements,” within the meaning of the U.S. Securities Exchange Act of 1934, as amended. Forward-looking statements are not based on historical information and include, without limitation, statements regarding our future financial condition and results of operations, business strategy and plans and objectives of management for future operations. Forward-looking statements reflect our current views with respect to future events. The words “may,” “will,” “expect,” “intend,” “anticipate,” “believe,” “project,” “estimate” and similar expressions identify forward-looking statements. These forward-looking statements are based upon estimates and assumptions made by us or our officials that, although believed to be reasonable, are subject to certain known and unknown risks and uncertainties that could cause actual results to differ materially and adversely as compared to those contemplated or implied by such forward-looking statements.
All forward-looking statements involve risks, assumptions and uncertainties. You should not rely upon forward-looking statements as predictors of future events. The occurrence of the events described, and the achievement of the expected results, depend on many events, some or all of which are not predictable or within our control. Actual results may differ materially from expected results. For more information about factors that may cause our actual results to differ materially from these forward-looking statements, including COVID-19 and the related global economic uncertainty, please refer to the reports we file with the Securities and Exchange Commission (the “SEC”) from time to time, including our most recent Annual Report on Form 10-K for the fiscal year ended March 31, 2020, filed with the SEC on July 23, 2020, and our subsequent filings with the SEC. These risks, assumptions and uncertainties are not necessarily all of the important factors that could cause actual results to differ materially from those expressed in any of our forward-looking statements. Other unknown or unpredictable factors also could harm our results. All of the forward-looking statements we have included in this presentation are based on information available to us on the date of this presentation. We undertake no obligation, and specifically decline any obligation, to update publicly or revise any forward-looking statements, whether as a result of new information, future events or otherwise. In light of these risks, uncertainties and assumptions, the forward-looking events discussed in this presentation might not occur.

US GAAP Conversion, Non-GAAP Financial Measures, & Outlook
Safe Harbor Statement
3
U.S. GAAP ConversionEffective April 1, 2020, the Company began to file periodic reports on U.S. domestic issuer forms with the Securities and Exchange Commission. Accordingly, unless otherwise indicated, the financial results and estimates provided herein have been prepared in accordance with accounting principles generally accepted in the United States. There are certain differences in these financial results and estimates prepared in accordance with GAAP compared to such financial results and estimates prepared in accordance with International Financial Reporting Standards (“IFRS”) as issued by the International Accounting Standard Board, and therefore the financial results and estimates provided herein are not directly comparable to the Company’s disclosures prior to May 2020. Please refer to our May 28, 2020 press release for a description and reconciliation of the differences between GAAP and IFRS financial results and estimates.
Use of Non-GAAP MeasuresThis presentation also contains certain non-GAAP financial measures as defined by the SEC rules. These non-GAAP financial measures are in addition to, and not a substitute for or superior to, measures of financial performance prepared in accordance with GAAP. As required by Regulation G, we have provided a reconciliation of those measures to their most directly comparable GAAP measures, which is available in the Appendix slides to this presentation. Please refer to our October 29, 2020 press release for information as to why we believe these non-GAAP financial measures are useful to investors and others in assessing our operating results. We urge investors not to rely on any single financial measure to evaluate our business.
Business OutlookDue to the uncertainty surrounding the level of business disruption as a result of the spread of COVID-19, the Company suspended its practice of issuing financial guidance for the full 2021 fiscal year.

1. Company Overview
2. Market Opportunity
3. Innovative Solutions
4. Competitive Advantages
5. Growth Drivers
6. Financial Overview
AGENDA

Company Overview
About MiX Telematics

6
About MiX TelematicsA leading global provider of Fleet and Asset Management solutions
Large global subscriber basein approximately120 countries
SaaS solutionsfor safety, efficiency,
security andcompliance
Broad productportfolio
deliveringdiversified
revenue streams
Proven ROIdrives expansion
& customer retention

7
What we do for our customersWe deliver ongoing value to our customers, helping them address a variety of challenges
Safety Efficiency Compliance Security
• Fuel savings• Customer service• Utilization• Operating costs
• Real-time driver feedback• Fewer accidents• Driver scoring
• Compliance monitoring• Hours of Service (HOS)• Fuel tax reporting
• Vehicle tracking• Crash notification• Theft recovery• Access control

Market Opportunity
Driven by Strong Global Trends
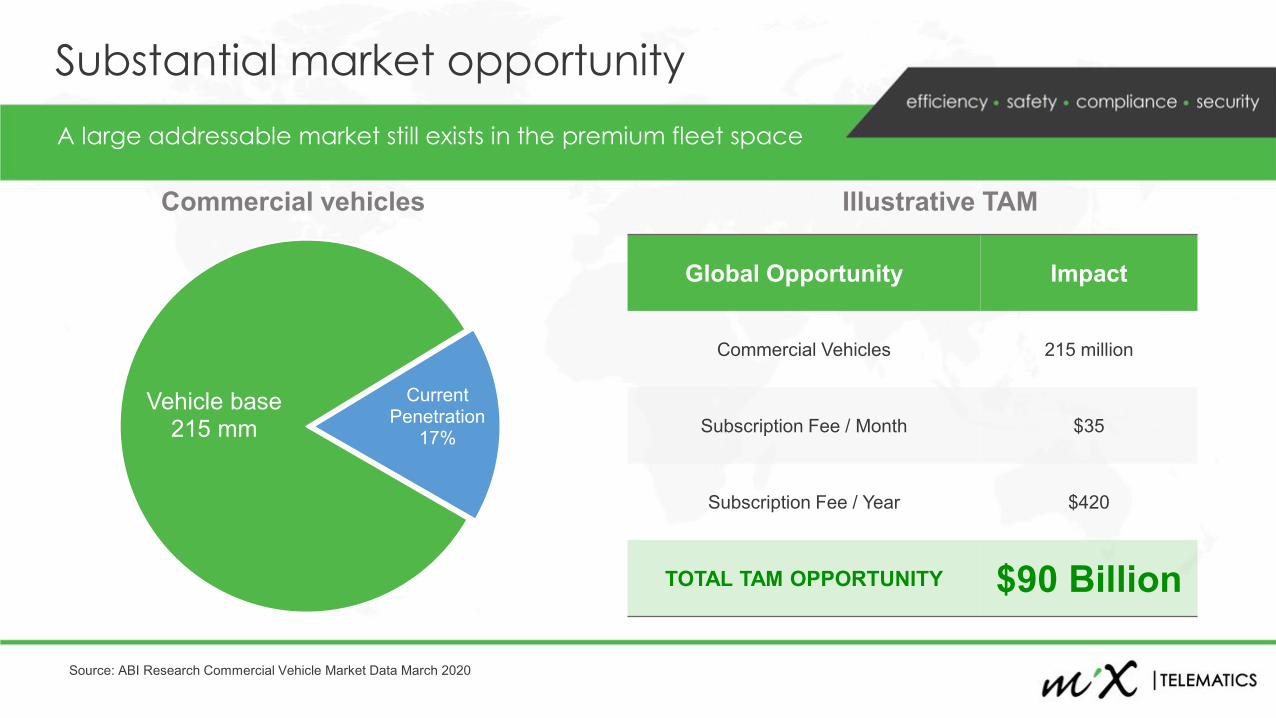
Vehicle base 215 mm
CurrentPenetration
17%
A large addressable market still exists in the premium fleet space
Substantial market opportunity
Global Opportunity Impact
Commercial Vehicles 215 million
Subscription Fee / Month $35
Subscription Fee / Year $420
TOTAL TAM OPPORTUNITY $90 Billion
Commercial vehicles Illustrative TAM
Source: ABI Research Commercial Vehicle Market Data March 2020

Innovative SolutionsBroad & Diverse Portfolio on a Highly Scalable Platform

11
Innovative SolutionsBroad portfolio of solutions to address the needs of all size businesses and fleet operators
Asset TrackingLight fleetPremium fleet
12
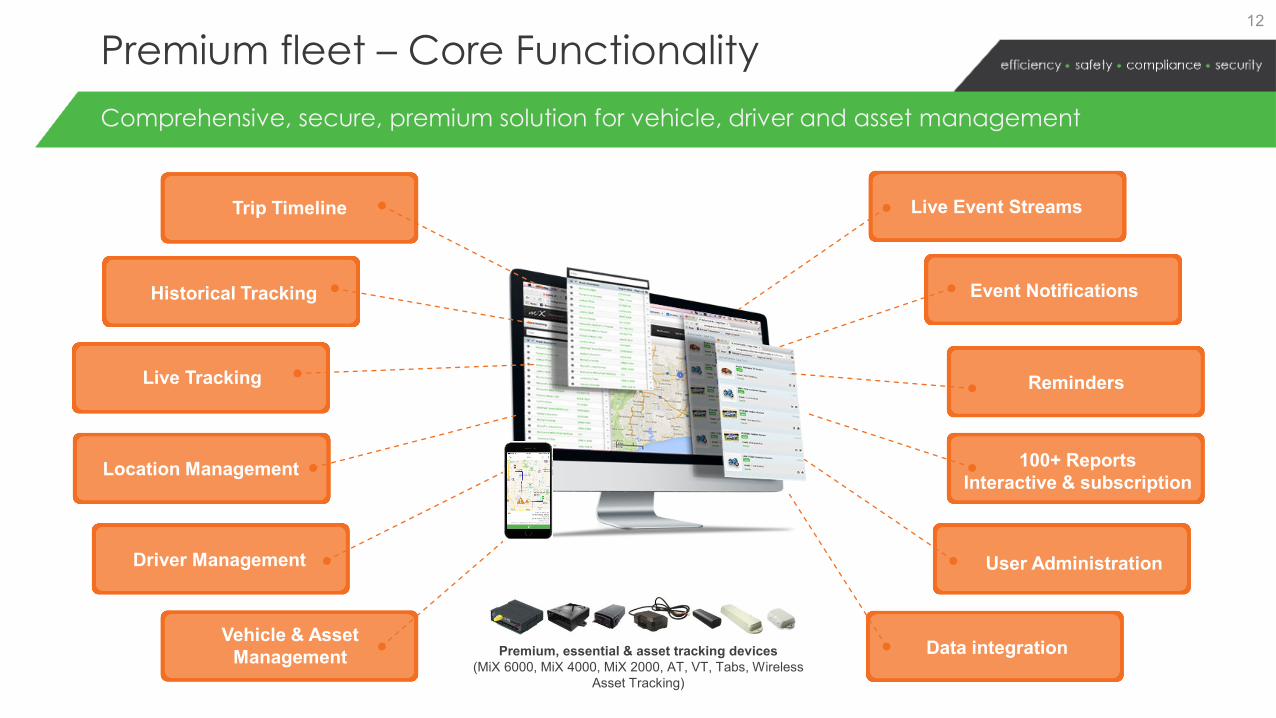
Premium fleet – Core FunctionalityComprehensive, secure, premium solution for vehicle, driver and asset management
Premium, essential & asset tracking devices(MiX 6000, MiX 4000, MiX 2000, AT, VT, Tabs, Wireless
Asset Tracking)
Vehicle & AssetManagement
Driver Management
Location Management
Live Tracking
Historical Tracking
Trip Timeline Live Event Streams
Event Notifications
Reminders
100+ ReportsInteractive & subscription
Data integration
User Administration

13
Premium fleet – Value Added ServicesSupports a wide array of sensors, peripherals, accessories & value-added services
In-cab driver coaching
Driver engagement
Task management
Analytics
HOS compliance Journey risk management
Logistics execution management
In-cab display withnavigation
SatelliteCommunication
Video telematics
Data IntegrationWide range of peripherals, accessories and sensors (MiX Rovi, MiX Vision, MiX SatComms, RIBAS, DriveMate)

14
Light fleet – Core FunctionalityEssential solution– similar to core premium fleet offering but less data rich, using cheaper enablers
Premium, essential & asset tracking devices(OBDII, MiX 2000, AT, VT, Tabs, Wireless Asset Tracking)
Vehicle & AssetManagement
Driver Management
Location Management
Live Tracking
Historical Tracking
Trip Timeline Live Event Streams
Event Notifications
Reminders
Reports
Plug ‘n play
Data integration

15
Light Fleet – Value Added ServicesSelected accessories and value-added services
In-cab driver feedback*
Driver engagement
Tax logbook
Non regulatory HOS
Journey risk management
SatelliteCommunication
* Limited accessories – depends on hardware enabler

Tracking
Impact detect
Movement alerts
Asset recovery
16
Asset tracking Core features and value added services
Roadside assistance
In-cab video
Value addedCore

Competitive AdvantagesWhy Customers Choose Mix Telematics

18
Why customers choose MiXProven track record, delivering on-going value to customers for over two decades
Loyal, happyand referenceable
customers
Best-in-class,Modern
technology
Broad and diverseproduct portfolio &suite of solutions
Longstanding,deep industry
expertise
Strategic focuson fleets
Unique globalfootprint andecosystem
Strong brand

Powerful global distribution
19
MiX offices Regional partners presence

20
Unique global platform in a disparate marketplace
Our ability to compete globally and service multi-national corporations is a key competitive advantage
One of few providers with global subscriber base serving customers in approximately 120 countries
Competition differs in every region in which we operate.

21
Diverse, global customer basePassenger vehicles to small fleet operators and large enterprise fleets across multiple verticals
Passenger vehicles Fleets
• Significant presence in multiple verticals:• Oil & gas
• Transport & logistics
• Public transport
• Leasing/rental
• Construction
• Minerals & exploration

22
Flexible Go-to-Market Sales StrategyWe have a 3-pronged approach to sales execution
Enterprisesales
SMBsales Global Partners
130+
23
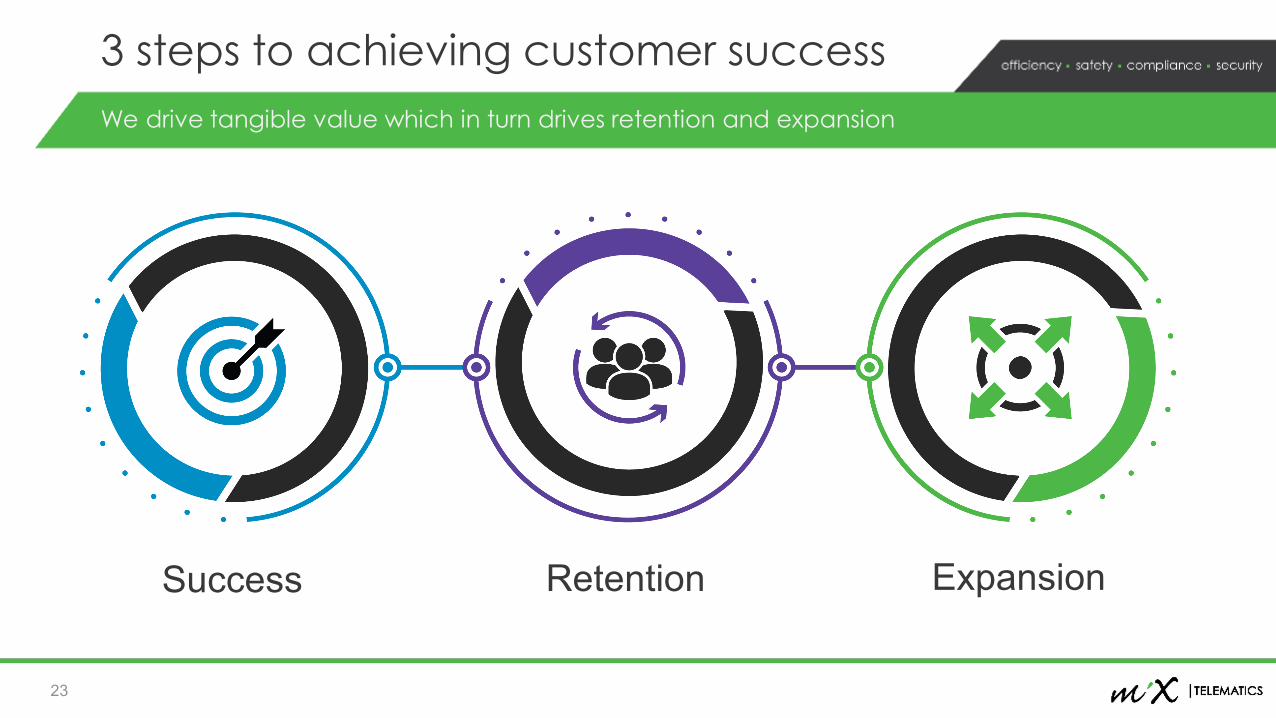
3 steps to achieving customer successWe drive tangible value which in turn drives retention and expansion
Success Retention Expansion

Asset Tracking
16%
LightFleet20%
PremiumFleet64%
24
Subscription RevenueMajority of subscription revenue derived from fleet customers (based on FY21 subscription revenue)
Fleets > 50 vehicles
91%premium subs
revenue
67%premium subs
revenue
Fleets > 500 vehicles
Subscription Revenue
FY21

25
High fleet customer retention ratesMost of the premium fleet subscriber base reduction in FY’21 was a result of a decline in the average customer fleet size and not due to the loss of customers.
FY’21 Fleet Customer Retention Rates

Growth DriversMultiple Vectors of Continued Growth

27
Multiple drivers for revenue growthWe continue to deliver on our business objectives
Expand with M&A
andPartners
Introducenew,
innovative solutions
Broadencustomer segment
focus
Scaleregional
presenceIncrease sales to existing
customersAcquire
new customers

Financial OverviewAttractive and Profitable Business Model

Leading to a high SAAS recurring revenue model
Consistent subscription revenue growth (1)
29
(1) Due to the uncertainty surrounding the level of business disruption as a result of the spread of COVID-19, the Company suspended its practice of issuing financial guidance.
-
100,000
200,000
300,000
400,000
500,000
600,000
700,000
800,000
Subscribers
$0
$5,000
$10,000
$15,000
$20,000
$25,000
$30,000
$35,000
Subscription Revenue – ($000’s) Covid-19 impact (1)

46%
35% 34%38%
31%
25%
46% 46%
32%
45%40%
29%
43% 42%37%
48%
41%
29%
47%
37%43%
46%
37%
29%
Africa Americas Europe Middle East &Australasia
Brazil Consolidated
Adjusted EBITDA Margin (1)
FY'18 FY'19 FY'20 FY'21
Track record of disciplined and balanced approach to growing revenue while maintaining profitability
Proven, sustainable, & profitable operating model
(1) Due to the uncertainty surrounding the level of business disruption as a result of the spread of COVID-19, the Company suspended its practice of issuing financial guidance. The Company expects FY22 Adjusted EBITDA to be in the low to mid 20% range.

Long-Term Growth and Margin Profile Goals
31
Annual subscription revenue growth (1)
Subs revenue as a % of total revenue
Gross margin
Operating profit margin
> 20%
LT Goals
Adjusted EBITDA margin
> 90%
~ 70%
~ 20%
>30%
FY21A (2)FY20A
8.7%
87.6%
63.6%
14.5%
28.6%
-6.1%
89.3%
65.4%
14.3%
29.3%
(1) Constant currency basis which excludes the effect of foreign exchange changes
(2) COVID-19 Global pandemic impact
The foregoing long term goals do not represent projections. These are the long-term objectives utilized by management to steer the business. Achieving these goals is subject to:• significant economic, competitive, business, and other risks; and• successful execution of both the Company’s business plan and integration of acquisitions.
See “Risk Factors” in MiX Telematics’ Annual Report on Form 10-K filed on July 23, 2020 with the SEC. The Company undertakes no duty to update its goals.
Maintained strong earnings profile in FY21 despite the subscription revenue contraction related to the COVID-19 global pandemic

APPENDIXNon-GAAP Reconciliation
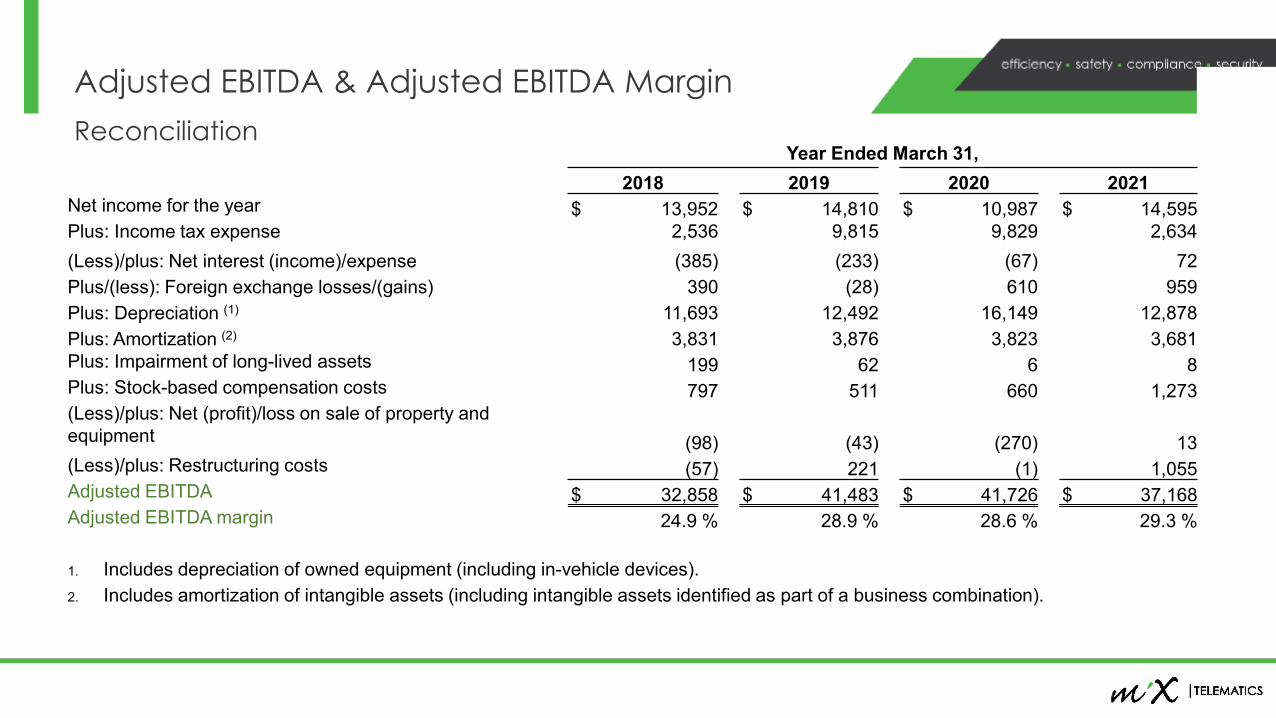
Adjusted EBITDA & Adjusted EBITDA MarginReconciliation
Year Ended March 31,2018 2019 2020 2021
Net income for the year $ 13,952 $ 14,810 $ 10,987 $ 14,595Plus: Income tax expense 2,536 9,815 9,829 2,634(Less)/plus: Net interest (income)/expense (385) (233) (67) 72Plus/(less): Foreign exchange losses/(gains) 390 (28) 610 959Plus: Depreciation (1) 11,693 12,492 16,149 12,878Plus: Amortization (2) 3,831 3,876 3,823 3,681Plus: Impairment of long-lived assets 199 62 6 8Plus: Stock-based compensation costs 797 511 660 1,273(Less)/plus: Net (profit)/loss on sale of property and equipment (98) (43) (270) 13(Less)/plus: Restructuring costs (57) 221 (1) 1,055Adjusted EBITDA $ 32,858 $ 41,483 $ 41,726 $ 37,168Adjusted EBITDA margin 24.9 % 28.9 % 28.6 % 29.3 %
1. Includes depreciation of owned equipment (including in-vehicle devices).2. Includes amortization of intangible assets (including intangible assets identified as part of a business combination).

Segment Adjusted EBITDAThe following table (unaudited and shown in thousands) reconciles total Segment Adjusted EBITDA toincome before tax expense for the periods shown:
Year Ended March 31,2018 2019 2020 2021
Segment Adjusted EBITDA $ 43,021 $ 52,472 $ 53,298 $ 48,811Corporate and consolidation entries (9,018) (8,631) (8,366) (8,879)Operating lease costs — (988) (1,610) (1,652)Product development costs (1,162) (1,449) (1,363) (1,112)Loss contingency 17 15 (233) —Expected credit losses — 64 — —Depreciation and amortization (15,524) (16,368) (19,972) (16,559)Impairment of long-lived assets (199) (62) (6) (8)Stock-based compensation costs (797) (511) (660) (1,273)Decrease/(increase) in restructuring costs 57 (221) 1 (1,055)Net profit/(loss) on sale of property and equipment 98 43 270 (13)Net foreign exchange (losses)/gains (390) 28 (610) (959)Net interest income/(expense) 385 233 67 (72)Income before tax expense for the year $ 16,488 $ 24,625 $ 20,816 $ 17,229

Segment Adjusted EBITDA
Description of reconciling items:1. For segment reporting purposes for fiscal 2018, operating leases were expensed over the lease term on a straight-line basis, and the resultant
lease expense was included in Segment Adjusted EBITDA. From fiscal 2019, for the purposes of calculating Segment Adjusted EBITDA, operating leases have been capitalized, except for leases with a term of no more than 12 months or with a term that ended by March 31, 2019or leases of low value assets. Where operating leases are capitalized for segment purposes, the amortization of the right-of-use asset, and the interest on the operating lease liability are excluded from the Segment Adjusted EBITDA. ASC 842 Leases was adopted early from fiscal 2019, therefore, in order to reconcile Segment Adjusted EBITDA to income before taxes for fiscal 2019 and fiscal 2020, the total lease expense in respect of operating leases needs to be deducted.
2. For segment reporting purposes, product development costs, which do not meet the capitalization requirements under ASC 730 Research and Development or under ASC 985 Software, are capitalized and amortized. The amortization is excluded from Segment Adjusted EBITDA. In order to reconcile Segment Adjusted EBITDA to net income before taxes, product development costs capitalized for segment reporting purposes need to be deducted.
3. For segment reporting purposes, a loss contingency (51% probability), which had been raised prior to fiscal 2018 was increased during fiscal 2018 and fiscal 2019. As of March 31, 2020, the loss contingency was no longer needed because an outflow is now considered remote. For GAAP, this loss contingency has never been recognized because the recognition requirements of ASC 450 Contingencies have never been met. Therefore, in order to reconcile Segment Adjusted EBITDA to net income before taxes, these aforementioned increases/decreases, recognized for segment reporting purposes, need to be added/deducted.
4. For segment reporting purposes, from fiscal 2019, the allowance for doubtful debts has been determined using an expected credit loss model; whereas in fiscal 2018, an incurred loss model was used. This resulted in a higher doubtful debts expense in fiscal 2019 for segment reporting purposes, than that recognized in income before taxes. From fiscal 2020, an expected credit loss model is applied for GAAP purposes, which is why there is no longer a reconciling item.
35

Thank You
36