missouri phosphorus issues as viewed by an economist in the space shuttle verel w. benson soil and...
Post on 15-Jan-2016
277 views
TRANSCRIPT

Missouri Phosphorus Issues as Viewed by an Economist in the
Space Shuttle
Verel W. Benson
Soil and Water Conservation Society Show-Me Chapter of Missouri Fall Forum
OCTOBER 20, 2005GEORGE WASHINGTON CARVER FARM
Why are there Phosphorus Issues?
Phosphorus use history and balance CRP impacts on P loss Farm and watershed assessment Manure P recycling potential Energy production recycling potential How do economic and environmental
regulations impact P issues? What are the stakes? Solution strategies

Potash & Phosphate Institute (PPI) Summary of Fertilizer and Manure Nutrients in North America (2002)
PPI review of nutrient use and balance in North America
On-line order form: http://www.store.yahoo.com/ppi-store/plannutusein.html
P
HISTORY
&
BALANCE

ND
SKMB
ON
BCBCAB
WA
OR
MTMT
ID
SD
MN
PQPQ
NY
PAOHINIL
IA
WIMI
WY
UT
NV
CACA
AZ NM
NBNB
NSNS
PEIPEI
MEME
NH
VT
MAMA
CTCTRIRI
NE
KSMO
KY
WV
VAVA
MD
DEDE
NJNJ
NCNCTN
AROK
TX LA
MS ALAL GAGA
SCSC
FLFL
CO
1.10-1.49
0.50-0.89
0.00-0.49
0.90-1.09
>1.50
R/(F+M)
Ratio of P removal by crops to fertilizer applied plus recoverable manure.
P
HISTORY
&
BALANCE

N P2O5 K2O
8% increase since 1980
21% decrease since 1980
Consumption of Fertilizer N, P2O5, and K2O in the United States from 1960 to 2000
P
HISTORY
&
BALANCE

Trend in P2O5 Consumption in MS Basin States, 1980-2002
y = -19,404.91x + 4,023,285.91
R2 = 0.15
0
1,000,000
2,000,000
3,000,000
4,000,000
5,000,000
Year ending June 30
To
ns o
f P 2O
517% decline in fertilizer P2O5 since 1980
P
HISTORY
&
BALANCE
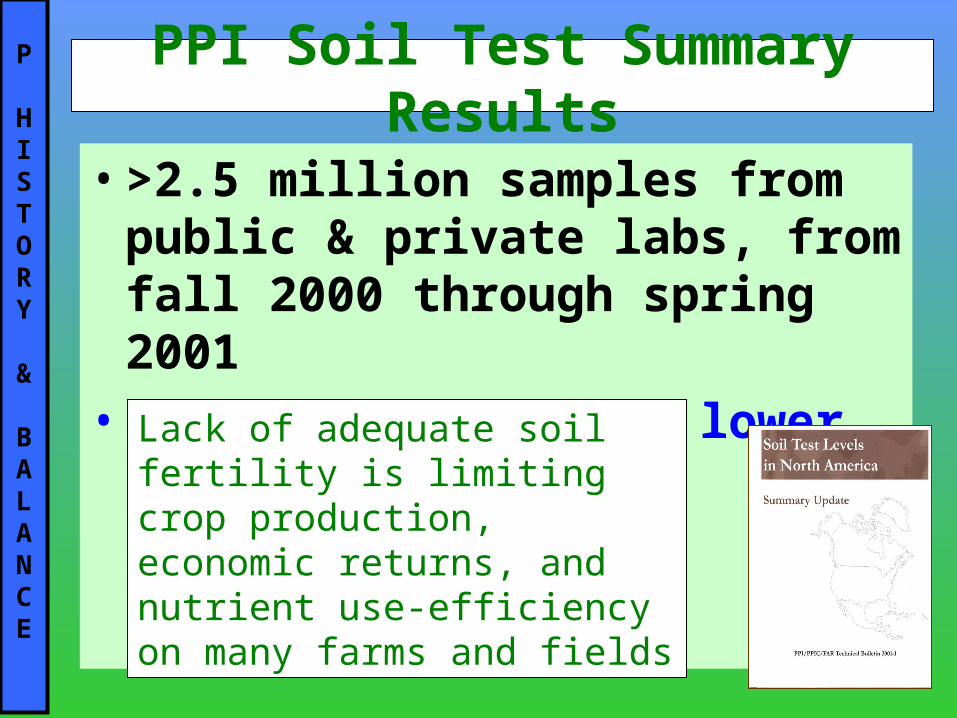
PPI Soil Test Summary Results
• >2.5 million samples from public & private labs, from fall 2000 through spring 2001
• 47 % test medium or lower in PLack of adequate soil fertility is limiting crop production, economic returns, and nutrient use-efficiency on many farms and fields
P
HISTORY
&
BALANCE
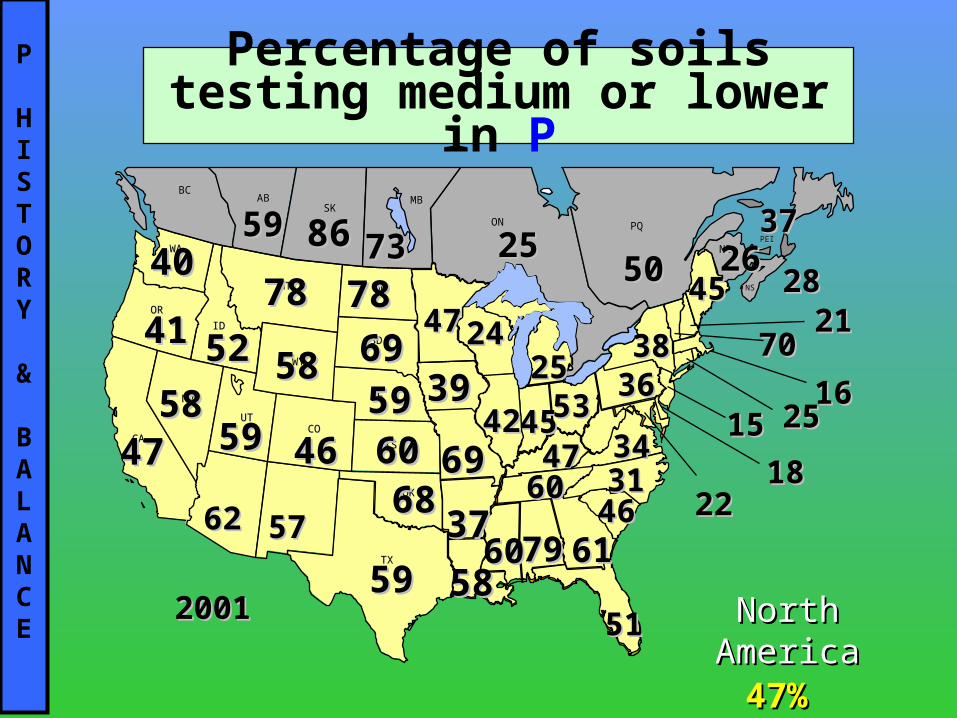
Percentage of soils testing medium or lower in P
20012001
NDND
SKSKMBMB
ONON
BCBCABAB
WAWA
OROR
MTMT
IDID
SDSD
MNMN
PQPQ
ILIL
WYWY
UTUT
NVNV
CACA
NBNB
NSNS
PEIPEI
NENE
KSKSMOMO
TNTNARAR
OKOK
TXTX LALA
ALAL GAGA
FLFL
COCO
3737
7070
7373
25252424
18182222
3939
4747
5959 8686
4747
2121
5050 26262828
North AmericaNorth America47%47%
25251616
5959
6868606059595858
5959
4141 5252
7878 7878
6969
6262
4040
5858
4646
5757
2525
P
HISTORY
&
BALANCE
4747
45454242
6060
6161
5151
797960605858
3737
69691515
4545
38383636
34345353
46463131
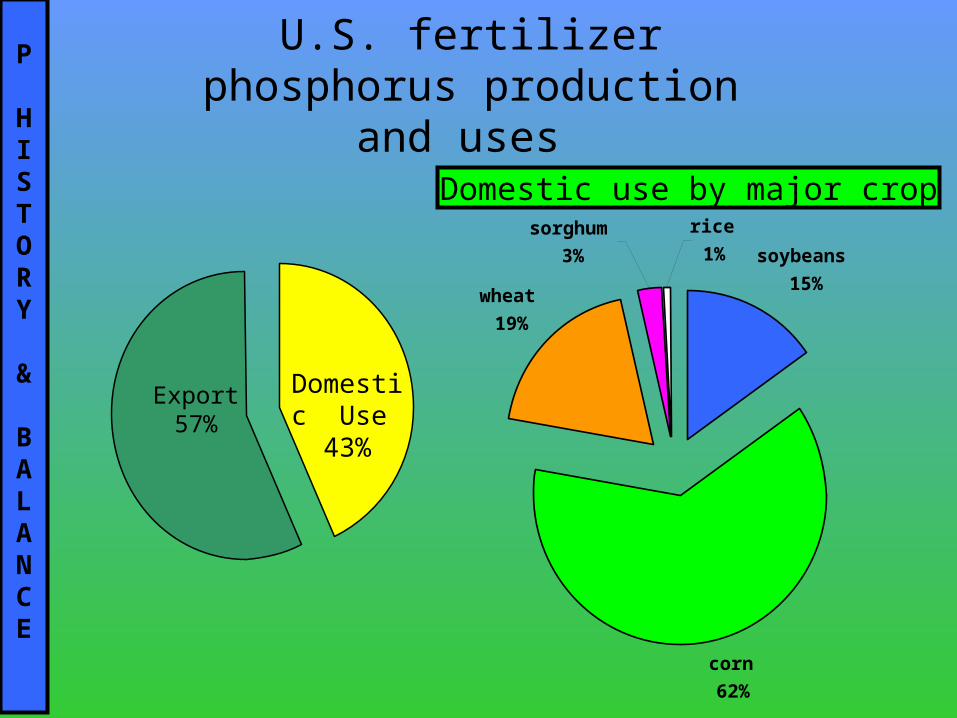
U.S. fertilizer phosphorus production and uses
Domestic Use 43%
Export57%
Domestic use by major crop
soybeans
15%
corn
62%
wheat
19%
sorghum
3%
rice
1%
P
HISTORY
&
BALANCE

U.S. production compared to potential manure P available
U.S.Use43%
Export57%
P
HISTORY
&
BALANCE
32%
Potential P from
animal manure

Sources of P from recycled animal manure
Broiler15%
Layers
10%
Turkey
8%
Swine35%
Fattened cattle14%
Dairy
18%
P
HISTORY
&
BALANCE
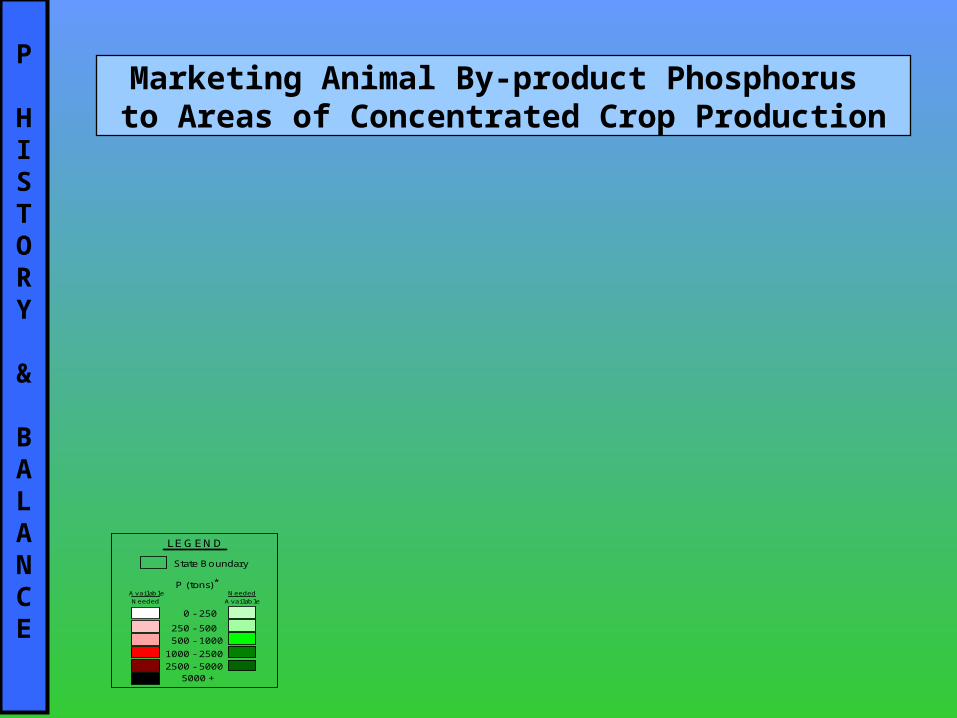
Marketing Animal By-product Phosphorus to Areas of Concentrated Crop Production
NeededAvailable
AvailableNeeded
*P (tons)
5000 +2500 - 50001000 - 2500500 - 1000250 - 500
0 - 250
State Boundary
LEGEND
P
HISTORY
&
BALANCE
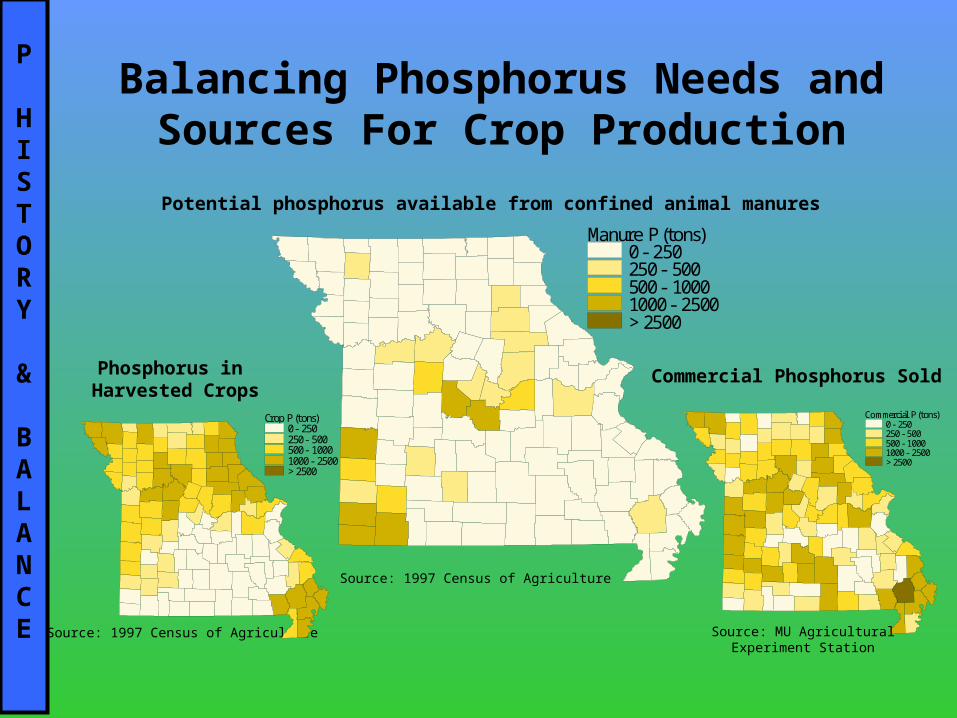
Source: 1997 Census of Agriculture
Phosphorus in Harvested Crops
Crop P (tons)0 - 250250 - 500500 - 10001000 - 2500> 2500
Commercial P (tons)0 - 250250 - 500500 - 10001000 - 2500> 2500
Commercial Phosphorus Sold
Source: MU Agricultural Experiment Station
Manure P (tons)0 - 250250 - 500500 - 10001000 - 2500> 2500
Potential phosphorus available from confined animal manures
Source: 1997 Census of Agriculture
Balancing Phosphorus Needs and Sources For Crop Production
P
HISTORY
&
BALANCE

Phosphorus processes
Soil
Manure applicationSoluble P Organic P
Labile Ppool
Stable mineral P
poolActive
mineral Ppool
Crop
Organic Ppool
Mineralization
ImmobilizationCrop yield P Plantresidue
Erosion organic & mineral P
Runoff
labile P
LeachedP
CRP
P HOSPHORUS
IMPACTS

Estimated P LossConventionally Tilled Crop
Total P (lbs/ac)0 - 0.250.25 - 0.50.5 - 0.750.75 - 1.51.5 - 33 - 66 - 99 - 1818 - 36
2 Digit HUCs
Pre-CRP simulated P loss/acre for soils with high CRP enrollment
(conventionally tilled crops)
CRP
P HOSPHORUS
IMPACTS

Estimated P LossConventionally Tilled Crop
Total P (lbs/ac)0 - 0.250.25 - 0.50.5 - 0.750.75 - 1.51.5 - 33 - 66 - 99 - 1818 - 36
2 Digit HUCsMissouri
Pre-CRP simulated P loss/acre for soils with high CRP enrollment
(conventionally tilled crops)
CRP
P HOSPHORUS
IMPACTS

Total P (lbs/ac)0 - 0.250.25 - 0.50.5 - 0.750.75 - 1.51.5 - 33 - 66 - 99 - 1818 - 36
2 Digit HUCs
Estimated P LossConservation Reserve Grassland
CRP simulated P loss/acre for soils with high CRP enrollment (mixed
grass cover)
CRP
P HOSPHORUS
IMPACTS

Total P (Lbs/ac)0 - 0.250.25 - 0.50.5 - 0.750.75 - 1.51.5 - 33 - 66 - 99 - 1818 - 36
2 Digit HUCsMissouri
Estimated P LossConservation Reserve Grassland
CRP simulated P loss/acre for soils with high CRP enrollment
(mixed grass cover)
CRP
P HOSPHORUS
IMPACTS
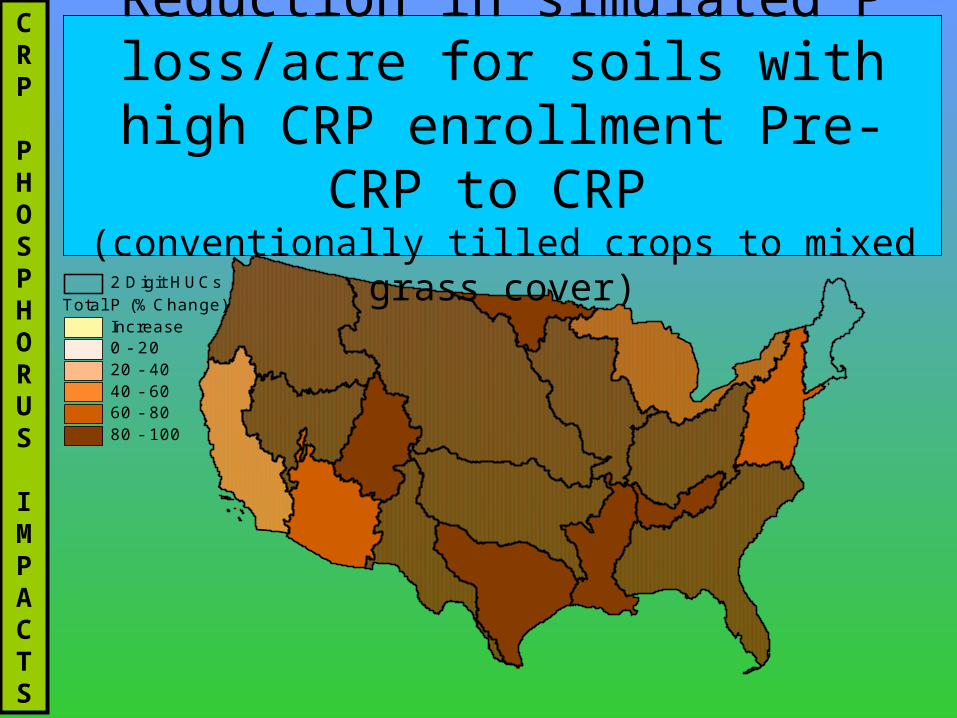
Estimated Reductions
Total P (%Change)Increase0 - 2020 - 4040 - 6060 - 8080 - 100
2 Digit HUCs
Reduction in simulated P loss/acre for soils with high CRP enrollment
Pre-CRP to CRP (conventionally tilled crops to mixed grass cover)
CRP
P HOSPHORUS
IMPACTS
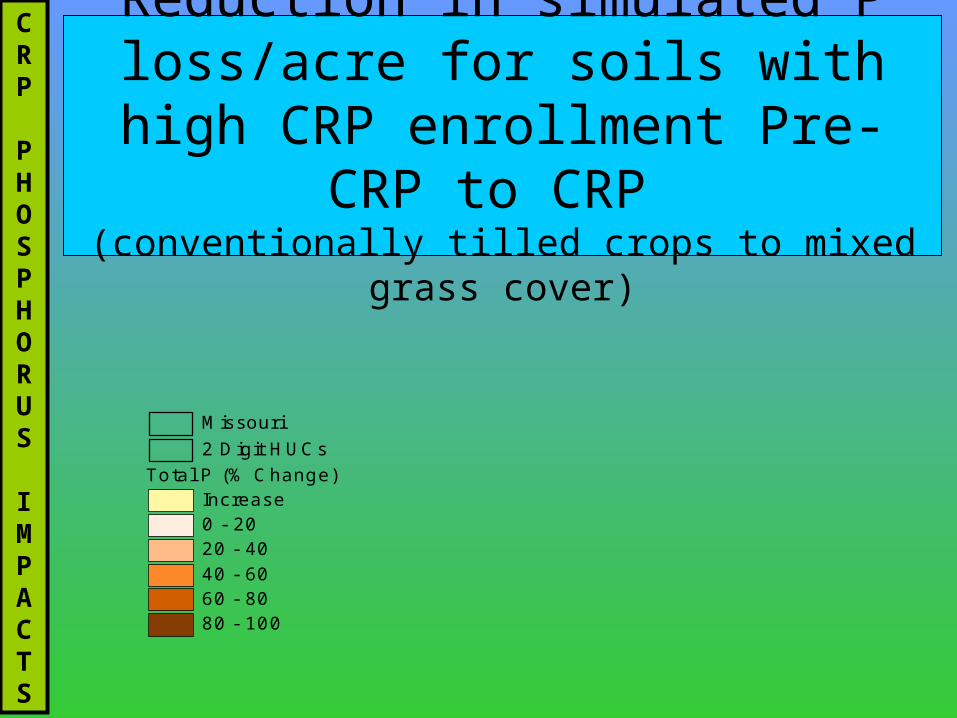
Estimated P Reductions
Total P (% Change)Increase0 - 2020 - 4040 - 6060 - 8080 - 100
2 Digit HUCsMissouri
Reduction in simulated P loss/acre for soils with high CRP enrollment
Pre-CRP to CRP (conventionally tilled crops to mixed grass cover)
CRP
P HOSPHORUS
IMPACTS
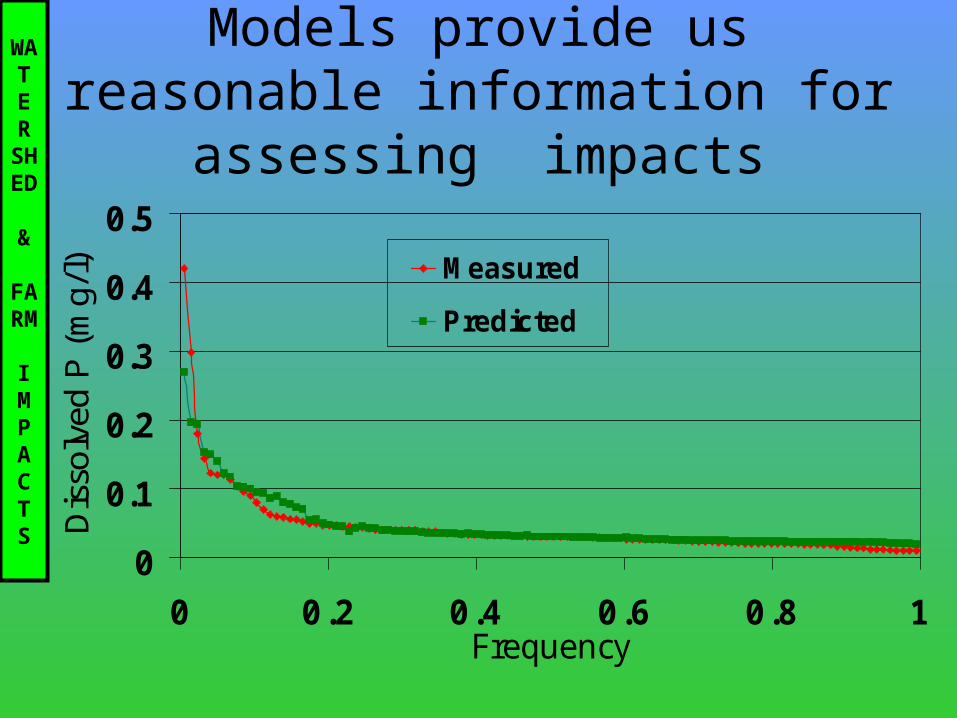
Models provide us reasonable information for assessing
impacts
0
0.1
0.2
0.3
0.4
0.5
0 0.2 0.4 0.6 0.8 1Frequency
Dis
solv
ed P
(m
g/l) Measured
Predicted
WATERSHED
& FARM
IMPACTS

Annual average baseline P concentrations in Upper Shoal Creek
0.0
0.1
0.2
0.3
0.4
0.5
1 6 11 16 21 26 31 36 41 46Years
Ph
os
ph
oru
s
co
nc
en
tra
tio
ns
(m
g/L
)
Mineral Phosphorus
WATERSHED
& FARM
IMPACTS

-80
-60
-40
-20
0
20
40
60
80
100
120
1998 1999 2000 2001 2002 2003
Ending cash reserves for Lawrence and Barry Counties Contract Broiler Representative Farm
Current-annual litter
Harvest hay-annual litter
Current-no litter
Current-alt. year
litter
WATERSHED
& FARM
IMPACTS

100
120
140
160
180
200
220
240
1 6 11 16 21 26 31 36 41 46
Ph
osp
hor
us
Loa
d (
lbs/
ac)
Lawrence/Barry Counties Representative Broiler Farm
Projected accumulated soil phosphorus in top six inches of soil
Years
Current-no litter
Only slight increase in p with alternate year litter application
Current-alt. year
litter
Harvest hay-annual litter
Current-annual litter
WATERSHED
& FARM
IMPACTS
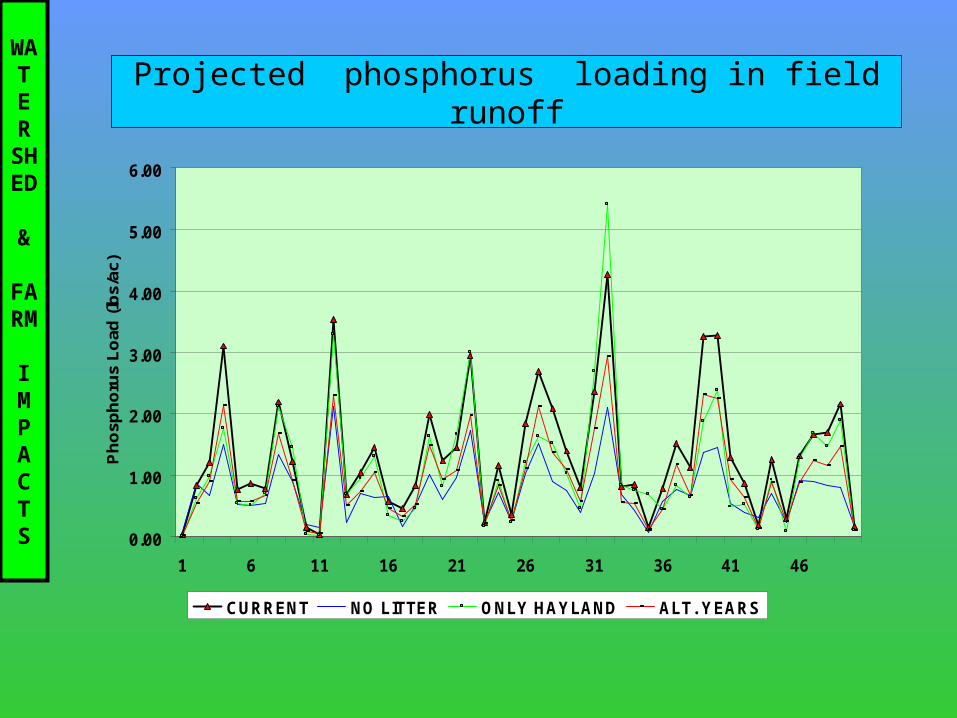
Projected Phosphorus Loading in Field Runoff
0.00
1.00
2.00
3.00
4.00
5.00
6.00
1 6 11 16 21 26 31 36 41 46
Ph
osp
ho
rus
Lo
ad (
lbs/
ac)
CURRENT NO LITTER ONLY HAYLAND ALT. YEARS
Projected phosphorus loading in field runoff
WATERSHED
& FARM
IMPACTS

Farm runoff P when no litter is applied, evaluated to illustrate
solutions will not likely be immediate
0
0.1
0.2
0.3
0.4
0.5
0.6
1 4 7 10 13 16 19 22 25 28 31 34 37 40 43 46 49
Years
Ave
rag
e r
un
off
con
cen
tra
tion
(m
g/L
)
30% decrease in 50 years
37 PPB
Most municipal discharge permits are currently 500 PPB or greater
WATERSHED
& FARM
IMPACTS
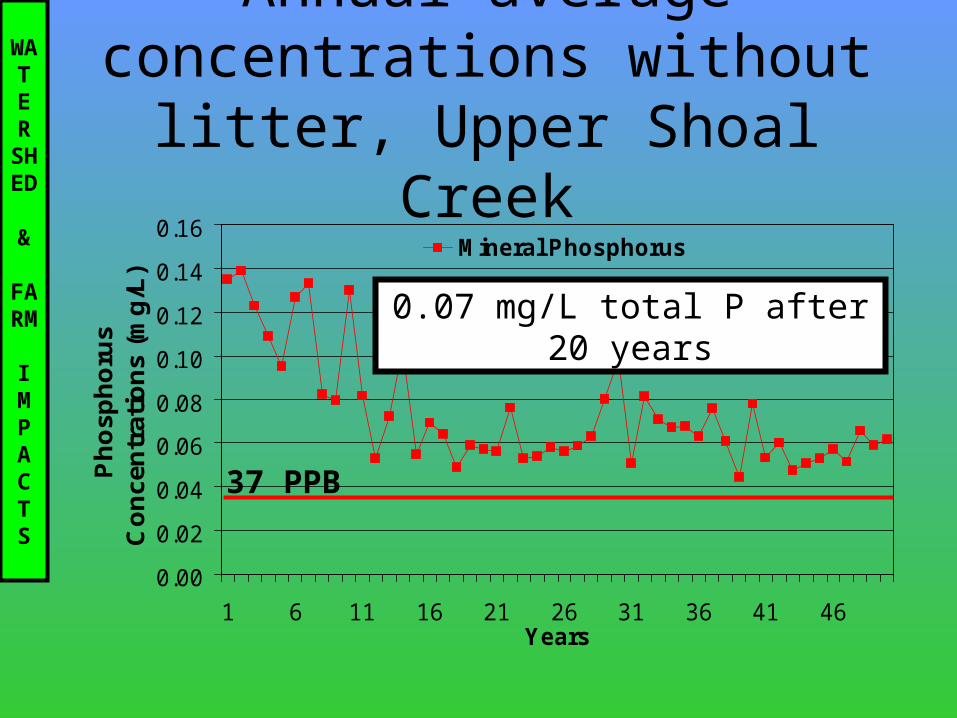
Annual average concentrations without litter, Upper Shoal Creek
0.00
0.02
0.04
0.06
0.08
0.10
0.12
0.14
0.16
1 6 11 16 21 26 31 36 41 46Years
Ph
osp
ho
rus
Co
nce
ntr
atio
ns
(mg
/L)
Mineral Phosphorus
0.07 mg/L total P after 20 years
37 PPB
WATERSHED
& FARM
IMPACTS
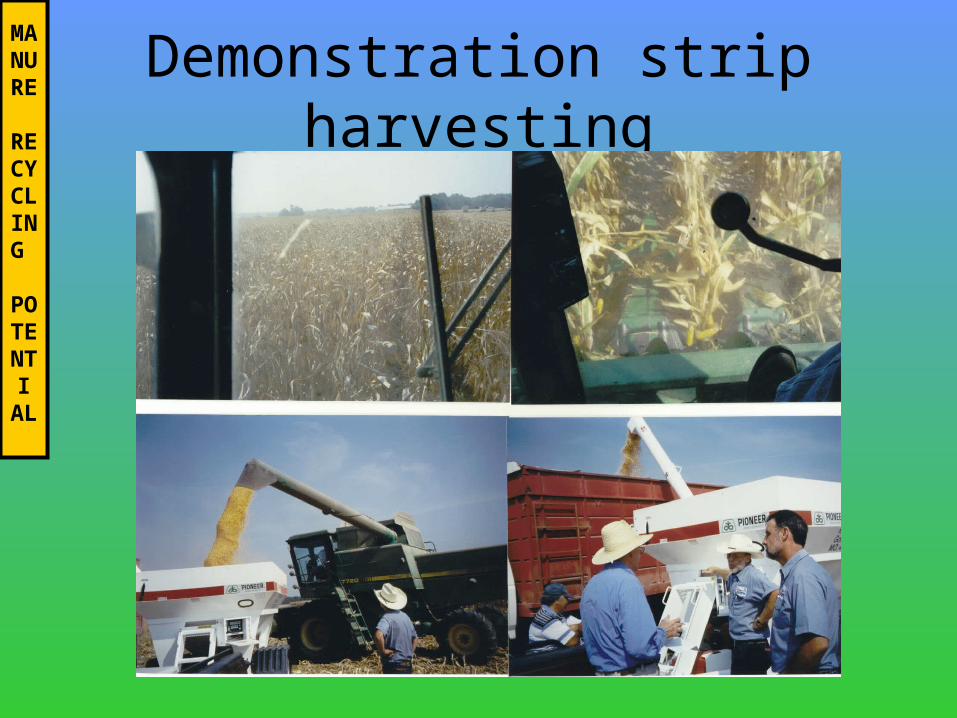
Demonstration strip harvestingMANURE
RECYCLING
POTENTIAL

Poultry litter demonstration
N-P-K applications by strip
0
50
100
150
200
250
300
350
400
Lb
s/A
cre
N
P2O5
K2O
Broile
r litt
er
Comm
erci
al
ferti
lizer
Pelle
ted
litte
rPel
lete
d lit
ter
Pelle
ted
litte
rEM
Tur
key
litte
rEM
Tur
key
litte
r EM T
urke
y lit
ter
Laye
r man
ure
Laye
r man
ure
MANURE
RECYCLING
POTENTIAL
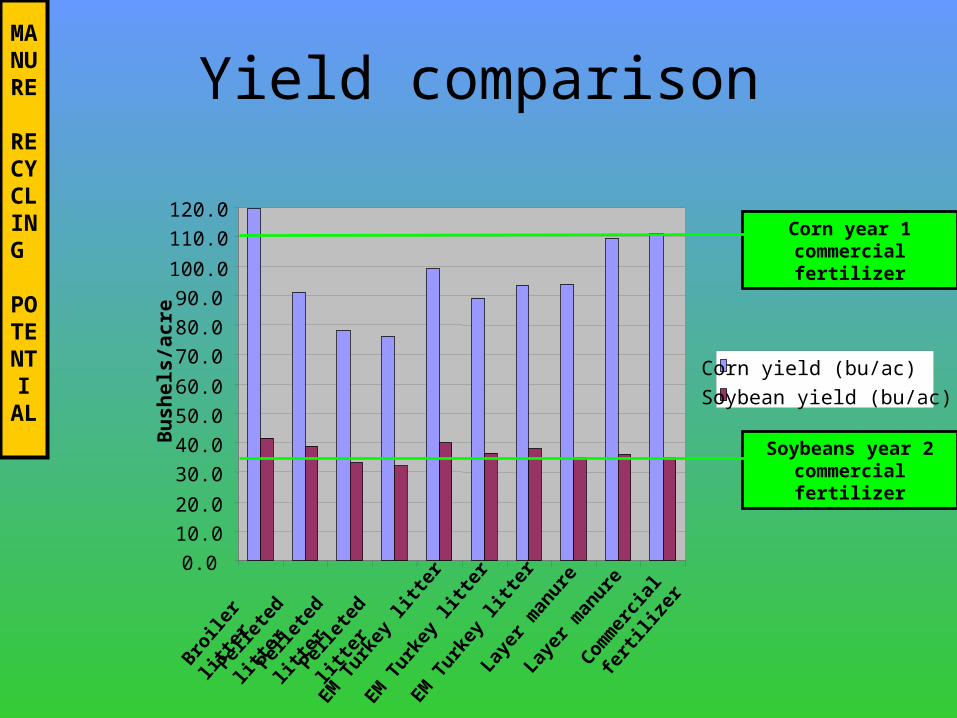
Yield comparison
Broile
r litt
er
Pelle
ted
litte
r
EM T
urke
y lit
ter
Laye
r man
ure
Comm
erci
al
ferti
lizer
Pelle
ted
litte
r
Pelle
ted
litte
rEM
Tur
key
litte
r
EM T
urke
y lit
ter
Laye
r man
ure
0.0
10.0
20.0
30.0
40.0
50.0
60.0
70.0
80.0
90.0
100.0
110.0
120.0
Bu
sh
els
/ac
re
Corn yield (bu/ac)
Soybean yield (bu/ac)
Corn year 1 commercial fertilizer
Soybeans year 2 commercial fertilizer
MANURE
RECYCLING
POTENTIAL
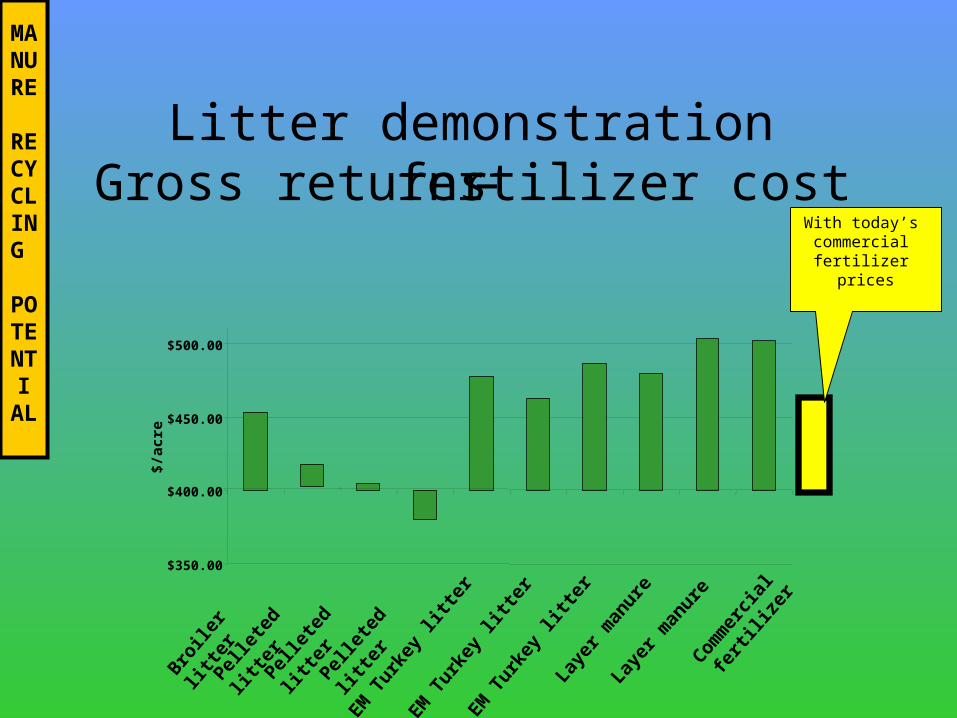
Litter demonstration Gross returns –fertilizer cost
$350.00
$400.00
$450.00
$500.00
$/ac
reBro
iler l
itter
Pelle
ted
litte
r
EM T
urke
y lit
ter
Laye
r man
ure
Comm
erci
al
ferti
lizer
Pelle
ted
litte
rPel
lete
d lit
ter
EM T
urke
y lit
ter
EM T
urke
y lit
ter
Laye
r man
ure
MANURE
RECYCLING
POTENTIAL
With today’s commercial
fertilizer prices
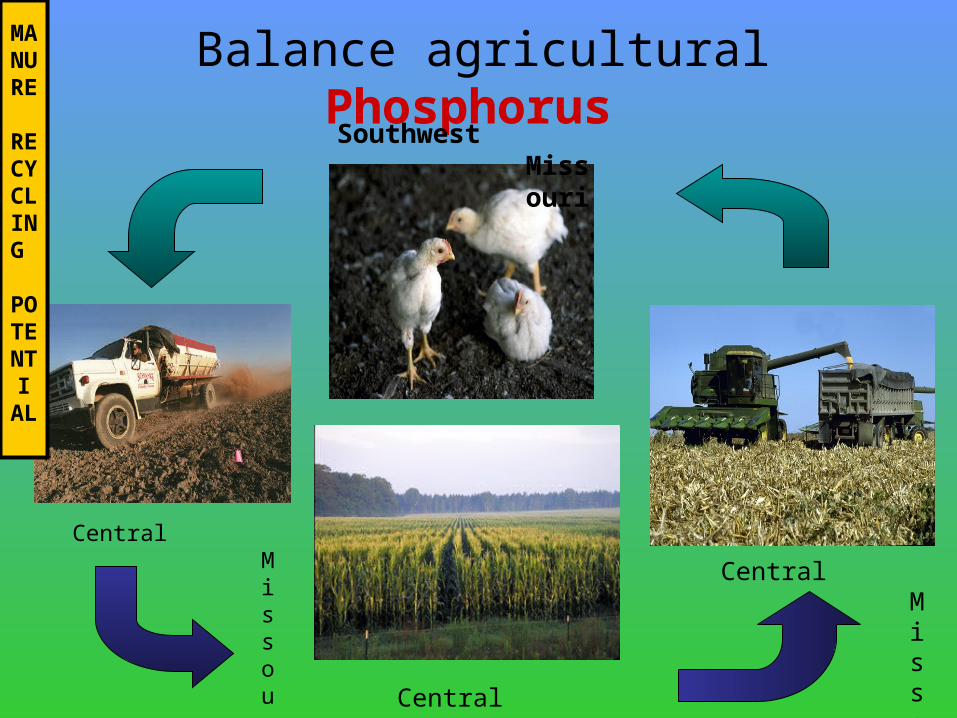
Balance agricultural Phosphorus
Central Missouri
Central Missouri
Central Missouri
Southwest Missouri
MANURE
RECYCLING
POTENTIAL

Producing energy from
poultry & forestry byproducts
ENERGY
PRODUCTION
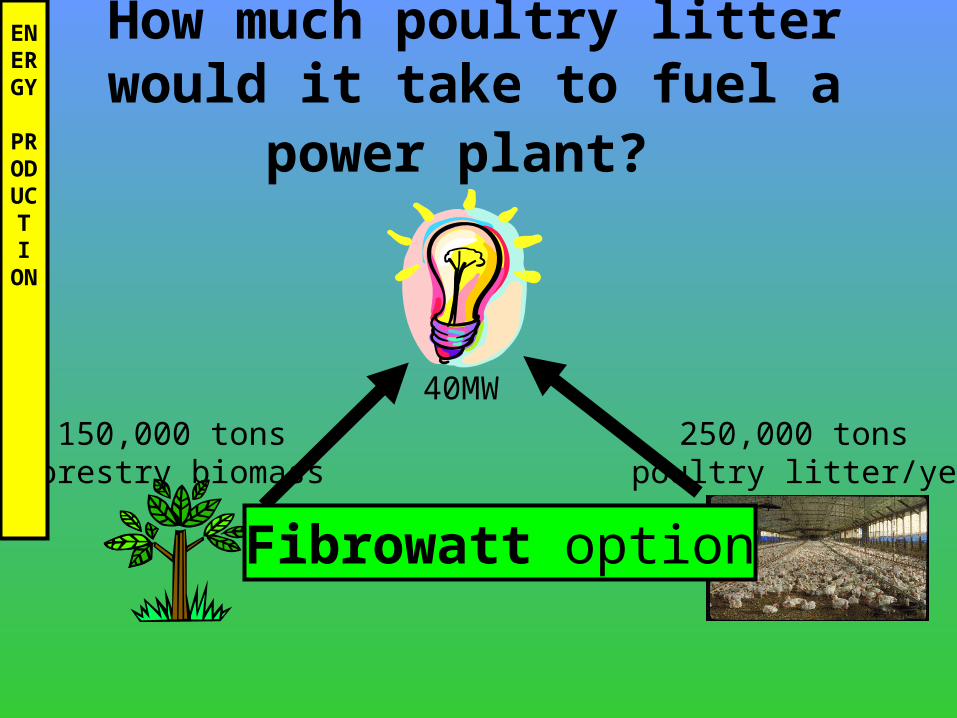
How much poultry litter would it take to fuel a power plant?
250,000 tons poultry litter/year
150,000 tonsForestry biomass
40MW
Fibrowatt option
ENERGY
PRODUCTION

Litter supply – Springfield
Tons of poultry litter
#
Poultry Litter Supply (T/sq mi) 0 1 - 50 51 - 100101 - 200 > 200
50-mi Transport Zones# Springfield
#
ENERGY
PRODUCTION

Estimated cost per Btu fromcoal & poultry litter Springfield, MO
Poultry litter by distance from site
Tons available
Cost per million Btu
0-50 miles 150,000 <$1.2051-100 miles 450,000 $1.21-$1.80
101-150 miles 900,000 $1.81-$2.40
Coal n/a $1.43
ENERGY
PRODUCTION

Riparian Buffers
Buffers trap Sediment
Phosphorus Fecal coliform
Buffers produce Biomass
ENERGY
PRODUCTION

Potential biomass buffers
#
Buffer Density (ac/sq mi) 0 - 5 5 - 1010 - 1515 - 20 > 20
50-mi Transport Zones# Springfield
169,333
140,771
91,387
150-mile 100-mile 50-mile
Potential acres of buffers
Biomass production
expected to be 5-10 tons/acre
per year
ENERGY
PRODUCTION

Adopt/adapt new technologies biomass compressed to less than
50 % of original volume
•Methodology developed by University of Missouri-Columbia Capsule Pipeline Research Center to compress coal
•Compressed biomass is easier to transport and store
•Cost is estimated to be $5 to $8 per ton
•Prototype machine for compressing forest byproducts and poultry litter could be built this year pending funds
ENERGY
PRODUCTION

Current design of a biomass fuel compaction
machine with about 3 ton/hr production rate
Transportable on a flatbed trailer and uses electric power
ENERGY
PRODUCTION

Let’s examinethe balance between regulations and feasibility of food production
REGULATORY
IMPACTS

Rural R
esidence Buffer
Road Buffer
Roa
d B
uffe
r
Stream Buffer
Stream Buffer
Field characteristics and their Field characteristics and their impact on nutrient recyclingimpact on nutrient recycling
Road
Roa
d
Stream
Residence
Residence
REGULATORY
IMPACTS

Field comparison of some of the Field comparison of some of the impacts of alternative buffer widthimpacts of alternative buffer width
Area in buffers- no litter application
Area remaining for litter application
Stream buffers
15 foot Buffers
Road buffers
Rural residence buffer
REGULATORY
IMPACTS

Field comparison of some of the Field comparison of some of the impacts of alternative buffer widthimpacts of alternative buffer width
100 foot buffers
Stream buffers
Road buffers
Rural residencebuffers
Area in buffers- no litter application
Area remaining for litter application
REGULATORY
IMPACTS

What are the impactsof buffer widths at a
regional level?
Let us look at the impactsfrom the perspective of
integrated poultry production
REGULATORY
IMPACTS

Competition among integrated Competition among integrated poultry operations is required poultry operations is required
by antitrust lawsby antitrust laws
Feed Mill Processing Plant
Hatchery 30 mile radius
Poultry Growers
REGULATORY
IMPACTS
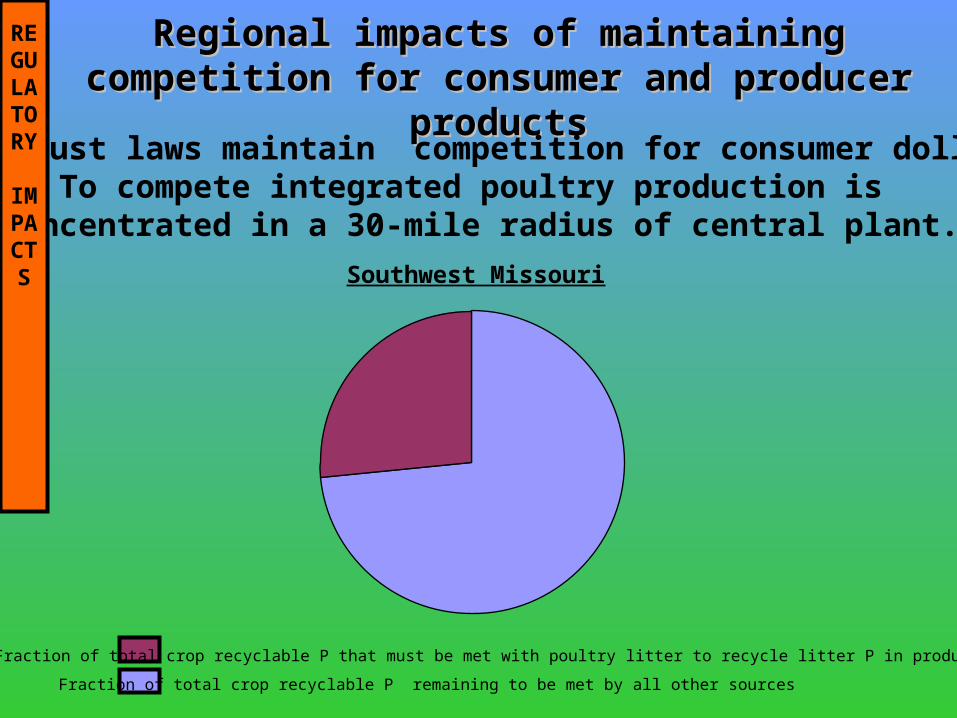
Regional impacts of maintaining competition for Regional impacts of maintaining competition for consumer and producer productsconsumer and producer products
Antitrust laws maintain competition for consumer dollar.To compete integrated poultry production is
concentrated in a 30-mile radius of central plant.
Southwest Missouri
Fraction of total crop recyclable P remaining to be met by all other sources
Fraction of total crop recyclable P that must be met with poultry litter to recycle litter P in production area
REGULATORY
IMPACTS

Packer and Stockyard regulations strongly Packer and Stockyard regulations strongly encourage competition for contract poultry encourage competition for contract poultry
producers.producers. To maintain competition, two integrated operations are assumed to exist.
Fraction of total crop recyclable P remaining to be met by all other sources
Fraction of total crop recyclable P that must be met with poultry litter to recycle litter P in production area
Southwest Missouri
REGULATORY
IMPACTS

Integrated poultry producers in Southwest Missouri
#
#
#
#
#
REGULATORY
IMPACTS

Regional impacts of 15 foot buffer widths
Fraction of total crop recyclable P remaining to be met by all other sources
Fraction of total crop recyclable P that must be met with poultry litter to recycle litter P in production area
Southwest Missouri
REGULATORY
IMPACTS

Regional impacts of 100 foot buffer widths
Southwest Missouri
Fraction of total crop recyclable P remaining to be met by all other sources
Fraction of total crop recyclable P that must be met with poultry litter to recycle litter P in production area
REGULATORY
IMPACTS

We’ve created impossible goals
• Our intentions were good at every point of the decision process
• Both economic and environmental decisions appear to be reasonable
• Holistic assessment says we’re not there yet
• A key issue is equitable allocation of costs and benefits
REGULATORY
IMPACTS
Economic and Environmental Impacts
• Consumer impacts
• Farm impacts
• Watershed impacts
• Regional impacts
WHAT
ARE
THE
STAKES?

Farm Level Prices (1982-84=100 CPI)
020406080
100120140160180
Year
cent
s/lb
Cattle Hogs Chicken
Source:USDA, ERS
Prior tovertical
integration
Verticalintegration
A chickenin every pot
meant wealth
Poultry HistoryWHAT
ARE
THE
STAKES?

Consumer Savings
Farm Level Prices (1982-84=100 CPI)
020406080
100120140160180
Year
cent
s/lb
Cattle Hogs Chicken
Source:USDA, ERS
Potential consumer savings/lb
WHAT
ARE
THE
STAKES?

Corn price effect of poultry feed demand
WHAT
ARE
THE
STAKES?

Loss ofpoultry industry
-$1.8 billion -16,000 jobs
Regional economic impacts of choices
Loss of recreation industries
-$1.4 billion-34,000 jobs
Developa litter hauling
recycling industry$15.9 million
182 jobs
Develop an integrated agroforestry/ poultry litter recycling industry that produces renewable energy and
fertilizer products
$?,??? Million
?,??? jobs
WHAT
ARE
THE
STAKES?
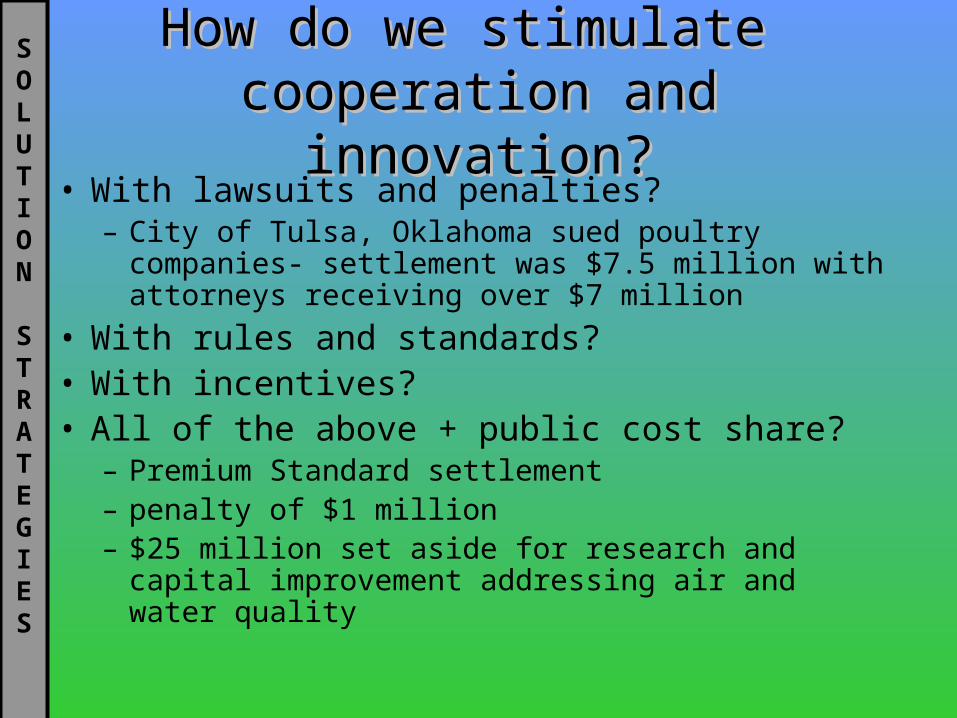
How do we stimulate How do we stimulate cooperation and innovation?cooperation and innovation?
• With lawsuits and penalties?– City of Tulsa, Oklahoma sued poultry companies-
settlement was $7.5 million with attorneys receiving over $7 million
• With rules and standards?• With incentives?• All of the above + public cost share?
– Premium Standard settlement – penalty of $1 million– $25 million set aside for research and capital
improvement addressing air and water quality
SOLUTION
STRATEGIES
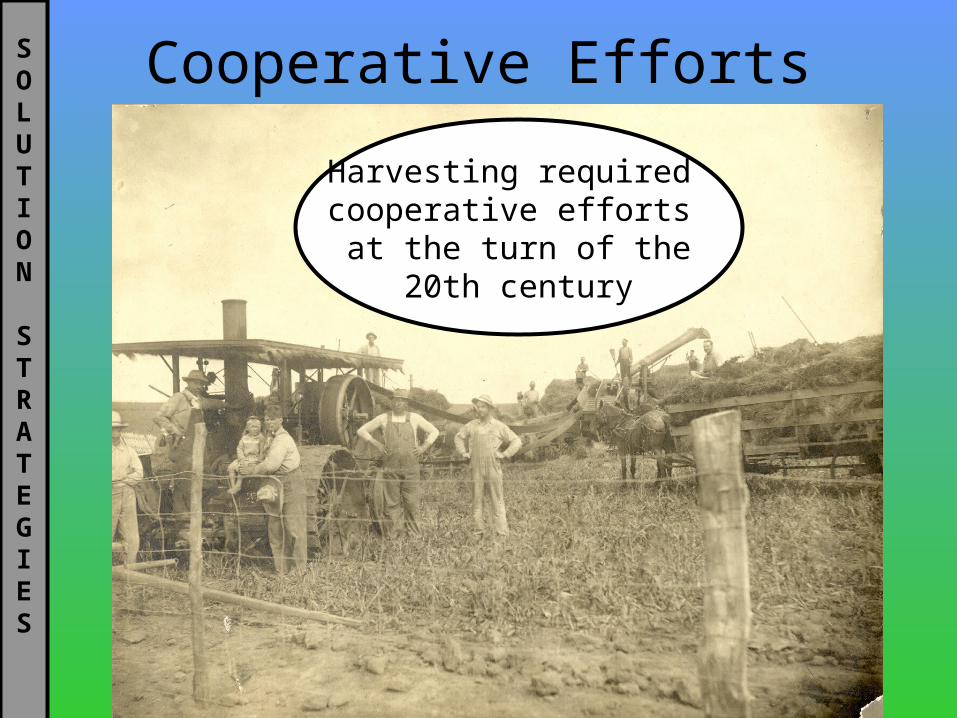
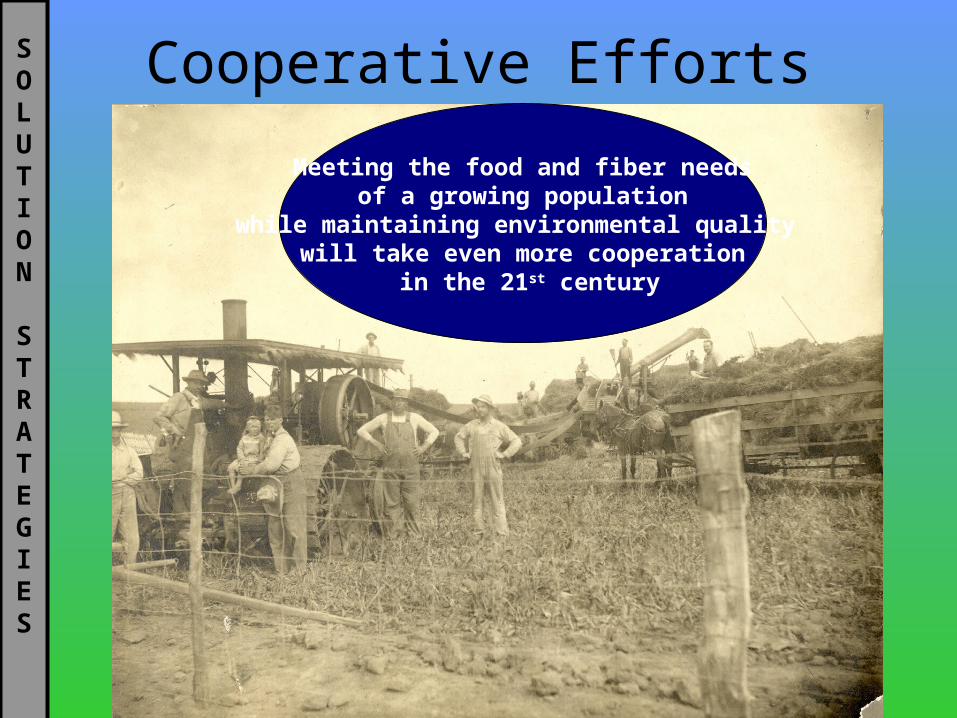
Cooperative Efforts
Harvesting required cooperative efforts
at the turn of the20th century
SOLUTION
STRATEGIES
Cooperative Efforts
Harvesting required Cooperative Efforts
at the turn of the20th century
Meeting the food and fiber needs of a growing population
while maintaining environmental quality will take even more cooperation
in the 21st century
SOLUTION
STRATEGIES

Thank You
Questions?