mississippi lime development - aadelime+developt… · 11 the solution –stuck pipe cherokee shale...
TRANSCRIPT

Mississippi Lime Development
2/11/2015
Cody Martin
Drilling Engineer
2
Mississippi Lime Drilling Team
Mitch Elkins
Terry Leeper
Mike Jagneaux
Daniel Habenicht
Ian West
Cody Martin
Charles Patrick
Jill Fuller
Chelce Rouse
Jacque Croudy
Larry Rader
3
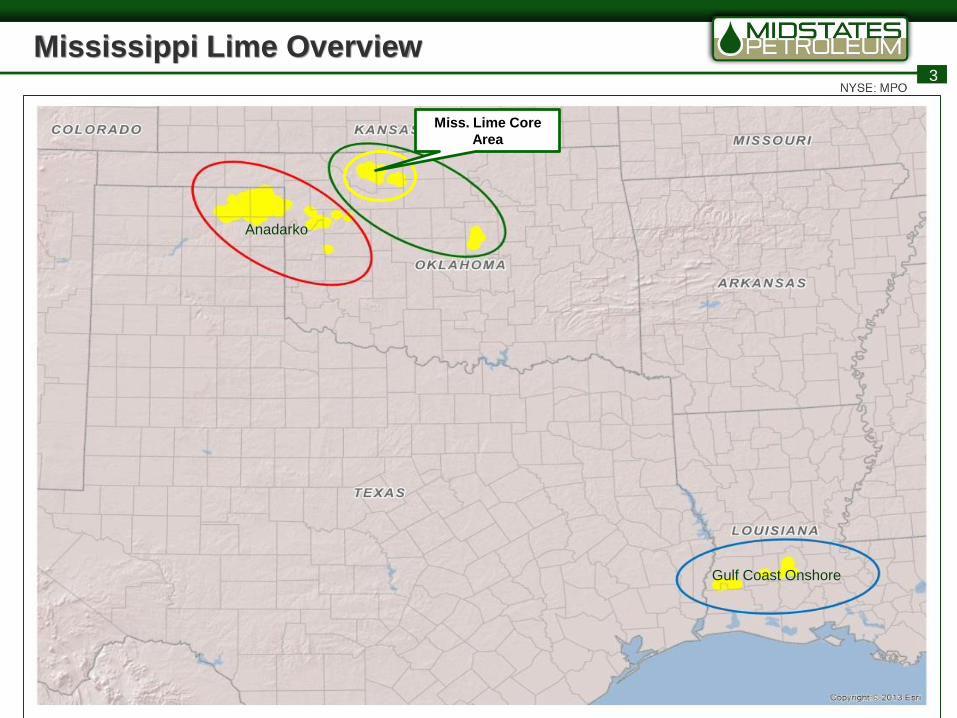
Mississippi Lime Overview
Miss. Lime Core
Area
Anadarko
Gulf Coast Onshore
4
Mississippi Lime Overview
Acquired Eagle Energy acreage in 2012
First Midstates drilled well in 2013
Design and operational changes in 2014
Capital efficiency in 2015

5
Mississippi Lime Overview
Cherokee
Shale
Mississippian Lime
Potential Target
Intervals
6
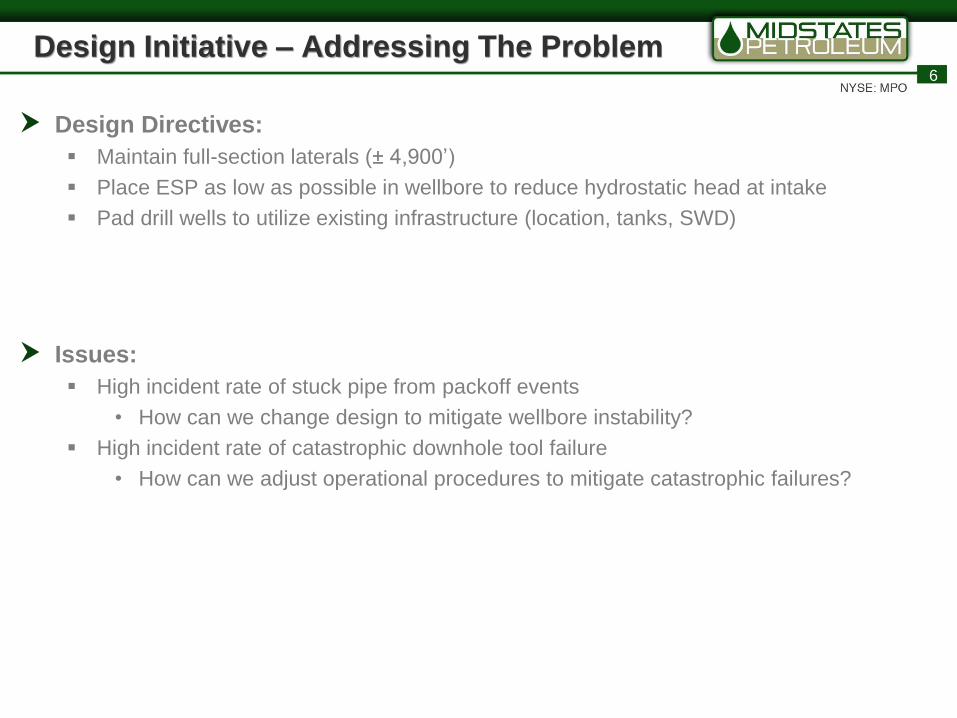
Design Initiative – Addressing The Problem
Design Directives:
Maintain full-section laterals (± 4,900’)
Place ESP as low as possible in wellbore to reduce hydrostatic head at intake
Pad drill wells to utilize existing infrastructure (location, tanks, SWD)
Issues:
High incident rate of stuck pipe from packoff events
• How can we change design to mitigate wellbore instability?
High incident rate of catastrophic downhole tool failure
• How can we adjust operational procedures to mitigate catastrophic failures?

7
Typical Pad Design

8
The Problem - Stuck Pipe
0
2
4
6
8
10
12
14
1000 2000 3000 4000 5000 6000 7000 8000 9000 10000 11000 12000
Fre
quency
Depth
Stuck pipe frequency by depth
Packoff
events in the
curve
9
The Problem – Stuck Pipe
Cherokee Shale is predominately Illite Clay
Extremely dispersive shale
10
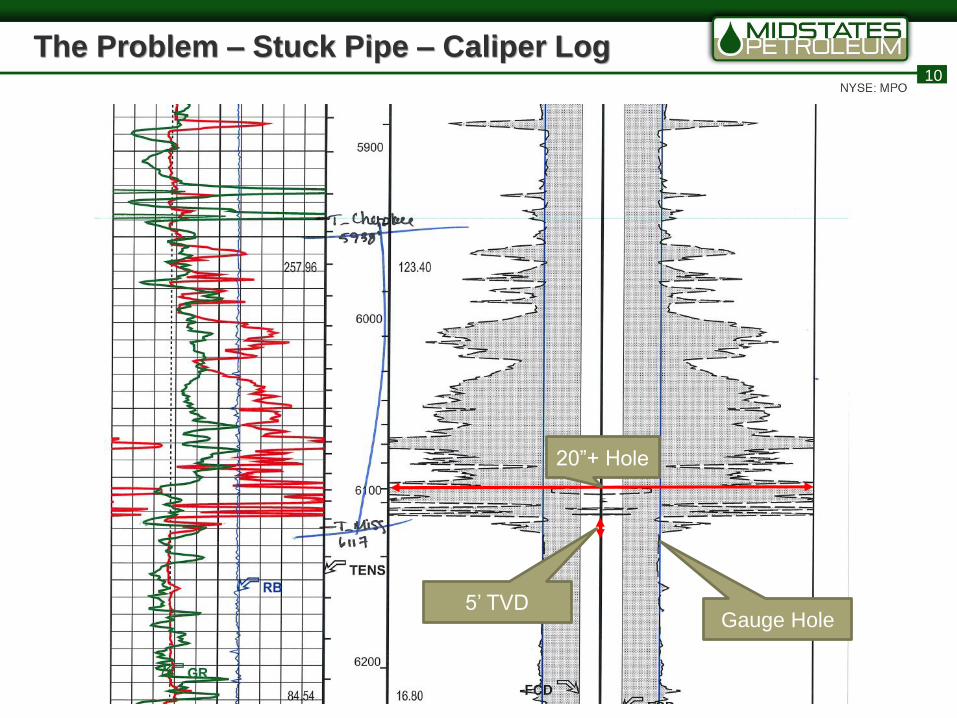
The Problem – Stuck Pipe – Caliper Log
20”+ Hole
Gauge Hole5’ TVD
11
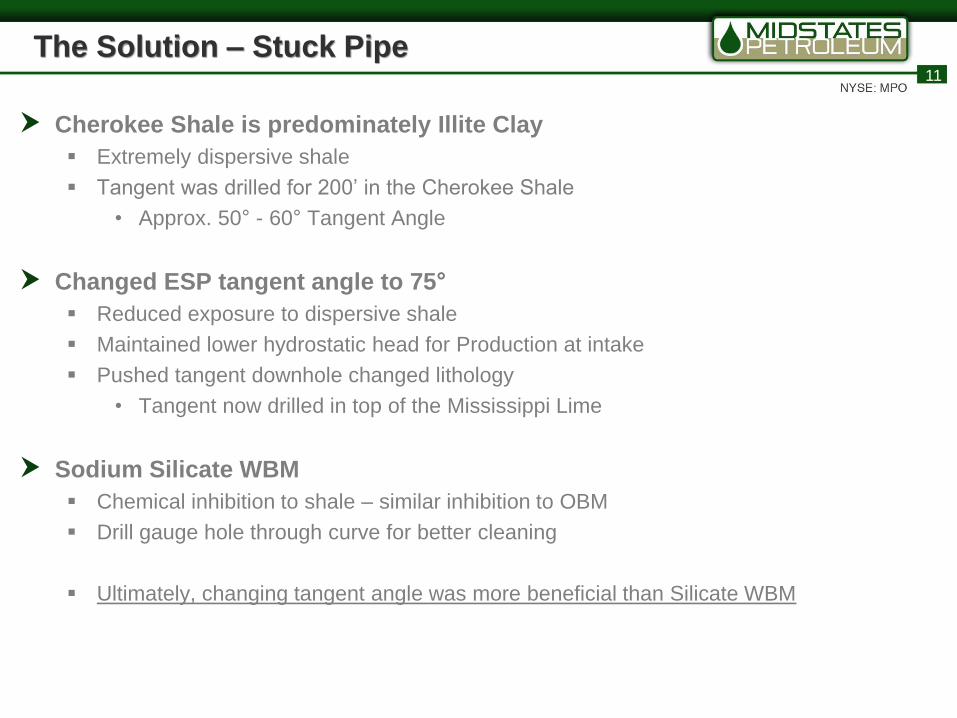
The Solution – Stuck Pipe
Cherokee Shale is predominately Illite Clay
Extremely dispersive shale
Tangent was drilled for 200’ in the Cherokee Shale
• Approx. 50° - 60° Tangent Angle
Changed ESP tangent angle to 75°
Reduced exposure to dispersive shale
Maintained lower hydrostatic head for Production at intake
Pushed tangent downhole changed lithology
• Tangent now drilled in top of the Mississippi Lime
Sodium Silicate WBM
Chemical inhibition to shale – similar inhibition to OBM
Drill gauge hole through curve for better cleaning
Ultimately, changing tangent angle was more beneficial than Silicate WBM
12
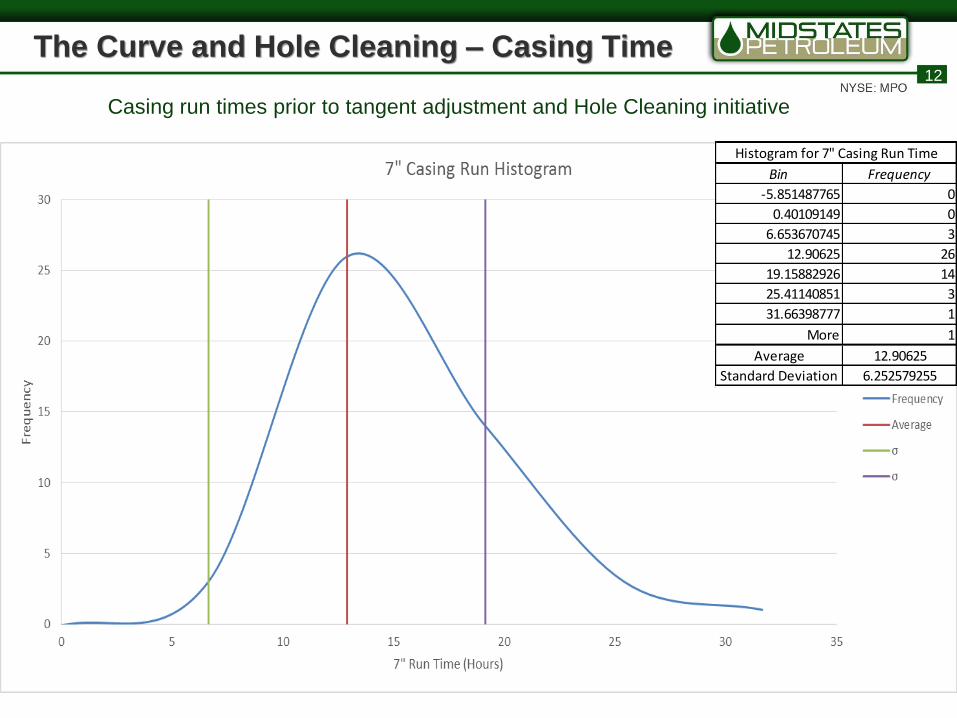
The Curve and Hole Cleaning – Casing Time
Bin Frequency
-5.851487765 0
0.40109149 0
6.653670745 3
12.90625 26
19.15882926 14
25.41140851 3
31.66398777 1
More 1
Average 12.90625
Standard Deviation 6.252579255
Histogram for 7" Casing Run Time
Casing run times prior to tangent adjustment and Hole Cleaning initiative

13
The Curve and Hole Cleaning – Casing Time
Histogram for H2 7" Casing Run Time
Bin Frequency
3.738355272 0
5.857767151 0
7.97717903 4
10.09659091 19
12.21600279 13
14.33541467 7
16.45482655 1
More 0
Average 10.09659091
Standard Deviation 2.119411879

14
The Curve and Hole Cleaning – Casing Time
Changed ESP tangent angle to 75°
Reduced exposure to dispersive shale
Maintained lower hydrostatic head for Production at intake
Pushed tangent downhole changed lithology
• Tangent now drilled in top of the Mississippi Lime
Reduced 7” Casing Time Average and Train Wrecks!
Average running reduced 2.8 hours
• Previous average was 12.9 Hours
• New average is 10.1 Hours
Longest casing run was 13.5 hours
• No pulled casing strings!
• Previous longest casing time was 41 Hours
o Pulled casing and multiple conditioning runs
15
The Problem – Catastrophic DHT Failures
DHT failures were persistent issues
Catastrophic failures – resulting in sidetracks
Near-catastrophic – success retrieving tools
Undiagnosed failure – TOOH for new assembly
Why were so many tools breaking?
16
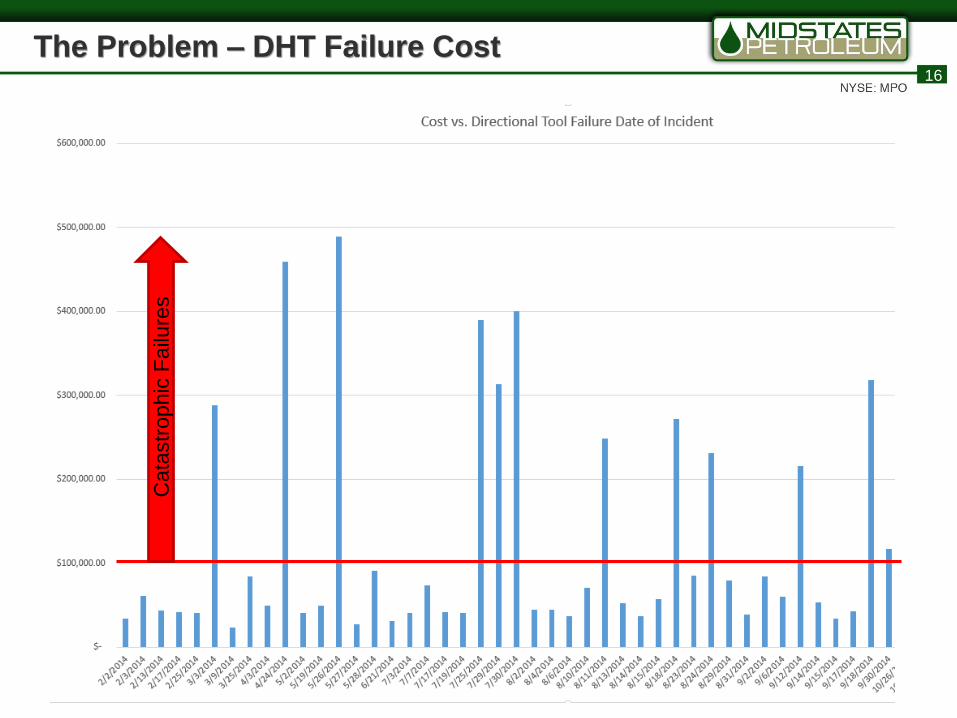
The Problem – DHT Failure Cost
Cata
str
ophic
Failu
res
17
The Solution – Catastrophic DHT Failures
DHT failures were persistent issues
Catastrophic failures – resulting in sidetracks
Near-catastrophic – success retrieving tools
Undiagnosed failure – TOOH for new assembly
Why were so many tools breaking?
Implement DHT guidelines and procedure rollout
Clearly define the issue at hand
Clearly state the operational parameters
Training, training, training!
• Engineer, Company Man, driller, and DD MUST work together!
Document failures
Learn from the mistakes
Keep it in the open so it’s not forgotten!
“It’s not the hole you make, it’s the hole you keep!”

18
The Solution – DHT Failures
$-
$100,000.00
$200,000.00
$300,000.00
$400,000.00
$500,000.00
$600,000.00
2/2
/20
14
2/3
/20
14
2/1
3/2
01
4
2/1
7/2
01
4
2/2
5/2
01
4
3/3
/20
14
3/9
/20
14
3/2
5/2
01
4
4/3
/20
14
4/2
4/2
01
4
5/2
/20
14
5/1
9/2
01
4
5/2
6/2
01
4
5/2
7/2
01
4
5/2
8/2
01
4
6/2
1/2
01
4
7/3
/20
14
7/7
/20
14
7/1
7/2
01
4
7/1
9/2
01
4
7/2
5/2
01
4
7/2
9/2
01
4
7/3
0/2
01
4
8/2
/20
14
8/4
/20
14
8/6
/20
14
8/1
0/2
01
4
8/1
1/2
01
4
8/1
3/2
01
4
8/1
4/2
01
4
8/1
5/2
01
4
8/1
8/2
01
4
8/2
3/2
01
4
8/2
4/2
01
4
8/2
9/2
01
4
8/3
1/2
01
4
9/2
/20
14
9/6
/20
14
9/1
2/2
01
4
9/1
4/2
01
4
9/1
5/2
01
4
9/1
7/2
01
4
9/1
8/2
01
4
9/3
0/2
01
4
10
/26
/20
14
10
/27
/20
14
10
/28
/20
14
10
/30
/20
14
11
/4/2
01
4
10
/23
/20
14
12
/16
/20
14
12
/17
/20
14
1/3
/20
15
1/2
3/2
01
5
Cost vs. Directional Tool Failure Date of Incident
Directional tool failure analysis and action plan instituted
19
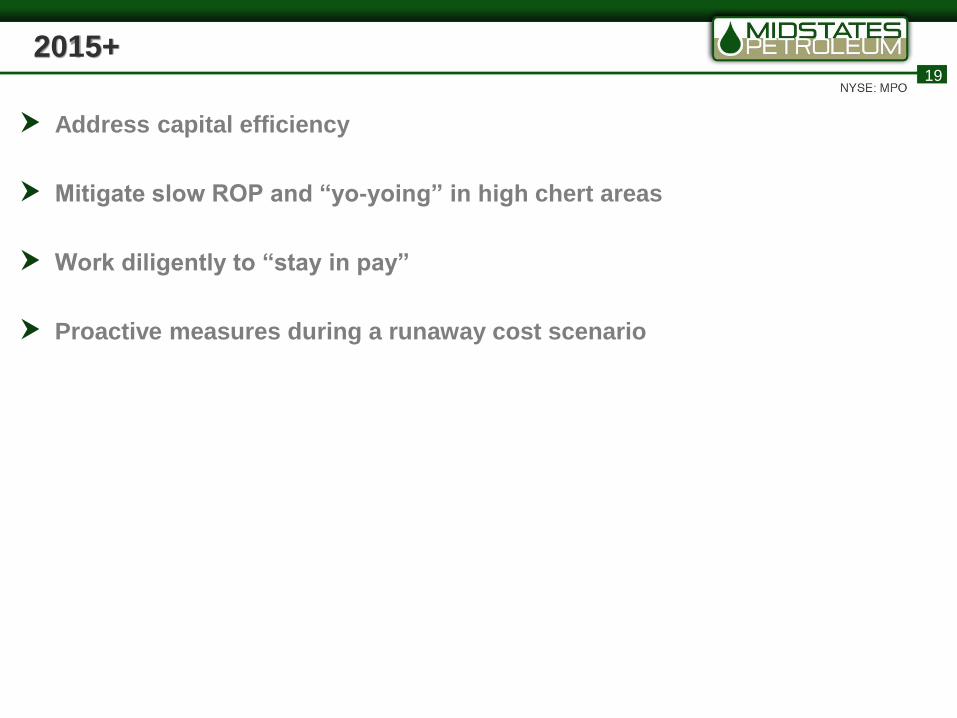
2015+
Address capital efficiency
Mitigate slow ROP and “yo-yoing” in high chert areas
Work diligently to “stay in pay”
Proactive measures during a runaway cost scenario

20
Questions
Thank you for listening
Questions?