minnehaha creek lake minnetonka gray’s bay dam … · this information allows mcwd to plan and...
TRANSCRIPT
GRAY’S BAY DAM PARTNERSHIPBETWEEN MINNEHAHA CREEK WATERSHED DISTRICT AND THE NATIONAL WEATHER SERVICE
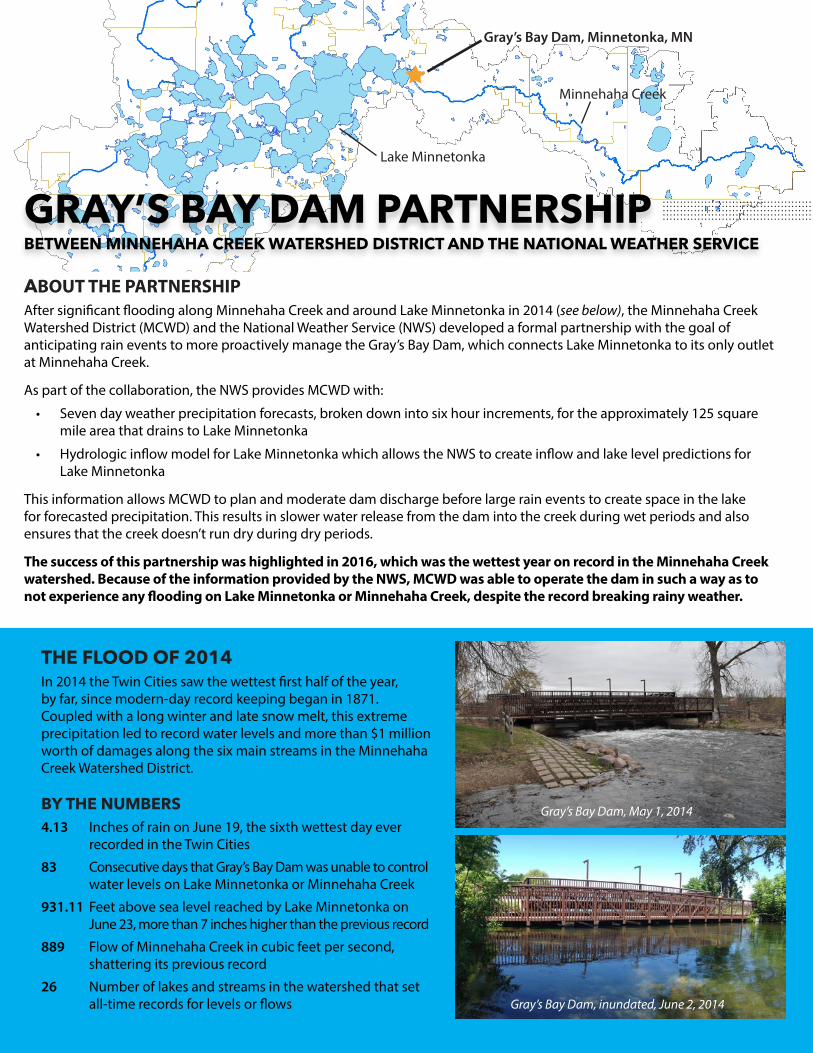
ABOUT THE PARTNERSHIPAfter significant flooding along Minnehaha Creek and around Lake Minnetonka in 2014 (see below), the Minnehaha Creek Watershed District (MCWD) and the National Weather Service (NWS) developed a formal partnership with the goal of anticipating rain events to more proactively manage the Gray’s Bay Dam, which connects Lake Minnetonka to its only outlet at Minnehaha Creek.
As part of the collaboration, the NWS provides MCWD with:
• Seven day weather precipitation forecasts, broken down into six hour increments, for the approximately 125 square mile area that drains to Lake Minnetonka
• Hydrologic inflow model for Lake Minnetonka which allows the NWS to create inflow and lake level predictions for Lake Minnetonka
This information allows MCWD to plan and moderate dam discharge before large rain events to create space in the lake for forecasted precipitation. This results in slower water release from the dam into the creek during wet periods and also ensures that the creek doesn’t run dry during dry periods.
The success of this partnership was highlighted in 2016, which was the wettest year on record in the Minnehaha Creek watershed. Because of the information provided by the NWS, MCWD was able to operate the dam in such a way as to not experience any flooding on Lake Minnetonka or Minnehaha Creek, despite the record breaking rainy weather.
THE FLOOD OF 2014In 2014 the Twin Cities saw the wettest first half of the year, by far, since modern-day record keeping began in 1871. Coupled with a long winter and late snow melt, this extreme precipitation led to record water levels and more than $1 million worth of damages along the six main streams in the Minnehaha Creek Watershed District.
BY THE NUMBERS4.13 Inches of rain on June 19, the sixth wettest day ever recorded in the Twin Cities
83 Consecutive days that Gray’s Bay Dam was unable to control water levels on Lake Minnetonka or Minnehaha Creek
931.11 Feet above sea level reached by Lake Minnetonka on June 23, more than 7 inches higher than the previous record
889 Flow of Minnehaha Creek in cubic feet per second, shattering its previous record
26 Number of lakes and streams in the watershed that set all-time records for levels or flows
Gray’s Bay Dam, May 1, 2014
Gray’s Bay Dam, inundated, June 2, 2014
Gray’s Bay Dam, Minnetonka, MN
Lake Minnetonka
Minnehaha Creek
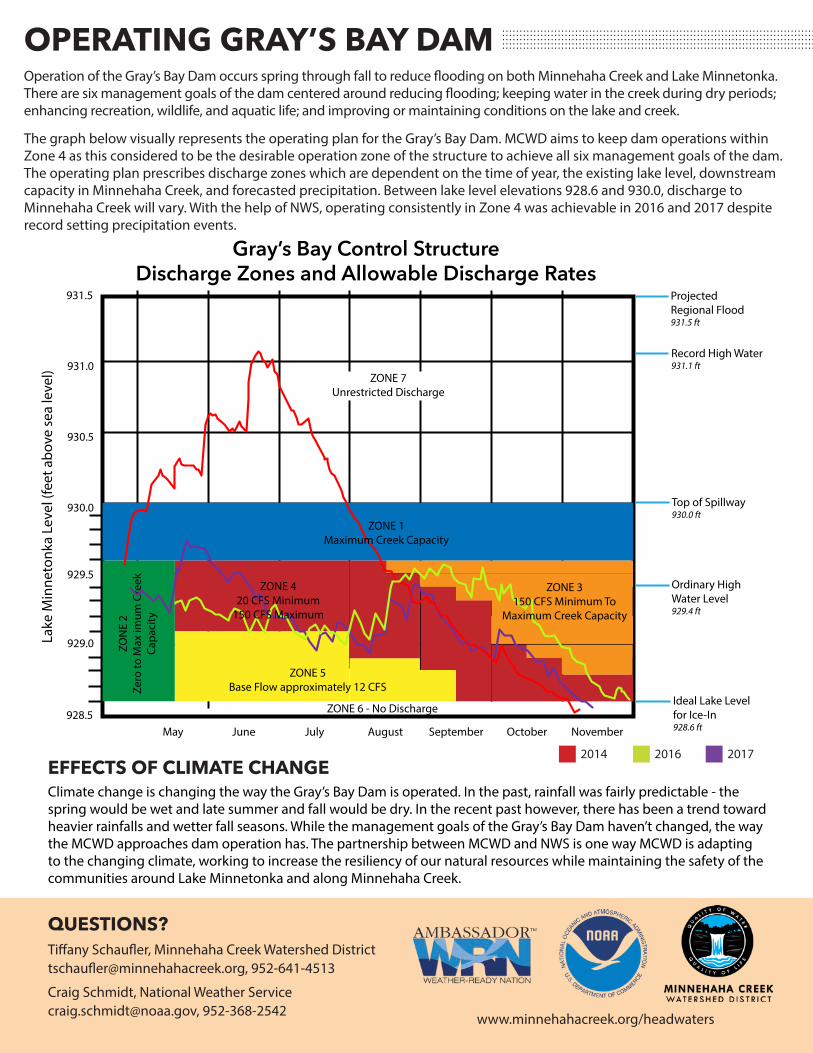
Projected Regional Flood931.5 ft
Record High Water931.1 ft
Top of Spillway930.0 ft
Ordinary High Water Level929.4 ft
May June July August September October
931.5
931.0
930.5
930.0
929.5
929.0
928.5November
ZONE 7Unrestricted Discharge
Lake
Min
neto
nka
Leve
l (fe
et a
bove
sea
leve
l)
Ideal Lake Level for Ice-In928.6 ft
ZONE 5Base Flow approximately 12 CFS
ZON
E 2
Zero
to M
ax im
um C
reek
Ca
paci
ty
ZONE 6 - No Discharge
Gray’s Bay Control StructureDischarge Zones and Allowable Discharge Rates
ZONE 1Maximum Creek Capacity
ZONE 3150 CFS Minimum To
Maximum Creek Capacity
ZONE 420 CFS Minimum
150 CFS Maximum
EFFECTS OF CLIMATE CHANGEClimate change is changing the way the Gray’s Bay Dam is operated. In the past, rainfall was fairly predictable - the spring would be wet and late summer and fall would be dry. In the recent past however, there has been a trend toward heavier rainfalls and wetter fall seasons. While the management goals of the Gray’s Bay Dam haven’t changed, the way the MCWD approaches dam operation has. The partnership between MCWD and NWS is one way MCWD is adapting to the changing climate, working to increase the resiliency of our natural resources while maintaining the safety of the communities around Lake Minnetonka and along Minnehaha Creek.
OPERATING GRAY’S BAY DAM
QUESTIONS?Tiffany Schaufler, Minnehaha Creek Watershed District [email protected], 952-641-4513
Craig Schmidt, National Weather Service [email protected], 952-368-2542
2016 20172014
Operation of the Gray’s Bay Dam occurs spring through fall to reduce flooding on both Minnehaha Creek and Lake Minnetonka. There are six management goals of the dam centered around reducing flooding; keeping water in the creek during dry periods; enhancing recreation, wildlife, and aquatic life; and improving or maintaining conditions on the lake and creek.
The graph below visually represents the operating plan for the Gray’s Bay Dam. MCWD aims to keep dam operations within Zone 4 as this considered to be the desirable operation zone of the structure to achieve all six management goals of the dam. The operating plan prescribes discharge zones which are dependent on the time of year, the existing lake level, downstream capacity in Minnehaha Creek, and forecasted precipitation. Between lake level elevations 928.6 and 930.0, discharge to Minnehaha Creek will vary. With the help of NWS, operating consistently in Zone 4 was achievable in 2016 and 2017 despite record setting precipitation events.
www.minnehahacreek.org/headwaters