minitab statistical software...
TRANSCRIPT

Minitab Statistical Software Introduction
Wang Ruci M1
Division of Spatial Information Science
Graduate School of Life and Environmental Sciences
University of Tsukuba
2015.12.05


Introduction
• Minitab is a statistics software that often combined with the implementation of Six sigma, CMMI (Capability Maturity Model Integration) and other statistics-based process improvement methods.
Simple and
intuitive
Multi language version
Compatible with
Microsoft
Comprehensive statistical analysis
Based on excel
Minitab 17

The relationship between Minitab and 6 Sigma
• In the 1980s, Motorola begin within the company to introduce 6 sigma, and using Minitab statistical software to do the maximum limit development.
• The MAIC (Measure, Analyze, Improve and Control)step in 6 sigma, a lot of analyze and statistic can finish in Minitab software in a simple way.

Multi language version
Chinese
English
Japanese French
Korean
German
Spanish

About download

About download

Minitab user interface
Session window
WorksheetColumns
Rows
Cells
Project manager

Toolbar introduction
Folding session window
Folding worksheets window
Folding graph window
Project window
Historical record
Report stack
Show related documents
Design for current worksheet
Session window
Current data window
Project manager
Close all graphs

Function
• Computation function
Calculator function
Generating data function
Probability distribution function
Matrix operation

Function
• Data analysis function
Statistic
Regression analysis
Variance analysis
Multivariable analysis
Non-parametric estimation
……

Function• Graphic analysis
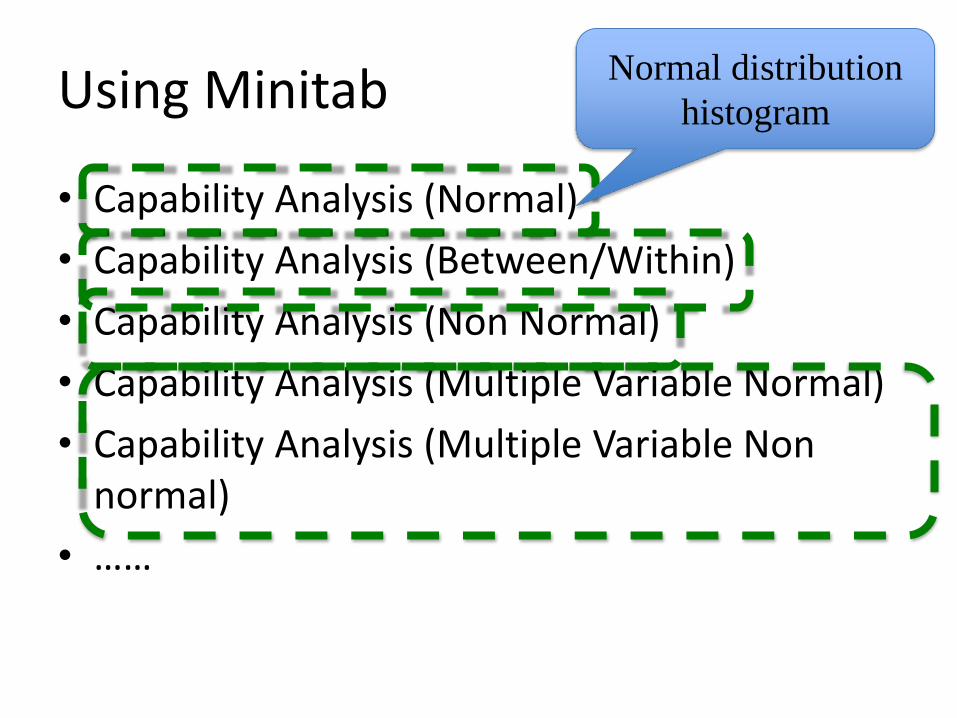
Using Minitab
• Capability Analysis (Normal)
• Capability Analysis (Between/Within)
• Capability Analysis (Non Normal)
• Capability Analysis (Multiple Variable Normal)
• Capability Analysis (Multiple Variable Non normal)
• ……
Normal distribution
histogram
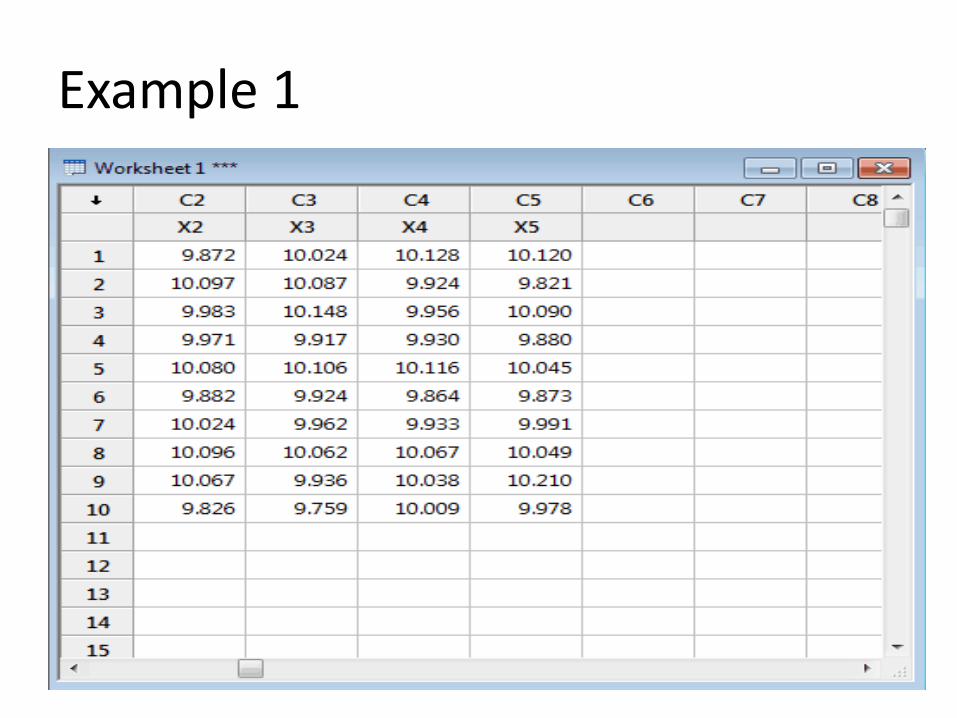
Example 1
• For example:
10±0.3gram
s

Input data and analysis
• Select : Stat—Quality Tools—Capability Analysis (Normal)
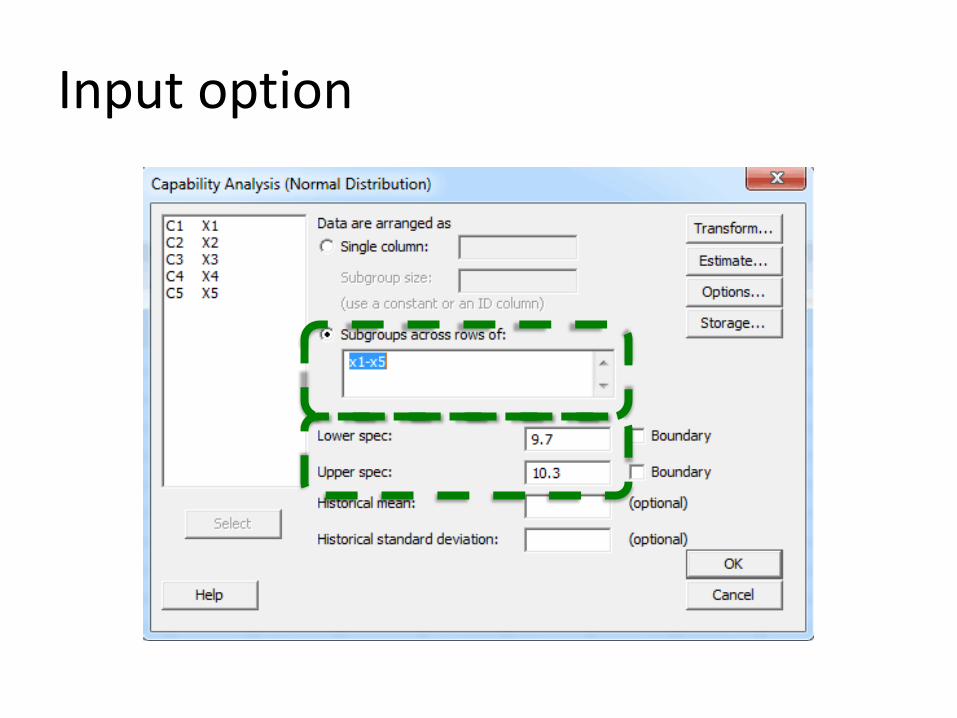
Input option

Output result
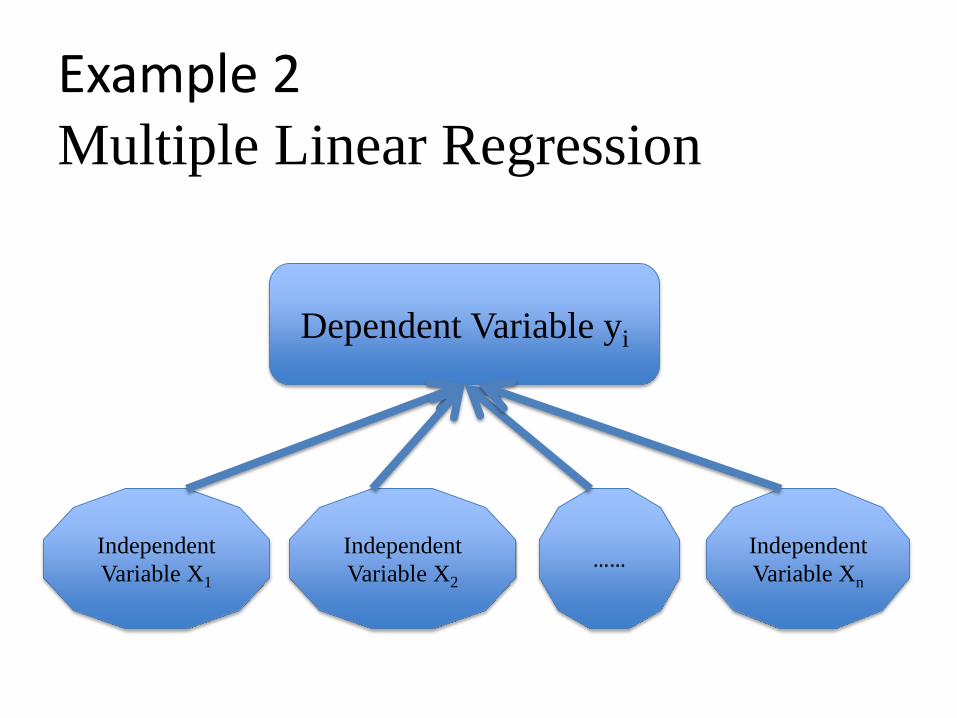
Example 2Multiple Linear Regression
Independent
Variable X2
Independent
Variable X1
……Independent
Variable Xn
Dependent Variable yi

Somatic fat volume
subcutaneous fat mass circumference of leg
circumference of arm

Input data
• Observe
• Conjecture
• Make a trend graph

Graph
Straight line relationship

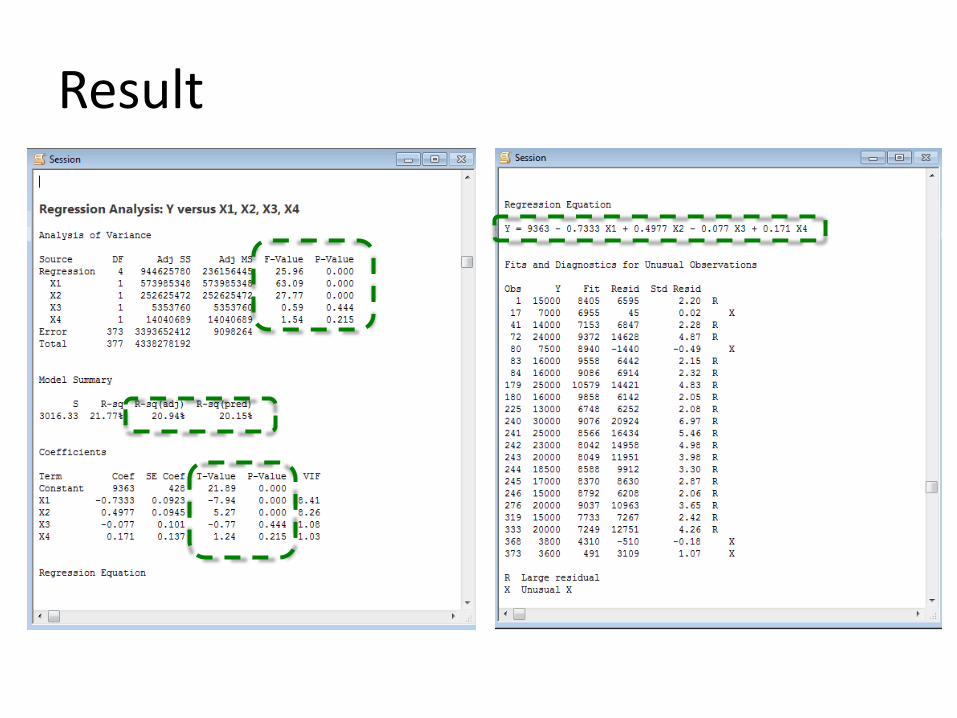
Multiple Linear Regression

Result

Example 3

Graph
Result

27
Thanks for your attention .
Wang Ruci 2015 12 03