ministry of fisheries & forests -...
TRANSCRIPT
Our Forest Our Ocean, Our F
uture
MIN
ISTRY OF FISHERIES & F
OR
ESTS
2 0 1 5 A N N U A L C O R P O R A T E P L A N
Ministry of Fisheries & Forests

TABLE OF CONTENTS
Minister’s Foreword 4
Permanent Secretary’s Statement 5
Acronyms 6
Corporate Profile 7
- Vision 7
- Mission 7
- Values 7
- Customers 8
Functions 10
Statutory Functions 12
Functions of the Permanent Secretary 12
Legislative Framework 13
Budget Performance Outputs 14
Priority Outcomes (RDSSED) 16
Organization Structure, Plans and planning process 17
Linkage of the Roadmap for Democracy and Sustainable 19
Ministry’s Outputs and Performance Targets – Table 2 22
Public Service Commission Deliverables and Indicators –Table 3 93
Capital Projects for the Year (2015) – Table 4 95
Ministry of Finance Deliverables and Indicators – Table 5 108
Non Specific Outputs - Optional 109
Glossary 110

M I N I S T R Y O F F I S H E R I E S A N D F O R E S T S
4 2015 Annual Corporate Plan
M I N I S T E R ’ S F O R E W O R D
I thank the staff for the dedication and hard work in producing this 2015 Corporate Plan. The Plan is important to the Ministry of Fisheries and Forests because it directs and
guides its resources and time towards discharging its mandated roles and responsibilities.
I am confident that this Plan will again raise the performance level of the Ministry. There is considerable commitment towards aligning the Ministry’s key policy objectives and Outputs to the National Planning Documents and most importantly to the Government of the days manifesto.
The Ministry will engage in smart partnership for effective and efficient service delivery and central to this, is securing the confidence of key partners that share similar goals in improving and advancing the wellbeing and governance of the fisheries and forest industries and communities. To this end, the Ministry of Fisheries and Forests is determined to implement the following key initiatives:-
1. Ensuring food security for the people of Fiji through various programs and activities that is
implemented;2. Greater collaboration and networking of all key stakeholders involved with Research;3. Protection of our biodiversity through the establishment of national parks and reserves; 4. Community Empowerment through provision of appropriate training for SME’s and identification of alternative livelihood schemes; 5. Streamlining of systems and processes to better service Fijians; 6. Empowerment of women to participate competitively in the market of fisheries and forest products; 7. Enhancement of Ministry staff to provide efficient and effective service delivery; 8. Reducing climate change impact; and 9. Provision of affordable housing to Fijians through our Pine Maritime Project,
The challenge is to keep striving for excellence and to deliver within given resources and timeframe. To accomplish these, it is imperative that we take full ownership of this Plan and that the fisheries and forest community also share its purpose and benefits with others for ensuring a enhanced and prosperous Fisheries and forest sector for the present and future generation.
Mr. Osea Naiqamu Honorable Minister for Fisheries and Forests

M I N I S T R Y O F F I S H E R I E S A N D F O R E S T S
52015 Annual Corporate Plan
P E R M A N E N T S E C R E T A R Y ’ S S T A T E M E N T
This Annual Corporate Plan highlights the key outputs that the Ministry of Fisheries and Forests is committed to deliver in 2015. The total commitment of staff in the
planning process is a positive indication of acceptance and assurance that we have seriously considered the strategies for achieving our goals from a renewed perspective.
This Plan sets out the context of our core business and articulates the key strategies we intend to pursue in meeting these goals. It communicates our planned approach to all staff so that there is clear understanding and meaningful participation in moving the Ministry towards the right direction for 2015.
Furthermore, this important document retains the fundamental elements of our planning by focusing on our customers, service delivery, our staff and our core business performance. An extension of this Plan is the development of a annual Business Plans by each Division/Department of the Ministry and the Individual Work plan of each employee. The Business Plan contains greater specificity in presenting the objectives, strategies and initiatives to guide our progress for each year.
It is my fervent hope that the 2015 Corporate Plan will reach out to all our stakeholders and to the public at large to ensure that there is greater appreciation of our operational environment and the direction that we are taking for the year.
I look forward to meeting the objectives and strategies set out in this Plan.
Mr. Inoke WainiqoloPermanent Secretary for Fisheries and Forests
M I N I S T R Y O F F I S H E R I E S A N D F O R E S T S
6 2015 Annual Corporate Plan
ACP Annual Corporate Plan
CBD Convention on Biological Diversity
CBT Competency Based Training
CI Conservation International
CITIESConvention on International Trade of Endangered Species of Wild Fauna and Flora
EIA Environmental Impact Assessment
EU European Union
FLEGTForest Law Enforcement Governance & Trade
FAD Fish Aggregation Device
FAOFood and Agriculture Organisation of the United Nations
FFHCOP Fiji Forest Harvesting Code of Practice
Table A:Acronyms
M I N I S T R Y O F F I S H E R I E S A N D F O R E S T S
72015 Annual Corporate Plan
VISION
O u r F u t u r e g e n e r a t i o n w i l l i n h e r i t a p r o s p e r o u s a n d e n h a n c e d F i s h e r i e s a n d F o r e s t s S e c t o r
MISSION STATEMENT
I m p r o v i n g L i v e l i h o o d t h r o u g h S M A R T P o l i c i e s o n S u s t a i n a b l e M a n a g e m e n t o f F i s h e r i e s a n d F o r e s t R e s o u r c e s
C O R P O R A T E P R O F I L E
Responsible : We w i l l d i s c h a r g e o u r d u t i e s w i t h a c c o u n t a b i l i t y
Resolute : We w i l l d i s c h a r g e o u r d u t i e s w i t h d e t e r m i n a t i o n a n d b e f i r m a n d f a i r i n o u r d e c i s i o n m a k i n g .
Respectful : We w i l l b e s e n s i t i v e t o i n d i v i d u a l n e e d s a n d t h e d i v e r s i t y o f v i e w p o i n t s t h e y r e p r e s e n t
Resourceful : We w i l l b e p r a c t i c a l , c r e a t i v e , e f f e c t i v e a n d e f f i c i e n t a n d m a i n t a i n u n c o m p r o m i s i n g i n t e g r i t y i n o u r d a i l y w o r k
Reliable : We w i l l d o a n d d e l i v e r w h a t w e h a v e c o m m i t t e d a n d p r o m i s e d t o o u r c u s t o m e r s
Our Values Are:
VALUES
M I N I S T R Y O F F I S H E R I E S A N D F O R E S T S
8 2015 Annual Corporate Plan
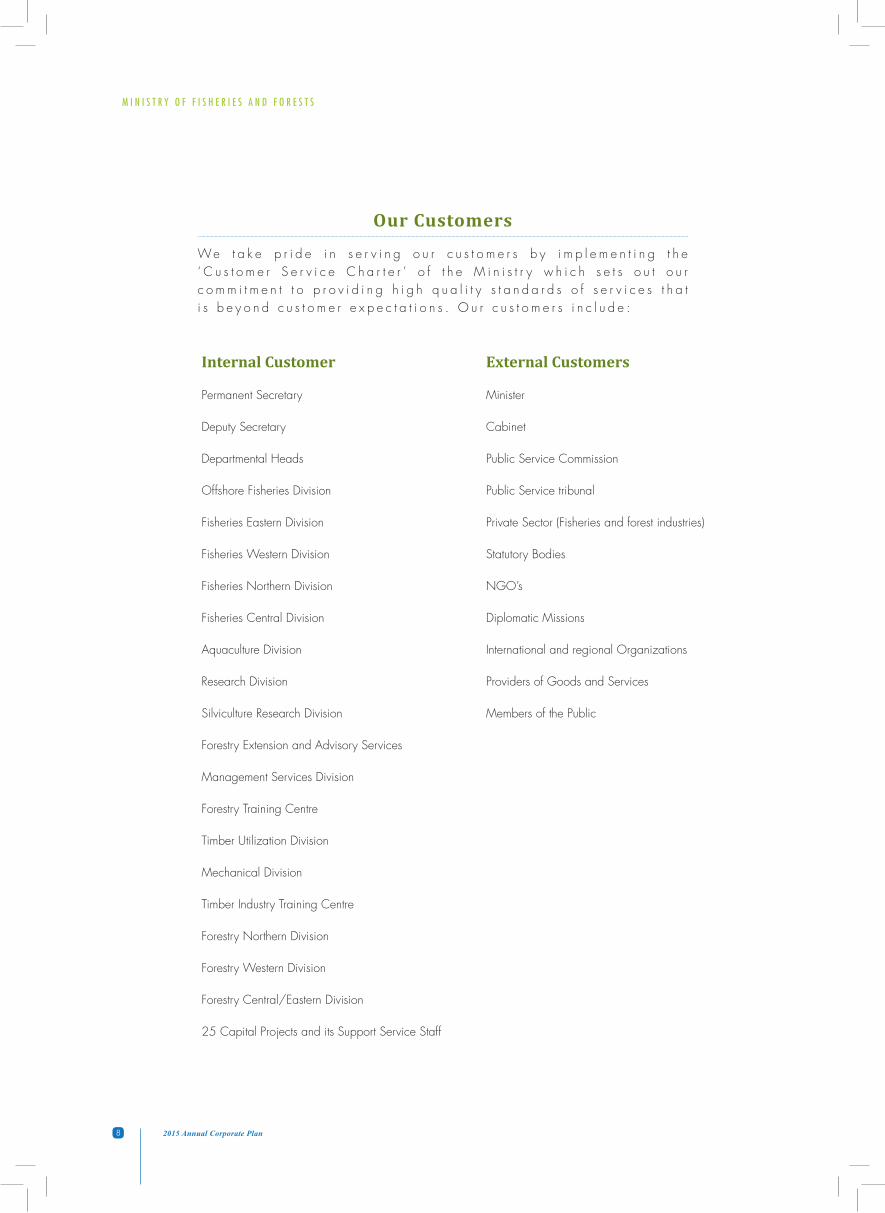
Our Customers
We t a k e p r i d e i n s e r v i n g o u r c u s t o m e r s b y i m p l e m e n t i n g t h e ‘ C u s t o m e r S e r v i c e C h a r t e r ’ o f t h e M i n i s t r y w h i c h s e t s o u t o u r c o m m i t m e n t t o p r o v i d i n g h i g h q u a l i t y s t a n d a r d s o f s e r v i c e s t h a t i s b e y o n d c u s t o m e r e x p e c t a t i o n s . O u r c u s t o m e r s i n c l u d e :
Internal Customer External Customers
Permanent Secretary Minister
Deputy Secretary Cabinet
Departmental Heads Public Service Commission
Offshore Fisheries Division Public Service tribunal
Fisheries Eastern Division Private Sector (Fisheries and forest industries)
Fisheries Western Division Statutory Bodies
Fisheries Northern Division NGO’s
Fisheries Central Division Diplomatic Missions
Aquaculture Division International and regional Organizations
Research Division Providers of Goods and Services
Silviculture Research Division Members of the Public
Forestry Extension and Advisory Services
Management Services Division
Forestry Training Centre
Timber Utilization Division
Mechanical Division
Timber Industry Training Centre
Forestry Northern Division
Forestry Western Division
Forestry Central/Eastern Division
25 Capital Projects and its Support Service Staff
M I N I S T R Y O F F I S H E R I E S A N D F O R E S T S
92015 Annual Corporate Plan
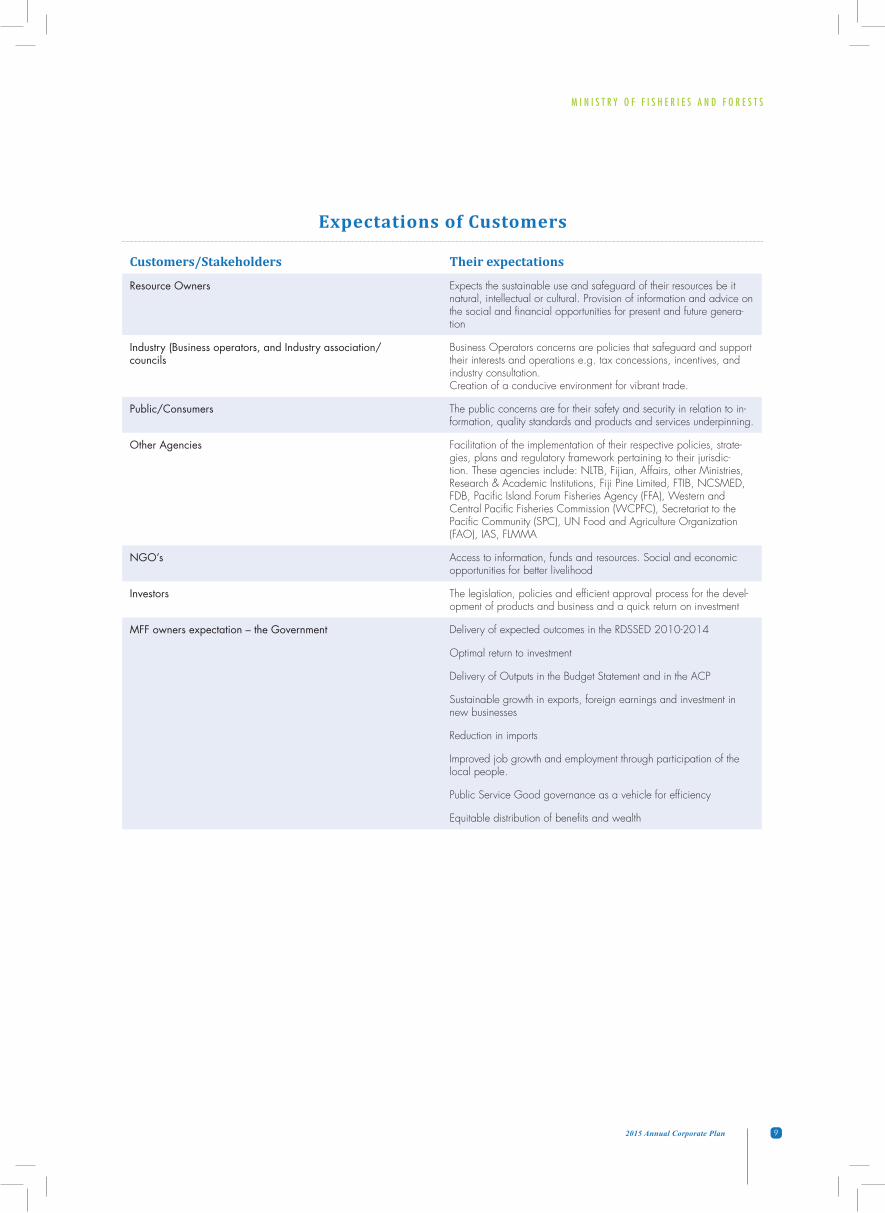
Expectations of Customers
Customers/Stakeholders Their expectations
Resource Owners Expects the sustainable use and safeguard of their resources be it natural, intellectual or cultural. Provision of information and advice on the social and financial opportunities for present and future genera-tion
Industry (Business operators, and Industry association/councils
Business Operators concerns are policies that safeguard and support their interests and operations e.g. tax concessions, incentives, and industry consultation. Creation of a conducive environment for vibrant trade.
Public/Consumers The public concerns are for their safety and security in relation to in-formation, quality standards and products and services underpinning.
Other Agencies Facilitation of the implementation of their respective policies, strate-gies, plans and regulatory framework pertaining to their jurisdic-tion. These agencies include: NLTB, Fijian, Affairs, other Ministries, Research & Academic Institutions, Fiji Pine Limited, FTIB, NCSMED, FDB, Pacific Island Forum Fisheries Agency (FFA), Western and Central Pacific Fisheries Commission (WCPFC), Secretariat to the Pacific Community (SPC), UN Food and Agriculture Organization (FAO), IAS, FLMMA
NGO’s Access to information, funds and resources. Social and economic opportunities for better livelihood
Investors The legislation, policies and efficient approval process for the devel-opment of products and business and a quick return on investment
MFF owners expectation – the Government Delivery of expected outcomes in the RDSSED 2010-2014
Optimal return to investment
Delivery of Outputs in the Budget Statement and in the ACP
Sustainable growth in exports, foreign earnings and investment in new businesses
Reduction in imports
Improved job growth and employment through participation of the local people.
Public Service Good governance as a vehicle for efficiency
Equitable distribution of benefits and wealth
M I N I S T R Y O F F I S H E R I E S A N D F O R E S T S
10 2015 Annual Corporate Plan
The Ministry of Fisheries & Forest is a service organization, each responsible for portfolio leadership and policy initiatives for the conservation and sustainable management and development of the fisheries & forest resources and the industry they support. The Departments drive this through coordination, consultation and in partnership with resource owners, business and industry, private sector, government agencies, NGO’s and international agencies.
We work in partnership with government departments, fishers, foresters and Industry partners to deliver policies and programs that improve their competitiveness, sustainability and self-reliance. Our work contributes to the well-being of rural and regional communities.
What We Do
• Formulationoffisheriesandforestpoliciesand strategies;• Coordinateandfacilitatetheimplementation of Fisheries & Forest strategies and policies (including private sector development and trade standards) in partnership with Government entities & the industry)
• Provideandadministertheregulatoryfunctionunder the respective Departments legislation, Forest Decree, Fisheries Act and part of the Marine Spaces Act)
How We Function
The Department of Fisheries & Forests executes the above functions through its Functional Divisions. There are a total of 43 stations nationwide—23 fisheries stations and 20 forestry stations.
The Department of Fisheries has 5 functional divisions namely: Tuna Management Services, Research and Development, Aquaculture, Extension & Advisory Services and Fleet and
F U N C T I O N S - C O N S T I T U T I O N A L / L E G I S L A T E D F U N C T I O N S
ROLES OF THE DEPARTMENT AND VARIOUS DIVISIONS
Technical Services. These 5 functions are divisionalized into its four (4) operation centers - Central, Eastern, Southern and Northern Division.
Six (6) Functional Divisions
1 Economic Planning, Policy, Statistics, IT and Trade
The role of the Policy and Planning Section is formulation, evaluation, assessment, monitoring and review of the statutory development plan for the fisheries sector which sets out the policy framework for handling new development proposals. The responsibilities of the Section are Policy Research and Analysis, Planning, Statistics, Trade Facilitation and Project Monitoring & Evaluation.
2 Resource Assessment and Product Development
The role of the Resource Assessment and Product Development Section is for fisheries research and development. The responsibilities of the section includes: resource assessment, product development, gear technology, aquaculture research; formulation, establishment and implementation of quality management system; fisheries certification and establishment of code of practice and product standards and the implementation of Fisheries Research Development Plan.
Immigration laws. Further to carrying out referral duties, the Border Control Unit at HQ are also required to process appeals, PI uplift and update the controversial list.
In addition to referral duties, outer station offices also vet and receipt Passport applications, Citizenship applications and long term Work Permits applications before applications are sent to HQ for processing. Other Permits that are receipted, processed and issued are extension of visitors permit applications, visa applications, exemptions permit applications, short Term Permits applications, student permit applications, Investigations, Inspections and intelligence
M I N I S T R Y O F F I S H E R I E S A N D F O R E S T S
112015 Annual Corporate Plan
work on Immigration related cases that is also carried out by these Offices. They are also required to compile and submit timely reports to HQ on a daily, monthly, quarterly, bi-annually and annual basis.
3 Offshore Fisheries Division
The role of the Offshore Fisheries Division is the administration and enforcement of the Offshore Fisheries Management Decree (2012), Offshore Fisheries Management Regulations (2014) and compliance to the convention on the Conservation and Management of Highly Migratory Fish Stocks in the Western and Central Pacific Ocean (WCPFC) and its adopted conservation and management measures relevant to Fiji. It is also responsible for the implementation of the TMDP (2014-2018) the NPOA IUU Fishing, the NPOA (Sharks – when it is endorsed), the Strategy on Fiji Fleet Operating in Areas Beyond National Jurisdictions and other offshore fisheries policies. The responsibilities of the section include: licensing, surveillance, enforcement, investigation, monitoring (observer placement both national and regional), data collection, data quality control, data analysis and data management. The Division also actively participates in the collection of biological samples whilst placed on fishing vessels that are sent to SPC in Noumea for scientific analysis
4 Fisheries Extension and Advisory Services
The role of the Extension and Advisory Service Section is the provision of technical advice and assistance to fishermen and fishing communities. The Division is responsible for the promotion of sustainable fisheries management, technology transfer, fisheries-based business development; facilitate development and implementation of community based initiatives for fisheries-based projects, provision of advisory services, training, communication and awareness; and the implementation of commodity plans and policies pertaining to the inshore and aquaculture sub sector. The section is also responsible for administration of the Fisheries Act (Cap 158) – Monitoring, Control and Surveillance on the fishery. This function is decentralized in the 4 divisions of Fisheries.
5 Aquaculture Development Services
The role of the section is the provision of technical advice and assistance to fish farming communities. The Section is also responsible for the promotion of sustainable fisheries management practice and best practices in the aquaculture subsector of Fisheries. It also facilitates the development
and implementation of training, community awareness and the implementation of Aquaculture Commodity Plans and policies. The Department of Forest has eight (7) functional divisions namely Silviculture Research Division, Management Services, Timber Utilization, Forest Parks, Extension & Advisory Services, Timber Industry Training, Forestry Training, Mechanical Division and Forest Harvesting & MCS. Details of services provided can be obtained from the Office locations. 1 Forest Management Services
Division
The role of the Management Services Division is the management of forest management information system (FMIS) and databank for planning and policy advice. Its responsibilities include resource inventory, resource assessment, administration of mapping and surveys of forest boundaries; forest functions and services; and coordination and facilitation of forest international and regional conventions and agreements. 2 Training and Education Division The role of the Training and Education Division is to manage Human Resource Development and Planning of the Forestry Sector. The Division is responsible for the provision of training, skill development and capacity building; conducting training needs assessment and maintenance of qualified and skilled workforce. 3 Forest Research Division
The Forest Research Division’s role is Silviculture research and is responsible for: quarantine and border protection and control; monitoring of the health status of forest resources, establishment of effective silvicultural (study, cultivation and management of forest trees) techniques, and research publications. 4 Timber Utilization Research &
Product Development Division
The role of TUD is commodity and product development, marketing and market research. TUD is responsible for the research and investigation of wood properties, formulation, establishment and implementation of quality management system; forest certification and establishment of code of practice and product standards; administration of timber trade and administering timber processing and inspectoral
M I N I S T R Y O F F I S H E R I E S A N D F O R E S T S
12 2015 Annual Corporate Plan
services 5 Extension and Advisory Service
Division
The role of the Extension and Advisory Service Division is the provision of technical advice and assistance to forest dependent communities and stakeholders. The Division is responsible for the promotion of sustainable forest management, technology transfer, community-based forestry and business development, facilitating development of community based initiatives for forest based projects, provision of advisory services and raising awareness.
6 Harvesting - Monitoring, Surveillance and Control Division
The role of the Harvesting -Division is to administer the Fiji Forest Harvesting Code of Practice (FFHCOP) and the harvesting provisions of the Forest Decree 1992. The Division is responsible for the monitoring, surveillance, evaluation and control of all harvesting activities and logging operations; compliance to the standard requirements of the Forest Decree 1992 and the Fiji Forest Harvesting Code of Practice (FFHCOP); and facilitating sustainable log supply system for the timber industries. This function is divisionalised into Forestry West, North and Central & Eastern.
7 Forest Parks, Recreation and Nature Reserve Division
The role of the Division is to manage all forest parks, reserves, and recreation and conservation areas. The Division is responsible for the administration of leases and compensation payments, maintenance of boundaries; communication and awareness and monitoring and evaluation of all forest parks, reserves, recreation and conservation areas.
Statutory Functions
The Statutory functions of the Ministry are stipulated in the various legislation and regulation that we administer for ensuring that our fisheries and forest resources are sustainably managed for the present and future generation. The overarching legislation for Fisheries is the Fisheries Act (Cap 158) and the Offshore Fisheries Management Decree 2013. The supportive and subsequent regulations to enforce the provisions of the Fisheries Laws are the various regulations gazetted as legal notices.
As for Forests, the overarching law is the Forest Decree 1992
which is currently under Review. The subsequent regulations
Constitutional Powers And Functions Of The Permanent Secretary
Subject to Section 127 (3), (7) and (8) of the 2013 Constitution the Permanent Secretary has the following’ functions-
(a) responsible to the Minister concerned for the efficient, effective and economical management of the ministry or any department under the Ministry;
(b) have the authority to appoint, remove and institute disciplinary action against all staff of the Commission with the agreement of the Prime Minister; and
(c) has the authority to determine all matters pertaining to the employment of all staff of the Commission, with the agreement of the Prime Minister, including:
i. terms and conditions of employment;
ii. qualification requirements for appointment and the process to be followed for appointment which must be open, transparent and competitive selection based on merit;
iii. salaries, benefits and allowances payable in accordance with its approved budget; and
iv. Total establishment or the total number of staff that are required to be appointed in accordance with the approved budget
M I N I S T R Y O F F I S H E R I E S A N D F O R E S T S
132015 Annual Corporate Plan
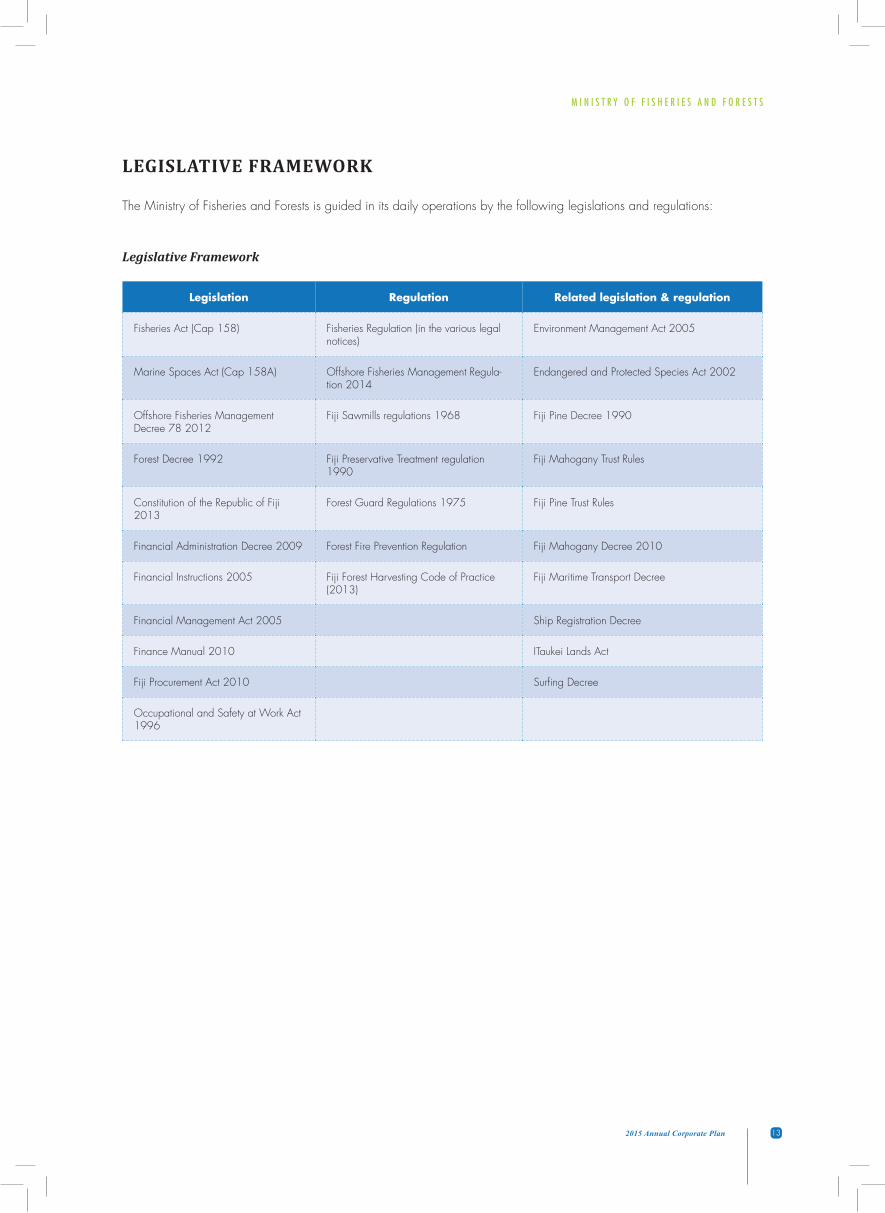
LEGISLATIVE FRAMEWORK
The Ministry of Fisheries and Forests is guided in its daily operations by the following legislations and regulations:
Legislative Framework
Legislation Regulation Related legislation & regulation
Fisheries Act (Cap 158) Fisheries Regulation (in the various legal notices)
Environment Management Act 2005
Marine Spaces Act (Cap 158A) Offshore Fisheries Management Regula-tion 2014
Endangered and Protected Species Act 2002
Offshore Fisheries Management Decree 78 2012
Fiji Sawmills regulations 1968 Fiji Pine Decree 1990
Forest Decree 1992 Fiji Preservative Treatment regulation 1990
Fiji Mahogany Trust Rules
Constitution of the Republic of Fiji 2013
Forest Guard Regulations 1975 Fiji Pine Trust Rules
Financial Administration Decree 2009 Forest Fire Prevention Regulation Fiji Mahogany Decree 2010
Financial Instructions 2005 Fiji Forest Harvesting Code of Practice (2013)
Fiji Maritime Transport Decree
Financial Management Act 2005 Ship Registration Decree
Finance Manual 2010 ITaukei Lands Act
Fiji Procurement Act 2010 Surfing Decree
Occupational and Safety at Work Act 1996
M I N I S T R Y O F F I S H E R I E S A N D F O R E S T S
14 2015 Annual Corporate Plan
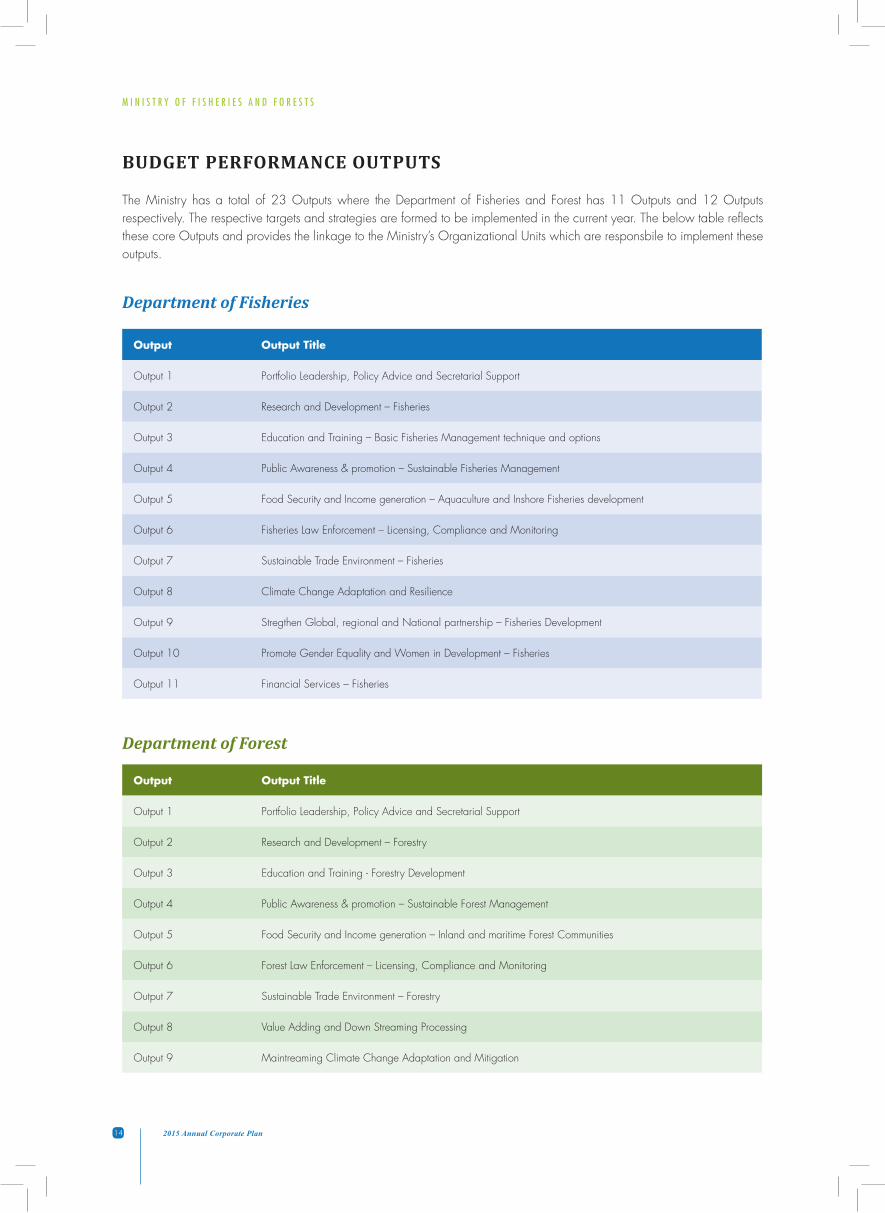
BUDGET PERFORMANCE OUTPUTS
The Ministry has a total of 23 Outputs where the Department of Fisheries and Forest has 11 Outputs and 12 Outputs respectively. The respective targets and strategies are formed to be implemented in the current year. The below table reflects these core Outputs and provides the linkage to the Ministry’s Organizational Units which are responsbile to implement these outputs.
Department of Fisheries
Output Output Title
Output 1 Portfolio Leadership, Policy Advice and Secretarial Support
Output 2 Research and Development – Fisheries
Output 3 Education and Training – Basic Fisheries Management technique and options
Output 4 Public Awareness & promotion – Sustainable Fisheries Management
Output 5 Food Security and Income generation – Aquaculture and Inshore Fisheries development
Output 6 Fisheries Law Enforcement – Licensing, Compliance and Monitoring
Output 7 Sustainable Trade Environment – Fisheries
Output 8 Climate Change Adaptation and Resilience
Output 9 Stregthen Global, regional and National partnership – Fisheries Development
Output 10 Promote Gender Equality and Women in Development – Fisheries
Output 11 Financial Services – Fisheries
Output Output Title
Output 1 Portfolio Leadership, Policy Advice and Secretarial Support
Output 2 Research and Development – Forestry
Output 3 Education and Training - Forestry Development
Output 4 Public Awareness & promotion – Sustainable Forest Management
Output 5 Food Security and Income generation – Inland and maritime Forest Communities
Output 6 Forest Law Enforcement – Licensing, Compliance and Monitoring
Output 7 Sustainable Trade Environment – Forestry
Output 8 Value Adding and Down Streaming Processing
Output 9 Maintreaming Climate Change Adaptation and Mitigation
Department of Forest
M I N I S T R Y O F F I S H E R I E S A N D F O R E S T S
152015 Annual Corporate Plan
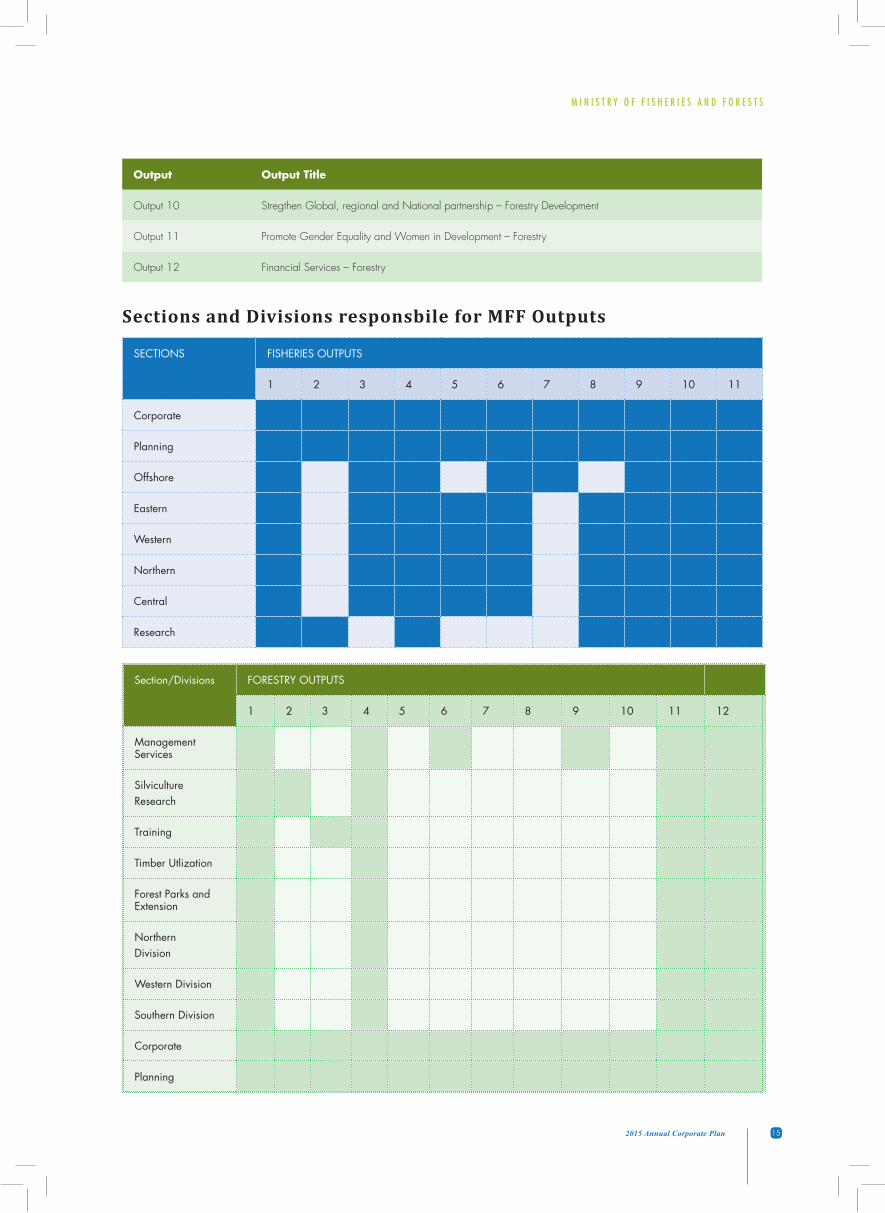
Sections and Divisions responsbile for MFF Outputs
SECTIONS FISHERIES OUTPUTS
1 2 3 4 5 6 7 8 9 10 11
Corporate
Planning
Offshore
Eastern
Western
Northern
Central
Research
Section/Divisions FORESTRY OUTPUTS
1 2 3 4 5 6 7 8 9 10 11 12
Management Services
Silviculture Research
Training
Timber Utlization
Forest Parks and Extension
Northern Division
Western Division
Southern Division
Corporate
Planning
Output Output Title
Output 10 Stregthen Global, regional and National partnership – Forestry Development
Output 11 Promote Gender Equality and Women in Development – Forestry
Output 12 Financial Services – Forestry
M I N I S T R Y O F F I S H E R I E S A N D F O R E S T S
16 2015 Annual Corporate Plan
PRIORITY OUTCOMES – LINKAGE TO NATIONAL PRIORITIES
Amongst others, the Ministry’s Annual Corporate Plan (ACP) is aligned to relevant outcomes identified in the Roadmap for Democracy and Sustainable Socio-Economic Development 2010-2014 (RDSSED), the Government of the day’s Manifesto, 2013 Constitution including the National Strategic Human Resource Plan 2011- 2015 (NSHRP). These are tabulated in the following tables
Priority Outcomes as in the RDSSED, Government of the day’s Manifesto and the 2013 Constitution
The above key focus outcomes can be further translated into the table below:
No. Description
1 The Accountability Framework - Productive and transparent, democratic and accountable institution
2 Public Sector Reform - Improved Public Sector efficiency, effectiveness and service delivery.
3 Leadership -Effective, enlightened and accountable leadership
4 Employment & The Labor Market - Fullest and most productive utilization of human resources
In aligning the above to the Government of the Day’s manifesto the following key areas apparently stood out:
1. Ensuring food security for the people of Fiji through various programs and activities that is implemented;2. Greater collaboration and networking of all key stakeholders involved with Research;3. Protection of our biodiversity through the establishment of national parks and reserves; 4. Community Empowerment through provision of appropriate training for SME’s and identifica tion of alternative livelihood schemes; 5. Streamlining of systems and processes to better service Fijians; 6. Empowerment of women to participate competitively in the market of fisheries and forest products; 7. Enhancement of Ministry staff to provide efficient and effective service delivery; 8. Reducing climate change impact; and 9. Provision of affordable housing to Fijians through our Pine Maritime Project,
M I N I S T R Y O F F I S H E R I E S A N D F O R E S T S
172015 Annual Corporate Plan
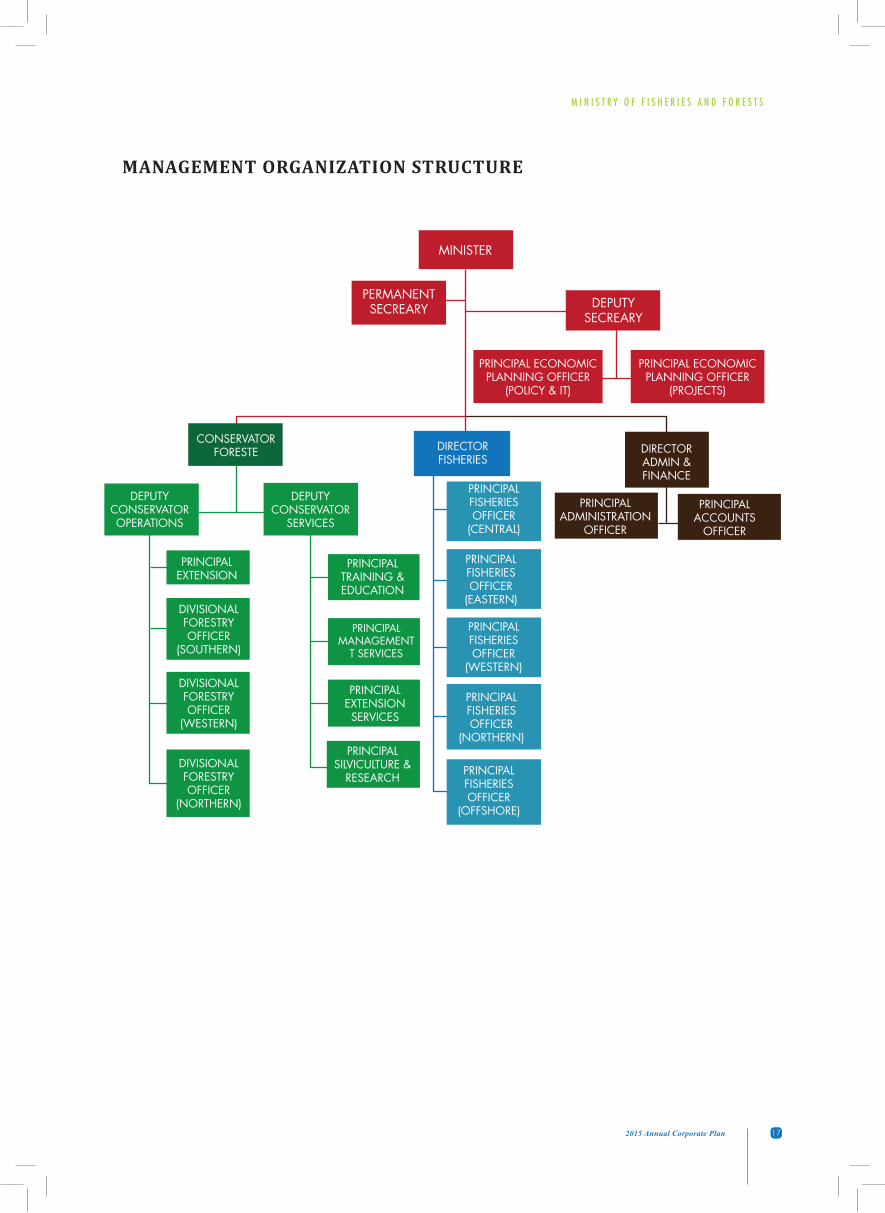
MANAGEMENT ORGANIZATION STRUCTURE
PRINCIPALADMINISTRATION
OFFICER
PRINCIPALACCOUNTS
OFFICER
DIRECTORADMIN &FINANCE
MINISTER
PERMANENTSECREARY
PRINCIPAL ECONOMICPLANNING OFFICER
(POLICY & IT)
PRINCIPAL ECONOMICPLANNING OFFICER
(PROJECTS)
DEPUTYSECREARY
CONSERVATORFORESTE
DEPUTYCONSERVATOROPERATIONS
DEPUTYCONSERVATOR
SERVICES
PRINCIPALEXTENSION
PRINCIPALTRAINING &EDUCATION
PRINCIPALMANAGEMENT
T SERVICES
DIVISIONALFORESTRYOFFICER
(SOUTHERN)
DIVISIONALFORESTRYOFFICER
(WESTERN)
DIVISIONALFORESTRYOFFICER
(NORTHERN)
PRINCIPALEXTENSIONSERVICES
PRINCIPALSILVICULTURE &
RESEARCH
PRINCIPALFISHERIESOFFICER
(CENTRAL)
PRINCIPALFISHERIESOFFICER
(EASTERN)
PRINCIPALFISHERIESOFFICER
(OFFSHORE)
PRINCIPALFISHERIESOFFICER
(NORTHERN)
PRINCIPALFISHERIESOFFICER
(WESTERN)
DIRECTORFISHERIES

M I N I S T R Y O F F I S H E R I E S A N D F O R E S T S
18 2015 Annual Corporate Plan
PLANS AND PLANNING PROCESS
The most important planning documents that are currently in existence are the Annual Corporate Plan, Departmental Business Plans, Divisional Unit Plans and IWP’s that guide and set the directions for the Ministry’s activities during the year.
The plans and planning process have taken into account the needs of our stakeholders, customers and the people of Fiji, Government of Fiji’s President’s Mandate, the Roadmap for Democracy and Sustainable Socio-Economic Development 2010-2014,), the Government of the day’s Manifesto, 2013 Constitution, National Strategic Human Resource Plan 2011-2015, Ministries of Finance and Strategic Planning & National Development and PSC Corporate Planning Requirements.
Over the years the Planning Process for the Ministry has improved and is more inclusive. Extensive Consultation with staff at divisional level was encouraged over the years to ensure ownership and ease of implementation. We have tested all approaches such as Top down, Bottom up Approach and Integrated Approach to development plans and have noted that an integrated approach of all the approaches identified is the best one to be adopted to ensure implementation and ownership of the plans from the implementers – the staff.
M I N I S T R Y O F F I S H E R I E S A N D F O R E S T S
192015 Annual Corporate Plan
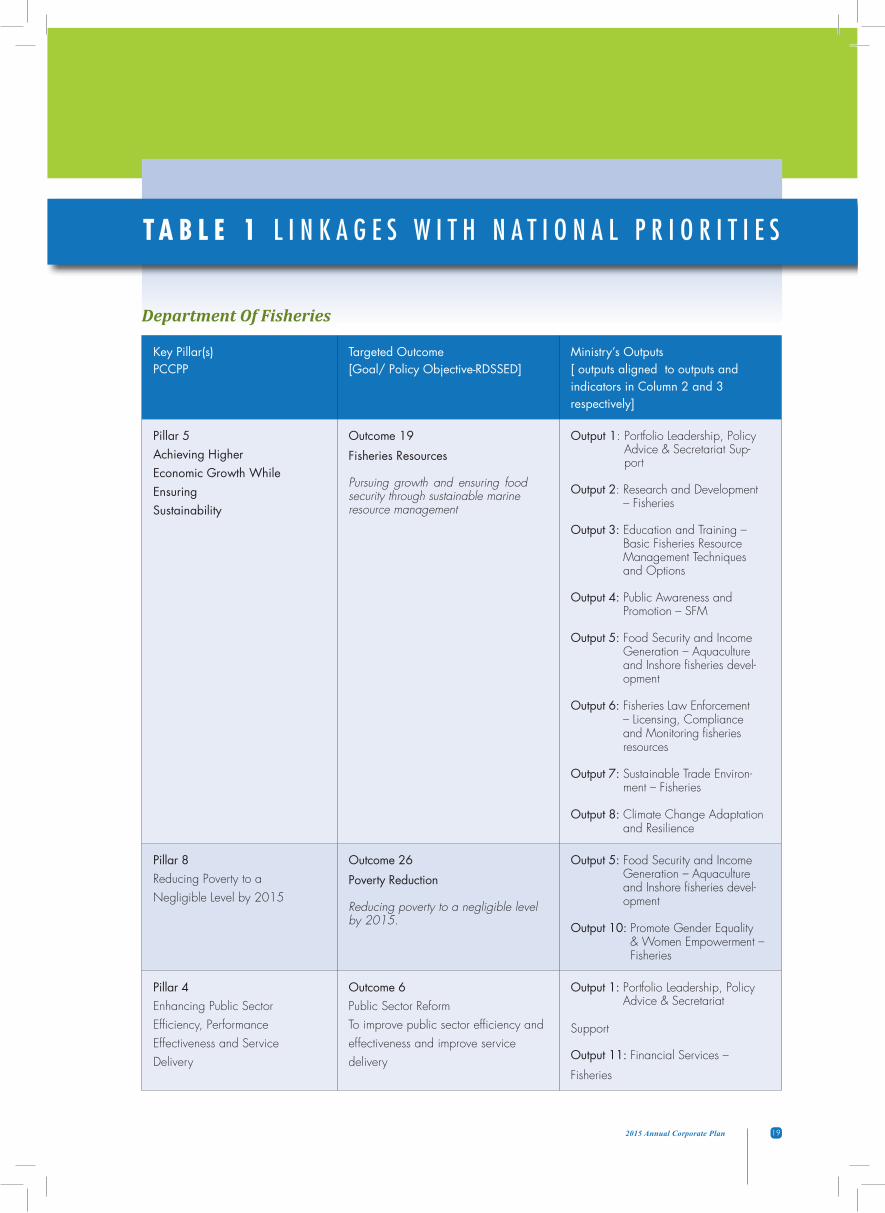
Department Of Fisheries
T A B L E 1 L I N K A G E S W I T H N A T I O N A L P R I O R I T I E S
Key Pillar(s)PCCPP
Targeted Outcome[Goal/ Policy Objective-RDSSED]
Ministry’s Outputs[ outputs aligned to outputs and indicators in Column 2 and 3 respectively]
Pillar 5 Achieving HigherEconomic Growth WhileEnsuringSustainability
Outcome 19Fisheries Resources
Pursuing growth and ensuring food security through sustainable marine resource management
Output 1: Portfolio Leadership, Policy Advice & Secretariat Sup-port
Output 2: Research and Development – Fisheries
Output 3: Education and Training – Basic Fisheries Resource Management Techniques and Options
Output 4: Public Awareness and Promotion – SFM
Output 5: Food Security and Income Generation – Aquaculture and Inshore fisheries devel-opment
Output 6: Fisheries Law Enforcement – Licensing, Compliance and Monitoring fisheries resources
Output 7: Sustainable Trade Environ-ment – Fisheries
Output 8: Climate Change Adaptation and Resilience
Pillar 8Reducing Poverty to aNegligible Level by 2015
Outcome 26Poverty Reduction
Reducing poverty to a negligible level by 2015.
Output 5: Food Security and Income Generation – Aquaculture and Inshore fisheries devel-opment
Output 10: Promote Gender Equality & Women Empowerment – Fisheries
Pillar 4Enhancing Public SectorEfficiency, PerformanceEffectiveness and ServiceDelivery
Outcome 6Public Sector ReformTo improve public sector efficiency andeffectiveness and improve servicedelivery
Output 1: Portfolio Leadership, Policy Advice & Secretariat
Support
Output 11: Financial Services –
Fisheries
M I N I S T R Y O F F I S H E R I E S A N D F O R E S T S
20 2015 Annual Corporate Plan
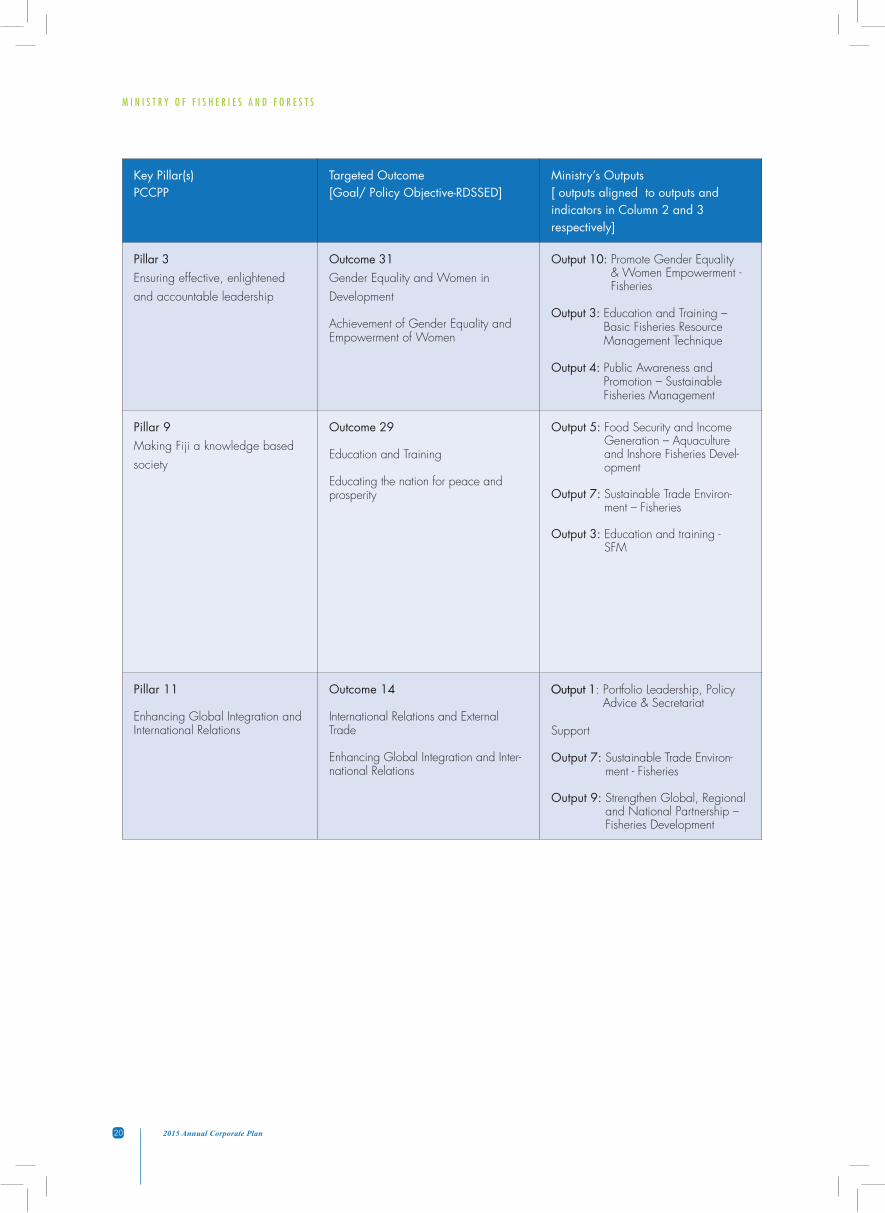
Key Pillar(s)PCCPP
Targeted Outcome[Goal/ Policy Objective-RDSSED]
Ministry’s Outputs[ outputs aligned to outputs and indicators in Column 2 and 3 respectively]
Pillar 3Ensuring effective, enlightened and accountable leadership
Outcome 31Gender Equality and Women in Development
Achievement of Gender Equality and Empowerment of Women
Output 10: Promote Gender Equality & Women Empowerment - Fisheries
Output 3: Education and Training – Basic Fisheries Resource Management Technique
Output 4: Public Awareness and Promotion – Sustainable Fisheries Management
Pillar 9Making Fiji a knowledge based society
Outcome 29
Education and Training
Educating the nation for peace and prosperity
Output 5: Food Security and Income Generation – Aquaculture and Inshore Fisheries Devel-opment
Output 7: Sustainable Trade Environ-ment – Fisheries
Output 3: Education and training - SFM
Pillar 11
Enhancing Global Integration and International Relations
Outcome 14
International Relations and External Trade
Enhancing Global Integration and Inter-national Relations
Output 1: Portfolio Leadership, Policy Advice & Secretariat
Support
Output 7: Sustainable Trade Environ-ment - Fisheries
Output 9: Strengthen Global, Regional and National Partnership – Fisheries Development

M I N I S T R Y O F F I S H E R I E S A N D F O R E S T S
212015 Annual Corporate Plan
Key Pillar(s)PCCPP
Targeted Outcome[Goal/ Policy Objective-RDSSED]
Ministry’s Outputs[ outputs aligned to outputs and indicators in Column 2 and 3 respectively]
Pillar 5Achieving Higher EconomicGrowth While EnsuringSustainability
Outcome 18.Forestry Resources Sustainable development and management of forest resources.
Output 1: Portfolio Leadership, Policy Advice and Secretarial SupportOutput 2: Research & Development – Forestry Output 3: Education & Training – Forestry DevelopmentOutput 4: Public Awareness & Promotion-SFMOutput 5: Food Security & Income GenerationOutput 6: Forest Law Enforcement Output 7: Sustainable Trade Environment – Forestry Output 8: Value Adding & Down streaming processingOutput 9: Strengthen Global, Regional and national partnership – ForestryOutput10: Strengthen Global Partnership for Development
Pillar 8Reducing Poverty to aNegligible Level by 2015
Outcome 26Poverty ReductionReducing poverty to a negligible level by2015.
Output 2: Research & Development – Forestry Output 3: Education & Training – Forestry DevelopmentOutput 4: Public Awareness & Promotion – SFM Output 5: Food Security & Income Generation Output 8: Value Adding & Down streaming process Output 9: Strengthen Global, regional and National Partnership - Forestry DevelopmentOutput 10: Strengthen Global Partnership for DevelopmentOutput 12: Financial Services
Pillar 4Enhancing Public SectorEfficiency, PerformanceEffectiveness and ServiceDelivery
Outcome 6Public Sector ReformTo improve public sector efficiency andeffectiveness and improve service delivery
Output 1: Portfolio Leadership, Policy Advice & Secretariat SupportOutput 9: Strengthen Global, Regional and National Partnership – Fisheries Development
Pillar 3Ensuring effective, enlightened and accountable leadership
Outcome 31Gender Equality and Women in DevelopmentAchievement of Gender Equality and Empowerment of Women
Output 11: Promote Gender Equality & Women Empowerment - FisheriesOutput 3: Education and Training – Basic Fisheries Resource Management TechniqueOutput 4: Public Awareness and Promotion – Sustainable Fisheries Management
Pillar 9Making Fiji a knowledge based society
Outcome 29 Education and TrainingEducating the nation for peace and prosperity
Output 3: Education & Training – Forestry DevelopmentOutput 4: Public Awareness & Promotion-SFMOutput 8: Value Adding & Down streaming processing
Pillar 11Enhancing Global Integration and International Relations
Outcome 14International Relations and External TradeEnhancing Global Inte-gration and International Relations
Output 1: Portfolio Leadership, Policy Advice and Secretarial SupportOutput 4: Public Awareness & Promotion-SFMOutput 6: Forest Law EnforcementOutput 7: Sustainable Trade Environment – ForestryOutput 10: Strengthen Global Partnership for Development
Department Of Forests
M I N I S T R Y O F F I S H E R I E S A N D F O R E S T S
22 2015 Annual Corporate Plan
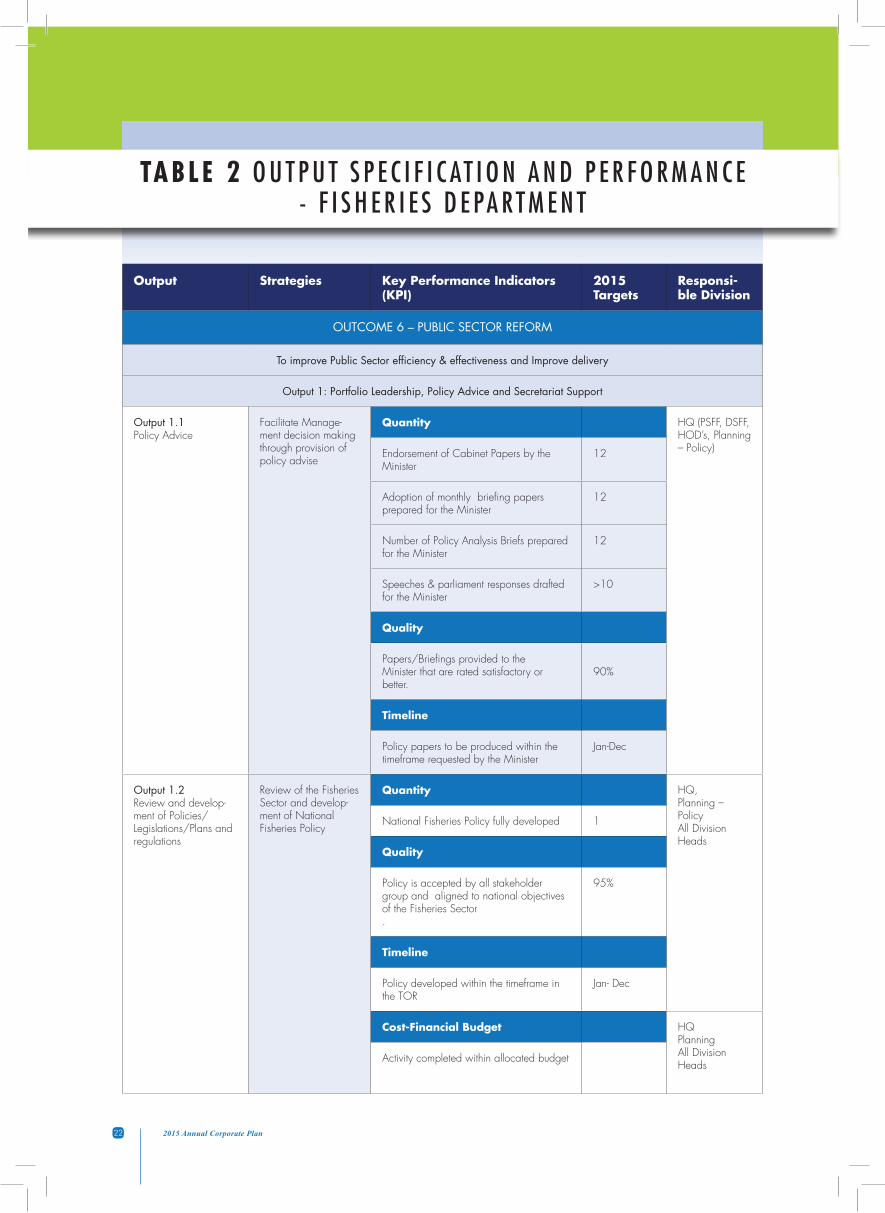
TABLE 2 O U T P U T S P E C I F I C AT I O N A N D P E R F O R M A N C E - F I S H E R I E S D E PA RT M E N T
Output Strategies Key Performance Indicators (KPI)
2015Targets
Responsi-ble Division
OUTCOME 6 – PUBLIC SECTOR REFORM
To improve Public Sector efficiency & effectiveness and Improve delivery
Output 1: Portfolio Leadership, Policy Advice and Secretariat Support
Output 1.1 Policy Advice
Facilitate Manage-ment decision making through provision of policy advise
Quantity HQ (PSFF, DSFF, HOD’s, Planning – Policy) Endorsement of Cabinet Papers by the
Minister12
Adoption of monthly briefing papers prepared for the Minister
12
Number of Policy Analysis Briefs prepared for the Minister
12
Speeches & parliament responses drafted for the Minister
>10
Quality
Papers/Briefings provided to theMinister that are rated satisfactory or better.
90%
Timeline
Policy papers to be produced within the timeframe requested by the Minister
Jan-Dec
Output 1.2Review and develop-ment of Policies/Legislations/Plans and regulations
Review of the Fisheries Sector and develop-ment of National Fisheries Policy
Quantity HQ, Planning – Policy All Division Heads
National Fisheries Policy fully developed 1
Quality
Policy is accepted by all stakeholder group and aligned to national objectives of the Fisheries Sector .
95%
Timeline
Policy developed within the timeframe in the TOR
Jan- Dec
Cost-Financial Budget HQ Planning All Division Heads
Activity completed within allocated budget
M I N I S T R Y O F F I S H E R I E S A N D F O R E S T S
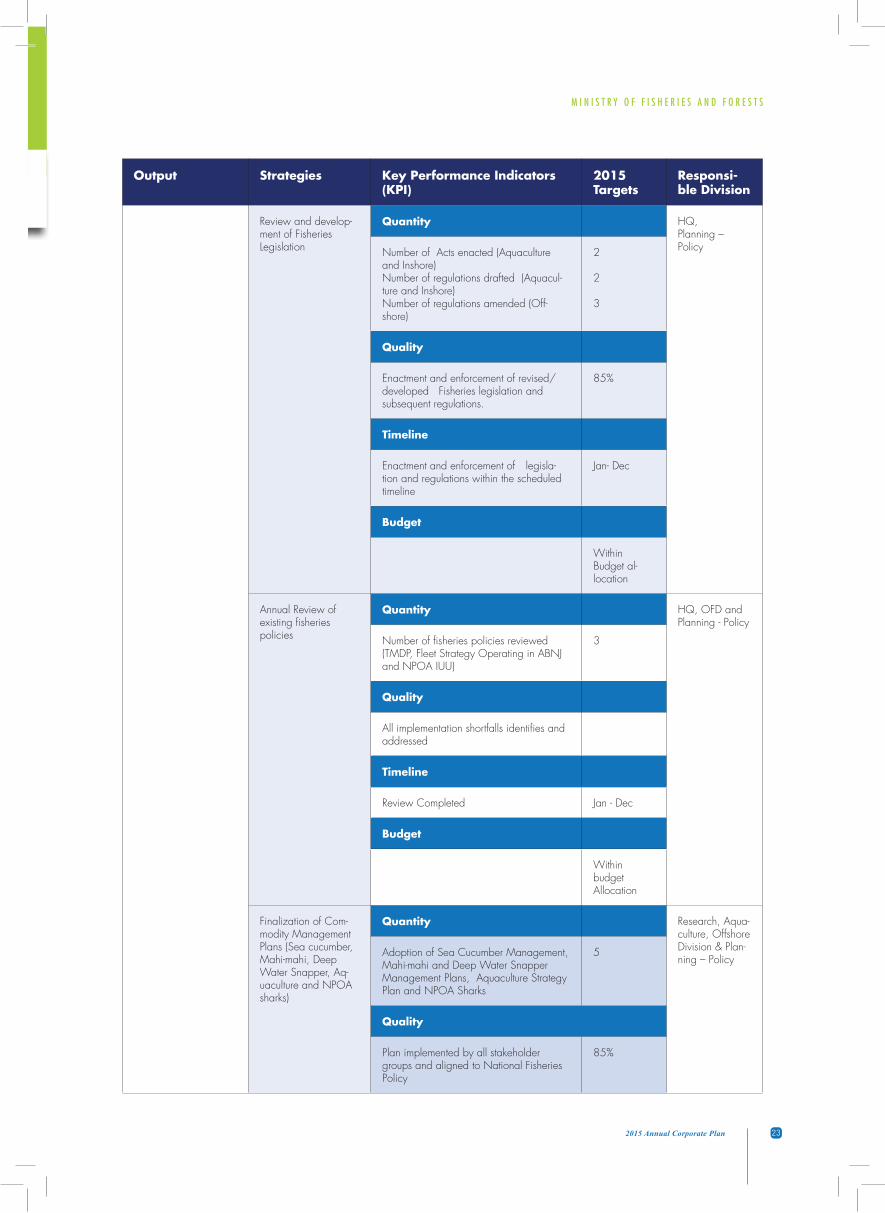
232015 Annual Corporate Plan
Output Strategies Key Performance Indicators (KPI)
2015Targets
Responsi-ble Division
Review and develop-ment of Fisheries Legislation
Quantity HQ, Planning – Policy Number of Acts enacted (Aquaculture
and Inshore) Number of regulations drafted (Aquacul-ture and Inshore)Number of regulations amended (Off-shore)
2
2
3
Quality
Enactment and enforcement of revised/developed Fisheries legislation and subsequent regulations.
85%
Timeline
Enactment and enforcement of legisla-tion and regulations within the scheduled timeline
Jan- Dec
Budget
Within Budget al-location
Annual Review of existing fisheries policies
Quantity HQ, OFD and Planning - Policy
Number of fisheries policies reviewed (TMDP, Fleet Strategy Operating in ABNJ and NPOA IUU)
3
Quality
All implementation shortfalls identifies and addressed
Timeline
Review Completed Jan - Dec
Budget
Within budget Allocation
Finalization of Com-modity Management Plans (Sea cucumber, Mahi-mahi, Deep Water Snapper, Aq-uaculture and NPOA sharks)
Quantity Research, Aqua-culture, Offshore Division & Plan-ning – Policy
Adoption of Sea Cucumber Management, Mahi-mahi and Deep Water Snapper Management Plans, Aquaculture Strategy Plan and NPOA Sharks
5
Quality
Plan implemented by all stakeholder groups and aligned to National Fisheries Policy
85%
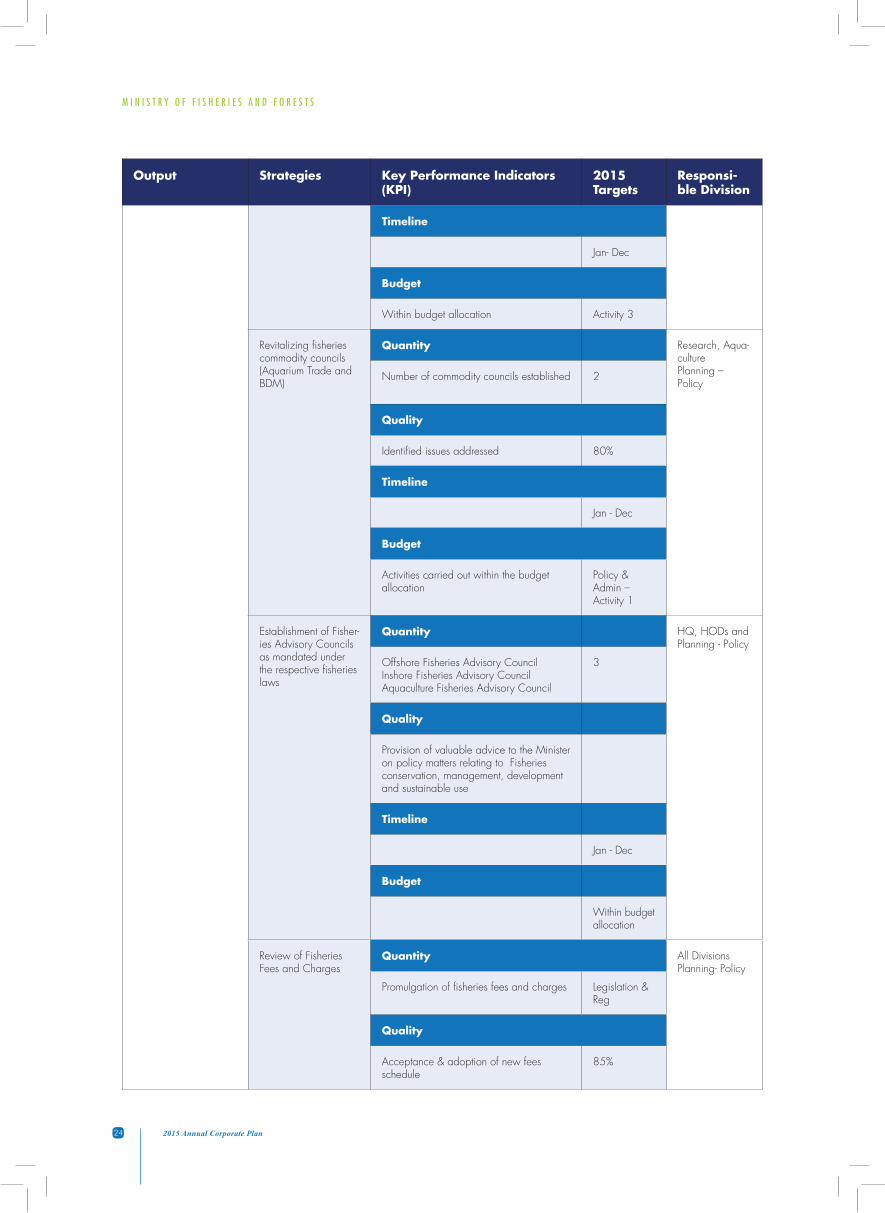
M I N I S T R Y O F F I S H E R I E S A N D F O R E S T S
24 2015 Annual Corporate Plan
Output Strategies Key Performance Indicators (KPI)
2015Targets
Responsi-ble Division
Timeline
Jan- Dec
Budget
Within budget allocation Activity 3
Revitalizing fisheries commodity councils(Aquarium Trade and BDM)
Quantity Research, Aqua-culture Planning – Policy
Number of commodity councils established 2
Quality
Identified issues addressed 80%
Timeline
Jan - Dec
Budget
Activities carried out within the budget allocation
Policy & Admin – Activity 1
Establishment of Fisher-ies Advisory Councils as mandated under the respective fisheries laws
Quantity HQ, HODs and Planning - Policy
Offshore Fisheries Advisory CouncilInshore Fisheries Advisory CouncilAquaculture Fisheries Advisory Council
3
Quality
Provision of valuable advice to the Minister on policy matters relating to Fisheries conservation, management, development and sustainable use
Timeline
Jan - Dec
Budget
Within budget allocation
Review of Fisheries Fees and Charges
Quantity All Divisions Planning- Policy
Promulgation of fisheries fees and charges Legislation & Reg
Quality
Acceptance & adoption of new fees schedule
85%
M I N I S T R Y O F F I S H E R I E S A N D F O R E S T S
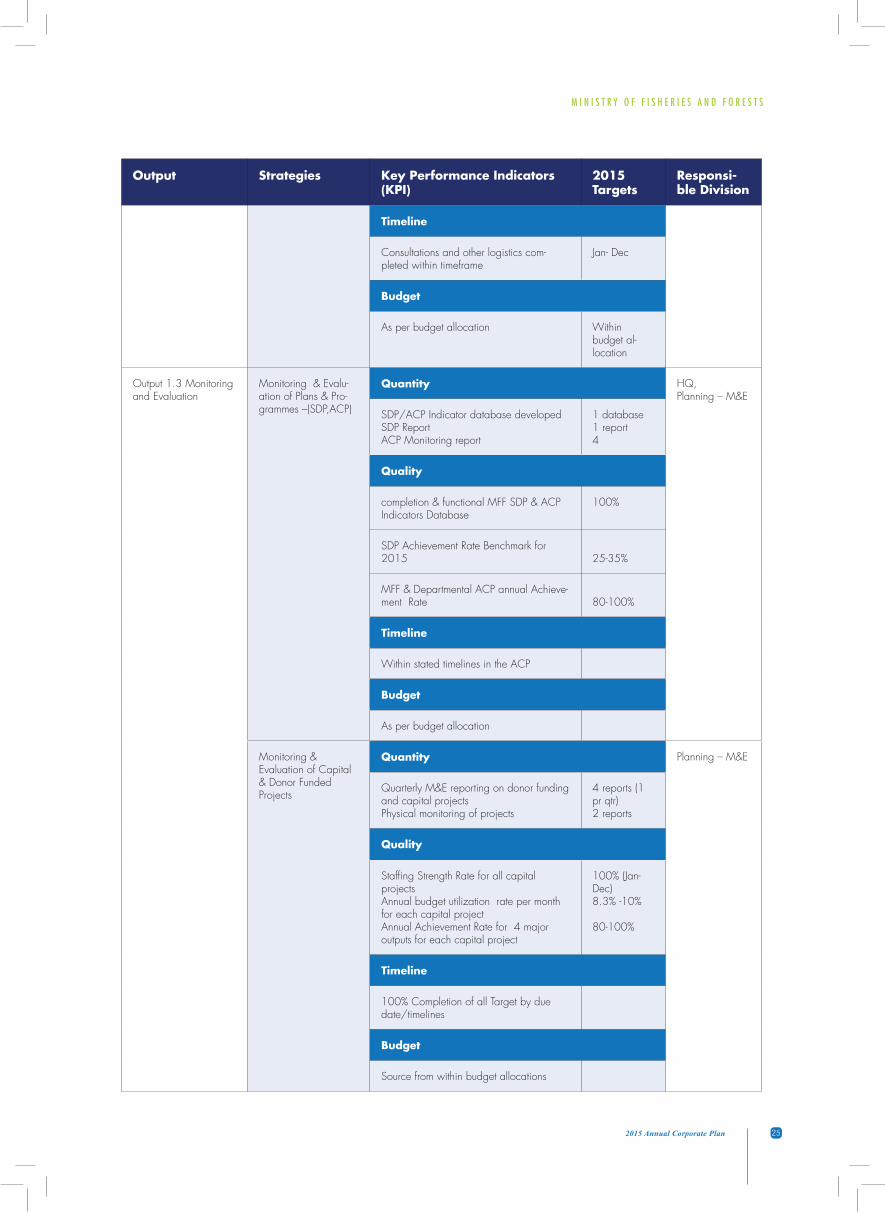
252015 Annual Corporate Plan
Output Strategies Key Performance Indicators (KPI)
2015Targets
Responsi-ble Division
Timeline
Consultations and other logistics com-pleted within timeframe
Jan- Dec
Budget
As per budget allocation Within budget al-location
Output 1.3 Monitoring and Evaluation
Monitoring & Evalu-ation of Plans & Pro-grammes –(SDP,ACP)
Quantity HQ, Planning – M&E
SDP/ACP Indicator database developedSDP Report ACP Monitoring report
1 database 1 report 4
Quality
completion & functional MFF SDP & ACP Indicators Database
100%
SDP Achievement Rate Benchmark for 2015 25-35%
MFF & Departmental ACP annual Achieve-ment Rate 80-100%
Timeline
Within stated timelines in the ACP
Budget
As per budget allocation
Monitoring & Evaluation of Capital & Donor Funded Projects
Quantity Planning – M&E
Quarterly M&E reporting on donor funding and capital projects Physical monitoring of projects
4 reports (1 pr qtr)2 reports
Quality
Staffing Strength Rate for all capital projects Annual budget utilization rate per month for each capital projectAnnual Achievement Rate for 4 major outputs for each capital project
100% (Jan- Dec)8.3% -10%
80-100%
Timeline
100% Completion of all Target by due date/timelines
Budget
Source from within budget allocations
M I N I S T R Y O F F I S H E R I E S A N D F O R E S T S
26 2015 Annual Corporate Plan
Output Strategies Key Performance Indicators (KPI)
2015Targets
Responsi-ble Division
Compliance to Strategic Planning Framework - Public Sector Investment Programme
Quantity HQ, Planning – M&E All Division Heads
PSIP Consolidated submission for 2016 1
Quality
Change ( Increase decrease) in MFF capi-tal projects budget allocation per annum and over 3 yearsMFF Capital Projects proposals graded as AMFF Capital Project proposals allocated funding in annual govt budget
10-20%
90-100%
90-100%
Timeline
100% Completion of all Target by due date/timelines
Budget
Source from within budget allocations
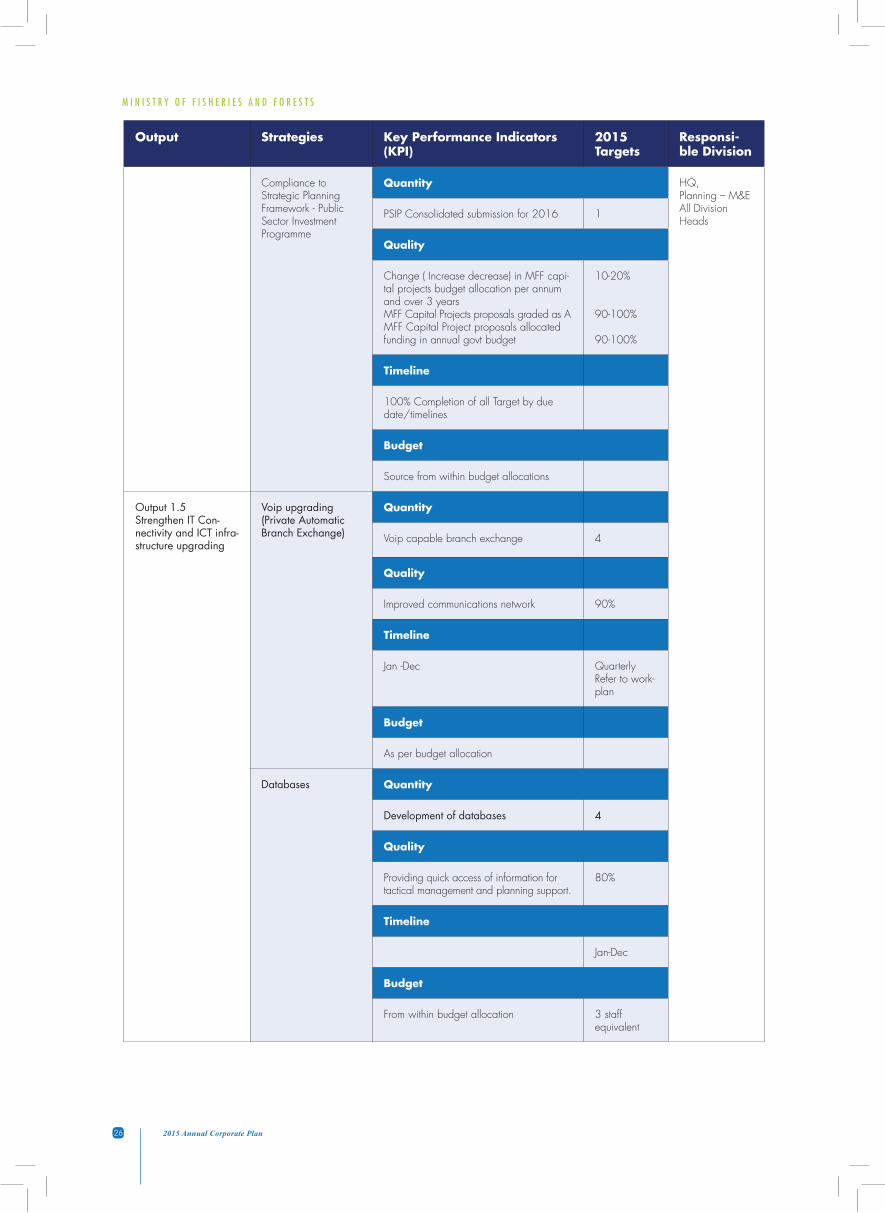
Output 1.5 Strengthen IT Con-nectivity and ICT infra-structure upgrading
Voip upgrading (Private Automatic Branch Exchange)
Quantity
Voip capable branch exchange 4
Quality
Improved communications network 90%
Timeline
Jan -Dec Quarterly Refer to work-plan
Budget
As per budget allocation
Databases Quantity
Development of databases 4
Quality
Providing quick access of information for tactical management and planning support.
80%
Timeline
Jan-Dec
Budget
From within budget allocation 3 staff equivalent

M I N I S T R Y O F F I S H E R I E S A N D F O R E S T S
272015 Annual Corporate Plan
Output Strategies Key Performance Indicators (KPI)
2015Targets
Responsi-ble Division
Websites Quantity PLANNING-IT AND DIVISION-AL HEADSPLANNING-IT AND DIVISION-AL HEADS
Development of new and Refurbishment of existing sites
3
Quality
Accessibility of information through the web
Budget
From within budget allocation
Timeline
First Quarter
Radio telephone systems
Quantity
Forestry 1 Division, Fisheries 4 Divisions 5
Quality
For operational communication and safety on land and sea
Budget
From allocated budget
Timeline
Jan - Sep Jan – Sep (80%)
Structured Cabling Quantity
4
Quality
Improved network connectivity from 4 locations
80%
Budget
As allocated
Timeline
Jan - Dec Jan - Dec
M I N I S T R Y O F F I S H E R I E S A N D F O R E S T S
28 2015 Annual Corporate Plan
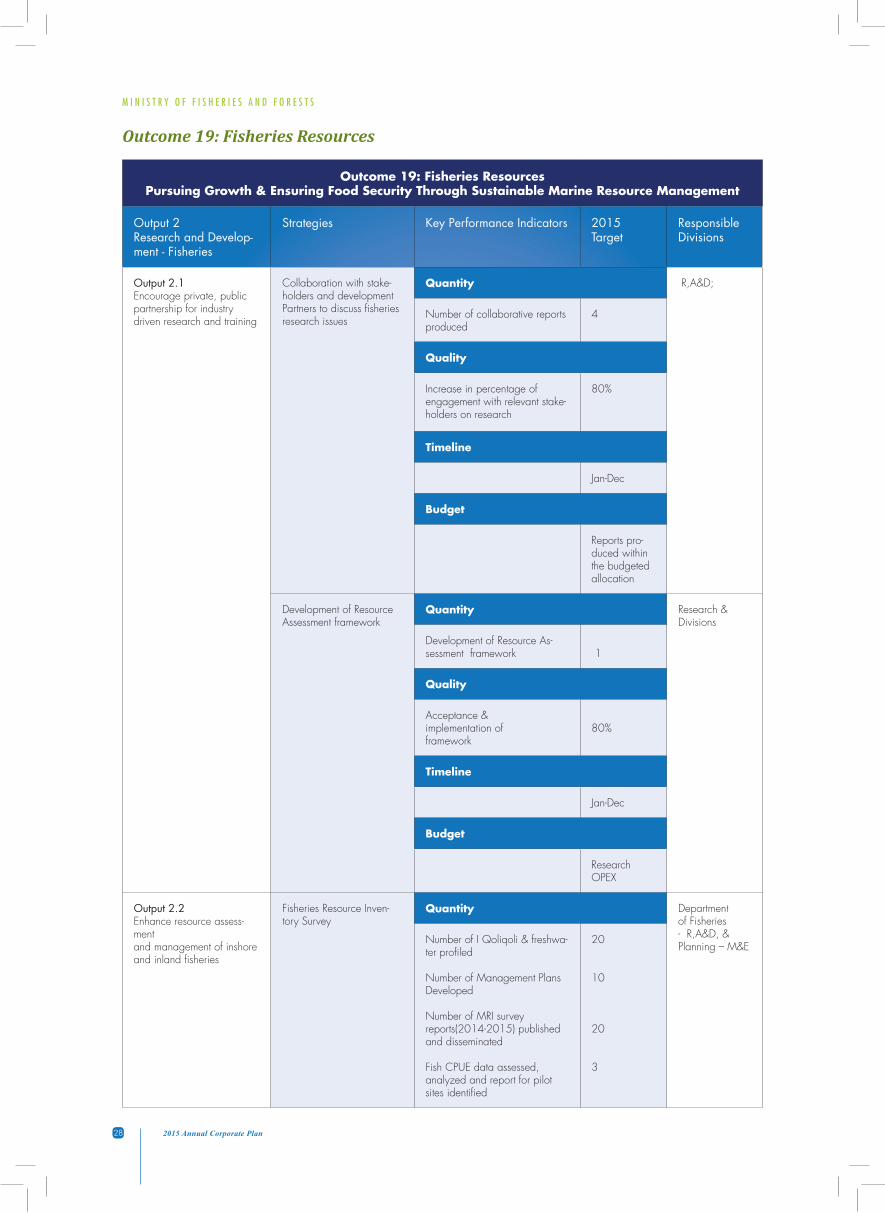
Outcome 19: Fisheries ResourcesPursuing Growth & Ensuring Food Security Through Sustainable Marine Resource Management
Output 2Research and Develop-ment - Fisheries
Strategies Key Performance Indicators 2015 Target
Responsible Divisions
Output 2.1Encourage private, public partnership for industry driven research and training
Collaboration with stake-holders and development Partners to discuss fisheries research issues
Quantity R,A&D;
Number of collaborative reports produced
4
Quality
Increase in percentage of engagement with relevant stake-holders on research
80%
Timeline
Jan-Dec
Budget
Reports pro-duced within the budgeted allocation
Development of Resource Assessment framework
Quantity Research & Divisions
Development of Resource As-sessment framework 1
Quality
Acceptance & implementation of framework
80%
Timeline
Jan-Dec
Budget
Research OPEX
Output 2.2Enhance resource assess-mentand management of inshore and inland fisheries
Fisheries Resource Inven-tory Survey
Quantity Department of Fisheries - R,A&D, &Planning – M&E
Number of I Qoliqoli & freshwa-ter profiled
Number of Management PlansDeveloped
Number of MRI survey reports(2014-2015) published and disseminated
Fish CPUE data assessed, analyzed and report for pilot sites identified
20
10
20
3
Outcome 19: Fisheries Resources
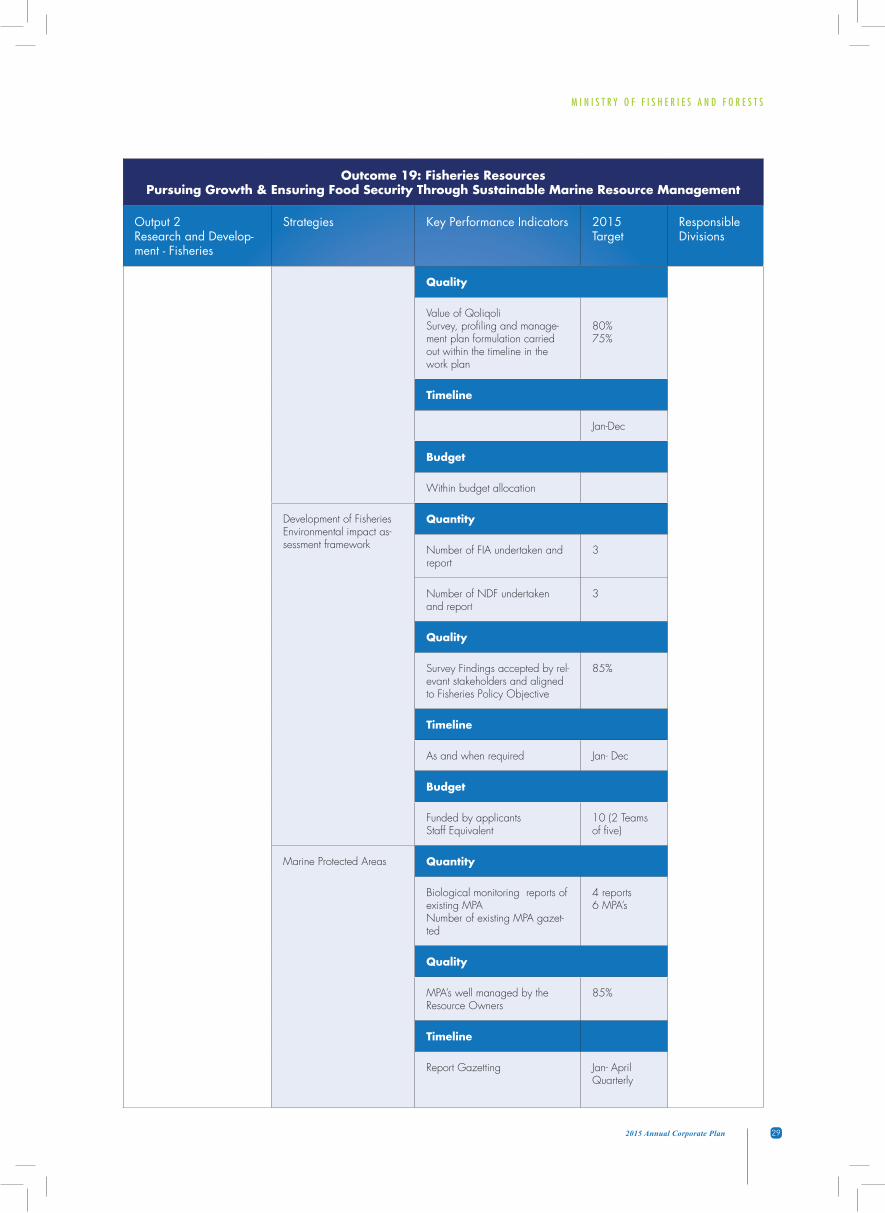
M I N I S T R Y O F F I S H E R I E S A N D F O R E S T S
292015 Annual Corporate Plan
Outcome 19: Fisheries ResourcesPursuing Growth & Ensuring Food Security Through Sustainable Marine Resource Management
Output 2Research and Develop-ment - Fisheries
Strategies Key Performance Indicators 2015 Target
Responsible Divisions
Quality
Value of QoliqoliSurvey, profiling and manage-ment plan formulation carried out within the timeline in the work plan
80%75%
Timeline
Jan-Dec
Budget
Within budget allocation
Development of Fisheries Environmental impact as-sessment framework
Quantity
Number of FIA undertaken and report
3
Number of NDF undertaken and report
3
Quality
Survey Findings accepted by rel-evant stakeholders and aligned to Fisheries Policy Objective
85%
Timeline
As and when required Jan- Dec
Budget
Funded by applicants Staff Equivalent
10 (2 Teams of five)
Marine Protected Areas Quantity
Biological monitoring reports of existing MPA Number of existing MPA gazet-ted
4 reports6 MPA’s
Quality
MPA’s well managed by the Resource Owners
85%
Timeline
Report Gazetting Jan- April Quarterly
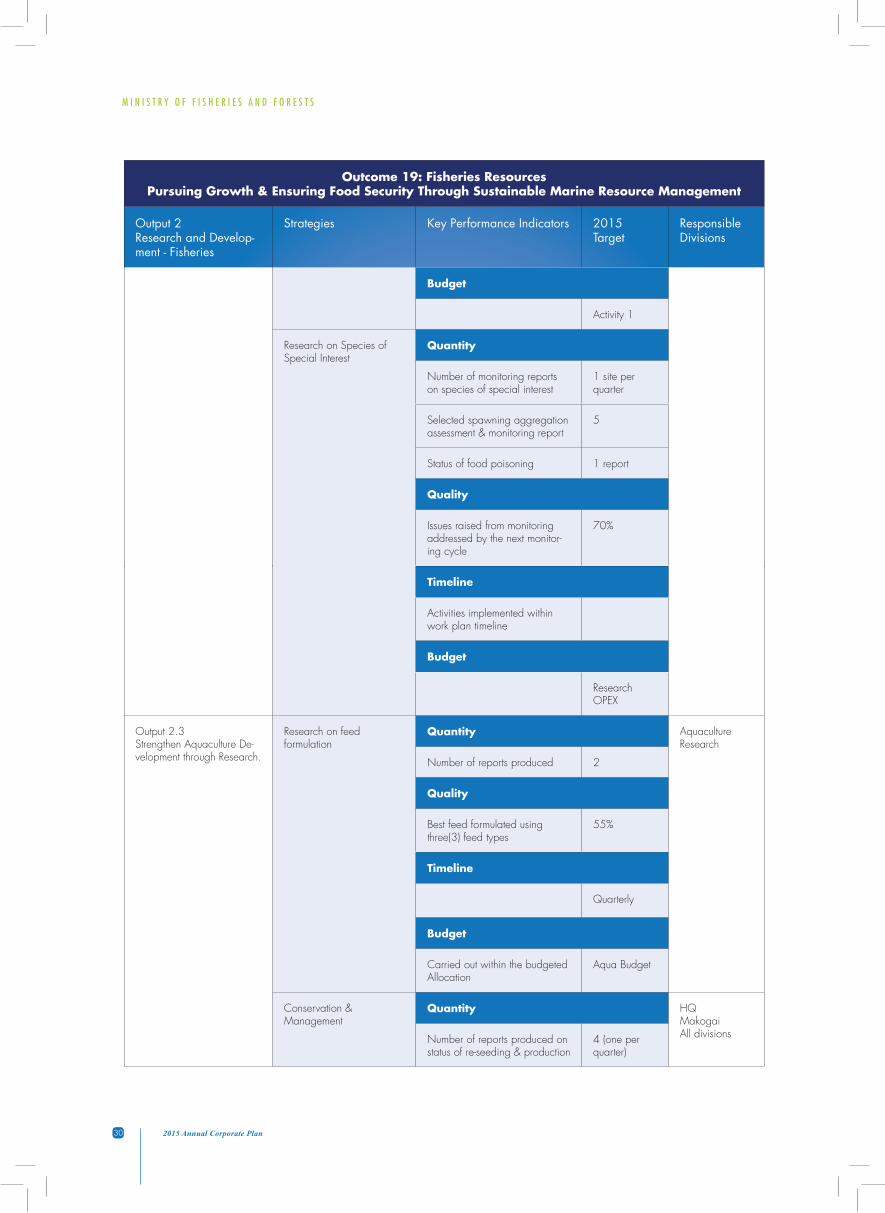
M I N I S T R Y O F F I S H E R I E S A N D F O R E S T S
30 2015 Annual Corporate Plan
Outcome 19: Fisheries ResourcesPursuing Growth & Ensuring Food Security Through Sustainable Marine Resource Management
Output 2Research and Develop-ment - Fisheries
Strategies Key Performance Indicators 2015 Target
Responsible Divisions
Budget
Activity 1
Research on Species of Special Interest
Quantity
Number of monitoring reports on species of special interest
1 site per quarter
Selected spawning aggregation assessment & monitoring report
5
Status of food poisoning 1 report
Quality
Issues raised from monitoring addressed by the next monitor-ing cycle
70%
Timeline
Activities implemented within work plan timeline
Budget
Research OPEX
Output 2.3Strengthen Aquaculture De-velopment through Research.
Research on feed formulation
Quantity Aquaculture Research
Number of reports produced 2
Quality
Best feed formulated using three(3) feed types
55%
Timeline
Quarterly
Budget
Carried out within the budgetedAllocation
Aqua Budget
Conservation & Management
Quantity HQ MakogaiAll divisions Number of reports produced on
status of re-seeding & production4 (one per quarter)
M I N I S T R Y O F F I S H E R I E S A N D F O R E S T S
312015 Annual Corporate Plan
Outcome 19: Fisheries ResourcesPursuing Growth & Ensuring Food Security Through Sustainable Marine Resource Management
Output 2Research and Develop-ment - Fisheries
Strategies Key Performance Indicators 2015 Target
Responsible Divisions
Quality
Rate of increase in survival rate at the respective re-seeded sites
20%
Timeline
(research) (report) Feb- JulyAugust
Budget
Donor funded Co funded
Output 2.4Build Capacity at communitylevel to manage its resources, including inshore fisheries and coral reef management
Expand seed production at MakogaiMariculture Station
Quantity Makogai
Divisions Report of existing MPA’s re-seeded and report
20
Reports on MPA reseeded 4
Quality
Rate of increase in production volume at seed bank
20%
Timeline
Jan-Dec
Budget
Within the budget allocation $200,000
Develop MOUs with poten-tial re-seeding communities
Quantity Makogai. M&E
Number of MOUs developed, vetted and signed
8
Quality
Gradual increase in number of communities interested in re-seeding
90%
Timeline
Jan-Mar First quarter
Budget
Within budget allocation Aquaculture budget
M I N I S T R Y O F F I S H E R I E S A N D F O R E S T S
32 2015 Annual Corporate Plan
Outcome 19: Fisheries ResourcesPursuing Growth & Ensuring Food Security Through Sustainable Marine Resource Management
Output 2Research and Develop-ment - Fisheries
Strategies Key Performance Indicators 2015 Target
Responsible Divisions
Establish a standardized monitoring mechanism for effectively monitoring re-seeding activities
Quantity Makogai M&E
Monitoring mechanism estab-lished & adopted
1
Quality
Monitoring mechanism devel-oped, endorsed and adopted
90%
Timeline
Jan – June
Budget
Aquaculture budget
Empower the community to manage and monitor their fisheries resources
Quantity
Number of Community based awareness undertaken
8
Quality
Underlying principles of Com-munity Based Approach to Management accepted for adoption
90%
Timeline
Jan-Dec
Budget
Within the allocated budget Within the allocated budget
M I N I S T R Y O F F I S H E R I E S A N D F O R E S T S
332015 Annual Corporate Plan
Outcome 19: Fisheries ResourcesPursuing Growth & Ensuring Food Security Through Sustainable Marine Resource Management
Output 3Education and Training – Basic Fisheries Man-agement Techniques & Options
Strategies Key Performance Indicators 2015 Target
Responsible Divisions
Output 3.1:Ensure standardized & qual-ity awareness and training programs for empowering communities, for the sustain-able fisheries management
Review and develop fisher-ies training module
Quantity Department ofFisheries- All Divisions & Planning
Report on the review of all exist-ing fisheries training module produced
2
Value-adding and Downstream processing awareness report
4 (1per divi-sion)
Quality
Drastic reduction in illegal activities (poaching, under-sized fishing, unlicensed fishermen)
90%
Timeline
Jan-Dec
Budget
Activities carried out within the budget allocation
$50,000 Activity 2 Fisheries
Accreditation of all train-ers of fisheries training programs
Quantity All Divisions & Planning
Number of trainers trained and certified
4
Quality
Increase in the credibility of fisheries training programs due to the accreditation of trainers
90%
Timeline
Jan-Dec
Budget
Activities carried out within the budget allocation
Within the allocated budget
Capacity building for tech-nical staff on basic fisheries training
Quantity All Divisions/Corporate ServiceTrained technical staff as
percentage of total divisional workforce
30%
M I N I S T R Y O F F I S H E R I E S A N D F O R E S T S
34 2015 Annual Corporate Plan
Outcome 19: Fisheries ResourcesPursuing Growth & Ensuring Food Security Through Sustainable Marine Resource Management
Output 3Education and Training – Basic Fisheries Man-agement Techniques & Options
Strategies Key Performance Indicators 2015 Target
Responsible Divisions
Development of staff training module
1
Development of staff technical training policy
1
Quality
Increase service delivery to customers
90%
Increase in customer satisfaction 20%
Timeline
As per timeline in training plan Jan- Dec
Budget
Within Budget allocation Activity Train-ing vote Co funded
Capacity building for offshore staffs
Quantity Offshore Division
Training categories to be undertaken:1.National Observer training2.Investigation3.Surveillance4.Data Management5.E-monitoring6.Observer Trainee trainer certification7.MCS foundation course8.International Fisheries Nego-tiation9.International Fisheries Law short courses10.Observer Debriefer trainings
10 training Max of 30 staffs trained
Report on training undertaken by staff
4 (1 per quarter)
Quality
Staff trained well equipped to execute fisheries programs and activities
80%

M I N I S T R Y O F F I S H E R I E S A N D F O R E S T S
352015 Annual Corporate Plan
Outcome 19: Fisheries ResourcesPursuing Growth & Ensuring Food Security Through Sustainable Marine Resource Management
Output 3Education and Training – Basic Fisheries Man-agement Techniques & Options
Strategies Key Performance Indicators 2015 Target
Responsible Divisions
Timeline
Jan- Dec
Budget
From within budget al-location and external funds from SPC and FFA
Outcome 19: Fisheries ResourcesPursuing Growth & Ensuring Food Security Through Sustainable Marine Resource Management
Output 4Public Awareness and Promotions – Sustainable Fisheries Management
Strategies Key Performance Indicators
2015 Target
Responsible Divisions
Output 4.1Promotion on Sustainable Fisher-ies Management
Participation In National,Government Awareness Programs(new International Events)
Quantity Department of Fisheries- All Divisions & Planning
Report on national expo-sitions and exhibitions participated
As per request
Reports on Awareness pro-grams participated
16 (4 per divi-sion)
Quality
Increase in general aware-ness through participation & demarcation of events
95%95%
Timeline
Jan-Dec
Budget
Activities carried out within the budgeted allocation
M I N I S T R Y O F F I S H E R I E S A N D F O R E S T S
36 2015 Annual Corporate Plan
Outcome 19: Fisheries ResourcesPursuing Growth & Ensuring Food Security Through Sustainable Marine Resource Management
Output 4Public Awareness and Promotions – Sustainable Fisheries Management
Strategies Key Performance Indicators
2015 Target
Responsible Divisions
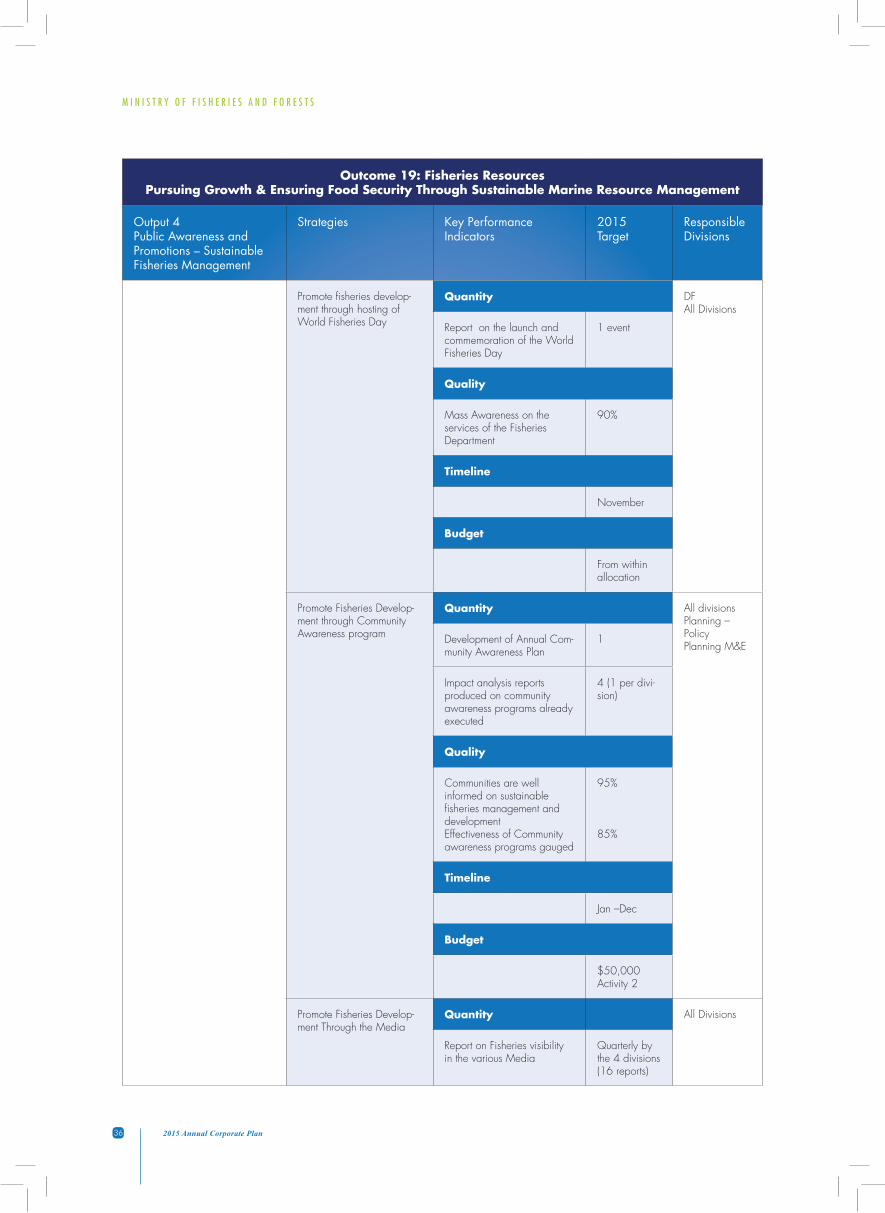
Promote fisheries develop-ment through hosting of World Fisheries Day
Quantity DF All Divisions
Report on the launch and commemoration of the World Fisheries Day
1 event
Quality
Mass Awareness on the services of the Fisheries Department
90%
Timeline
November
Budget
From within allocation
Promote Fisheries Develop-ment through Community Awareness program
Quantity All divisions Planning – Policy Planning M&E
Development of Annual Com-munity Awareness Plan
1
Impact analysis reports produced on community awareness programs already executed
4 (1 per divi-sion)
Quality
Communities are well informed on sustainable fisheries management and developmentEffectiveness of Community awareness programs gauged
95%
85%
Timeline
Jan –Dec
Budget
$50,000Activity 2
Promote Fisheries Develop-ment Through the Media
Quantity All Divisions
Report on Fisheries visibility in the various Media
Quarterly by the 4 divisions (16 reports)
M I N I S T R Y O F F I S H E R I E S A N D F O R E S T S
372015 Annual Corporate Plan
Outcome 19: Fisheries ResourcesPursuing Growth & Ensuring Food Security Through Sustainable Marine Resource Management
Output 4Public Awareness and Promotions – Sustainable Fisheries Management
Strategies Key Performance Indicators
2015 Target
Responsible Divisions
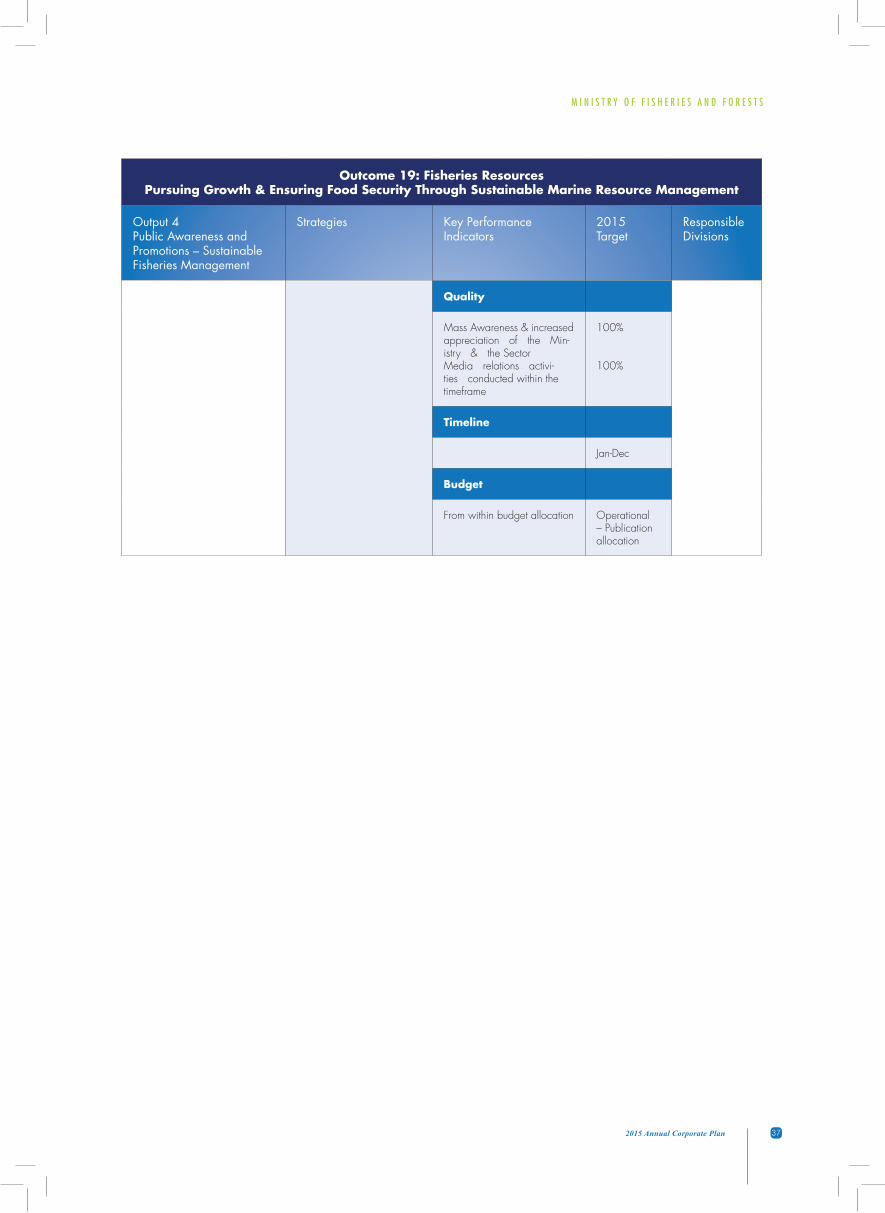
Quality
Mass Awareness & increasedappreciation of the Min-istry & the Sector Media relations activi-ties conducted within the timeframe
100%
100%
Timeline
Jan-Dec
Budget
From within budget allocation Operational – Publication allocation
M I N I S T R Y O F F I S H E R I E S A N D F O R E S T S
38 2015 Annual Corporate Plan
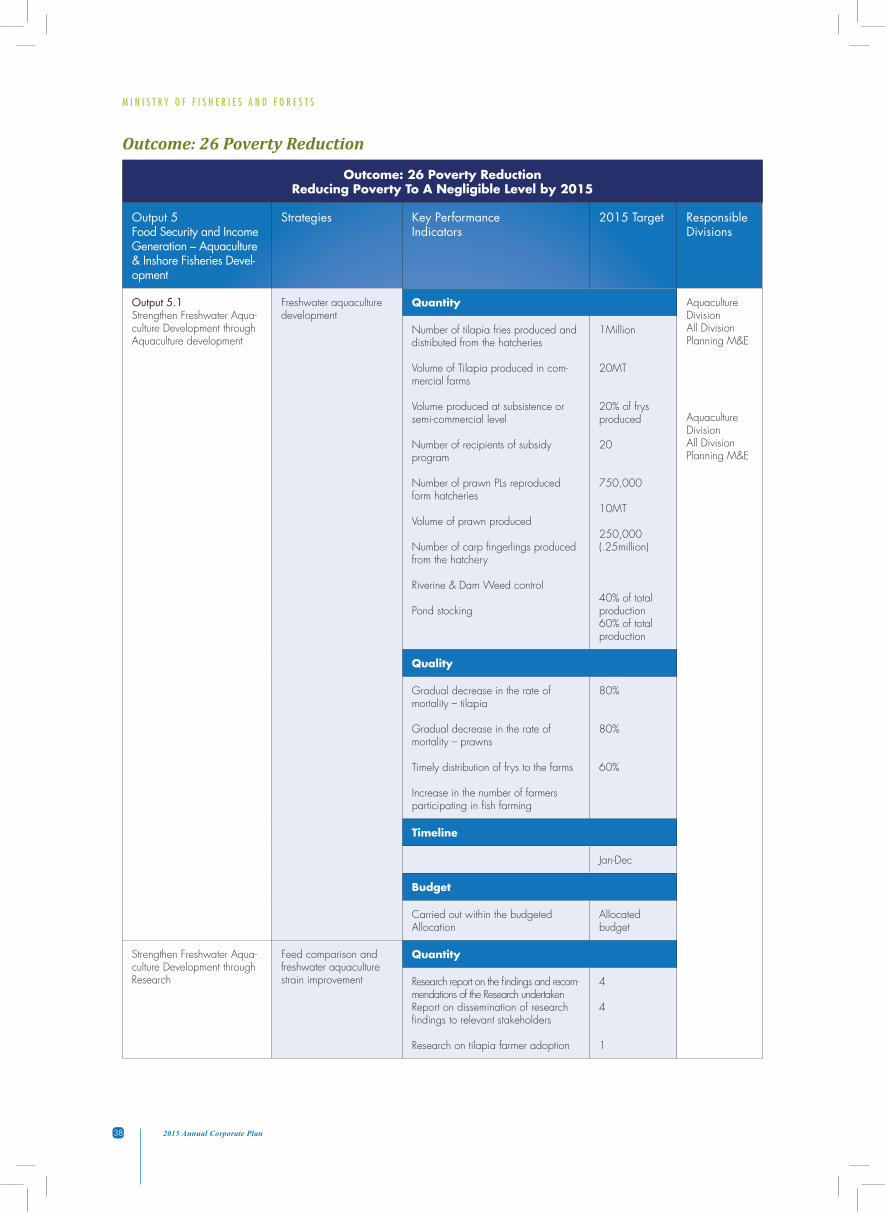
Outcome: 26 Poverty ReductionReducing Poverty To A Negligible Level by 2015
Output 5Food Security and Income Generation – Aquaculture & Inshore Fisheries Devel-opment
Strategies Key Performance Indicators
2015 Target Responsible Divisions
Output 5.1Strengthen Freshwater Aqua-culture Development through Aquaculture development
Freshwater aquaculture development
Quantity Aquaculture Division All Division Planning M&E
Aquaculture Division All Division Planning M&E
Number of tilapia fries produced and distributed from the hatcheries
Volume of Tilapia produced in com-mercial farms
Volume produced at subsistence or semi-commercial level
Number of recipients of subsidy program
Number of prawn PLs reproduced form hatcheries
Volume of prawn produced
Number of carp fingerlings produced from the hatchery
Riverine & Dam Weed control
Pond stocking
1Million
20MT
20% of frys produced
20
750,000
10MT
250,000 (.25million)
40% of total production 60% of total production
Quality
Gradual decrease in the rate of mortality – tilapia
Gradual decrease in the rate of mortality – prawns Timely distribution of frys to the farms
Increase in the number of farmers participating in fish farming
80%
80%
60%
Timeline
Jan-Dec
Budget
Carried out within the budgeted Allocation
Allocated budget
Strengthen Freshwater Aqua-culture Development through Research
Feed comparison and freshwater aquaculture strain improvement
Quantity
Research report on the findings and recom-mendations of the Research undertaken Report on dissemination of research findings to relevant stakeholders
Research on tilapia farmer adoption
4
4
1
Outcome: 26 Poverty Reduction

M I N I S T R Y O F F I S H E R I E S A N D F O R E S T S
392015 Annual Corporate Plan
Outcome: 26 Poverty ReductionReducing Poverty To A Negligible Level by 2015
Output 5Food Security and Income Generation – Aquaculture & Inshore Fisheries Devel-opment
Strategies Key Performance Indicators
2015 Target Responsible Divisions
Quality
Report formulated as per consultation and trials carried out Greater awareness on feed
Report on research produced on time
80%
80%
80%
Timeline
Jan-Dec
Budget
Carry out within the budget allocation
Quantity
Number of shrimp PLs reproduced from hatcheries Volume of shrimp produced from farmsNumber of sandfish juveniles pro-duced
500,000
8 MT
10,000
Quality
Low mortality rate of PLsPLs distributed to farmers across the countryBrackish water PL’s produced and dis-tributed within the specified timeframe in the work plan
60%80%
80%
Timeline
Jan-Dec
Budget
Carried out with the allocated budget $250,000
Output 5.3Strengthen Pearl Development through Spat Collection
Community based spat collection farms
Quantity Pearl Oyster Research& DevelopmentProjectPlanning M&E
Number of community based spat farms established Number of pearl monitoring reportNumber of Market Research & Devel-opment report
2 sites
42
M I N I S T R Y O F F I S H E R I E S A N D F O R E S T S
40 2015 Annual Corporate Plan
Outcome: 26 Poverty ReductionReducing Poverty To A Negligible Level by 2015
Output 5Food Security and Income Generation – Aquaculture & Inshore Fisheries Devel-opment
Strategies Key Performance Indicators
2015 Target Responsible Divisions
Quality
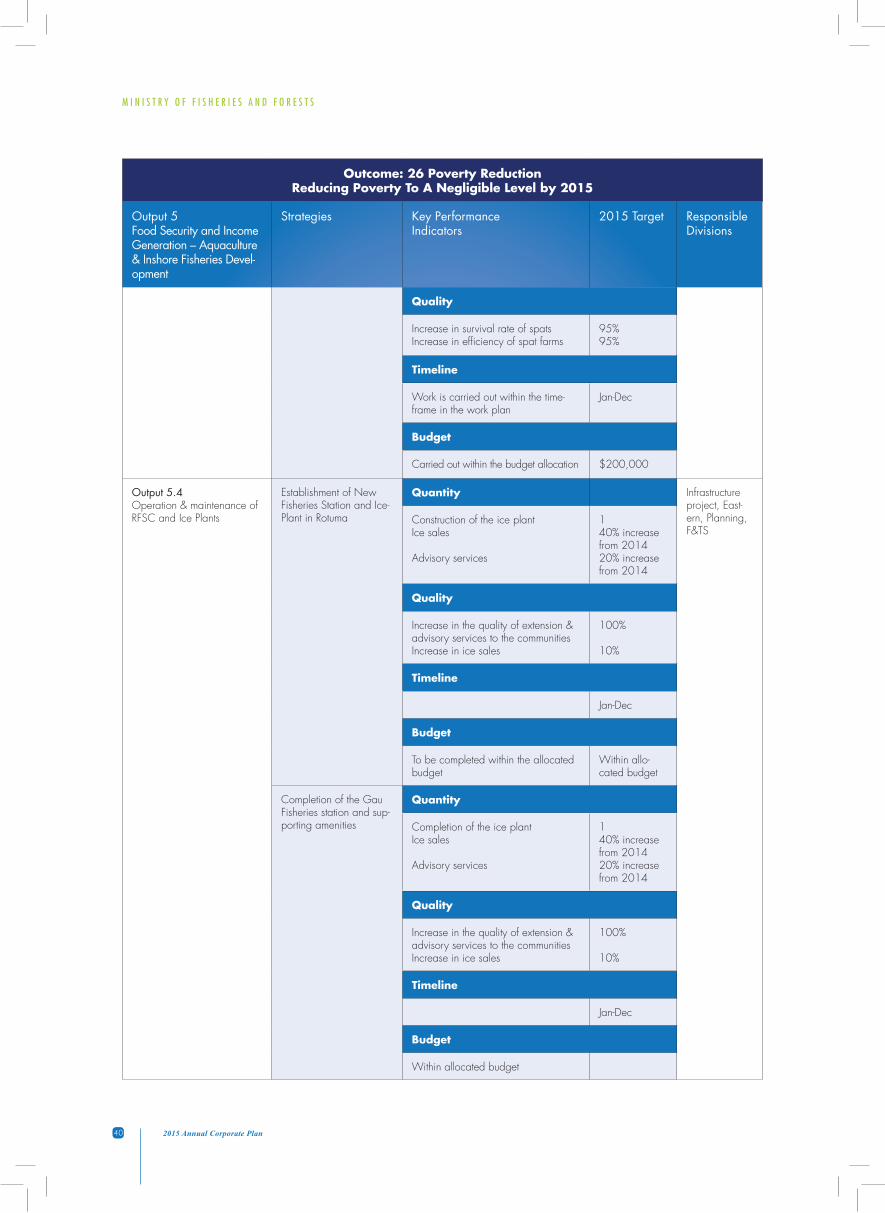
Increase in survival rate of spats Increase in efficiency of spat farms
95%95%
Timeline
Work is carried out within the time-frame in the work plan
Jan-Dec
Budget
Carried out within the budget allocation $200,000
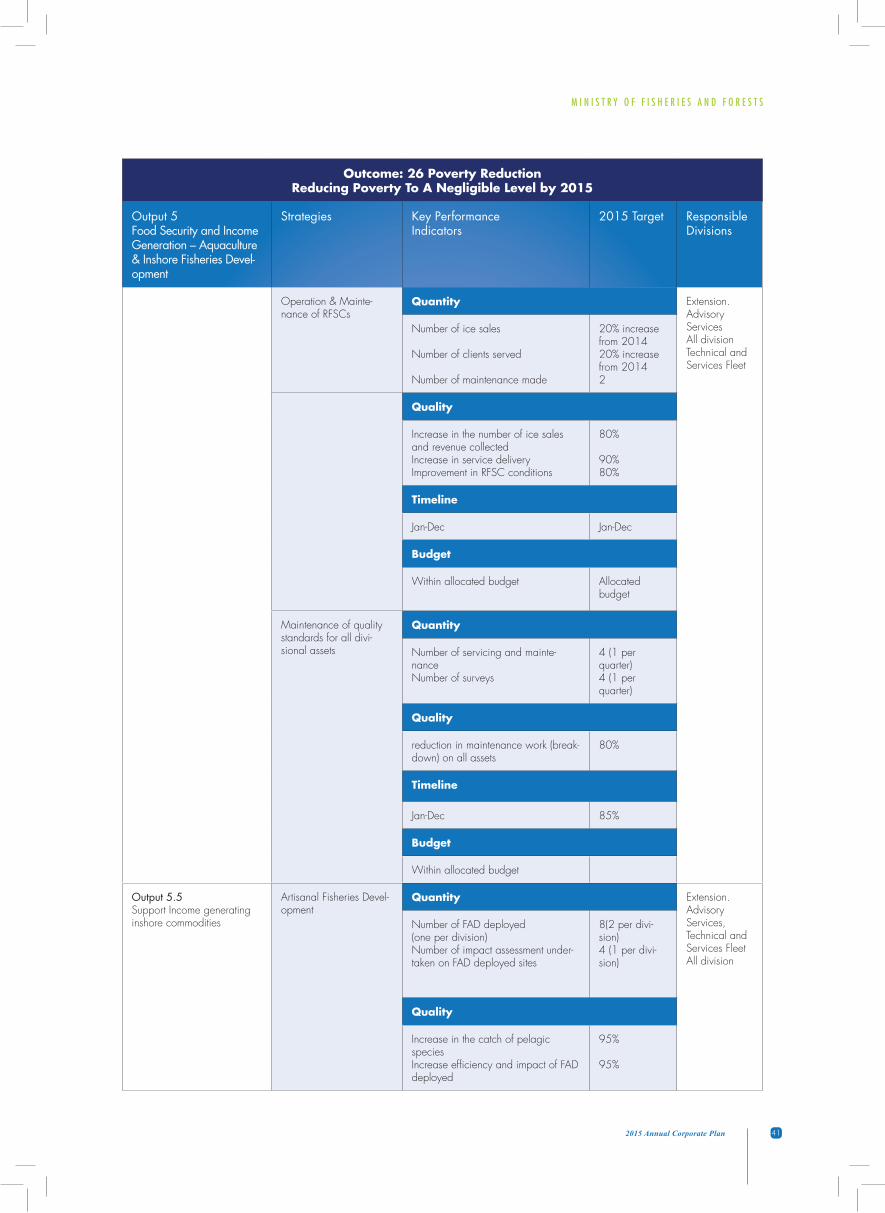
Output 5.4Operation & maintenance of RFSC and Ice Plants
Establishment of New Fisheries Station and Ice-Plant in Rotuma
Quantity Infrastructure project, East-ern, Planning, F&TS
Construction of the ice plantIce sales
Advisory services
140% increase from 201420% increase from 2014
Quality
Increase in the quality of extension & advisory services to the communitiesIncrease in ice sales
100%
10%
Timeline
Jan-Dec
Budget
To be completed within the allocated budget
Within allo-cated budget
Completion of the Gau Fisheries station and sup-porting amenities
Quantity
Completion of the ice plantIce sales
Advisory services
140% increase from 201420% increase from 2014
Quality
Increase in the quality of extension & advisory services to the communitiesIncrease in ice sales
100%
10%
Timeline
Jan-Dec
Budget
Within allocated budget
M I N I S T R Y O F F I S H E R I E S A N D F O R E S T S
412015 Annual Corporate Plan
Outcome: 26 Poverty ReductionReducing Poverty To A Negligible Level by 2015
Output 5Food Security and Income Generation – Aquaculture & Inshore Fisheries Devel-opment
Strategies Key Performance Indicators
2015 Target Responsible Divisions
Operation & Mainte-nance of RFSCs
Quantity Extension. AdvisoryServicesAll division Technical and Services Fleet
Number of ice sales
Number of clients served
Number of maintenance made
20% increase from 201420% increase from 20142
Quality
Increase in the number of ice sales and revenue collected Increase in service deliveryImprovement in RFSC conditions
80%
90%80%
Timeline
Jan-Dec Jan-Dec
Budget
Within allocated budget Allocated budget
Maintenance of quality standards for all divi-sional assets
Quantity
Number of servicing and mainte-nanceNumber of surveys
4 (1 per quarter)4 (1 per quarter)
Quality
reduction in maintenance work (break-down) on all assets
80%
Timeline
Jan-Dec 85%
Budget
Within allocated budget
Output 5.5Support Income generating inshore commodities
Artisanal Fisheries Devel-opment
Quantity Extension. AdvisoryServices,Technical and Services Fleet All division
Number of FAD deployed(one per division)Number of impact assessment under-taken on FAD deployed sites
8(2 per divi-sion)4 (1 per divi-sion)
Quality
Increase in the catch of pelagic speciesIncrease efficiency and impact of FAD deployed
95%
95%
M I N I S T R Y O F F I S H E R I E S A N D F O R E S T S
42 2015 Annual Corporate Plan
Outcome: 26 Poverty ReductionReducing Poverty To A Negligible Level by 2015
Output 5Food Security and Income Generation – Aquaculture & Inshore Fisheries Devel-opment
Strategies Key Performance Indicators
2015 Target Responsible Divisions
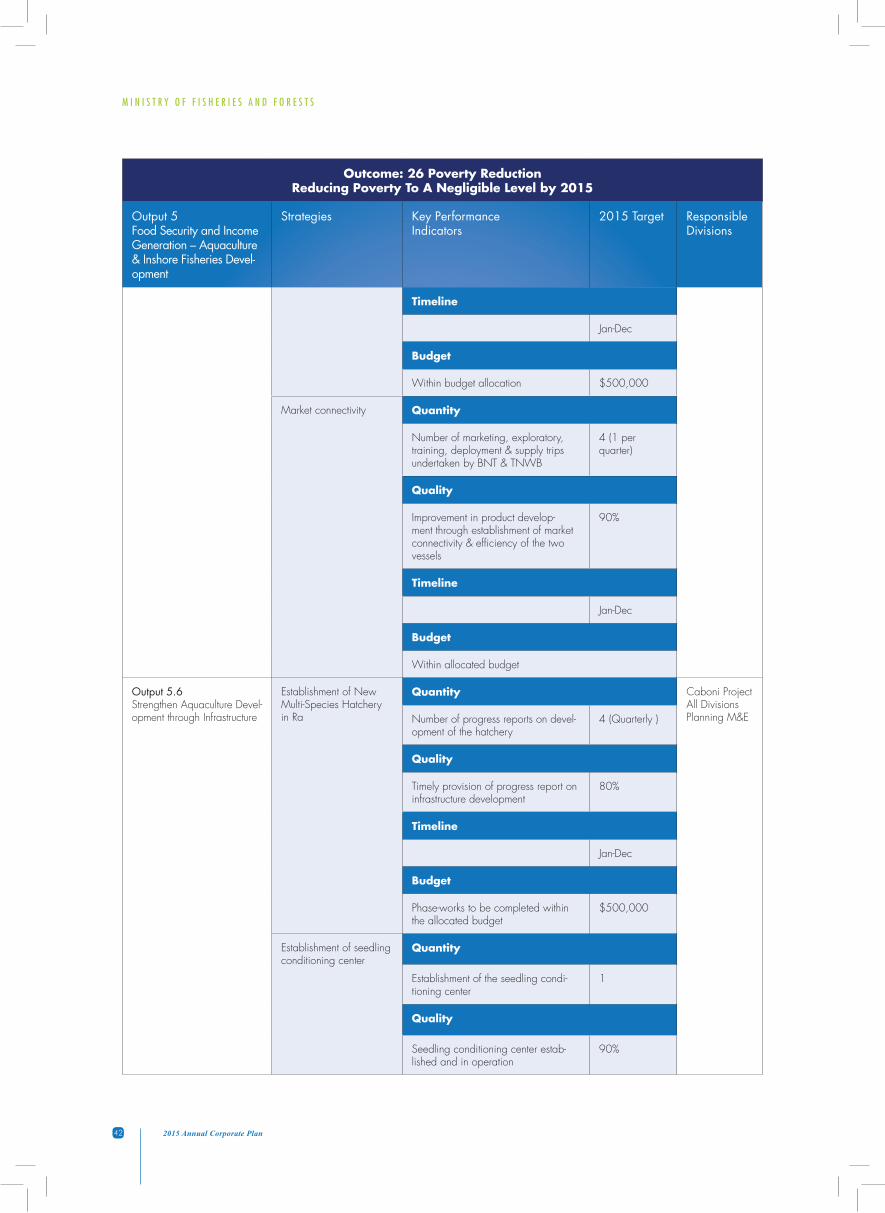
Timeline
Jan-Dec
Budget
Within budget allocation $500,000
Market connectivity Quantity
Number of marketing, exploratory, training, deployment & supply trips undertaken by BNT & TNWB
4 (1 per quarter)
Quality
Improvement in product develop-ment through establishment of market connectivity & efficiency of the two vessels
90%
Timeline
Jan-Dec
Budget
Within allocated budget
Output 5.6Strengthen Aquaculture Devel-opment through Infrastructure
Establishment of New Multi-Species Hatchery in Ra
Quantity Caboni Project All DivisionsPlanning M&ENumber of progress reports on devel-
opment of the hatchery4 (Quarterly )
Quality
Timely provision of progress report on infrastructure development
80%
Timeline
Jan-Dec
Budget
Phase-works to be completed within the allocated budget
$500,000
Establishment of seedling conditioning center
Quantity
Establishment of the seedling condi-tioning center
1
Quality
Seedling conditioning center estab-lished and in operation
90%
M I N I S T R Y O F F I S H E R I E S A N D F O R E S T S
432015 Annual Corporate Plan
Outcome: 26 Poverty ReductionReducing Poverty To A Negligible Level by 2015
Output 5Food Security and Income Generation – Aquaculture & Inshore Fisheries Devel-opment
Strategies Key Performance Indicators
2015 Target Responsible Divisions
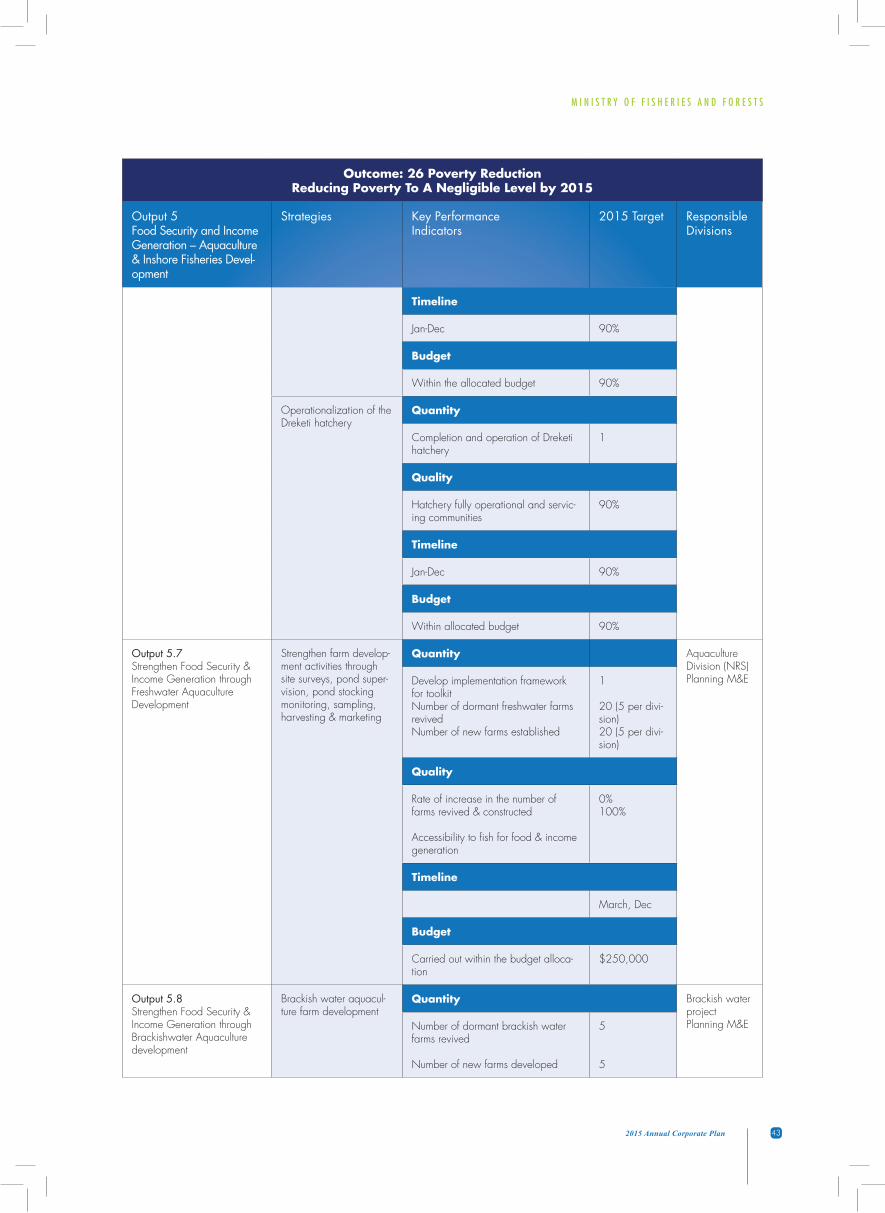
Timeline
Jan-Dec 90%
Budget
Within the allocated budget 90%
Operationalization of the Dreketi hatchery
Quantity
Completion and operation of Dreketi hatchery
1
Quality
Hatchery fully operational and servic-ing communities
90%
Timeline
Jan-Dec 90%
Budget
Within allocated budget 90%
Output 5.7Strengthen Food Security & Income Generation through Freshwater Aquaculture Development
Strengthen farm develop-ment activities through site surveys, pond super-vision, pond stocking monitoring, sampling, harvesting & marketing
Quantity Aquaculture Division (NRS)Planning M&E Develop implementation framework
for toolkitNumber of dormant freshwater farms revivedNumber of new farms established
1
20 (5 per divi-sion)20 (5 per divi-sion)
Quality
Rate of increase in the number of farms revived & constructed
Accessibility to fish for food & income generation
0% 100%
Timeline
March, Dec
Budget
Carried out within the budget alloca-tion
$250,000
Output 5.8Strengthen Food Security & Income Generation through Brackishwater Aquaculture development
Brackish water aquacul-ture farm development
Quantity Brackish water project Planning M&ENumber of dormant brackish water
farms revived
Number of new farms developed
5
5
M I N I S T R Y O F F I S H E R I E S A N D F O R E S T S
44 2015 Annual Corporate Plan
Outcome: 26 Poverty ReductionReducing Poverty To A Negligible Level by 2015
Output 5Food Security and Income Generation – Aquaculture & Inshore Fisheries Devel-opment
Strategies Key Performance Indicators
2015 Target Responsible Divisions
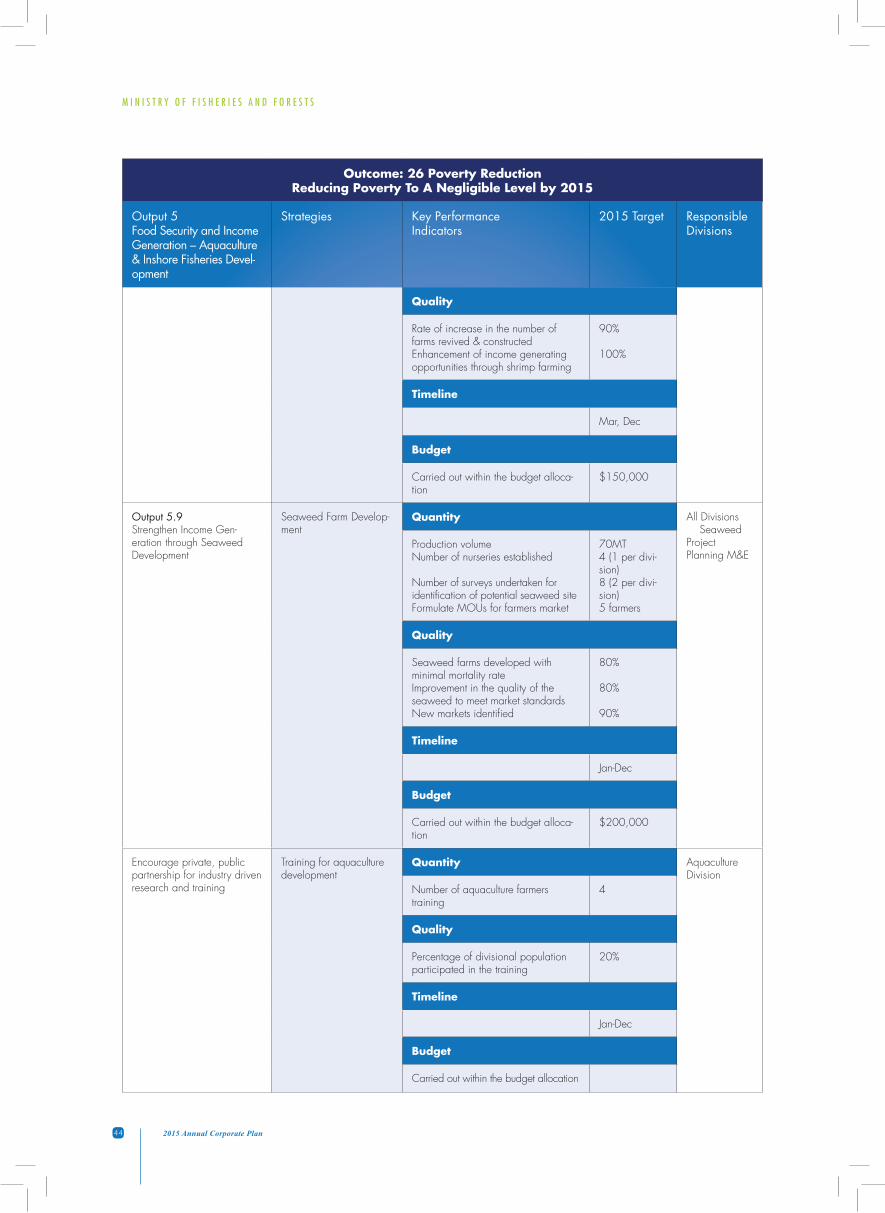
Quality
Rate of increase in the number of farms revived & constructedEnhancement of income generating opportunities through shrimp farming
90%
100%
Timeline
Mar, Dec
Budget
Carried out within the budget alloca-tion
$150,000
Output 5.9Strengthen Income Gen-eration through Seaweed Development
Seaweed Farm Develop-ment
Quantity All Divisions Seaweed Project Planning M&E
Production volume Number of nurseries established
Number of surveys undertaken for identification of potential seaweed siteFormulate MOUs for farmers market
70MT4 (1 per divi-sion)8 (2 per divi-sion)5 farmers
Quality
Seaweed farms developed with minimal mortality rateImprovement in the quality of the seaweed to meet market standards New markets identified
80%
80%
90%
Timeline
Jan-Dec
Budget
Carried out within the budget alloca-tion
$200,000
Encourage private, public partnership for industry driven research and training
Training for aquaculture development
Quantity Aquaculture Division
Number of aquaculture farmers training
4
Quality
Percentage of divisional population participated in the training
20%
Timeline
Jan-Dec
Budget
Carried out within the budget allocation
M I N I S T R Y O F F I S H E R I E S A N D F O R E S T S
452015 Annual Corporate Plan
Outcome: 26 Poverty ReductionReducing Poverty To A Negligible Level by 2015
Output 5Food Security and Income Generation – Aquaculture & Inshore Fisheries Devel-opment
Strategies Key Performance Indicators
2015 Target Responsible Divisions
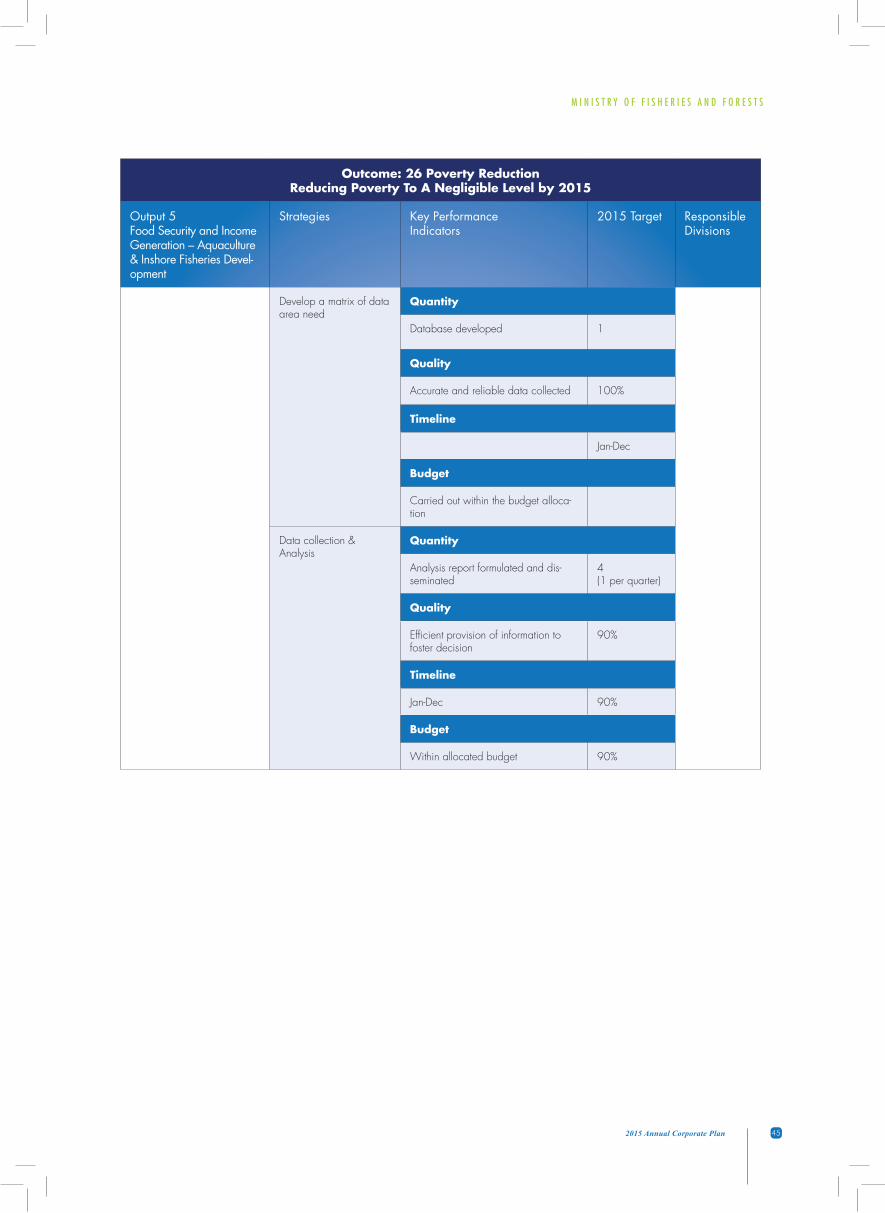
Develop a matrix of data area need
Quantity
Database developed 1
Quality
Accurate and reliable data collected 100%
Timeline
Jan-Dec
Budget
Carried out within the budget alloca-tion
Data collection & Analysis
Quantity
Analysis report formulated and dis-seminated
4 (1 per quarter)
Quality
Efficient provision of information to foster decision
90%
Timeline
Jan-Dec 90%
Budget
Within allocated budget 90%
M I N I S T R Y O F F I S H E R I E S A N D F O R E S T S
46 2015 Annual Corporate Plan
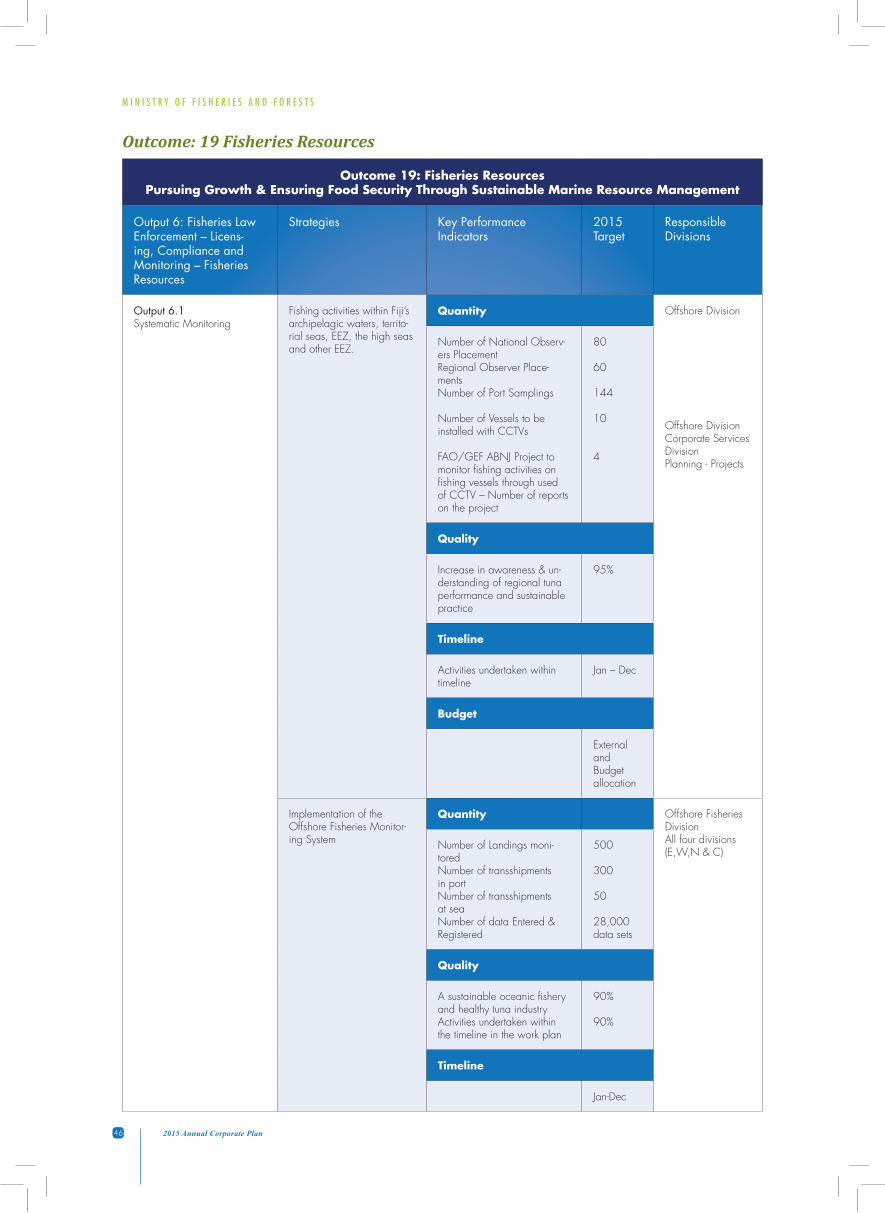
Outcome 19: Fisheries ResourcesPursuing Growth & Ensuring Food Security Through Sustainable Marine Resource Management
Output 6: Fisheries Law Enforcement – Licens-ing, Compliance and Monitoring – Fisheries Resources
Strategies Key Performance Indicators
2015 Target
Responsible Divisions
Output 6.1Systematic Monitoring
Fishing activities within Fiji’s archipelagic waters, territo-rial seas, EEZ, the high seas and other EEZ.
Quantity Offshore Division
Offshore DivisionCorporate Services DivisionPlanning - Projects
Number of National Observ-ers PlacementRegional Observer Place-mentsNumber of Port Samplings
Number of Vessels to be installed with CCTVs
FAO/GEF ABNJ Project to monitor fishing activities on fishing vessels through used of CCTV – Number of reports on the project
80
60
144
10
4
Quality
Increase in awareness & un-derstanding of regional tuna performance and sustainable practice
95%
Timeline
Activities undertaken within timeline
Jan – Dec
Budget
External and Budget allocation
Implementation of the Offshore Fisheries Monitor-ing System
Quantity Offshore Fisheries DivisionAll four divisions (E,W,N & C)
Number of Landings moni-toredNumber of transshipments in portNumber of transshipments at seaNumber of data Entered & Registered
500
300
50
28,000 data sets
Quality
A sustainable oceanic fishery and healthy tuna industryActivities undertaken within the timeline in the work plan
90%
90%
Timeline
Jan-Dec
Outcome: 19 Fisheries Resources
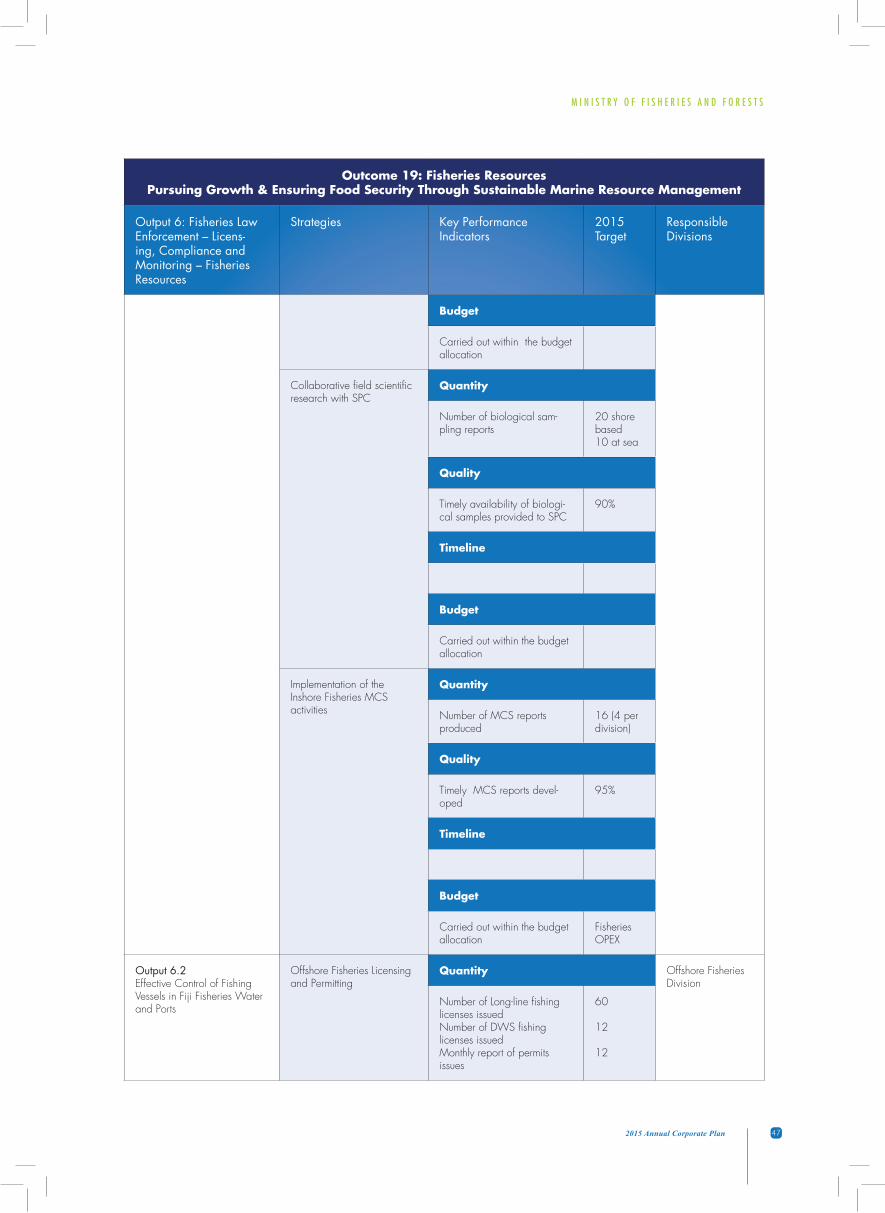
M I N I S T R Y O F F I S H E R I E S A N D F O R E S T S
472015 Annual Corporate Plan
Outcome 19: Fisheries ResourcesPursuing Growth & Ensuring Food Security Through Sustainable Marine Resource Management
Output 6: Fisheries Law Enforcement – Licens-ing, Compliance and Monitoring – Fisheries Resources
Strategies Key Performance Indicators
2015 Target
Responsible Divisions
Budget
Carried out within the budget allocation
Collaborative field scientific research with SPC
Quantity
Number of biological sam-pling reports
20 shore based 10 at sea
Quality
Timely availability of biologi-cal samples provided to SPC
90%
Timeline
Budget
Carried out within the budget allocation
Implementation of the Inshore Fisheries MCS activities
Quantity
Number of MCS reports produced
16 (4 per division)
Quality
Timely MCS reports devel-oped
95%
Timeline
Budget
Carried out within the budget allocation
Fisheries OPEX
Output 6.2Effective Control of Fishing Vessels in Fiji Fisheries Water and Ports
Offshore Fisheries Licensing and Permitting
Quantity Offshore Fisheries Division
Number of Long-line fishing licenses issuedNumber of DWS fishing licenses issuedMonthly report of permits issues
60
12
12
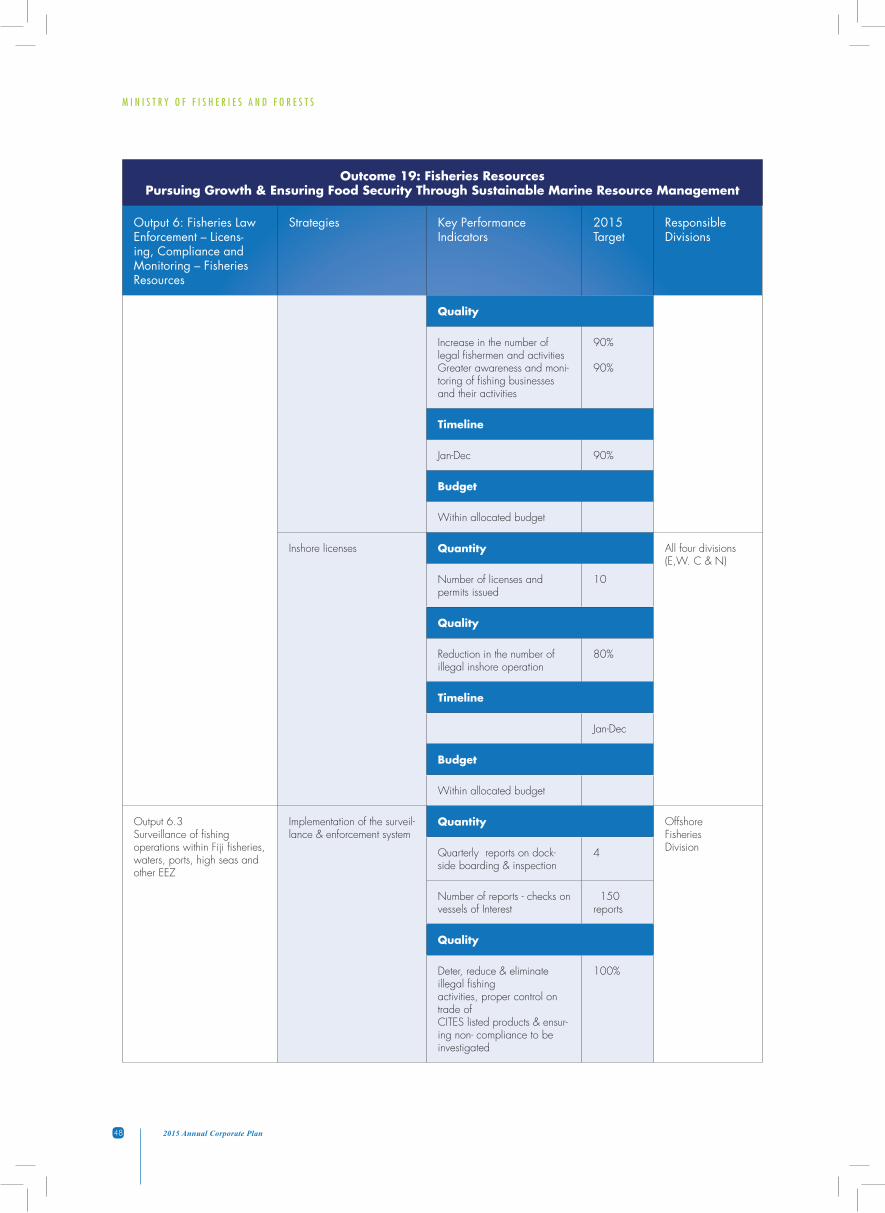
M I N I S T R Y O F F I S H E R I E S A N D F O R E S T S
48 2015 Annual Corporate Plan
Outcome 19: Fisheries ResourcesPursuing Growth & Ensuring Food Security Through Sustainable Marine Resource Management
Output 6: Fisheries Law Enforcement – Licens-ing, Compliance and Monitoring – Fisheries Resources
Strategies Key Performance Indicators
2015 Target
Responsible Divisions
Quality
Increase in the number of legal fishermen and activitiesGreater awareness and moni-toring of fishing businesses and their activities
90%
90%
Timeline
Jan-Dec 90%
Budget
Within allocated budget
Inshore licenses Quantity All four divisions (E,W. C & N)
Number of licenses and permits issued
10
Quality
Reduction in the number of illegal inshore operation
80%
Timeline
Jan-Dec
Budget
Within allocated budget
Output 6.3Surveillance of fishing operations within Fiji fisheries, waters, ports, high seas and other EEZ
Implementation of the surveil-lance & enforcement system
Quantity Offshore Fisheries DivisionQuarterly reports on dock-
side boarding & inspection4
Number of reports - checks on vessels of Interest
150 reports
Quality
Deter, reduce & eliminate illegal fishingactivities, proper control on trade ofCITES listed products & ensur-ing non- compliance to be investigated
100%
M I N I S T R Y O F F I S H E R I E S A N D F O R E S T S
492015 Annual Corporate Plan
Outcome 19: Fisheries ResourcesPursuing Growth & Ensuring Food Security Through Sustainable Marine Resource Management
Output 6: Fisheries Law Enforcement – Licens-ing, Compliance and Monitoring – Fisheries Resources
Strategies Key Performance Indicators
2015 Target
Responsible Divisions
Timeline
Jan-Dec
Budget
Within allocated budget
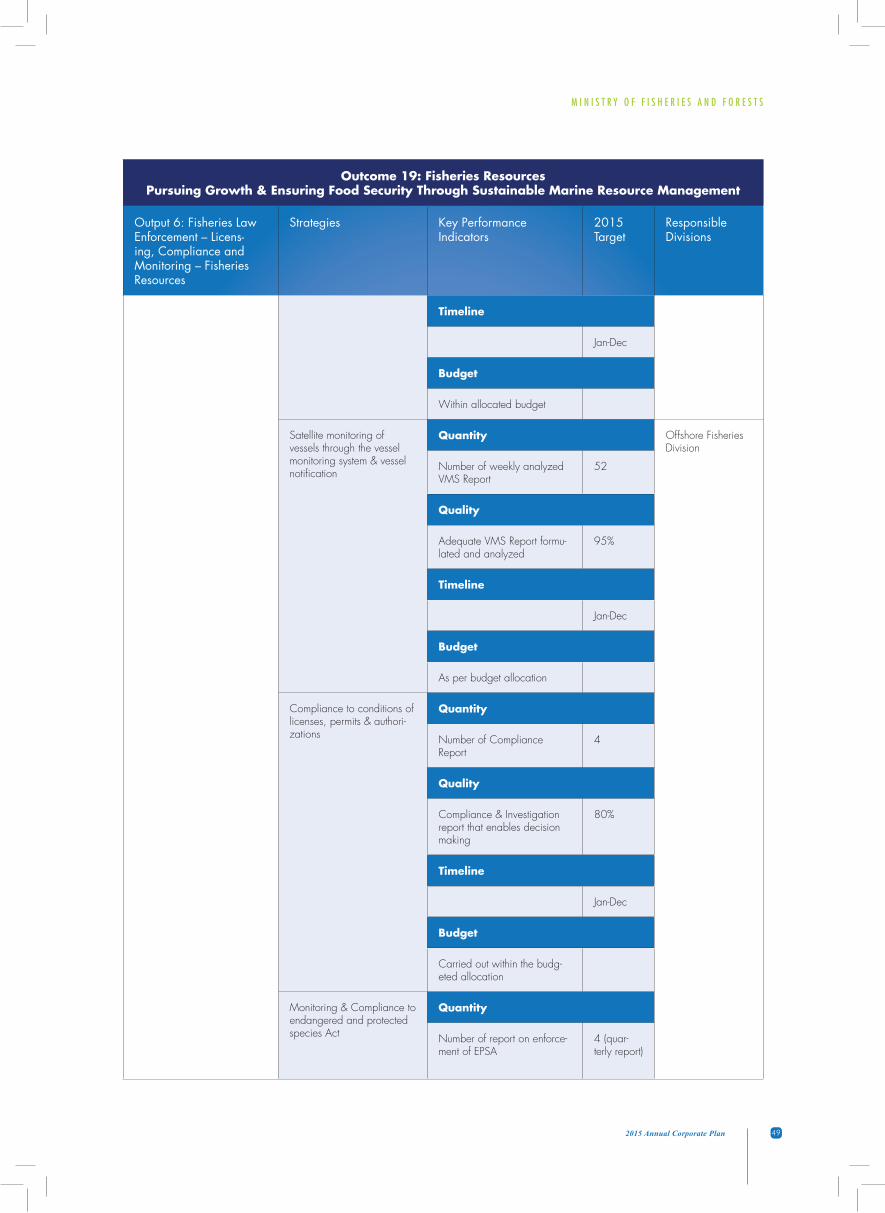
Satellite monitoring of vessels through the vessel monitoring system & vessel notification
Quantity Offshore Fisheries Division
Number of weekly analyzed VMS Report
52
Quality
Adequate VMS Report formu-lated and analyzed
95%
Timeline
Jan-Dec
Budget
As per budget allocation
Compliance to conditions of licenses, permits & authori-zations
Quantity
Number of Compliance Report
4
Quality
Compliance & Investigation report that enables decision making
80%
Timeline
Jan-Dec
Budget
Carried out within the budg-eted allocation
Monitoring & Compliance to endangered and protected species Act
Quantity
Number of report on enforce-ment of EPSA
4 (quar-terly report)

M I N I S T R Y O F F I S H E R I E S A N D F O R E S T S
50 2015 Annual Corporate Plan
Outcome 19: Fisheries ResourcesPursuing Growth & Ensuring Food Security Through Sustainable Marine Resource Management
Output 6: Fisheries Law Enforcement – Licens-ing, Compliance and Monitoring – Fisheries Resources
Strategies Key Performance Indicators
2015 Target
Responsible Divisions
Quality
Report from visits assist in decision making
90%
Timeline
Jan-Dec
Budget
Carried out within the budg-eted allocation
OFD OPEX
Output 6.4Evaluate Fisheries Trade & Economic Data
Review of Fisheries Data collecting system
Quantity Inshore Statistics
Inventory of fisheries data collected and documentation of methodology
1 report
Number of statistics policy brief produced
4(1 per Qtr)
Fisheries Key stats 2015 published
1
Number of training on data collection undertaken
1
Quality
Accurate, reliable data col-lection &compilation
80%
Timeline
Activities undertaken within the Timeframe
March Quarterly DecemberMay
Budget
Carried out within the budget allocation& time
Within budget allocation
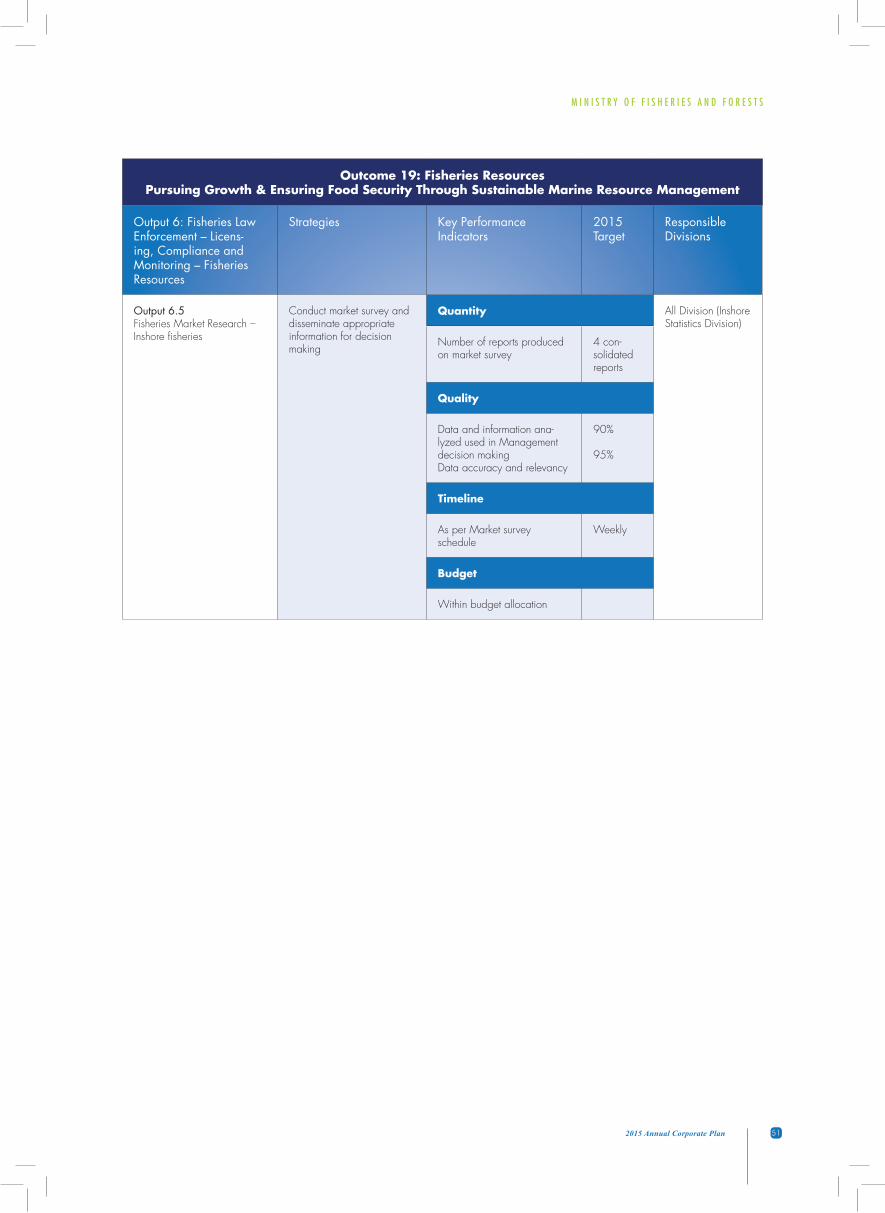
M I N I S T R Y O F F I S H E R I E S A N D F O R E S T S
512015 Annual Corporate Plan
Outcome 19: Fisheries ResourcesPursuing Growth & Ensuring Food Security Through Sustainable Marine Resource Management
Output 6: Fisheries Law Enforcement – Licens-ing, Compliance and Monitoring – Fisheries Resources
Strategies Key Performance Indicators
2015 Target
Responsible Divisions
Output 6.5 Fisheries Market Research – Inshore fisheries
Conduct market survey and disseminate appropriate information for decision making
Quantity All Division (Inshore Statistics Division)
Number of reports produced on market survey
4 con-solidated reports
Quality
Data and information ana-lyzed used in Management decision making Data accuracy and relevancy
90%
95%
Timeline
As per Market survey schedule
Weekly
Budget
Within budget allocation
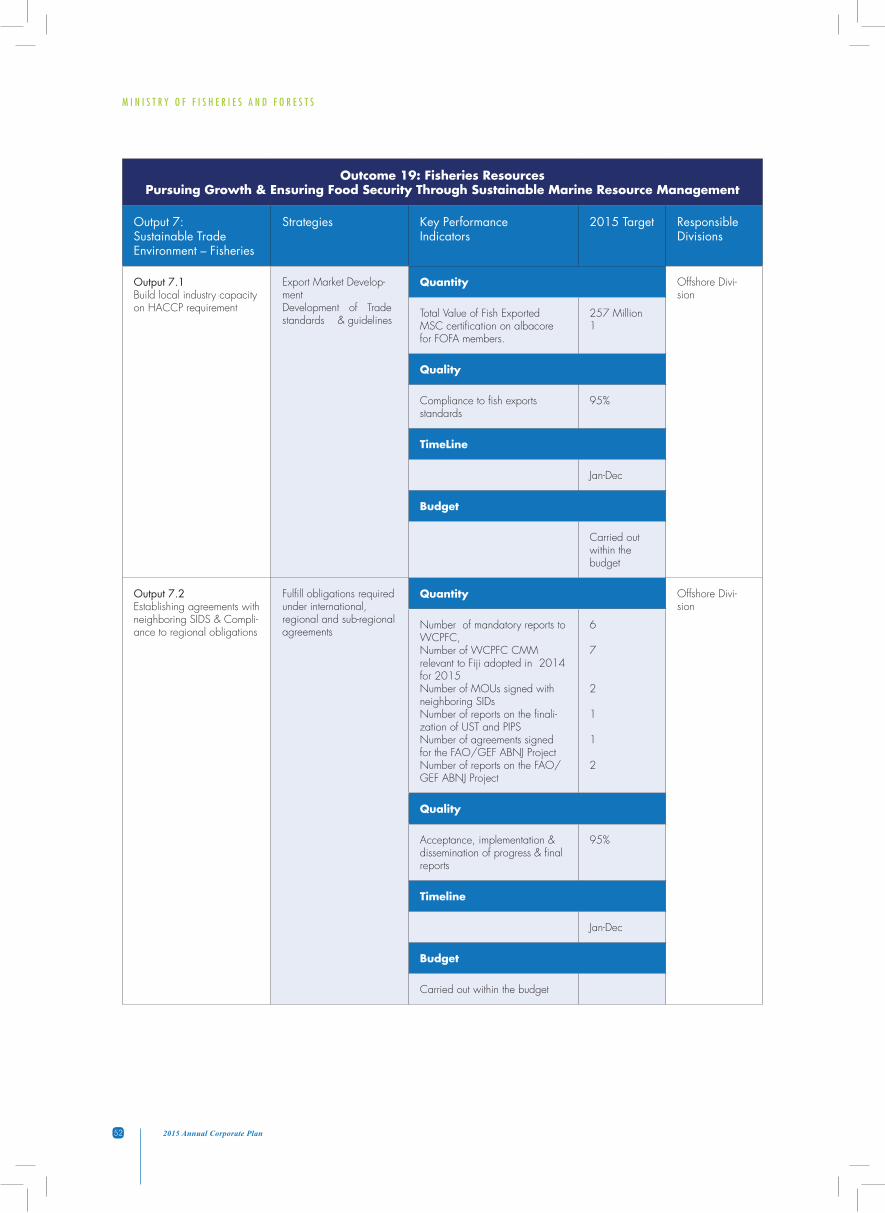
M I N I S T R Y O F F I S H E R I E S A N D F O R E S T S
52 2015 Annual Corporate Plan
Outcome 19: Fisheries ResourcesPursuing Growth & Ensuring Food Security Through Sustainable Marine Resource Management
Output 7: Sustainable Trade Environment – Fisheries
Strategies Key Performance Indicators
2015 Target Responsible Divisions
Output 7.1Build local industry capacity on HACCP requirement
Export Market Develop-mentDevelopment of Trade standards & guidelines
Quantity Offshore Divi-sion
Total Value of Fish ExportedMSC certification on albacore for FOFA members.
257 Million1
Quality
Compliance to fish exports standards
95%
TimeLine
Jan-Dec
Budget
Carried out within the budget
Output 7.2Establishing agreements withneighboring SIDS & Compli-ance to regional obligations
Fulfill obligations required under international, regional and sub-regional agreements
Quantity Offshore Divi-sion
Number of mandatory reports to WCPFC,Number of WCPFC CMM relevant to Fiji adopted in 2014 for 2015Number of MOUs signed with neighboring SIDsNumber of reports on the finali-zation of UST and PIPSNumber of agreements signed for the FAO/GEF ABNJ ProjectNumber of reports on the FAO/GEF ABNJ Project
6
7
2
1
1
2
Quality
Acceptance, implementation & dissemination of progress & final reports
95%
Timeline
Jan-Dec
Budget
Carried out within the budget

M I N I S T R Y O F F I S H E R I E S A N D F O R E S T S
532015 Annual Corporate Plan
Outcome 19: Fisheries ResourcesPursuing Growth & Ensuring Food Security Through Sustainable Marine Resource Management
Output 7: Sustainable Trade Environment – Fisheries
Strategies Key Performance Indicators
2015 Target Responsible Divisions
Output 7.1Build local industry capacity on HACCP requirement
Export Market Develop-mentDevelopment of Trade standards & guidelines
Quantity Offshore Divi-sion
Total Value of Fish ExportedMSC certification on albacore for FOFA members.
257 Million1
Quality
Compliance to fish exports standards
95%
TimeLine
Jan-Dec
Budget
Carried out within the budget
Output 7.2Establishing agreements withneighboring SIDS & Compli-ance to regional obligations
Fulfill obligations required under international, regional and sub-regional agreements
Quantity Offshore Divi-sion
Number of mandatory reports to WCPFC,Number of WCPFC CMM relevant to Fiji adopted in 2014 for 2015Number of MOUs signed with neighboring SIDsNumber of reports on the finali-zation of UST and PIPSNumber of agreements signed for the FAO/GEF ABNJ ProjectNumber of reports on the FAO/GEF ABNJ Project
6
7
2
1
1
2
Quality
Acceptance, implementation & dissemination of progress & final reports
95%
Timeline
Jan-Dec
Budget
Carried out within the budget
Outcome 19: Fisheries ResourcesPursuing Growth & Ensuring Food Security Through Sustainable Marine Resource Management
Output 7: Sustainable Trade Environment – Fisheries
Strategies Key Performance Indicators
2015 Target Responsible Divisions
Output 7.3 Increased Market Connectiv-ity for Maritime Islands
Market Connectivity – Maritime Islands: Fisheries Multi-Purpose Vessel
Quantity (BNT)
Number of trip reports to Mari-time islands
12
Volume of fish collected from maritime trips
Quality
Increased connectivity to marketsGreater Market Access of fish collected
90%95%
Timeline
Jan-Dec
Budget
Within budget allocation
Output 7.4 Trade Facilitation
Development of informa-tion toolkit on forestry trade and business infor-mation (Business guide)
Quantity Planning – Policy All Divisions Information toolkit produced and
disseminated to more than 1000 stakeholders
1 publica-tion – 1000 stakeholders
Quality
Referral visits/enquiries on same requests reduced and Increase in the number of enquires and potential investment proposals received
50%
90%
Timeline
Activities undertaken within the timeline in the work plan
Jan- June
Budget
Within the budgeted allocation Economic Planning & Policy – Publi-cation Budget
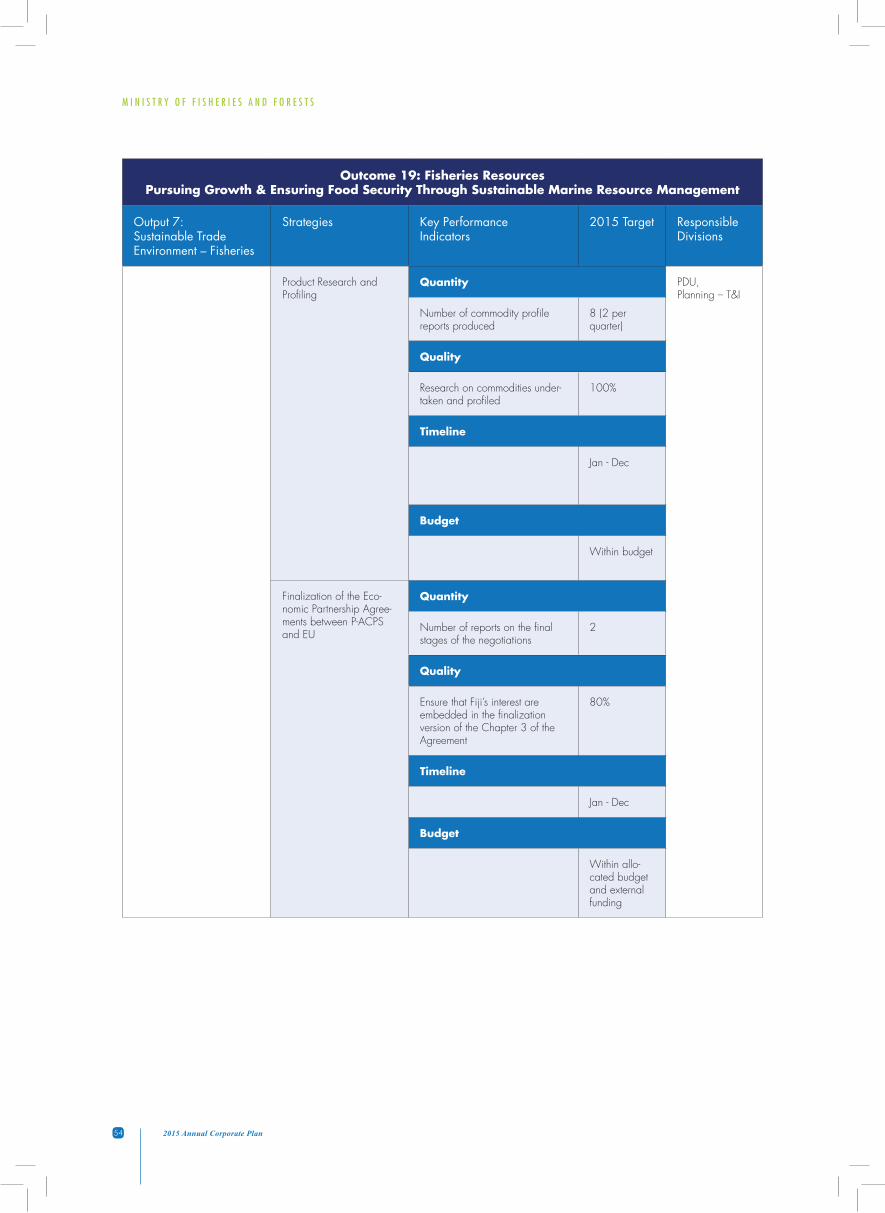
M I N I S T R Y O F F I S H E R I E S A N D F O R E S T S
54 2015 Annual Corporate Plan
Outcome 19: Fisheries ResourcesPursuing Growth & Ensuring Food Security Through Sustainable Marine Resource Management
Output 7: Sustainable Trade Environment – Fisheries
Strategies Key Performance Indicators
2015 Target Responsible Divisions
Product Research and Profiling
Quantity PDU, Planning – T&I
Number of commodity profile reports produced
8 (2 per quarter)
Quality
Research on commodities under-taken and profiled
100%
Timeline
Jan - Dec
Budget
Within budget
Finalization of the Eco-nomic Partnership Agree-ments between P-ACPS and EU
Quantity
Number of reports on the final stages of the negotiations
2
Quality
Ensure that Fiji’s interest are embedded in the finalization version of the Chapter 3 of the Agreement
80%
Timeline
Jan - Dec
Budget
Within allo-cated budget and external funding
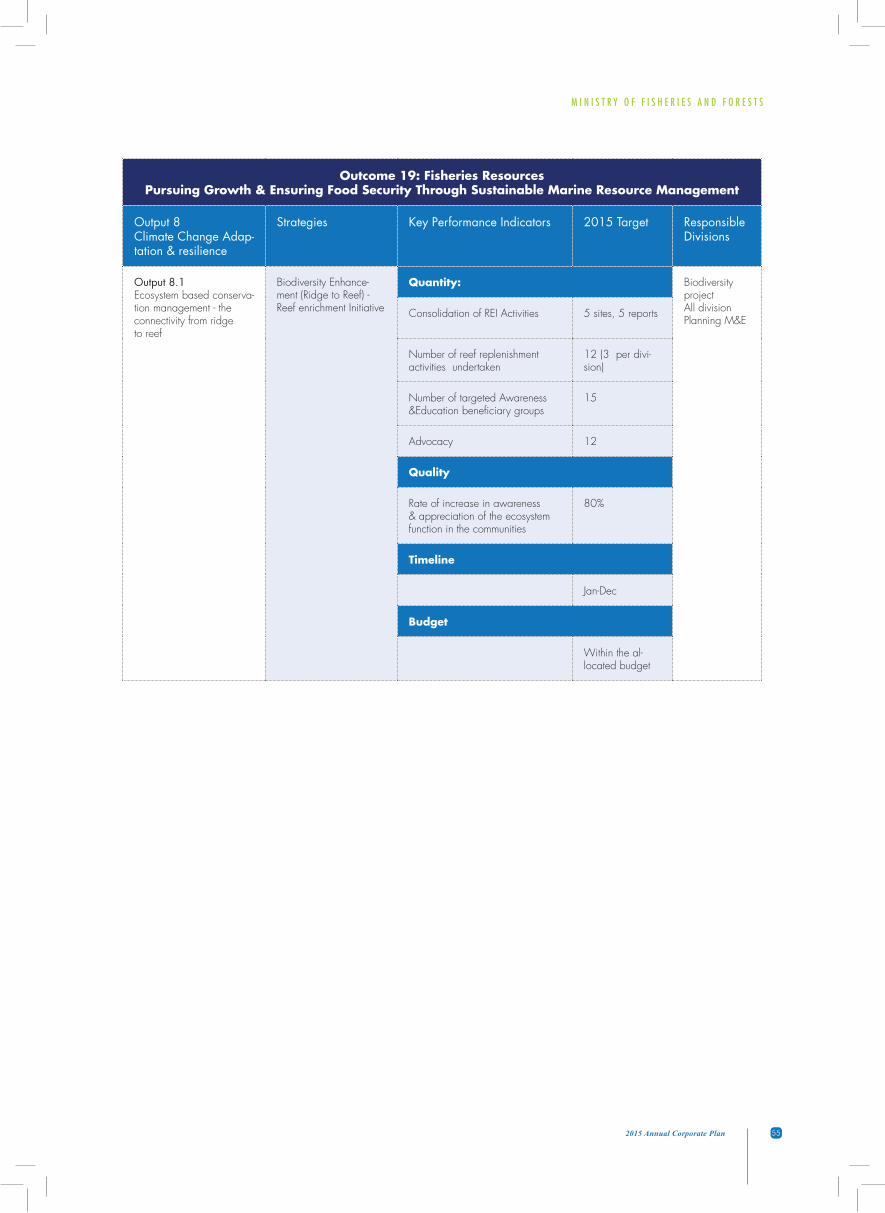
M I N I S T R Y O F F I S H E R I E S A N D F O R E S T S
552015 Annual Corporate Plan
Outcome 19: Fisheries ResourcesPursuing Growth & Ensuring Food Security Through Sustainable Marine Resource Management
Output 8Climate Change Adap-tation & resilience
Strategies Key Performance Indicators 2015 Target Responsible Divisions
Output 8.1 Ecosystem based conserva-tion management - the connectivity from ridge to reef
Biodiversity Enhance-ment (Ridge to Reef) - Reef enrichment Initiative
Quantity: Biodiversity project All division Planning M&E
Consolidation of REI Activities 5 sites, 5 reports
Number of reef replenishment activities undertaken
12 (3 per divi-sion)
Number of targeted Awareness &Education beneficiary groups
15
Advocacy 12
Quality
Rate of increase in awareness & appreciation of the ecosystem function in the communities
80%
Timeline
Jan-Dec
Budget
Within the al-located budget
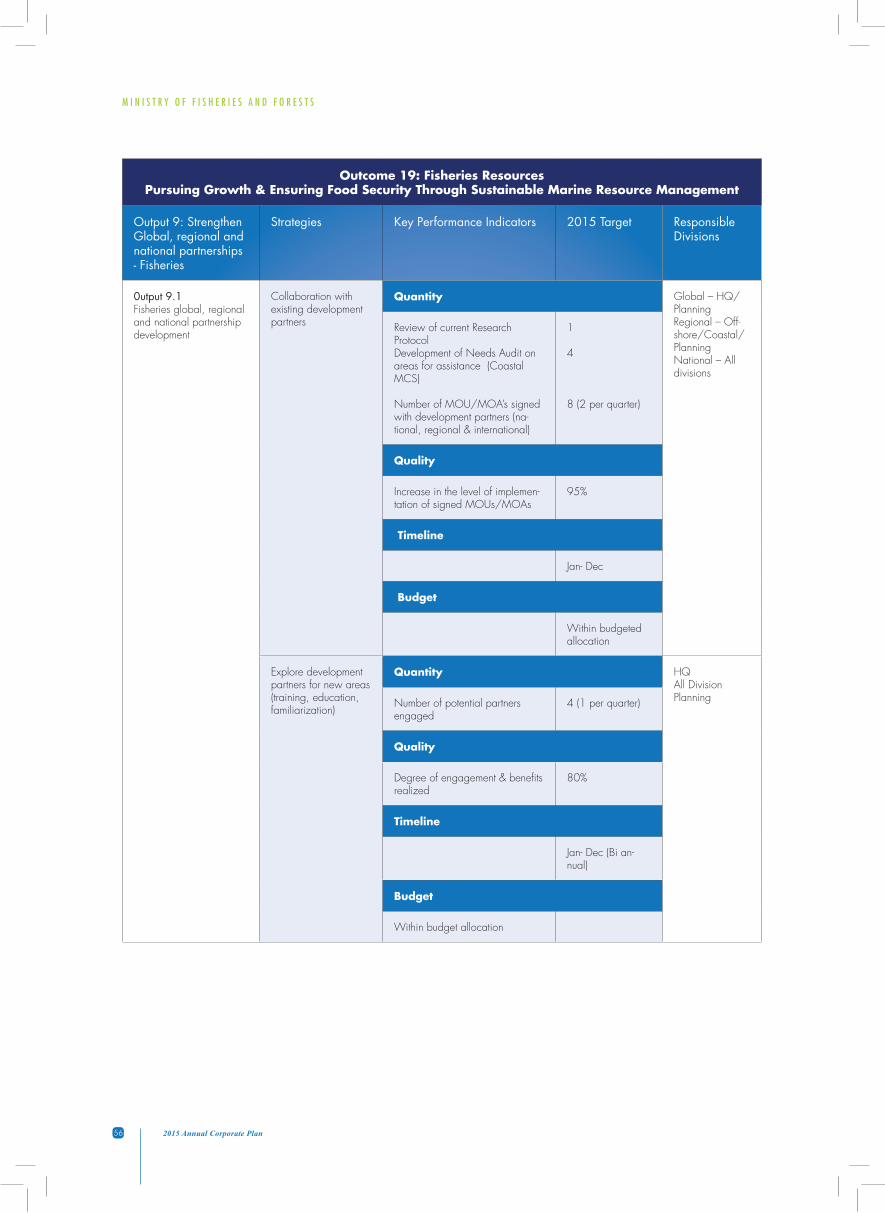
M I N I S T R Y O F F I S H E R I E S A N D F O R E S T S
56 2015 Annual Corporate Plan
Outcome 19: Fisheries ResourcesPursuing Growth & Ensuring Food Security Through Sustainable Marine Resource Management
Output 9: Strengthen Global, regional and national partnerships - Fisheries
Strategies Key Performance Indicators 2015 Target Responsible Divisions
0utput 9.1 Fisheries global, regional and national partnership development
Collaboration with existing development partners
Quantity Global – HQ/Planning Regional – Off-shore/Coastal/Planning National – All divisions
Review of current Research Protocol Development of Needs Audit on areas for assistance (Coastal MCS)
Number of MOU/MOA’s signed with development partners (na-tional, regional & international)
1
4
8 (2 per quarter)
Quality
Increase in the level of implemen-tation of signed MOUs/MOAs
95%
Timeline
Jan- Dec
Budget
Within budgeted allocation
Explore development partners for new areas (training, education, familiarization)
Quantity HQAll Division Planning Number of potential partners
engaged4 (1 per quarter)
Quality
Degree of engagement & benefits realized
80%
Timeline
Jan- Dec (Bi an-nual)
Budget
Within budget allocation
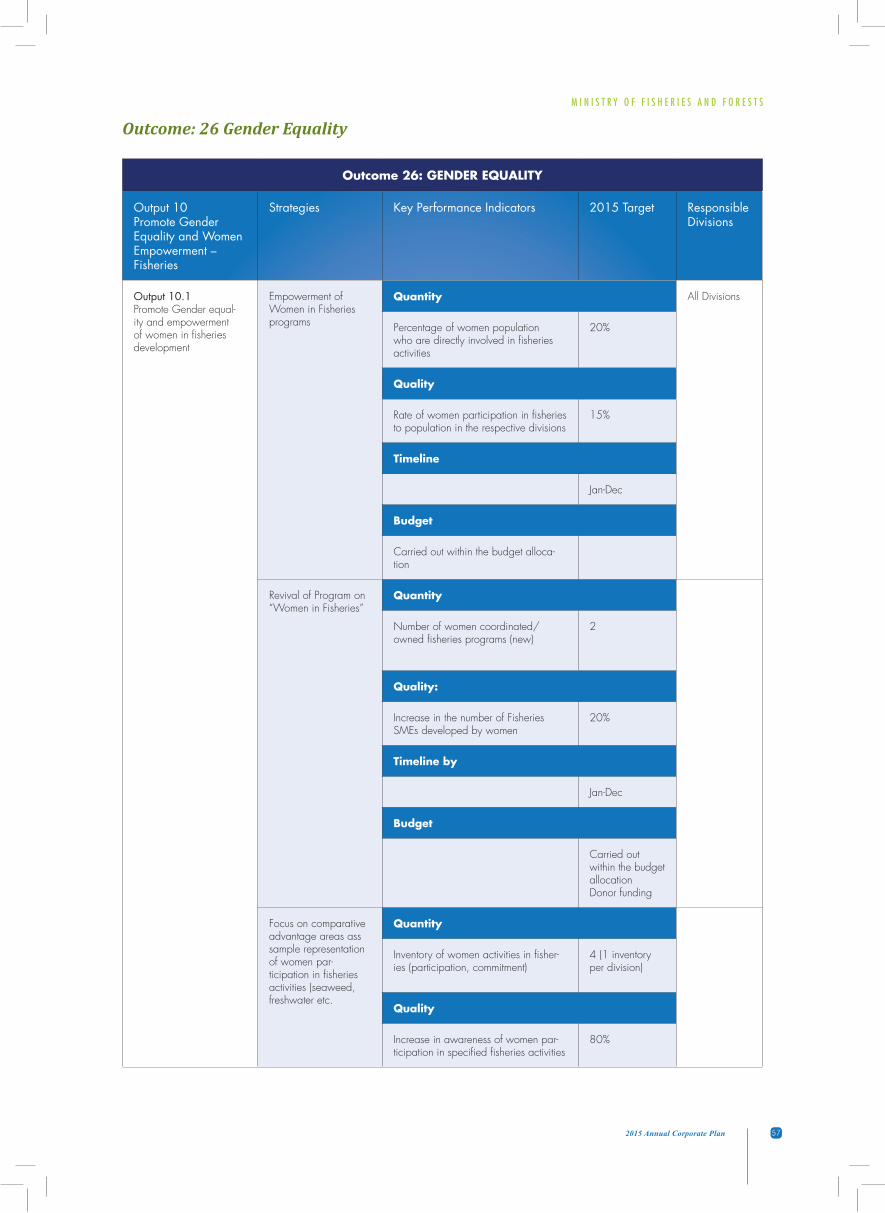
M I N I S T R Y O F F I S H E R I E S A N D F O R E S T S
572015 Annual Corporate Plan
Outcome 26: GENDER EQUALITY
Output 10Promote Gender Equality and Women Empowerment – Fisheries
Strategies Key Performance Indicators 2015 Target Responsible Divisions
Output 10.1 Promote Gender equal-ity and empowerment of women in fisheries development
Empowerment of Women in Fisheries programs
Quantity All Divisions
Percentage of women population who are directly involved in fisheries activities
20%
Quality
Rate of women participation in fisheries to population in the respective divisions
15%
Timeline
Jan-Dec
Budget
Carried out within the budget alloca-tion
Revival of Program on “Women in Fisheries”
Quantity
Number of women coordinated/owned fisheries programs (new)
2
Quality:
Increase in the number of Fisheries SMEs developed by women
20%
Timeline by
Jan-Dec
Budget
Carried out within the budget allocationDonor funding
Focus on comparative advantage areas ass sample representation of women par-ticipation in fisheries activities (seaweed, freshwater etc.
Quantity
Inventory of women activities in fisher-ies (participation, commitment)
4 (1 inventory per division)
Quality
Increase in awareness of women par-ticipation in specified fisheries activities
80%
Outcome: 26 Gender Equality
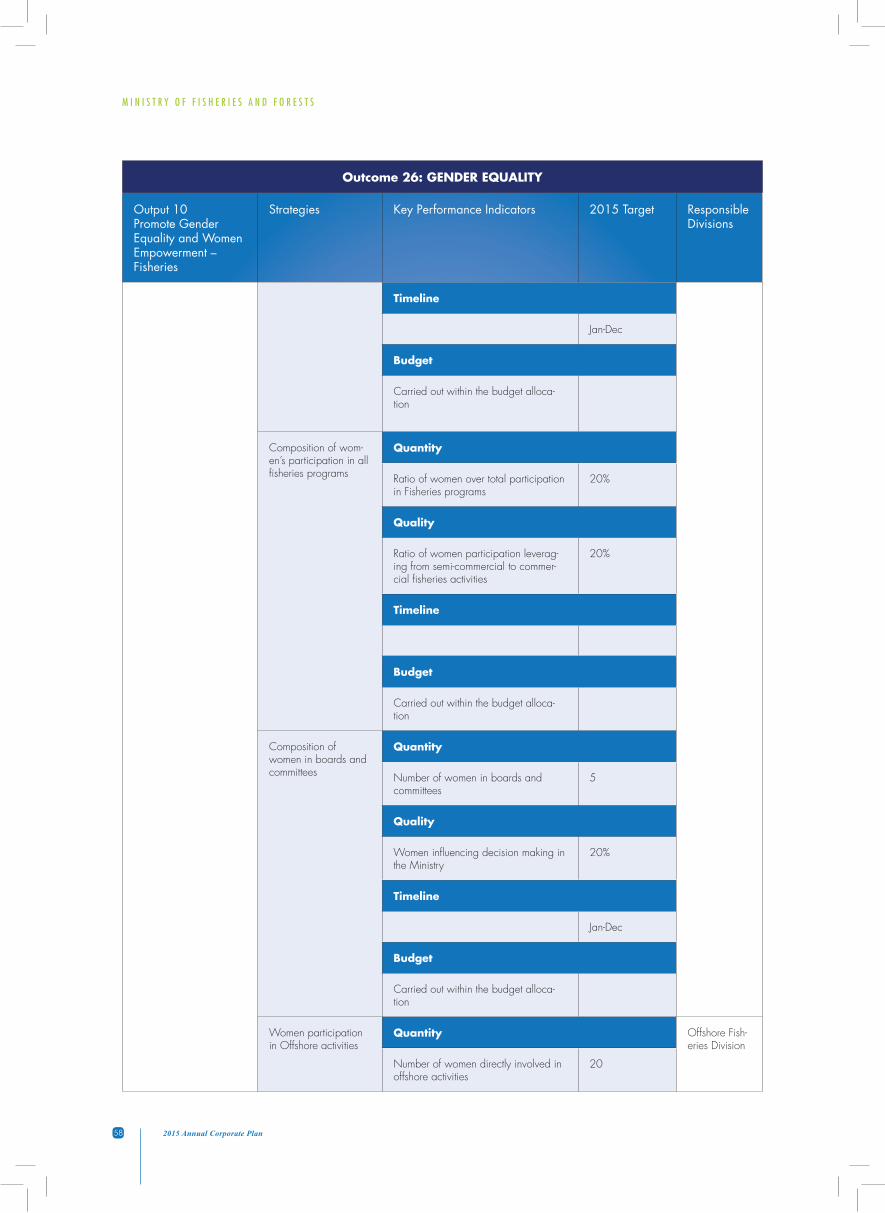
M I N I S T R Y O F F I S H E R I E S A N D F O R E S T S
58 2015 Annual Corporate Plan
Outcome 26: GENDER EQUALITY
Output 10Promote Gender Equality and Women Empowerment – Fisheries
Strategies Key Performance Indicators 2015 Target Responsible Divisions
Timeline
Jan-Dec
Budget
Carried out within the budget alloca-tion
Composition of wom-en’s participation in all fisheries programs
Quantity
Ratio of women over total participation in Fisheries programs
20%
Quality
Ratio of women participation leverag-ing from semi-commercial to commer-cial fisheries activities
20%
Timeline
Budget
Carried out within the budget alloca-tion
Composition of women in boards and committees
Quantity
Number of women in boards and committees
5
Quality
Women influencing decision making in the Ministry
20%
Timeline
Jan-Dec
Budget
Carried out within the budget alloca-tion
Women participation in Offshore activities
Quantity Offshore Fish-eries Division
Number of women directly involved in offshore activities
20

M I N I S T R Y O F F I S H E R I E S A N D F O R E S T S
592015 Annual Corporate Plan
Outcome 26: GENDER EQUALITY
Output 10Promote Gender Equality and Women Empowerment – Fisheries
Strategies Key Performance Indicators 2015 Target Responsible Divisions
Quality
Data collected provide sufficient infor-mation on Provision of equal opportuni-ties for women
80%
Timeline
Jan- June
Budget
Within budget allocation
Outcome 21: Financial Services
Output 11Financial Services – Fisheries
Strategies Key Performance Indicators 2015 Target Responsible Divisions
Output 11.1 Compliance to Financial Reports
Submission of the Agency Financial Statement to OAG
Quantity Accounts Division
Agency Financial Submitted 1
Quality
Agency Financial Statement aligned to the requirements of the Finance Act and accepted by OAG
100%
Timeline
April
Budget
Within allocation
Submission of Annual Reports
Quantity All Divisions Planning
2014 Annual Report completed and published
1
Quality
Annual Report endorsed by Cabinet and Management
95%
Timeline
January May 31st
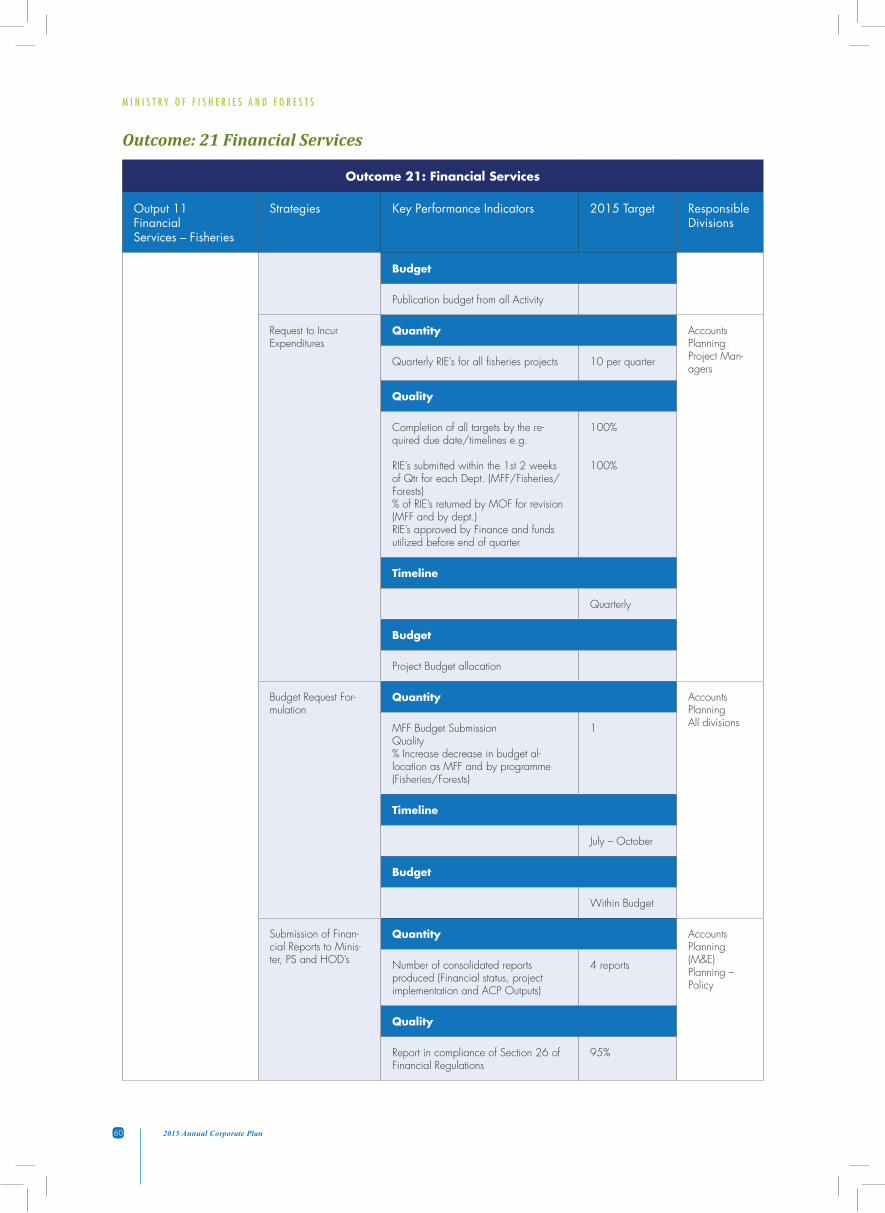
M I N I S T R Y O F F I S H E R I E S A N D F O R E S T S
60 2015 Annual Corporate Plan
Outcome 21: Financial Services
Output 11Financial Services – Fisheries
Strategies Key Performance Indicators 2015 Target Responsible Divisions
Budget
Publication budget from all Activity
Request to Incur Expenditures
Quantity Accounts Planning Project Man-agers
Quarterly RIE’s for all fisheries projects 10 per quarter
Quality
Completion of all targets by the re-quired due date/timelines e.g.
RIE’s submitted within the 1st 2 weeks of Qtr for each Dept. (MFF/Fisheries/Forests)% of RIE’s returned by MOF for revision (MFF and by dept.)RIE’s approved by Finance and funds utilized before end of quarter
100%
100%
Timeline
Quarterly
Budget
Project Budget allocation
Budget Request For-mulation
Quantity Accounts Planning All divisions MFF Budget Submission
Quality % Increase decrease in budget al-location as MFF and by programme (Fisheries/Forests)
1
Timeline
July – October
Budget
Within Budget
Submission of Finan-cial Reports to Minis-ter, PS and HOD’s
Quantity Accounts Planning (M&E) Planning – Policy
Number of consolidated reports produced (Financial status, project implementation and ACP Outputs)
4 reports
Quality
Report in compliance of Section 26 of Financial Regulations
95%
Outcome: 21 Financial Services
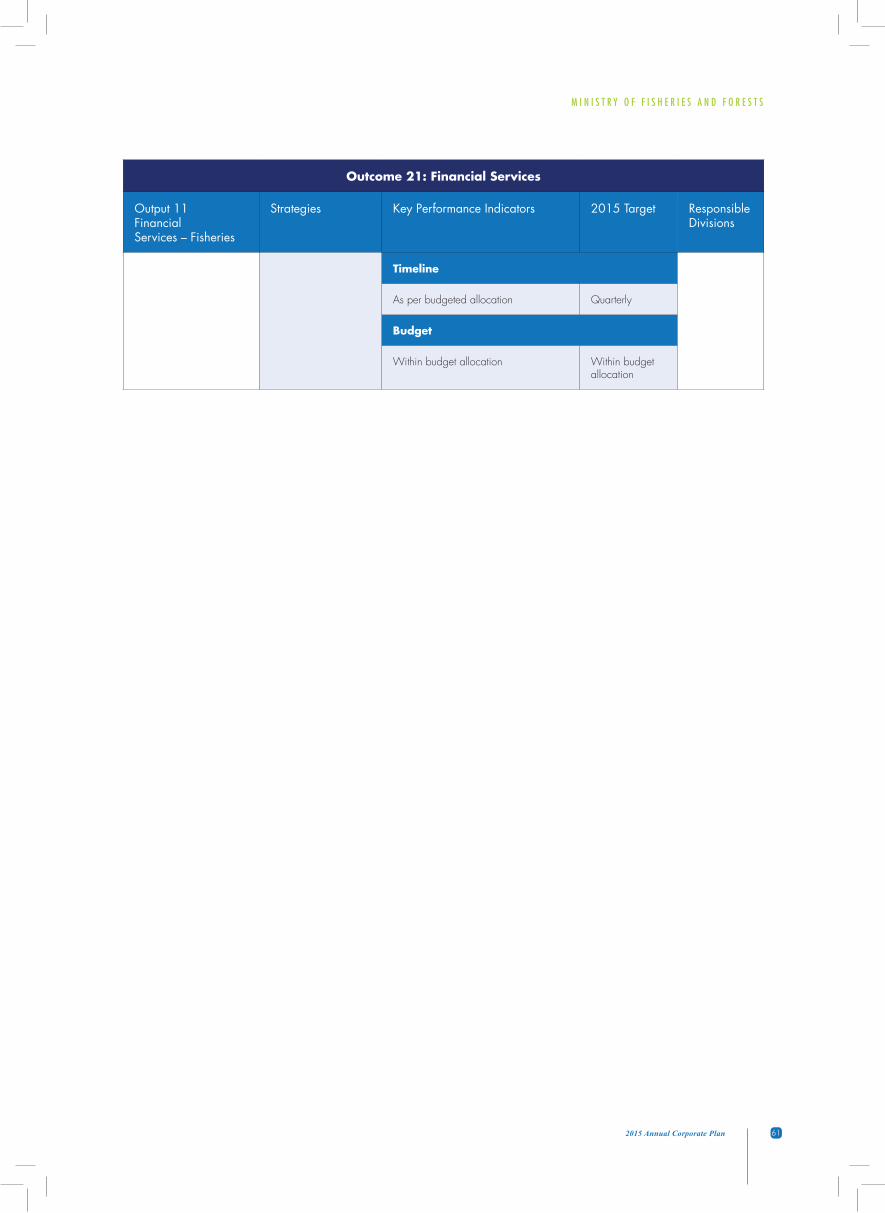
M I N I S T R Y O F F I S H E R I E S A N D F O R E S T S
612015 Annual Corporate Plan
Outcome 21: Financial Services
Output 11Financial Services – Fisheries
Strategies Key Performance Indicators 2015 Target Responsible Divisions
Timeline
As per budgeted allocation Quarterly
Budget
Within budget allocation Within budget allocation

M I N I S T R Y O F F I S H E R I E S A N D F O R E S T S
62 2015 Annual Corporate Plan
TABLE 3 O U T P U T S P E C I F I C AT I O N F O R E S T RY D E PA RT M E N T
OUTCOME 6 – PUBLIC SECTOR REFORM
To improve Public Sector efficiency & effectiveness and Improve delivery
Output 1: Portfolio Leadership, Policy Advice and Secretariat Support
Output Strategies Key Performance Indicators (KPI)
2015Targets
Responsible Division
Sub Output 1.1Facilitate informed decision Making
Provide necessary Policy advice to the Minister and Permanent Secretary of fisheries and forest
Quantity HQ, Planning All Division Heads
Endorsement of Cabinet Papers by the Minister
Adoption of monthly briefing papers prepared for the Minister
Number of Policy Analysis Briefs prepared for the Minister
Speeches & parliament responses drafted for the Minister
6
12
6
12
Quality
Papers/Briefings provided to theMinister that are rated satisfac-tory or better.
90%
Timeliness
Policy papers to be produced within the timeframe requested by the Minister
Jan- Dec
Cost-Financial Budget
Completion of work program within the Budget allocation at 1
Activity 112 Staff Equivalent
Output 1.2Portfolio Leadership and Secretarial Support
Stakeholder partnership, collaboration and coordination
Quantity HQ, Planning All Division Heads
Number of updates/paper sub-mitted to the Forestry Board
3 updates
Quality
Meeting resolutions identified and addressed Board approval for papers submitted
85%
90%
Timeline
quarterly Forum Meetings Bi Monthly Board meetings
Jan- Dec
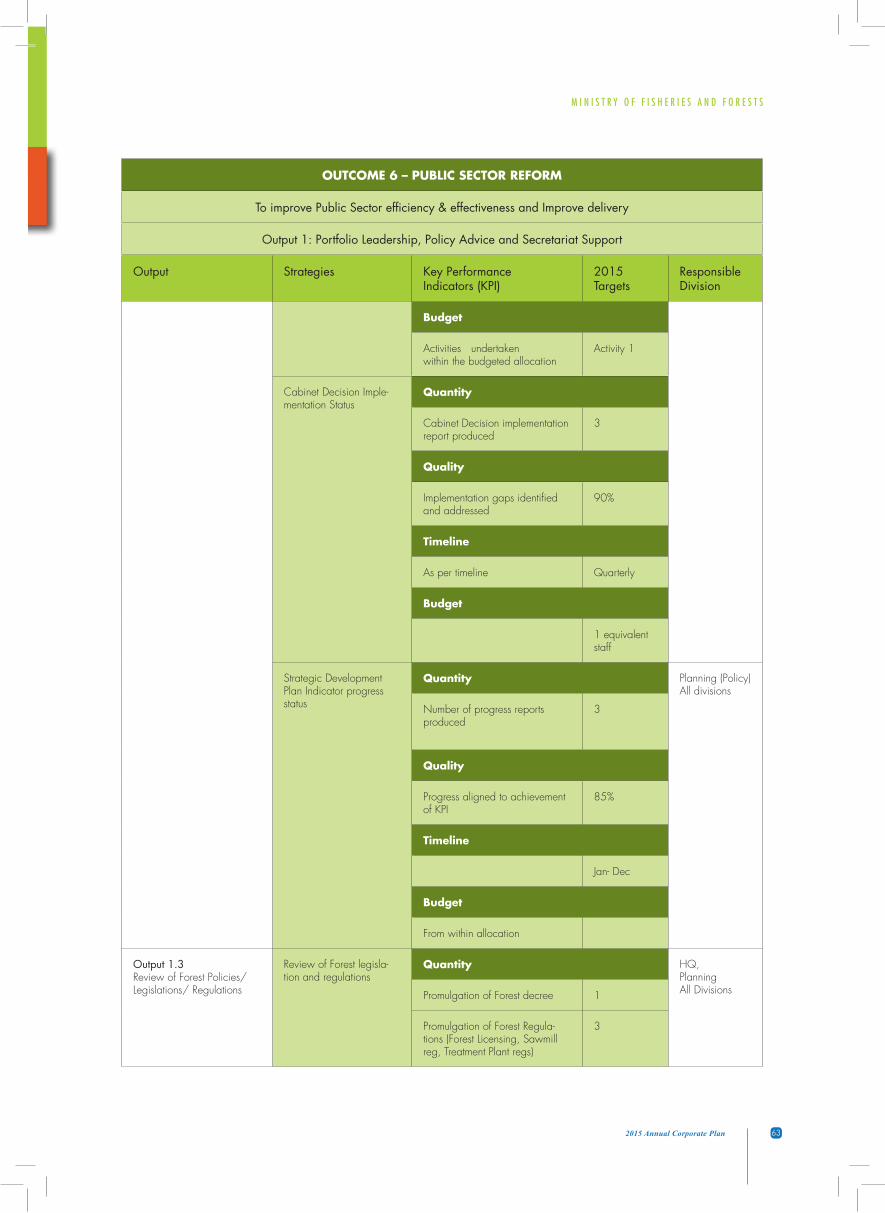
M I N I S T R Y O F F I S H E R I E S A N D F O R E S T S
632015 Annual Corporate Plan
OUTCOME 6 – PUBLIC SECTOR REFORM
To improve Public Sector efficiency & effectiveness and Improve delivery
Output 1: Portfolio Leadership, Policy Advice and Secretariat Support
Output Strategies Key Performance Indicators (KPI)
2015Targets
Responsible Division
Budget
Activities undertaken within the budgeted allocation
Activity 1
Cabinet Decision Imple-mentation Status
Quantity
Cabinet Decision implementation report produced
3
Quality
Implementation gaps identified and addressed
90%
Timeline
As per timeline Quarterly
Budget
1 equivalent staff
Strategic Development Plan Indicator progress status
Quantity Planning (Policy) All divisions
Number of progress reports produced
3
Quality
Progress aligned to achievement of KPI
85%
Timeline
Jan- Dec
Budget
From within allocation
Output 1.3 Review of Forest Policies/Legislations/ Regulations
Review of Forest legisla-tion and regulations
Quantity HQ, Planning All Divisions Promulgation of Forest decree 1
Promulgation of Forest Regula-tions (Forest Licensing, Sawmill reg, Treatment Plant regs)
3
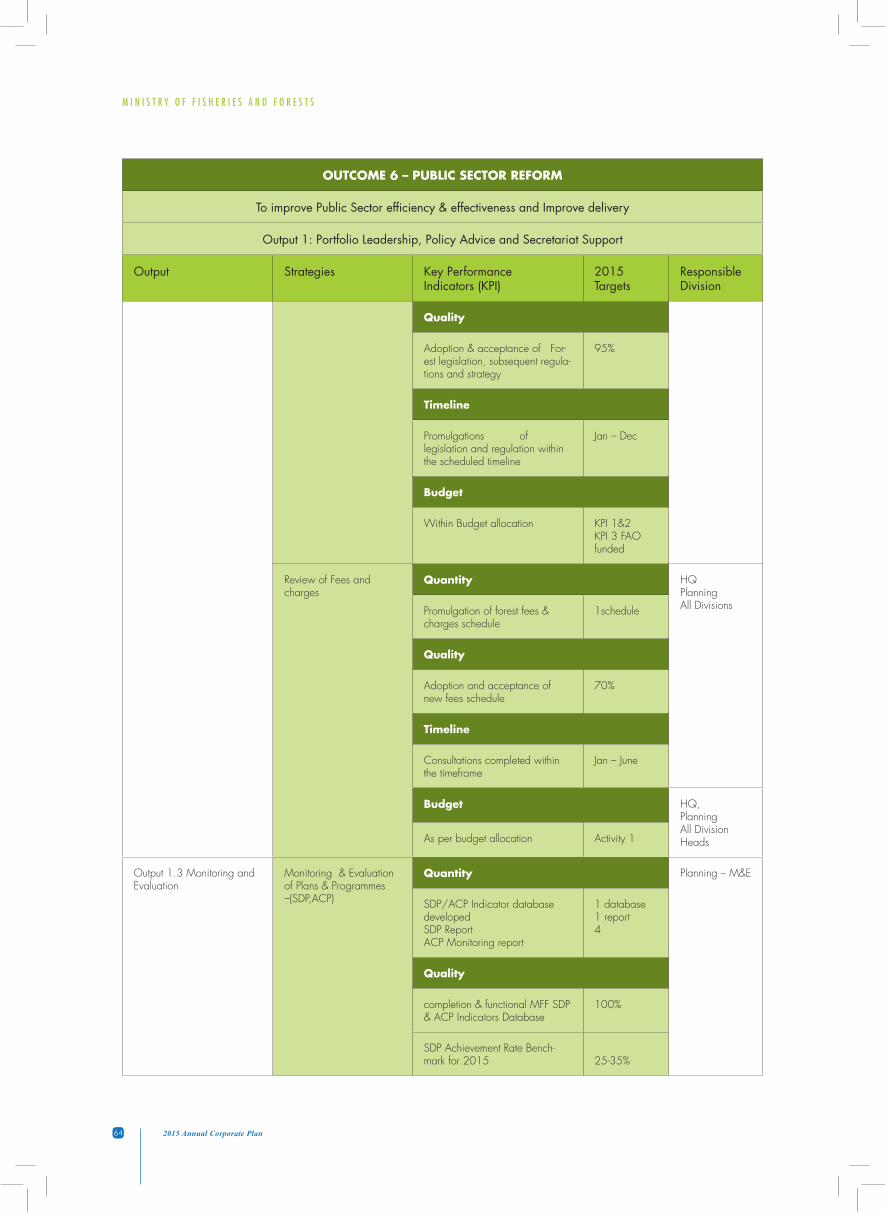
M I N I S T R Y O F F I S H E R I E S A N D F O R E S T S
64 2015 Annual Corporate Plan
OUTCOME 6 – PUBLIC SECTOR REFORM
To improve Public Sector efficiency & effectiveness and Improve delivery
Output 1: Portfolio Leadership, Policy Advice and Secretariat Support
Output Strategies Key Performance Indicators (KPI)
2015Targets
Responsible Division
Quality
Adoption & acceptance of For-est legislation, subsequent regula-tions and strategy
95%
Timeline
Promulgations of legislation and regulation within the scheduled timeline
Jan – Dec
Budget
Within Budget allocation KPI 1&2KPI 3 FAO funded
Review of Fees and charges
Quantity HQ Planning All Divisions Promulgation of forest fees &
charges schedule1schedule
Quality
Adoption and acceptance of new fees schedule
70%
Timeline
Consultations completed within the timeframe
Jan – June
Budget HQ, Planning All Division HeadsAs per budget allocation Activity 1
Output 1.3 Monitoring and Evaluation
Monitoring & Evaluation of Plans & Programmes –(SDP,ACP)
Quantity Planning – M&E
SDP/ACP Indicator database developedSDP Report ACP Monitoring report
1 database 1 report 4
Quality
completion & functional MFF SDP & ACP Indicators Database
100%
SDP Achievement Rate Bench-mark for 2015 25-35%
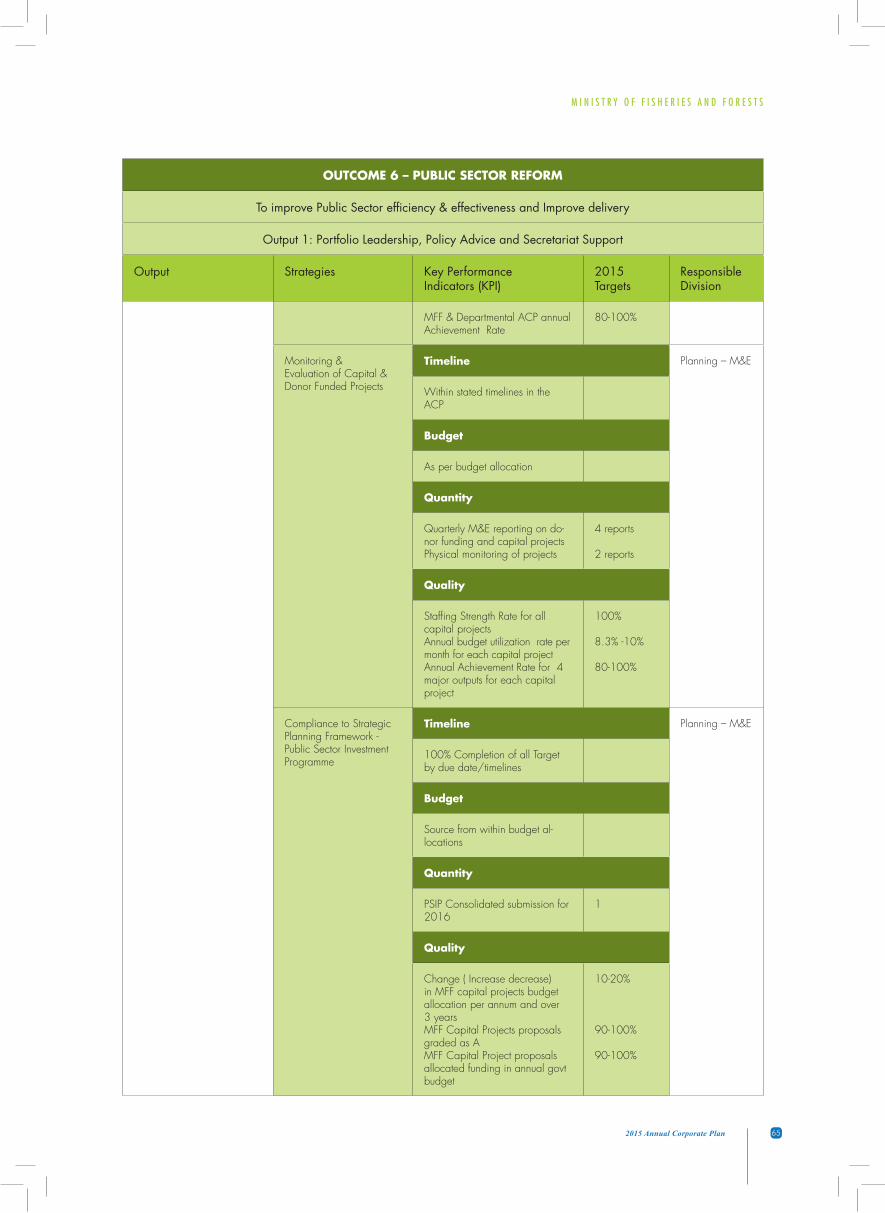
M I N I S T R Y O F F I S H E R I E S A N D F O R E S T S
652015 Annual Corporate Plan
OUTCOME 6 – PUBLIC SECTOR REFORM
To improve Public Sector efficiency & effectiveness and Improve delivery
Output 1: Portfolio Leadership, Policy Advice and Secretariat Support
Output Strategies Key Performance Indicators (KPI)
2015Targets
Responsible Division
MFF & Departmental ACP annual Achievement Rate
80-100%
Monitoring & Evaluation of Capital & Donor Funded Projects
Timeline Planning – M&E
Within stated timelines in the ACP
Budget
As per budget allocation
Quantity
Quarterly M&E reporting on do-nor funding and capital projects Physical monitoring of projects
4 reports
2 reports
Quality
Staffing Strength Rate for all capital projects Annual budget utilization rate per month for each capital projectAnnual Achievement Rate for 4 major outputs for each capital project
100%
8.3% -10%
80-100%
Compliance to Strategic Planning Framework - Public Sector Investment Programme
Timeline Planning – M&E
100% Completion of all Target by due date/timelines
Budget
Source from within budget al-locations
Quantity
PSIP Consolidated submission for 2016
1
Quality
Change ( Increase decrease) in MFF capital projects budget allocation per annum and over 3 yearsMFF Capital Projects proposals graded as AMFF Capital Project proposals allocated funding in annual govt budget
10-20%
90-100%
90-100%

M I N I S T R Y O F F I S H E R I E S A N D F O R E S T S
66 2015 Annual Corporate Plan
OUTCOME 6 – PUBLIC SECTOR REFORM
To improve Public Sector efficiency & effectiveness and Improve delivery
Output 1: Portfolio Leadership, Policy Advice and Secretariat Support
Output Strategies Key Performance Indicators (KPI)
2015Targets
Responsible Division
Timeline
100% Completion of all Target by due date/timelines
Output 1.7 Strengthen IT Connectiv-ity and ICT infrastructure upgrading
ICT infrastructure upgrad-ing
Quantity Planning (IT Unit)
Number of upgrading reports produced
3
Quality
Improved communications 90%
Timeline
As per ICT project work-plan Quarterly Refer to work-plan
Budget
As per budget allocation $119,000 Oexp$653,000 Capital (with ITC)
Website Development Quantity
Website fully developed and launched
1
Quality
Stakeholders accessibility to website
60%
Timeline
Quarter 1
Budget
From within budget allocation 3 staff equivalent
Sub Output 2.1Undertake Applied Silvicul-ture Research for Resource Development
Research into Silviculture practices of native and exotic tree species
Quantity CFDCFS, SRD
Periodical reports on 6 native and exotic tree species
6
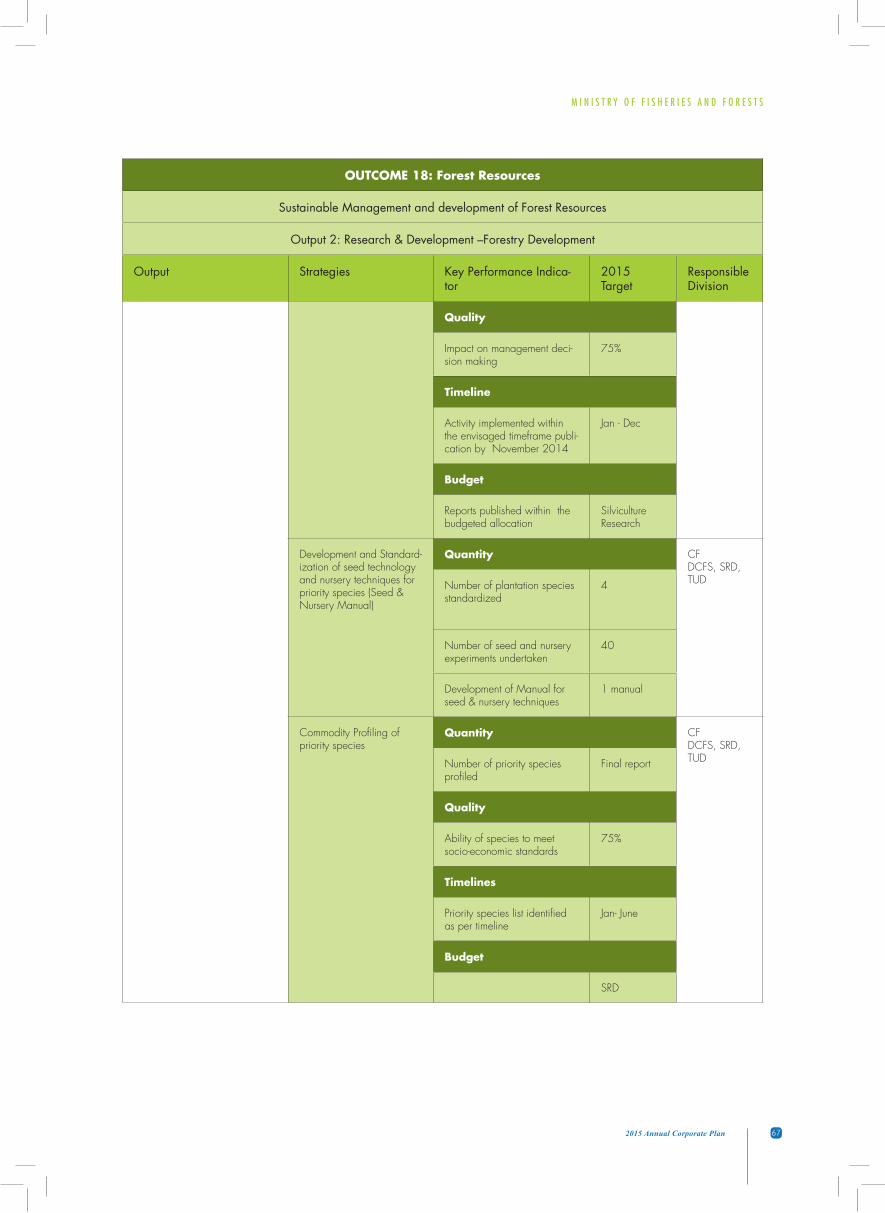
M I N I S T R Y O F F I S H E R I E S A N D F O R E S T S
672015 Annual Corporate Plan
OUTCOME 18: Forest Resources
Sustainable Management and development of Forest Resources
Output 2: Research & Development –Forestry Development
Output Strategies Key Performance Indica-tor
2015 Target
Responsible Division
Quality
Impact on management deci-sion making
75%
Timeline
Activity implemented within the envisaged timeframe publi-cation by November 2014
Jan - Dec
Budget
Reports published within the budgeted allocation
Silviculture Research
Development and Standard-ization of seed technology and nursery techniques for priority species (Seed & Nursery Manual)
Quantity CFDCFS, SRD, TUDNumber of plantation species
standardized4
Number of seed and nursery experiments undertaken
40
Development of Manual for seed & nursery techniques
1 manual
Commodity Profiling of priority species
Quantity CFDCFS, SRD, TUDNumber of priority species
profiledFinal report
Quality
Ability of species to meet socio-economic standards
75%
Timelines
Priority species list identified as per timeline
Jan- June
Budget
SRD

M I N I S T R Y O F F I S H E R I E S A N D F O R E S T S
68 2015 Annual Corporate Plan
OUTCOME 18: Forest Resources
Sustainable Management and development of Forest Resources
Output 2: Research & Development –Forestry Development
Output Strategies Key Performance Indica-tor
2015 Target
Responsible Division
Sandalwood Clonal Seed Orchard (CSO) & Gene Conservation Area (GCA)
Quantity CFDCFS, SRD
Number of base popula-tion, seed trees, and sites established
40 base population & 200 grafted trees replicated in 2 sites
Number of seed and nursery experiments undertaken
4
Development of Manual for seed & nursery techniques
2 manual
Quality
Information on seed and nurs-ery techniques for the public readily available
75%
Timelines
Activity implemented within the envisaged timeframe by November 2015
Jan - Dec
Budget
SRD
Forest Health Monitoring & Surveillance
Quantity CFDCFS, SRD
Number of status reports produced
4
Forest pest list manual compiled
1 list
Quality
Enhance monitoring of forest health status
80%
Timeline
Jan- Dec
Budget
SRD
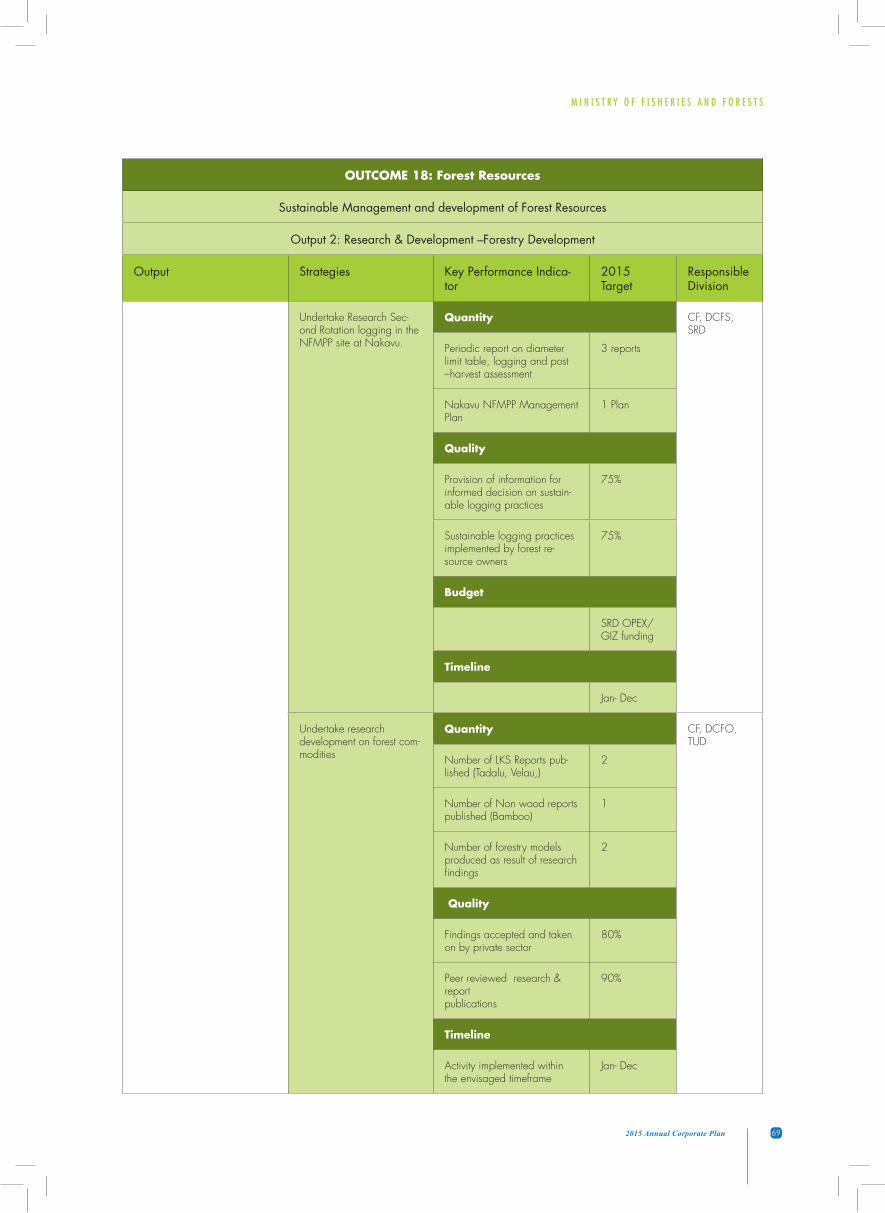
M I N I S T R Y O F F I S H E R I E S A N D F O R E S T S
692015 Annual Corporate Plan
OUTCOME 18: Forest Resources
Sustainable Management and development of Forest Resources
Output 2: Research & Development –Forestry Development
Output Strategies Key Performance Indica-tor
2015 Target
Responsible Division
Undertake Research Sec-ond Rotation logging in the NFMPP site at Nakavu.
Quantity CF, DCFS, SRD
Periodic report on diameter limit table, logging and post –harvest assessment
3 reports
Nakavu NFMPP Management Plan
1 Plan
Quality
Provision of information for informed decision on sustain-able logging practices
75%
Sustainable logging practices implemented by forest re-source owners
75%
Budget
SRD OPEX/GIZ funding
Timeline
Jan- Dec
Undertake research development on forest com-modities
Quantity CF, DCFO, TUD
Number of LKS Reports pub-lished (Tadalu, Velau,)
2
Number of Non wood reports published (Bamboo)
1
Number of forestry models produced as result of research findings
2
Quality
Findings accepted and taken on by private sector
80%
Peer reviewed research & report publications
90%
Timeline
Activity implemented within the envisaged timeframe
Jan- Dec
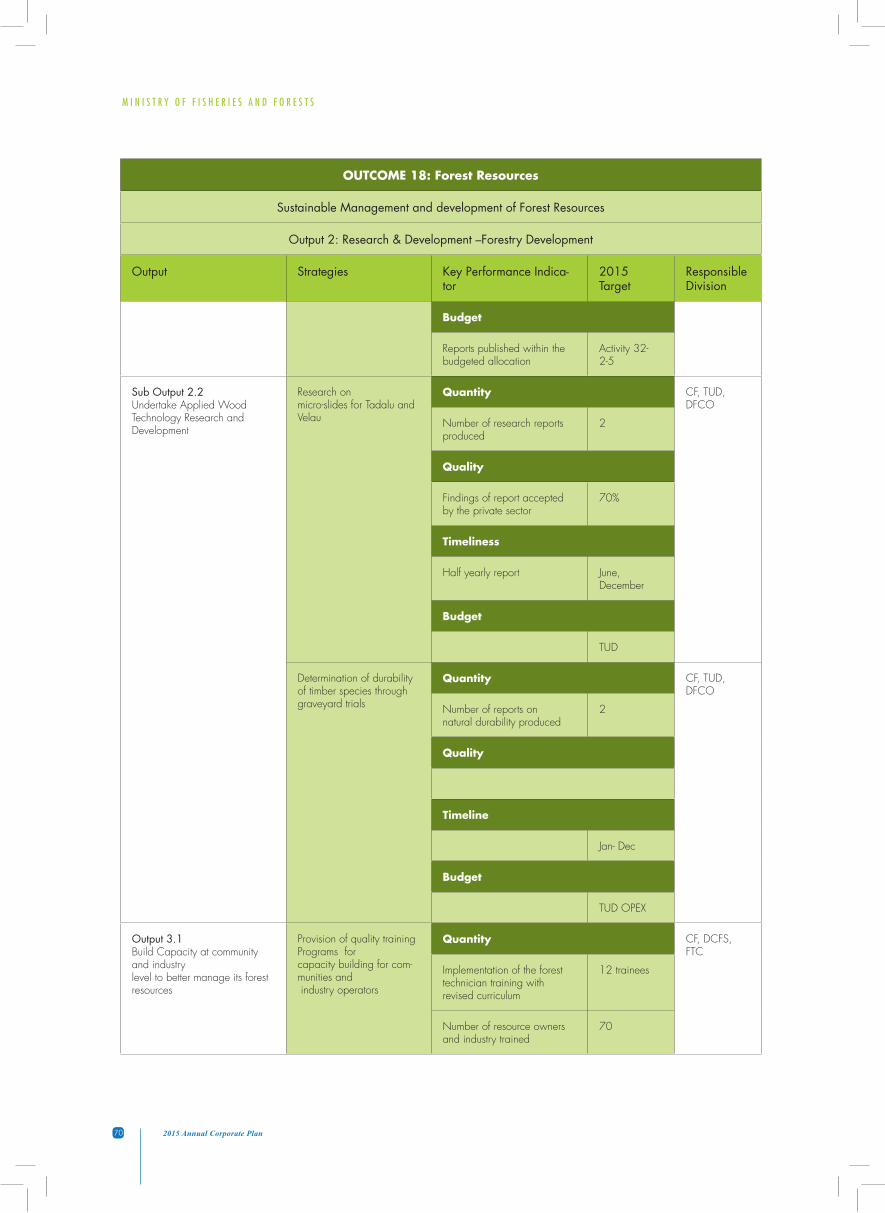
M I N I S T R Y O F F I S H E R I E S A N D F O R E S T S
70 2015 Annual Corporate Plan
OUTCOME 18: Forest Resources
Sustainable Management and development of Forest Resources
Output 2: Research & Development –Forestry Development
Output Strategies Key Performance Indica-tor
2015 Target
Responsible Division
Budget
Reports published within the budgeted allocation
Activity 32-2-5
Sub Output 2.2Undertake Applied Wood Technology Research and Development
Research on micro-slides for Tadalu and Velau
Quantity CF, TUD, DFCO
Number of research reports produced
2
Quality
Findings of report accepted by the private sector
70%
Timeliness
Half yearly report June, December
Budget
TUD
Determination of durability of timber species through graveyard trials
Quantity CF, TUD, DFCO
Number of reports on natural durability produced
2
Quality
Timeline
Jan- Dec
Budget
TUD OPEX
Output 3.1 Build Capacity at community and industry level to better manage its forest resources
Provision of quality training Programs for capacity building for com-munities and industry operators
Quantity CF, DCFS, FTC
Implementation of the forest technician training with revised curriculum
12 trainees
Number of resource owners and industry trained
70
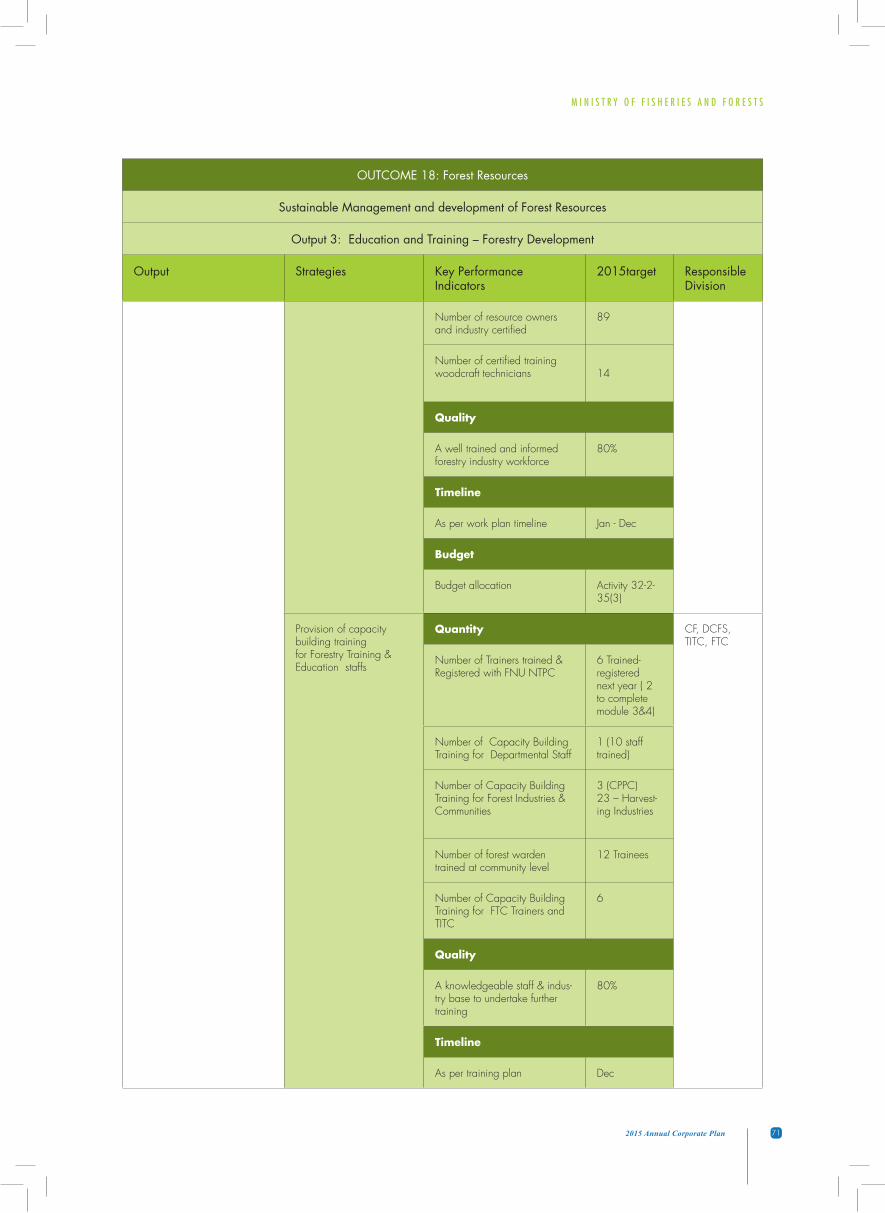
M I N I S T R Y O F F I S H E R I E S A N D F O R E S T S
712015 Annual Corporate Plan
OUTCOME 18: Forest Resources
Sustainable Management and development of Forest Resources
Output 3: Education and Training – Forestry Development
Output Strategies Key Performance Indicators
2015target Responsible Division
Number of resource owners and industry certified
89
Number of certified training woodcraft technicians 14
Quality
A well trained and informed forestry industry workforce
80%
Timeline
As per work plan timeline Jan - Dec
Budget
Budget allocation Activity 32-2-35(3)
Provision of capacity building trainingfor Forestry Training & Education staffs
Quantity CF, DCFS, TITC, FTC
Number of Trainers trained & Registered with FNU NTPC
6 Trained-registered next year ( 2 to complete module 3&4)
Number of Capacity Building Training for Departmental Staff
1 (10 staff trained)
Number of Capacity Building Training for Forest Industries & Communities
3 (CPPC)23 – Harvest-ing Industries
Number of forest warden trained at community level
12 Trainees
Number of Capacity Building Training for FTC Trainers and TITC
6
Quality
A knowledgeable staff & indus-try base to undertake further training
80%
Timeline
As per training plan Dec
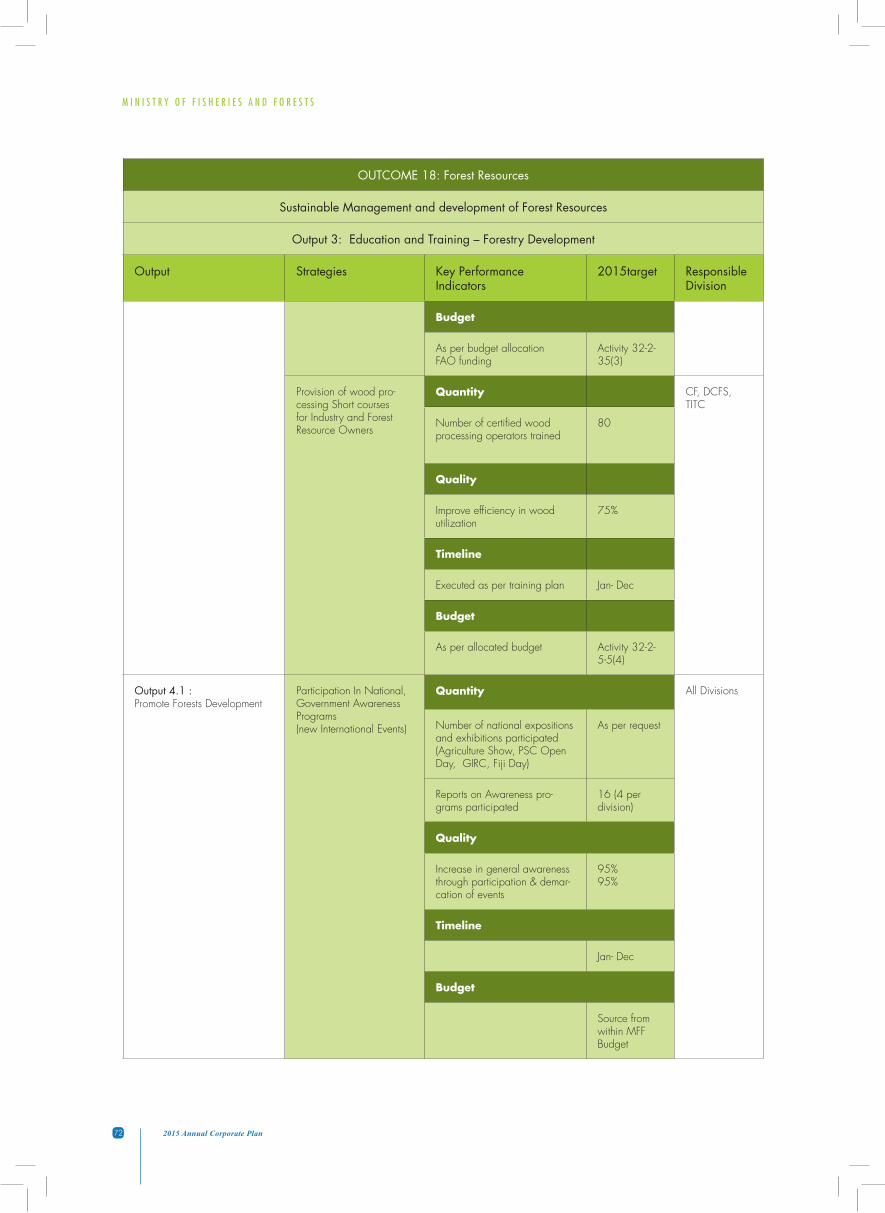
M I N I S T R Y O F F I S H E R I E S A N D F O R E S T S
72 2015 Annual Corporate Plan
OUTCOME 18: Forest Resources
Sustainable Management and development of Forest Resources
Output 3: Education and Training – Forestry Development
Output Strategies Key Performance Indicators
2015target Responsible Division
Budget
As per budget allocation FAO funding
Activity 32-2-35(3)
Provision of wood pro-cessing Short courses for Industry and Forest Resource Owners
Quantity CF, DCFS, TITC
Number of certified wood processing operators trained
80
Quality
Improve efficiency in wood utilization
75%
Timeline
Executed as per training plan Jan- Dec
Budget
As per allocated budget Activity 32-2-5-5(4)
Output 4.1 :Promote Forests Development
Participation In National,Government Awareness Programs(new International Events)
Quantity All Divisions
Number of national expositions and exhibitions participated(Agriculture Show, PSC Open Day, GIRC, Fiji Day)
As per request
Reports on Awareness pro-grams participated
16 (4 per division)
Quality
Increase in general awareness through participation & demar-cation of events
95%95%
Timeline
Jan- Dec
Budget
Source from within MFF Budget
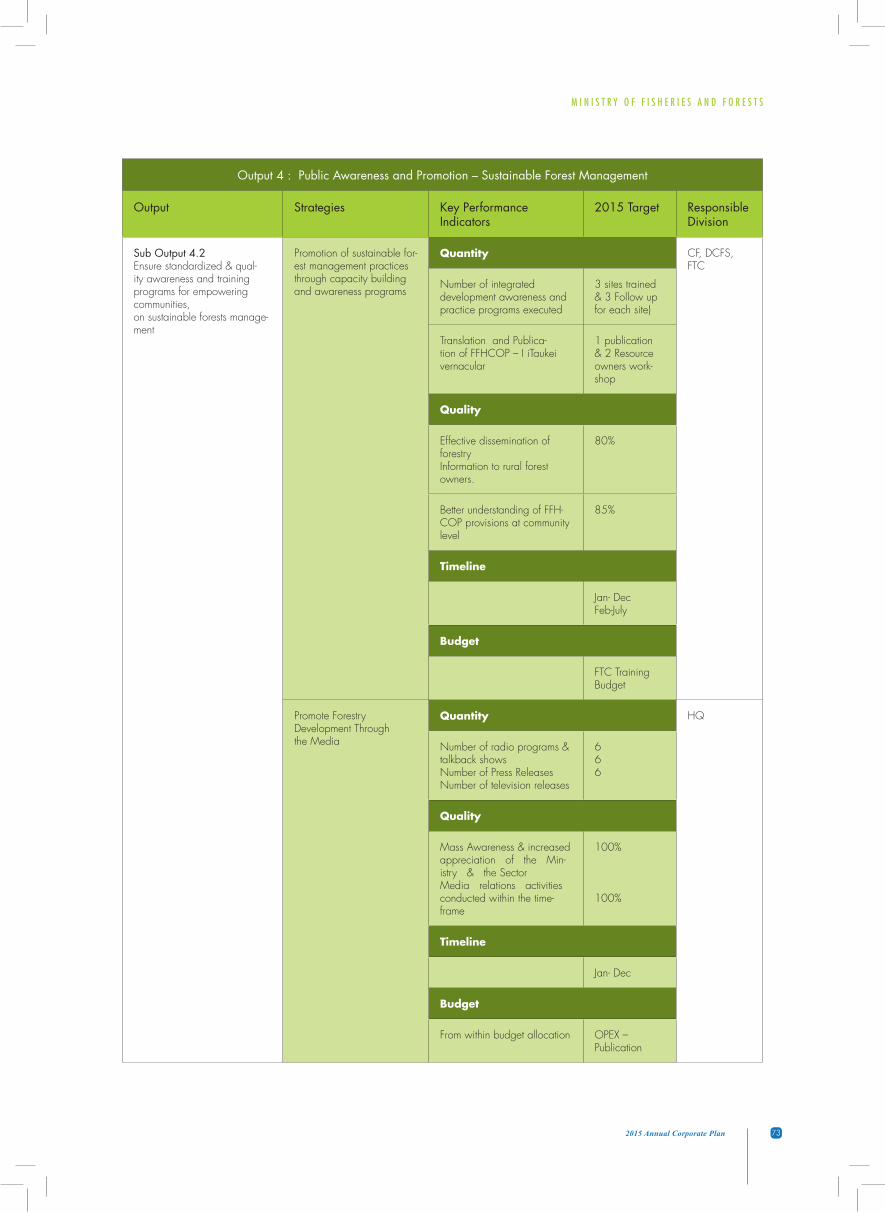
M I N I S T R Y O F F I S H E R I E S A N D F O R E S T S
732015 Annual Corporate Plan
Output 4 : Public Awareness and Promotion – Sustainable Forest Management
Output Strategies Key Performance Indicators
2015 Target Responsible Division
Sub Output 4.2Ensure standardized & qual-ity awareness and training programs for empowering communities, on sustainable forests manage-ment
Promotion of sustainable for-est management practices through capacity building and awareness programs
Quantity CF, DCFS, FTC
Number of integrated development awareness and practice programs executed
3 sites trained & 3 Follow up for each site)
Translation and Publica-tion of FFHCOP – I iTaukei vernacular
1 publication & 2 Resource owners work-shop
Quality
Effective dissemination of forestryInformation to rural forest owners.
80%
Better understanding of FFH-COP provisions at community level
85%
Timeline
Jan- DecFeb-July
Budget
FTC Training Budget
Promote Forestry Development Through the Media
Quantity HQ
Number of radio programs & talkback showsNumber of Press ReleasesNumber of television releases
666
Quality
Mass Awareness & increasedappreciation of the Min-istry & the Sector Media relations activities conducted within the time-frame
100%
100%
Timeline
Jan- Dec
Budget
From within budget allocation OPEX – Publication
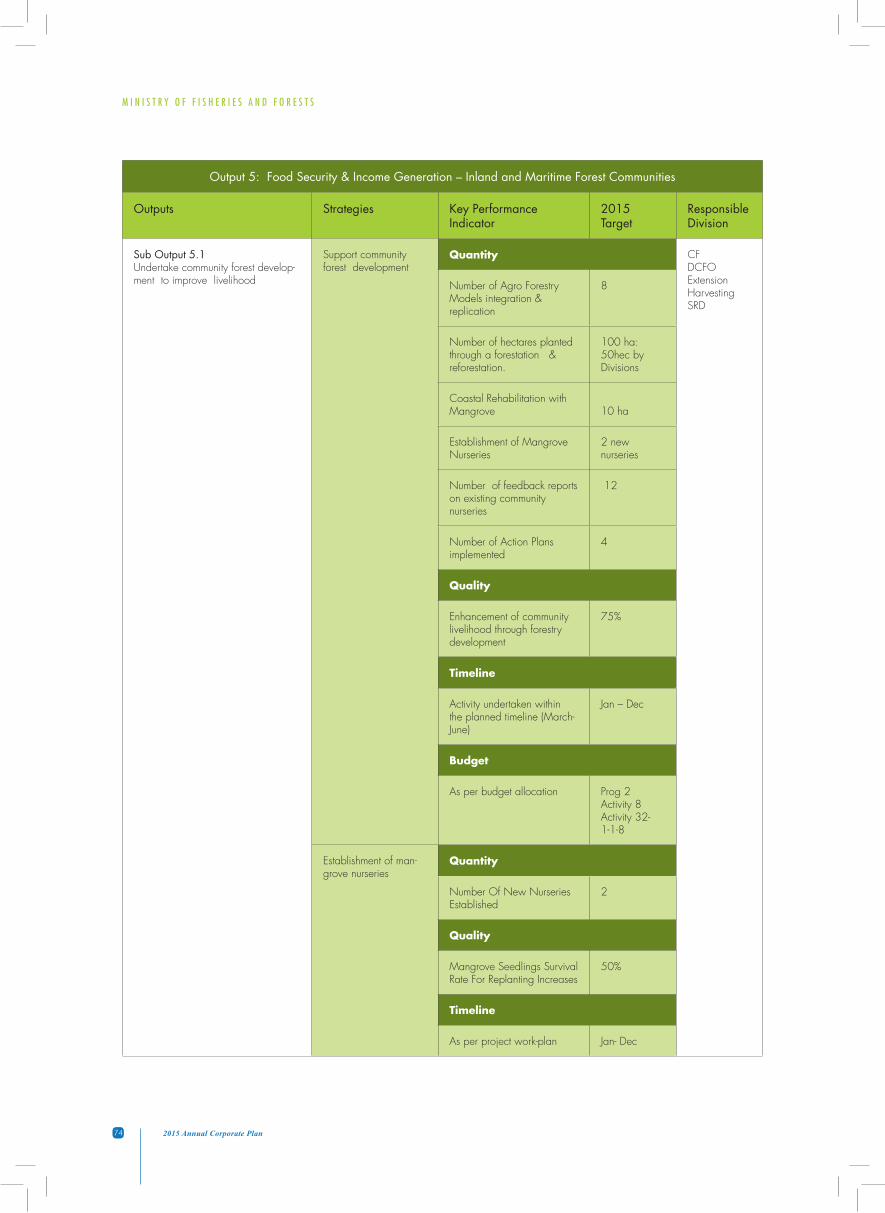
M I N I S T R Y O F F I S H E R I E S A N D F O R E S T S
74 2015 Annual Corporate Plan
Output 5: Food Security & Income Generation – Inland and Maritime Forest Communities
Outputs Strategies Key Performance Indicator
2015 Target
Responsible Division
Sub Output 5.1 Undertake community forest develop-ment to improve livelihood
Support community forest development
Quantity CFDCFOExtension Harvesting SRD
Number of Agro Forestry Models integration & replication
8
Number of hectares planted through a forestation & reforestation.
100 ha: 50hec by Divisions
Coastal Rehabilitation with Mangrove 10 ha
Establishment of Mangrove Nurseries
2 new nurseries
Number of feedback reports on existing community nurseries
12
Number of Action Plans implemented
4
Quality
Enhancement of community livelihood through forestry development
75%
Timeline
Activity undertaken within the planned timeline (March- June)
Jan – Dec
Budget
As per budget allocation Prog 2 Activity 8Activity 32-1-1-8
Establishment of man-grove nurseries
Quantity
Number Of New Nurseries Established
2
Quality
Mangrove Seedlings Survival Rate For Replanting Increases
50%
Timeline
As per project work-plan Jan- Dec
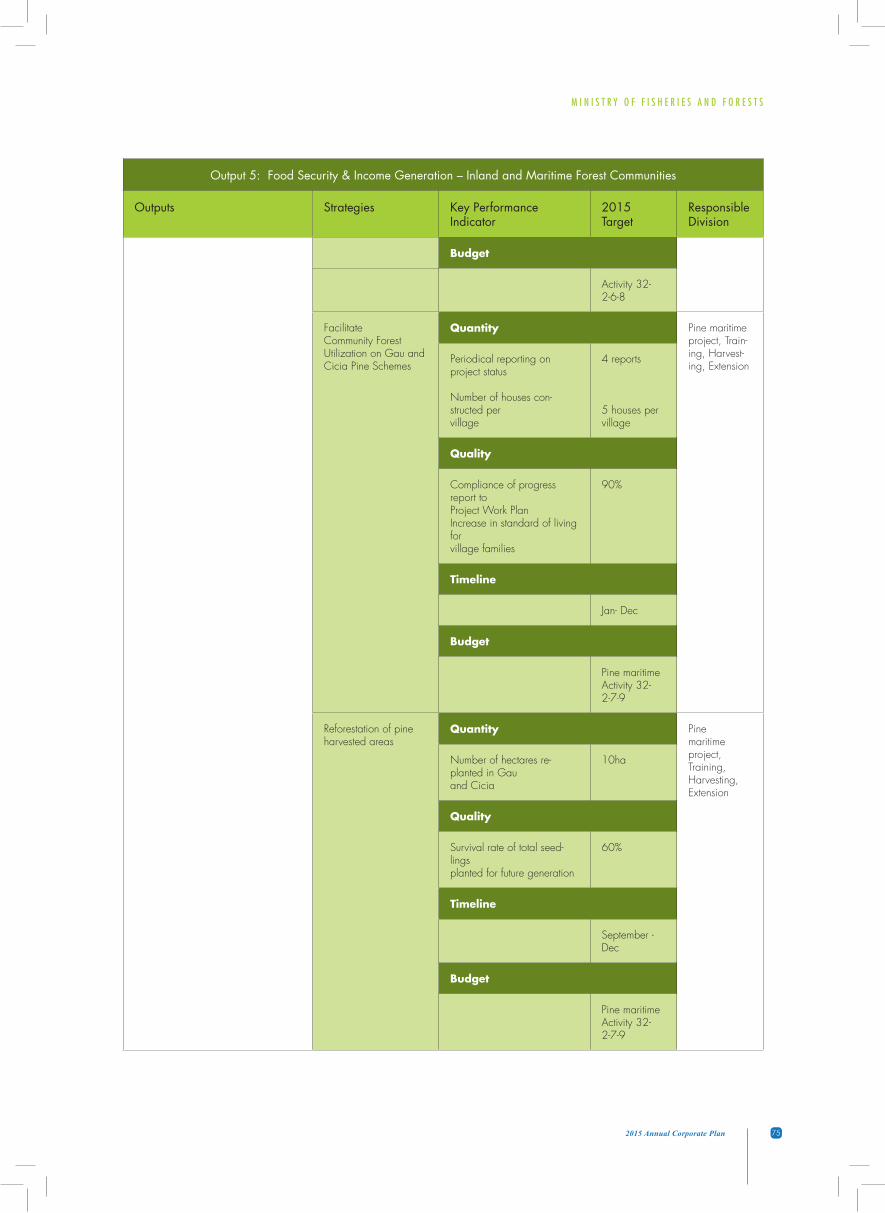
M I N I S T R Y O F F I S H E R I E S A N D F O R E S T S
752015 Annual Corporate Plan
Output 5: Food Security & Income Generation – Inland and Maritime Forest Communities
Outputs Strategies Key Performance Indicator
2015 Target
Responsible Division
Budget
Activity 32-2-6-8
Facilitate Community Forest Utilization on Gau and Cicia Pine Schemes
Quantity Pine maritime project, Train-ing, Harvest-ing, Extension
Periodical reporting on project status
Number of houses con-structed per village
4 reports
5 houses per village
Quality
Compliance of progress report to Project Work Plan Increase in standard of living for village families
90%
Timeline
Jan- Dec
Budget
Pine maritime Activity 32-2-7-9
Reforestation of pine harvested areas
Quantity Pine maritime project, Training, Harvesting, Extension
Number of hectares re-planted in Gau and Cicia
10ha
Quality
Survival rate of total seed-lings planted for future generation
60%
Timeline
September - Dec
Budget
Pine maritime Activity 32-2-7-9

M I N I S T R Y O F F I S H E R I E S A N D F O R E S T S
76 2015 Annual Corporate Plan
Output 5: Food Security & Income Generation – Inland and Maritime Forest Communities
Outputs Strategies Key Performance Indicator
2015 Target
Responsible Division
Sub Output 5.2 Promote Conservation of Natural Forests
Documentation of forest reserves
Quantity CFDCFOExtension Number of forest reserves
documented (Labiko, Saru, Naboro, Lololo)
4
Quality
Timely availability of statistics on forest and nature reserves
80%
Timeline
Jan - Dec
Budget
Extension OPEX
Establishment of Con-servation areas.
Quantity CFDCFOExtension Number of conservation ar-
eas established and reported (Delaikoro/Taveuni)
1 area reported
Quality
Availability of information on conservation areas estab-lished by the Department
60%
Timeline
Jan- Dec
Budget
Ext/GEF 4 PAS
Expansion of Forest Reserves
Quantity CFDCFOExtension
Expansion of Wabu ca 1
Quality
Forest area designated as forest reserves increase
20%
Timeline
Jan- Dec

M I N I S T R Y O F F I S H E R I E S A N D F O R E S T S
772015 Annual Corporate Plan
Output 5: Food Security & Income Generation – Inland and Maritime Forest Communities
Outputs Strategies Key Performance Indicator
2015 Target
Responsible Division
Budget
Extension OPEX
Output 5.3 Strengthen Forest Parks Marketability to improve its popularity.
Increase visitor arrivals to the CIS Forest Park
Quantity CFDCFOExtension
Increase in financial value $45,000
Quality
Customer satisfaction in-creased by 10% from 2014 base
Back to number 1
Timeline
Jan- Dec
Budget
Forest parks and Ext
Sub Output 5.4 Strengthen Community Eco Parks through infrastructure upgrading and development.
Upgrading of CIS For-est Parks.
Quantity CFDCFOExtension
Number of upgrading reports produced
4
Quality
Upgrading works meeting scope of works and contrac-tual agreement
90%
Timeline
Upgrading of CIS Park
Budget
Activity 32-2-8-8
Consolidate CIS Park networking - strength-ening with Resource owners & engaging existing markets
Quantity
Number of engagements done for promoting CIS Park through signing of MOU with Community and Tour operators
2
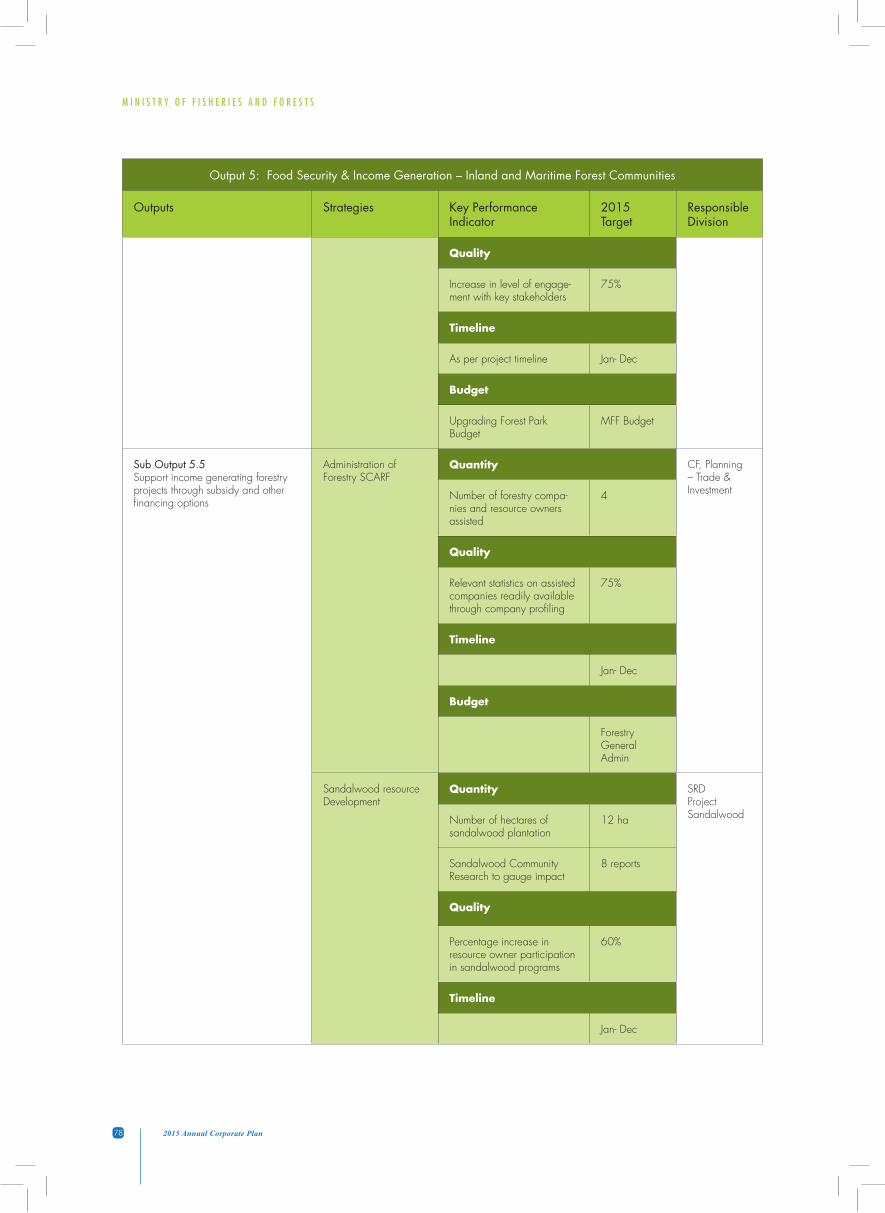
M I N I S T R Y O F F I S H E R I E S A N D F O R E S T S
78 2015 Annual Corporate Plan
Output 5: Food Security & Income Generation – Inland and Maritime Forest Communities
Outputs Strategies Key Performance Indicator
2015 Target
Responsible Division
Quality
Increase in level of engage-ment with key stakeholders
75%
Timeline
As per project timeline Jan- Dec
Budget
Upgrading Forest Park Budget
MFF Budget
Sub Output 5.5 Support income generating forestry projects through subsidy and other financing options
Administration of Forestry SCARF
Quantity CF, Planning – Trade & InvestmentNumber of forestry compa-
nies and resource owners assisted
4
Quality
Relevant statistics on assisted companies readily available through company profiling
75%
Timeline
Jan- Dec
Budget
Forestry General Admin
Sandalwood resource Development
Quantity SRD Project Sandalwood Number of hectares of
sandalwood plantation12 ha
Sandalwood Community Research to gauge impact
8 reports
Quality
Percentage increase in resource owner participation in sandalwood programs
60%
Timeline
Jan- Dec
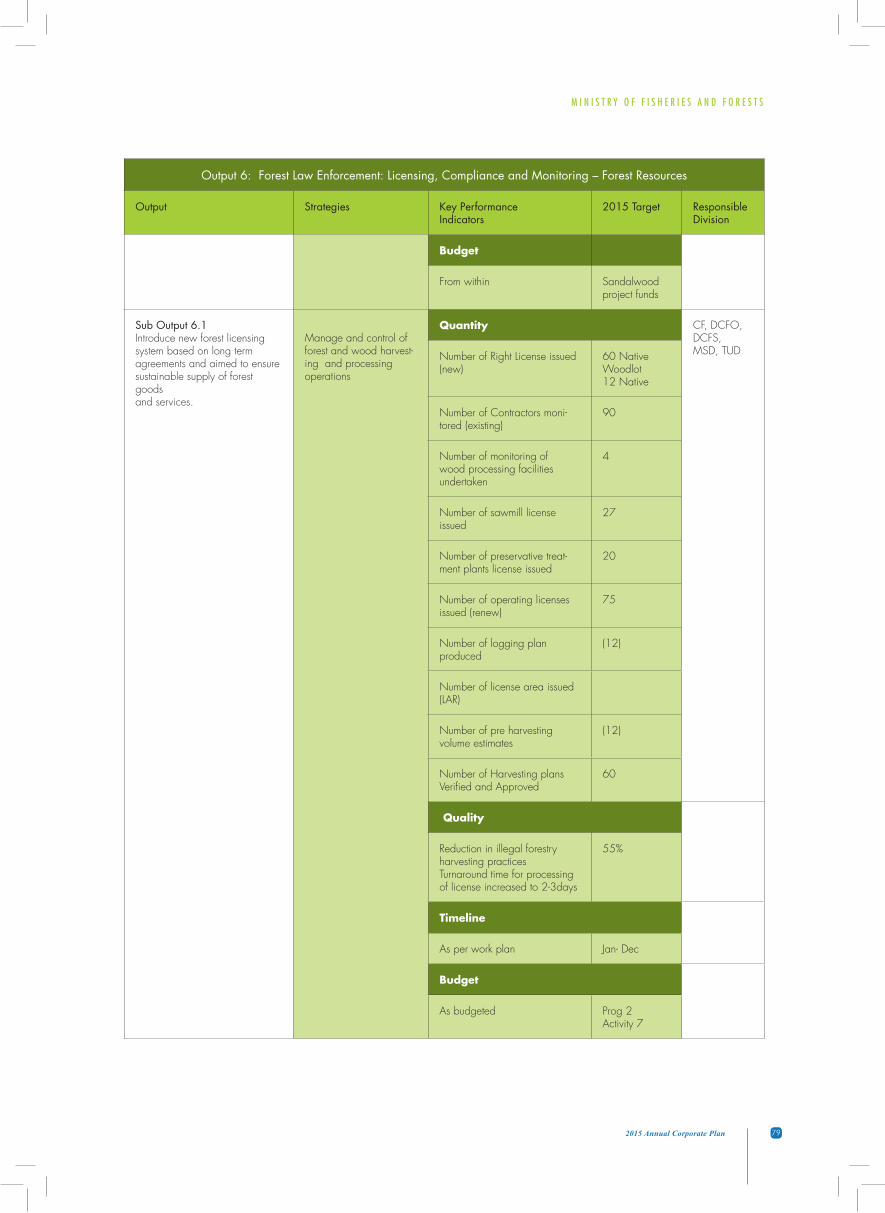
M I N I S T R Y O F F I S H E R I E S A N D F O R E S T S
792015 Annual Corporate Plan
Output 6: Forest Law Enforcement: Licensing, Compliance and Monitoring – Forest Resources
Output Strategies Key Performance Indicators
2015 Target Responsible Division
Budget
From within Sandalwood project funds
Sub Output 6.1Introduce new forest licensing system based on long term agreements and aimed to ensure sustainable supply of forest goods and services.
Manage and control of forest and wood harvest-ing and processing operations
Quantity CF, DCFO, DCFS, MSD, TUD Number of Right License issued
(new)60 Native Woodlot12 Native
Number of Contractors moni-tored (existing)
90
Number of monitoring of wood processing facilities undertaken
4
Number of sawmill license issued
27
Number of preservative treat-ment plants license issued
20
Number of operating licenses issued (renew)
75
Number of logging plan produced
(12)
Number of license area issued (LAR)
Number of pre harvesting volume estimates
(12)
Number of Harvesting plans Verified and Approved
60
Quality
Reduction in illegal forestry harvesting practices Turnaround time for processing of license increased to 2-3days
55%
Timeline
As per work plan Jan- Dec
Budget
As budgeted Prog 2 Activity 7
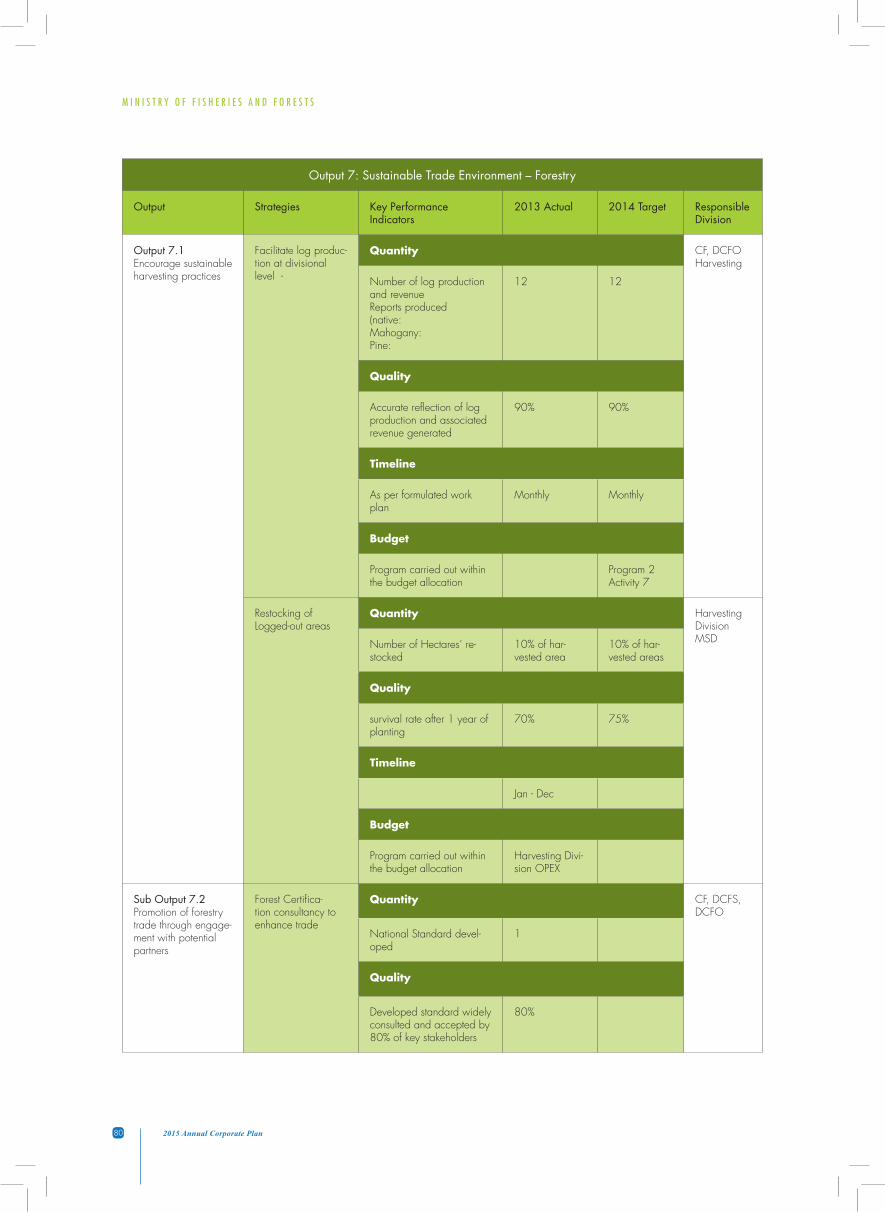
M I N I S T R Y O F F I S H E R I E S A N D F O R E S T S
80 2015 Annual Corporate Plan
Output 7: Sustainable Trade Environment – Forestry
Output Strategies Key Performance Indicators
2013 Actual 2014 Target Responsible Division
Output 7.1Encourage sustainable harvesting practices
Facilitate log produc-tion at divisional level -
Quantity CF, DCFO Harvesting
Number of log production and revenueReports produced(native: Mahogany: Pine:
12 12
Quality
Accurate reflection of log production and associated revenue generated
90% 90%
Timeline
As per formulated work plan
Monthly Monthly
Budget
Program carried out within the budget allocation
Program 2 Activity 7
Restocking of Logged-out areas
Quantity Harvesting DivisionMSD Number of Hectares’ re-
stocked10% of har-vested area
10% of har-vested areas
Quality
survival rate after 1 year of planting
70% 75%
Timeline
Jan - Dec
Budget
Program carried out within the budget allocation
Harvesting Divi-sion OPEX
Sub Output 7.2 Promotion of forestry trade through engage-ment with potential partners
Forest Certifica-tion consultancy to enhance trade
Quantity CF, DCFS, DCFO
National Standard devel-oped
1
Quality
Developed standard widely consulted and accepted by 80% of key stakeholders
80%
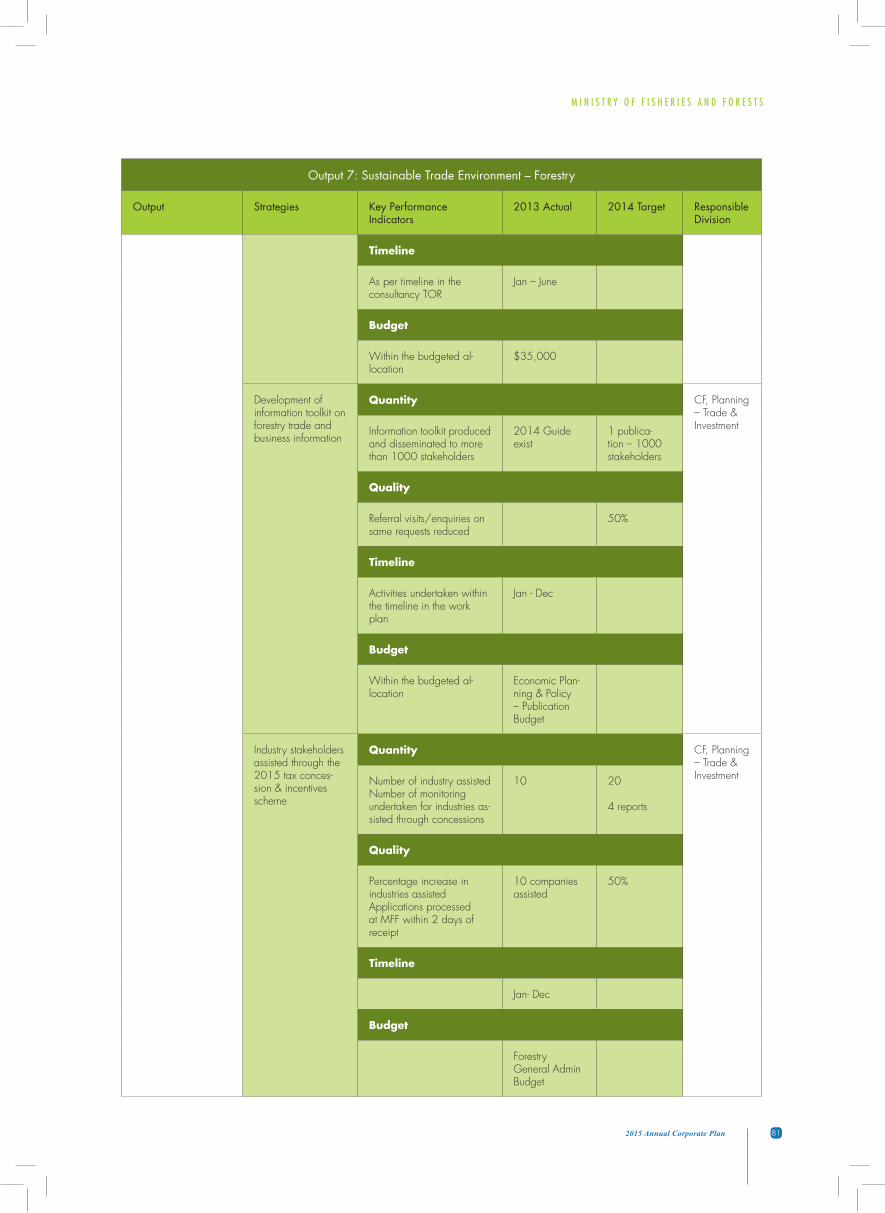
M I N I S T R Y O F F I S H E R I E S A N D F O R E S T S
812015 Annual Corporate Plan
Output 7: Sustainable Trade Environment – Forestry
Output Strategies Key Performance Indicators
2013 Actual 2014 Target Responsible Division
Timeline
As per timeline in the consultancy TOR
Jan – June
Budget
Within the budgeted al-location
$35,000
Development of information toolkit on forestry trade and business information
Quantity CF, Planning – Trade & Investment Information toolkit produced
and disseminated to more than 1000 stakeholders
2014 Guide exist
1 publica-tion – 1000 stakeholders
Quality
Referral visits/enquiries on same requests reduced
50%
Timeline
Activities undertaken within the timeline in the work plan
Jan - Dec
Budget
Within the budgeted al-location
Economic Plan-ning & Policy – Publication Budget
Industry stakeholders assisted through the 2015 tax conces-sion & incentives scheme
Quantity CF, Planning – Trade & Investment Number of industry assisted
Number of monitoring undertaken for industries as-sisted through concessions
10 20
4 reports
Quality
Percentage increase in industries assisted Applications processed at MFF within 2 days of receipt
10 companies assisted
50%
Timeline
Jan- Dec
Budget
Forestry General Admin Budget
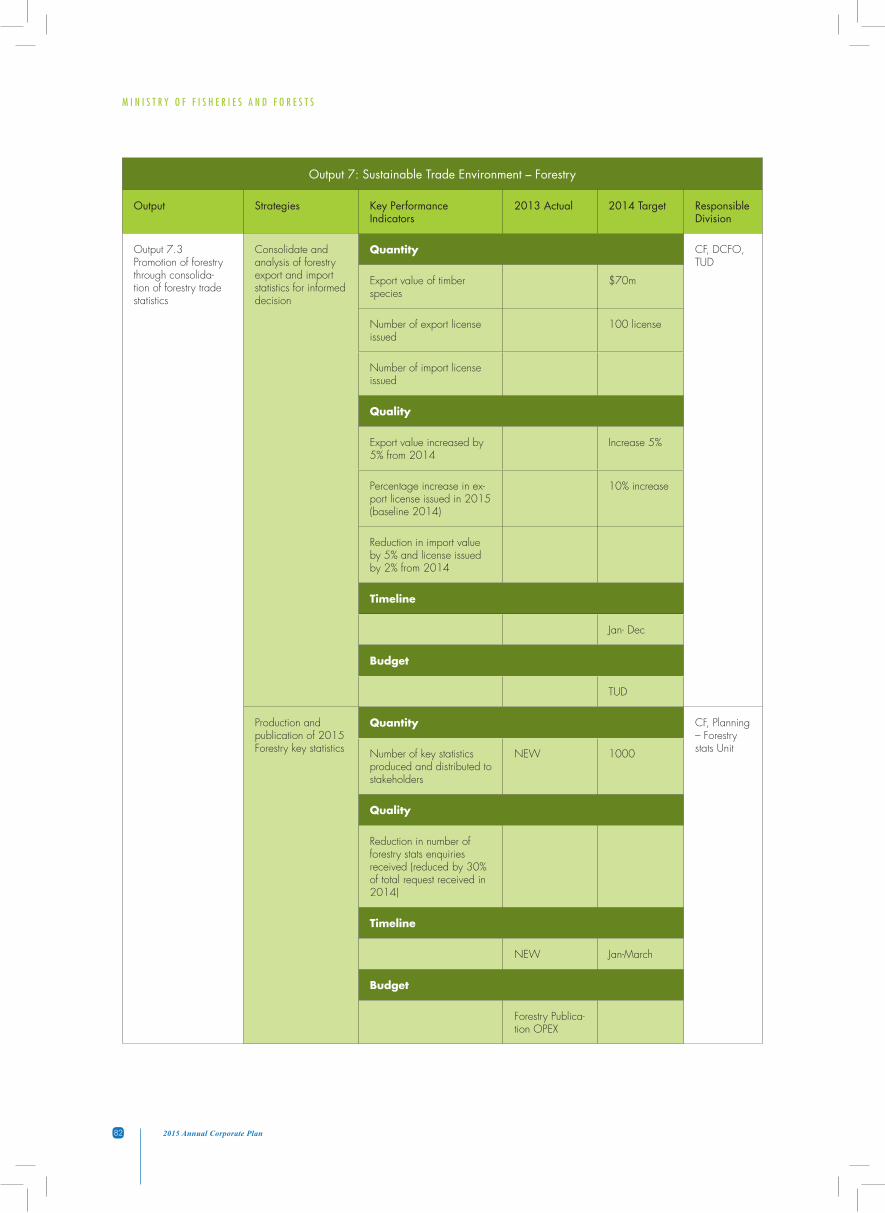
M I N I S T R Y O F F I S H E R I E S A N D F O R E S T S
82 2015 Annual Corporate Plan
Output 7: Sustainable Trade Environment – Forestry
Output Strategies Key Performance Indicators
2013 Actual 2014 Target Responsible Division
Output 7.3Promotion of forestry through consolida-tion of forestry trade statistics
Consolidate and analysis of forestry export and import statistics for informed decision
Quantity CF, DCFO, TUD
Export value of timber species
$70m
Number of export license issued
100 license
Number of import license issued
Quality
Export value increased by 5% from 2014
Increase 5%
Percentage increase in ex-port license issued in 2015 (baseline 2014)
10% increase
Reduction in import value by 5% and license issued by 2% from 2014
Timeline
Jan- Dec
Budget
TUD
Production and publication of 2015 Forestry key statistics
Quantity CF, Planning – Forestry stats Unit Number of key statistics
produced and distributed to stakeholders
NEW 1000
Quality
Reduction in number of forestry stats enquiries received (reduced by 30% of total request received in 2014)
Timeline
NEW Jan-March
Budget
Forestry Publica-tion OPEX
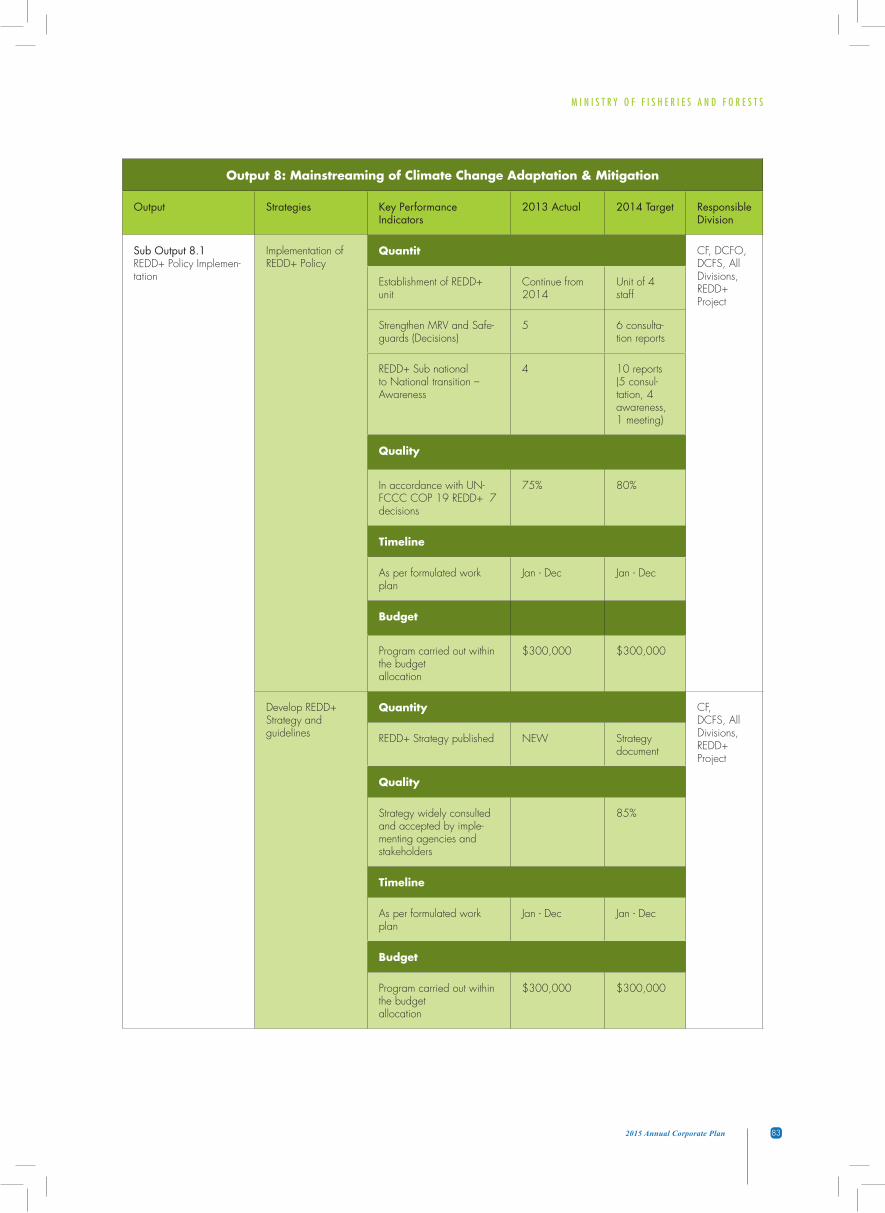
M I N I S T R Y O F F I S H E R I E S A N D F O R E S T S
832015 Annual Corporate Plan
Output 8: Mainstreaming of Climate Change Adaptation & Mitigation
Output Strategies Key Performance Indicators
2013 Actual 2014 Target Responsible Division
Sub Output 8.1REDD+ Policy Implemen-tation
Implementation of REDD+ Policy
Quantit CF, DCFO, DCFS, All Divisions, REDD+ Project
Establishment of REDD+ unit
Continue from 2014
Unit of 4 staff
Strengthen MRV and Safe-guards (Decisions)
5 6 consulta-tion reports
REDD+ Sub national to National transition – Awareness
4 10 reports (5 consul-tation, 4 awareness, 1 meeting)
Quality
In accordance with UN-FCCC COP 19 REDD+ 7 decisions
75% 80%
Timeline
As per formulated work plan
Jan - Dec Jan - Dec
Budget
Program carried out within the budget allocation
$300,000 $300,000
Develop REDD+ Strategy and guidelines
Quantity CF, DCFS, All Divisions, REDD+ Project
REDD+ Strategy published NEW Strategy document
Quality
Strategy widely consulted and accepted by imple-menting agencies and stakeholders
85%
Timeline
As per formulated work plan
Jan - Dec Jan - Dec
Budget
Program carried out within the budget allocation
$300,000 $300,000
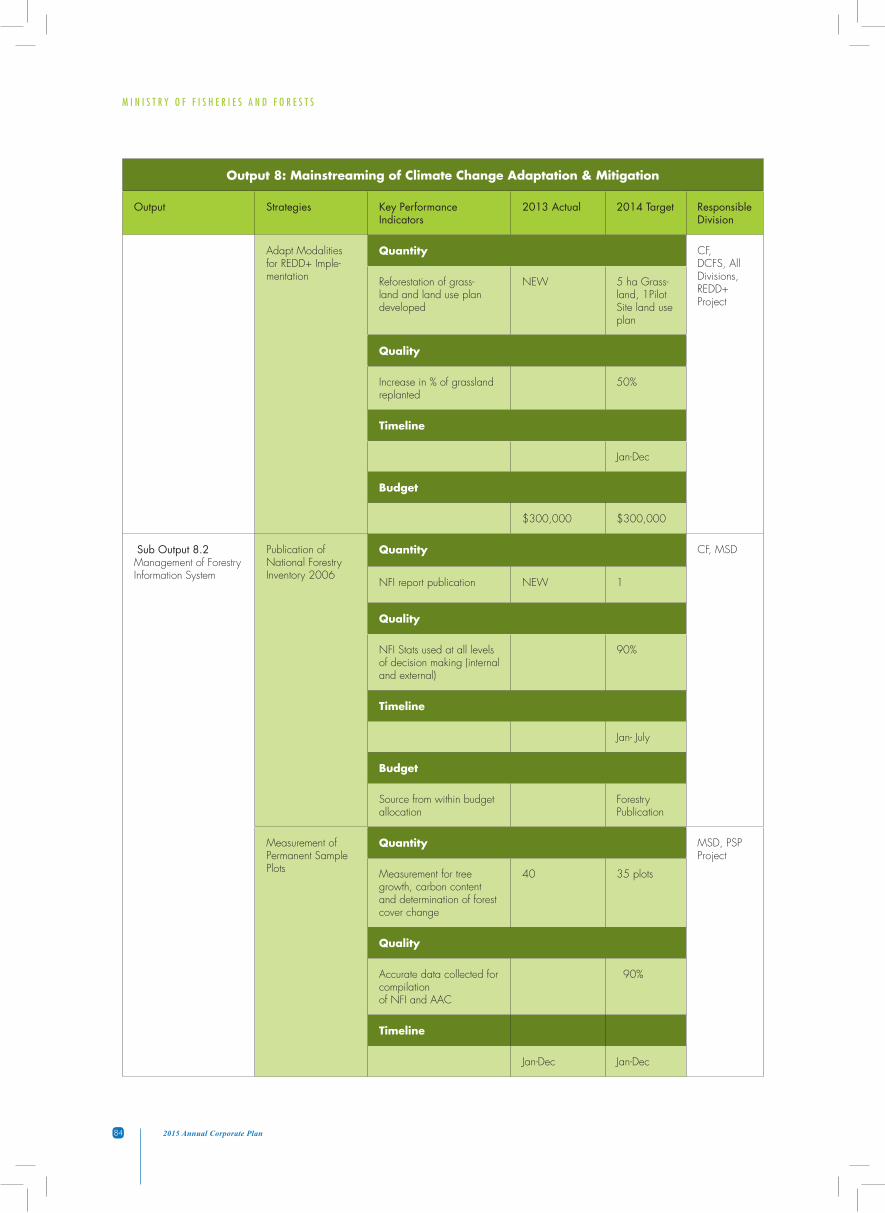
M I N I S T R Y O F F I S H E R I E S A N D F O R E S T S
84 2015 Annual Corporate Plan
Output 8: Mainstreaming of Climate Change Adaptation & Mitigation
Output Strategies Key Performance Indicators
2013 Actual 2014 Target Responsible Division
Adapt Modalities for REDD+ Imple-mentation
Quantity CF, DCFS, All Divisions, REDD+ Project
Reforestation of grass-land and land use plan developed
NEW 5 ha Grass-land, 1Pilot Site land use plan
Quality
Increase in % of grassland replanted
50%
Timeline
Jan-Dec
Budget
$300,000 $300,000
Sub Output 8.2 Management of Forestry Information System
Publication of National Forestry Inventory 2006
Quantity CF, MSD
NFI report publication NEW 1
Quality
NFI Stats used at all levels of decision making (internal and external)
90%
Timeline
Jan- July
Budget
Source from within budget allocation
Forestry Publication
Measurement of Permanent Sample Plots
Quantity MSD, PSP Project
Measurement for tree growth, carbon content and determination of forest cover change
40 35 plots
Quality
Accurate data collected for compilationof NFI and AAC
90%
Timeline
Jan-Dec Jan-Dec
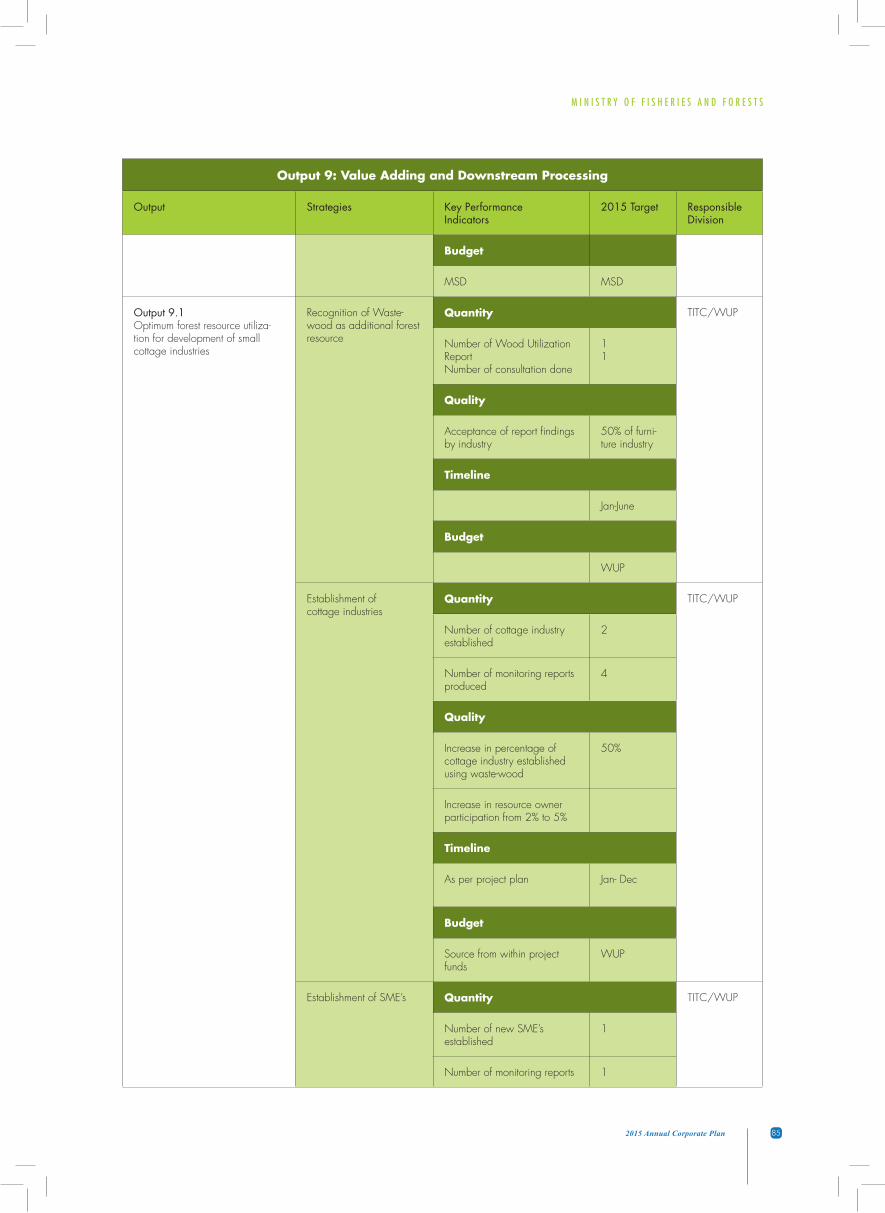
M I N I S T R Y O F F I S H E R I E S A N D F O R E S T S
852015 Annual Corporate Plan
Output 9: Value Adding and Downstream Processing
Output Strategies Key Performance Indicators
2015 Target Responsible Division
Budget
MSD MSD
Output 9.1Optimum forest resource utiliza-tion for development of small cottage industries
Recognition of Waste-wood as additional forest resource
Quantity TITC/WUP
Number of Wood Utilization Report Number of consultation done
11
Quality
Acceptance of report findings by industry
50% of furni-ture industry
Timeline
Jan-June
Budget
WUP
Establishment of cottage industries
Quantity TITC/WUP
Number of cottage industry established
2
Number of monitoring reports produced
4
Quality
Increase in percentage of cottage industry established using waste-wood
50%
Increase in resource owner participation from 2% to 5%
Timeline
As per project plan Jan- Dec
Budget
Source from within project funds
WUP
Establishment of SME’s Quantity TITC/WUP
Number of new SME’s established
1
Number of monitoring reports 1
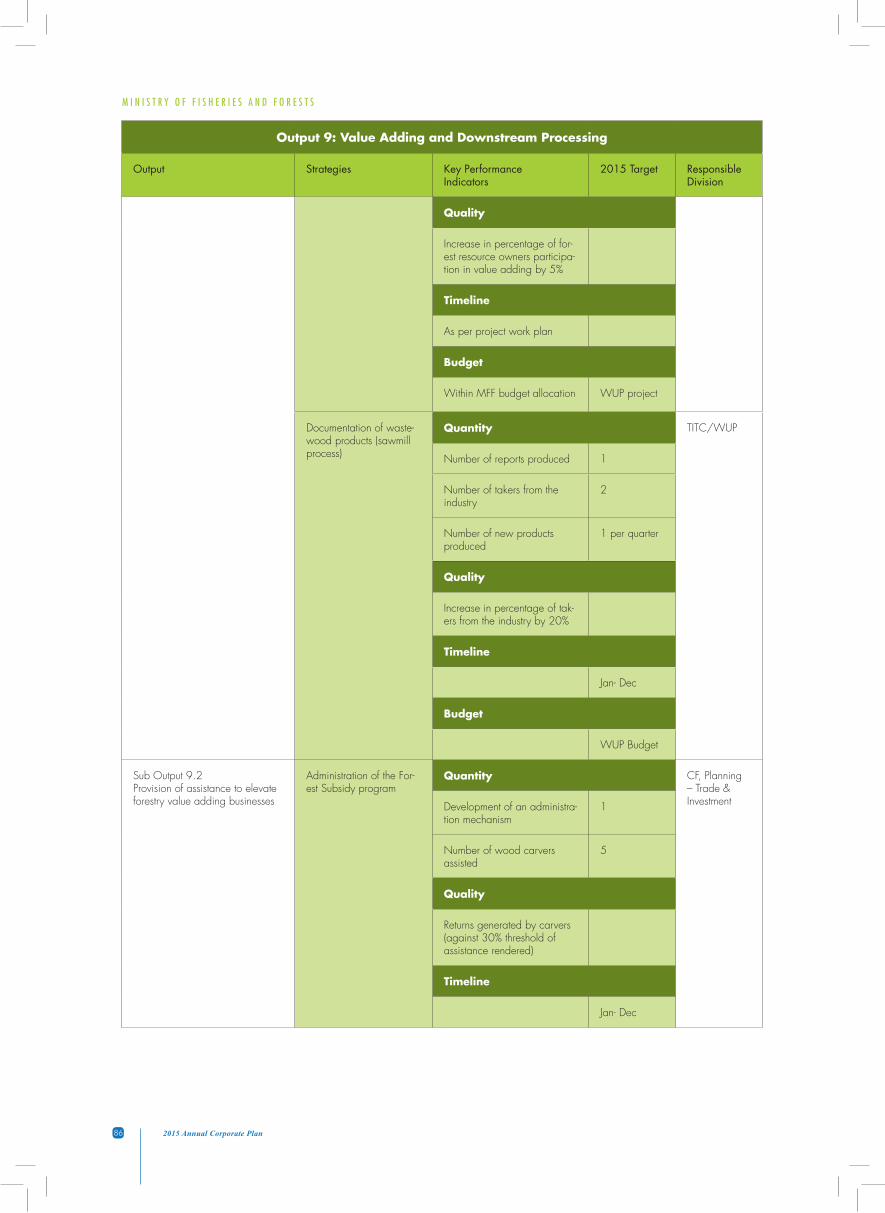
M I N I S T R Y O F F I S H E R I E S A N D F O R E S T S
86 2015 Annual Corporate Plan
Output 9: Value Adding and Downstream Processing
Output Strategies Key Performance Indicators
2015 Target Responsible Division
Quality
Increase in percentage of for-est resource owners participa-tion in value adding by 5%
Timeline
As per project work plan
Budget
Within MFF budget allocation WUP project
Documentation of waste-wood products (sawmill process)
Quantity TITC/WUP
Number of reports produced 1
Number of takers from the industry
2
Number of new products produced
1 per quarter
Quality
Increase in percentage of tak-ers from the industry by 20%
Timeline
Jan- Dec
Budget
WUP Budget
Sub Output 9.2 Provision of assistance to elevate forestry value adding businesses
Administration of the For-est Subsidy program
Quantity CF, Planning – Trade & Investment Development of an administra-
tion mechanism1
Number of wood carvers assisted
5
Quality
Returns generated by carvers (against 30% threshold of assistance rendered)
Timeline
Jan- Dec
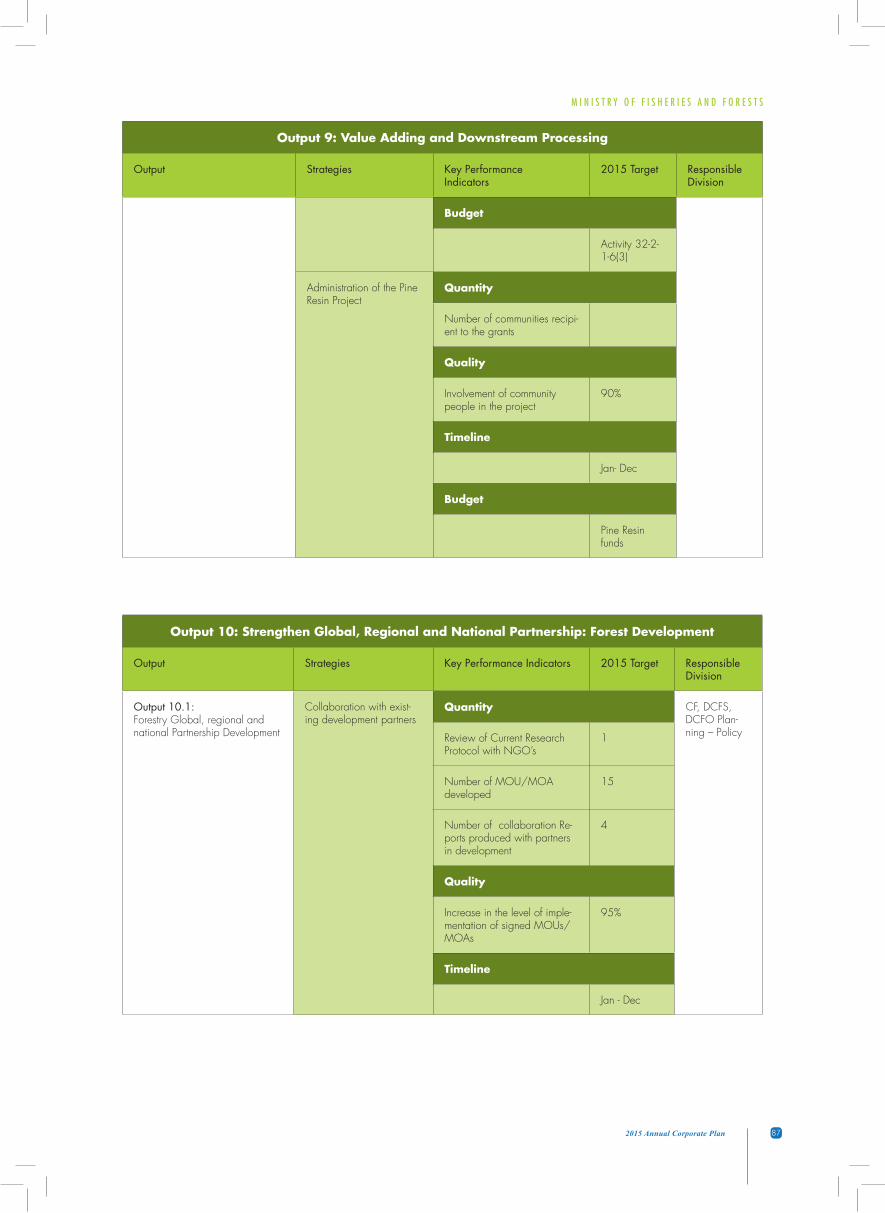
M I N I S T R Y O F F I S H E R I E S A N D F O R E S T S
872015 Annual Corporate Plan
Output 9: Value Adding and Downstream Processing
Output Strategies Key Performance Indicators
2015 Target Responsible Division
Budget
Activity 32-2-1-6(3)
Administration of the Pine Resin Project
Quantity
Number of communities recipi-ent to the grants
Quality
Involvement of community people in the project
90%
Timeline
Jan- Dec
Budget
Pine Resin funds
Output 10: Strengthen Global, Regional and National Partnership: Forest Development
Output Strategies Key Performance Indicators 2015 Target Responsible Division
Output 10.1: Forestry Global, regional and national Partnership Development
Collaboration with exist-ing development partners
Quantity CF, DCFS, DCFO Plan-ning – Policy Review of Current Research
Protocol with NGO’s1
Number of MOU/MOA developed
15
Number of collaboration Re-ports produced with partners in development
4
Quality
Increase in the level of imple-mentation of signed MOUs/MOAs
95%
Timeline
Jan - Dec
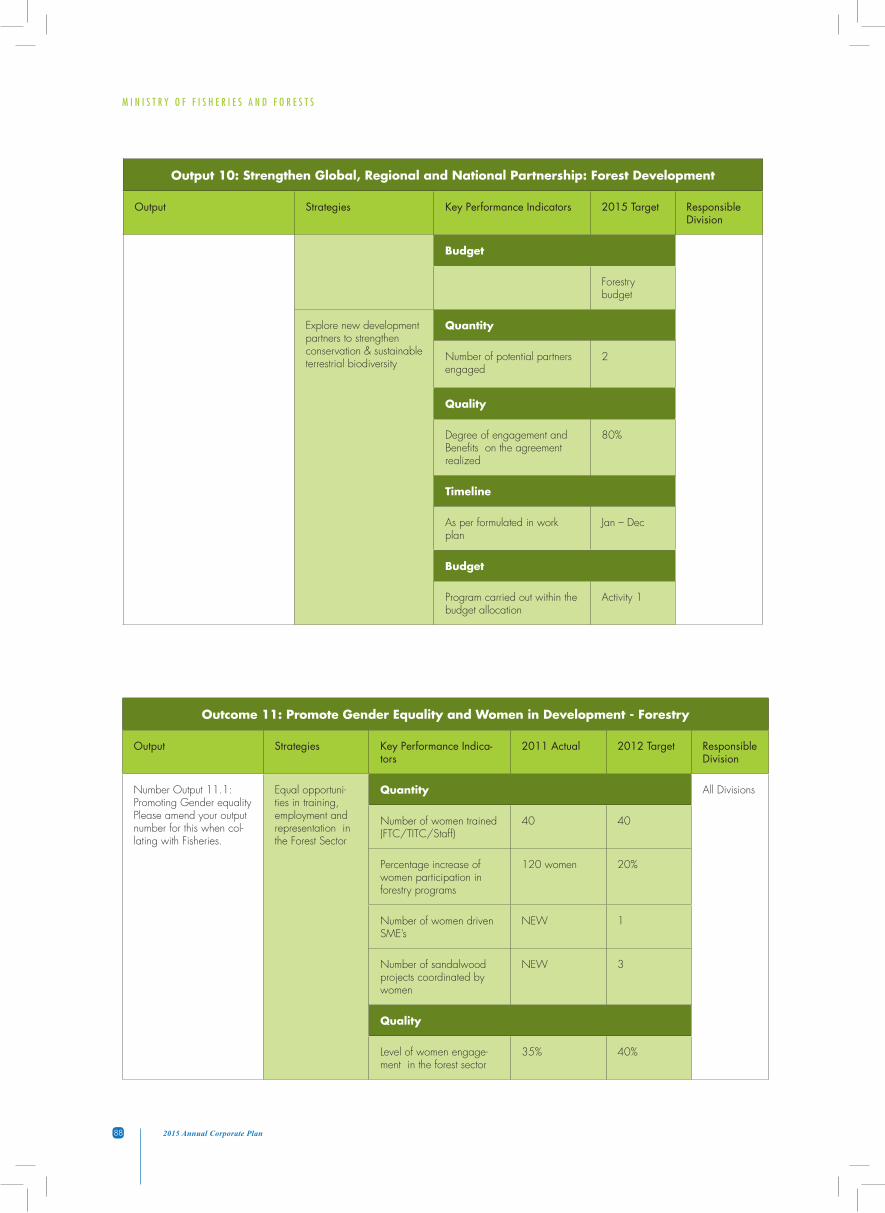
M I N I S T R Y O F F I S H E R I E S A N D F O R E S T S
88 2015 Annual Corporate Plan
Output 10: Strengthen Global, Regional and National Partnership: Forest Development
Output Strategies Key Performance Indicators 2015 Target Responsible Division
Budget
Forestry budget
Explore new development partners to strengthen conservation & sustainable terrestrial biodiversity
Quantity
Number of potential partners engaged
2
Quality
Degree of engagement and Benefits on the agreement realized
80%
Timeline
As per formulated in work plan
Jan – Dec
Budget
Program carried out within the budget allocation
Activity 1
Outcome 11: Promote Gender Equality and Women in Development - Forestry
Output Strategies Key Performance Indica-tors
2011 Actual 2012 Target Responsible Division
Number Output 11.1: Promoting Gender equality Please amend your output number for this when col-lating with Fisheries.
Equal opportuni-ties in training, employment and representation in the Forest Sector
Quantity All Divisions
Number of women trained (FTC/TITC/Staff)
40 40
Percentage increase of women participation in forestry programs
120 women 20%
Number of women driven SME’s
NEW 1
Number of sandalwood projects coordinated by women
NEW 3
Quality
Level of women engage-ment in the forest sector
35% 40%

M I N I S T R Y O F F I S H E R I E S A N D F O R E S T S
892015 Annual Corporate Plan
Outcome 11: Promote Gender Equality and Women in Development - Forestry
Output Strategies Key Performance Indica-tors
2011 Actual 2012 Target Responsible Division
Timeline
As per activity timeline Jan - Dec Jan - Dec
Budget
As per budget allocation All Activity budget
All Activity budget
Collection of sex disaggregated data to ascertain involvement of women in various forestry activities
Quantity All Divisions
Inventory of women activi-ties in fisheries (participa-tion, commitment)
NEW 4 (1 inventory per division)
Quality
Increase in awareness of women participation in specified fisheries activities
80%
Timeline
Jan-Dec
Budget
Carried out within the budget allocation
Composition of women in boards and committees
Quantity All Divisions
Number of women in boards and committees
10
Quality
Number of women in boards making strategic decisions
20% 30%
Timeline
Jan-Dec Jan-Dec
Budget
Carried out within the budget allocation
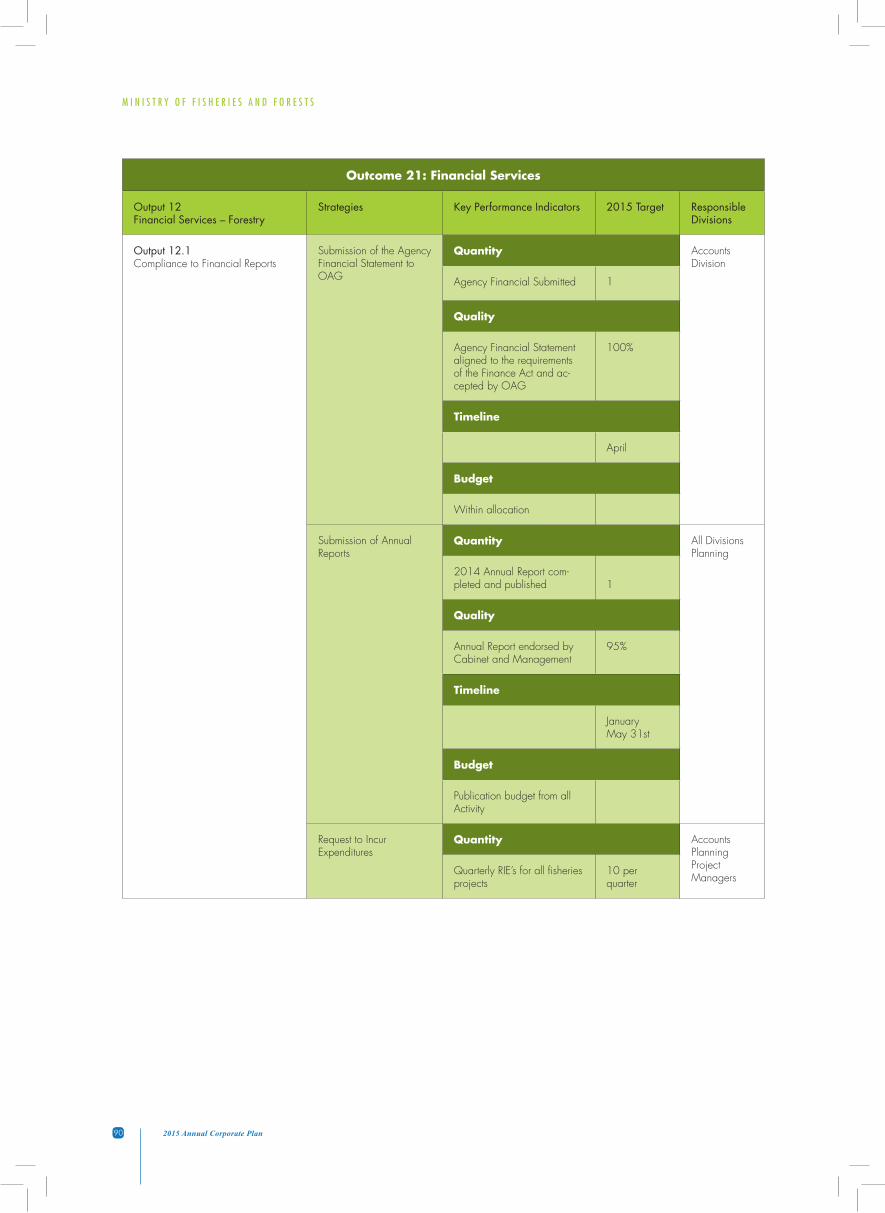
M I N I S T R Y O F F I S H E R I E S A N D F O R E S T S
90 2015 Annual Corporate Plan
Outcome 21: Financial Services
Output 12Financial Services – Forestry
Strategies Key Performance Indicators 2015 Target Responsible Divisions
Output 12.1 Compliance to Financial Reports
Submission of the Agency Financial Statement to OAG
Quantity Accounts Division
Agency Financial Submitted 1
Quality
Agency Financial Statement aligned to the requirements of the Finance Act and ac-cepted by OAG
100%
Timeline
April
Budget
Within allocation
Submission of Annual Reports
Quantity All Divisions Planning
2014 Annual Report com-pleted and published 1
Quality
Annual Report endorsed by Cabinet and Management
95%
Timeline
January May 31st
Budget
Publication budget from all Activity
Request to Incur Expenditures
Quantity Accounts Planning Project Managers
Quarterly RIE’s for all fisheries projects
10 per quarter

M I N I S T R Y O F F I S H E R I E S A N D F O R E S T S
912015 Annual Corporate Plan
Outcome 21: Financial Services
Output 12Financial Services – Forestry
Strategies Key Performance Indicators 2015 Target Responsible Divisions
Quality
Completion of all targets by the required due date/time-lines e.g.
RIE’s submitted within the 1st 2 weeks of Qtr for each Dept. (MFF/Fisheries/Forests)% of RIE’s returned by MOF for revision (MFF and by dept.)RIE’s approved by Finance and funds utilized before end of quarter
100%
100%
Timeline
Quarterly
Budget
Project Budget allocation
Budget Request Formulation
Quantity Accounts Planning All divisions MFF Budget Submission
Quality % Increase decrease in budget allocation as MFF and by programme (Fisher-ies/Forests)
1
Timeline
July – October
Budget
Within Budget

M I N I S T R Y O F F I S H E R I E S A N D F O R E S T S
92 2015 Annual Corporate Plan
Outcome 21: Financial Services
Output 12Financial Services – Forestry
Strategies Key Performance Indicators 2015 Target Responsible Divisions
Submission of Financial Reports to Minister, PS and HOD’s
Quantity Accounts Planning (M&E) Planning – Policy
Number of consolidated reports produced (Financial status, project implementation and ACP Outputs)
4 reports
Quality
Report in compliance of Section 26 of Financial Regulations
95%
Timeline
As per budgeted allocation
Quarterly
Budget
Within budget allocation
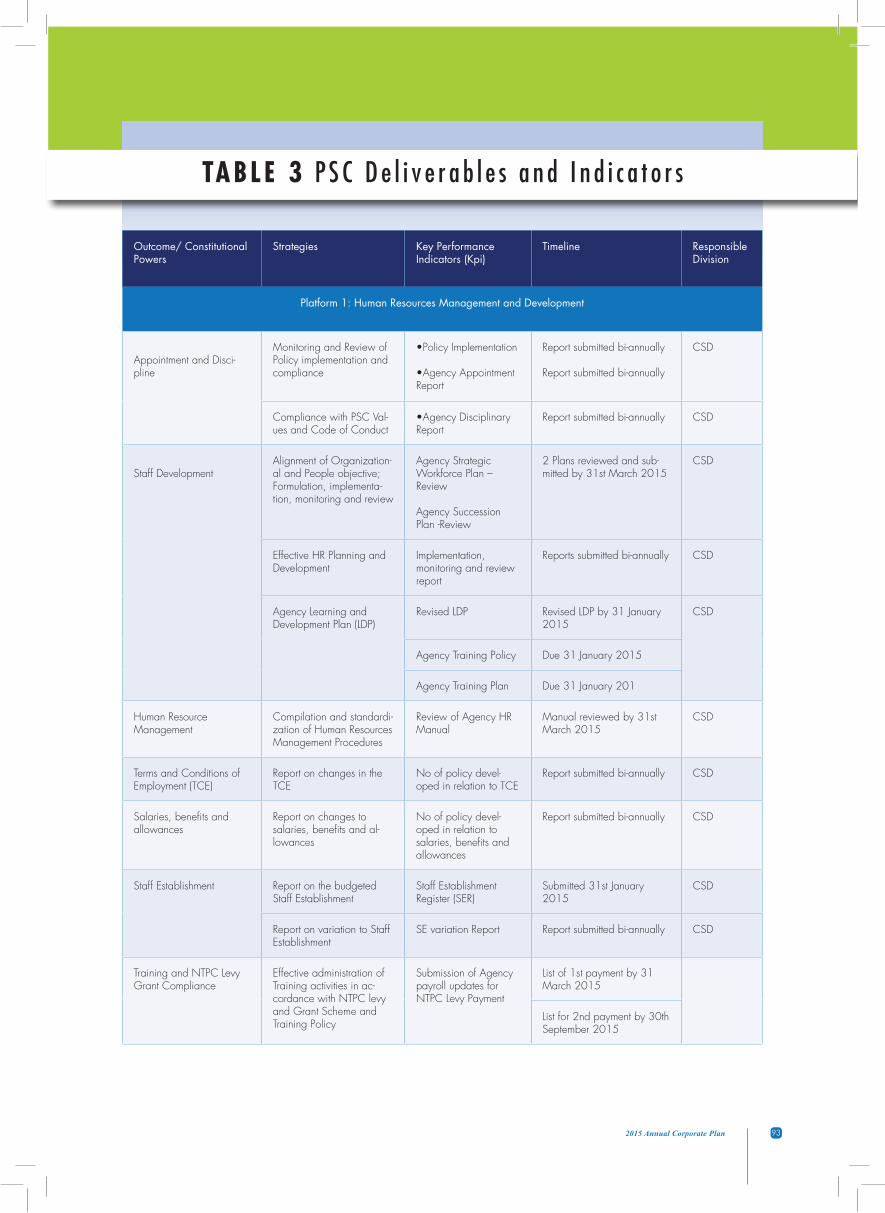
M I N I S T R Y O F F I S H E R I E S A N D F O R E S T S
932015 Annual Corporate Plan
TABLE 3 P S C D e l i v e r a b l e s a n d I n d i c a t o r s
Outcome/ ConstitutionalPowers
Strategies Key PerformanceIndicators (Kpi)
Timeline ResponsibleDivision
Platform 1: Human Resources Management and Development
Appointment and Disci-pline
Monitoring and Review of Policy implementation and compliance
•PolicyImplementation
•AgencyAppointmentReport
Report submitted bi-annually
Report submitted bi-annually
CSD
Compliance with PSC Val-ues and Code of Conduct
•AgencyDisciplinaryReport
Report submitted bi-annually CSD
Staff DevelopmentAlignment of Organization-al and People objective; Formulation, implementa-tion, monitoring and review
Agency Strategic Workforce Plan – Review
Agency Succession Plan -Review
2 Plans reviewed and sub-mitted by 31st March 2015
CSD
Effective HR Planning and Development
Implementation, monitoring and review report
Reports submitted bi-annually CSD
Agency Learning and Development Plan (LDP)
Revised LDP Revised LDP by 31 January 2015
CSD
Agency Training Policy Due 31 January 2015
Agency Training Plan Due 31 January 201
Human Resource Management
Compilation and standardi-zation of Human Resources Management Procedures
Review of Agency HR Manual
Manual reviewed by 31st March 2015
CSD
Terms and Conditions of Employment (TCE)
Report on changes in the TCE
No of policy devel-oped in relation to TCE
Report submitted bi-annually CSD
Salaries, benefits and allowances
Report on changes to salaries, benefits and al-lowances
No of policy devel-oped in relation to salaries, benefits and allowances
Report submitted bi-annually CSD
Staff Establishment Report on the budgeted Staff Establishment
Staff Establishment Register (SER)
Submitted 31st January 2015
CSD
Report on variation to Staff Establishment
SE variation Report Report submitted bi-annually CSD
Training and NTPC Levy Grant Compliance
Effective administration of Training activities in ac-cordance with NTPC levy and Grant Scheme and Training Policy
Submission of Agency payroll updates for NTPC Levy Payment
List of 1st payment by 31 March 2015
List for 2nd payment by 30th September 2015
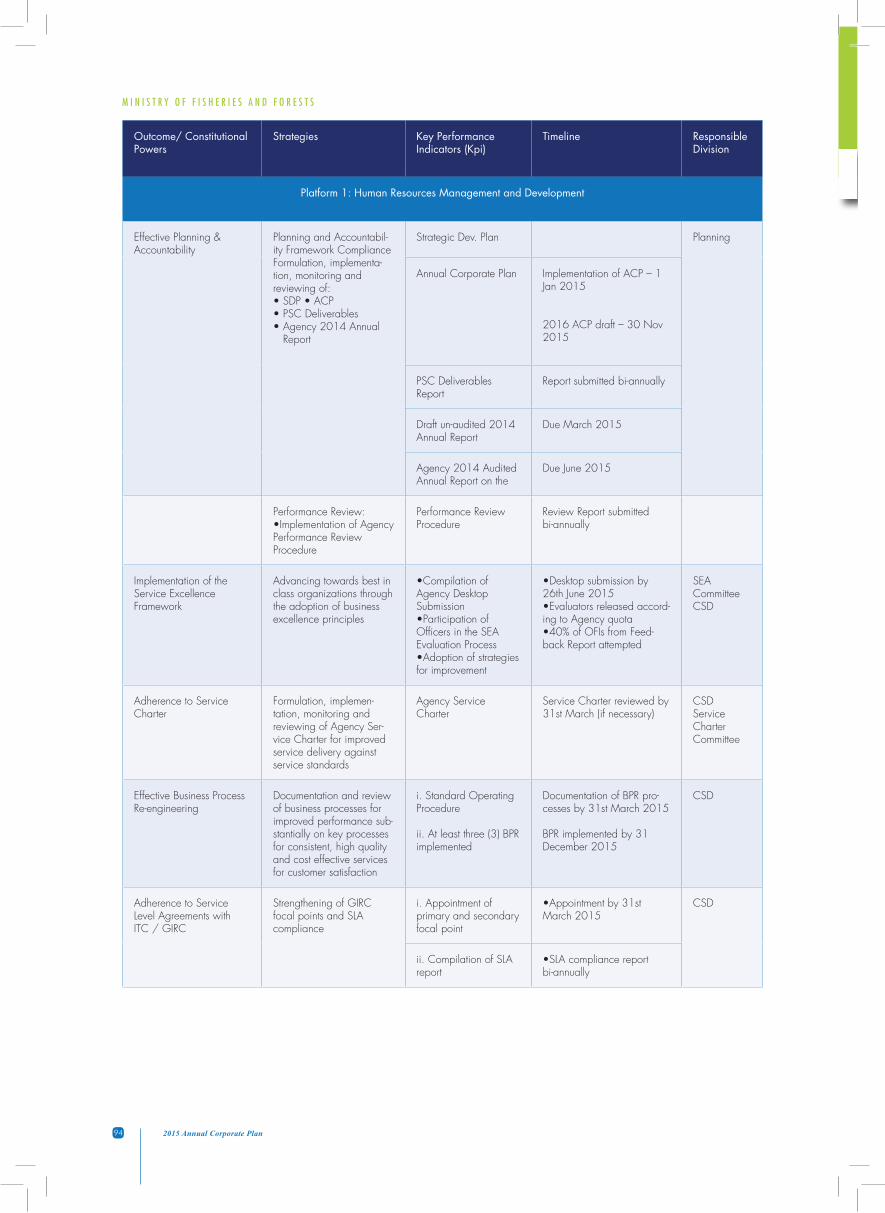
M I N I S T R Y O F F I S H E R I E S A N D F O R E S T S
94 2015 Annual Corporate Plan
Outcome/ ConstitutionalPowers
Strategies Key PerformanceIndicators (Kpi)
Timeline ResponsibleDivision
Platform 1: Human Resources Management and Development
Effective Planning & Accountability
Planning and Accountabil-ity Framework ComplianceFormulation, implementa-tion, monitoring and reviewing of:•SDP•ACP•PSCDeliverables•Agency2014Annual Report
Strategic Dev. Plan Planning
Annual Corporate Plan Implementation of ACP – 1 Jan 2015
2016 ACP draft – 30 Nov 2015
PSC Deliverables Report
Report submitted bi-annually
Draft un-audited 2014 Annual Report
Due March 2015
Agency 2014 Audited Annual Report on the
Due June 2015
Performance Review:•ImplementationofAgencyPerformance Review Procedure
Performance ReviewProcedure
Review Report submitted bi-annually
Implementation of the Service Excellence Framework
Advancing towards best in class organizations through the adoption of business excellence principles
•CompilationofAgency Desktop Submission•ParticipationofOfficers in the SEA Evaluation Process•Adoptionofstrategiesfor improvement
•Desktopsubmissionby26th June 2015•Evaluatorsreleasedaccord-ing to Agency quota•40%ofOFIsfromFeed-back Report attempted
SEA Committee CSD
Adherence to Service Charter
Formulation, implemen-tation, monitoring and reviewing of Agency Ser-vice Charter for improved service delivery against service standards
Agency Service Charter
Service Charter reviewed by 31st March (if necessary)
CSD Service Charter Committee
Effective Business Process Re-engineering
Documentation and review of business processes for improved performance sub-stantially on key processes for consistent, high quality and cost effective services for customer satisfaction
i. Standard Operating Procedure
ii. At least three (3) BPR implemented
Documentation of BPR pro-cesses by 31st March 2015
BPR implemented by 31 December 2015
CSD
Adherence to Service Level Agreements with ITC / GIRC
Strengthening of GIRC focal points and SLA compliance
i. Appointment of primary and secondary focal point
•Appointmentby31stMarch 2015
CSD
ii. Compilation of SLA report
•SLAcompliancereportbi-annually
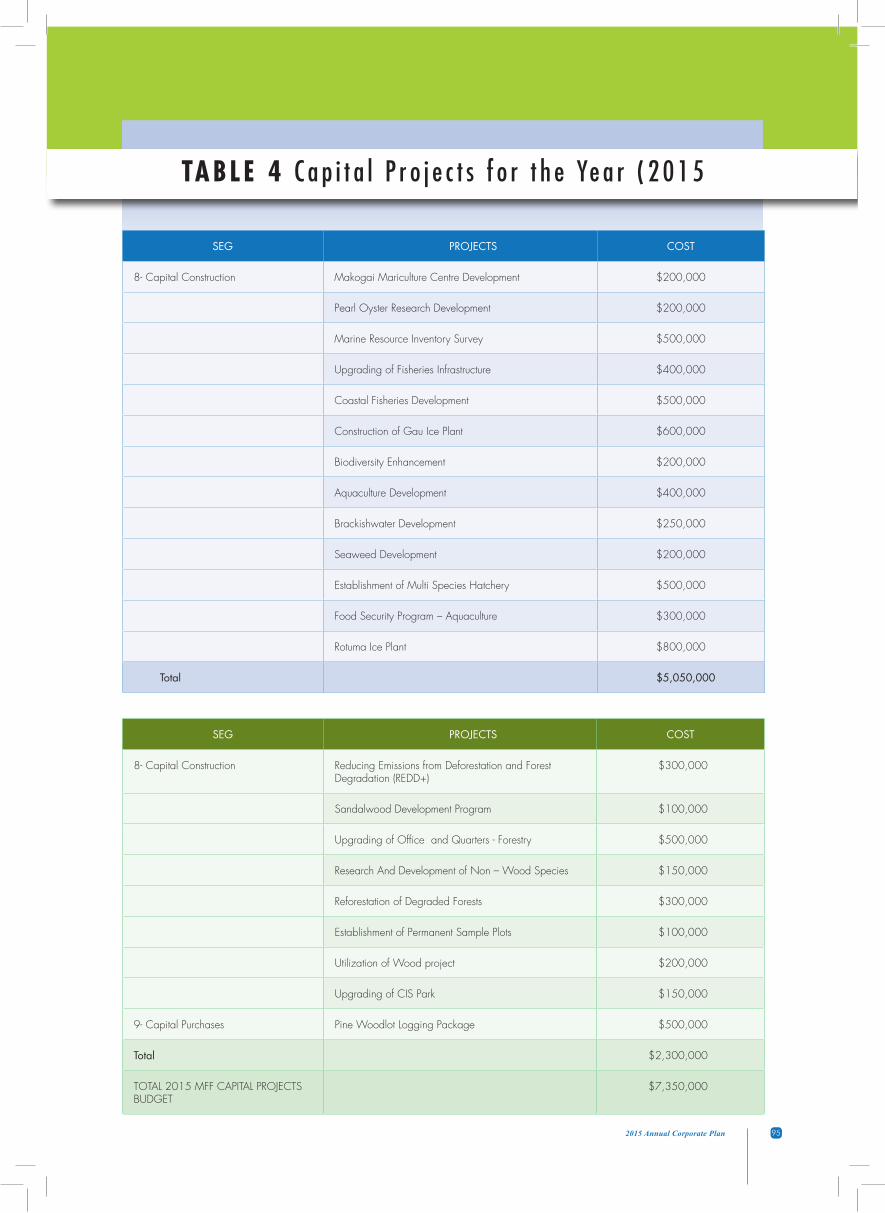
M I N I S T R Y O F F I S H E R I E S A N D F O R E S T S
952015 Annual Corporate Plan
TABLE 4 C a p i t a l P r o j e c t s f o r t h e Ye a r ( 2 0 1 5
SEG PROJECTS COST
8- Capital Construction Makogai Mariculture Centre Development $200,000
Pearl Oyster Research Development $200,000
Marine Resource Inventory Survey $500,000
Upgrading of Fisheries Infrastructure $400,000
Coastal Fisheries Development $500,000
Construction of Gau Ice Plant $600,000
Biodiversity Enhancement $200,000
Aquaculture Development $400,000
Brackishwater Development $250,000
Seaweed Development $200,000
Establishment of Multi Species Hatchery $500,000
Food Security Program – Aquaculture $300,000
Rotuma Ice Plant $800,000
Total $5,050,000
SEG PROJECTS COST
8- Capital Construction Reducing Emissions from Deforestation and Forest Degradation (REDD+)
$300,000
Sandalwood Development Program $100,000
Upgrading of Office and Quarters - Forestry $500,000
Research And Development of Non – Wood Species $150,000
Reforestation of Degraded Forests $300,000
Establishment of Permanent Sample Plots $100,000
Utilization of Wood project $200,000
Upgrading of CIS Park $150,000
9- Capital Purchases Pine Woodlot Logging Package $500,000
Total $2,300,000
TOTAL 2015 MFF CAPITAL PROJECTS BUDGET
$7,350,000
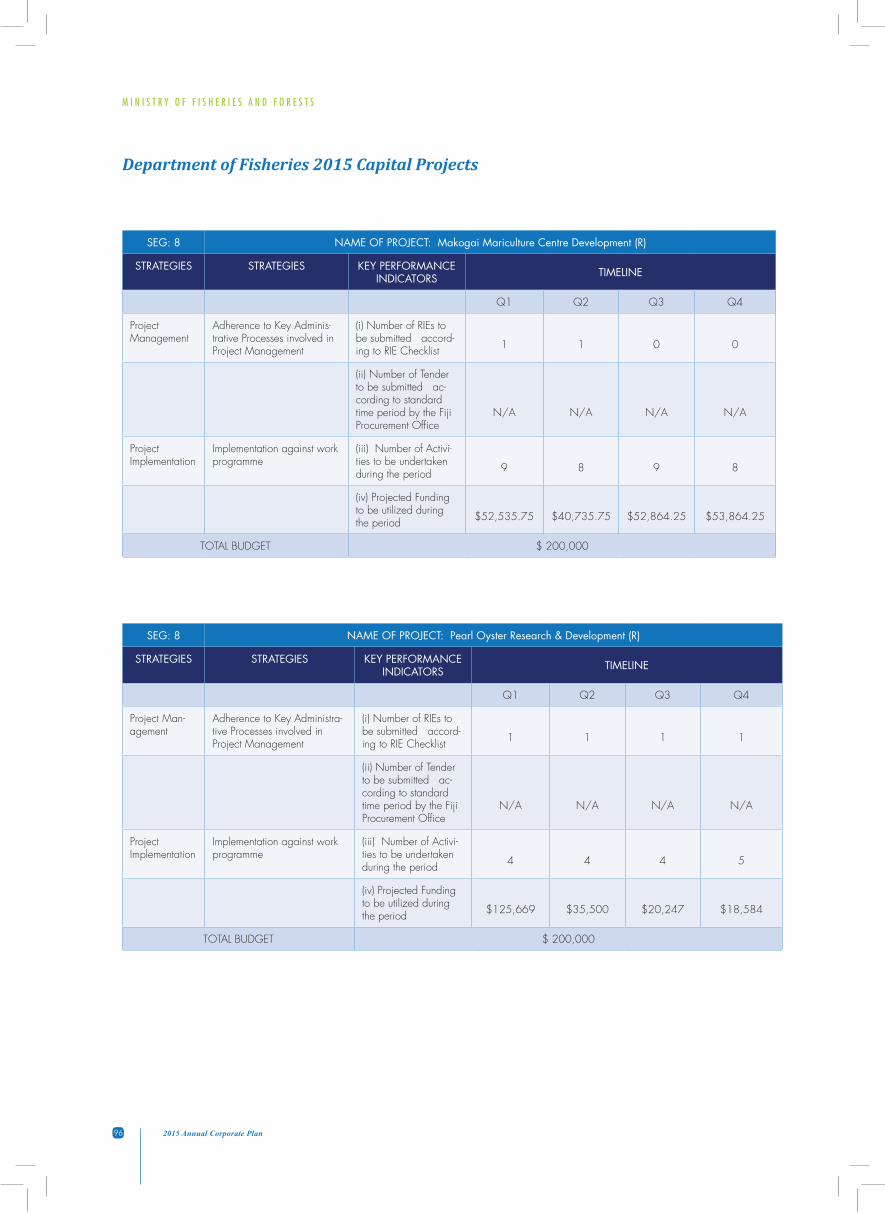
M I N I S T R Y O F F I S H E R I E S A N D F O R E S T S
96 2015 Annual Corporate Plan
SEG: 8 NAME OF PROJECT: Makogai Mariculture Centre Development (R)
STRATEGIES STRATEGIES KEY PERFORMANCE INDICATORS TIMELINE
Q1 Q2 Q3 Q4
Project Management
Adherence to Key Adminis-trative Processes involved in Project Management
(i) Number of RIEs to be submitted accord-ing to RIE Checklist 1 1 0 0
(ii) Number of Tender to be submitted ac-cording to standard time period by the Fiji Procurement Office
N/A N/A N/A N/A
Project Implementation
Implementation against work programme
(iii) Number of Activi-ties to be undertaken during the period 9 8 9 8
(iv) Projected Funding to be utilized during the period $52,535.75 $40,735.75 $52,864.25 $53,864.25
TOTAL BUDGET $ 200,000
SEG: 8 NAME OF PROJECT: Pearl Oyster Research & Development (R)
STRATEGIES STRATEGIES KEY PERFORMANCE INDICATORS TIMELINE
Q1 Q2 Q3 Q4
Project Man-agement
Adherence to Key Administra-tive Processes involved in Project Management
(i) Number of RIEs to be submitted accord-ing to RIE Checklist 1 1 1 1
(ii) Number of Tender to be submitted ac-cording to standard time period by the Fiji Procurement Office
N/A N/A N/A N/A
Project Implementation
Implementation against work programme
(iii) Number of Activi-ties to be undertaken during the period 4 4 4 5
(iv) Projected Funding to be utilized during the period $125,669 $35,500 $20,247 $18,584
TOTAL BUDGET $ 200,000
Department of Fisheries 2015 Capital Projects
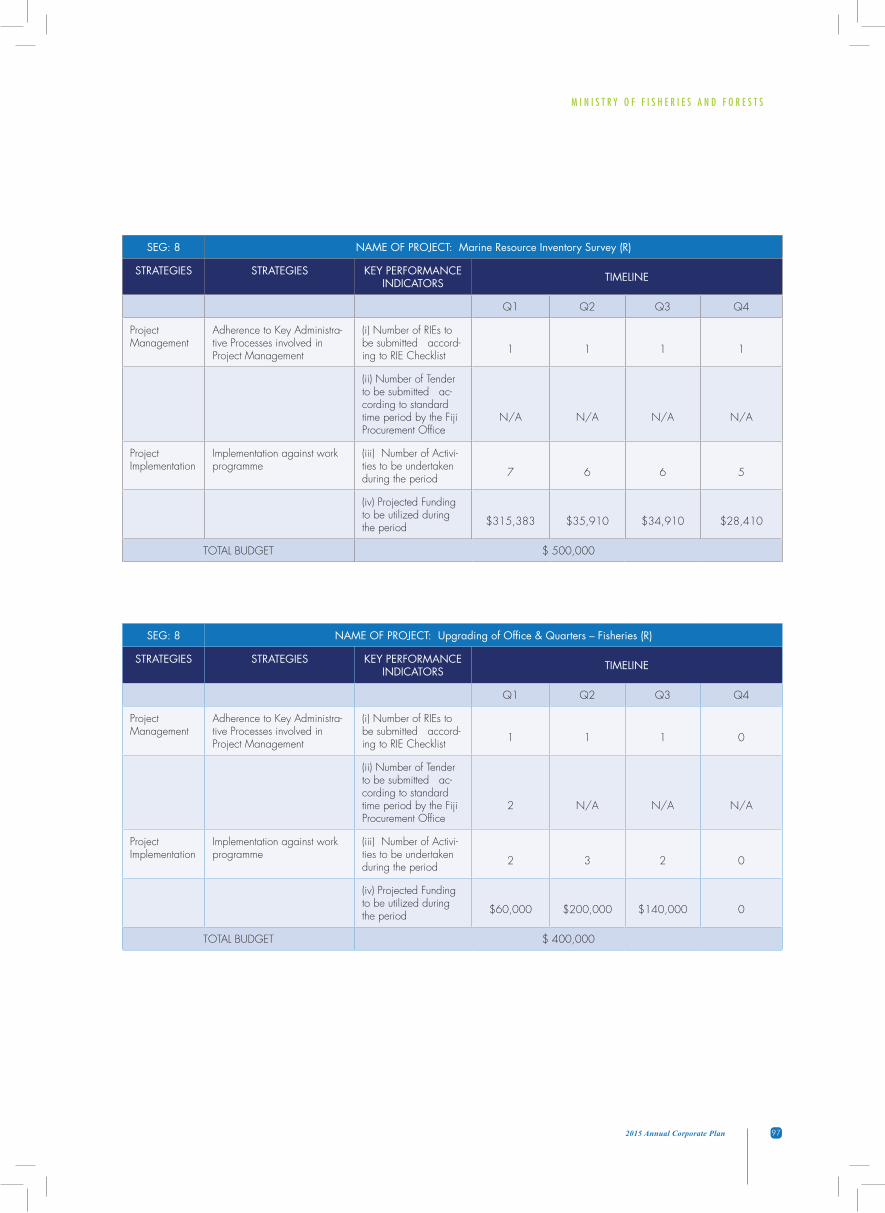
M I N I S T R Y O F F I S H E R I E S A N D F O R E S T S
972015 Annual Corporate Plan
SEG: 8 NAME OF PROJECT: Marine Resource Inventory Survey (R)
STRATEGIES STRATEGIES KEY PERFORMANCE INDICATORS TIMELINE
Q1 Q2 Q3 Q4
Project Management
Adherence to Key Administra-tive Processes involved in Project Management
(i) Number of RIEs to be submitted accord-ing to RIE Checklist 1 1 1 1
(ii) Number of Tender to be submitted ac-cording to standard time period by the Fiji Procurement Office
N/A N/A N/A N/A
Project Implementation
Implementation against work programme
(iii) Number of Activi-ties to be undertaken during the period 7 6 6 5
(iv) Projected Funding to be utilized during the period $315,383 $35,910 $34,910 $28,410
TOTAL BUDGET $ 500,000
SEG: 8 NAME OF PROJECT: Upgrading of Office & Quarters – Fisheries (R)
STRATEGIES STRATEGIES KEY PERFORMANCE INDICATORS TIMELINE
Q1 Q2 Q3 Q4
Project Management
Adherence to Key Administra-tive Processes involved in Project Management
(i) Number of RIEs to be submitted accord-ing to RIE Checklist 1 1 1 0
(ii) Number of Tender to be submitted ac-cording to standard time period by the Fiji Procurement Office
2 N/A N/A N/A
Project Implementation
Implementation against work programme
(iii) Number of Activi-ties to be undertaken during the period 2 3 2 0
(iv) Projected Funding to be utilized during the period $60,000 $200,000 $140,000 0
TOTAL BUDGET $ 400,000
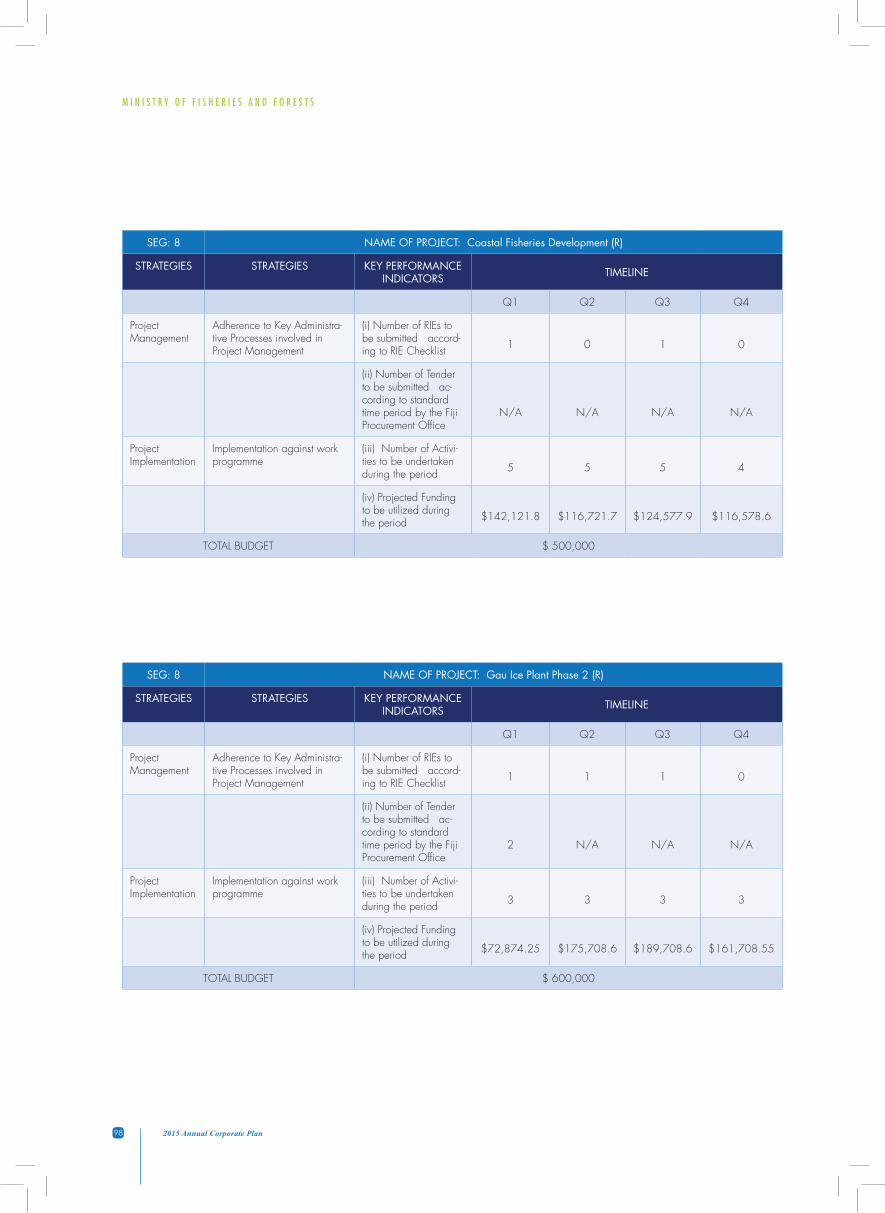
M I N I S T R Y O F F I S H E R I E S A N D F O R E S T S
98 2015 Annual Corporate Plan
SEG: 8 NAME OF PROJECT: Coastal Fisheries Development (R)
STRATEGIES STRATEGIES KEY PERFORMANCE INDICATORS TIMELINE
Q1 Q2 Q3 Q4
Project Management
Adherence to Key Administra-tive Processes involved in Project Management
(i) Number of RIEs to be submitted accord-ing to RIE Checklist 1 0 1 0
(ii) Number of Tender to be submitted ac-cording to standard time period by the Fiji Procurement Office
N/A N/A N/A N/A
Project Implementation
Implementation against work programme
(iii) Number of Activi-ties to be undertaken during the period 5 5 5 4
(iv) Projected Funding to be utilized during the period $142,121.8 $116,721.7 $124,577.9 $116,578.6
TOTAL BUDGET $ 500,000
SEG: 8 NAME OF PROJECT: Gau Ice Plant Phase 2 (R)
STRATEGIES STRATEGIES KEY PERFORMANCE INDICATORS TIMELINE
Q1 Q2 Q3 Q4
Project Management
Adherence to Key Administra-tive Processes involved in Project Management
(i) Number of RIEs to be submitted accord-ing to RIE Checklist 1 1 1 0
(ii) Number of Tender to be submitted ac-cording to standard time period by the Fiji Procurement Office
2 N/A N/A N/A
Project Implementation
Implementation against work programme
(iii) Number of Activi-ties to be undertaken during the period 3 3 3 3
(iv) Projected Funding to be utilized during the period $72,874.25 $175,708.6 $189,708.6 $161,708.55
TOTAL BUDGET $ 600,000
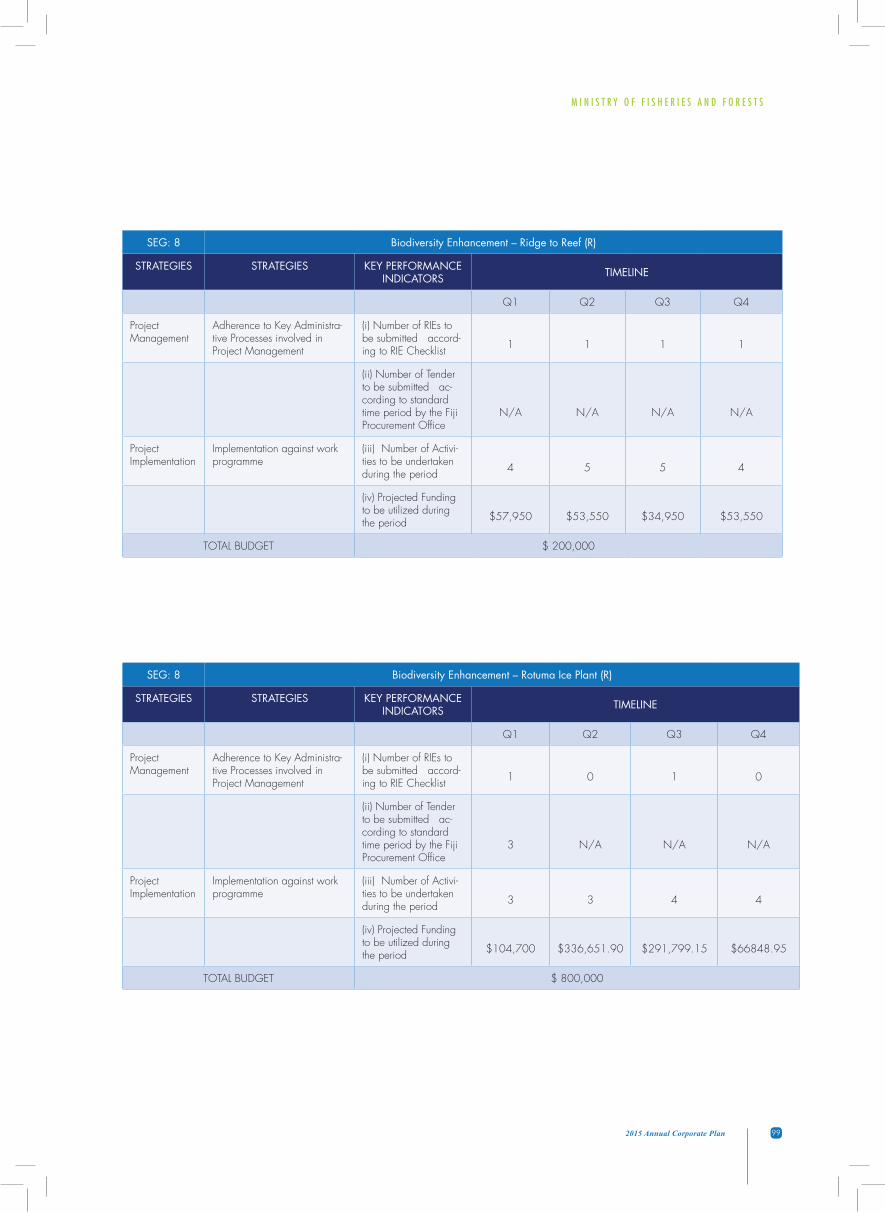
M I N I S T R Y O F F I S H E R I E S A N D F O R E S T S
992015 Annual Corporate Plan
SEG: 8 Biodiversity Enhancement – Ridge to Reef (R)
STRATEGIES STRATEGIES KEY PERFORMANCE INDICATORS TIMELINE
Q1 Q2 Q3 Q4
Project Management
Adherence to Key Administra-tive Processes involved in Project Management
(i) Number of RIEs to be submitted accord-ing to RIE Checklist 1 1 1 1
(ii) Number of Tender to be submitted ac-cording to standard time period by the Fiji Procurement Office
N/A N/A N/A N/A
Project Implementation
Implementation against work programme
(iii) Number of Activi-ties to be undertaken during the period 4 5 5 4
(iv) Projected Funding to be utilized during the period $57,950 $53,550 $34,950 $53,550
TOTAL BUDGET $ 200,000
SEG: 8 Biodiversity Enhancement – Rotuma Ice Plant (R)
STRATEGIES STRATEGIES KEY PERFORMANCE INDICATORS TIMELINE
Q1 Q2 Q3 Q4
Project Management
Adherence to Key Administra-tive Processes involved in Project Management
(i) Number of RIEs to be submitted accord-ing to RIE Checklist 1 0 1 0
(ii) Number of Tender to be submitted ac-cording to standard time period by the Fiji Procurement Office
3 N/A N/A N/A
Project Implementation
Implementation against work programme
(iii) Number of Activi-ties to be undertaken during the period 3 3 4 4
(iv) Projected Funding to be utilized during the period $104,700 $336,651.90 $291,799.15 $66848.95
TOTAL BUDGET $ 800,000

M I N I S T R Y O F F I S H E R I E S A N D F O R E S T S
100 2015 Annual Corporate Plan
SEG: 8 Biodiversity Enhancement – Freshwater Aquaculture Development (R)
STRATEGIES STRATEGIES KEY PERFORMANCE INDICATORS TIMELINE
Q1 Q2 Q3 Q4
Project Management
Adherence to Key Administra-tive Processes involved in Project Management
(i) Number of RIEs to be submitted accord-ing to RIE Checklist 1 1 1 1
(ii) Number of Tender to be submitted ac-cording to standard time period by the Fiji Procurement Office
N/A N/A N/A N/A
Project Implementation
Implementation against work programme
(iii) Number of Activi-ties to be undertaken during the period 8 8 8 7
(iv) Projected Funding to be utilized during the period $272,304 $27,000 $74,000 $26,696
TOTAL BUDGET $ 400,000
SEG: 8 Biodiversity Enhancement – Brackishwater Development (R)
STRATEGIES STRATEGIES KEY PERFORMANCE INDICATORS TIMELINE
Q1 Q2 Q3 Q4
Project Management
Adherence to Key Administra-tive Processes involved in Project Management
(i) Number of RIEs to be submitted accord-ing to RIE Checklist 1 1 1 1
(ii) Number of Tender to be submitted ac-cording to standard time period by the Fiji Procurement Office
N/A N/A N/A N/A
Project Implementation
Implementation against work programme
(iii) Number of Activi-ties to be undertaken during the period 7 7 7 7
(iv) Projected Funding to be utilized during the period $144,160 $22,500 $54,000 $29,340
TOTAL BUDGET $ 250,000
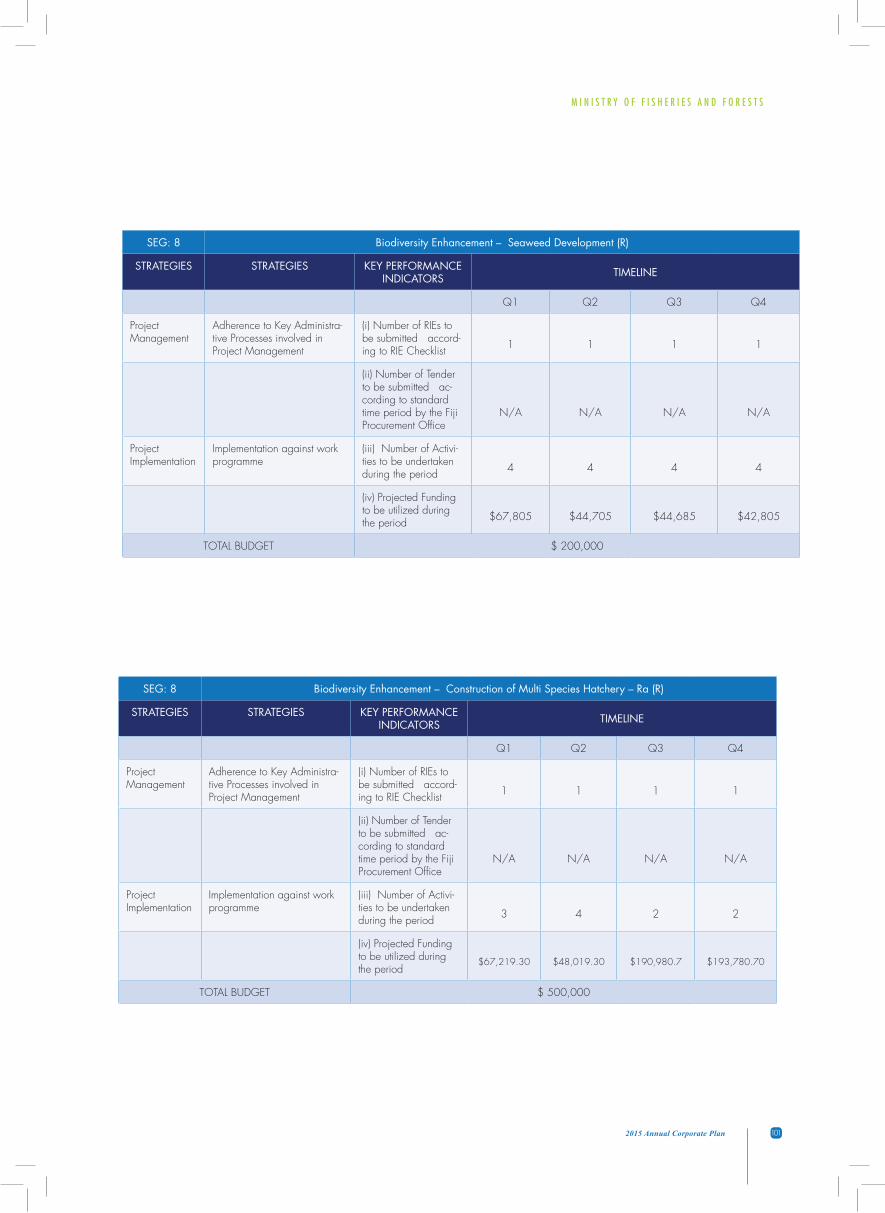
M I N I S T R Y O F F I S H E R I E S A N D F O R E S T S
1012015 Annual Corporate Plan
SEG: 8 Biodiversity Enhancement – Seaweed Development (R)
STRATEGIES STRATEGIES KEY PERFORMANCE INDICATORS TIMELINE
Q1 Q2 Q3 Q4
Project Management
Adherence to Key Administra-tive Processes involved in Project Management
(i) Number of RIEs to be submitted accord-ing to RIE Checklist 1 1 1 1
(ii) Number of Tender to be submitted ac-cording to standard time period by the Fiji Procurement Office
N/A N/A N/A N/A
Project Implementation
Implementation against work programme
(iii) Number of Activi-ties to be undertaken during the period 4 4 4 4
(iv) Projected Funding to be utilized during the period $67,805 $44,705 $44,685 $42,805
TOTAL BUDGET $ 200,000
SEG: 8 Biodiversity Enhancement – Construction of Multi Species Hatchery – Ra (R)
STRATEGIES STRATEGIES KEY PERFORMANCE INDICATORS TIMELINE
Q1 Q2 Q3 Q4
Project Management
Adherence to Key Administra-tive Processes involved in Project Management
(i) Number of RIEs to be submitted accord-ing to RIE Checklist 1 1 1 1
(ii) Number of Tender to be submitted ac-cording to standard time period by the Fiji Procurement Office
N/A N/A N/A N/A
Project Implementation
Implementation against work programme
(iii) Number of Activi-ties to be undertaken during the period 3 4 2 2
(iv) Projected Funding to be utilized during the period
$67,219.30 $48,019.30 $190,980.7 $193,780.70
TOTAL BUDGET $ 500,000
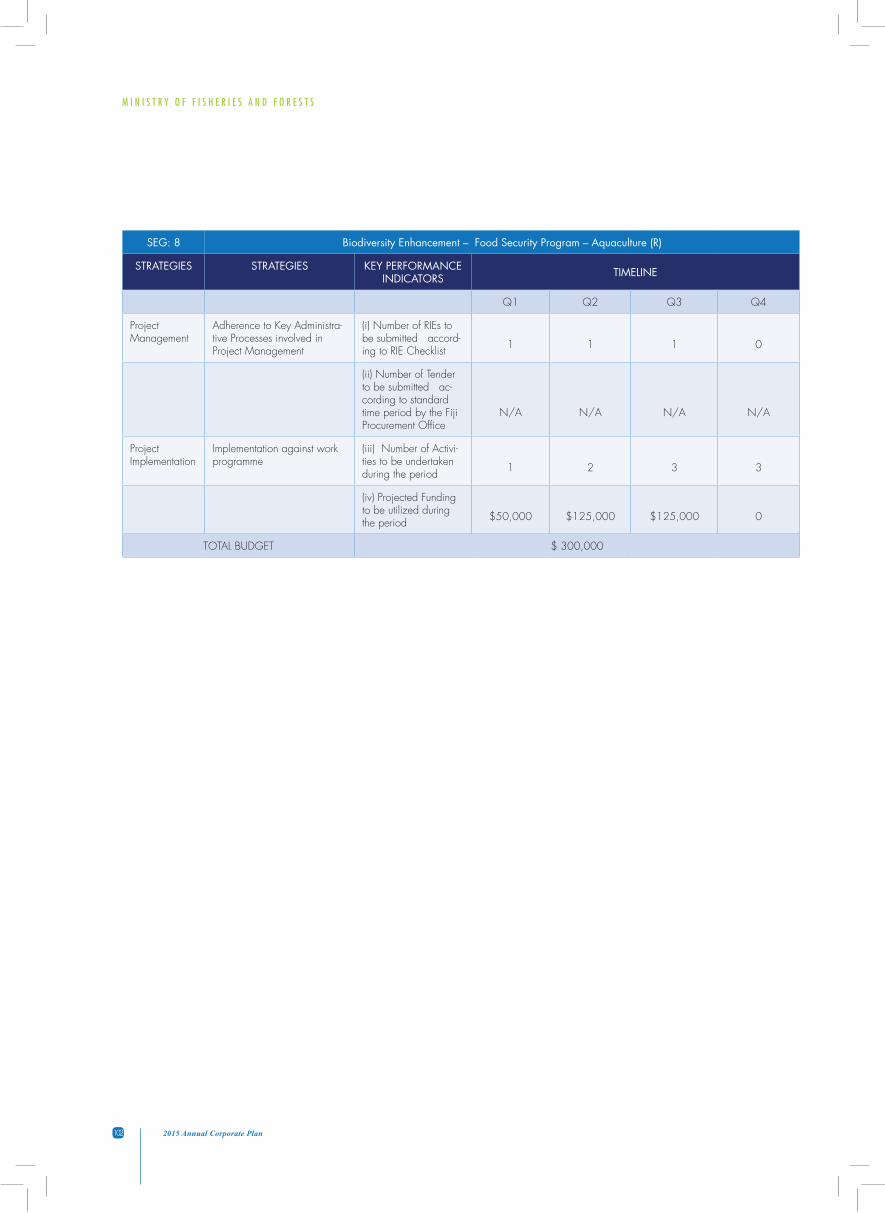
M I N I S T R Y O F F I S H E R I E S A N D F O R E S T S
102 2015 Annual Corporate Plan
SEG: 8 Biodiversity Enhancement – Food Security Program – Aquaculture (R)
STRATEGIES STRATEGIES KEY PERFORMANCE INDICATORS TIMELINE
Q1 Q2 Q3 Q4
Project Management
Adherence to Key Administra-tive Processes involved in Project Management
(i) Number of RIEs to be submitted accord-ing to RIE Checklist 1 1 1 0
(ii) Number of Tender to be submitted ac-cording to standard time period by the Fiji Procurement Office
N/A N/A N/A N/A
Project Implementation
Implementation against work programme
(iii) Number of Activi-ties to be undertaken during the period 1 2 3 3
(iv) Projected Funding to be utilized during the period $50,000 $125,000 $125,000 0
TOTAL BUDGET $ 300,000
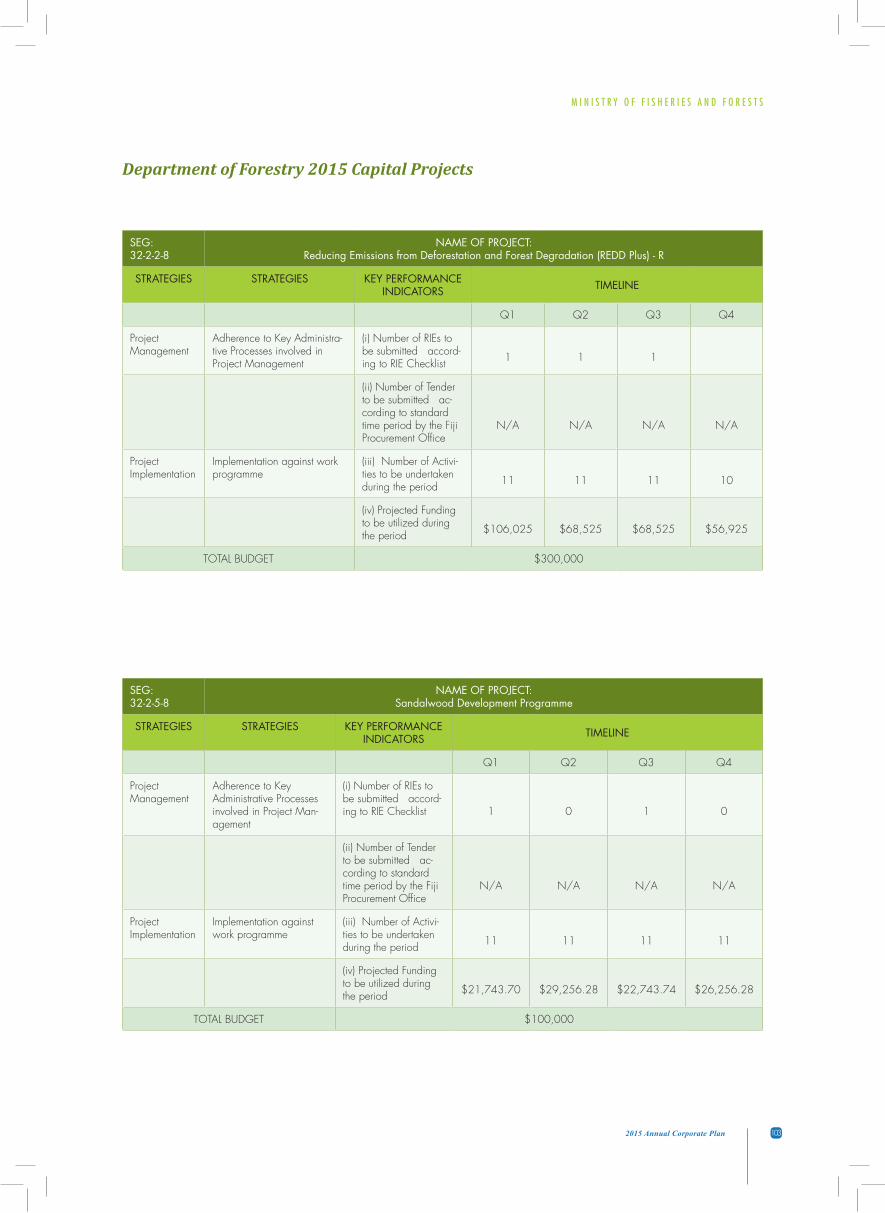
M I N I S T R Y O F F I S H E R I E S A N D F O R E S T S
1032015 Annual Corporate Plan
SEG:32-2-2-8
NAME OF PROJECT: Reducing Emissions from Deforestation and Forest Degradation (REDD Plus) - R
STRATEGIES STRATEGIES KEY PERFORMANCE INDICATORS TIMELINE
Q1 Q2 Q3 Q4
Project Management
Adherence to Key Administra-tive Processes involved in Project Management
(i) Number of RIEs to be submitted accord-ing to RIE Checklist 1 1 1
(ii) Number of Tender to be submitted ac-cording to standard time period by the Fiji Procurement Office
N/A N/A N/A N/A
Project Implementation
Implementation against work programme
(iii) Number of Activi-ties to be undertaken during the period 11 11 11 10
(iv) Projected Funding to be utilized during the period $106,025 $68,525 $68,525 $56,925
TOTAL BUDGET $300,000
SEG:32-2-5-8
NAME OF PROJECT: Sandalwood Development Programme
STRATEGIES STRATEGIES KEY PERFORMANCE INDICATORS TIMELINE
Q1 Q2 Q3 Q4
Project Management
Adherence to Key Administrative Processes involved in Project Man-agement
(i) Number of RIEs to be submitted accord-ing to RIE Checklist 1 0 1 0
(ii) Number of Tender to be submitted ac-cording to standard time period by the Fiji Procurement Office
N/A N/A N/A N/A
Project Implementation
Implementation against work programme
(iii) Number of Activi-ties to be undertaken during the period 11 11 11 11
(iv) Projected Funding to be utilized during the period $21,743.70 $29,256.28 $22,743.74 $26,256.28
TOTAL BUDGET $100,000
Department of Forestry 2015 Capital Projects

M I N I S T R Y O F F I S H E R I E S A N D F O R E S T S
104 2015 Annual Corporate Plan
SEG:32-2-5-8
NAME OF PROJECT: Upgrade of Office & Quarters – Forestry
STRATEGIES STRATEGIES KEY PERFORMANCE INDICATORS TIMELINE
Q1 Q2 Q3 Q4
Project Management
Adherence to Key Administra-tive Processes involved in Project Management
(i) Number of RIEs to be submitted accord-ing to RIE Checklist 1 1 1
(ii) Number of Tender to be submitted ac-cording to standard time period by the Fiji Procurement Office
2 0 0 0
Project Implementation
Implementation against work programme
(iii) Number of Activi-ties to be undertaken during the period 11 11 11 10
(iv) Projected Funding to be utilized during the period $90,000 $360,000 $50,000 $0
TOTAL BUDGET $500,000
SEG:32-2-5-8
NAME OF PROJECT: Research & Development of Wood & Non-Wood Species
STRATEGIES STRATEGIES KEY PERFORMANCE INDICATORS TIMELINE
Q1 Q2 Q3 Q4
Project Management
Adherence to Key Administra-tive Processes involved in Project Management
(i) Number of RIEs to be submitted accord-ing to RIE Checklist 0 0 0 0
(ii) Number of Tender to be submitted ac-cording to standard time period by the Fiji Procurement Office
N/A N/A N/A N/A
Project Implementation
Implementation against work programme
(iii) Number of Activi-ties to be undertaken during the period 4 4 4 4
(iv) Projected Funding to be utilized during the period $57,631.75 $25,631.75 $43,104.75 $22,631.75
TOTAL BUDGET $150,000
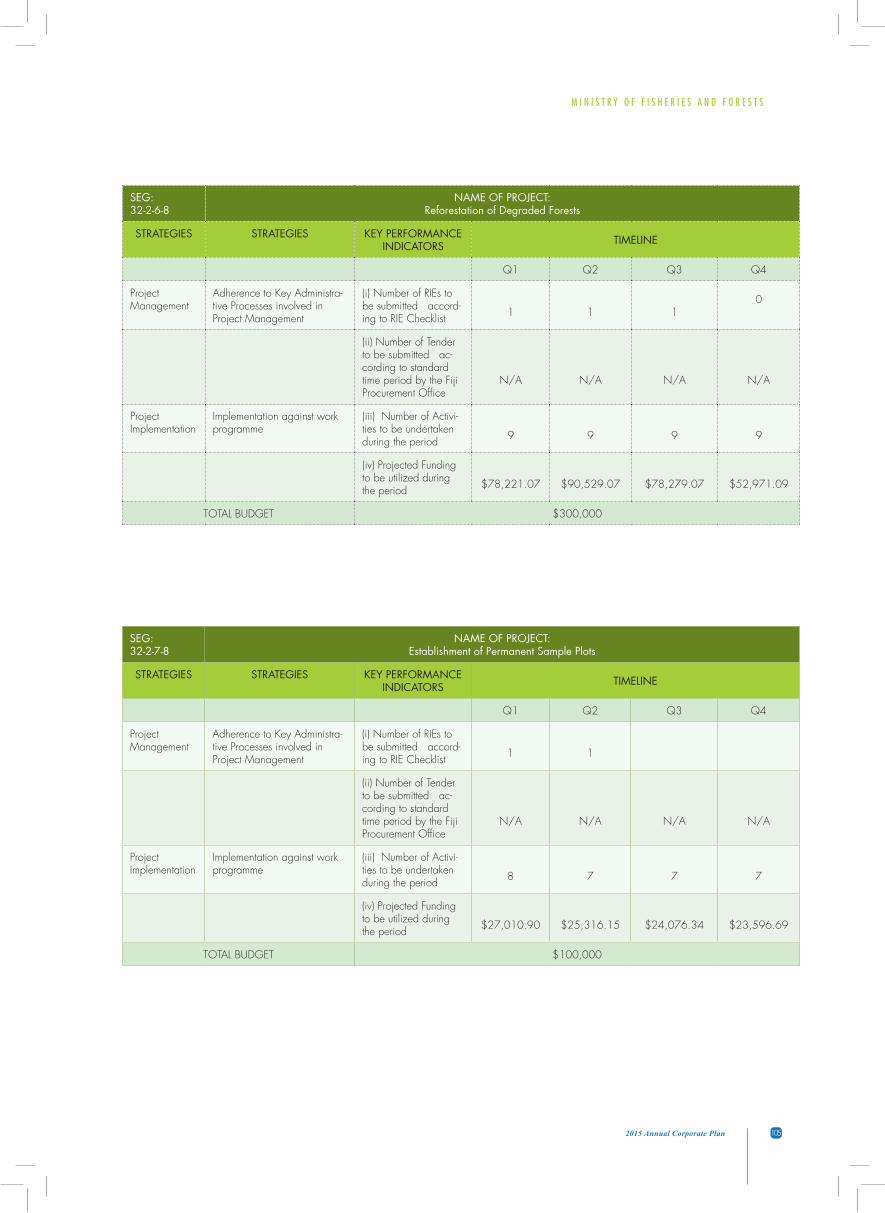
M I N I S T R Y O F F I S H E R I E S A N D F O R E S T S
1052015 Annual Corporate Plan
SEG:32-2-6-8
NAME OF PROJECT: Reforestation of Degraded Forests
STRATEGIES STRATEGIES KEY PERFORMANCE INDICATORS TIMELINE
Q1 Q2 Q3 Q4
Project Management
Adherence to Key Administra-tive Processes involved in Project Management
(i) Number of RIEs to be submitted accord-ing to RIE Checklist 1 1 1
0
(ii) Number of Tender to be submitted ac-cording to standard time period by the Fiji Procurement Office
N/A N/A N/A N/A
Project Implementation
Implementation against work programme
(iii) Number of Activi-ties to be undertaken during the period 9 9 9 9
(iv) Projected Funding to be utilized during the period $78,221.07 $90,529.07 $78,279.07 $52,971.09
TOTAL BUDGET $300,000
SEG:32-2-7-8
NAME OF PROJECT: Establishment of Permanent Sample Plots
STRATEGIES STRATEGIES KEY PERFORMANCE INDICATORS TIMELINE
Q1 Q2 Q3 Q4
Project Management
Adherence to Key Administra-tive Processes involved in Project Management
(i) Number of RIEs to be submitted accord-ing to RIE Checklist 1 1
(ii) Number of Tender to be submitted ac-cording to standard time period by the Fiji Procurement Office
N/A N/A N/A N/A
Project Implementation
Implementation against work programme
(iii) Number of Activi-ties to be undertaken during the period 8 7 7 7
(iv) Projected Funding to be utilized during the period $27,010.90 $25,316.15 $24,076.34 $23,596.69
TOTAL BUDGET $100,000
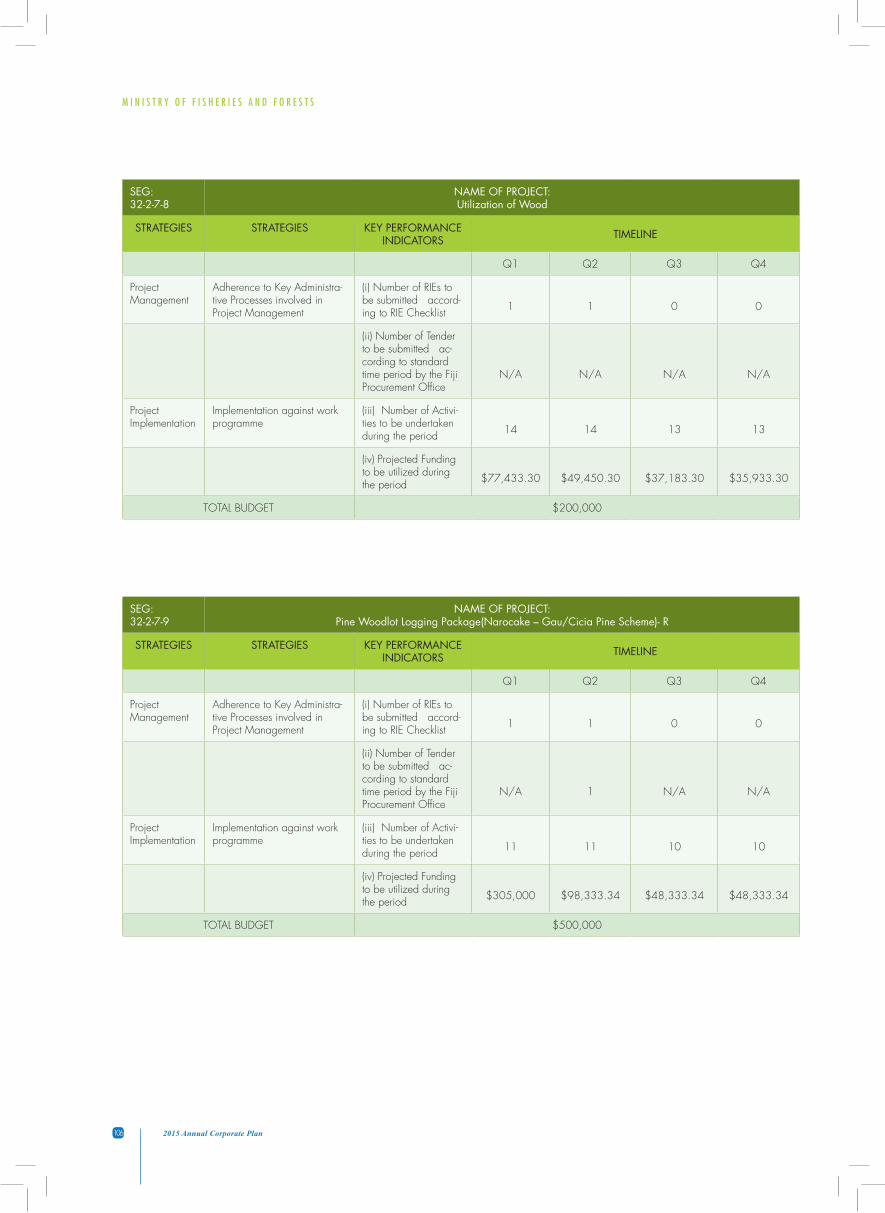
M I N I S T R Y O F F I S H E R I E S A N D F O R E S T S
106 2015 Annual Corporate Plan
SEG:32-2-7-8
NAME OF PROJECT: Utilization of Wood
STRATEGIES STRATEGIES KEY PERFORMANCE INDICATORS TIMELINE
Q1 Q2 Q3 Q4
Project Management
Adherence to Key Administra-tive Processes involved in Project Management
(i) Number of RIEs to be submitted accord-ing to RIE Checklist 1 1 0 0
(ii) Number of Tender to be submitted ac-cording to standard time period by the Fiji Procurement Office
N/A N/A N/A N/A
Project Implementation
Implementation against work programme
(iii) Number of Activi-ties to be undertaken during the period 14 14 13 13
(iv) Projected Funding to be utilized during the period $77,433.30 $49,450.30 $37,183.30 $35,933.30
TOTAL BUDGET $200,000
SEG:32-2-7-9
NAME OF PROJECT: Pine Woodlot Logging Package(Narocake – Gau/Cicia Pine Scheme)- R
STRATEGIES STRATEGIES KEY PERFORMANCE INDICATORS TIMELINE
Q1 Q2 Q3 Q4
Project Management
Adherence to Key Administra-tive Processes involved in Project Management
(i) Number of RIEs to be submitted accord-ing to RIE Checklist 1 1 0 0
(ii) Number of Tender to be submitted ac-cording to standard time period by the Fiji Procurement Office
N/A 1 N/A N/A
Project Implementation
Implementation against work programme
(iii) Number of Activi-ties to be undertaken during the period 11 11 10 10
(iv) Projected Funding to be utilized during the period $305,000 $98,333.34 $48,333.34 $48,333.34
TOTAL BUDGET $500,000
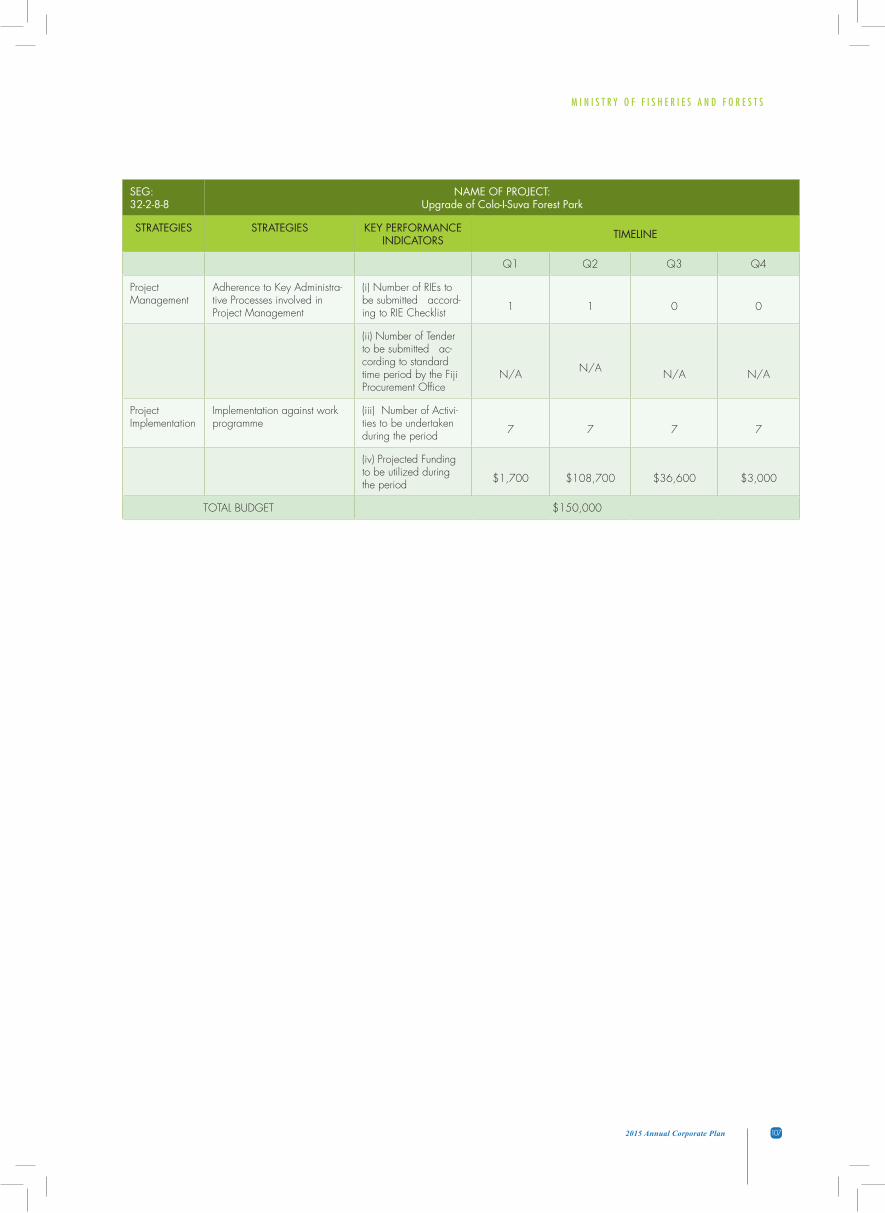
M I N I S T R Y O F F I S H E R I E S A N D F O R E S T S
1072015 Annual Corporate Plan
SEG:32-2-8-8
NAME OF PROJECT: Upgrade of Colo-I-Suva Forest Park
STRATEGIES STRATEGIES KEY PERFORMANCE INDICATORS TIMELINE
Q1 Q2 Q3 Q4
Project Management
Adherence to Key Administra-tive Processes involved in Project Management
(i) Number of RIEs to be submitted accord-ing to RIE Checklist 1 1 0 0
(ii) Number of Tender to be submitted ac-cording to standard time period by the Fiji Procurement Office
N/A N/A N/A N/A
Project Implementation
Implementation against work programme
(iii) Number of Activi-ties to be undertaken during the period 7 7 7 7
(iv) Projected Funding to be utilized during the period $1,700 $108,700 $36,600 $3,000
TOTAL BUDGET $150,000
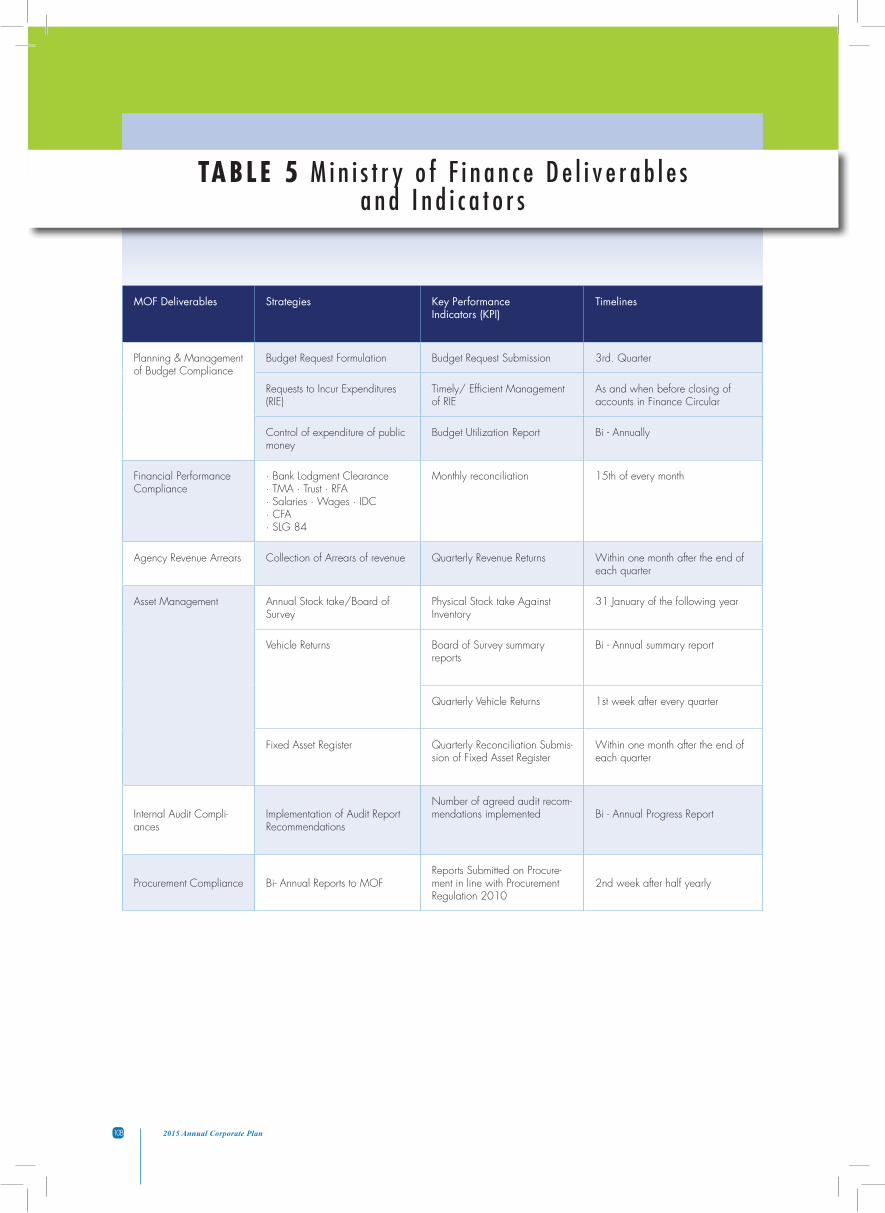
M I N I S T R Y O F F I S H E R I E S A N D F O R E S T S
108 2015 Annual Corporate Plan
TABLE 5 M i n i s t r y o f F i n a n c e D e l i v e r a b l e s a n d I n d i c a t o r s
MOF Deliverables Strategies Key PerformanceIndicators (KPI)
Timelines
Planning & Management of Budget Compliance
Budget Request Formulation Budget Request Submission 3rd. Quarter
Requests to Incur Expenditures (RIE)
Timely/ Efficient Management of RIE
As and when before closing of accounts in Finance Circular
Control of expenditure of public money
Budget Utilization Report Bi - Annually
Financial Performance Compliance
· Bank Lodgment Clearance· TMA · Trust · RFA· Salaries · Wages · IDC· CFA· SLG 84
Monthly reconciliation 15th of every month
Agency Revenue Arrears Collection of Arrears of revenue Quarterly Revenue Returns Within one month after the end of each quarter
Asset Management Annual Stock take/Board of Survey
Physical Stock take Against Inventory
31 January of the following year
Vehicle Returns Board of Survey summary reports
Bi - Annual summary report
Quarterly Vehicle Returns 1st week after every quarter
Fixed Asset Register Quarterly Reconciliation Submis-sion of Fixed Asset Register
Within one month after the end of each quarter
Internal Audit Compli-ances
Implementation of Audit Report Recommendations
Number of agreed audit recom-mendations implemented Bi - Annual Progress Report
Procurement Compliance Bi- Annual Reports to MOFReports Submitted on Procure-ment in line with Procurement Regulation 2010
2nd week after half yearly

M I N I S T R Y O F F I S H E R I E S A N D F O R E S T S
1092015 Annual Corporate Plan
Non- Specific Outputs - Optional
Output Strategies Key PerformanceIndicators (KPI) 2013 Actual 2014 Target Responsible
Division
Promote innovation and best practice in public service delivery
Provide a conducive en-vironment for healthy and motivated workforce
Coordinate improvement initiatives through estab-lished task forces
Monitoring of taskforces
Quantity All Divisions/CSD
•Numberofprograms/ activities (CSD)
•Numberoftaskforce
•Numberoftaskforce report
12
4
12
8
4
Quality
•AcceptancebyPS
•Compliancetoguide lines and procedures
•Effectivenessofthe programs/activities
80%
80%
60%
80%
80%
60%
Timeline
30/12/2014
Cost
All Divisions/Social Committee
Provision of Corporate Social responsibility
Quantity CSD
•Numberofprograms/activities
3 4
Quality
•Acceptancebythe Commission
80% 80%
•Complianceto guidelines
80% 80%
•Effectivenessofthe programs/activities
60% 60%
Timeline
30/12/2013
Cost
All Divisions/Social Committee
M I N I S T R Y O F F I S H E R I E S A N D F O R E S T S
110 2015 Annual Corporate Plan
GLOSSARY
Outcome –impact/effect on the community from the goods and services delivered by agencies.
RDSSED – acronym for the Roadmap for Democracy and Sustainable Socio-Economic Development 2009-2014.
Output –services or goods provided to clients/customers external to the agency.
Internal Output –goods or services of one part of an agency delivered to other parts of the same agency. They contribute indirectly to the production of outputs.
Sub-output –a single output produced along the production process leading to the production/delivery of an output.
Output groups –a collection of outputs (including internal outputs) that are similar in nature.
Output performance measures –an assessment of characteristics of performance that illustrate that an agency has deliv-ered its outputs. These measures relate to quantity, quality and timeliness.
Performance targets –numerical target levels of performance against which actual performance can be compared.