mining group movement patterns
TRANSCRIPT
Mining Group Movement Patterns for TrackingMoving Objects Efficiently
Hsiao-Ping Tsai, Member, IEEE, De-Nian Yang, and Ming-Syan Chen, Fellow, IEEE
Abstract—Existing object tracking applications focus on finding the moving patterns of a single object or all objects. In contrast, we
propose a distributed mining algorithm that identifies a group of objects with similar movement patterns. This information is important in
some biological research domains, such as the study of animals’ social behavior and wildlife migration. The proposed algorithm
comprises a local mining phase and a cluster ensembling phase. In the local mining phase, the algorithm finds movement patterns
based on local trajectories. Then, based on the derived patterns, we propose a new similarity measure to compute the similarity of
moving objects and identify the local group relationships. To address the energy conservation issue in resource-constrained
environments, the algorithm only transmits the local grouping results to the sink node for further ensembling. In the cluster ensembling
phase, our algorithm combines the local grouping results to derive the group relationships from a global view. We further leverage the
mining results to track moving objects efficiently. The results of experiments show that the proposed mining algorithm achieves good
grouping quality, and the mining technique helps reduce the energy consumption by reducing the amount of data to be transmitted.
Index Terms—Distributed clustering, similarity measure, object tracking, WSN.
Ç
1 INTRODUCTION
RECENT advances in location-acquisition technologies,such as global positioning systems (GPSs) and wireless
sensor networks (WSNs), have fostered many novelapplications like object tracking, environmental monitoring,and location-dependent service. These applications gener-ate large amounts of location data, and many approachesfocus on compiling the collected data to identify therepeating movement patterns of objects of interest. Theobjective is to facilitate the analysis of past movements andestimate future movements, as well as support approximatequeries on the original data [17], [34], [38], [48], [52].
In object tracking applications, many natural phenomenashow that moving objects often exhibit some degree ofregularity in their movements. For example, the famousannual wildebeest migration demonstrates that the move-ment of creatures is temporally and spatially correlated. Inaddition, biologists have found that many creatures, such aselephants, zebra, whales, and birds, form large social groupswhen migrating to find food, or for breeding, wintering, or
other unknown reasons. These characteristics indicate thatthe trajectory data of multiple objects may be correlated.Moreover, some research domains, such as the study ofanimals’ social behavior and wildlife migration [41], [44],are more concerned with a group of animals’ movementpatterns than each individual’s. This raises a new challengeof finding moving animals belonging to the same group andidentifying their aggregated movement patterns.
Many researchers model the temporal-and-spatial corre-lations of moving objects as sequential patterns in datamining, and various algorithms have been proposed todiscover frequent movement patterns [17], [33], [34], [37],[48], [52]. However, such works only consider the movementcharacteristics of a single object or all objects. Other works,such as [35], [50], take the euclidean distance to measure thesimilarity of two entire trajectories, and then derive groupsof mobile users based on their movement data. Since objectsmay be close together in some types of terrain, such asgorges, and widely distributed in less rugged areas, such asgrassland, their group relationships are distinct in someareas and vague in others. Instead of applying globalclustering on entire trajectories, examining partial trajec-tories of individual areas shows more opportunities ofrevealing the local group relationships of moving objects.
Another motivation for discovering the group relation-ships and movement patterns behind the trajectories ofmoving objects, such as monkeys or elephants, is to reducetracking costs, especially in resource-constrained environ-ments like WSNs. In a WSN, a large number of miniaturesensor nodes with sensing, computing, and wirelesscommunication capabilities are deployed in remote areasfor various applications, such as environmental monitoringor wildlife tracking. As the sensors are generally battery-powered, recharging a large number of them is difficult;therefore, energy conservation is paramount among all thedesign issues in WSNs [5]. One important characteristic ofWSNs is that sensors are deployed close together to ensurecomplete coverage of the monitored area. As a result, the
266 IEEE TRANSACTIONS ON KNOWLEDGE AND DATA ENGINEERING, VOL. 23, NO. 2, FEBRUARY 2011
. H.-P. Tsai is with the Department of Electrical Engineering (EE), NationalChung Hsing University, No. 250, Kuo Kuang Road, Taichung 402,Taiwan, ROC. E-mail: [email protected].
. D.-N. Yang is with the Institute of Information Science (IIS) and theResearch Center of Information Technology Innovation (CITI), AcademiaSinica, No. 128, Academia Road, Sec. 2, Nankang, Taipei 11529, Taiwan,ROC. E-mail: [email protected].
. M.-S. Chen is with the Research Center of Information TechnologyInnovation (CITI), Academia Sinica, No. 128, Academia Road, Sec. 2,Nankang, Taipei 11529, Taiwan, ROC, and the Department of ElectricalEngineering (EE), Department of Computer Science and InformationEngineer (CSIE), and the Graduate Institute of Communication Engineer-ing (GICE), National Taiwan University, No. 1, Sec. 4, Roosevelt Road,Taipei 10617, Taiwan, ROC. E-mail: [email protected].
Manuscript received 20 July 2008; revised 1 Mar. 2009; accepted 8 Aug. 2009;published online 11 Nov. 2009.Recommended for acceptance by L. Wang.For information on obtaining reprints of this article, please send e-mail to:[email protected], and reference IEEECS Log Number TKDE-2008-07-0372.Digital Object Identifier no. 10.1109/TKDE.2009.202.
1041-4347/11/$26.00 � 2011 IEEE Published by the IEEE Computer Society
sensing fields of multiple sensors overlap, so there is likelyto be some redundancy in readings of nearby sensors or in aseries of readings of a single sensor. Most applicationsincorporate data aggregation techniques to combine datafrom multiple sources and filter redundant data; andthereby, reduce the amount of data and—by extension—theenergy consumption. If we can find moving animalsbelonging to the same group and identify their aggregatedmovement patterns, we can utilize the group relationshipsin data aggregation to reduce long-distance transmissions,or in wake-up scheduling to keep most sensors asleep. Tothe best of our knowledge, little research has been dedicatedto discovering a group of objects with similar movementpatterns for data aggregation purposes. Algorithms fordiscovering the movement patterns of a specific group ofobjects in a resource-constrained environment have notbeen proposed, and related design issues have not beendiscussed in the literature. Moreover, we find that dis-covering the movement patterns of a group of objects ismore difficult than finding the patterns of a single objectbecause we need to identify a group of objects before orafter discovering their movement patterns. To address theseproblems, we first propose a mining framework that canidentify a group of moving objects and discover their groupmovement patterns in a distributed manner. The discoveredinformation is then used in the design of an efficienttracking network. We show that discovering and exploitingthe movement patterns of a group of objects can furtherreduce the transmission costs and thereby conserve energy.
In the first part of the paper, we present our distributedmining algorithm, which is comprised of 1) a local GroupMovement Pattern Mining (GMPMine) algorithm thatextracts local group information, and 2) a Cluster Ensem-bling (CE) algorithm that combines and improves the localgrouping results. To address the energy conservation issuein WSNs, the algorithm only transmits the local groupingresults to the sink node for further ensembling, instead ofall the location data about moving objects. In contrast toapproaches that perform clustering on entire trajectories ata central server, the proposed algorithm discovers thegroup relationship in a distributed manner on sensor nodes.The network structure naturally partitions the trajectories ofmoving objects into segments, which our algorithm uses toidentify the objects’ local group relationships. Thus, we candiscover the group relationships of objects that may beblurred when analyzing an entire trajectory. As a result, wecan aggregate the location data of such objects in areaswhere they have distinct group relationships. Moreover,our algorithm considers the diversity of the number ofgroups and their sizes in the tracking applications. Sincethere are inherent variations in the number of groups andtheir sizes (e.g., elephant herds may contain 8-100 indivi-duals, depending on the environment and family size [1]), itis difficult to predetermine these two parameters. Therefore,we use the HCS algorithm [21] to cluster objects efficientlywithout prespecifying the number of groups or their sizes.
In the second part of the paper, we leverage the miningresults to reduce the number and size of packets in theproposed tracking network, which consistently reports thelocations of moving objects. We utilize the discoveredgroup information to combine the location data of a groupof objects in data aggregation. By using object movementpatterns as the prediction model, we do not need to send
the update packets for the objects whose locations arepredictable. Moreover, the group information enables us toadaptively adjust the range in which a group of objects ismonitored and, thereby, limit the overhead due to floodingwithin that range. Therefore, the proposed design reduceslong-distance transmissions and the amount of data to betransmitted. It also reduces in-network traffic and preventshot spots around the clusterheads (CHs).
The contribution of this paper is threefold. First, wepropose a distributed mining framework to discover grouprelationships as well as group movement patterns. Second,we propose a new pairwise measure based on patternsimilarity to compute the similarity of moving objects.Third, we use the discovered information to track movingobjects efficiently. The remainder of this paper is organizedas follows: In Section 2, we review related works, providean overview of our network model and location model,and define the notations used throughout the paper. InSection 3, we describe the design of our distributed miningalgorithm. Section 4 considers the design aspects of ourtracking network, and Section 5 details our experimentalresults. Then, in Section 6, we summarize our conclusions.
2 PRELIMINARIES
2.1 Related Work
2.1.1 Movement Pattern Mining
The temporal-and-spatial correlations and the regularity inthe trajectory data sets of moving objects are often modeledas sequential patterns for use in data mining. Agrawal andSrikant [4] first defined the sequential pattern miningproblem and proposed an Apriori-like algorithm to minefrequent sequential patterns. Han et al. proposed FreeSpan[20], which is an FP-growth-based algorithm that addressesthe sequential pattern mining problem by considering thepattern-projection method. For handling the uncertainty intrajectories of mobile objects, Yang and Hu [52] developed anew match measure and proposed TrajPattern to minesequential patterns from imprecise trajectories. Moreover, anumber of research works have been elaborated uponmining traversal patterns for various applications. Forexample, Chen et al. [13] proposed the FS and SS algorithmsfor mining path traversal patterns in a Web environmentwhile Peng and Chen [37] proposed an incrementalalgorithm to mine user moving patterns for data allocationin a mobile computing system. However, sequentialpatterns or path traversal patterns do not provide sufficientinformation for location prediction or clustering. Thereasons are as follows: First, for sequential pattern miningor path traversal pattern mining extract frequent patterns ofall objects, meaningful movement characteristics of indivi-dual objects may be ignored. Second, a sequential pattern ora traversal pattern carries no time information betweenconsecutive items, so they cannot provide accurate in-formation for location prediction when time is concerned.Third, sequential patterns are not full representative toindividual trajectories because a sequential pattern does notcontain the information about the number of times it occursin each individual trajectory. To discover significantpatterns for location prediction, Morzy proposed Apriori-Traj [33] and Traj-PrefixSpan [34] to mine frequenttrajectories, where consecutive items of a frequent trajectoryare also adjacent in the original trajectory data. Meanwhile,
TSAI ET AL.: MINING GROUP MOVEMENT PATTERNS FOR TRACKING MOVING OBJECTS EFFICIENTLY 267
the approach in [17] extracts T-patterns from spatialtemporal data sets to provide concise descriptions offrequent movements. Tseng and Lin [48] proposed theTMP-Mine algorithm for discovering the temporal move-ment patterns of objects. However, the above Apriori-like orFP-growth-based algorithms suffer from computing effi-ciency or memory problems, which make them unsuitablefor use in resource-constrained environments. In addition,they focus on discovering frequent patterns of all objects.
2.1.2 Trajectory Clustering
Recently, clustering based on objects’ movement behaviorhas attracted more attention. For example, Li et al. [30]employ Moving Microclusters (MMC) to discover andmaintain a cluster of moving objects online. Meanwhile,Lee et al. [28] proposed trajectory clustering to discoverpopular movement paths. Clustering similar trajectorysequences to discover group relationships is closely relatedto our problem. Wang et al. [50] transform the locationsequences into a transaction-like data on users and based onwhich to obtain a valid group. However, the proposed AGPand VG-growth algorithms are Apriori-like or FP-growth-based algorithms that suffer from high computing cost andmemory demand. Nanni and Pedreschi [35] apply adensity-based clustering algorithm to the trajectory cluster-ing problem based on the average euclidean distance of twotrajectories. However, the above works that discover groupinformation based on the proportion of the time a group ofusers stay close together or the average euclidean distanceof the entire trajectories may not reveal the local grouprelationships, which are required for many applications.
2.1.3 Similarity Measure
Identifying the similarity (or distance) between twotrajectories is essential for clustering. Computing theaverage euclidean distance of two geometric trajectories isa simple and useful approach. Nevertheless, the geometriccoordinates are expensive and not always available. Otherapproaches, such as EDR, LCSS, and DTW, are widely usedto compute the similarity of symbolic sequences [12].However, the above dynamic programming approachessuffer from scalability problem [19]. Therefore, approxima-tion or summarization techniques are used to representoriginal data for providing scalability. For example,Guralnik and Karypis [19] represent each data sequenceby a vector whose dimensions are the sequential patterns,and use a vector-based K-means algorithm to find theclusters of objects. But there are two issues of this approach.First, as mentioned previously, sequential patterns areunsuitable for our applications. Second, since meaningfulpatterns are underpruned if the minimum support thresh-old is not adequate, the importance of a sequential patternregarding different sequences can be very different. How-ever, when projecting each data sequence into a vectorspace of sequential patterns, the importance of a sequentialpattern regarding to each data sequence is not mentioned.In addition, Yang and Wang [53] employ a probabilisticsuffix tree to learn the structural features of sequences andproposed a new similarity measure which computes thesimilarity of a probabilistic suffix tree and a sequence. Theirclustering algorithm iteratively identifies a sequence to acluster and adjusts the representative probabilistic suffixtree for each cluster. However, the generated clusters may
overlap which differentiates their objective from ours. Inaddition, once the tree or the sequence is changed,recalculating their similarity requires repeating the wholesimilarity computing process, which is not desirable forresource-constrained or streaming environments.
2.1.4 Distributed Clustering
Distributed clustering is an important research topic. Mostof the approaches proposed in the literature focus onseeking a combination of multiple clustering results toachieve better clustering quality, stability, and scalability.For example, Strehl and Ghosh [46] introduced andformulated the clustering ensemble problem to a hyper-graph partitioning problem, and proposed CSPA, HGPA,and MCLA to compute the best K-partition of the graph.Ayad et al. [8] presented a probabilistic model to combinecluster ensembles by utilizing information theoretic mea-sures. Fred and Jain [16] combine multiple runs of theK-means algorithm with random initializations and randomnumbers to obtain the final consensus partition. Fern andBrodley [15] apply random projection to the high dimen-sional data and cluster the reduced data by using EM for asingle run of clustering. The Collective PCA technique [24]proposed by Kargupta et al. is applied to reduce the vectordimension for distributed clustering of high dimensionalheterogeneous data. However, since the trajectory data setis composed of sequential data, one of the challengesaddressed in our paper is the similarity comparison oflocation sequences. The data types of the above works [8],[15], [16], [24], [46] are most integer vector or categoricaldata, and their related issues are thereby different fromours. In addition, previous works that require a predeter-mined k in their clustering or ensembling algorithms are notsuitable for our applications. Besides, although the localgrouping results in a vector of integers, each of whichrepresents the mapping between an object and its belonginggroup, dimension reduction like Collective PCA [24] isunnecessary in our case.
2.2 Hierarchical Network Structure and LocationModel
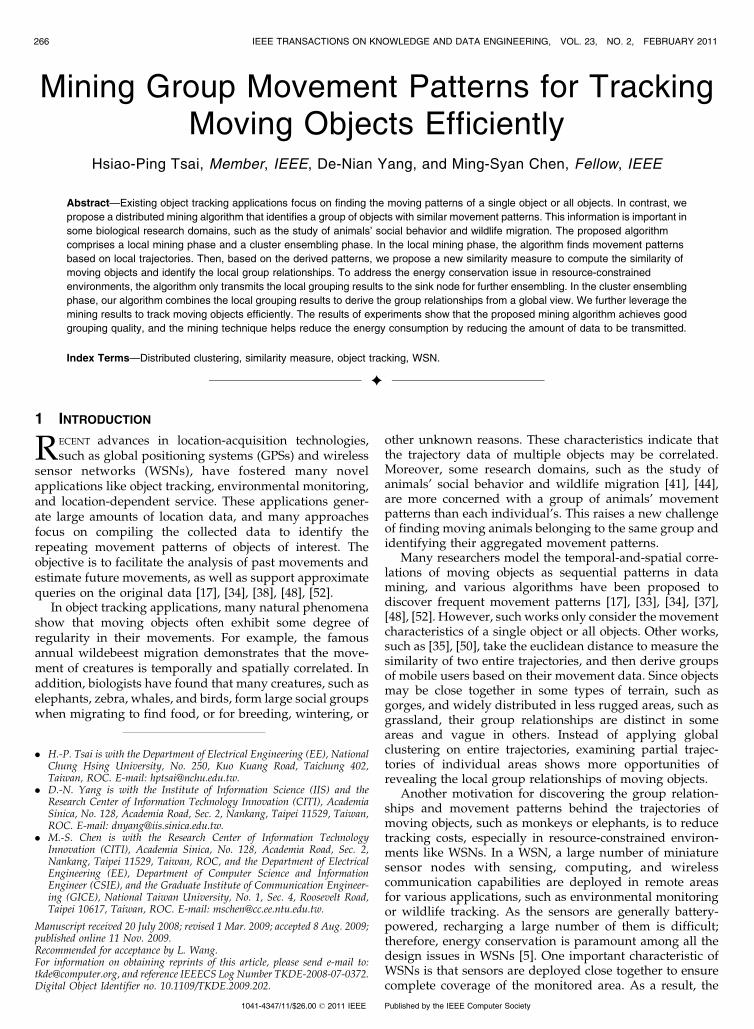
Many researchers believe that a hierarchical architectureprovides better coverage and scalability, and also extendsthe network lifetime of WSNs [47], [56]. In a hierarchicalWSN, such as that proposed in [36], the energy, computing,and storage capacity of sensors are heterogeneous. A high-end sophisticated node, such as Intel Stargate [3], is assignedas a CH to perform high complexity tasks; while a resource-constrained node, such as Mica2 mote [2], performs thesensing and low complexity tasks. In this work, we adopt ahierarchical and cluster-based network structure withK layers. As shown in Fig. 1a, the nodes are clustered ineach level, and each cluster is a mesh network of fixed size,i.e., each cluster is a set of n� n sensors. We assume thateach sensor in a cluster has a locally unique ID, and denotethe sensor IDs by an alphabet �. Fig. 1b shows an example ofa two-layer network structure, where each cluster contains16 nodes whose IDs are identified by � ¼ fa; b; . . . ; pg.
A cluster of sensors communicate with each other byusing multihop routing, and wake up on their duty cycles tocarry out a given task [6]. They collaboratively gather orrelay remote information to a base station called a sink.Take the tracking application for example. When a sensor
268 IEEE TRANSACTIONS ON KNOWLEDGE AND DATA ENGINEERING, VOL. 23, NO. 2, FEBRUARY 2011
wakes up and detects an object of interest, it transmits thelocation data of the object to its CH and then enters thesleep mode. The CH aggregates the data and forwards it tothe CH of the upper layer. The process is repeated until thesink node receives the location data. The data flow is asshown in Fig. 1. When a task of discovering the grouprelationships of objects is assigned, it is unnecessary totransmit all the location data to the sink for postprocessing.In our design, CHs collect the location data for a period andgenerate location sequence data sets locally. Then, based onthe data sets, our mining algorithm tries to discover thegroup relationships about the objects of interest.
Geometric models and symbolic models are widely usedto represent the location of objects [22]. A geometric locationdenotes precise two-dimension or three-dimension coordi-nates; while a symbolic location represents an area, such asthe sensing area of a sensor or a group of sensors, definedby the applications. Since the accurate geometric location isnot easy to obtain, in this work, we employ a symbolicmodel and take the sensors’ IDs as the locations of an objectof interest. Sensors are closely deployed to ensure completecoverage of the monitored area, but this causes consistencyand redundancy problems. Techniques like the ReceivedSignal Strength (RSS) [29] simply estimate an object’slocation based on the ID of the sensor with the strongestsignal and eliminate unnecessary transmissions. The trajec-tory of a moving object is thus modeled as an orderedsequence of sensor IDs, i.e., a location sequence denoted bys ¼ �0�1...�l�1, where �i 2 � and l is the sequence length.
2.3 Variable Length Markov Model (VMM) andProbabilistic Suffix Tree (PST)
If the movement of an object is regular, the object’s nextlocation can be predicted based on its preceding locations.We leverage the temporal-and-spatial correlations of themoving object and use a VMM to model the statistics.Under this model, an object’s movement is modeled by theconditional probability distribution over � for a givenlocation sequence data set. Specifically, for a locationsequence s over � and a symbol � 2 �, P ð�jsÞ is theconditional probability that � will follow s. The length of sis floating, which provides the flexibility to adapt to thevariable length of movement patterns.
Among many implementations of VMM, PST [40] has thelowest storage requirement [25]. The PST building algorithm1
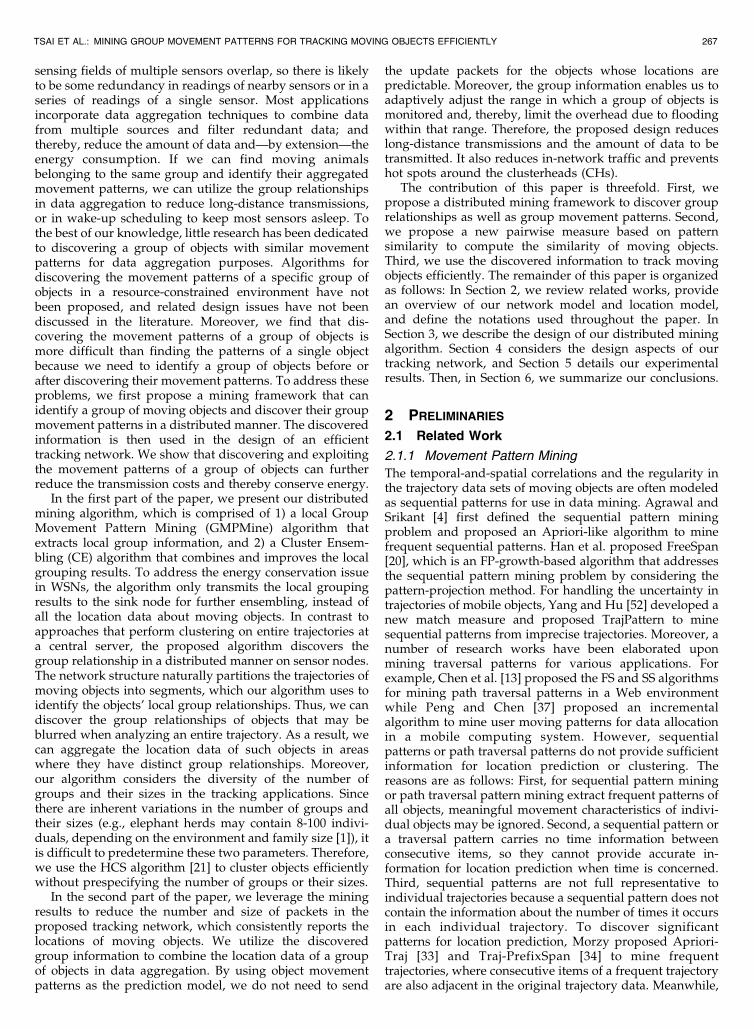
extracts significant patterns from a data set, prunes unneces-sary nodes during tree construction, and then generates aPST. Each node in the tree is labeled by a string s, whichrepresents a significant pattern with occurrence probabilityabove the minimal threshold Pmin. Each node carries theconditional empirical probabilities, i.e., P ð�jsÞ, for every� 2 �, and the maximal length of s is specified by Lmax. Forexample, as shown in Fig. 2, nodejf is a child of nodef withrespect to symbol j. It represents a significant pattern withs ¼ 00jf 00, whose occurrence probability is above 0.01. Theconditional empirical probabilities are P ð0b0j00jf 00Þ ¼ 0:33,P ð0e0j00jf 00Þ ¼ 0:67, and P ð�j00jf 00Þ ¼ 0 for the other � 2 �.
The PST algorithm has an excellent capacity for extract-ing structural information from sequences. Its low complex-ity, i.e., OðlÞ in both time and space [7], makes it moreattractive to be used in streaming or resource-constrainedenvironments. Compared with algorithms that mine allaccurate frequent patterns, the compact tree structure andthe controllable size of a PST are particularly useful inresource-constrained environments. For example, if theconditional probabilities of a pattern “ABCD” are similarto those of “BCD,” PST will only store “BCD.” Moreover,PST is efficient in predicting the occurrence probability of asequence or predicting the next symbol of a sequence. Theoccurrence probability of a sequence s regarding to a PST T ,denoted by PT ðsÞ, is the prediction of the occurrenceprobability of s based on T . For example, given a PST T , asshown in Fig. 2, the occurrence probability PT ð00nokjfb00Þ iscomputed as follows:
PT ð00nokjfb00Þ ¼ PT ð00n00Þ � PT ð0o0j00n00Þ � PT ð0k0j00no00Þ� PT ð0j0j00nok00Þ � PT ð0f 0j00nokj00Þ� PT ð0b0j00nokjf 00Þ¼ PT ð00n00Þ � PT ð0o0j00n00Þ � PT ð0k0j00o00Þ� PT ð0j0j00k00Þ � PT ð0f 0j00j00Þ � PT ð0b0j00okjf 00Þ¼ 0:05� 1� 1� 1� 1� 0:33
¼ 0:0165:
For a given sequence s and a PST T , our predict_nextalgorithm2 outputs the next most likely symbol �. Weexplain the algorithm by an example to demonstrate theefficiency of the algorithm. Given a sequence s ¼ 00nokjf 00
TSAI ET AL.: MINING GROUP MOVEMENT PATTERNS FOR TRACKING MOVING OBJECTS EFFICIENTLY 269
Fig. 1. (a) The hierarchical and cluster-based network structure and thedata flow of an update-based tracking network. (b) A flat view of a two-layer tracking network. Fig. 2. The movement of an object and its PST.
1. Given in Appendix 1, which can be found on the Computer SocietyDigital Library at http://doi.ieeecomputersociety.org/10.1109/TKDE.2009.202.
2. Given in Appendix 2, which can be found on the Computer SocietyDigital Library at http://doi.ieeecomputersociety.org/10.1109/TKDE.2009.202.
and a PST T , as shown in Fig. 2, the predict_next algorithmtraverses T to the deepest node nodeokjf based on s. Thepath includes noderoot, nodef , nodejf , nodekjf , and nodeokjf .Finally, symbol 0e0, which has the highest conditionalempirical probability in nodeokjf , is returned as the mostprobable next symbol. Since the algorithm’s computationaloverhead is limited by the height of a PST, it is suitable forsensor nodes. Further details about the PST buildingalgorithm and related discussions about parameter settingcan be found in [9], [27]. The notations and key symbolsused in the paper are listed in Table 1.
3 DESIGN OF THE DISTRIBUTED MINING ALGORITHM
In this work, we model the movement of an object by aVMM, and use a PST to mine the significant movementpatterns. The advantages of PST include its computing andstorage efficiency as well as the information it carries. In thetracking application, objects are tracked periodically so thatthe time interval of consecutive items of a location sequenceis implied. The PST building algorithm scans the sequencefor significant movement patterns, whose items are con-strained to be consecutive in the location sequence. This isalso why the computing cost is much lower than sequencepattern mining. Moreover, a PST provides us importantinformation in similarity comparison. For a pattern and aPST, we can predict the occurrence probability of thepattern, which is viewed as the importance of the patternregarding the PST.
A set of moving objects is regarded as belonging to thesame group if they share similar movement patterns. In thissection, we first propose a new similarity measure to definethe pairwise similarity of moving objects. The advantages ofthe new proposed similarity measure simp include itsefficiency and its accuracy. First, simp compares thesimilarity of two objects based on their significant move-ment patterns instead of their entire location sequences. In[54], a variation of PST, named emission tree, is used totrain the patterns in a streaming environment. simp can bedirectly applied to the mature nodes of two emission trees,instead of all nodes. Thus, simp can provide efficiency forthe applications with evolving and evolutionary similarityrelationships.3 Second, it considers the importance of eachmovement pattern regarding to each individual object sothat it achieves better accuracy in similarity comparison.
With the definition of simp,4 two objects are similar if
their similarity score is above a minimal threshold. A set ofobjects is regarded as a group if each object is similar to atleast half the members of the same group. To tackle theproblem of discovering groups of moving objects, wepropose a distributed mining algorithm comprised of aGMPMine algorithm and a CE algorithm as shown in Fig. 3.The GMPMine algorithm uses a PST to generate the
270 IEEE TRANSACTIONS ON KNOWLEDGE AND DATA ENGINEERING, VOL. 23, NO. 2, FEBRUARY 2011
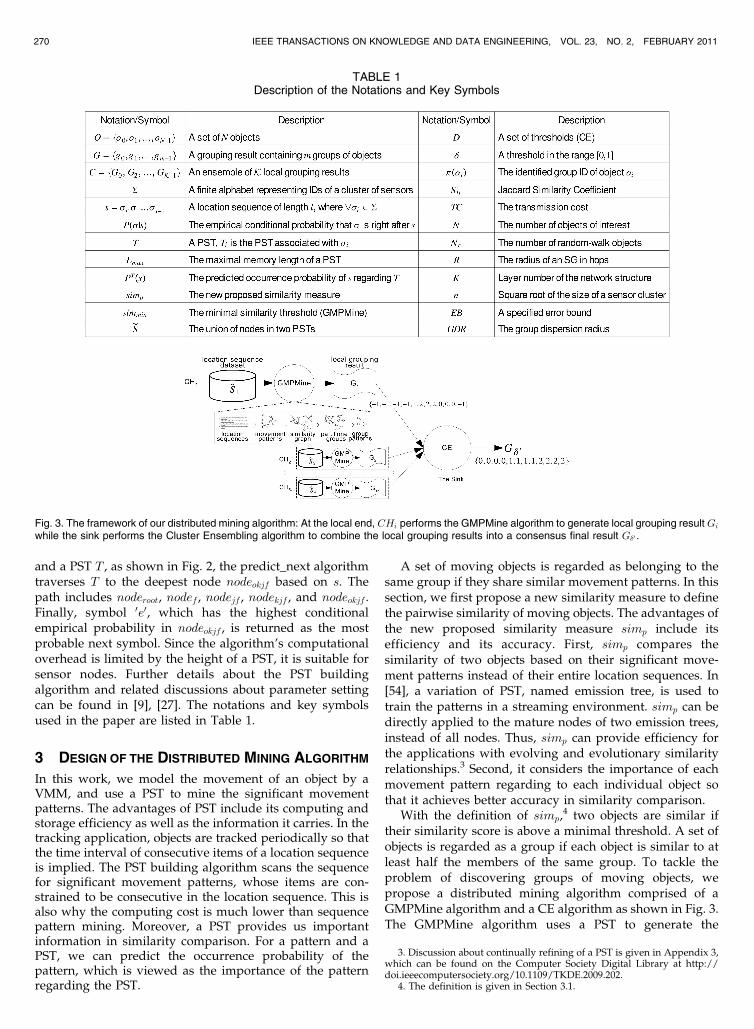
TABLE 1Description of the Notations and Key Symbols
Fig. 3. The framework of our distributed mining algorithm: At the local end, CHi performs the GMPMine algorithm to generate local grouping result Gi
while the sink performs the Cluster Ensembling algorithm to combine the local grouping results into a consensus final result G�0 .
3. Discussion about continually refining of a PST is given in Appendix 3,which can be found on the Computer Society Digital Library at http://doi.ieeecomputersociety.org/10.1109/TKDE.2009.202.
4. The definition is given in Section 3.1.
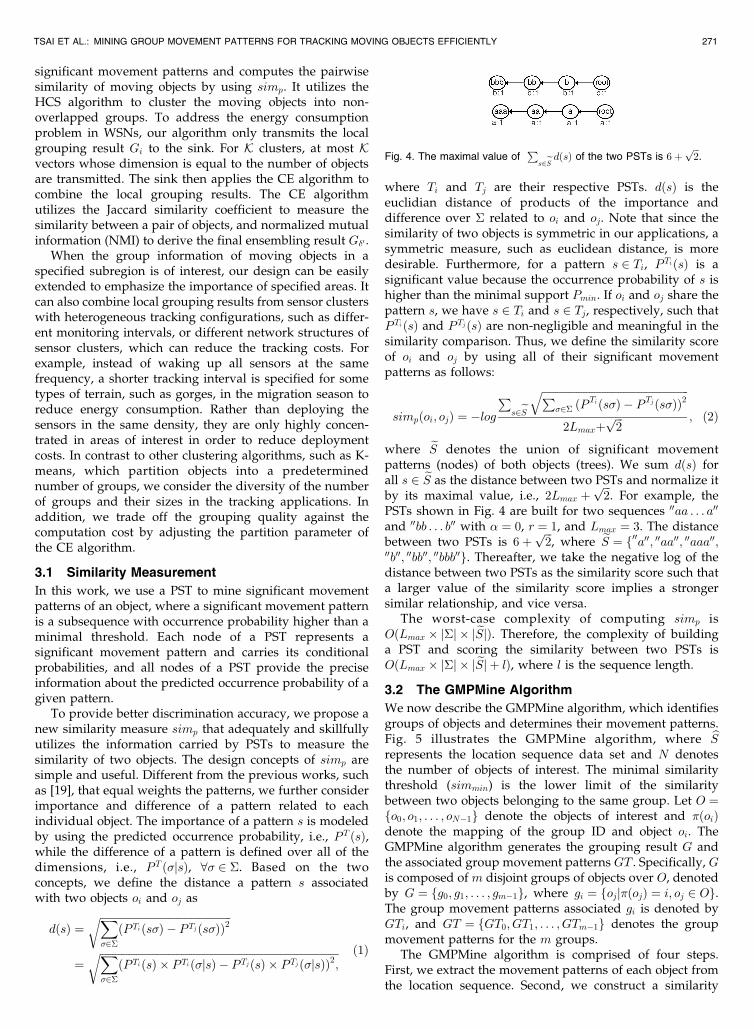
significant movement patterns and computes the pairwisesimilarity of moving objects by using simp. It utilizes theHCS algorithm to cluster the moving objects into non-overlapped groups. To address the energy consumptionproblem in WSNs, our algorithm only transmits the localgrouping result Gi to the sink. For K clusters, at most Kvectors whose dimension is equal to the number of objectsare transmitted. The sink then applies the CE algorithm tocombine the local grouping results. The CE algorithmutilizes the Jaccard similarity coefficient to measure thesimilarity between a pair of objects, and normalized mutualinformation (NMI) to derive the final ensembling result G�0 .
When the group information of moving objects in aspecified subregion is of interest, our design can be easilyextended to emphasize the importance of specified areas. Itcan also combine local grouping results from sensor clusterswith heterogeneous tracking configurations, such as differ-ent monitoring intervals, or different network structures ofsensor clusters, which can reduce the tracking costs. Forexample, instead of waking up all sensors at the samefrequency, a shorter tracking interval is specified for sometypes of terrain, such as gorges, in the migration season toreduce energy consumption. Rather than deploying thesensors in the same density, they are only highly concen-trated in areas of interest in order to reduce deploymentcosts. In contrast to other clustering algorithms, such as K-means, which partition objects into a predeterminednumber of groups, we consider the diversity of the numberof groups and their sizes in the tracking applications. Inaddition, we trade off the grouping quality against thecomputation cost by adjusting the partition parameter ofthe CE algorithm.
3.1 Similarity Measurement
In this work, we use a PST to mine significant movementpatterns of an object, where a significant movement patternis a subsequence with occurrence probability higher than aminimal threshold. Each node of a PST represents asignificant movement pattern and carries its conditionalprobabilities, and all nodes of a PST provide the preciseinformation about the predicted occurrence probability of agiven pattern.
To provide better discrimination accuracy, we propose anew similarity measure simp that adequately and skillfullyutilizes the information carried by PSTs to measure thesimilarity of two objects. The design concepts of simp aresimple and useful. Different from the previous works, suchas [19], that equal weights the patterns, we further considerimportance and difference of a pattern related to eachindividual object. The importance of a pattern s is modeledby using the predicted occurrence probability, i.e., PT ðsÞ,while the difference of a pattern is defined over all of thedimensions, i.e., PT ð�jsÞ, 8� 2 �. Based on the twoconcepts, we define the distance a pattern s associatedwith two objects oi and oj as
dðsÞ ¼ffiffiffiffiffiffiffiffiffiffiffiffiffiffiffiffiffiffiffiffiffiffiffiffiffiffiffiffiffiffiffiffiffiffiffiffiffiffiffiffiffiffiffiffiffiffiffiffiffiffiX�2�
ðPTiðs�Þ � PTjðs�ÞÞ2r
¼ffiffiffiffiffiffiffiffiffiffiffiffiffiffiffiffiffiffiffiffiffiffiffiffiffiffiffiffiffiffiffiffiffiffiffiffiffiffiffiffiffiffiffiffiffiffiffiffiffiffiffiffiffiffiffiffiffiffiffiffiffiffiffiffiffiffiffiffiffiffiffiffiffiffiffiffiffiffiffiffiffiffiffiffiffiffiffiffiffiffiffiX�2�
ðPTiðsÞ � PTið�jsÞ � PTjðsÞ � PTjð�jsÞÞ2;r ð1Þ
where Ti and Tj are their respective PSTs. dðsÞ is theeuclidian distance of products of the importance anddifference over � related to oi and oj. Note that since thesimilarity of two objects is symmetric in our applications, asymmetric measure, such as euclidean distance, is moredesirable. Furthermore, for a pattern s 2 Ti, PTiðsÞ is asignificant value because the occurrence probability of s ishigher than the minimal support Pmin. If oi and oj share thepattern s, we have s 2 Ti and s 2 Tj, respectively, such thatPTiðsÞ and PTjðsÞ are non-negligible and meaningful in thesimilarity comparison. Thus, we define the similarity scoreof oi and oj by using all of their significant movementpatterns as follows:
simpðoi; ojÞ ¼ �logP
s2eSffiffiffiffiffiffiffiffiffiffiffiffiffiffiffiffiffiffiffiffiffiffiffiffiffiffiffiffiffiffiffiffiffiffiffiffiffiffiffiffiffiffiffiffiffiffiffiffiffiffiffiffiffiffiffiffiP
�2� ðPTiðs�Þ � PTjðs�ÞÞ2
q2Lmaxþ
ffiffiffi2p ; ð2Þ
where eS denotes the union of significant movementpatterns (nodes) of both objects (trees). We sum dðsÞ forall s 2 eS as the distance between two PSTs and normalize itby its maximal value, i.e., 2Lmax þ
ffiffiffi2p
. For example, thePSTs shown in Fig. 4 are built for two sequences 00aa . . . a00
and 00bb . . . b00 with � ¼ 0, r ¼ 1, and Lmax ¼ 3. The distancebetween two PSTs is 6þ
ffiffiffi2p
, where eS ¼ f00a00; 00aa00; 00aaa00;00b00; 00bb00; 00bbb00g. Thereafter, we take the negative log of thedistance between two PSTs as the similarity score such thata larger value of the similarity score implies a strongersimilar relationship, and vice versa.
The worst-case complexity of computing simp isOðLmax � j�j � jeSjÞ. Therefore, the complexity of buildinga PST and scoring the similarity between two PSTs isOðLmax � j�j � jeSj þ lÞ, where l is the sequence length.
3.2 The GMPMine Algorithm
We now describe the GMPMine algorithm, which identifiesgroups of objects and determines their movement patterns.Fig. 5 illustrates the GMPMine algorithm, where bSrepresents the location sequence data set and N denotesthe number of objects of interest. The minimal similaritythreshold (simmin) is the lower limit of the similaritybetween two objects belonging to the same group. Let O ¼fo0; o1; . . . ; oN�1g denote the objects of interest and �ðoiÞdenote the mapping of the group ID and object oi. TheGMPMine algorithm generates the grouping result G andthe associated group movement patterns GT . Specifically, Gis composed of m disjoint groups of objects over O, denotedby G ¼ fg0; g1; . . . ; gm�1g, where gi ¼ fojj�ðojÞ ¼ i; oj 2 Og.The group movement patterns associated gi is denoted byGTi, and GT ¼ fGT0; GT1; . . . ; GTm�1g denotes the groupmovement patterns for the m groups.
The GMPMine algorithm is comprised of four steps.First, we extract the movement patterns of each object fromthe location sequence. Second, we construct a similarity
TSAI ET AL.: MINING GROUP MOVEMENT PATTERNS FOR TRACKING MOVING OBJECTS EFFICIENTLY 271
Fig. 4. The maximal value ofP
s2eS dðsÞ of the two PSTs is 6þffiffiffi2p
.
graph in which similar objects are connected by an edge.
Third, we extract highly connected components to derive
the group information. Fourth, we construct a group PST
for each group in order to conserve the memory space. In
the next section, we describe the steps in detail.
3.2.1 Building PSTs for All Objects
In this step, we learn the movement patterns and construct
a PST for each object. As shown in Lines 3 and 4 of Fig. 5, for
the location sequence data set with N location sequences,
we compute the movement patterns and generate N PSTs.
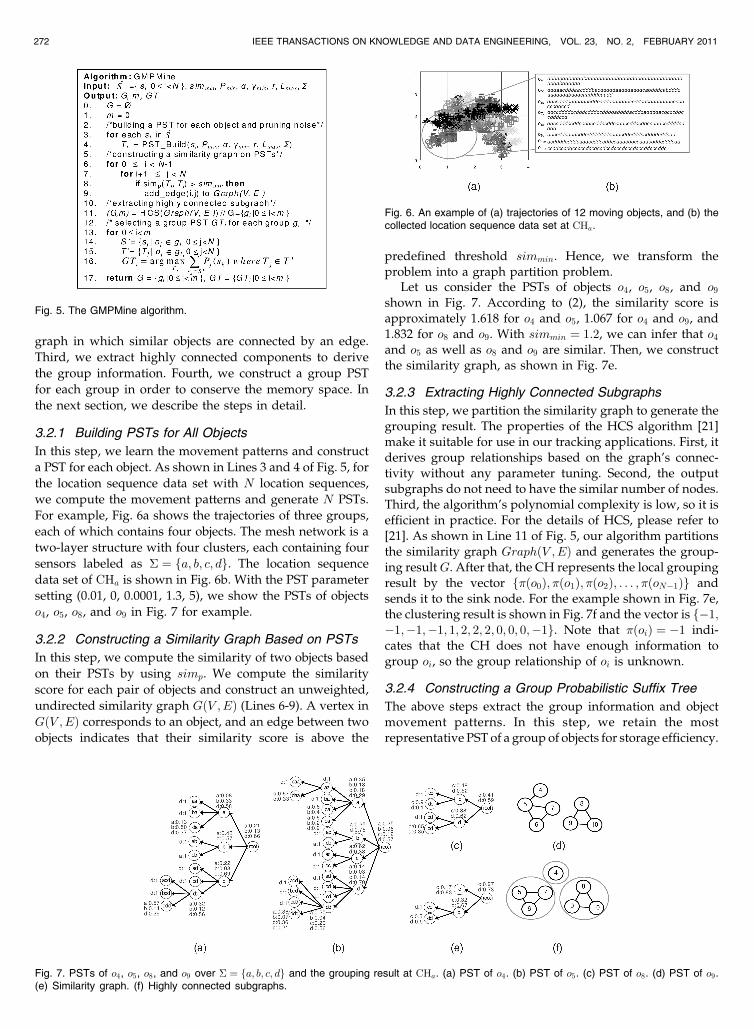
For example, Fig. 6a shows the trajectories of three groups,
each of which contains four objects. The mesh network is a
two-layer structure with four clusters, each containing four
sensors labeled as � ¼ fa; b; c; dg. The location sequence
data set of CHa is shown in Fig. 6b. With the PST parameter
setting (0.01, 0, 0.0001, 1.3, 5), we show the PSTs of objects
o4, o5, o8, and o9 in Fig. 7 for example.
3.2.2 Constructing a Similarity Graph Based on PSTs
In this step, we compute the similarity of two objects based
on their PSTs by using simp. We compute the similarity
score for each pair of objects and construct an unweighted,
undirected similarity graph GðV ;EÞ (Lines 6-9). A vertex in
GðV ;EÞ corresponds to an object, and an edge between two
objects indicates that their similarity score is above the
predefined threshold simmin. Hence, we transform theproblem into a graph partition problem.
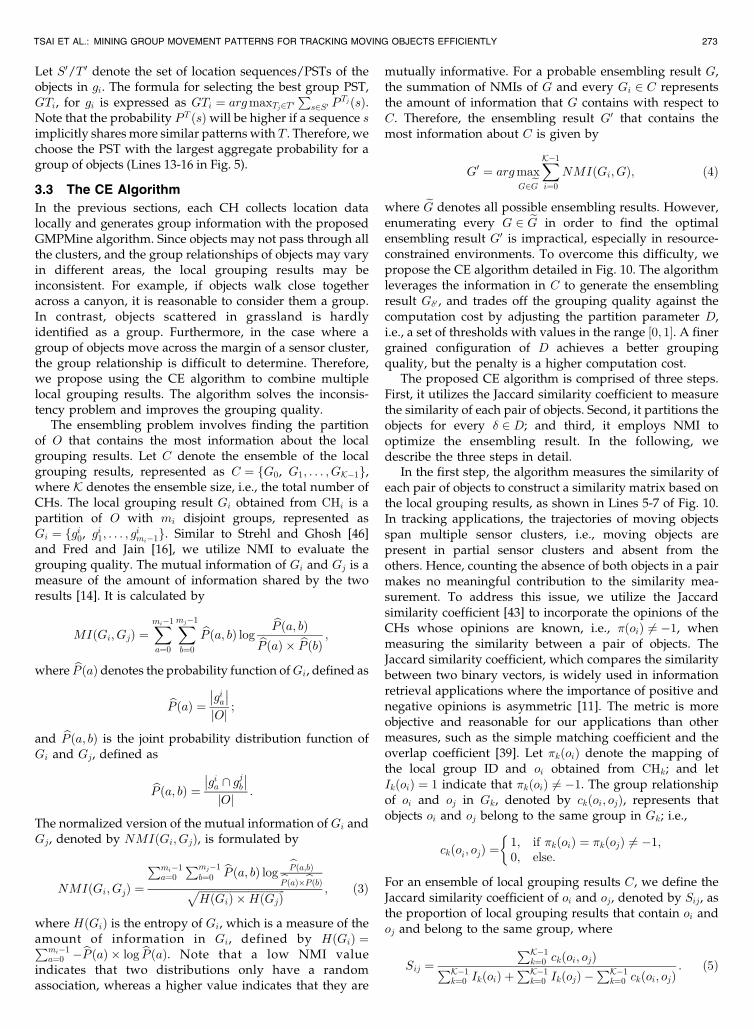
Let us consider the PSTs of objects o4, o5, o8, and o9
shown in Fig. 7. According to (2), the similarity score isapproximately 1.618 for o4 and o5, 1.067 for o4 and o9, and1.832 for o8 and o9. With simmin ¼ 1:2, we can infer that o4
and o5 as well as o8 and o9 are similar. Then, we constructthe similarity graph, as shown in Fig. 7e.
3.2.3 Extracting Highly Connected Subgraphs
In this step, we partition the similarity graph to generate thegrouping result. The properties of the HCS algorithm [21]make it suitable for use in our tracking applications. First, itderives group relationships based on the graph’s connec-tivity without any parameter tuning. Second, the outputsubgraphs do not need to have the similar number of nodes.Third, the algorithm’s polynomial complexity is low, so it isefficient in practice. For the details of HCS, please refer to[21]. As shown in Line 11 of Fig. 5, our algorithm partitionsthe similarity graph GraphðV ;EÞ and generates the group-ing resultG. After that, the CH represents the local groupingresult by the vector f�ðo0Þ; �ðo1Þ; �ðo2Þ; . . . ; �ðoN�1Þg andsends it to the sink node. For the example shown in Fig. 7e,the clustering result is shown in Fig. 7f and the vector is f�1;�1;�1;�1; 1; 2; 2; 2; 0; 0; 0;�1g. Note that �ðoiÞ ¼ �1 indi-cates that the CH does not have enough information togroup oi, so the group relationship of oi is unknown.
3.2.4 Constructing a Group Probabilistic Suffix Tree
The above steps extract the group information and objectmovement patterns. In this step, we retain the mostrepresentative PST of a group of objects for storage efficiency.
272 IEEE TRANSACTIONS ON KNOWLEDGE AND DATA ENGINEERING, VOL. 23, NO. 2, FEBRUARY 2011
Fig. 6. An example of (a) trajectories of 12 moving objects, and (b) thecollected location sequence data set at CHa.
Fig. 7. PSTs of o4, o5, o8, and o9 over � ¼ fa; b; c; dg and the grouping result at CHa. (a) PST of o4. (b) PST of o5. (c) PST of o8. (d) PST of o9.(e) Similarity graph. (f) Highly connected subgraphs.
Fig. 5. The GMPMine algorithm.
Let S0/T 0 denote the set of location sequences/PSTs of theobjects in gi. The formula for selecting the best group PST,GTi, for gi is expressed as GTi ¼ argmaxTj2T 0
Ps2S0 P
TjðsÞ.Note that the probability PT ðsÞwill be higher if a sequence simplicitly shares more similar patterns with T . Therefore, wechoose the PST with the largest aggregate probability for agroup of objects (Lines 13-16 in Fig. 5).
3.3 The CE Algorithm
In the previous sections, each CH collects location datalocally and generates group information with the proposedGMPMine algorithm. Since objects may not pass through allthe clusters, and the group relationships of objects may varyin different areas, the local grouping results may beinconsistent. For example, if objects walk close togetheracross a canyon, it is reasonable to consider them a group.In contrast, objects scattered in grassland is hardlyidentified as a group. Furthermore, in the case where agroup of objects move across the margin of a sensor cluster,the group relationship is difficult to determine. Therefore,we propose using the CE algorithm to combine multiplelocal grouping results. The algorithm solves the inconsis-tency problem and improves the grouping quality.
The ensembling problem involves finding the partitionof O that contains the most information about the localgrouping results. Let C denote the ensemble of the localgrouping results, represented as C ¼ fG0, G1; . . . ; GK�1g,where K denotes the ensemble size, i.e., the total number ofCHs. The local grouping result Gi obtained from CHi is apartition of O with mi disjoint groups, represented asGi ¼ fgi0, gi1; . . . ; gimi�1g. Similar to Strehl and Ghosh [46]and Fred and Jain [16], we utilize NMI to evaluate thegrouping quality. The mutual information of Gi and Gj is ameasure of the amount of information shared by the tworesults [14]. It is calculated by
MIðGi;GjÞ ¼Xmi�1
a¼0
Xmj�1
b¼0
bP ða; bÞ logbP ða; bÞbP ðaÞ � bP ðbÞ ;
where bP ðaÞ denotes the probability function ofGi, defined as
bP ðaÞ ¼��gia��jOj ;
and bP ða; bÞ is the joint probability distribution function ofGi and Gj, defined as
bP ða; bÞ ¼��gia \ gjb��jOj :
The normalized version of the mutual information of Gi andGj, denoted by NMIðGi;GjÞ, is formulated by
NMIðGi;GjÞ ¼
Pmi�1a¼0
Pmj�1b¼0
bP ða; bÞ logbP ða;bÞbP ðaÞ�bP ðbÞffiffiffiffiffiffiffiffiffiffiffiffiffiffiffiffiffiffiffiffiffiffiffiffiffiffiffiffiffiffiffiffiffi
HðGiÞ �HðGjÞp ; ð3Þ
where HðGiÞ is the entropy of Gi, which is a measure of theamount of information in Gi, defined by HðGiÞ ¼Pmi�1
a¼0 �bP ðaÞ � log bP ðaÞ. Note that a low NMI valueindicates that two distributions only have a randomassociation, whereas a higher value indicates that they are
mutually informative. For a probable ensembling result G,the summation of NMIs of G and every Gi 2 C representsthe amount of information that G contains with respect toC. Therefore, the ensembling result G0 that contains themost information about C is given by
G0 ¼ argmaxG2eG
XK�1
i¼0
NMIðGi;GÞ; ð4Þ
where eG denotes all possible ensembling results. However,enumerating every G 2 eG in order to find the optimalensembling result G0 is impractical, especially in resource-constrained environments. To overcome this difficulty, wepropose the CE algorithm detailed in Fig. 10. The algorithmleverages the information in C to generate the ensemblingresult G�0 , and trades off the grouping quality against thecomputation cost by adjusting the partition parameter D,i.e., a set of thresholds with values in the range ½0; 1�. A finergrained configuration of D achieves a better groupingquality, but the penalty is a higher computation cost.
The proposed CE algorithm is comprised of three steps.First, it utilizes the Jaccard similarity coefficient to measurethe similarity of each pair of objects. Second, it partitions theobjects for every � 2 D; and third, it employs NMI tooptimize the ensembling result. In the following, wedescribe the three steps in detail.
In the first step, the algorithm measures the similarity ofeach pair of objects to construct a similarity matrix based onthe local grouping results, as shown in Lines 5-7 of Fig. 10.In tracking applications, the trajectories of moving objectsspan multiple sensor clusters, i.e., moving objects arepresent in partial sensor clusters and absent from theothers. Hence, counting the absence of both objects in a pairmakes no meaningful contribution to the similarity mea-surement. To address this issue, we utilize the Jaccardsimilarity coefficient [43] to incorporate the opinions of theCHs whose opinions are known, i.e., �ðoiÞ 6¼ �1, whenmeasuring the similarity between a pair of objects. TheJaccard similarity coefficient, which compares the similaritybetween two binary vectors, is widely used in informationretrieval applications where the importance of positive andnegative opinions is asymmetric [11]. The metric is moreobjective and reasonable for our applications than othermeasures, such as the simple matching coefficient and theoverlap coefficient [39]. Let �kðoiÞ denote the mapping ofthe local group ID and oi obtained from CHk; and letIkðoiÞ ¼ 1 indicate that �kðoiÞ 6¼ �1. The group relationshipof oi and oj in Gk, denoted by ckðoi; ojÞ, represents thatobjects oi and oj belong to the same group in Gk; i.e.,
ckðoi; ojÞ ¼1; if �kðoiÞ ¼ �kðojÞ 6¼ �1;0; else:
�
For an ensemble of local grouping results C, we define theJaccard similarity coefficient of oi and oj, denoted by Sij, asthe proportion of local grouping results that contain oi andoj and belong to the same group, where
Sij ¼PK�1
k¼0 ckðoi; ojÞPK�1k¼0 IkðoiÞ þ
PK�1k¼0 IkðojÞ �
PK�1k¼0 ckðoi; ojÞ
: ð5Þ
TSAI ET AL.: MINING GROUP MOVEMENT PATTERNS FOR TRACKING MOVING OBJECTS EFFICIENTLY 273
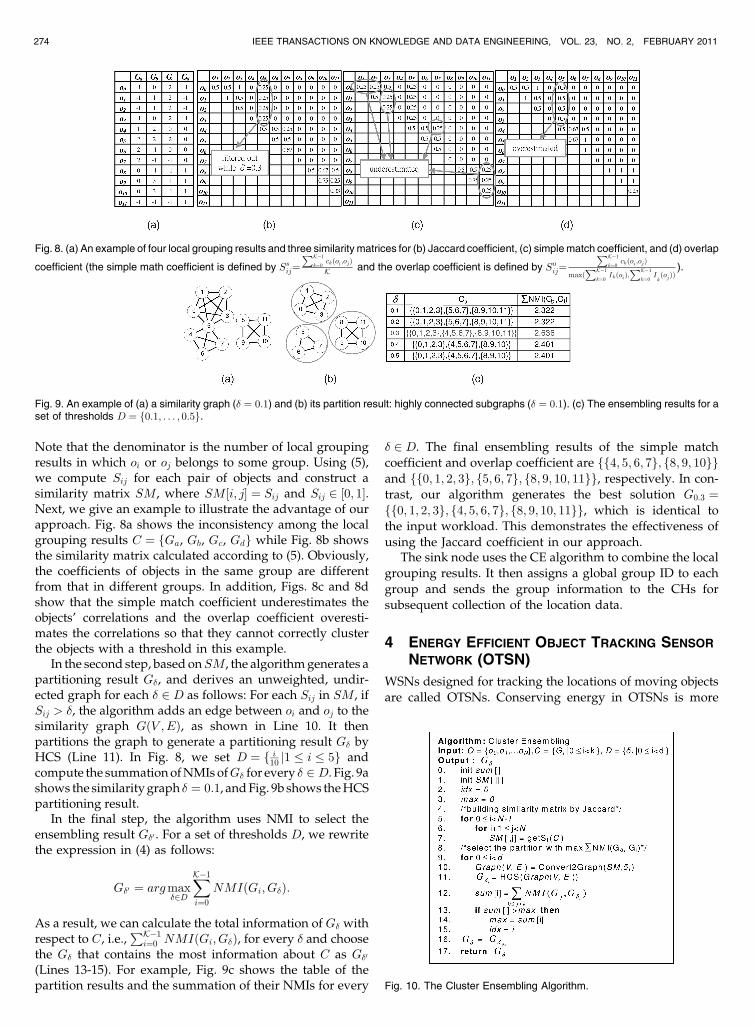
Note that the denominator is the number of local groupingresults in which oi or oj belongs to some group. Using (5),we compute Sij for each pair of objects and construct asimilarity matrix SM, where SM½i; j� ¼ Sij and Sij 2 ½0; 1�.Next, we give an example to illustrate the advantage of ourapproach. Fig. 8a shows the inconsistency among the localgrouping results C ¼ fGa, Gb, Gc, Gdg while Fig. 8b showsthe similarity matrix calculated according to (5). Obviously,the coefficients of objects in the same group are differentfrom that in different groups. In addition, Figs. 8c and 8dshow that the simple match coefficient underestimates theobjects’ correlations and the overlap coefficient overesti-mates the correlations so that they cannot correctly clusterthe objects with a threshold in this example.
In the second step, based onSM, the algorithm generates apartitioning result G�, and derives an unweighted, undir-ected graph for each � 2 D as follows: For each Sij in SM, ifSij > �, the algorithm adds an edge between oi and oj to thesimilarity graph GðV ;EÞ, as shown in Line 10. It thenpartitions the graph to generate a partitioning result G� byHCS (Line 11). In Fig. 8, we set D ¼ f i10 j1 � i � 5g andcompute the summation of NMIs ofG� for every � 2 D. Fig. 9ashows the similarity graph � ¼ 0:1, and Fig. 9b shows the HCSpartitioning result.
In the final step, the algorithm uses NMI to select theensembling result G�0 . For a set of thresholds D, we rewritethe expression in (4) as follows:
G�0 ¼ argmax�2D
XK�1
i¼0
NMIðGi;G�Þ:
As a result, we can calculate the total information of G� withrespect to C, i.e.,
PK�1i¼0 NMIðGi;G�Þ, for every � and choose
the G� that contains the most information about C as G�0
(Lines 13-15). For example, Fig. 9c shows the table of thepartition results and the summation of their NMIs for every
� 2 D. The final ensembling results of the simple matchcoefficient and overlap coefficient are ff4; 5; 6; 7g; f8; 9; 10ggand ff0; 1; 2; 3g; f5; 6; 7g; f8; 9; 10; 11gg, respectively. In con-trast, our algorithm generates the best solution G0:3 ¼ff0; 1; 2; 3g; f4; 5; 6; 7g; f8; 9; 10; 11gg, which is identical tothe input workload. This demonstrates the effectiveness of
using the Jaccard coefficient in our approach.The sink node uses the CE algorithm to combine the local
grouping results. It then assigns a global group ID to each
group and sends the group information to the CHs forsubsequent collection of the location data.
4 ENERGY EFFICIENT OBJECT TRACKING SENSOR
NETWORK (OTSN)
WSNs designed for tracking the locations of moving objects
are called OTSNs. Conserving energy in OTSNs is more
274 IEEE TRANSACTIONS ON KNOWLEDGE AND DATA ENGINEERING, VOL. 23, NO. 2, FEBRUARY 2011
Fig. 9. An example of (a) a similarity graph (� ¼ 0:1) and (b) its partition result: highly connected subgraphs (� ¼ 0:1). (c) The ensembling results for aset of thresholds D ¼ f0:1; . . . ; 0:5g.
Fig. 8. (a) An example of four local grouping results and three similarity matrices for (b) Jaccard coefficient, (c) simple match coefficient, and (d) overlap
coefficient (the simple math coefficient is defined by Ssij¼PK�1
k¼0ckðoi;ojÞK and the overlap coefficient is defined by Soij¼
PK�1
k¼0ckðoi;ojÞ
maxðPK�1
k¼0IkðoiÞ;
PK�1
k¼0IkðojÞÞ
).
Fig. 10. The Cluster Ensembling Algorithm.
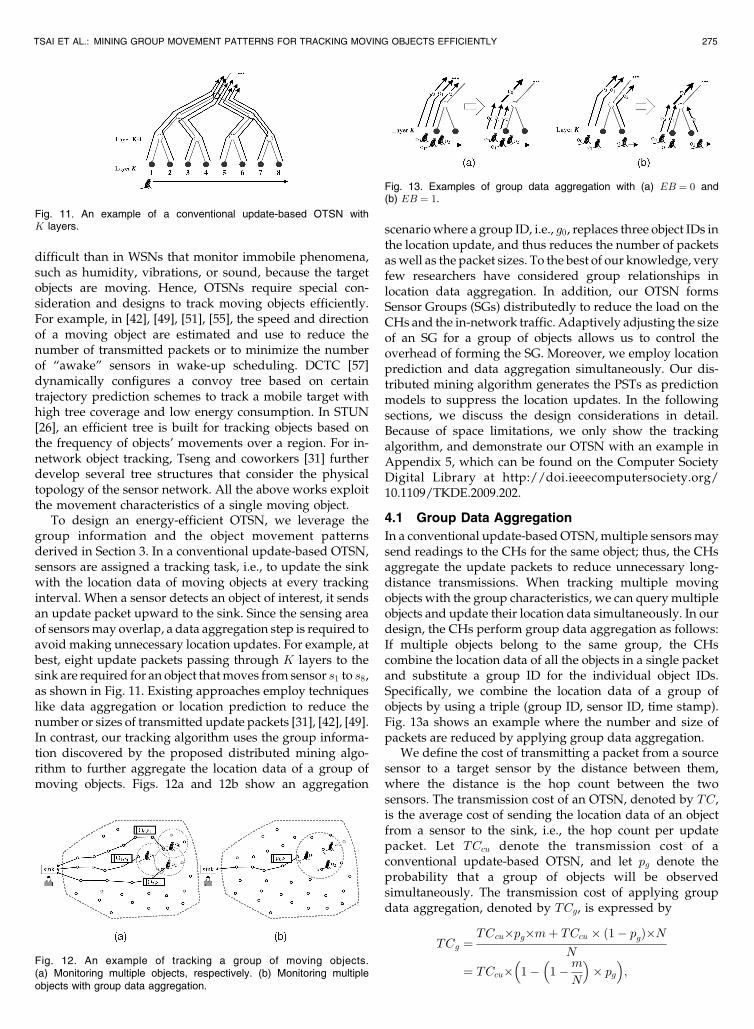
difficult than in WSNs that monitor immobile phenomena,such as humidity, vibrations, or sound, because the targetobjects are moving. Hence, OTSNs require special con-sideration and designs to track moving objects efficiently.For example, in [42], [49], [51], [55], the speed and directionof a moving object are estimated and use to reduce thenumber of transmitted packets or to minimize the numberof “awake” sensors in wake-up scheduling. DCTC [57]dynamically configures a convoy tree based on certaintrajectory prediction schemes to track a mobile target withhigh tree coverage and low energy consumption. In STUN[26], an efficient tree is built for tracking objects based onthe frequency of objects’ movements over a region. For in-network object tracking, Tseng and coworkers [31] furtherdevelop several tree structures that consider the physicaltopology of the sensor network. All the above works exploitthe movement characteristics of a single moving object.
To design an energy-efficient OTSN, we leverage thegroup information and the object movement patternsderived in Section 3. In a conventional update-based OTSN,sensors are assigned a tracking task, i.e., to update the sinkwith the location data of moving objects at every trackinginterval. When a sensor detects an object of interest, it sendsan update packet upward to the sink. Since the sensing areaof sensors may overlap, a data aggregation step is required toavoid making unnecessary location updates. For example, atbest, eight update packets passing through K layers to thesink are required for an object that moves from sensor s1 to s8,as shown in Fig. 11. Existing approaches employ techniqueslike data aggregation or location prediction to reduce thenumber or sizes of transmitted update packets [31], [42], [49].In contrast, our tracking algorithm uses the group informa-tion discovered by the proposed distributed mining algo-rithm to further aggregate the location data of a group ofmoving objects. Figs. 12a and 12b show an aggregation
scenario where a group ID, i.e., g0, replaces three object IDs inthe location update, and thus reduces the number of packetsas well as the packet sizes. To the best of our knowledge, veryfew researchers have considered group relationships inlocation data aggregation. In addition, our OTSN formsSensor Groups (SGs) distributedly to reduce the load on theCHs and the in-network traffic. Adaptively adjusting the sizeof an SG for a group of objects allows us to control theoverhead of forming the SG. Moreover, we employ locationprediction and data aggregation simultaneously. Our dis-tributed mining algorithm generates the PSTs as predictionmodels to suppress the location updates. In the followingsections, we discuss the design considerations in detail.Because of space limitations, we only show the trackingalgorithm, and demonstrate our OTSN with an example inAppendix 5, which can be found on the Computer SocietyDigital Library at http://doi.ieeecomputersociety.org/10.1109/TKDE.2009.202.
4.1 Group Data Aggregation
In a conventional update-based OTSN, multiple sensors maysend readings to the CHs for the same object; thus, the CHsaggregate the update packets to reduce unnecessary long-distance transmissions. When tracking multiple movingobjects with the group characteristics, we can query multipleobjects and update their location data simultaneously. In ourdesign, the CHs perform group data aggregation as follows:If multiple objects belong to the same group, the CHscombine the location data of all the objects in a single packetand substitute a group ID for the individual object IDs.Specifically, we combine the location data of a group ofobjects by using a triple (group ID, sensor ID, time stamp).Fig. 13a shows an example where the number and size ofpackets are reduced by applying group data aggregation.
We define the cost of transmitting a packet from a sourcesensor to a target sensor by the distance between them,where the distance is the hop count between the twosensors. The transmission cost of an OTSN, denoted by TC,is the average cost of sending the location data of an objectfrom a sensor to the sink, i.e., the hop count per updatepacket. Let TCcu denote the transmission cost of aconventional update-based OTSN, and let pg denote theprobability that a group of objects will be observedsimultaneously. The transmission cost of applying groupdata aggregation, denoted by TCg, is expressed by
TCg ¼TCcu�pg�mþ TCcu � ð1� pgÞ�N
N
¼ TCcu� 1� 1�mN
� �� pg
� �;
TSAI ET AL.: MINING GROUP MOVEMENT PATTERNS FOR TRACKING MOVING OBJECTS EFFICIENTLY 275
Fig. 11. An example of a conventional update-based OTSN withK layers.
Fig. 12. An example of tracking a group of moving objects.(a) Monitoring multiple objects, respectively. (b) Monitoring multipleobjects with group data aggregation.
Fig. 13. Examples of group data aggregation with (a) EB ¼ 0 and(b) EB ¼ 1.
where m is the number of groups and N is the number ofobjects. The saving is ðTCcu � TCgÞ=TCcu ¼ ð1� m
NÞ � pg.For example, if pg ¼ 0:6, m ¼ 5, and N ¼ 50, the saving willbe 54 percent.
Since the accuracy of sensor networks is inherentlylimited, allowing approximation of sensor readings is acompromise [45]. We regulate the accuracy by an errorbound, defined as the maximal hop count between the realand reported locations of an object. This improves energysavings in two ways: it reduces the number of long-distancetransmissions, and it increases group data aggregation.Fig. 13b shows an example of group data aggregation withan error bound EB ¼ 1. We observe that the CH success-fully reduces the number and size of the packets, evenwhen a group of objects is located by different sensors.
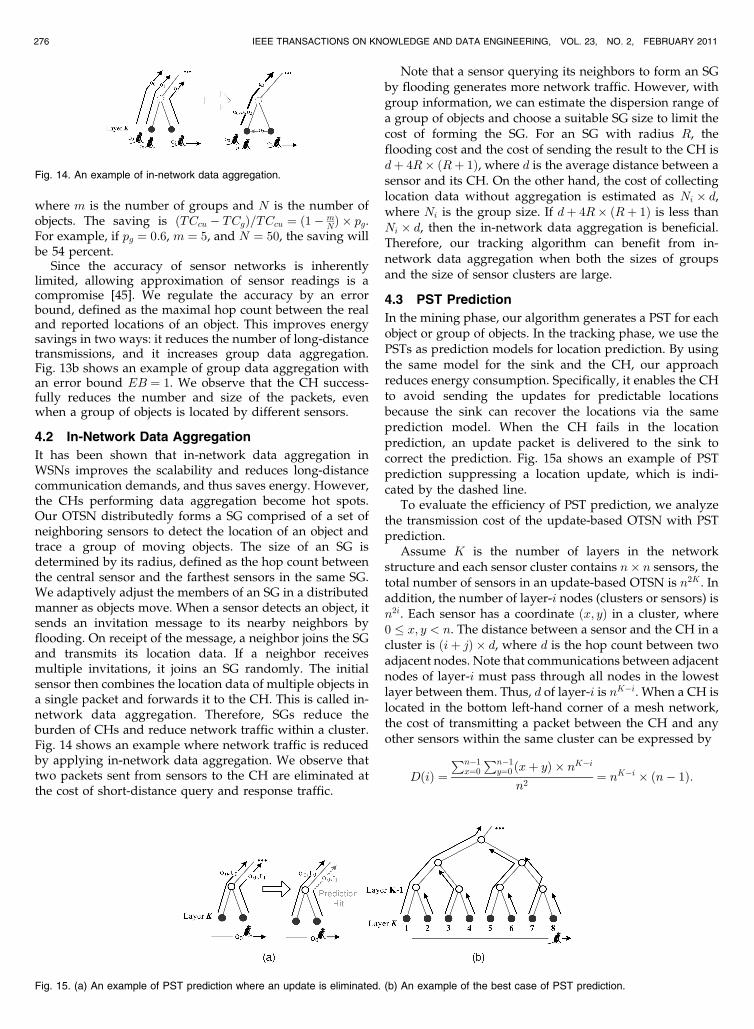
4.2 In-Network Data Aggregation
It has been shown that in-network data aggregation inWSNs improves the scalability and reduces long-distancecommunication demands, and thus saves energy. However,the CHs performing data aggregation become hot spots.Our OTSN distributedly forms a SG comprised of a set ofneighboring sensors to detect the location of an object andtrace a group of moving objects. The size of an SG isdetermined by its radius, defined as the hop count betweenthe central sensor and the farthest sensors in the same SG.We adaptively adjust the members of an SG in a distributedmanner as objects move. When a sensor detects an object, itsends an invitation message to its nearby neighbors byflooding. On receipt of the message, a neighbor joins the SGand transmits its location data. If a neighbor receivesmultiple invitations, it joins an SG randomly. The initialsensor then combines the location data of multiple objects ina single packet and forwards it to the CH. This is called in-network data aggregation. Therefore, SGs reduce theburden of CHs and reduce network traffic within a cluster.Fig. 14 shows an example where network traffic is reducedby applying in-network data aggregation. We observe thattwo packets sent from sensors to the CH are eliminated atthe cost of short-distance query and response traffic.
Note that a sensor querying its neighbors to form an SGby flooding generates more network traffic. However, withgroup information, we can estimate the dispersion range ofa group of objects and choose a suitable SG size to limit thecost of forming the SG. For an SG with radius R, theflooding cost and the cost of sending the result to the CH isdþ 4R� ðRþ 1Þ, where d is the average distance between asensor and its CH. On the other hand, the cost of collectinglocation data without aggregation is estimated as Ni � d,where Ni is the group size. If dþ 4R� ðRþ 1Þ is less thanNi � d, then the in-network data aggregation is beneficial.Therefore, our tracking algorithm can benefit from in-network data aggregation when both the sizes of groupsand the size of sensor clusters are large.
4.3 PST Prediction
In the mining phase, our algorithm generates a PST for eachobject or group of objects. In the tracking phase, we use thePSTs as prediction models for location prediction. By usingthe same model for the sink and the CH, our approachreduces energy consumption. Specifically, it enables the CHto avoid sending the updates for predictable locationsbecause the sink can recover the locations via the sameprediction model. When the CH fails in the locationprediction, an update packet is delivered to the sink tocorrect the prediction. Fig. 15a shows an example of PSTprediction suppressing a location update, which is indi-cated by the dashed line.
To evaluate the efficiency of PST prediction, we analyzethe transmission cost of the update-based OTSN with PSTprediction.
Assume K is the number of layers in the networkstructure and each sensor cluster contains n� n sensors, thetotal number of sensors in an update-based OTSN is n2K . Inaddition, the number of layer-i nodes (clusters or sensors) isn2i. Each sensor has a coordinate ðx; yÞ in a cluster, where0 � x; y < n. The distance between a sensor and the CH in acluster is ðiþ jÞ � d, where d is the hop count between twoadjacent nodes. Note that communications between adjacentnodes of layer-i must pass through all nodes in the lowestlayer between them. Thus, d of layer-i is nK�i. When a CH islocated in the bottom left-hand corner of a mesh network,the cost of transmitting a packet between the CH and anyother sensors within the same cluster can be expressed by
DðiÞ ¼Pn�1
x¼0
Pn�1y¼0 ðxþ yÞ � nK�i
n2¼ nK�i � ðn� 1Þ:
276 IEEE TRANSACTIONS ON KNOWLEDGE AND DATA ENGINEERING, VOL. 23, NO. 2, FEBRUARY 2011
Fig. 14. An example of in-network data aggregation.
Fig. 15. (a) An example of PST prediction where an update is eliminated. (b) An example of the best case of PST prediction.
In the worst case, where all predictions fail and all updatepackets pass from the bottom layer to the sink, thetransmission cost _(denoted by TCworst) is the same as thatof the conventional update-based OTSN. We formulate thisscenario as TCworst ¼
PKi¼1 DðiÞ ¼ nK � 1. In the best case,
where all predictions are correct, we only need to updatethe location of a new object, as shown by the arrows inFig. 15b. For example, as a new object enters the range of s1
and the CHs on the path to the sink, a packet passingthrough K layers is required to update the locationsequence data set at those CHs. When the object movesfrom sensor s1 to s2, the latter only updates the location ofthe object to its CH in layer K � 1, since the CH correctlypredicts the location and the sink recovers the location viathe same prediction model. In the best case, the transmis-sion cost, denoted by TCbest, contains the product of the costand the number of arrows between layer-i� 1 and layer-ifor 1 � i � K. We formulate TCbest as follows:
TCbest ¼PK
i¼1 DðiÞ � n2i
n2K
¼PK
i¼1 nK�i�ðn� 1Þ � n2i
n2K¼ n� 1
nK�1:
ð6Þ
Equation (6) shows that a network structure with morelayers results in a lower TCbest cost. However, the best casedoes not always hold. Besides, if a network structure hasmore layers, there are probably more predictions; thus, theoverall prediction hit rate will be lower. Therefore, we needto conduct more experiments to study the impact of thenetwork structure.
5 EXPERIMENTS
We implement an event driven simulator in C++ with SIM[10] to evaluate the performance of our design. Since it isdifficult to obtain real location data, this study is based onsynthetic data only. In the experiments, we use theReference Point Group Mobility Model [23] to syntheticallygenerate location data, i.e., the coordinates ðx; yÞ, for agroup of objects. The location-dependent mobility model[18] is used to simulate the roaming behavior of a groupleader. The other member objects are followers that areuniformly distributed within a specified group dispersionradius (GDR) of the leader, where the GDR is the maximalhop count between the followers and their leader. Weutilize the GDR to control the dispersion degree of theobjects. A smaller GDR implies stronger group relation-ships, i.e., objects are closer together. In addition, we controlthe movement range of a group of objects by using themovement distance (d), which is the linear distance betweenthe starting point and the furthest point reached by theleader object. A longer distance implies that objects moveacross more sensor clusters. To ensure our simulationreflects the real-world scenarios, we input objects with arandom-walk model. In the following sections, we firststudy the effectiveness of our distributed mining algorithm,and then demonstrate the efficiency of our OTSN.
5.1 Effectiveness of the Distributed MiningAlgorithm
To study the effectiveness of our distributed miningalgorithm, we conduct six experiments as follows: First,
we inspect the impacts of the group number (m), the SGradius (R), and the movement distance (d) on the groupingquality.5 Then, we study the influence of the location-dependent GDR on the grouping quality and conduct acase study to show that comparing the similarity on theentire trajectories by using average euclidean distance maynot reveal the local group relationships. Finally, weinvestigate the discrimination ability of the new proposedsimilarity measure simp.
In the following experiments, we assume a 16� 16 meshnetwork of a two-layer structure, i.e., it is composed of16 clusters, each of which has 16 sensors. There arem groups of objects and Nr random-walk objects walkingin the mesh network, where Nr is equal to the total numberof objects of the m groups. The size of each group isuniformly distributed between 5 and 15. The speed of theobjects is 1 sensor per time unit, and the tracking interval is0.5 time units. The default values ofEB, Lmax, d, andR are 0,6, 12, and 0, respectively. We set the PST parametersðPmin; �; �min; rÞ ¼ ð0:01; 0; 0:0001; 1:2Þ empirically. To eval-uate the grouping quality, we take the NMI of theensembling result G�0 and the input workload Ginput as theexternal evaluation metric. Note that a higher NMI valueindicates better grouping quality.6
In the first experiment, we compare the grouping qualityand the transmission costs of our distributed approach(denoted by DGMP) with a vector-based K-means approach(denoted by VK)7 [19]. The GDR varies from 0.1 to 1.0 whilem is uniformly selected between a and b, where ða; bÞ are setto ð10; 20Þ; . . . , and ð40; 50Þ. The parameter k representingthe specified cluster number of the K-means algorithm is setto aþb
2 . Fig. 16a shows a decreasing trend in the NMI valuesof DGMP and VK as the GDR increases. When the GDR isless than 0.4, our approach clusters the patterned objectsexactly and filters out most random-walk objects. Thegrouping quality decreases to 0.8 as the GDR approaches 1.In contrast, the NMI of VK is less than 0.7 even when theGDR is small. This is because the clustering result of the K-means algorithm is sensitive to the seed selection and theparameter k. Note that the number of unfiltered random-walk objects increases with Nr. These objects often do notbelong to any group, or they belong to small groups withtwo or three members that can be removed by postproces-sing. In real-world applications, there may be someunwanted objects that are viewed as outliers, e.g., objectswith random-walk movements. To remove a type ofoutliers, we first train a PST of a sample object of this typeand then remove the objects that are similar to it. Throughthis approach, we prune the similarity graph and therebyreduce the clustering cost.
When the grouping results of DGMP and VK are utilizedin our group data aggregation technique to reduce the
TSAI ET AL.: MINING GROUP MOVEMENT PATTERNS FOR TRACKING MOVING OBJECTS EFFICIENTLY 277
5. Due to the page limit, we discuss the impact of Lmax in Appendix 6,which can be found on the Computer Society Digital Library at http://doi.ieeecomputersociety.org/10.1109/TKDE.2009.202.
6. For example, given Ginput ¼ ff0; 1; . . . ; 4g; f5; 6; . . . ; 9g; f10; 11; . . . ;14g; f15; 16; . . . ; 19g; f20; 21; . . . ; 24gg, the NMI of the result {{1, 2, 3}, {6, 8,9}, {21, 22, 23, 24}}, Ginput is 0.56; and the NMI of the result {{0, 1, 2, 3, 4}, {5, 7,9}, {10, 11, 12, 13, 14}, {15, 17, 18, 19}, {20, 23, 24}} and Ginput is 0.8.
7. Instead of using sequential patterns, we generate a vector for eachobject by projecting its sequence into the feature domain of the significantmovement patterns of all objects.
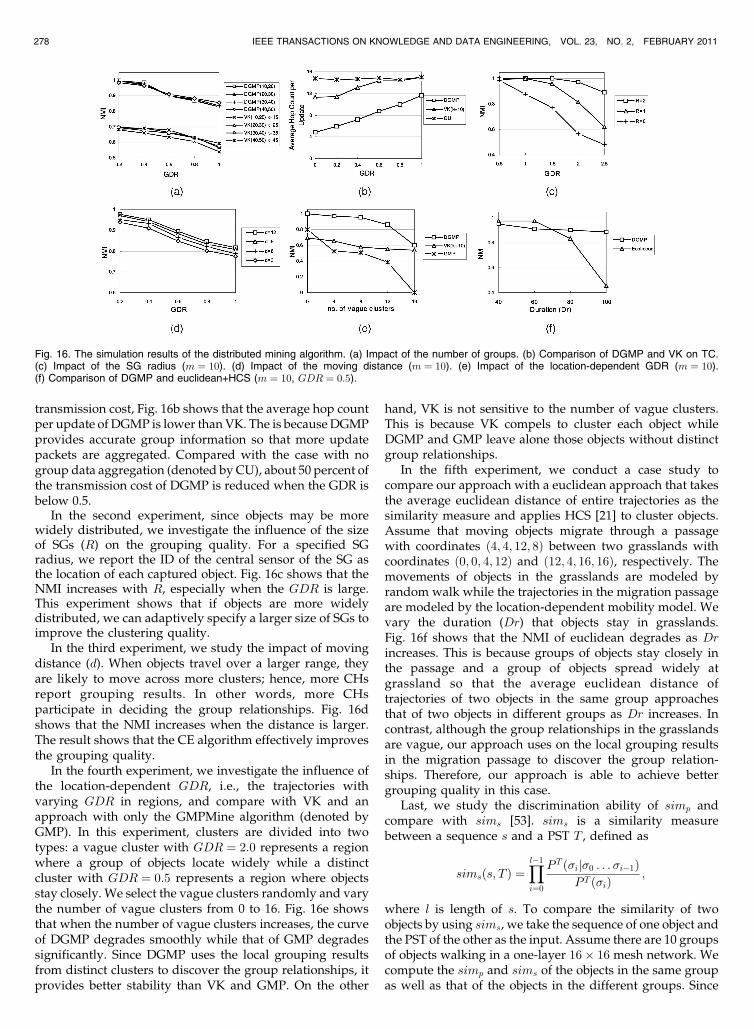
transmission cost, Fig. 16b shows that the average hop countper update of DGMP is lower than VK. The is because DGMPprovides accurate group information so that more updatepackets are aggregated. Compared with the case with nogroup data aggregation (denoted by CU), about 50 percent ofthe transmission cost of DGMP is reduced when the GDR isbelow 0.5.
In the second experiment, since objects may be morewidely distributed, we investigate the influence of the sizeof SGs (R) on the grouping quality. For a specified SGradius, we report the ID of the central sensor of the SG asthe location of each captured object. Fig. 16c shows that theNMI increases with R, especially when the GDR is large.This experiment shows that if objects are more widelydistributed, we can adaptively specify a larger size of SGs toimprove the clustering quality.
In the third experiment, we study the impact of movingdistance (d). When objects travel over a larger range, theyare likely to move across more clusters; hence, more CHsreport grouping results. In other words, more CHsparticipate in deciding the group relationships. Fig. 16dshows that the NMI increases when the distance is larger.The result shows that the CE algorithm effectively improvesthe grouping quality.
In the fourth experiment, we investigate the influence ofthe location-dependent GDR, i.e., the trajectories withvarying GDR in regions, and compare with VK and anapproach with only the GMPMine algorithm (denoted byGMP). In this experiment, clusters are divided into twotypes: a vague cluster with GDR ¼ 2:0 represents a regionwhere a group of objects locate widely while a distinctcluster with GDR ¼ 0:5 represents a region where objectsstay closely. We select the vague clusters randomly and varythe number of vague clusters from 0 to 16. Fig. 16e showsthat when the number of vague clusters increases, the curveof DGMP degrades smoothly while that of GMP degradessignificantly. Since DGMP uses the local grouping resultsfrom distinct clusters to discover the group relationships, itprovides better stability than VK and GMP. On the other
hand, VK is not sensitive to the number of vague clusters.This is because VK compels to cluster each object whileDGMP and GMP leave alone those objects without distinctgroup relationships.
In the fifth experiment, we conduct a case study tocompare our approach with a euclidean approach that takesthe average euclidean distance of entire trajectories as thesimilarity measure and applies HCS [21] to cluster objects.Assume that moving objects migrate through a passagewith coordinates ð4; 4; 12; 8Þ between two grasslands withcoordinates ð0; 0; 4; 12Þ and ð12; 4; 16; 16Þ, respectively. Themovements of objects in the grasslands are modeled byrandom walk while the trajectories in the migration passageare modeled by the location-dependent mobility model. Wevary the duration (Dr) that objects stay in grasslands.Fig. 16f shows that the NMI of euclidean degrades as Drincreases. This is because groups of objects stay closely inthe passage and a group of objects spread widely atgrassland so that the average euclidean distance oftrajectories of two objects in the same group approachesthat of two objects in different groups as Dr increases. Incontrast, although the group relationships in the grasslandsare vague, our approach uses on the local grouping resultsin the migration passage to discover the group relation-ships. Therefore, our approach is able to achieve bettergrouping quality in this case.
Last, we study the discrimination ability of simp andcompare with sims [53]. sims is a similarity measurebetween a sequence s and a PST T , defined as
simsðs; T Þ ¼Yl�1
i¼0
PT ð�ij�0 . . .�i�1ÞPT ð�iÞ
;
where l is length of s. To compare the similarity of twoobjects by using sims, we take the sequence of one object andthe PST of the other as the input. Assume there are 10 groupsof objects walking in a one-layer 16� 16 mesh network. Wecompute the simp and sims of the objects in the same groupas well as that of the objects in the different groups. Since
278 IEEE TRANSACTIONS ON KNOWLEDGE AND DATA ENGINEERING, VOL. 23, NO. 2, FEBRUARY 2011
Fig. 16. The simulation results of the distributed mining algorithm. (a) Impact of the number of groups. (b) Comparison of DGMP and VK on TC.(c) Impact of the SG radius (m ¼ 10). (d) Impact of the moving distance (m ¼ 10). (e) Impact of the location-dependent GDR (m ¼ 10).(f) Comparison of DGMP and euclidean+HCS (m ¼ 10, GDR ¼ 0:5).
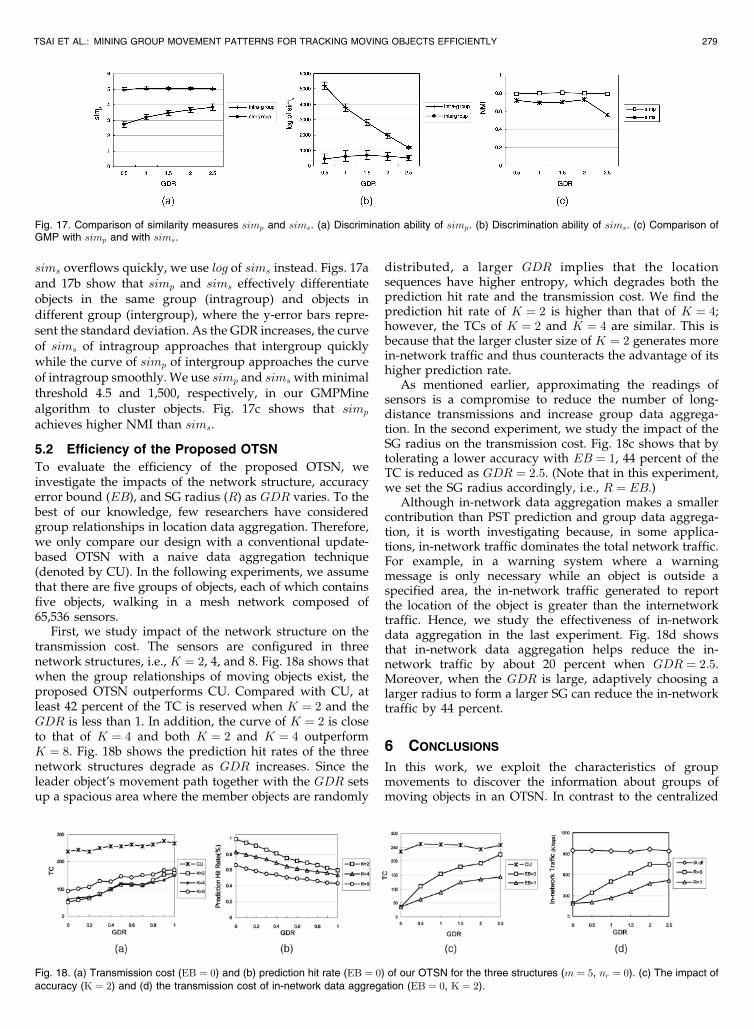
sims overflows quickly, we use log of sims instead. Figs. 17aand 17b show that simp and sims effectively differentiateobjects in the same group (intragroup) and objects indifferent group (intergroup), where the y-error bars repre-sent the standard deviation. As the GDR increases, the curveof sims of intragroup approaches that intergroup quicklywhile the curve of simp of intergroup approaches the curveof intragroup smoothly. We use simp and sims with minimalthreshold 4.5 and 1,500, respectively, in our GMPMinealgorithm to cluster objects. Fig. 17c shows that simp
achieves higher NMI than sims.
5.2 Efficiency of the Proposed OTSN
To evaluate the efficiency of the proposed OTSN, weinvestigate the impacts of the network structure, accuracyerror bound (EB), and SG radius (R) as GDR varies. To thebest of our knowledge, few researchers have consideredgroup relationships in location data aggregation. Therefore,we only compare our design with a conventional update-based OTSN with a naive data aggregation technique(denoted by CU). In the following experiments, we assumethat there are five groups of objects, each of which containsfive objects, walking in a mesh network composed of65,536 sensors.
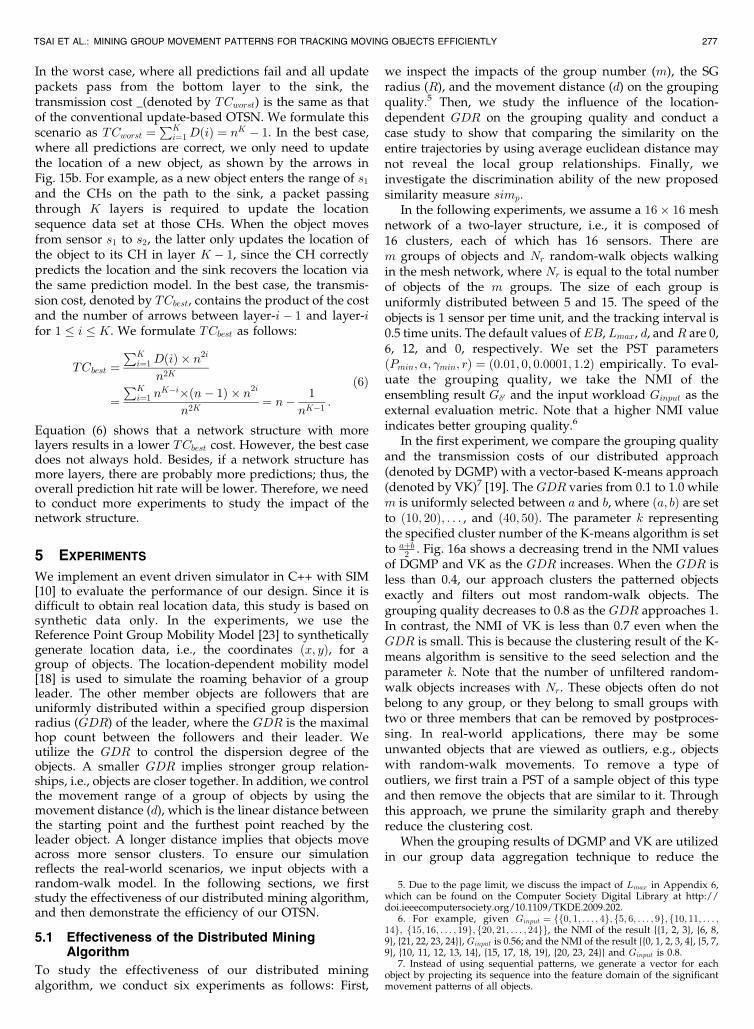
First, we study impact of the network structure on thetransmission cost. The sensors are configured in threenetwork structures, i.e., K ¼ 2, 4, and 8. Fig. 18a shows thatwhen the group relationships of moving objects exist, theproposed OTSN outperforms CU. Compared with CU, atleast 42 percent of the TC is reserved when K ¼ 2 and theGDR is less than 1. In addition, the curve of K ¼ 2 is closeto that of K ¼ 4 and both K ¼ 2 and K ¼ 4 outperformK ¼ 8. Fig. 18b shows the prediction hit rates of the threenetwork structures degrade as GDR increases. Since theleader object’s movement path together with the GDR setsup a spacious area where the member objects are randomly
distributed, a larger GDR implies that the locationsequences have higher entropy, which degrades both theprediction hit rate and the transmission cost. We find theprediction hit rate of K ¼ 2 is higher than that of K ¼ 4;however, the TCs of K ¼ 2 and K ¼ 4 are similar. This isbecause that the larger cluster size of K ¼ 2 generates morein-network traffic and thus counteracts the advantage of itshigher prediction rate.
As mentioned earlier, approximating the readings ofsensors is a compromise to reduce the number of long-distance transmissions and increase group data aggrega-tion. In the second experiment, we study the impact of theSG radius on the transmission cost. Fig. 18c shows that bytolerating a lower accuracy with EB ¼ 1, 44 percent of theTC is reduced as GDR ¼ 2:5. (Note that in this experiment,we set the SG radius accordingly, i.e., R ¼ EB.)
Although in-network data aggregation makes a smallercontribution than PST prediction and group data aggrega-tion, it is worth investigating because, in some applica-tions, in-network traffic dominates the total network traffic.For example, in a warning system where a warningmessage is only necessary while an object is outside aspecified area, the in-network traffic generated to reportthe location of the object is greater than the internetworktraffic. Hence, we study the effectiveness of in-networkdata aggregation in the last experiment. Fig. 18d showsthat in-network data aggregation helps reduce the in-network traffic by about 20 percent when GDR ¼ 2:5.Moreover, when the GDR is large, adaptively choosing alarger radius to form a larger SG can reduce the in-networktraffic by 44 percent.
6 CONCLUSIONS
In this work, we exploit the characteristics of groupmovements to discover the information about groups ofmoving objects in an OTSN. In contrast to the centralized
TSAI ET AL.: MINING GROUP MOVEMENT PATTERNS FOR TRACKING MOVING OBJECTS EFFICIENTLY 279
Fig. 18. (a) Transmission cost (EB ¼ 0) and (b) prediction hit rate (EB ¼ 0) of our OTSN for the three structures (m ¼ 5, nr ¼ 0). (c) The impact ofaccuracy (K ¼ 2) and (d) the transmission cost of in-network data aggregation (EB ¼ 0, K ¼ 2).
Fig. 17. Comparison of similarity measures simp and sims. (a) Discrimination ability of simp. (b) Discrimination ability of sims. (c) Comparison ofGMP with simp and with sims.
mining technique, we mine the group information in adistributed manner. We propose a novel mining algorithm,which consists of a local GMPMine algorithm and a CEalgorithm, to discover group information. Our algorithmmines object movement patterns as well as group informa-tion and the estimated group dispersion radius. Other thanclustering trajectories, we can apply the distributed cluster-ing approach to heterogeneous and distributed sequentialdata sets, such as web logs or gene sequence. Using themined object movement patterns and the group informa-tion, we design an energy-efficient OTSN. The contributionof our approach is threefold: 1) it reduces energyconsumption by allowing CHs to avoid sending theprediction-hit locations, because the locations can berecovered by the sink via the same prediction model; 2) itleverages group information in data aggregation to elim-inate redundant update traffic; and 3) it sets the size of anSG adaptively to limit the amount of flooding traffic. Ourexperimental results show that the proposed miningtechnique achieves good grouping quality. Furthermore,the proposed OTSN with PST prediction, group dataaggregation, and in-network data aggregation significantlyreduces energy consumption in terms of the transmissioncost, especially in the case where moving objects havedistinct group relationships.
ACKNOWLEDGMENTS
The work was supported in part by the National ScienceCouncil of Taiwan, R.O.C., under Contracts NSC99-2218-E-005-002 and NSC99-2219-E-001-001.
REFERENCES
[1] African Elephant, http://www.defenders.org/wildlife_and_habitat/wildlife/elephant.php, 2010.
[2] Mica2 Sensor Board, http://www.xbow.com, 2010.[3] Stargate: A Platform X Project, http://platformx.sourceforge.net,
2010.[4] R. Agrawal and R. Srikant, “Mining Sequential Patterns,” Proc.
11th Int’l Conf. Data Eng., pp. 3-14, 1995.[5] I.F. Akyildiz, W. Su, Y. Sankarasubramaniam, and E. Cayirci,
“Wireless Sensor Networks: A Survey,” Computer Networks,vol. 38, no. 4, pp. 393-422, 2002.
[6] J.N. Al Karaki and A.E. Kamal, “Routing Techniques in WirelessSensor Networks: A Survey,” IEEE Wireless Comm., vol. 11, no. 6,pp. 6-28, Dec. 2004.
[7] A. Apostolico and G. Bejerano, “Optimal Amnesic ProbabilisticAutomata or How to Learn and Classify Proteins in Linear Timeand Space,” Proc. Fourth Ann. Int’l Conf. Computational MolecularBiology, pp. 25-32, 2000.
[8] H. Ayad, O.A. Basir, and M. Kamel, “A Probabilistic Model UsingInformation Theoretic Measures for Cluster Ensembles,” Proc.Fifth Int’l Workshop Multiple Classifier Systems, pp. 144-153, June2004.
[9] G. Bejerano and G. Yona, “Variations on Probabilistic Suffix Trees:Statistical Modeling and the Prediction of Protein Families,”Bioinformatics, vol. 17, no. 1, pp. 23-43, 2001.
[10] D. Bolier, “SIM: A C++ Library for Discrete Event Simulation,”http://www.cs.vu.nl/eliens/sim, Oct. 1995.
[11] D. Bollegala, Y. Matsuo, and M. Ishizuka, “Measuring SemanticSimilarity between Words Using Web Search Engines,” Proc. 16thInt’l World Wide Web Conf., pp. 757-766, 2007.
[12] L. Chen, M. Tamer Ozsu, and V. Oria, “Robust and Fast SimilaritySearch for Moving Object Trajectories,” Proc. ACM SIGMOD,pp. 491-502, 2005.
[13] M.-S. Chen, J.S. Park, and P.S. Yu, “Efficient Data Mining for PathTraversal Patterns,” Knowledge and Data Eng., vol. 10, no. 2,pp. 209-221, 1998.
[14] T.M. Cover and J.A. Thomas, Elements of Information Theory. WileyInterscience, Aug. 1991.
[15] X.Z. Fern and C.E. Brodley, “Random Projection for HighDimensional Data Clustering: A Cluster Ensemble Approach,”Proc. 20th Int’l Conf. Machine Learning, pp. 1186-1193, June 2003.
[16] A.L.N. Fred and A.K. Jain, “Combining Multiple ClusteringsUsing Evidence Accumulation,” IEEE Trans. Pattern Analysis andMachine Intelligence, vol. 27, no. 6, pp. 835-850, June 2005.
[17] F. Giannotti, M. Nanni, F. Pinelli, and D. Pedreschi, “TrajectoryPattern Mining,” Proc. 13th ACM SIGKDD, pp. 330-339, 2007.
[18] B. Gloss, M. Scharf, and D. Neubauer, “Location-DependentParameterization of a Random Direction Mobility Model,” Proc.IEEE 63rd Conf. Vehicular Technology, vol. 3, pp. 1068-1072, 2006.
[19] V. Guralnik and G. Karypis, “A Scalable Algorithm for ClusteringSequential Data,” Proc. First IEEE Int’l Conf. Data Mining, pp. 179-186, 2001.
[20] J. Han, J. Pei, B. Mortazavi-Asl, Q. Chen, U. Dayal, and M. Hsu,“Freespan: Frequent Pattern-Projected Sequential PatternMining,” Proc. Sixth ACM SIGKDD, pp. 355-359, 2000.
[21] E. Hartuv and R. Shamir, “A Clustering Algorithm Based onGraph Connectivity,” Information Processing Letters, vol. 76, nos. 4-6, pp. 175-181, 2000.
[22] J. Hightower and G. Borriello, “Location Systems for UbiquitousComputing,” Computer, vol. 34, no. 8, pp. 57-66, Aug. 2001.
[23] X. Hong, M. Gerla, G. Pei, and C. Chiang, “A Group MobilityModel for Ad Hoc Wireless Networks,” Proc. Ninth ACM/IEEEInt’l Symp. Modeling, Analysis and Simulation of Wireless and MobileSystems, pp. 53-60, Aug. 1999.
[24] H. Kargupta, W. Huang, K. Sivakumar, and E.L. Johnson,“Distributed Clustering Using Collective Principal ComponentAnalysis,” Knowledge and Information System, vol. 3, pp. 422-448,2001.
[25] D. Katsaros and Y. Manolopoulos, “A Suffix Tree Based PredictionScheme for Pervasive Computing Environments,” Proc. PanhellenicConf. Informatics, pp. 267-277, Nov. 2005.
[26] H.T. Kung and D. Vlah, “Efficient Location Tracking Using SensorNetworks,” Proc. Conf. IEEE Wireless Comm. and Networking, vol. 3,pp. 1954-1961, Mar. 2003.
[27] C. Largeron-Leteno, “Prediction Suffix Trees for SupervisedClassification of Sequences,” Pattern Recognition Letters, vol. 24,no. 16, pp. 3153-3164, 2003.
[28] J.-G. Lee, J. Han, and K.-Y. Whang, “Trajectory Clustering: APartition-and-Group Framework,” Proc. ACM SIGMOD, pp. 593-604, 2007.
[29] D. Li, K.D. Wong, Y.H. Hu, and A.M. Sayeed, “Detection,Classification, and Tracking of Targets,” IEEE Signal ProcessingMagazine, vol. 19, no. 2, pp. 17-30, Mar. 2002.
[30] Y. Li, J. Han, and J. Yang, “Clustering Moving Objects,” Proc. 10thACM SIGKDD, pp. 617-622, 2004.
[31] C.-Y. Lin, W.-C. Peng, and Y.-C. Tseng, “Efficient In-NetworkMoving Object Tracking in Wireless Sensor Networks,” IEEETrans. Mobile Computing, vol. 5, no. 8, pp. 1044-1056, Aug. 2006.
[32] G. Mazeroff, J. Gregor, M. Thomason, and R. Ford, “ProbabilisticSuffix Models for API Sequence Analysis of Windows XPApplications,” Pattern Recognition, vol. 41, no. 1, pp. 90-101, 2008.
[33] M. Morzy, “Prediction of Moving Object Location Based onFrequent Trajectories,” Proc. 21st Int’l Symp. Computer andInformation Sciences, pp. 583-592, Nov. 2006.
[34] M. Morzy, “Mining Frequent Trajectories of Moving Objects forLocation Prediction,” Proc. Fifth Int’l Conf. Machine Learning andData Mining in Pattern Recognition, pp. 667-680, July 2007.
[35] M. Nanni and D. Pedreschi, “Time-Focused Clustering ofTrajectories of Moving Objects,” J. Intelligent Information Systems,vol. 27, no. 3, pp. 267-289, 2006.
[36] S. Pandey, S. Dong, P. Agrawal, and K. Sivalingam, “A HybridApproach to Optimize Node Placements in Hierarchical Hetero-geneous Networks,” Proc. IEEE Conf. Wireless Comm. and Network-ing Conf., pp. 3918-3923, Mar. 2007.
[37] W.-C. Peng and M.-S. Chen, “Developing Data AllocationSchemes by Incremental Mining of User Moving Patterns in aMobile Computing System,” IEEE Trans. Knowledge and Data Eng.,vol. 15, no. 1, pp. 70-85, Jan./Feb. 2003.
[38] W.-C. Peng, Y.-Z. Ko, and W.-C. Lee, “On Mining Moving Patternsfor Object Tracking Sensor Networks,” Proc. Seventh Int’l Conf.Mobile Data Management, p. 41, 2006.
[39] C.J. Van Rijsbergen, Information Retrieval. Springer, 1979.
280 IEEE TRANSACTIONS ON KNOWLEDGE AND DATA ENGINEERING, VOL. 23, NO. 2, FEBRUARY 2011
[40] D. Ron, Y. Singer, and N. Tishby, “Learning ProbabilisticAutomata with Variable Memory Length,” Proc. Seventh Ann.Conf. Computational Learning Theory, July 1994.
[41] C. Roux and R.T.F. Bernard, “Home Range Size, Spatial Distribu-tion and Habitat Use of Elephants in Two Enclosed GameReserves in the Eastern Cape Province, South Africa,” African J.Ecology, Oct. 2007.
[42] S. Santini and K. Romer, “An Adaptive Strategy for Quality-BasedData Reduction in Wireless Sensor Networks,” Proc. Third Int’lConf. Networked Sensing Systems, pp. 29-36, June 2006.
[43] G. Saporta and G. Youness, “Comparing Two Partitions: SomeProposals and Experiments,” Proc. Computational Statistics, Aug.2002.
[44] G. Shannon, B. Page, K. Duffy, and R. Slotow, “African ElephantHome Range and Habitat Selection in Pongola Game Reserve,South Africa,” African Zoology, vol. 41, no. 1, pp. 37-44, Apr. 2006.
[45] A. Silberstein, “Push and Pull in Sensor Network QueryProcessing,” Proc. Southeast Workshop Data and Information Manage-ment, Mar. 2006.
[46] A. Strehl and J. Ghosh, “Cluster Ensembles—A Knowledge ReuseFramework for Combining Partitionings,” Proc. Conf. ArtificialIntelligence, pp. 93-98, July 2002.
[47] J. Tang, B. Hao, and A. Sen, “Relay Node Placement in Large ScaleWireless Sensor Networks,” J. Computer Comm., special issue onsensor networks, vol. 29, no. 4, pp. 490-501, 2006.
[48] V.S. Tseng and K.W. Lin, “Energy Efficient Strategies for ObjectTracking in Sensor Networks: A Data Mining Approach,”J. Systems and Software, vol. 80, no. 10, pp. 1678-1698, 2007.
[49] G. Wang, H. Wang, J. Cao, and M. Guo, “Energy-Efficient DualPrediction-Based Data Gathering for Environmental MonitoringApplications,” Proc. IEEE Wireless Comm. and Networking Conf.,Mar. 2007.
[50] Y. Wang, E.-P. Lim, and S.-Y. Hwang, “Efficient Mining of GroupPatterns from User Movement Data,” Data Knowledge Eng., vol. 57,no. 3, pp. 240-282, 2006.
[51] Y. Xu, J. Winter, and W.-C. Lee, “Dual Prediction-Based Reportingfor Object Tracking Sensor Networks,” Proc. First Ann. Int’l Conf.Mobile and Ubiquitous Systems: Networking and Services, pp. 154-163,Aug. 2004.
[52] J. Yang and M. Hu, “Trajpattern: Mining Sequential Patterns fromImprecise Trajectories of Mobile Objects,” Proc. 10th Int’l Conf.Extending Database Technology, pp. 664-681, Mar. 2006.
[53] J. Yang and W. Wang, “CLUSEQ: Efficient and Effective SequenceClustering,” Proc. 19th Int’l Conf. Data Eng., pp. 101-112, Mar. 2003.
[54] J. Yang and W. Wang, “Agile: A General Approach to DetectTransitions in Evolving Data Streams,” Proc. Fourth IEEE Int’lConf. Data Mining, pp. 559-562, 2004.
[55] J. Yick, B. Mukherjee, and D. Ghosal, “Analysis of a Prediction-Based Mobility Adaptive Tracking Algorithm,” Proc. Second Int’lConf. Broadband Networks, pp. 753-760, Oct. 2005.
[56] M. Younis and K. Akkaya, “Strategies and Techniques for NodePlacement in Wireless Sensor Networks: A Survey,” Ad HocNetworks, vol. 6, no. 4, pp. 621-655, 2008.
[57] W. Zhang and G. Cao, “DCTC: Dynamic Convoy Tree-BasedCollaboration for Target Tracking in Sensor Networks,” IEEETrans. Wireless Comm., vol. 3, no. 5, pp. 1689-1701, Sept. 2004.
Hsiao-Ping Tsai received the BS and MSdegrees in computer science and informationengineering from National Chiao Tung Univer-sity, Hsinchu, Taiwan, in 1996 and 1998,respectively, and the PhD degree in electricalengineering from National Taiwan University,Taipei, Taiwan, in January 2009. She is now anassistant professor in the Department of Elec-trical Engineering, National Chung Hsing Uni-versity. Her research interests include data
mining, sensor data management, object tracking, mobile computing,and wireless data broadcasting. She is a member of the IEEE.
De-Nian Yang received the BS and PhDdegrees from the Department of ElectricalEngineering, National Taiwan University, Taipei,Taiwan, in 1999 and 2004, respectively. From1999 to 2004, he joined the Internet ResearchLab with advisor Prof. Wanjiun Liao. Afterward,he joined the Network Database Lab withadvisor Prof. Ming-Syan Chen as a postdoctoralfellow for the military services. He is now anassistant research fellow in the Institute of
Information Science (IIS) and the Research Center of InformationTechnology Innovation (CITI), Academia Sinica.
Ming-Syan Chen received the BS degree inelectrical engineering from the National TaiwanUniversity, Taipei, Taiwan, and the MS and PhDdegrees in computer, information and controlengineering from the University of Michigan, AnnArbor, in 1985 and 1988, respectively. He is nowa distinguished research fellow and the directorof the Research Center of Information Technol-ogy Innovation (CITI) in the Academia Sinica,Taiwan, and is also a distinguished professor
jointly appointed by the EE Department, the CSIE Department, and theGraduate Institute of Communication Engineering (GICE) at the NationalTaiwan University. He was a research staff member at IBM ThomasJ. Watson Research Center, Yorktown Heights, New York, from 1988 to1996, the director of GICE from 2003 to 2006, and also the president/CEO of the Institute for Information Industry (III), which is one of thelargest organizations for information technology in Taiwan, from 2007 to2008. His research interests include databases, data mining, mobilecomputing systems, and multimedia networking, and he has publishedmore than 290 papers in his research areas. In addition to serving asprogram chairs/vice-chairs and keynote/tutorial speakers in manyinternational conferences, he was an associate editor of the IEEETransactions on Knowledge and Data Engineering, the VLDB Journal,Knowledge and Information Systems (KAIS), and also The Journal ofInformation Systems Education (JISE), and is currently the editor-in-chief of the International Journal of Electrical Engineering (IJEE). Heholds, or has applied for, 18 US patents and 7 ROC patents in hisresearch areas. He is a recipient of the National Science Council (NSC)Distinguished Research Award, the Pan Wen Yuan DistinguishedResearch Award, the Teco Award, the Honorary Medal of Information,and the K.-T. Li Research Breakthrough Award for his research work,and also the Outstanding Innovation Award from IBM Corporate for hiscontribution to a major database product. He also received numerousawards for his research, teaching, inventions, and patent applications.He is a fellow of the ACM and the IEEE.
. For more information on this or any other computing topic,please visit our Digital Library at www.computer.org/publications/dlib.
TSAI ET AL.: MINING GROUP MOVEMENT PATTERNS FOR TRACKING MOVING OBJECTS EFFICIENTLY 281