mineral commodity summaries of the czech … · the yearbook “mineral commodity summaries of the...
TRANSCRIPT
MINERAL COMMODITY SUMMARIES
OF THE CZECH REPUBLIC
(STATE TO 2006)
(Data deadline: August 31, 2007)
Ministry of the EnvironmentCzech Geological Survey – Geofond
October 2007

Reviewed by:Phillip C.F. Crowson
Arnošt Dudek(except the chapters Geological evolution of the area of the Czech Republic and Regional geological terms)
Dušan ĎuricaPhilippe Gentilhomme
Miloš KužvartJiří Pešek
Marian RadetzkiVladimír Sattran
Martin SivekMiroslav Šedina
Friedrich-Wilhelm Wellmer
Compiled by:Jaromír StarýPavel Kavina
Mirko Vaněček Ivo SitenskýJana Kotková
Tereza Nekutová
Graphic design:Ludmila Richterová
ISSN 1801-6693

CONTENTS
page
ExplaNaTOry NOTES ..................................................................................... .5
List of abbreviations, symboLs and technicaL units ……………………………..... .6exchange and infLation rates of currencies in which mineraLs are priced.......... .10
INTrODUCTION................................................................................................. .11
MINEral BaSE OF THE CZECH rEpUBlIC aND ITS DEVElOpMENT IN 2006.................................................................... .15
ECONOMy aND MINEralS.............................................................................. .23
deveLopment of the czech and worLd economy and importance of raw materiaLs .................................................................... 24Legend to seLected economic terms ............................................................... 38the economic situation of domestic mining enterprises ................................... 41outLine of domestic mine production ............................................................... .77
MINEralS IN THE CZECH FOrEIGN TraDE ....................................................... .79
MINING aND NaTUrE prOTECTION ..................................................................... .87
GEOlOGy aND MINEralS..................................................................................... .97
geoLogicaL evoLution of the area of the czech repubLic................................. .98regionaL geoLogicaL terms (used beLow in the yearbook in chapters deaLing with particuLar mineraLs)............................................................................... .112
ENErGy MINEralS – GEOlOGICal rESErVES aND MINE prODUCTION.................................................................................. .117
uranium ....................................................................................................... 119bituminous coaL ........................................................................................... 129brown coaL .................................................................................................. 139Lignite ......................................................................................................... 146crude oiL ..................................................................................................... 150naturaL gas .................................................................................................. .159

�
INDUSTrIal MINEralS – GEOlOGICal rESErVES aND MINE prODUCTION.................................................................................. .167
fLuorspar .................................................................................................... 169barite .......................................................................................................... 176graphite ...................................................................................................... 181gemstones ................................................................................................... 188kaoLin .......................................................................................................... 197cLays ........................................................................................................... 207bentonite ..................................................................................................... 215diatomite ..................................................................................................... 222feLdspar ...................................................................................................... 227siLica mineraLs ............................................................................................. 236gLass sand .................................................................................................. 242foundry sand ............................................................................................... 249Limestones and corrective additives for cement production ......................... 254doLomite ...................................................................................................... 265gypsum ......................................................................................................... .269
CONSTrUCTION MINEralS – GEOlOGICal rESErVES aND MINE prODUCTION.................................................................................. .275
dimension stone ........................................................................................... 278crushed stone ............................................................................................. 287sand and graveL ........................................................................................... 295brick cLays and reLated mineraLs ................................................................... .303
METallIC OrES – GEOlOGICal rESErVES aND MINE prODUCTION.................................................................................. .309
iron ............................................................................................................. 310manganese ................................................................................................... 319copper ........................................................................................................ 326Lead ............................................................................................................. 334zinc ............................................................................................................. 341tin ............................................................................................................... 348tungsten ..................................................................................................... 355siLver .......................................................................................................... 362goLd ............................................................................................................. .368
BaSIC DaTa ON SElECTED raW MaTErIalS NOT prODUCED IN THE CZECH rEpUBlIC ............................................................................. .375
Contents
ExplaNaTOry NOTES

6
list of abbreviations, symbols and technical units
AOPK ČR Agency for Nature Conservation and Landscape Protection (Nature Conservation Authority) of the Czech Republic (Agentura ochrany přírody a krajiny České republiky)
API American Petroleum InstituteAPI degrees Degrees of crude oil specific gravity defined by the API (°API) API gravity formulas: °API gravity = SG
14at1.5
60° F – 131.5
141.5 SG at 60° F = °API gravity + 131.5 SG = specific gravity (t/m3) 60° F = 15,6° CAPT Ammonium Paratungstate, formula (NH4)10[H2W12O42]·4H2OARSM (Czech) Association for recycling of building materials development
(Asociace pro rozvoj recyklace stavebních materiálů)a. s. initials after a Czech company name indicate that it is a joint stock
company (akciová společnost)ATPC Association of Tin Producing Countriesbbl barrel of crude petroleum, 158.99 dm3; 1 tonne of crude petroleum is
approximately 7 bblbill billion, 109
BP British Petroleum, British multinational petrochemical companyBtu British thermal unit, 252 cal, 1,055.06 Jcarat abbreviated as ct – (metric carat), weight unit for gemstones, equal to 0.2 g – unit of gold content (purity) in its alloys equal to 4.167 %; 24 carats = 100 % for fine goldCBM Coal Bed MethaneČBÚ Czech Mining Office (Český báňský úřad)CFR Cost and Freight (named port of destination)CHKO Protected landscape area (Chráněná krajinná oblast)CHLÚ Protected deposit area (Chráněné ložiskové území)CI Coal Information, mineral (coal) yearbook of the IEACIF Cost, Insurance and Freight (named port of destination)ČNB Czech National Bank (Česká národní banka)
Explanatory notes

7
ČNR Czech National Council (Česká národní rada)COCHILCO Comisión Chilena del Cobre, Chilean Copper CommissionCOREX® smelting reduction process that allows for the production of hot metal in
blast furnace from non-coking coal and ore (concentrate) of various qualityČR Czech Republic (Česká republika)CSK Czechoslovak Koruna (československá koruna)ČSÚ Czech Statistical Office (Český statistický úřad)CZK Czech Koruna (česká koruna)DRI Direct Reduction of Iron, this method makes iron from high-grade ore
without the use of a blast furnace, coke, or limestoneDU depleted uranium (mostly below 0.2 % 235U)e estimateECU European Currency UnitEFTA European Free Trade AssociationEIA Environmental Impact AssessmentEIU Economist Intelligence Unit, world’s provider of country, industry and
management analysis based in LondonESA Euratom Supply Agency, European agency for common supply policy
on the principle of regular and equitable supply of nuclear fuels for Community users
EU European UnionEUR Euro, currency of Eurozone countries of the European UnionEXW Ex Works (named place)FAS Free Alongside Ship (named port of shipment)FOB Free on Board (named port of shipment)FOL Free on Lorry (named place) (United Kingdom)FOT Free on Truck (named place) (USA)Ga billion of yearsGBP British pound (Great Britain pound, pound sterling)GBp British penceGCC Ground Calcium CarbonateGDP Gross Domestic ProductHEU highly-enriched uranium (above 20 % 235U)IAEA International Atomic Energy AgencyICSG International Copper Study GroupIEA International Energy AgencyIISI International Iron and Steel Institute ILZSG International Lead and Zinc Study Group
List of abbreviations, symbols and technical units

8
IMF International Monetary FundIPE International Petroleum Exchange (London, UK) ISL In Situ Leaching (leaching of U ores just in their deposit)k. s. initials after a Czech company name indicate that it is a limited partnership
company (komanditní společnost)kt kilotonne, 1,000 tlb pound, 0.4536 kg LEU low-enriched uranium (up to 20 % 235U, mostly 3–5 %)LME London Metal ExchangeMa million of yearsMCS Mineral Commodity Summaries, mineral yearbook of the US Geological
Surveymesh to designate screen size as the number of openings per linear inch
(including screen wire diameter)MF Ministry of Finance (of the Czech Republic) (Ministerstvo financí)MH ČR Ministry of Economy of the Czech Republic (Ministerstvo hospodářství
České republiky)MHPR ČR Ministry of Economic Policy and Development of the Czech Republic
(Ministerstvo pro hospodářskou politiku a rozvoj České republiky)MJ megajoule, 106 Jmill million, 106
MOX mixed oxide fuel (mixture of plutonium and oxides of uranium from reprocessed burned nuclear fuel, where 235U is replaced by 239Pu as a main energy source)
MPO ČR Ministry of Industry and Trade of the Czech Republic (Ministerstvo průmyslu a obchodu České republiky)
mtu metric tonne unit, 10 kg, in concentrates (1 % by weight of useful component content in 1 tonne of concentrate or ore purchased by smelter)
MŽP ČR Ministry of the Environment of the Czech Republic (Ministerstvo životního prostředí České republiky)
N not available or not reliable dataNP Natural park (Národní park)NPP nuclear power plantNYMEX New York Mercantile ExchangeOECD Organization for Economic Cooperation and DevelopmentOPEC Organization of Petroleum Exporting CountriesPCC Precipitated Calcium CarbonatePCE Pyrometric cone equivalentPETE Polyethylene Terephthalate, used mainly for manufacture of bewerage
bottles
Explanatory notes
9
ppm parts per million, 0.0001 %PÚ exploration area (průzkumné území)Sb. Collection of Laws (abbreviated as Coll.) of the Czech Republics. p. initials after a Czech company name indicate that it is a state public
enterprise (státní podnik)spol. s r. o. initials after a Czech company name indicate that it is a limited liability
company (společnost s ručením omezeným), ditto initials s.r.o.s. r. o. initials after a Czech company name indicate that it is a limited liability
company (společnost s ručením omezeným), ditto initials spol. s r.o.SEU slightly enriched uranium (0,9–2 % 235U)st short ton, 907.2 kgt metric tonne, 1,000 kg, 1,000,000 gths thousand, 103
troy oz Troy ounce (t oz), 31.103 gT/C Treatment Charge, the amount per tonne of ore or concentrate (Sn, Pb,
Zn, Cu, etc.), charged by the smelter for converting ore or concentrate to metal; it is incorporated into price at which the smelter buys 1 % by weight of useful component content in concentrate or ore (mtu)
UI Uranium InstituteUNCTAD United Nations Conference on Trade and DevelopmentUSBM United States Bureau of Mines (disbanded in 1995–1996)USD United States DollarUSc United States centUSGS United States Geological SurveyVAT value added taxv. o. s. initials after a company name indicate that it is an unlimited company
(general partnership) (veřejná obchodní společnost)WBD Welt Bergbau Daten, mineral yearbook of Austrian Federal Ministry for
Economy and Labour WNA World Nuclear AssociationWMS World Mineral Statistics, mineral yearbook of the British Geological
Survey till 2004WMP World Mineral Production, mineral yearbook of the British Geological
Survey since 2005WMMR World Metals & Mineral Review 2005, mineral yearbook of the Metal
Bulletin PlcWOGR World Oil and Gas Review, mineral (petroleum, natural gas) yearbook
of the Italian multinational petrochemical company ENI (Ente Nazionale Idrocarburi) S.p.A.
ZCHÚ Specially protected area (Zvláště chráněné území)
List of abbreviations, symbols and technical units

10
Exchange and inflation rates of currencies in which minerals are priced
Annual inflation rates in the USA (US), United Kingdom (UK), Euro Area (EUR) and Czech Republic (CZ)
US UK EUR CZ1991 �.2 7.� 56.61992 3.0 �.3 11.11993 3.0 2.5 20.8199� 2.6 2.1 10.01995 2.8 2.6 9.21996 2.9 2.� 8.81997 2.3 1.8 8.�1998 1.5 1.6 10.61999 2.2 1.3 1.1 2.32000 3.� 0.9 2.1 3.82001 2.8 1.2 2.� �.72002 1.6 1.3 2.3 1.82003 2.3 1.� 2.1 0.1200� 2.7 1.3 2.1 2.82005 3.� 2.0 2.2 1.82006 3.2 2.3 2.2 2.5
Notes:• source – IMF. World Economic Outlook Database. April 2007• inflation rates based on average annual changes of consumer price indices
(index 2000 = 100)
Average yearly exchange rates of CZK against EUR, USD and GBPEUR USD GBP
1991 . 29.5 52.01992 . 28.3 �9.91993 . 29.2 �3.8199� . 28.8 ��.01995 . 26.5 �1.91996 . 27.1 �2.31997 . 31.7 51.91998 . 32.3 53.�1999 36.9 3�.6 56.02000 35.6 38.6 58.�2001 3�.1 38.0 5�.82002 30.8 32.7 �9.02003 31.8 28.2 �6.0200� 31.9 25.7 �7.12005 29.8 23.9 �3.62006 28.3 22.6 �1.6
Source: Czech National Bank
Explanatory notes

11
INTrODUCTION
The yearbook “Mineral Commodity Summaries of the Czech Republic”, published for the fifteenth time, is intended to inform professional and particularly business communities and to assist the expansion of the minerals industry in line with relevant legislation and interests of mining organizations.
The group of reviewers of the last year was modified and completed especially as its foreign members concerns. Two of the reviewers and authors proved their high theoreti-cal and practical abilities by becoming the Deputy General Manager of the Ariab Mining Company in Sudan (Charles Huijbregts) and the Chief Geologist of Londex Resources Company in Azerbaijan (Mirko Vaněček). Only the second one has found time to work on the Summaries this year. In addition to the authors and reviewers, there are other experts involved in the yearbook preparation. We acknowledge a long-term help of Jean-Pierre Ivan Benz, former mine specialist of the Bureau de Recherches Géologiques et Minières in Orléans, France.
Suggestions of the reviewers and readers are being incorporated in the yearbook gradu-ally depending on the capacity of the author team and restrictions resulting from the time schedule of the yearbook preparation.
This publication covers the most important minerals of the Czech Republic, which have been recently of an industrial importance. It includes basic data on the state and changes in reserves of raw materials in the Czech Republic extracted from the “Register of Reserves of Mineral Deposits” (hereinafter the “Register”), which is published for only a limited number of state administration bodies.
Additional information on prices of minerals, their technological parameters and use, imports and exports, major mining companies and the location of mineral deposits is in-tended to assist towards an understanding of the mineral potential of the Czech Republic and to stimulate investment in the minerals industry.
The publication is being updated by relevant statistical data as demanded by progress in the national information system and international cooperation and taking into account readers’ comments.
Hereinto presented (mineral) reserves are geological otherwise “total reserves”, i.e. orig-inal reserves (in situ) within individual deposits, estimated according to the given classifi-cation and technical-economic conditions of their exploitability. The basic data come from mineral reserves estimations, which were approved or verified in the past by the Commis-sion for Classification of Mineral Reserves and/or by the Commission for Exploration and Mining of Reserved Minerals of the former Ministry of Economy of the Czech Republic and Ministry of Economic Policy and Development of the Czech Republic or by former commissions for management of mineral reserves of individual mining and processing in-dustries. Uranium reserves and reserve estimations were approved by the Commission for Classification of Reserves of Radioactive Raw Materials of the former Federal Ministry of Fuels and Power. Nowadays mineral reserves are approved by the Commission for Projects and Final Reports of the Ministry of the Environment of the Czech Republic or by bodies ordering geological works.

12
There are reserved and non-reserved minerals and deposits defined by the Mining Act no. 44/1988 Coll., as amended. Reserved minerals always form reserved deposits. The reserved deposits are owned by the Czech Republic. Non-reserved deposits are owned by ground owners. Non-reserved minerals (construction minerals) can form both reserved and non-re-served deposits. Until 1991, the reserved ones were those of sufficient mineral quantity and quality, which were proclaimed “suitable for national economy needs and development” in then valid Mining Act wording. After 1991, the newly recognized and explored deposits of non-reserved minerals form non-reserved deposits.
Geological reserves on reserved deposits of reserved and non-reserved minerals – as of December 31, 2006 – achieved 49 billion tonnes with prevalence of energy minerals and construction minerals. The Ministry of the Environment together with the Ministry of Industry and Trade undertook a fundamental economic revaluation of the mineral wealth of the Czech Republic in 1993–2001. The task continued to a smaller extent into 2003. For this reason, many changes have occurred in volume of reserves or number of deposits of many minerals (especially metallic ores) in comparison with past years.
The yearbook “Mineral Commodity Summaries of the Czech Republic” includes se-lected minerals, i.e. mineral fuels, industrial minerals and construction minerals and metal-lic ores, which are of economic importance and substantial reserves (in case of ores in the past) on the territory of the Czech Republic. Each mineral is presented in a separate chapter consisting of eleven parts.
Part 1. Characteristics and use – provides a basic description of the mineral raw mate-rial, its abundance in nature, major minerals and general use.
Part 2. Mineral resources of the Czech Republic – describes major regions of occur-rence, characteristics of deposits, ore types, mining and potential use of the given mineral.
Part 3. Registered deposits and other resources of the Czech Republic – is based upon the Register of mineral deposits of the Czech Republic and for the majority of miner-als it includes a list of deposits and their location. Names of exploited deposits are given in bold. As for energy minerals and some industrial minerals, only regions and basins rather than single deposits are given. As for dimension stone and construction minerals, hundreds of these deposits are scattered over the whole territory of the Czech Republic. Consequent-ly, neither their list nor locations are given in this paragraph; however, their groupings are localized in subdivision to registered, non-registered, worked and unworked deposits.
Part 4. Basic statistical data of the Czech Republic as of December 31 are extracted from the Register. There are 3 groups of minerals (ores, energy minerals and reserved in-dustrial and construction minerals (building materials)) registered in the Czech Republic. Mining production in non-reserved deposits has been monitored since 1999.
NOTE: There is a difference in terminology between Czech official application of the term reserves and standard international application of the term. Exactly trans-lated, Potentially economic reserves are not recoverable now but sometimes in future – they are therefore actually potentially economic resources. Consequently Total min-eral reserves are in reality Total mineral resources.
Part 5. Foreign trade – provides information on import and export of important cus-toms tariff items of the raw material. Data on foreign trade are the latest (continuously reviewed) data of the ČSÚ.
Introduction

13
Part 6. Prices of domestic market and foreign trade – gives indicative prices on do-mestic production, import and export prices. Domestic prices do not include VAT.
Part 7. Mining companies in the Czech Republic as of December 2006. This part gives a list of companies, which are mining the given mineral on the territory of the Czech Republic. The companies are arranged according to the level of production. Their addresses are at disposal in the Czech Geological Survey – Geofond.
Part 8. World production gives data on mining and production of commercial products for the last 5 years. There are also quoted significant world producers, i.e. 5–10 top produc-ers in the world production.
Part 9. World market prices – gives a summary of world prices and their evolution in the last five years as well as prices based upon quotations or prices negotiated in contracts.
Part 10. Recycling – gives a brief description of possible recycling methods known in the world.
Part 11. Substitutes – this paragraph provides an appraisal of materials, which can sub-stitute for the given mineral (worldwide).
Numerous domestic data and foreign materials were used when compiling the present year-book, especially data from journals and last editions of various international statistical year-books (for example Welt Bergbau Daten 2007 (WBD), Mineral Commodity Summaries 2007 (MCS), World Mineral Statistics (WMS), World Mineral Production 2001–2005 (WMP), World Oil and Gas Review 2004 (WOGR), Coal Information (CI), World Metals & Min-eral Review 2005 (WMMR), BP Statistical Review of World Energy 2007, Estadísticas del Cobre y Otros Minerales 1987–2006 de Comisión Chilena del Cobre).
Introduction


15
MINEral BaSE OF THE CZECH rEpUBlIC aND ITS DEVElOpMENT IN 2006
Tomáš Sobota and Josef Janda, Ministry of the Environment
Minerals, defined in Act No. 44/1988 Coll. on mineral protection and exploitation amended by later regulations, are divided into reserved and non-reserved. Natural accumu-lations of reserved minerals form reserved mineral deposits. These constitute the mineral wealth of the country and are owned by the Czech Republic. Deposits of non-reserved minerals (especially sand and gravel, crushed stone and brick clay) are a constituent part of the land as stipulated by § 7 of the Mining Act. The former option to declare significant non-reserved mineral deposits as reserved ones was cancelled by the amendment of the Mining Act from 1991. Decisions of the state administration bodies in this matter, which had been issued before the amendment went into force, remain valid based on transitional provisions (§ 43a par. 1 of the Mining Act). Deposits specified by these decisions are still reserved deposits, i.e. owned by the state, detached from the land itself.
The prospecting and exploration of reserved minerals deposits and their exploration are regulated by the Czech National Council Act No. 62/1988 Coll. on geological works, amend-ed by later regulations. Prospecting and exploration can be carried out by an individual or organization, providing that the works are managed and guaranteed by a qualified and certi-fied person (responsible manager of geological works). The organization, which is going to carry out prospecting and exploration of deposits of these minerals, verification of reserves and processing of geological documents for their exploitation and protection, has to request the establishment of the exploration area at the Ministry of the Environment. The proceed-ings, subject to administrative rules, are concluded by an establishment or non-establishment of the “exploration area”. This, in the former case, includes a determination of the follow-ing: the survey area, the mineral to be prospected and explored which the area is established for, the conditions for the execution of the works and the period of licence validity for the exploration area. The exploration area is not a territorial decision, but it provides the entre-preneur or organization (hereinafter entrepreneur) with the exclusive privilege to prospect for the mineral on the exploration area. The entrepreneur is obliged by law to pay a tax of CZK 2,000 per any opened square kilometre of the exploration area in the first year. This tax increases each year by CZK 1,000 per each opened km2. These taxes represent an income for municipalities, in whose cadastral area the exploration area is established.
Within the scope of work plans and operations for reserved mineral deposits prospecting and exploration, the organization must consider conditions and respect interests protected by special regulations (§ 22 of the Act on geological works). This primarily refers to laws for the protection of landscape and nature, agriculture and forestland, water, mining laws and the like. The Ministry of the Environment can cancel the established exploration area if the organization repeatedly breaks the obligations given by the Geological Act.
The above-mentioned enactments can be applied to prospecting and exploration of non-reserved mineral deposits only if they were previously declared as reserved deposits ac-cording to transitional provisions of the Mining Act. In other cases, an organization can carry out new prospecting and exploration of non-reserved minerals only upon agreement

16
with the landowner. The provision under § 22 of the Act on geological works is also valid in these cases. Mining of reserved deposits is a mining activity and mining of non-reserved deposits, which represent a part of the land, is an activity carried out in the mining way ac-cording to the mining methods of Act No. 61/1988 Coll. on mining activity, explosives and on the state mining administration, amended by later regulations.
When the reserved mineral is found to be of quality and volume indicative of its accu-mulation (which is supported by a partial deposit reserve estimate given in the category of prospected reserves during prospecting and exploration), the organization reports it to the Ministry of the Environment, which issues the certificate for the reserved deposit owned by the state. At the same time, this certificate guarantees the protection of the reserved deposit against actions making its mining difficult or impossible by the establishment of its pro-tected deposit area (CHLÚ) according to § 17 of the Mining Act.
The entrepreneur’s right to mine the reserved deposit is provided by the mining lease allocation. An application for the determination of a lease must be preceded by the consent of the Ministry of the Environment. The Ministry´s approval is subject to the fulfilment of limiting conditions, which take into consideration state mineral policy interests, and cov-ering the expenses of geological works taken from the state budget. The organization, on whose behalf the exploration was carried out, has priority in the acquisition of the precedent consent for the mining lease allocation. If it fails to assert its lease, precedence is given to the organization, which participated financially in the exploration. Different rules apply to cases concerning oil and gas based on the transposed EU directive.
The mining lease is only allocated to the entrepreneur possessing the “Certificate of mining operations” issued by the authorised Regional Mining Office. This office determines the min-ing lease in cooperation with other state administration bodies, mainly in agreement with envi-ronmental and territorial planning and building authorities. The entrepreneur must support the application for the determination of a lease by documentation as stipulated by law. Relations with the owners of the land and a settlement of conflicts of interests, which are protected by special regulations, are dealt with during the administrative procedure. The environmental im-pact assessment (EIA) represents a part of the documentation, too. The decision, establishing a mining lease, represents a mining authorization,as well as a decision on area exploitation.
The entrepreneur, who obtained the determined mining lease, can start mining operations only after the mining activities licence is issued by the authorised Regional Mining Office. Issue of this licence is subject to an administrative procedure, during which plans of open-ing, preparation and mining of the deposit and plans of rehabilitation and reclamation after finishing the exploitation of the deposit are assessed. In justified cases, the Regional Mining Office can combine the determination of the mining lease and the permission of mining activities into one administrative procedure.
The entrepreneur is obliged to pay payments from the leases and extracted reserved min-erals. A yearly lease payment of CZK 100 to 1,000 is assessed for every opened hectare of the mining lease in the area demarcated on the surface. The payment is graded with respect to the degree of the environmental protection of the area in question, the type of the activity carried out in the mining lease and its environmental impact. Every Regional Mining Office fully transfers this payment to the municipalities in whose territories the lease is located. The ratio corresponds to the lease proportions of each municipality territory.
Yearly payment for minerals exploited in mining leases (royalty) is given by the Ministry of Economy and Trade Decrees No. 426/2001 Coll. and 63/2005 Coll., which amend De-
Mineral base of the Czech Republic and its development in 2006

17
cree No. 617/1992 Coll., regulating details of mining lease and extracted reserved minerals payments. The royalty is calculated as
Nd SU= ––– · T · ––– , Nc 100whereNd = costs of mineral exploitation (ths CZK)Nc = total costs of the enterprise for manufacture of products (ths CZK)T = sales (ths CZK)S = royalty rate (%)U = royalty total (ths CZK) The Regional Mining Office transfers 25 % of the yield from the royalty to the state
budget of the Czech Republic, from which these finances will be purposefully used for remediation of damage to the environment caused by the mining of reserved and non-re-served deposits, and the remaining 75 % to the budget of the relevant municipalities.
During mining activities, the entrepreneur is obliged to produce sufficient financial re-serves for mine damages and the reclamation of areas affected by the deposit exploita-tion. The creation of these reserves is approved by the Regional Mining Office during the procedure of permission of mining activities, the opening and exploitation of the deposit. The withdrawal of the financial reserves is permitted by the Regional Mining Office in agreement with the Ministry of the Environment upon opinion of the affected municipality. In the case of enterprises owned partly by the state, the Regional Mining Office decides in agreement with the Ministry of Industry and Trade.
Selected statistical data on exploration and mining on the territory of the Czech Republic
Statistical data/year 2002 2003 2004 2005 2006
registered.geological.works 2.069 2.680 2.850 2.631 2.563
protected.deposit.areas 965 1.018 1.052 1.0�8 1.060
mining.leases.–.total.number 1.010 1.008 1.00� 998 986
number.of.exploited.reserved.deposits 525 5�0 513 517 508
number.of.exploited.non-reserved.deposits 218 252 220 22� 219
mine.production.of.reserved.deposits,.mill.t.a) 125 133 13� 135 138
mine.production.of.non-reserved.deposits,.mill.t.a) 11 12 13 1� 15
organizations.managing.reserved.deposits 362 387 31� 335 328
organizations.mining.reserved.deposits 236 231 227 215 20�
organizations.mining.non-reserved.deposits. 187 195 167 190 165
Note: a) conversion to tonnes: natural gas – 1,000 m3 = 1 t; dimension and crushed stones – 1,000 m3
= 2,700 t; sand and gravel and brick clays – 1,000 m3 = 1,800 t
Mineral base of the Czech Republic and its development in 2006
18
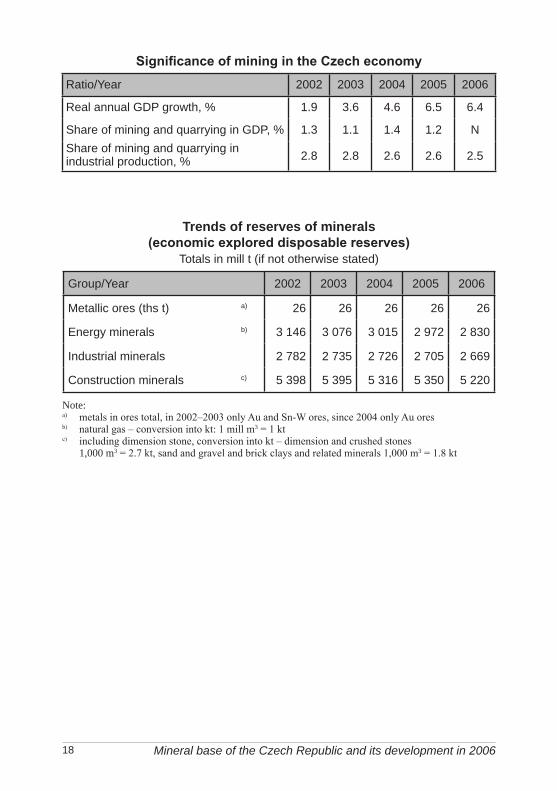
Significance of mining in the Czech economyRatio/Year 2002 2003 200� 2005 2006
Real.annual.GDP.growth,.% 1.9 3.6 �.6 6.5 6.�
Share.of.mining.and.quarrying.in.GDP,.% 1.3 1.1 1.� 1.2 NShare.of.mining.and.quarrying.in.industrial.production,.% 2.8 2.8 2.6 2.6 2.5
Trends of reserves of minerals (economic explored disposable reserves)
Totals.in.mill.t.(if.not.otherwise.stated)
Group/Year 2002 2003 200� 2005 2006
Metallic.ores.(ths.t). a) 26 26 26 26 26
Energy.minerals b) 3.1�6. 3.076. 3.015. 2.972 2.830
Industrial.minerals 2.782. 2.735. 2.726. 2.705 2.669
Construction.minerals c) 5.398. 5.395. 5.316. 5.350 5.220
Note:a) metals in ores total, in 2002–2003 only Au and Sn-W ores, since 2004 only Au ores b) natural gas – conversion into kt: 1 mill m3 = 1 ktc) including dimension stone, conversion into kt – dimension and crushed stones
1,000 m3 = 2.7 kt, sand and gravel and brick clays and related minerals 1,000 m3 = 1.8 kt
Mineral base of the Czech Republic and its development in 2006

19
Summary of exploration licences valid in 2006 and exploration licences issued during 2006
Exploration areas (EA) in 2006Prospecting and exploration works financed by companies
Minerals Number.of.valid.EA.(min..1)
Number.of.valid.EA.(min..2)
Number.of.new.issues.in.2006
Start.of.validity.in.2006
Hard.coal 1 0 0 0Crude.oil.and.natural.gas �2 0 2 2Gemstones 3 1 0 0Kaolin 7 0 2 2Clays 3 0 1 1Bentonite 6 1 3 3Feldspar.and.feldspar.substitutes .7 1 2 2Silica.raw.materials � 0 1 1Crushed.stone 0 1 0 0Sand.and.gravel 6 2 2 2Total 79 6 13 13
Mineral 1 (min. 1) – in case that the raw material is the major oneMineral 2 (min. 2) – in case that the raw materials is an accompanying one
Prospecting and exploration works financed from the state budget
Geological works related to prospecting, exploration and protection of reserved depos-its financed from the state budget in the amount of CZK 1.615 mill were executed by the Ministry of Environment in 2006. For instance, exploration of new deposits of reserved minerals in order to establish their protection for future use was carried out. This concerns exploration of bentonite and feldspar deposits.
The central geological state administration body fulfils duty of the state register of re-served deposits – the state property (§ 29 of the Mining Act). For this purpose, it issues the “Register” as one of the main bases for• territorial planning • raw material policy• policy of the environment• structural policy• policy of employment
In the Register, deposits in the state documented by the most recent reserve estimate are given. The estimate of reserves is carried out according to the conditions of exploit-ability expressing• state of the market, prices, economy of the enterprise• mining and technical conditions of the exploitation• conflicts of interests with the deposit exploitation (primarily protection of the environ-
ment and other conflicts)
Mineral base of the Czech Republic and its development in 2006

20
All these factors are changeable, reflecting political, economic and social changes (in the largest sense).
Revaluation of deposits not allocated for entrepreneurial exploitation continued. Part of the finances from the state budget was allocated to efface consequences of raw
material exploration and mining.The state of some technical workings carried out during geological exploration in the
past has deteriorated and started to endanger the environment. Therefore they had to be liquidated. In 2006, CZK 10.257 mill were spent for liquidation of these workings.
A partial programme continued aiming to perform a revaluation of heaps, dumpings and tailings after mineral mining from two fundamental standpoints:a) which of the existing heaps, dumpings and tailings represent an accumulation of mineral
potentially exploitable in future, and have to be considered potentially exploitable min-eral accumulations
b) which is the state of biotope in heaps, dumpings and tailings and which of them represent a risk factor from standpoints of environmental management.
Results of works in this area are used also at evaluation of impact of former mining op-erations in individual localities. CZK 4.253 mill were allocated to these works in 2006.
Expenditures for exploration works on mineral deposit studies
financed from the state budget (rounded.values)
1993. CZK.2�8.7.mill199�. CZK.2�9.8.mill1995. CZK.2�2.3.mill1996. CZK.163.0.mill1997. CZK.113.2.mill1998. CZK.11�.2.mill1999. CZK.110.8.mill2000. CZK.. 26.3.mill2001. CZK.. 21.5.mill2002. CZK.. 17.0.mill2003. CZK.. 7.0.mill200�. CZK.. 26.2.mill2005. CZK.. 12.0.mill2006. CZK.. 1.7.mill
Mainly geological works of a „non-deposit“ character were financed from the state budget. Particular public orders were placed for an implementation of the following partial programmes:
Mineral base of the Czech Republic and its development in 2006

21
– removal of consequences of the last geological (non-deposit) works financed by the state (some not yet liquidated mining workings, boreholes)
– geological informatics– geological mapping– risk geofactors of the environment– hydrogeology– engineering geology– complex geological studies
About CZK 55.4 mill in total were spent on these geological works in 2006.
Selected legal regulations on mineral prospecting and exploration in force as of June 30, 2007
acts
Act No. 44/1988 Coll. on mineral protection and use (Mining Act) – as amended by the Acts No. 541/1991 Coll., No. 10/1993 Coll., No. 168/1993 Coll., No. 132/2000 Coll., No. 258/2000 Coll., No. 366/2000 Coll., No. 315/2001 Coll., No. 61/2002 Coll., No. 320/2002 Coll., No. 150/2003 Coll., 3/2005 Coll., No. 386/2005 Coll., No. 186/2006 Coll. and No. 313/2006 Coll.
Act No. 61/1988 Coll. on mining operations, explosives and state mining administration as amended by the Acts No. 425/1990 Coll., No. 542/1991 Coll., No. 169/1993 Coll., No. 128/1999 Coll., No. 71/2000 Coll., No. 124/2000 Coll., No. 315/2001 Coll., No. 206/2002 Coll., No. 320/2002 Coll., No. 226/2004 Coll., No. 3/2005 Coll., No. 386/2005 Coll., No.186/2006 Coll., No. 313/2006 Coll. and No. 342/2006 Coll.
Act No. 62/1988 Coll. on geological works as amended by the Acts No. 543/1991 Coll., No. 366/2000 Coll., No. 320/2002 Coll., No. 18/2004 Coll., No. 3/2005 Coll., No. 444/2005 Coll. and No. 186/2006 Coll.
Other legal regulations
Mineral deposits exploitation
Decree of the ČBÚ No. 306/2002 Coll. that determines districts of operation of the Dis-trict Mining Offices.
Decree of the ČBÚ No. 104/1988 Coll. on efficient use of reserved deposits, on permits and notification of mining operations and other operations that use mining methods amended in Decree No. 242/1993 Coll., No. 434/2000 Coll. and No. 299/2005 Coll.
Decree of the ČBÚ No. 415/1991 Coll. on construction, elaboration of documentation and determination of safety pillars, rods and zones of protection of underground and surface objects in wording of the Decree of the ČBÚ No. 340/1992 Coll. and No. 331/2002 Coll.
Mineral base of the Czech Republic and its development in 2006
22
Decree of the ČBÚ No. 172/1992 Coll. on mining leases in the wording of the Decree No. 351/2000 Coll.
Decree of the ČBÚ No. 175/1992 Coll. on conditions of non-reserved mineral deposit exploitation in the wording of the Decree No. 298/2005 Coll.
Decree of the MŽP ČR No. 363/1992 Coll. on survey of old workings and old workings register management in wording of the Decree of the MŽP No. 368/2004 Coll.
Decree of the MŽP ČR No. 364/1992 Coll. on protected deposit areasDecree of the ČBÚ No. 435/1992 Coll., on mine surveying documentation during mining
and some other operations that use mining methods in the wording of the Decree of the ČBÚ No. 158/1997 Coll. and the Decree No. 298/2005 Coll.
Decree of the MH ČR No. 617/1992 Coll. on details of tax payment from mining leases and extracted reserved minerals, in wording of the Decree of the MPO No. 426/2001 Coll. and No. 63/2005 Coll.
Decree of the MHPR ČR No. 497/1992 Coll., on registration of reserves in reserved mineral deposits
Geological works
Decree of the MŽP No. 282/2001 Coll. on evidence of geological works, in the wording of the Decree of the MŽP No. 368/2004 Coll.
Decree of the MŽP No. 368/2004 Coll. on geological documentation Decree of the MŽP No. 369/2004 Coll. on projection, carrying out and evaluation of
geological works, on announcing of risk geofactors and on procedure at reserve estimate of reserved deposits
regulations on licensing of mining operations and on verification of qualification
Decree of the ČBÚ No. 298/2005 Coll. on professional qualification requirements and professional competence at mining operations or operations that use mining methods and on changes of some legal regulations, in the wording of the Decree No. 240/2006 Coll.
Decree of the ČBÚ No. 15/1995 Coll. on licence of mining operations and other operations that use mining methods as well as of project development of objects and installations, which are a constituent part of these operations, in the wording of Decree No. 298/2005 Coll.
Decree of the MŽP ČR No. 206/2001 Coll. on certificate of qualification to project, carry out and evaluate geological works
Mineral base of the Czech Republic and its development in 2006
ECONOMy aND MINEralS
2�
Development of the Czech and world economy and importance of raw materials
Vojtěch Spěváček, Václav ŽďárekCentre for Economic Studies, University of Economics and Management, Prague
1. Growth performance of the Czech economyThe year 2006 was exceptionally successful for the development of the Czech economy.
The real growth of the gross domestic product (GDP) [1] reached 6.4 % and together with the year 2006 (6.5 %) represented the highest annual GDP growth in Czech history. The GDP grew on average by 3 % during the previous four years. The economic growth rate of the Czech Republic not only increased considerably but the growth also became healthier as a result of changes on both the supply and demand sides. Restructuring and moderniza-tion on the supply side [2] were accelerated by a strong inflow of foreign direct invest-ment and by an increasing importance of corporations under foreign control with markedly higher productivity. Easier accessible financial sources from the banks, low interest rates and expansive fiscal policy assisted the growth, too. This reinforced investment and exports which became a driving force of the growth on the demand side [3]. The entry of the Czech Republic into the EU, which cultivated the institutional environment and increased possi-bilities of free movement of goods, services, capital and labour, undoubtedly represented a positive impulse. Despite the relatively low economic growth of the old member countries of the EU, the dynamics of Czech exports increased significantly and foreign trade became an important growth factor.
The growth on the supply side in 2006 was markedly influenced especially by a strong growth of the gross value added (GVA) [4] in industry and services (see Tab. 1). The ro-bust growth of the GVA in industry (12.9 %) made about 60 % of the total growth of the economy and it became a driving force on the supply side. The tendency to strengthen the position of manufacturing industry increased; the GVA of this industry increased by 15.1 % especially thanks to the enlargement of the production of corporations under foreign control. Production of cars, metallurgy, electrotechnics, production of rubber, plastics and machinery and equipment represented five main industries covering together almost one half of the industrial production. Agriculture showed a strong decrease of production and the GVA increase in the construction industry slowed down markedly compared to the pre-ceding two years. Services displayed a solid growth rate of GVA (4.3 %) and in regard to its high share in total GVA in the national economy they contributed significantly to the growth of the economy. The development in the individual branches of the services was different. The highest GVA growth rates were registered in transport and telecommunications.
Automotive industry with growth of 22.2 % and about 15 % share in the industrial pro-duction contributed the most to the growth of the industrial production. More than 500,000 Škoda cars were produced in 2006, which represents a historical record of this company. The fact that corporations under foreign control gradually exchange imported components by domestic production of car components contributes to the accelerating growth of car
Economy and minerals

25
production, too. On a long term, the increasing importance of automotive industry in the Czech economy can represent a certain risk owing to a cyclic character of demand for cars. Production of electric and optical instruments and equipment (21 %), production and repairs of machinery and equipment (20.8 %) and rubber and plastics (15.3 %) showed dou-ble-digit growth in 2006, too. All these rapidly growing industries have two common de-nominators: a high share of sales from direct export and a high penetration of corporations under foreign control. Metallurgy represented another accelerating industry, with a share of roughly 15 % in total industrial production. Production of metals and metal-working products increased by 9.1 % during the whole year, which represented a big improvement compared to decrease by 1 % in 2005 and at the same time one of the substantial reasons for the industry acceleration in 2006. Favourable development in wood processing and wooden products manufacturing (increase by 9.9 %) from the point of view of economic cycle has continued.
On the domestic demand side, the growth of final demand of households slowed down in 2006, which reflected relatively slow growth of the real disposable incomes of house-holds, the development of which was influenced first of all by the growth of real wages.
Tab. 2: Final demand components (annual percentage change)
GDP[1]
Final.consum-
ption[6]
Private.consum-
ption[7]
Public.consum-
ption[8]
Gross.capital.
formation[9]
Gross.fixed
capital.formation
[10]
Domestic.demand
[11]Export Import
2001 2.5 2.6 2.3 3.6 6.6 6.6 3.7 11.2 12.82002 1.9 3.5 2.2 6.7 �.6 5.1 3.8 2.1 5.02003 3.6 6.3 6.0 7.1 -1.� 0.� �.2 7.2 8.0200� �.6 1.1 2.9 -0.� 9.1 3.9 3.2 20.7 17.92005 6.5 2.� 2.� 2.3 -0.2 2.3 1.7 11.8 5.02006 6.� 3.� �.� 1.1 11.7 7.6 5.8 15.9 15.2
Source: ČSÚ, quarterly national accounts (June 2007), own calculations..
Tab. 1: Gross value added by economic activity (annual percentage change)
2001 2002 2003 200� 2005 2006Agriculture, fishing and forestry -2.8 3.3 �.0 7.8 5.7 -8.0Industry -1.2 �.0 -1.2 13.1 10.8 12.9. Out.of.that:. Mining.and.quarrying -6.5 2.7 -10.9 1�.5 -8.7 13.2
. Manufacturing -0.5 5.� -1.0 13.� 12.� 15.1
. Electricity,.gas.and.water..
. supply -�.� -7.5 1.6 9.3 �.2 -9.1
Construction -5.0 -1.9 2.6 6.2 6.0 2.2Services 5.7 2.3 �.9 0.1 5.7 5.5Total.GVA.1) 2.5 2.5 2.9 �.6 6.7 6.9
Note: 1) without FISIM [5]. Source: ČSÚ – national accounts (June 2007), own calculations.
Development of the Czech and world economy

26
Investment increase speeded up markedly and domestic demand (final consumption and gross capital formation) became the main driving force of the GDP growth. The balance of foreign trade in goods and services [12] reached again positive values, but the contribution of foreign trade to the GDP growth was substantially lower than in 2005. The development of the basic demand components stabilized (see Tab. 2).
The growth rate of GDP of the Czech Republic increased on average up to 3.7 % during the last six years (2001–2006). The economic growth rate significantly increased since the fourth quarter of 2002, after pronounced fluctuations during the previous years marked by the recession of the Czech economy in 1997 and 1998 (see Fig. 1). Up to date the most rapid GDP growth was noted in the last quarter of 2005 (7.0 %). In international comparisons, the Czech Republic moved up to the tenth position in the chart of GDP growth rates in the EU-25 countries in 2001–2006. The chart is led by Baltic states followed by Romania, Bulgaria, Ireland, Slovakia, Greece and Hungary (see Fig. 2). The remarkable gain of the economic growth of the Czech Republic over the growth of the EU, where the average an-nual GDP growth rate was only 1.9 % in 2001–2006, showed itself in acceleration of the real convergence (approaching the level of the average income per capita in the EU). GDP per capita of the Czech Republic in purchasing power parity [13] in relation to the average level in the EU-25 increased from 64.7 % in 2000 to 76.1 % in 2006, i.e. almost by com-plete 11.4 percent points. The Czech Republic this way overcame the loss of its position from the 1990s and reached the 16th position in the GDP per capita within the EU-25. The Czech Republic belongs after Slovenia to the most developed of the new member states of the Central and Eastern Europe. The process of convergence of the Czech economy in the years 2001–2006 was the most rapid from the group of Central European new member states of the EU (Czech Republic, Hungary, Poland, Slovakia and Slovenia).
Most forecasts of the development of the Czech economy for the years 2006 and 2007 are for a slight decrease of the economic growth rate. Renowned international organizations (OECD, EU, IMF) differ in their projections from spring 2007. IMF expects decrease of the GDP growth to 4.8 % in 2007 and to 4.3 % in 2008. This projection seems pessimistic com-pared to the prediction of the Ministry of Finance from April 2007 (this expects increase by 5.3 % in 2007 and by 4.9 % in 2008) and of the Czech National Bank. OECD projection is
Source: ČSÚ (2007) – quarterly national accounts (June 2007).
Fig. 1: Quarterly changes in real GDP in 1997–2006 (percentage change against corresponding quarter of the previous year)
Economy and minerals

27
close to that of the Ministry of Finance and presents growth of 5.5 % in 2007 and 5 % in 2008. Decrease in the growth dynamics of the Czech economy reflects the supposed lower growth of personal consumption and export. According to the European Commission, the exceptional growth from the years 2005 and 2006 should decrease to roughly 5 % (growth of 4.9 % is foreseen for both years). The projected growth rate of the Czech economy is however more than twice that of the EU countries as a whole and it will result in the Czech Republic further approaching the economic level of the EU. Risks for the future lie in the external environment (development of the oil prices and the world boom), in the inflow of foreign direct investment and the prosperity of corporations under foreign control, as well as the behaviour of consumers and investors. The economic policy of the new government following the elections in June 2006 and its determination to execute the necessary reforms will be important, too.
2. Structural changes of the Czech economyThe structure of the Czech national economy has gone through marked changes since
1989. These were related to changing domestic and foreign demand, price and foreign trade liberalization and extensive privatization. The biggest structural changes took place in 1990–1995, when the so-called industrialization structure with a high share of industry, and within its frame first of all heavy industry, had to be overcome. This was reflected also in a decrease of the importance and share of industries mining and processing raw materials. In the period 1995 to 2006, the structure of the Czech economy changed only gradually. The share of agriculture and industry continued to decrease (from 5 % in 1995 to 2.7 % in 2006). Industry retained its almost one-third share and even increased (from 31.6 % in 2000 to 32.3 % in 2006) thanks to the rapid growth of the manufacturing industry. Construction industry retains its share of 6.5–6.8 %. Share of services remains low in the international comparison (it is even the lowest of all the EU countries after Romania) and it stabilized on the level of 58 % during the last years. The rate of decrease of the share of mining and quar-rying was already slower and it practically stopped in 2000–2006 as a result of a significant GVA increase of this industry in 2004 and 2006 influenced by price changes (Tab. 3).
The Czech Republic has a relatively low share of services and a high share of industry within the EU. The high share of industry is given by the country’s long industrial tradition amongst other factors. A very steep drop in industrial production occurred in the beginning
Source: EUROSTAT, Structural Indicators (2. 7. 2007)
Fig. 2: GDP growth in 2001–2006 (average annual percentage change)
Development of the Czech and world economy

28
of the transformation as a result of loss of the eastern markets, changed domestic and for-eign demand and strong foreign competition after the liberalization of foreign trade.
Tab. 3: Structure of the gross value added (current prices) and employment (in %)
Gross.value.added Employment1995 2000 2006 1995 2000 2006
Agriculture, fishing and forestry 5.0 3.9 2.7 6.0 �.7 3.7Industry 31.7 31.6 32.3 29.9 29.8 29.5. Mining.and.quarrying 2.2 1.5 1.� 1.8 1.3 0.9Construction 6.6 6.5 6.8 10.1 8.7 8.�Services 56.7 58.0 58.2 .5�.0 56.8 58.�
Source: ČSÚ – quarterly national accounts (June 2007), own calculations
Only the last three years have seen a marked revival of industrial production, as an influx of direct foreign investment and the influence of corporations under foreign control start to show themselves more distinctly. The real growth of gross value added [14] in industry was enormously high in 2003–2006 (annual average 12.3 %), whereas the GVA in industry practically stagnated in the preceding three years. Employment decreased on a long term in agriculture, mining and quarrying and electricity, gas and water production. Manufacturing industry showed employment increase in the last two years.
Individual branches of industry developed very differently. The greatest growth was in production of transport equipment followed by production of electric and optical instru-ments. On the other end is energy production along with mining, food, textiles and leather industry, where there was total decrease of GVA.
The importance of raw materials measured by the share of this industry in the gross value added and employment in the whole national economy of the Czech Republic is rather small and it has been declining. The share of the mining and quarrying in total GVA decreased from 2.2 % in 1995 to 1.4 % in 2006. The share of mining and quarrying in the industrial production is indeed higher but it also decreased considerably. This branch had a share of 4.2 % (according to the national accounts) in total industrial production in 1995 and only 2.2 % in 2004. The employment in this branch decreased by more than one half be-tween 1995 and 2004 (from 94.5 thousand person to 43.7 thousand, respectively), and share of this branch on the total employment in the national economy decreased from 1.8 % to 0.9 %, respectively. The lower share of employment than of the GVA shows relatively higher labour productivity compared to the average productivity in whole national economy.
According to the index of industrial production [15] based on the statistics of the produc-tion of selected products, mining and quarrying practically stagnated during the last five years (the index of industrial production 2005/2000 equalled 101.6). Production of this branch however increased by 2.5 % in 2006 owing to the revival of the energy-produc-ing and other raw materials mining. This is related to the favourable world boom and the increase of prices of oil and other raw materials on world markets. Increasing mine produc-tion of oil and gas however weighs just a little in whole branch of the mining and quarrying and the future development of coal mining will depend on solving the question of ecologi-cal limits in northern Bohemia.
Economy and minerals

29
From the macroeconomic point of view [16] the small and decreasing importance of min-ing and quarrying (except coal and construction minerals) is caused by the Czech Repub-lic’s relative poverty in raw materials and depence on export of important energy and other minerals (especially oil and gas). Ongoing structural changes with decreasing importance of industry depending on the raw materials join that. According to tables of interindustry relations [17] for the year 2003, the decisive part of the resources (domestic production and import) of the mining and quarrying industry is used for intermediate consumption. Accord-ing to the OKEČ (Classification of industries by economic activity) [18] two industries, coke, refined petroleum products and nuclear fuel (DF) and electricity, gas and water supply (E) – represent the largest consumers of the subindustry CA (energy-producing minerals). These two industries, which make up 12 % of total industrial production, consumed 67.7 % of subindustry CA resources. Three industries – production of other non-metallic mineral products (DI), production of basic metals and fabricated metal products (DJ) and construc-tion (F) – represent the main consumers in the subindustry CB (other minerals). These three industries consumed 74.3 % of the subindustry CB resources. The weight of the DI and DJ subindustries in total industry is rather large (20 % of the industrial production) and the importance of domestic raw materials have to be assessed also by the weight of manufac-turing branches in the national economy which use them. Environmental aspects represent an indispensable factor, as the mining industry in the main has a negative influence on the environment. On the other hand, relatively rapid growth of the world economy and increas-ing prices of energy and other raw materials can result in enhancement of the mining sector or even renewal of production in enterprises which were formerly unprofitable.
The position of the industry of raw material mining in the whole national economy is shown in Tab. 4.
Tab. 4: Gross value added in current prices (CZK billion)
1995 2000 2006Agriculture, fishing and forestry 66.3 77.2 78.1Mining.and.quarrying 29.2 29.1 39.8Manufacturing 321.8 532.1 790.0Electricity,.gas.and.water.supply 69.8 66.0 108.0Construction 87.2 128.0 197.5Services 751.9 1.151.1 1.691.3GVA.total.in.basic.prices 1.326.2 1.983.� 2.90�.8
Source: ČSÚ – quarterly national accounts
Calculated in current prices the GVA of the mining and quarrying industry strongly in-creased during the last three years. This was caused also by a marked increase of prices in 2004 and 2005 (price deflator [19] of GVA in the mining and quarrying industry increased by 12.7 % in 2004 and by 21.7 % in 2005). On the other hand, the prices measured by the price deflator of GVA decreased in 2006.
3. World economy trendsThe growth of the world economy after the dynamics slowed down in 2001 and 2002
entered the fifth year of a strong expansion, during which the average annual GDP fluctu-
Development of the Czech and world economy

30
ates around 5 %. This represents the strongest expansion since the beginning of the 1970s. Comparison of the average annual GDP growth in the world in the last two decades shows that it accelerated markedly from 3.2 % in 1989–1998 to 4.4 % in the decade 1999–2008 (including projection for 2007 and 2008). Remarkable is that the growth is dynamic despite a considerable fluctuation of gas and other minerals and pertaining global disequilibrium. Even though the growth of the US economy slowed down, the world GDP increased by 5.4 % in 2006 thanks to a considerable growth in Asian countries (China, India), countries exporting oil (OPEC, Russia) but also in developing countries. The world GDP growth should slow down to 4.9 % in 2007 and 2008. Spring IMF analysis confirms what is con-tained also in other reports of renowned international organizations that the world economy growth stays high, but that considerable differences between individual regions like the USA, the EU or Asian countries remain (see Tab. 5). Less developed countries like China with an annual economic growth rate of 9.5 % in the years 2001–2005, India with an annual GDP growth rate exceeding 8 % during the last three years and Russia with annual average growth rate over 6 % during the last five years are the driving forces of the high growth of the world economy.
Tab. 5: Basic indicators of world economy trends (annual increase in %)2005 2006 2007 2008
GDp.–.world �.9 5.� �.9 �.9. . . .USA 3.2 3.3 2.2 2.8. . . .EU 1.9 3.2 2.8 2.7. . . .Japan 1.9 2.2 2.3 1.9. . . .China 10.� 10.7 10.0 9.5. . . .India 9.2 9.2 8.� 7.8. . . .Russia 6.� 6.7 6.� 5.9World trade 7.� 9.2 7.0 7.�Consumer prices 2.3 2.3 1.8 2.1
Source: IMF World Economic Outlook, April 2007, p. 2.
It remains in question whether the prognoses of the international organizations are not too optimistic in situation of strongly uncertain prices of oil and other minerals, political instability in some regions of the world, waking up protectionism in the world trade and considerable global disequilibrium, They are mostly based on the favourable evolution on financial markets and continued flexible macroeconomic policy, which however has to face increasing danger of inflation, leading to growth of interest rates. These could hinder the economic growth.
The main risks of the future evolution are related to the evolution in the USA, evolution of the domestic demand in the EU and developing countries (especially China and India), with possible supply shocks related to oil prices and turbulence on financial markets. Un-certainty regarding the future evolution of the US economy, where deterioration of the real estate market could further weaken the growth, remains the main weakness of the world economy. Another serious problem is how strongly the deceleration of the US economy will influence the evolution of other regions of the world. Until now this impact on the world economy was limited to the neighbouring countries – Canada and Mexico.
Economy and minerals

31
Unbalanced development of the world economy shows itself in increasing current account deficits in one group of countries and increasing surpluses in other countries. Cur-rent account balances rather rapidly adapted to the oil shocks by the way of increases of interest rates, and by slowing down of demand and economical growth in the past. In addi-tion, the exchange rate channel [20] functioned, too. At present it is sufficiency of financial sources and relatively low interest rates which enable to transfer sources from countries with savings surplus into countries with their deficit. Considerably high deficits of the USA reaching about 6 % of GDP one side and large surpluses of China, Japan and oil-exporting countries on the other side are the most serious aspects of the world economy. Insufficient national savings [21] in relation to the investments represent the basic reason of the high current account deficit of the USA. The consequences of this disequilibrium can be very serious, because the willingness of the foreign investors and central banks (especially in Japan and oil-exporting countries) to buy dollar assets [22] can weaken. This can result in a rapid growth of interest rates, further depreciation [23] of dollar, dollar assets freezing and a decrease of demand and economic growth in the USA with unfavourable consequences for whole world economy.
On a long term, concern is if it will be possible to keep the rapid labour productivity of the last years, caused by combination of a number of factors (technical development, higher openness of the world trade, increasing international capital fluxes and more adap-tive macroeconomic policy) and which enabled a strong rise of profits and increasing real wages. The growth of labour productivity can slow down in the next years for a number of reasons, e.g. the environment and restricted sources, ageing of the population or strength-ening protectionism on the world market. This deceleration would have a negative impact on the investments and consumption and on the macroeconomic equilibrium. Even though the impact of many factors on savings and investments development is hard to predict (this relation defines the macroeconomic equilibrium and current account deficit), the increase of need of financing in many countries can be expected and countries with a high deficit, like the USA, can have bigger problems to acquire the necessary external sources of financing.
For the Czech Republic, the development in the EU, where the year 2006 has seen a more pronounced acceleration of the economic growth, is important. Real GDP growth in the EU-25 reached 2.9 % in 2006 in contrast to 1.8 % in 2005. A slight deceleration, reflecting the influence of fiscal consolidation and tightening of the monetary policy, is ex-pected in the next two years. A small contribution of the foreign trade is foreseen, too. The prediction is based mostly on the favourable evolution of the domestic demand (personal consumption and investments).
The growth accelerated more markedly in Germany, France and Finland. IMF predicts deceleration of the GDP growth in Germany from 2.7 in 2006 to 1.8 and 1.9 in 2007 and 2008. Five German institutes for economic research however predict in their prognoses from spring increase by 2.4 % in both years. Investments should represent the driving force of the growth, as the personal consumption following the VAT increase in January 2007 should not rise more markedly before 2008. However, the January increase of the VAT did not have such a negative influence on the consumption expenses as it was originally expected. Foreign trade should contribute positively to the growth.
Decrease of oil prices in August 2006 helped to decrease the inflation of the Eurozone below 2 % to the end of the year 2006. Increase of wages remains proportional, therefore the growth of prices in 2007 should be about 2 % despite decrease of free capacities. IMF
Development of the Czech and world economy

32
recommends to increase interest rates to 4 % as the growth in the Eurozone fluctuates around its potential with a possible pressure on utilization of the factors.
The question is whether the recent higher economic performance of the Western Europe means a permanent improvement. On a longer term, Western Europe converged to the level of the USA in the after-war period, but with exception of several small countries it has been diverging since 1995. Broadening of the income gap reflects a slower labour productivity growth. This was about half in the EU-15 compared to the USA in 1996–2005. This effect concerned majority of industries, first of all manufacturing industry, financial services and trade. Large regulations on products and labour market, which restricted competition and slowed down movement of sources between the industries, were its cause. A lower utiliza-tion of new information technologies (ICT) represented another important factor of lower increase of labour productivity. In Great Britain, where reforms on products and labour market are more advanced, the labour productivity growth was more rapid.
The challenge for Europe is to ensure that the present cyclic acceleration changes into a permanent expansion. This would improve the fiscal situation and help to solve the problem of aging of the inhabitants. Europe therefore faces a basic problem – how to accelerate the growth of potential product and employment in the spirit of the Lisbon strategy.
4. Foreign trade and external economic balance [24] in the Czech RepublicDevelopment of the foreign trade has started to play a dominant role in the develop-
ment of the Czech economy. This is because the Czech economy is considerably open and important changes have occurred in foreign trade as a result of a strong inflow of foreign capital as well as the entry to the EU – exports rapidly increase, their structure, technical level as well as prices change and considerable changes of terms of trade take place. The high importance of the foreign trade for the Czech Republic results from the high share of the value of exports of goods and services in the GDP, which reached 76 % at export and 72.8 % at import in current prices in 2006. Very good results for Czech foreign trade dur-ing the last years show that the competitive strength of our production, which gains ground on difficult markets, has been growing – despite the recession of economic activity in the old EU countries and especially in Germany in 2001–2005, our main trading partner. From the macroeconomic point of view it is also important that foreign trade (with goods and
Source: ČSÚ (2007)
Fig. 3: Rate of growth of exports and imports (percentage annual change)
Economy and minerals

33
services) in 2004–2006 strongly contributed to the GDP growth and became an important driving force of the GDP growth on the demand side.
Whereas exports of goods increased by 8.5 % and overtook the growth of imports (4.6 %), growth rate of the export and import was relatively high and almost identical – 14.7 and 14.8 % (see Fig. 3). Surplus of the trade balance in 2006 (CZK 43 billion) was by 4.4 billion higher than in 2005. The year 2006 was therefore the second year in Czech history when the country reached a positive balance of foreign trade in goods. Entry of the Czech Republic into the EU contributed to the very favourable foreign trade results. First of all however it was the previous strong inflow of the direct foreign investment directed into branches with a high share of exports, such as production of transport equipment, telecom-munication equipment, consumer electronics and computer technique as well as revival of boom in the main business partner countries (Germany). As the commodity structure is concerned, the highest deficit creates group 3 (mineral fuels, lubricants and related materi-als – see Fig. 4). As regards the destination, export to the Commonwealth of Independent States and European transition economies (by more than 20 % however at a small share in bulk trade) increased the most. EU countries (more than 78 % of the foreign trade turnover,
Note: according to SITC rev. 3, group 3 includes mineral fuels, lubricants and related materials. Source: ČSÚ (2007), foreign trade statistics (2. 7. 2007)
Fig. 4: Balance of the foreign trade (CZK billion)
with about 30 % share of Germany) retain the dominant position. Development of the goods balance of foreign trade (without balance of services) is shown in Fig. 4.
Total foreign trade balances improved in 2006, but the evolution of individual com-modity groups was different. The trade deficit increased in the group of mineral fuels and lubricants (from CZK 110.2 billion in 2005 to CZK 139.0 billion in 2006), chemicals (from CZK 82.5 billion to CZK 89.5 billion) and food and live animals (from CZK 20.6 billion to CZK 26.1 billion). Group 2 (raw materials, inedible, except fuels) showed a deficit in 2001–2006, with the largest deficit in 2004 (CZK 5.6 billion). The growing deficit in some commodity groups was more than compensated by the growth of the trade balance surplus in the group of machinery and transport equipment (from CZK 212.3 billion in 2005 to CZK 274.4 billion in 2006).
Development of the Czech and world economy

3�
Tab. 6: Commodity structure of foreign trade of the Czech Republic (percentage share)
Export ImportGroup.SITC.(rev..3) 1996 2000 2006 1996 2000 20060,.1.–..Food.and.live.animals,.beverages.and.tobacco .5.0 .3.7 .3.� .6.6 .�.6 .�.8
2.–.Raw.materials,.inedible,.except.fuels .�.8 .3.5 .2.6 .3.7 .3.2 .2.73.–.Mineral.fuels,.lubricants.and.related.materials .�.5 .3.1 .2.9 .8.7 .9.6 .9.6
�.–.Animal.and.vegetable.oils,.fats.and.waxes .0.2 .0.1 .0.1 .0.3 .0.2 .0.25.–.Chemical.and.related.products,.n.e.s. .9.0 .7.1 .6.0 11.9 11.2 10.�6 – Manufactured goods classified chiefly by material 28.6 25.� 20.8 19.3 20.8 20.3
7.–..Machinery.and.transport.equipment 32.8 ��.5 53.1 38.0 �0.0 �1.28,.9.–..Miscellaneous.manufactured.articles,.commodities.and.transactions.n.e.c..in.the.SITC 15.1 12.6 11.1 11.5 10.� 10.7
Note: Data for the years 1996 and 2000 are in methods valid since 1. 7. 2000. Data for the year 2006 are preliminary, however revised in June 2007. Source: ČSÚ – foreign trade (June 2007).
Two groups dominate in Czech exports: manufactured goods classified chiefly by mate-rial (group 6) and first of all machinery and transport equipment (group 7). This group in-creased its share in total exports from 32.8 % in 1996 to 53.1 % in 2006 (see Tab. 6). On the other hand, the share of all other groups decreased. The share of groups 2 and 3, which are closest to the raw material mining industry, decreased from 9.3 % in 1996 to 5.5 % in 2006. In case of imports, the share of mineral fuels, lubricants and related materials increased to more than 9.6 % of total imports in 2006. This was caused first of all by the increase of oil and gas prices in several last years. This group has a markedly higher share in imports than in exports, from which results also a markedly negative balance of foreign trade.
Development of the selected import and export commodities is given in Tab. 7. Whereas raw material export decreases, import of the energy minerals (oil) continues to increase.
Tab. 7: Foreign trade – selected commodities (ths tonnes)
Export ImportConcrete Kaolin Limestone Oil Iron.ore
1999 1.559 �28 239 5.997 5.3572000 1.�9� ��3 305 5.819 6.9332001 866 �55 270 6.005 6.8912002 �66 ��5 212 6.082 6.8122003 562 ��2 103 6.3�� 8.222200� 7�7 �8� 1�0 6.�06 7.6392005 559 271 12� 7.730 6.8072006 �97 261 162 7.752 7.987
Source: ČSÚ (2007), Indicators of the social and economic evolution of the Czech Republic since 1999 until the end of the first quarter of the year 2007.
Economy and minerals
35
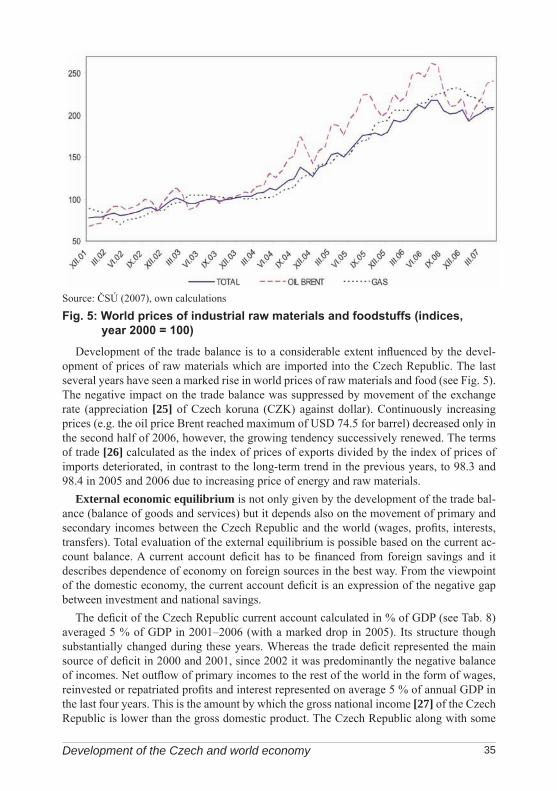
Development of the trade balance is to a considerable extent influenced by the devel-opment of prices of raw materials which are imported into the Czech Republic. The last several years have seen a marked rise in world prices of raw materials and food (see Fig. 5). The negative impact on the trade balance was suppressed by movement of the exchange rate (appreciation [25] of Czech koruna (CZK) against dollar). Continuously increasing prices (e.g. the oil price Brent reached maximum of USD 74.5 for barrel) decreased only in the second half of 2006, however, the growing tendency successively renewed. The terms of trade [26] calculated as the index of prices of exports divided by the index of prices of imports deteriorated, in contrast to the long-term trend in the previous years, to 98.3 and 98.4 in 2005 and 2006 due to increasing price of energy and raw materials.
External economic equilibrium is not only given by the development of the trade bal-ance (balance of goods and services) but it depends also on the movement of primary and secondary incomes between the Czech Republic and the world (wages, profits, interests, transfers). Total evaluation of the external equilibrium is possible based on the current ac-count balance. A current account deficit has to be financed from foreign savings and it describes dependence of economy on foreign sources in the best way. From the viewpoint of the domestic economy, the current account deficit is an expression of the negative gap between investment and national savings.
The deficit of the Czech Republic current account calculated in % of GDP (see Tab. 8) averaged 5 % of GDP in 2001–2006 (with a marked drop in 2005). Its structure though substantially changed during these years. Whereas the trade deficit represented the main source of deficit in 2000 and 2001, since 2002 it was predominantly the negative balance of incomes. Net outflow of primary incomes to the rest of the world in the form of wages, reinvested or repatriated profits and interest represented on average 5 % of annual GDP in the last four years. This is the amount by which the gross national income [27] of the Czech Republic is lower than the gross domestic product. The Czech Republic along with some
Source: ČSÚ (2007), own calculations
Fig. 5: World prices of industrial raw materials and foodstuffs (indices, year 2000 = 100)
Development of the Czech and world economy

36
other countries like Ireland or Hungary is among countries which lose an important part of their value added, which cannot be used on consumption or investments. Reinvestment and repatriation of profit will represent the main source of the current account deficit in future, too. Evaluation of the current account deficit therefore deserves more detailed examination of individual items, as these have varying impacts on the economy.
Tab. 8: Current account balance (% of GDP)
Current.account
Balance.of.trade
Balance.of.services
Balance.of.incomes
Current.transfers
2001 -5.� -5.2 2.5 -3.6 0.82002 -5.6 -�.8 0.9 -�.8 1.22003 -6.3 -2.7 0.5 -�.7 0.6200� -6.0 -1.0 0.5 -5.7 0.22005 -2.6 1.3 0.7 -5.2 0.72006 -�.2 1.� 0.� -5.7 -0.2
Source: ČNB, 2007, own calculations.
Foreign direct investments (FDI), the inflow of which intensified after the year 1998 in relation to the acceptance of investment incentives and to continuing privatization and restructuring of corporations, became an important factor in the Czech economy’s growth. The Czech Republic was in the first position amongst the 12 new member countries of the EU (followed by Estonia and Hungary) in the cumulative net value of FDI in % of GDP. The influence of corporations under foreign control increased with the inflow of FDI, too. These corporations accounted for more than half the total income of non-financial corpora-tions in 2006.
In the mining industry, former big state enterprises were divided into smaller companies and gradually privatized either by the method of voucher privatization or by direct sale to investor (e.g. Sokolovská uhelná a. s. in 2005).
Tab. 9: Stock of foreign direct investment in the Czech Republic as of 31. 12. 2006 (CZK mill)
Registered.capital
Reinvested.profit
Other.capital Total
Total.stock 9��.352.2 �89.377.9 192.511.0 1,626.2�1.1
Mining.and.quarrying 5.920.3 5.322.� 163.� 11.�06.2Share.of.mining.and.quarrying.(in.%) 0.63 1.09 0.08 0.70
Note: data for 2006 are preliminary. Source: ČNB (2007) Balance of payment statistics
The importance of foreign capital measured by cumulative inflow of foreign direct in-vestment in the mining industry corresponded roughly to the share of this industry in GDP (see Tab. 9). The year 2006 however brought a renewed interest in Czech companies, which resulted also in the increase of the FDI inflow of FDI into the companies dealing with min-ing and quarrying (investment into the basic capital made CZK 1,378 billion, i.e. 3.9 %
Economy and minerals

37
from the FDI inflow). The FDI inflow into this branch culminated until now in two years, 2004 (CZK 3,392.6 billion with a share of 2.7 % in total FDI influx) and in 2006 even CZK 5,208 billion, i.e. 3.9 % of the total FDI influx. The main investors in this branch come from the surrounding states (Germany and Austria) but also from the Netherlands or France.
The outflow of the Czech foreign direct investment to foreign countries is substantially lower (see Tab. 9), during recent years though Czech capital is successfully also involved in foreign companies (coal mining in Poland and exploration and mining of oil and gas realized abroad by the Moravské naftové doly company). Czech FDI abroad in the mining industry had its boom in 2003, when it reached almost CZK 1 billion and it took a share of more than 17 % in the total FDI outflow. The outflow of FDI to foreign countries in this sector decreased in 2004 and 2005, however, the year 2006 brought a marked increase re-lated to the renewed interest of the Czech companies in foreign acquisitions (this concerned almost exclusively re-invested profit). As for the volume, mining and quarrying is compara-ble to the manufacturing branch of the industry dealing with chemical products.
Tab. 10: Stock of Czech direct investment abroad as of 31. 12. 2006 (CZK mill)
Registered.capital
Reinvested.profit Other.capital Total
Total.stock 85.522.3 23.767.3 9.853.1 119.1�2.7
Mining.and.quarrying 1.178.3 1.3�9.1 101.� 2.628.8Share.of.mining.and.quarrying.(in.%) 1.38 5.68 1.03 2.21
Note: data for 2006 are preliminary. Source: ČNB (2007), Balance of payment statistics
Development of the Czech and world economy

38
legend to selected economic terms
Vojtěch Spěváček, Václav ŽďárekCentre for Economic Studies, University of Economics and Management, Prague
[1] Gross domestic product (GDP) is the most often used indicator of the total economic performance of the economy. It can be defined either as a sum of the gross value added [4] of various sectors and branches of the national economy or as a value of the do-mestic final demand (final consumption [6] and gross capital formation [9]) increased by exports and reduced by imports.
[2] Supply side of the economy relates to the basic factors of economic activity (labour, capital and total factor productivity) and to the main branches of activity (agriculture, industry, construction, services).
[3] Demand side explores the basic components of the demand which determine eco-nomic activity (personal consumption, public consumption, investment and foreign trade).
(Both demand and supply sides refer to levels of activity even more than growth!)
[4] Gross value added (GVA) is a widely used indicator of the total economic perform-ance of each branch. It is an indicator corresponding to the GDP in the whole national economy. It is calculated by subtraction of the intermediate consumption (consump-tion of the raw materials, energy, materials) from the total value of the production.
[5] FISIM is an abbreviation for financial intermediation services indirectly measured. Their income is given by the difference between the interest which they pay to lenders and interest they receive from borrowers for provided loans.
[6] Final consumption includes personal and public consumption, it determines the growth of standard of living and it represents the largest component of the final utili-zation of the production.
[7] Private consumption contains consumption of products and services for final use, which is covered from the disposable income of households.
[8] Public consumption is the part of final consumption which is covered from the dis-posable income of government institutions.
[9] Gross capital formation (total investments) includes gross fixed capital formation, changes in inventories and net acquisitions of assets.
Economy and minerals

39
[10] Gross fixed capital formation is a basic component of investment and it includes acquisitions of fixed assets (esp. machinery, equipment, buildings and constructions) during a certain period.
[11] Domestic demand is a sum of final consumption and gross capital formation.
[12] Balance of foreign trade is the difference between the value of exports and imports. When exports exceed imports, a surplus is formed, and in the opposite case there is a deficit .
[13] Purchasing power parity is a notional, artificially calculated currency exchange rate, which corresponds to its purchasing power. It is a rate at which we would obtain the same amount of goods and services at home as well as in the country with which we compare ourselves. It is used in the international comparisons of the real magnitudes as for instance the GDP per capita, for which the market exchange rates are not use-ful.
[14] Real growth of gross value added is growth calculated in constant prices, which excludes the influence of price changes.
[15] Index of industrial production is calculated in agreement with the international standards and it is based on statistics of selected products and a two-stage weighting system. It is a selective index representing the weighted arithmetic average of the indexes of selected indicators, which is used to characterize the industrial production growth.
[16] Macroeconomic point of view is a viewpoint which is based on the view of whole national economy and takes into account mutual linkages and connections.
[17] Tables of inter-industry relations (input-output tables) are chessboard tables (in form of matrices), which show flows of the production of individual industries. Use of the production of the industry in the intermediate consumption (according to indi-vidual industries) and in final use is given in the lines. Costs of the industry according to the supplier industries are given in the columns.
[18] OKEČ (Odvětvová klasifikace ekonomických činností - Classification of industries by economic activity) is the internationally standardized classification of the econom-ic activities according to the viewpoint of a similar economic utilization of the produc-tion. OKEČ divides the national economy into 16 basic groups (sections). Industry is divided into three sections (mining and quarrying, manufacturing and electricity, gas and water supply). More detailed division of industry then includes 17 branches.
[19] Price deflator is a price index mostly indirectly measured. Deflator of the gross value added has to be calculated from the changes of the total production and intermediate consumption prices. It equals a ratio of the GVA in current prices to the GVA in con-stant prices.
Legend to selected economic terms

�0
[20] Exchange rate channel expresses influence of the exchange rate changes on other economic magnitudes. In case of the foreign trade and current account deficit, the exchange rate change (weakening of strengthening of the currency) influences exports and imports of the country and by that also the external economic balance.
[21] National savings are a basic source of financing the investments. They represent that part of the disposable (final) incomes which is not used for final consumption. When investments are higher than savings, foreign savings have to be used for their financ-ing.
[22] Dollar assets are financial assets denominated in USD.
[23] Depreciation means weakening of the exchange rate of one currency to another de-pending on the demand and supply on the foreign exchange market.
[24] External economic balance is given by the relationship of the total income of the country from abroad (incomes from the export of goods and services and inflow of primary incomes and transfers) and expenses to foreign countries (import of goods and services, outflow of primary incomes and transfers). It can be assessed from the current account balance.
[25] Appreciation means valuation (strengthening) of the currency exchange rate of one country against the other depending on the demand and supply on the foreign ex-change market.
[26] Terms of trade express the movement of prices in foreign trade (the ratio of changes of the prices of.exports to prices of imports). They are calculated by division of an index of the prices of exports by an index of the prices of imports. Where prices of exports grow more quickly than those of imports, the country can import a higher physical volume of imports for the same physical volume of exports.
[27] Gross national income is an indicator based on the gross domestic product which takes into account inflow and outflow of primary incomes (incomes from labour, capi-tal and ownership). Primary income balance towards the foreign countries influences the so-called disposable incomes of the country, on which depend final consumption and savings. In case that the outflow of incomes is higher than inflow, possibilities to increase standard of living are reduced. This indicator is therefore more appropriate for characterising the growth of the country’s welfare than GDP.
Economy and minerals
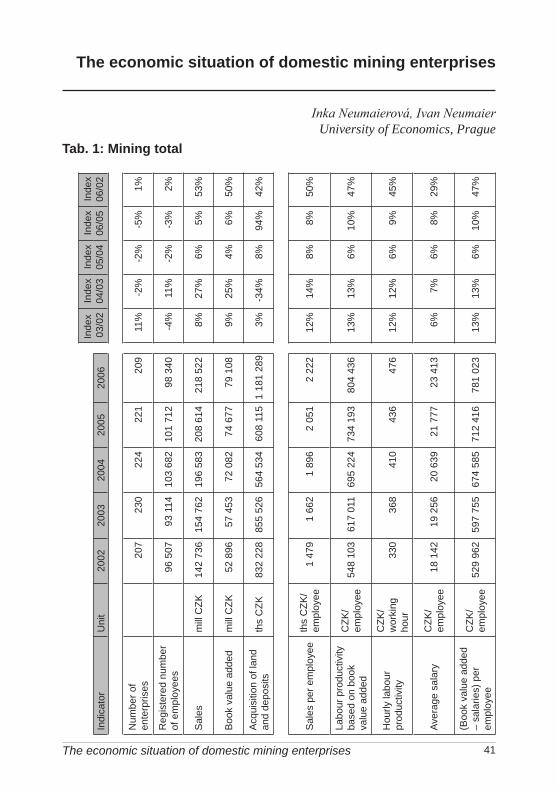
�1
The economic situation of domestic mining enterprises
Inka Neumaierová, Ivan Neumaier University of Economics, Prague
Tab. 1: Mining total
The economic situation of domestic mining enterprises
Inde
x03
/02
Inde
x0�
/03
Inde
x05
/0�
Inde
x06
/05
Inde
x06
/02
Indi
cato
rU
nit
2002
2003
200�
2005
2006
Num
ber.o
f.en
terp
rises
207
230
22�
221
209
11%
-2%
-2%
-5%
1%
Reg
iste
red.
num
ber.
of.e
mpl
oyee
s96
.507
93.1
1�10
3.68
210
1.71
298
.3�0
-�%
11%
-2%
-3%
2%
Sal
esm
ill.C
ZK1�
2.73
615
�.76
219
6.58
320
8.61
�21
8.52
28%
27%
6%5%
53%
Boo
k.va
lue.
adde
dm
ill.C
ZK52
.896
57.�
5372
.082
7�.6
7779
.108
9%25
%�%
6%50
%
Acq
uisi
tion.
of.la
nd.
and.
depo
sits
ths.
CZK
832.
228
855.
526
56�.
53�
608.
115
1.18
1.28
93%
-3�%
8%9�
%�2
%
Sal
es.p
er.e
mpl
oyee
ths.
CZK
/.em
ploy
ee1 .
�79
1.66
21.
896
2.05
12.
222
12%
1�%
8%8%
50%
Labo
ur.p
rodu
ctiv
ity.
base
d.on
.boo
k.va
lue.
adde
d
CZK
/.em
ploy
ee5 �
8.10
361
7.01
169
5.22
�73
�.19
380
�.�3
613
%13
%6%
10%
�7%
Hou
rly.la
bour
.pr
oduc
tivity
.
CZK
/.w
orki
ng.
hour
330
368
� 10
�36
�76
12%
12%
6%9%
�5%
Aver
age.
sala
ryC
ZK/.
empl
oyee
18.1
�219
.256
20.6
3921
.777
23.�
136%
7%6%
8%29
%
(Boo
k.va
lue.
adde
d.–.
sala
ries)
.per
.em
ploy
ee.
CZK
/.em
ploy
ee52
9 .96
259
7.75
567
�.58
571
2.�1
678
1.02
313
%13
%6%
10%
�7%

�2
There are five specific circumstances of the data for mining enterprises (Mining total) discussed in this yearbook:1. It is impossible to distinguish pure mining from other activities. All data are for the en-
terprise as a whole, such as, for example, the production of bricks and the trade activity together.
2. The enterprises belong not only to the group OKEČ (CZ-NACE)* C mining and quarry-ing, but also to CZ-NACE D manufacture of other non-metallic mineral products (glass and construction minerals) and few enterprises belong to other groups (mining is one of the activities).
3. Sampling is influenced by the accessibility of data. In the case of sales and book value added, the sample corresponds to 95 % of the whole, but it covers a much lower propor-tion of the number of enterprises. Data for very small enterprises are not available.
4. It is possible to collect a lot of data (for example from annual reports) for the large en-terprises, but in the case of small ones data are not available. This affects the selection of indexes.
5. In view of secret individual data, it was necessary to group the mining enterprises into bigger aggregates.
The selection of indicators is following:– number of enterprises– registered average number of employees – sales (sales of goods and sales of own goods and services)– book value added [(sales + change of stocks of own production + capitalization (produc-
tion of an enterprise for own consumption)) – purchased goods – intermediate consump-tion (consumption of supplies and raw materials, energy and services)]
– acquisition of land and mineral deposits (investment in new land and mineral deposits)– sales per employee (labour productivity based on sales, i.e. sales per registered employ-
ee)– book value added per employee (labour productivity based on book value added, i.e.
book value added per registered employee)– hourly labour productivity (book value added per working hour)– average salary– (the book value added – salaries) per employee, i.e. book value added after deduction of
salaries.Data have been collected for 2002 till 2006. Indicators for time series are supplied by
chain indices. Comparable indices are compared with data for Mining total (Mining total = 100 %).
* Translator’s note: OKEČ (Odvětvová klasifikace ekonomických činností) is the same as CZ-NACE – Czech adoption of the General Industrial Classification of Economic Activities within the European Communities (Nomenclature générale des Activités économiques dans les Communautés Européennes)
Economy and minerals
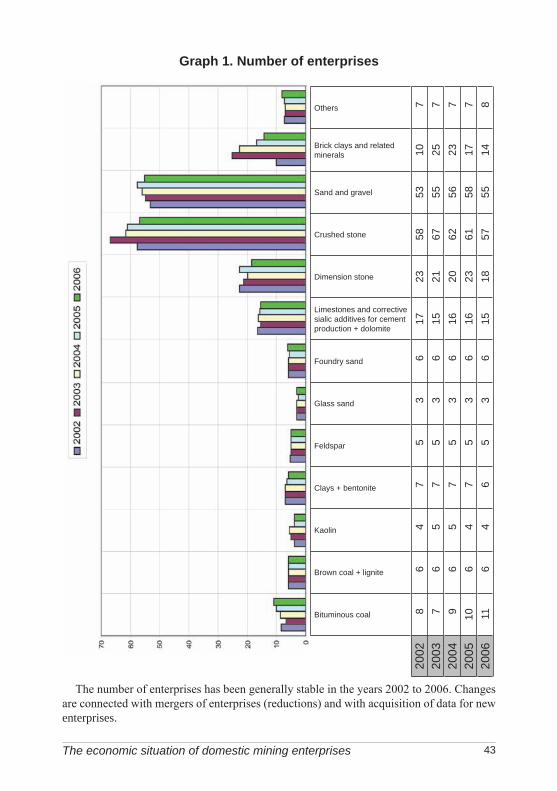
�3
Graph 1. Number of enterprises
The number of enterprises has been generally stable in the years 2002 to 2006. Changes are connected with mergers of enterprises (reductions) and with acquisition of data for new enterprises.
Bituminous.coal
Brown.coal.+.lignite
Kaolin
Clays.+.bentonite
Feldspar
Glass.sand
Foundry.sand
Limestones.and.corrective.sialic.additives.for.cement.production.+.dolomite
Dimension.stone
Crushed.stone
Sand.and.gravel
Brick.clays.and.related.minerals
Others
2002
86
�7
53
617
2358
5310
720
037
65
75
36
1521
6755
257
200�
96
57
53
616
2062
5623
720
0510
6�
75
36
1623
6158
177
2006
116
�6
53
615
1857
551�
8
The economic situation of domestic mining enterprises
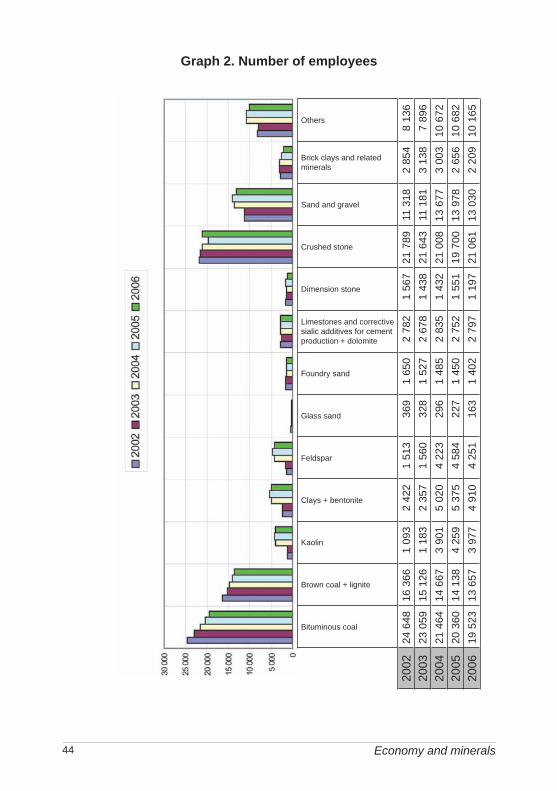
��
Graph 2. Number of employees
Bituminous.coal
Brown.coal.+.lignite
Kaolin
Clays.+.bentonite
Feldspar
Glass.sand
Foundry.sand
Limestones.and.corrective.sialic.additives.for.cement.production.+.dolomite
Dimension.stone
Crushed.stone
Sand.and.gravel
Brick.clays.and.related.minerals
Others
2002
2�.6
�816
.366
1.09
32.
�22
1.51
336
91.
650
2.78
21.
567
21.7
8911
.318
2.85
�8.
136
2003
23.0
5915
.126
1.18
32.
357
1.56
032
81.
527
2.67
81.
�38
21.6
�311
.181
3.13
87.
896
200�
21.�
6�1�
.667
3.90
15.
020
�.22
329
61.
�85
2.83
51.
�32
21.0
0813
.677
3.00
310
.672
2005
20.3
601�
.138
�.25
95.
375
�.58
�22
71.
�50
2.75
21.
551
19.7
0013
.978
2.65
610
.682
2006
19.5
2313
.657
3.97
7�.
910
�.25
116
31.
�02
2.79
71.
197
21.0
6113
.030
2.20
910
.165
Economy and minerals

�5
The registered number of employees is higher in 2004 and 2005 than in 2002 and 2003. The reason is not so much an increase of employees working in mining, as an increase of employees working in consecutive manufacture and trade. That could be seen for example in cases of kaolin, clays, bentonite and feldspars. The influences of mergers of mining and manufacture are also manifest there, representing the biggest problem in evaluating the economic results. In comparison, in the “classical” mining branches such as, for example, coal mining, a decrease in the number of employees can be mentioned. This decrease oc-curred again in 2006. In general the number of employees working directly in mining will decrease.
The economic situation of domestic mining enterprises

�6
Graph 3. Sales (mill CZK)
Sales are growing over time not only because of the connection with subsequent manu-facture (as in case of kaolin). Sales are also increasing in coal mining enterprises where the influence of subsequent manufacture is minimal. Sales growth has been healthily high.
Bituminous.coal
Brown.coal.+.lignite
Kaolin
Clays.+.bentonite
Feldspar
Glass.sand
Foundry.sand
Limestones.and.corrective.sialic.additives.for.cement.production.+.dolomite
Dimension.stone
Crushed.stone
Sand.and.gravel
Brick.clays.and.related.minerals
Others
2002
30.3
1520
.81�
1.91
62.
785
2.07
�85
61.
9�9
9.11
31.
�29
36.0
6325
.965
5.73
73.
722
2003
30.9
8821
.067
2.28
73.
16�
2.31
091
92.
060
9.25
31.
707
�1.1
3629
.781
6.6�
33.
��6
200�
38.0
�821
.259
7.36
58.
267
7.27
996
02.
285
10.6
�81.
713
��.9
1�38
.336
7.�1
28.
096
2005
�1.2
6021
.920
8.26
69.
12�
8.16
�88
12.
229
10.3
�12.
525
�6.2
90�0
.818
7.60
09.
197
2006
36.5
992�
.613
8.22
29.
122
8.22
186
02.
�39
11.5
�51.
625
58.0
7��1
.228
6.68
�9.
292
Economy and minerals

�7
Graph 4. Book value added (mill CZK)
The situation in book value added is similar to that of sales, especially as the chain indi-ces concerns. Value added does not change in consequence of disintegrations and mergers, which represents its advantage over sales. Indices of the book value added are from this viewpoint more predicative than those in sales.
Bituminous.coal
Brown.coal.+.lignite
Kaolin
Clays.+.bentonite
Feldspar
Glass.sand
Foundry.sand
Limestones.and.corrective.sialic.additives.for.cement.production.+.dolomite
Dimension.stone
Crushed.stone
Sand.and.gravel
Brick.clays.and.related.minerals
Others
2002
12.8
5710
.771
1.10
51.
�60
1.07
338
987
03.
882
516
10.9
�96.
916
1.97
�13
�20
0312
.363
10.8
571.
276
1.73
11.
285
�22
932
3.96
566
912
.29�
8.56
92.
�22
668
200�
16.�
�611
.9�9
2.73
53.
127
2.68
9�2
598
3�.
22�
�69
13.7
5910
.582
2.9�
81.
7��
2005
18.6
3712
.166
2.81
23.
2�7
2.77
2�2
51.
007
�.27
553
213
.022
10.7
732.
880
2.12
920
0617
.153
1�.1
352.
522
2.95
32.
�98
�30
1.09
9�.
660
5�7
17.�
7910
.92�
2.72
21.
988
The economic situation of domestic mining enterprises

�8
Graph 5. Acquisition of land and mineral deposits (ths CZK)
The data on acquisition of land and deposits include investment into new land for manu-facture as well as for mining purposes (it is impossible to distinguish). The total sums of investments into land were markedly higher in 2002 and 2003 than in 2004–2005, and exceeded those in 2002–2003 in 2006.
Bituminous.coal
Brown.coal.+.lignite
Kaolin
Clays.+.bentonite
Feldspar
Glass.sand
Foundry.sand
Limestones.and.corrective.sialic.additives.for.cement.production.+.dolomite
Dimension.stone
Crushed.stone
Sand.and.gravel
Brick.clays.and.related.minerals
Others
2002
20.3
372�
5.73
712
.238
11.�
65�.
510
791.
225
�9.�
533.
053
359.
382
107.
�6�
13.6
8�3.
601
2003
28.0
8711
0.79
91�
.078
5.71
686
.917
00
129.
739
6.39
918
2.19
�27
3.50
310
.305
7.79
020
0�55
.�73
21.9
7825
.153
3�.0
�222
.361
5�8
3.05
123
.513
2.50
523
5.63
869
.010
�9.7
5221
.510
2005
33.�
96��
.106
52.8
�825
.2�0
3�.6
1112
36�
719
.971
1.37
513
9.�6
815
9.65
236
.7�0
59.8
3920
0619
.21�
197.
7�8
�3.3
31�0
.2�2
28.9
180
9�6
31.6
131.
�22
396.
75�
236.
8�7
136.
091
�8.1
63
Economy and minerals

�9
Graph 6. Sale of land and mineral deposits (ths CZK)
It is necessary to supplement data on the acquisition of land and deposits by information concerning their sale.
Bituminous.coal
Brown.coal.+.lignite
Kaolin
Clays.+.bentonite
Feldspar
Glass.sand
Foundry.sand
Limestones.and.corrective.sialic.additives.for.cement.production.+.dolomite
Dimension.stone
Crushed.stone
Sand.and.gravel
Brick.clays.and.related.minerals
Others
2002
––
––
––
––
––
––
–20
0326
.955
3�.2
7527
1�6
1.�9
20
213.
599
1.58
028
�.33
731
.95�
12.8
28�3
.�07
200�
53.9
3022
.�08
9.91
010
.790
9.91
025
625
9�1
6�.
637
60�.
238
35.1
�050
.257
65.7
7�20
0517
5.59
73�
.886
32.1
5232
.�52
32.1
5230
01.
��7
1.71
21.
738
368.
172
51.8
3735
.895
75.0
5020
063.
267
33.0
2830
.980
31.3
5230
.980
073
3.29
32.
816
�87.
383
92.1
183�
.176
175.
157
The economic situation of domestic mining enterprises
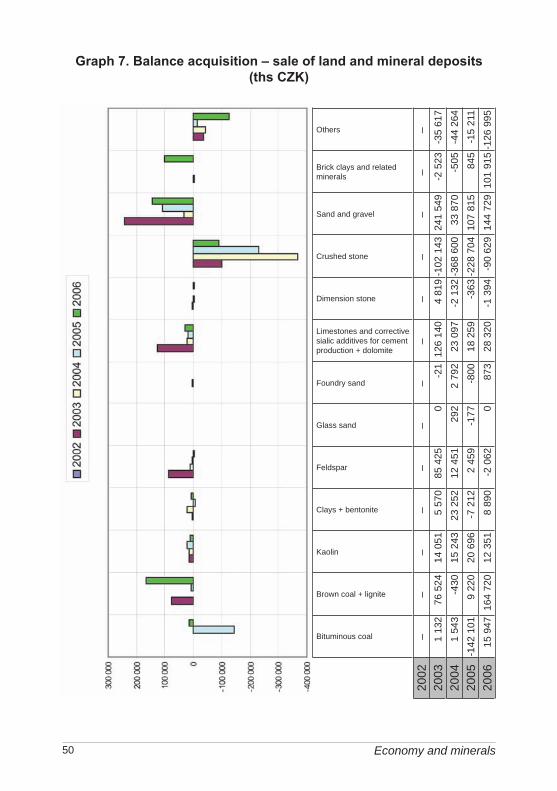
50
Graph 7. Balance acquisition – sale of land and mineral deposits (ths CZK)
Bituminous.coal
Brown.coal.+.lignite
Kaolin
Clays.+.bentonite
Feldspar
Glass.sand
Foundry.sand
Limestones.and.corrective.sialic.additives.for.cement.production.+.dolomite
Dimension.stone
Crushed.stone
Sand.and.gravel
Brick.clays.and.related.minerals
Others
2002
––
––
––
––
––
––
–20
031.
132
76.5
2�1�
.051
5.57
085
.�25
0-2
112
6.1�
0�.
819
-102
.1�3
2�1.
5�9
-2.5
23-3
5.61
7
200�
1.5�
3-�
3015
.2�3
23.2
5212
.�51
292
2.79
223
.097
-2.1
32-3
68.6
0033
.870
-505
-��.
26�
2005
-1�2
.101
9.22
020
.696
-7.2
122.
�59
-177
-800
18.2
59-3
63-2
28.7
0�10
7.81
58�
5-1
5.21
1
2006
15.9
�716
�.72
012
.351
8.89
0-2
.062
087
328
.320
-1.3
9�-9
0.62
91�
�.72
910
1.91
5-1
26.9
95
Economy and minerals
51
The summary information to graphs 5 and 6 in graph 7 is given through the balance of acquisitions and sales of land and deposits. This balance was CZK 415 mill in 2003, CZK -303 mill in 2004, CZK -235 mill in 2005 and CZK 257 mill in 2006. Total balance for 2003–2005 is CZK 141 mill. As individual minerals concerns, the highest balance show sand and gravel (CZK 528 mill), brown coal and lignite (CZK 250 mill), limestones and additives for cement production (CZK 196 mill), brick clays and related minerals (CZK 100 mill), feldspar (CZK 98 mill) and kaolin (CZK 62 mill). The positive balance probably reflects acquisition of land for potential mining. In contrast, crushed stone, uranium and diatomites, etc. display the lowest balance. Negative balance is given first of all by sale of unnecessary land and also by sale of mined-out deposits. However, interpretation of bal-ance is equivocal, as we do not dispose any information on the deposits themselves.
The economic situation of domestic mining enterprises
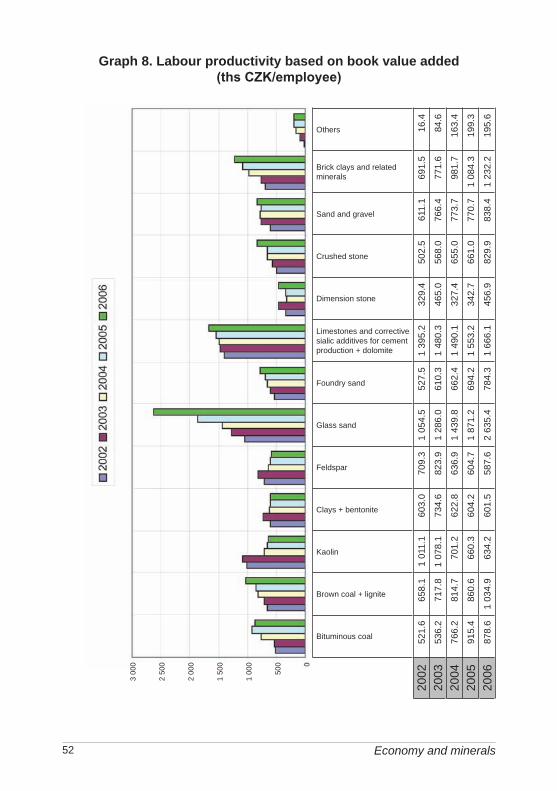
52
Graph 8. labour productivity based on book value added (ths CZK/employee)
Bituminous.coal
Brown.coal.+.lignite
Kaolin
Clays.+.bentonite
Feldspar
Glass.sand
Foundry.sand
Limestones.and.corrective.sialic.additives.for.cement.production.+.dolomite
Dimension.stone
Crushed.stone
Sand.and.gravel
Brick.clays.and.related.minerals
Others
2002
521.
665
8.1
1.01
1.1
603.
070
9.3
1.05
�.5
527.
51.
395.
232
9.�
502.
561
1.1
691.
516
.�
2003
536.
271
7.8
1.07
8.1
73�.
682
3.9
1.28
6.0
610.
31.
�80.
3�6
5.0
568.
076
6.�
771.
68�
.6
200�
766.
281
�.7
701.
262
2.8
636.
91.
�39.
866
2.�
1.�9
0.1
327.
�65
5.0
773.
798
1.7
163.
�
2005
915.
�86
0.6
660.
360
�.2
60�.
71.
871.
269
�.2
1.55
3.2
3�2.
766
1.0
770.
71.
08�.
319
9.3
2006
878.
61.
03�.
963
�.2
601.
558
7.6
2.63
5.�
78�.
31.
666.
1�5
6.9
829.
983
8.�
1.23
2.2
195.
6
Economy and minerals
3.00
0
2.50
0
2.00
0
1.50
0
1.00
0
..50
0

53
The book value added labour productivity is one of the main indicators for evaluating the enterprises in our sample of indicators. It can be seen from the graph 8 that big differ-ences exist between different minerals. Minerals for glass manufacture, limestone, cement raw materials and dolomites seem to be excellent. On the opposite side, there are other minerals group, where indices are decreasing due to high mining costs of uranium.
The indices can be compared each other (each mineral is compared with Mining total) and it is also possible to compare Mining total with bigger units (CZ-NACE aggregates). In comparison with total industry, mining’s labour productivity is about 11 % higher. Industry is composed of mining (included in our sample), of manufacture (partly included) and of energy. Mining total has book value added labour productivity lower than mineral extrac-tion (by about 15 %), higher than manufacturing industry (by about 28 %). Our sample is partly connected with manufacture (for example kaolin and ceramics), which is the reason for the labour productivity decrease. In comparison with the whole non-financial sectors, i.e. with the whole economy without the financial sector, our sample has a higher productiv-ity of about 23 %.
In the non-financial sectors of enterprises the book value added labour productivity of mining is in the second place after energy. It is specific for mining because the consumption of materials is very low – there are not manufactured products from purchased supplies.
The economic situation of domestic mining enterprises

5�
Graph 9. Hourly labour productivity (CZK/working hour)
Hourly book value added labour productivity (graph 9) has similar characteristics to book value added per employee (graph 8). It is a more precise expression of productivity, because it shows the book value added per working hour.
Bituminous.coal
Brown.coal.+.lignite
Kaolin
Clays.+.bentonite
Feldspar
Glass.sand
Foundry.sand
Limestones.and.corrective.sialic.additives.for.cement.production.+.dolomite
Dimension.stone
Crushed.stone
Sand.and.gravel
Brick.clays.and.related.minerals
Others
2002
328
�0�
595
36�
�25
615
317
776
197
291
350
399
1020
0333
5��
362
5�3
3�8
776
�36
680
927
232
3�3
8��
053
200�
�70
�95
�11
368
37�
831
391
811
191
375
��1
553
100
2005
567
525
399
366
365
1.09
5�2
085
920
137
2��
361
912
320
065�
963
037
335
73�
71.
571
�77
916
269
�73
�7�
707
120
Economy and minerals

55
Graph 10. Sales per employee (ths CZK/employee)
Bituminous.coal
Brown.coal.+.lignite
Kaolin
Clays.+.bentonite
Feldspar
Glass.sand
Foundry.sand
Limestones.and.corrective.sialic.additives.for.cement.production.+.dolomite
Dimension.stone
Crushed.stone
Sand.and.gravel
Brick.clays.and.related.minerals
Others
2002
1.23
01.
272
1.75
31.
150
1.37
12.
323
1.18
13.
275
912
1.65
52.
29�
2.01
0�5
720
031.
3��
1.39
31.
932
1.3�
31.
�81
2.79
91.
350
3.�5
51.
187
1.90
12.
66�
2.11
7�3
620
0�1.
773
1.��
91.
888
1.6�
71.
72�
3.2�
81.
539
3.75
61.
197
2.13
82.
803
2.�6
875
920
052.
027
1.55
01.
9�1
1.69
81.
781
3.88
11.
537
3.75
71.
628
2.35
02.
920
2.86
186
120
061.
875
1.80
22.
067
1.85
81.
93�
5.26
91.
7�0
�.12
81.
358
2.75
73.
16�
3.02
691
�
Compared with other aggregates in our sample, sales per employee (graph 10) are op-posite to the book value added labour productivity. In our sample there are higher sales per employee than in statewide aggregated mining (by about 14 %), but lower than in the
The economic situation of domestic mining enterprises

56
manufacturing industry, energy industry, in industry total and in the non-financial sectors enterprises. Higher sales per employee than in statewide aggregated mining are once more connected with including of a part of manufacture into our sample.
Mining takes the last position in sales per employee in comparison with aggregates in-dustry and non-financial sphere total. This can be expected, as e.g. in manufacturing indus-try, the enterprises supply each other with intermediate products which are then added to sales. This addition does not operate in value added, as stated above.
Economy and minerals

57
Graph 11. Average salary (CZK/employee)
Bituminous.coal
Brown.coal.+.lignite
Kaolin
Clays.+.bentonite
Feldspar
Glass.sand
Foundry.sand
Limestones.and.corrective.sialic.additives.for.cement.production.+.dolomite
Dimension.stone
Crushed.stone
Sand.and.gravel
Brick.clays.and.related.minerals
Others
2002
20.0
7�17
.935
17.7
0715
.561
16.8
�519
.150
1�.8
3920
.618
1�.7
6316
.928
18.3
1116
.988
17.6
1820
0320
.6�6
18.9
3320
.391
18.1
0218
.983
20.6
7516
.199
21.6
0216
.�81
18.1
9919
.893
17.8
5718
.838
200�
22.3
7820
.120
20.6
6919
.81�
20.2
8521
.972
17.5
5�22
.617
16.5
�619
.760
21.2
�719
.588
20.0
2920
052�
.181
21.3
1521
.517
20.6
3821
.105
2�.5
5318
.275
23.1
2616
.996
20.7
1222
.512
20.3
3520
.89�
2006
25.7
8723
.099
22.5
3321
.755
22.1
�527
.575
19.7
262�
.789
18.6
5922
.788
2�.2
0122
.385
22.0
76
The average salary (graph 11) is more or less equal despite rather big differences in la-bour productivity between individual minerals. Compared to industrial aggregates, average salary in our sample is by 3 % lower than in the statewide aggregate of mining and higher
The economic situation of domestic mining enterprises

58
than in the statewide aggregate of industry (by about 18 %), manufacturing industry (by about 22 %) and non-financial sphere in total (by about 16 %).
The comparison corresponds to the fact that mining occupies the second position after the energy production as salaries concerns. This represents again a particularity of the min-ing given by the employees’ structure.
Economy and minerals
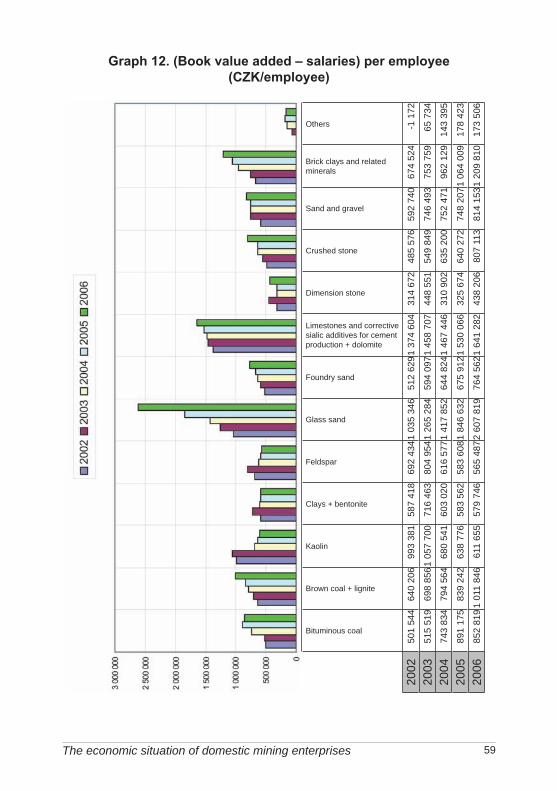
59
Graph 12. (Book value added – salaries) per employee (CZK/employee)
Bituminous.coal
Brown.coal.+.lignite
Kaolin
Clays.+.bentonite
Feldspar
Glass.sand
Foundry.sand
Limestones.and.corrective.sialic.additives.for.cement.production.+.dolomite
Dimension.stone
Crushed.stone
Sand.and.gravel
Brick.clays.and.related.minerals
Others
2002
501.
5��
6�0.
206
993.
381
587.
�18
692.
�3�1
.035
.3�6
512.
6291
.37�
.60�
31�.
672
�85.
576
592.
7�0
67�.
52�
-1.1
72
2003
515.
519
698.
8561
.057
.700
716.
�63
80�.
95�1
.265
.28�
59�.
0971
.�58
.707
��8.
551
5�9.
8�9
7�6.
�93
753.
759
65.7
3�
200�
7�3.
83�
79�.
56�
680.
5�1
603.
020
616.
5771
.�17
.852
6��.
82�1
.�67
.��6
310.
902
635.
200
752.
�71
962.
129
1�3.
395
2005
891.
175
839.
2�2
638.
776
583.
562
583.
6081
.8�6
.632
675.
9121
.530
.066
325.
67�
6�0.
272
7�8.
2071
.06�
.009
178.
�23
2006
852.
819
1.01
1.8�
661
1.65
557
9.7�
656
5.�8
72.6
07.8
1976
�.56
21.6
�1.2
82�3
8.20
680
7.11
381
�.15
31.2
09.8
1017
3.50
6
The economic situation of domestic mining enterprises

60
The difference between book value added labour productivity and average salary (graph 12) is a deciding indicator for the evaluation of an enterprise‘s productivity (in our selection of indices). The higher the value, the better, i.e. it leaves more money for covering other costs (depreciations, social taxes, financial costs etc.) and for profit creation. In view of the fact that average salaries are not too variable, the result is due to differences in the book value added labour productivity.
Economy and minerals

61
Graph 13. Index 2006/2002 (book value added – salaries) per employee
Bituminous.coal
Brown.coal.+.lignite
Kaolin
Clays.+.bentonite
Feldspar
Glass.sand
Foundry.sand
Limestones.and.corrective.sialic.additives.for.cement.production.+.dolomite
Dimension.stone
Crushed.stone
Sand.and.gravel
Brick.clays.and.related.minerals
Others
Mining.total
70,0
�%58
,05%
-38,
�3%
-1,3
1%-1
8,33
%15
1,88
%�9
,15%
19,�
0%39
,26%
66,2
2%37
,35%
79,3
6%-1
�899
,11%
�7,3
7%
The economic situation of domestic mining enterprises

62
The index 2006/2002 was calculated to orientate better in the index (book value added – salaries) per employee. Positive feature is that total mining showed growth of 47 %. In other words, mining business paid more in 2006 than in 2002. Glass sand mining is excel-lent. In contrast, kaolin shows an interesting development, probably reflecting connection with ceramics production.
An examination of different minerals follows.
Economy and minerals

63
Inde
xIn
dex
Inde
xIn
dex
Inde
xIn
dica
tor
Uni
t20
0220
0320
0�20
0520
0603
/02
0�/0
305
/0�
06/0
506
/02
Num
ber.o
f.en
terp
rises
87
910
11-2
0%28
%17
%9%
30%
Reg
iste
red.
num
ber.
of.e
mpl
oyee
s2�
.6�8
23.0
5921
.�6�
20.3
6019
.523
-6%
-7%
-5%
-�%
-21%
Sal
esm
ill.C
ZK30
.315
30.9
8838
.0�8
�1.2
6036
.599
2%23
%8%
-11%
21%
Boo
k.va
lue.
adde
dm
ill.C
ZK12
.857
12.3
6316
.��6
18.6
3717
.153
-�%
33%
13%
-8%
33%
Acq
uisi
tion.
of.la
nd.
and.
depo
sits
ths.
CZK
20.3
3728
.087
55.�
7333
.�96
19.2
1�38
%98
%-�
0%-�
3%-6
%
Sal
es.p
er.e
mpl
oyee
ths.
CZK
/.em
ploy
ee1.
230
1.3�
�1.
773
2.02
71.
875
9%32
%1�
%-7
%52
%
Min
ing
tota
l = 1
00%
%83
%81
%93
%99
%84
%La
bour
.pro
duct
ivity
.ba
sed.
on.b
ook.
valu
e.ad
ded
CZK
/.em
ploy
ee52
1.61
853
6.16
576
6.21
291
5.35
787
8.60
63%
�3%
19%
-�%
68%
Min
ing
tota
l = 1
00%
%95
%87
%11
0%12
5%10
9%
Hou
rly.la
bour
.pr
oduc
tivity
.
CZK
/.w
orki
ng.
hour
328
335
�70
567
5�9
2%�1
%21
%-3
%67
%
Min
ing
tota
l = 1
00%
%99
%91
%11
5%13
0%11
5%
Aver
age.
sala
ryC
ZK/.
empl
oyee
20.0
7�20
.6�6
22.3
782�
.181
25.7
873%
8%8%
7%28
%
Min
ing
tota
l = 1
00%
%11
1%10
7%10
8%11
1%11
0%(B
ook.
valu
e.ad
ded.
-.sal
arie
s).p
er.
empl
oyee
.
CZK
/.em
ploy
ee50
1.5�
�51
5.51
97�
3.83
�89
1.17
585
2.81
93%
��%
20%
-�%
70%
Min
ing
tota
l = 1
00%
%95
%86
%11
0%12
5%10
9%
Tab. 2: Bituminous coal
There are not many bituminous coal extracting enterprises (5 % of enterprises in our sample), but it is one of the most significant parts of mining for sales (16.7 %), employee numbers (19.8 %) and book value added (21.7 %). The growth of value added has been pleasing, too. Dynamics of sales is though interesting – it grew until 2005 and successively decreased in 2006, probably because of organization changes. In the relative indices bitu-minous coal has excellent growth and in comparison with Mining total it is an outstanding mineral from the economic point of view.
The economic situation of domestic mining enterprises

6�
Tab. 3: Brown coal and ligniteIn
dex
03/0
2In
dex
0�/0
3In
dex
05/0
�In
dex
06/0
5In
dex
06/0
2In
dica
tor
Uni
t20
0220
0320
0�20
0520
06
Num
ber.o
f.en
terp
rises
66
66
60%
0%0%
0%0%
Reg
iste
red.
num
ber.
of.e
mpl
oyee
s16
.366
15.1
261�
.667
1�.1
3813
.657
-8%
-3%
-�%
-3%
-17%
Sal
esm
ill.C
ZK20
.81�
21.0
6721
.259
21.9
202�
.613
1%1%
3%12
%18
%B
ook.
valu
e.ad
ded
mill
.CZK
10.7
7110
.857
11.9
�912
.166
1�.1
351%
10%
2%16
%31
%A
cqui
sitio
n.of
.land
.an
d.de
posi
tsth
s.C
ZK2�
5.73
711
0.79
921
.978
��.1
0619
7.7�
8-5
5%-8
0%10
1%3�
8%-2
0%
Sal
es.p
er.e
mpl
oyee
ths.
CZK
/.em
ploy
ee1.
272
1.39
31.
��9
1.55
01.
802
10%
�%7%
16%
�2%
Min
ing
tota
l = 1
00%
%86
%84
%76
%76
%81
%La
bour
.pro
duct
ivity
.ba
sed.
on.b
ook.
valu
e.ad
ded
CZK
/.em
ploy
ee65
8.1�
171
7.79
081
�.68
�86
0.55
71.
03�.
9�5
9%13
%6%
20%
57%
Min
ing
tota
l = 1
00%
%12
0%11
6%11
7%11
7%12
9%
Hou
rly.la
bour
.pr
oduc
tivity
.
CZK
/.w
orki
ng.
hour
�0�
��3
�95
525
630
10%
12%
6%20
%56
%
Min
ing
tota
l = 1
00%
%12
3%12
0%12
1%12
0%13
2%
Aver
age.
sala
ryC
ZK/.
empl
oyee
17.9
3518
.933
20.1
2021
.315
23.0
996%
6%6%
8%29
%
Min
ing
tota
l = 1
00%
%99
%98
%97
%98
%99
%(B
ook.
valu
e.ad
ded.
-.sal
arie
s).p
er.
empl
oyee
.
CZK
/.em
ploy
ee6�
0.20
669
8.85
679
�.56
�83
9.2�
21.
011.
8�6
9%1�
%6%
21%
58%
Min
ing
tota
l = 1
00%
%12
1%11
7%11
8%11
8%13
0%
There are also few brown coal and lignite extracting enterprises (2.9 % of enterprises), but it is one of the most important minerals for sales (11.3%), employee numbers (13.9 %) and book value added (17.9 %). Of course the growth dynamic of sales and of book value added is poorer compared to the Mining total. This mineral shows better dynamics in labour productivity than the Mining total. Compared to our sample Mining total, the mineral is above-average as labour productivity based on value added, hourly labour productivity and the difference (value added – salaries) per employee concerns.
Economy and minerals

65
Tab. 4: Kaolin
Inde
xIn
dex
Inde
xIn
dex
Inde
xIn
dica
tor
Uni
t20
0220
0320
0�20
0520
0603
/02
0�/0
305
/0�
06/0
506
/02
Num
ber.o
f.en
terp
rises
�5
5�
�25
%0%
-20%
0%0%
Reg
iste
red.
num
ber.
of.e
mpl
oyee
s1.
093
1.18
33.
901
�.25
93.
977
8%23
0%9%
-7%
26�%
Sal
esm
ill.C
ZK1.
916
2.28
77.
365
8.26
68.
222
19%
222%
12%
-1%
329%
Boo
k.va
lue.
adde
dm
ill.C
ZK1.
105
1.27
62.
735
2.81
22.
522
15%
11�%
3%-1
0%12
8%A
cqui
sitio
n.of
.land
.an
d.de
posi
tsth
s.C
ZK12
.238
1�.0
7825
.153
52.8
�8�3
.331
15%
79%
110%
-18%
25�%
Sal
es.p
er.e
mpl
oyee
ths.
CZK
/.em
ploy
ee1.
753
1.93
21.
888
1.9�
12.
067
10%
-2%
3%7%
18%
Min
ing
tota
l = 1
00%
%11
9%11
6%10
0%95
%93
%La
bour
.pro
duct
ivity
.ba
sed.
on.b
ook.
valu
e.ad
ded
CZK
/.em
ploy
ee1.
011.
088
1.07
8.09
270
1.21
166
0.29
363
�.18
97%
-35%
-6%
-�%
-37%
Min
ing
tota
l = 1
00%
%18
4%17
5%10
1%90
%79
%
Hou
rly.la
bour
.pr
oduc
tivity
.
CZK
/.w
orki
ng.
hour
595
625
�11
399
373
5%-3
�%-3
%-7
%-3
7%
Min
ing
tota
l = 1
00%
%18
0%17
0%10
0%92
%78
%
Aver
age.
sala
ryC
ZK/.
empl
oyee
17.7
0720
.391
20.6
6921
.517
22.5
3315
%1%
�%5%
27%
Min
ing
tota
l = 1
00%
%98
%10
6%10
0%99
%96
%(B
ook.
valu
e.ad
ded.
-.sal
arie
s).p
er.
empl
oyee
.
CZK
/.em
ploy
ee99
3.38
11.
057.
700
680.
5�1
638.
776
611.
655
6%-3
6%-6
%-�
%-3
8%
Min
ing
tota
l = 1
00%
%18
7%17
7%10
1%90
%78
%
A marked jump in employee numbers, sales and book value added in 2004 is influenced by organizational changes, primarily by the unification of extraction of kaolin with manu-facture of products. This unification can be seen also in the relative indices. In 2002 and 2003 it was an outstanding mineral, with its book value added labour productivity higher than Mining total by 84 % and 75% respectively. In 2006 the labour productivity was 21 % lower.
The economic situation of domestic mining enterprises

66
Tab. 5: Clays and bentoniteIn
dex
Inde
xIn
dex
Inde
xIn
dex
Indi
cato
rU
nit
2002
2003
200�
2005
2006
03/0
20�
/03
05/0
�06
/05
06/0
2
Num
ber.o
f.en
terp
rises
77
77
60%
0%0%
-1�%
-1�%
Reg
iste
red.
num
ber.
of.e
mpl
oyee
s2.
�22
2.35
75.
020
5.37
5�.
910
-3%
113%
7%-9
%10
3%
Sal
esm
ill.C
ZK2.
785
3.16
�8.
267
9.12
�9.
122
1�%
161%
10%
0%22
8%B
ook.
valu
e.ad
ded
mill
.CZK
1.�6
01.
731
3.12
73.
2�7
2.95
319
%81
%�%
-9%
102%
Acq
uisi
tion.
of.la
nd.
and.
depo
sits
ths.
CZK
11.�
655.
716
3�.0
�225
.2�0
�0.2
�2-5
0%�9
6%-2
6%59
%25
1%
Sal
es.p
er.e
mpl
oyee
ths.
CZK
/.em
ploy
ee1.
150
1.3�
31.
6�7
1.69
81.
858
17%
23%
3%9%
62%
Min
ing
tota
l = 1
00%
%78
%81
%87
%83
%84
%La
bour
.pro
duct
ivity
.ba
sed.
on.b
ook.
valu
e.ad
ded
CZK
/.em
ploy
ee60
2.97
973
�.56
562
2.83
�60
�.20
060
1.50
222
%-1
5%-3
%0%
0%
Min
ing
tota
l = 1
00%
%11
0%11
9%90
%82
%75
%
Hou
rly.la
bour
.pr
oduc
tivity
.
CZK
/.w
orki
ng.
hour
36�
�33
368
366
357
19%
-15%
0%-3
%-2
%
Min
ing
tota
l = 1
00%
%11
0%11
8%90
%84
%75
%
Aver
age.
sala
ryC
ZK/.
empl
oyee
15.5
6118
.102
19.8
1�20
.638
21.7
5516
%9%
�%5%
�0%
Min
ing
tota
l = 1
00%
%86
%94
%96
%95
%93
%(B
ook.
valu
e.ad
ded.
-.sal
arie
s).p
er.
empl
oyee
.
CZK
/.em
ploy
ee58
7.�1
871
6.�6
360
3.02
058
3.56
257
9.7�
622
%-1
6%-3
%-1
%-1
%
Min
ing
tota
l = 1
00%
%11
1%12
0%89
%82
%74
%
The performance of clays and bentonite seems to be similar to that of kaolin. In 2004 unification with manufacture changed the financial situation.
Economy and minerals

67
Tab. 6: Feldspar
Inde
xIn
dex
Inde
xIn
dex
Inde
xIn
dica
tor
Uni
t20
0220
0320
0�20
0520
0603
/02
0�/0
305
/0�
06/0
506
/02
Num
ber.o
f.ent
erpr
ises
55
55
50%
0%0%
0%0%
Reg
iste
red.
num
ber.o
f.em
ploy
ees
1.51
31.
560
�.22
3�.
58�
�.25
13%
171%
9%-7
%18
1%
Sal
esm
ill.C
ZK2.
07�
2.31
07.
279
8.16
�8.
221
11%
215%
12%
1%29
6%B
ook.
valu
e.ad
ded
mill
.CZK
1.07
31.
285
2.68
92.
772
2.�9
820
%10
9%3%
-10%
133%
Acq
uisi
tion.
of.la
nd.a
nd.
depo
sits
ths.
CZK
�.51
086
.917
22.3
613�
.611
28.9
1818
27%
-7�%
55%
-16%
5�1%
Sal
es.p
er.e
mpl
oyee
ths.
CZK
/.em
ploy
ee1.
371
1.�8
11.
72�
1.78
11.
93�
8%16
%3%
9%�1
%
Min
ing
tota
l = 1
00%
%93
%89
%91
%87
%87
%La
bour
.pro
duct
ivity
.ba
sed.
on.b
ook.
valu
e.ad
ded
CZK
/.em
ploy
ee70
9.27
982
3.93
663
6.86
260
�.71
358
7.63
216
%-2
3%-5
%-3
%-1
7%
Min
ing
tota
l = 1
00%
%12
9%13
4%92
%82
%73
%
Hou
rly.la
bour
.pr
oduc
tivity
.
CZK
/.w
orki
ng.
hour
�25
�87
37�
365
3�7
15%
-23%
-2%
-5%
-18%
Min
ing
tota
l = 1
00%
%12
9%13
3%91
%84
%73
%
Aver
age.
sala
ryC
ZK/.
empl
oyee
16.8
�518
.983
20.2
8521
.105
22.1
�513
%7%
�%5%
31%
Min
ing
tota
l = 1
00%
%93
%99
%98
%97
%95
%(B
ook.
valu
e.ad
ded.
-.sa
larie
s).p
er.e
mpl
oyee
.CZK
/.em
ploy
ee69
2.�3
�80
�.95
�61
6.57
758
3.60
856
5.�8
716
%-2
3%-5
%-3
%-1
8%
Min
ing
tota
l = 1
00%
%13
1%13
5%91
%82
%72
%
Similar to kaolin, clays and bentonite financial situation of feldspar changed as a result of the unification with manufacture in 2004.
The economic situation of domestic mining enterprises

68
Tab. 7: Glass sandIn
dex
Inde
xIn
dex
Inde
xIn
dex
Indi
cato
rU
nit
2002
2003
200�
2005
2006
03/0
20�
/03
05/0
�06
/05
06/0
2
Num
ber.o
f.en
terp
rises
33
33
30%
0%0%
0%0%
Reg
iste
red.
num
ber.o
f.em
ploy
ees
369
328
296
227
163
-11%
-10%
-23%
-28%
-56%
Sal
esm
ill.C
ZK85
691
996
088
186
07%
�%-8
%-2
%0%
Boo
k.va
lue.
adde
dm
ill.C
ZK38
9�2
2�2
5�2
5�3
09%
1%0%
1%11
%A
cqui
sitio
n.of
.land
.an
d.de
posi
tsth
s.C
ZK79
05�
812
30
-100
%-7
8%-1
00%
-100
%
Sal
es.p
er.e
mpl
oyee
ths.
CZK
/.em
ploy
ee2.
323
2.79
93.
2�8
3.88
15.
269
20%
16%
20%
36%
127%
Min
ing
tota
l = 1
00%
%15
7%16
8%17
1%18
9%23
7%La
bour
.pro
duct
ivity
.ba
sed.
on.b
ook.
valu
e.ad
ded
CZK
/.em
ploy
ee1.
05�.
�97
1.28
5.95
91.
�39.
82�
1.87
1.18
52.
635.
39�
22%
12%
30%
�1%
150%
Min
ing
tota
l = 1
00%
%19
2%20
8%20
7%25
5%32
8%
Hou
rly.la
bour
.pr
oduc
tivity
.
CZK
/.w
orki
ng.
hour
615
76�
831
1.09
51.
571
2�%
9%32
%��
%15
6%
Min
ing
tota
l = 1
00%
%18
6%20
8%20
2%25
1%33
0%
Aver
age.
sala
ryC
ZK/.
empl
oyee
19.1
5020
.675
21.9
722�
.553
27.5
758%
6%12
%12
%��
%
Min
ing
tota
l = 1
00%
%10
6%10
7%10
6%11
3%11
8%(B
ook.
valu
e.ad
ded.
-.sal
arie
s).p
er.
empl
oyee
.
CZK
/.em
ploy
ee1.
035.
3�6
1.26
5.28
�1.
�17.
852
1.8�
6.63
22.
607.
819
22%
12%
30%
�1%
152%
Min
ing
tota
l = 1
00%
%19
5%21
2%21
0%25
9%33
4%
Glass sand is the smallest mineral, based on employee numbers, sales and book value added, but a star performer in labour productivity – its productivity is 328 % higher than the total. The smallest, but the most effective mineral.
Economy and minerals

69
Tab. 8: Foundry sand
Inde
xIn
dex
Inde
xIn
dex
Inde
xIn
dica
tor
Uni
t20
0220
0320
0�20
0520
0603
/02
0�/0
305
/0�
06/0
506
/02
Num
ber.o
f.en
terp
rises
66
66
60%
0%0%
0%0%
Num
ber.o
f.em
ploy
ees
1.65
01.
527
1.�8
51.
�50
1.�0
2-7
%-3
%-2
%-3
%-1
5%S
ales
mill
.CZK
1.9�
92.
060
2.28
52.
229
2.�3
96%
11%
-2%
9%25
%Va
lue.
adde
dm
ill.C
ZK87
093
298
31.
007
1.09
97%
6%2%
9%26
%A
cqui
sitio
n.of
.gro
unds
.an
d.de
posi
tsth
s.C
ZK1.
225
03.
051
6�7
9�6
-100
%-7
9%�6
%-2
3%
Sal
es.p
er.e
mpl
oyee
ths.
.CZK
/.em
ploy
ee1.
181
1.35
01.
539
1.53
71.
7�0
1�%
1�%
0%13
%�7
%
Min
ing
tota
l = 1
00%
%80
%81
%81
%75
%78
%La
bour
.pro
duct
ivity
.ba
sed.
valu
e.ad
ded
CZK
/.em
ploy
ee52
7.�6
861
0.29
666
2.37
969
�.18
878
�.28
816
%9%
5%13
%�9
%
Min
ing
tota
l = 1
00%
%96
%99
%95
%95
%97
%
Hou
rly.la
bour
.pr
oduc
tivity
.
CZK
/.w
orki
ng.
hour
317
366
391
�20
�77
15%
7%7%
1�%
50%
Min
ing
tota
l = 1
00%
%96
%10
0%95
%96
%10
0%
Aver
age.
sala
ryC
ZK/.
empl
oyee
1�.8
3916
.199
17.5
5�18
.275
19.7
269%
8%�%
8%33
%
Min
ing
tota
l = 1
00%
%82
%84
%85
%84
%84
%(V
alue
.add
ed.
-.sal
arie
s).p
er.
empl
oyee
.
CZK
/.em
ploy
ee51
2.62
959
�.09
76�
�.82
�67
5.91
276
�.56
216
%9%
5%13
%�9
%
Min
ing
tota
l = 1
00%
%97
%99
%96
%95
%98
%
This mineral is small (has low value of a number of indicators) similarly to glass sand. However, it shows below-average performance (labour productivity) compared to glass sand.
The economic situation of domestic mining enterprises

70
Tab. 9: limestones and corrective sialic additives for cement production and dolomite
Inde
xIn
dex
Inde
xIn
dex
Inde
xIn
dica
tor
Uni
t20
0220
0320
0�20
0520
0603
/02
0�/0
305
/0�
06/0
506
/02
Num
ber.o
f.ent
erpr
ises
1715
1616
15-8
%6%
0%-3
%-8
%R
egis
tere
d.nu
mbe
r.of.
empl
oyee
s2.
782
2.67
82.
835
2.75
22.
797
-�%
6%-3
%2%
1%
Sal
esm
ill.C
ZK9.
113
9.25
310
.6�8
10.3
�111
.5�5
2%15
%-3
%12
%27
%B
ook.
valu
e.ad
ded
mill
.CZK
3.88
23.
965
�.22
��.
275
�.66
02%
7%1%
9%20
%A
cqui
sitio
n.of
.land
.and
.de
posi
tsth
s.C
ZK�9
.�53
129.
739
23.5
1319
.971
31.6
1316
2%-8
2%-1
5%58
%-3
6%
Sal
es.p
er.e
mpl
oyee
ths.
CZK
/.em
ploy
ee3.
275
3.�5
53.
756
3.75
7�.
128
5%9%
0%10
%26
%
Min
ing
tota
l = 1
00%
%22
1%20
8%19
8%18
3%18
6%La
bour
.pro
duct
ivity
.ba
sed.
on.b
ook.
valu
e.ad
ded
CZK
/.em
ploy
ee1.
395.
223
1.�8
0.30
91.
�90.
063
1.55
3.19
21.
666.
071
6%1%
�%7%
19%
Min
ing
tota
l = 1
00%
%25
5%24
0%21
4%21
2%20
7%
Hou
rly.la
bour
.pr
oduc
tivity
.
CZK
/.w
orki
ng.
hour
776
809
811
859
916
�%0%
6%7%
18%
Min
ing
tota
l = 1
00%
%23
5%22
0%19
8%19
7%19
2%
Aver
age.
sala
ryC
ZK/.
empl
oyee
20.6
1821
.602
22.6
1723
.126
2�.7
895%
5%2%
7%20
%
Min
ing
tota
l = 1
00%
%11
4%11
2%11
0%10
6%10
6%(B
ook.
valu
e.ad
ded.
-.sa
larie
s).p
er.e
mpl
oyee
.CZK
/.em
ploy
ee1.
37�.
60�
1.�5
8.70
71.
�67.
��6
1.53
0.06
61.
6�1.
282
6%1%
�%7%
19%
Min
ing
tota
l = 1
00%
%25
9%24
4%21
8%21
5%21
0%
A mineral which has about 7.3 % of enterprises, 2.8 % of employees, 5.3 % of sales and 5.9 % of book value added of the Mining total sample. It is also a star for labour productiv-ity, with the productivity more than twice higher than the whole. On the downside is its continuously decreasing share of productivity in the Mining total.
Economy and minerals

71
Tab. 10: Dimension stone
Inde
xIn
dex
Inde
xIn
dex
Inde
xIn
dica
tor
Uni
t20
0220
0320
0�20
0520
0603
/02
0�/0
305
/0�
06/0
506
/02
Num
ber.o
f.ent
erpr
ises
2321
2023
18-6
%-7
%1�
%-1
8%-1
8%R
egis
tere
d.nu
mbe
r.of.
empl
oyee
s1.
567
1.�3
81.
�32
1.55
11.
197
-8%
0%8%
-23%
-2�%
Sal
esm
ill.C
ZK1.
�29
1.70
71.
713
2.52
51.
625
19%
0%�7
%-3
6%1�
%B
ook.
valu
e.ad
ded
mill
.CZK
516
669
�69
532
5�7
30%
-30%
13%
3%6%
Acq
uisi
tion.
of.la
nd.a
nd.
depo
sits
ths.
CZK
3.05
36.
399
2.50
51.
375
1.�2
211
0%-6
1%-�
5%3%
-53%
Sal
es.p
er.e
mpl
oyee
ths.
CZK
/.em
ploy
ee91
21.
187
1.19
71.
628
1.35
830
%1%
36%
-17%
�9%
Min
ing
tota
l = 1
00%
%62
%71
%63
%79
%61
%La
bour
.pro
duct
ivity
.ba
sed.
on.b
ook.
valu
e.ad
ded
CZK
/.em
ploy
ee32
9.�3
5�6
5.03
232
7.��
83�
2.66
9�5
6.86
5�1
%-3
0%5%
33%
39%
Min
ing
tota
l = 1
00%
%60
%75
%47
%47
%57
%
Hou
rly.la
bour
.pr
oduc
tivity
.
CZK
/.w
orki
ng.
hour
197
272
191
201
269
38%
-30%
5%33
%36
%
Min
ing
tota
l = 1
00%
%60
%74
%47
%46
%56
%
Aver
age.
sala
ryC
ZK/.
empl
oyee
1�.7
6316
.�81
16.5
�616
.996
18.6
5912
%0%
3%10
%26
%
Min
ing
tota
l = 1
00%
%81
%86
%80
%78
%80
%(B
ook.
valu
e.ad
ded.
-.sa
larie
s).p
er.e
mpl
oyee
.CZK
/.em
ploy
ee31
�.67
2��
8.55
131
0.90
232
5.67
��3
8.20
6�3
%-3
1%5%
35%
39%
Min
ing
tota
l = 1
00%
%59
%75
%46
%46
%56
%
A small mineral with a very low labour productivity and average salaries.
The economic situation of domestic mining enterprises

72
Tab. 11: Crushed stone In
dex
Inde
xIn
dex
Inde
xIn
dex
Indi
cato
rU
nit
2002
2003
200 �
2005
2006
03/0
20�
/03
05/0
�06
/05
06/0
2
Num
ber.o
f.ent
erpr
ises
5867
6261
5716
%-8
%-1
%-7
%-2
%R
egis
tere
d.nu
mbe
r.of.
empl
oyee
s21
.789
21.6
�321
.008
19.7
0021
.061
-1%
-3%
-6%
7%-3
%
Sal
esm
ill.C
ZK36
.063
�1.1
36��
.91�
�6.2
9058
.07�
1�%
9%3%
25%
61%
Boo
k.va
lue.
adde
dm
ill.C
ZK10
.9�9
12.2
9�13
.759
13.0
2217
.�79
12%
12%
-5%
3�%
60%
Acq
uisi
tion.
of.la
nd.a
nd.
depo
sits
ths.
CZK
359.
382
182.
19�
235.
638
139.
�68
396.
75�
-�9%
29%
-�1%
18�%
10%
Sal
es.p
er.e
mpl
oyee
ths.
CZK
/.em
ploy
ee1.
655
1.90
12.
138
2.35
02.
757
15%
12%
10%
17%
67%
Min
ing
tota
l = 1
00%
%11
2%11
4%11
3%11
5%12
4%La
bour
.pro
duct
ivity
.ba
sed.
on.b
ook.
valu
e.ad
ded
CZK
/.em
ploy
ee50
2.50
�56
8.0�
865
�.96
066
0.98
�82
9.90
113
%15
%1%
26%
65%
Min
ing
tota
l = 1
00%
%92
%92
%94
%90
%10
3%
Hou
rly.la
bour
.pr
oduc
tivity
.
CZK
/.w
orki
ng.
hour
291
323
375
372
�73
11%
16%
-1%
27%
63%
Min
ing
tota
l = 1
00%
%88
%88
%91
%85
%99
%
Aver
age.
sala
ryC
ZK/.
empl
oyee
16.9
2818
.199
19.7
6020
.712
22.7
888%
9%5%
10%
35%
Min
ing
tota
l = 1
00%
%93
%95
%96
%95
%97
%(B
ook.
valu
e.ad
ded.
-.sa
larie
s).p
er.e
mpl
oyee
.CZK
/.em
ploy
ee�8
5.57
65�
9.8�
963
5.20
06�
0.27
280
7.11
313
%16
%1%
26%
66%
Min
ing
tota
l = 1
00%
%92
%92
%94
%90
%10
3%
The biggest mineral in terms of number of enterprises (27.1 %), sales (26.6 %) and number of employees (21.4 %). It is the second most important mineral for book value added (17.4 %). Of course it is an average mineral for labour productivity and average salaries.
Economy and minerals

73
Tab. 12: Sand and gravel
Inde
xIn
dex
Inde
xIn
dex
Inde
xIn
dica
tor
Uni
t20
0220
0320
0�20
0520
0603
/02
0�/0
305
/0�
06/0
506
/02
Num
ber.o
f.ent
erpr
ises
5355
5658
553%
2%3%
-�%
�%R
egis
tere
d.nu
mbe
r.of.
empl
oyee
s11
.318
11.1
8113
.677
13.9
7813
.030
-1%
22%
2%-7
%15
%
Sal
esm
ill.C
ZK25
.965
29.7
8138
.336
�0.8
18�1
.228
15%
29%
6%1%
59%
Boo
k.va
lue.
adde
dm
ill.C
ZK6.
916
8.56
910
.582
10.7
7310
.92�
2�%
23%
2%1%
58%
Acq
uisi
tion.
of.la
nd.a
nd.
depo
sits
ths.
CZK
107.
�6�
273.
503
69.0
1015
9.65
223
6.8�
715
5%-7
5%13
1%�8
%12
0%
Sal
es.p
er.e
mpl
oyee
ths.
CZK
/.em
ploy
ee2.
29�
2.66
�2.
803
2.92
03.
16�
16%
5%�%
8%38
%
Min
ing
tota
l = 1
00%
%15
5%16
0%14
8%14
2%14
2%La
bour
.pro
duct
ivity
.ba
sed.
on.b
ook.
valu
e.ad
ded
CZK
/.em
ploy
ee61
1.05
176
6.38
677
3.71
877
0.71
983
8.35
�25
%1%
0%9%
37%
Min
ing
tota
l = 1
00%
%11
1%12
4%11
1%10
5%10
4%
Hou
rly.la
bour
.pr
oduc
tivity
.
CZK
/.w
orki
ng.
hour
350
�38
��1
��3
�7�
25%
1%0%
7%36
%
Min
ing
tota
l = 1
00%
%10
6%11
9%10
8%10
2%10
0%
Aver
age.
sala
ryC
ZK/.
empl
oyee
18.3
1119
.893
21.2
�722
.512
2�.2
019%
7%6%
8%32
%
Min
ing
tota
l = 1
00%
%10
1%10
3%10
3%10
3%10
3%(B
ook.
valu
e.ad
ded.
-.sa
larie
s).p
er.e
mpl
oyee
.CZK
/.em
ploy
ee59
2.7�
07�
6.�9
375
2.�7
17�
8.20
781
�.15
326
%1%
-1%
9%37
%
Min
ing
tota
l = 1
00%
%11
2%12
5%11
2%10
5%10
4%
A very important mineral in absolute terms: 26.3 % of number of enterprises, 13.2 % of employees, 18.9 % of sales, and 13.8 % of book value added. It is also outstanding in rela-tive terms (labour productivity higher for 4 to 24 % than the whole).
The economic situation of domestic mining enterprises

7�
Tab. 13: Brick clays and related mineralsIn
dex
Inde
xIn
dex
Inde
xIn
dex
Indi
cato
rU
nit
2002
2003
200�
2005
2006
03/0
20�
/03
05/0
�06
/05
06/0
2
Num
ber.o
f.ent
erpr
ises
1025
2317
1�15
0%-1
0%-2
5%-1
5%�2
%R
egis
tere
d.nu
mbe
r.of.
empl
oyee
s2.
85�
3.13
83.
003
2.65
62.
209
10%
-�%
-12%
-17%
-23%
Sal
esm
ill.C
ZK5.
737
6.6�
37.
�12
7.60
06.
68�
16%
12%
3%-1
2%17
%B
ook.
valu
e.ad
ded
mill
.CZK
1.97
�2.
�22
2.9�
82.
880
2.72
223
%22
%-2
%-5
%38
%A
cqui
sitio
n.of
.land
.and
.de
posi
tsth
s.C
ZK13
.68�
10.3
05�9
.752
36.7
�013
6.09
1-2
5%38
3%-2
6%27
0%89
5%
Sal
es.p
er.e
mpl
oyee
ths.
CZK
/.em
ploy
ee2.
010
2.11
72.
�68
2.86
13.
026
5%17
%16
%6%
51%
Min
ing
tota
l = 1
00%
%13
6%12
7%13
0%14
0%13
6%La
bour
.pro
duct
ivity
.ba
sed.
on.b
ook.
valu
e.ad
ded
CZK
/.em
ploy
ee69
1.51
277
1.61
798
1.71
71.
08�.
3��
1.23
2.19
512
%27
%10
%1�
%78
%
Min
ing
tota
l = 1
00%
%12
6%12
5%14
1%14
8%15
3%
Hou
rly.la
bour
.pr
oduc
tivity
.
CZK
/.w
orki
ng.
hour
399
��0
553
619
707
10%
26%
12%
1�%
77%
Min
ing
tota
l = 1
00%
%12
1%12
0%13
5%14
2%14
8%
Aver
age.
sala
ryC
ZK/.
empl
oyee
16.9
8817
.857
19.5
8820
.335
22.3
855%
10%
�%10
%32
%
Min
ing
tota
l = 1
00%
%94
%93
%95
%93
%96
%(B
ook.
valu
e.ad
ded.
-.sa
larie
s).p
er.e
mpl
oyee
.CZK
/.em
ploy
ee67
�.52
�75
3.75
996
2.12
91.
06�.
009
1.20
9.81
012
%28
%11
%1�
%79
%
Min
ing
tota
l = 1
00%
%12
7%12
6%14
3%14
9%15
5%
Rather a small mineral (3.1 % of sales, etc.) with an outstanding and growing labour productivity.
Economy and minerals
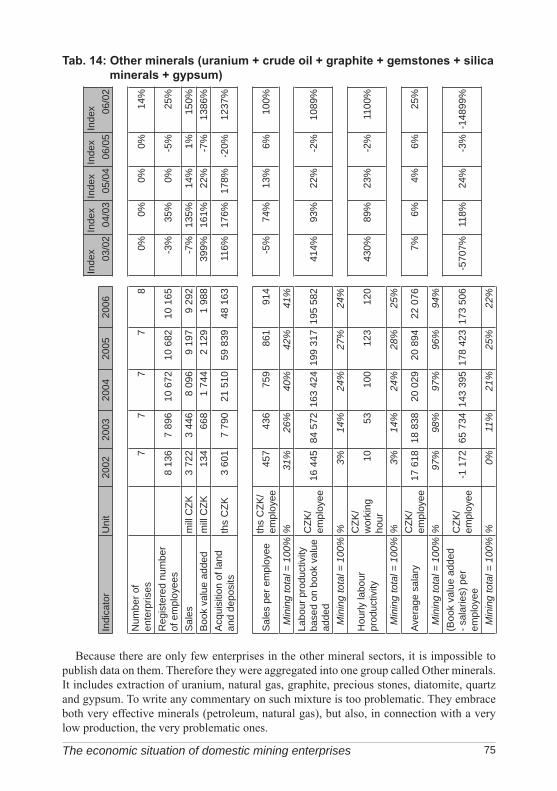
75
Tab. 14: Other minerals (uranium + crude oil + graphite + gemstones + silica minerals + gypsum)
Inde
xIn
dex
Inde
xIn
dex
Inde
xIn
dica
tor
Uni
t20
0220
0320
0�20
0520
0603
/02
0�/0
305
/0�
06/0
506
/02
Num
ber.o
f.en
terp
rises
77
77
80%
0%0%
0%1�
%
Reg
iste
red.
num
ber.
of.e
mpl
oyee
s8.
136
7.89
610
.672
10.6
8210
.165
-3%
35%
0%-5
%25
%
Sal
esm
ill.C
ZK3.
722
3.��
68.
096
9.19
79.
292
-7%
135%
1�%
1%15
0%B
ook.
valu
e.ad
ded
mill
.CZK
13�
668
1.7�
�2.
129
1.98
839
9%16
1%22
%-7
%13
86%
Acq
uisi
tion.
of.la
nd.
and.
depo
sits
ths.
CZK
3.60
17.
790
21.5
1059
.839
�8.1
6311
6%17
6%17
8%-2
0%12
37%
Sal
es.p
er.e
mpl
oyee
ths.
CZK
/.em
ploy
ee�5
7�3
675
986
191
�-5
%7�
%13
%6%
100%
Min
ing
tota
l = 1
00%
%31
%26
%40
%42
%41
%La
bour
.pro
duct
ivity
.ba
sed.
on.b
ook.
valu
e.ad
ded
CZK
/.em
ploy
ee16
.��5
8�.5
7216
3.�2
�19
9.31
719
5.58
2�1
�%93
%22
%-2
%10
89%
Min
ing
tota
l = 1
00%
%3%
14%
24%
27%
24%
Hou
rly.la
bour
.pr
oduc
tivity
.
CZK
/.w
orki
ng.
hour
1053
100
123
120
�30%
89%
23%
-2%
1100
%
Min
ing
tota
l = 1
00%
%3%
14%
24%
28%
25%
Aver
age.
sala
ryC
ZK/.
empl
oyee
17.6
1818
.838
20.0
2920
.89�
22.0
767%
6%�%
6%25
%
Min
ing
tota
l = 1
00%
%97
%98
%97
%96
%94
%(B
ook.
valu
e.ad
ded.
-.sal
arie
s).p
er.
empl
oyee
.
CZK
/.em
ploy
ee-1
.172
65.7
3�1�
3.39
517
8.�2
317
3.50
6-5
707%
118%
2�%
-3%
-1�8
99%
Min
ing
tota
l = 1
00%
%0%
11%
21%
25%
22%
Because there are only few enterprises in the other mineral sectors, it is impossible to publish data on them. Therefore they were aggregated into one group called Other minerals. It includes extraction of uranium, natural gas, graphite, precious stones, diatomite, quartz and gypsum. To write any commentary on such mixture is too problematic. They embrace both very effective minerals (petroleum, natural gas), but also, in connection with a very low production, the very problematic ones.
The economic situation of domestic mining enterprises

76
We have tried to compile some accessible economic data concerning the mining enter-prises in this sector. There are too little data, but in view of their accessibility for small enterprises, this is the maximum available.
Economy and minerals

77
Outline of domestic mine production
2002 2003 200� 2005 2006Energy.minerals
Uraniumt.U �77 �58 �35 �20 383Concentrate.production,.t.U* �65 �52 �12 �09 358
Bituminous.coal kt 1�.097 13.382 1�.6�8 12.778 13.017
Brown.coal kt** �8.83� �9.920 �7.8�0 �8.658 �8.915Lignite kt 501 �70 �50 �67 �59Crude.oil kt 253 310 299 306 259Natural.gas mil.m3 91 131 175 356 1�8
Industrial.mineralsGraphite kt 16 9 5 3 5Pyrope.(garnet).bearing.rock
kt 52 53 �2 �3 39
Moldavite.(tectite).bearing.rock
ths.m3 2� 36 11� 7� 95
KaolinRaw,.kt.***. 3.650 �.155 3.862 3.882 3.768Beneficiated, kt 577 591 596 6�9 673
Clays kt 56� 55� 6�9 671 561Bentonite kt. 17� 199 201 186 220Diatomite kt. 28 �1 33 38 53Feldspar kt �01 �21 �88 �72 �87Feldspar.substitutes kt 29 27 26 23 31
Glass.sand kt 851 90� 828 920 963Foundry.sand kt 676 712 831 807 773Limestones.and.corrective.additives.for.cement.production
kt 10.035 10.�37 10.800 10.190 10.��1
Dolomite kt 31� �16 3�5 �19 �09Gypsum kt 108 10� 71 25 16
Outline of domestic mine production

78
Construction.minerals
Dimension.stone
Mine.production.in.reserved.deposits,.ths.m3.****
235 2�� 273 288 2�2
Mine.production.in.non-reserved.deposits,.ths.m3.*****
50 60 65 55 55
Crushed.stone
Mine.production.in.reserved.deposits,.ths..m3.****
9.65� 11.210 11.966 12.822 1�.093
Mine.production.in.non-reserved.deposits,.ths.m3.*****
900 960 960 1.270 1.300
Sand.and.gravel
Mine.production.in.reserved.deposits,.ths.m3.****
8.26� 9.105 8.859 9.075 9.110
Mine.production.in.non-reserved.deposits,.ths.m3.*****
�.200 �.�00 �.800 5.000 6.000
Brick.clays.and.related.minerals
Mine.production.in.reserved.deposits,.ths.m3.****
1.525 1.626 1.55� 1.5�3 1.286
Mine.production.in.non-reserved.deposits,.ths..m3.*****.
120 180 330 220 300
Metallic.ores.(not.mined)
* corresponds to sales production (without beneficiation losses) ** ČSÚ presents so-called sales mining production which is production of marketable
brown coal and reaches on average about 95 % of given mine production *** raw kaolin, total production of all technological grades**** decrease of mineral reserves by mining production ***** estimate
Economy and minerals

79
MINEralS IN THE CZECH FOrEIGN TraDE
Minerals and mineral products represent an important group in the Czech foreign trade. However, foreign trade balance of minerals and mineral products has been permanently negative owing to large import volume of mineral fuels (crude oil and natural gas), iron ores and materials for mineral fertilizers production. The following 38 items of the Customs tariff nomenclature HS-4 and HS-6 are the most important minerals and products of Czech foreign trade at current process:
Definition of selected customs tariff items
raw material Code 1) Specification of item according to the customs tariff
Fe-ores.and.concentrates 2601 Iron.ores.and.concentrates.incl..roasted.iron.pyrites
Mn-ores.and.concentrates 2602Manganese.ores.and.concentrates.including.Mn-Fe.ores.and.concentrates.with.20.wt%.Mn.or.more.(calculated.on.dry.substance)
Ni-ores.and.concentrates 260� Nickel.ores.and.concentratesCu-ores.and.concentrates 2603 Copper.ores.and.concentratesPb-ores.and.concentrates 2607 Lead.ores.and.concentratesZn-ores.and.concentrates 2608 Zinc.ores.and.concentratesSn-ores.and.concentrates 2609 Tin.ores.and.concentratesW-ores.and.concentrates 2611 Tungsten.ores.and.concentratesAg-ores.and.concentrates 261610 Silver.ores.and.concentrates
Au-ores.and.concentrates
7108
261690
Gold.in.unwrought.or.semimanufactured.form,.gold.powderOther.precious.metal.ores.and.concentrates
U-ores.and.concentrates 261210 Uranium.ores.and.concentrates
Crude.oil 2709 Petroleum.oils.and.oils.obtained.from.bituminous.minerals,.crude
Natural.gas 271121 Natural.gas
Hard.coal 2701 Hard.coal,.briquets.and.similar.solid.fuels.made.of.bituminous.coal
Brown.coal 2702 Lignite,.also.agglomerated,.except.jet
Fluorspar
252921
252922
Fluorspar,.containing.97.wt.%.or.less.of.calcium fluorideFluorspar,.containing.more.than.97.wt.%.of.calcium fluoride
Barite 251010 Natural.barium.sulphate.(barite)Graphite 250� Natural.graphiteKaolin 2507 Kaolin.and.other.kaolinitic.clays,.also.calcined

80
Clays 2508Other.clays.(except.expanded.clays.No..6806),.andalusite,.kyanite,.sillimanite,.also.baked,.mullite,.chamotte.or.dinas.earths
Bentonite 250810 BentoniteFeldsparFeldspar.substitute
252910252930
FeldsparLeucite,.nepheline.and.nepheline.syenite
Silica.minerals 2506 Quartz.(except.natural.sand),.crude.quartzite,.also.dressed
Glass.and.foundry.sand 250510 Silica.sand.and.quartz.sand
Limestones 2521Limestone flux, limestone and other calcareous.stone.for.lime.or.cement.manufacturing
Dolomite 2518 Dolomite,.dolomite.calcined,.roughly.worked.or.cut,.agglomerated
Gypsum 252010 Gypsum,.anhydrite
Dimension.stone
251�
2515
2516
6801
6802
6803
Slate,.also.roughly.worked.or.cut.by.saw.or.other.way.only.into.blocks.or.rectangular.slabs.Marble,.travertine,.ecaussine.and.other.calcareous.monumental.or.crushed.stone,.density.2.5.or.higher,.and.alabaster,.also.roughly.worked.or.cut.by.saw.or.other.way.cut.only.into.blocks.or.rectangular.slabsGranite,.porphyry,.basalt,.sandstone.and.other.monumental.or.crushed.stone,.also.roughly.trimmed.or.cut.into.blocks.or.rectangular.slabsSetts, curbstones and flagstones of natural stone.(except.slate)Worked.monumental.and.crushed.stone.(except.slate.and.slate.products,.except.products.No..6801;.little.stones.for.mosaics.or.tasselated.pavements.or.similar.objects,.also.on beds; artificially coloured granules, chippings and.dust.of.natural.stone.(including.slate)Worked.slate.and.articles.of.slate.or.of.agglomerated.slate
Crushed.stone
251710* Pebbles,.gravel,.broken.or.crushed.stone.in.general.used.for.concreting.and.gravelling.of.roads, railroads etc., flint and hard head also heat-treated
Sand.and.gravel
250590
251710*
Other.sand.(natural.sand.of.all.kinds,.also.coloured,.except.sand.containing.metals.and.except.silica.sand.and.quartz.sand)Pebbles,.gravel,.broken.or.crushed.stone.in.general.used.for.concreting.and.gravelling.of.roads, railroads etc., flint and hard head also heat-treated.
1) Code of the customs tariff; * item included in one commodity only
Minerals in the Czech foreign trade

81
Definition of other important customs tariff items
raw material Code 1) Specification of item according to the customs tariff
Al-ores.and.concentrates 2606 Aluminium.ores.and.concentratesTi-ores.and.concentrates 261� Titanium.ores.and.concentratesNb,.Ta,.V.and.Zr-ores.and.concentrates 2515 Niobium,.tantalum,.vanadium.or.
zirconium.ores.and.concentrates
Coke 270� Coke.and.semi-coke.of.coal,.lignite.or.peat;.agglomerated;.retort.carbon
Salt 2501Salt.(inclusive.table.and.denatured.salt),.pure.sodium.chloride;.also.in.water.solution
Sulphur
2503
2802
Sulphur.of.all.kinds,.other.than.sublimed,.precipitated.and.colloidalSulphur,.sublimed.or.precipitated.colloidal.sulphur
Sulphuric.acid.oleum 2807 Sulphuric.acid.
Natural.phosphates 2510 Natural.calcium.phosphates,.aluminium.calcium.phosphates,.etc.,.unground
Phosphoric.substances 2809 Diphosphorus.pentaoxide,.phosphoric.acid.and.polyphosphoric.acids
Nitrogenous.fertilizers 3102 Mineral.or.chemical.fertilizers,.nitrogenous
Phosphatic.fertilizers 3103 Mineral.or.chemical.fertilizers,.phosphatic
Potassic.fertilizers 310� Mineral.or.chemical.fertilizers,.potassic
Fertilizers.of.more.elements 3105 Mineral.or.chemical.fertilizers.of.2–3.of.elements
Magnesite251910 Natural.magnesium.carbonate.
(magnesite)
251990 Magnesia,.fused,.dead-burned,.magnesium.oxides.
Talc 2526 Natural.steatite,.also.roughly.worked.or.cut.etc.,.talc.
Quicklime 2522Quicklime,.slaked.and.hydraulic,.other.than.calcium.oxide.and.calcium.hydroxide.of.2825
Cement 2523 Portland,.aluminous.cement,.slag,.supersulfate.and.other.hydraulic.cement
1) Code of the customs tariff
Minerals in the Czech foreign trade

82
Main export and import countries of minerals and intermediate products made of them (in % share of FOB current prices):
Country./.year 2002 2003 200� 2005 2006
Export Slovakia 2�.8 2�.9 2�.3 2�.� 2�.3
Austria 2�.� 23.� 26.5 29.6 23.9
Germany 32.8 3�.5 28.5 2�.6 22.3
Hungary 6.0 5.� �.7 8.9 1�.7
Poland 5.6 5.1 7.7 5.8 5.9
Others 6.� 6.7 8.3 6.7 8.9
Import Russia 57.7 57.3 5�.2 61.7 62.7
Azerbaijan 6.6 7.2 6.7 9.7 12.6
Norway 12.1 11.1 8.0 7.8 6.2
Ukraine 6.2 6.0 7.6 5.1 �.�
Poland �.0 �.� 9.2 �.1 �.�
Kazakhstan 0.1 0.5 1.6 1.8 2.7
Germany 1.9 2.0 2.3 1.8 1.8
Slovakia 3.2 3.0 2.6 2.0 1.7
Libya 1.0 1.5 1.6 1.9 1.2
Algeria. 0.6 0.0 1.3 1.0 0.1
Syria 3.8 �.2 1.8 0.2 0.0
Others 2.8 2.8 3.1 3.9 2.2
Note:A significant change in the import structure according to the countries in current prices occurred in the period of 1999–2000. The reasons were the radical price increase of crude oil and simultaneous weakening of CZK against USD (the most important items of mineral raw materials (crude oil, natural gas) are purchased for USD). A big share of countries, from which Czech Republic imports crude oil and natural gas, manifested itself also in years 2001 to 2006 with regard to still high world prices of both commodities, and regardless of a repeated strengthening of CZK against USD.
Czech foreign trade with raw materials is characterized by a high dependence on import of strategic natural fuels, especially oil and gas. A fact that predominant part of raw mate-rial import comes from countries outside the EU represents another characteristic feature. Amount of raw materials from the EU 15 oscillates between only 2 and 4 % in current prices of the import on a long term. This proportion slightly increased when the new mem-
Minerals in the Czech foreign trade

83
ber countries are taken into account (thanks to Poland and Slovakia), amounting to 15.7 % in 2004 and 9.1 % in 2005 and 2006. Despite these, about 85–90 % of commodities are imported from the territories outside the EU.
About 15 % of total Czech import of minerals in value was imported from EU 15 and almost 50 % from EU 25 in 2006 when crude oil and natural gas are not included. Territorial structure of import would in such a case be: Ukraine 24.3 %, Poland 24.1 %, Russia 21.7 %, Germany 9.9 %, Slovakia 9.2 %, Austria 2.4 % and Hungary 1.2 %.
The situation on the side of the Czech raw material export is completely different. Pre-dominant part of the Czech export is directed traditionally to western and central European markets. Export to three most important customer countries (Germany, Austria and Slo-vakia) exceeds 70 % of the value of total Czech export of raw materials and intermediate products made of on a long term.
Share of EU 15 resp. EU 25 countries on the Czech foreign trade with raw materials (% of FOB current prices)
Group.of.countries/year. 2002 2003 200� 2005 2006
Import.from.EU.15.(%) 3.3 3.6 3.7 2.7 2.7
Import.from.EU.25.(%) – 11.2 15.7 9.1 9.1
Export.to.EU.15.(%) 58.6 62.� 58.� 56.7 �9.6
Export.to.EU.25.(%) – 96.9 96.1 96.8 95.2
The most important commodities of the Czech export of mineral substances in 2006 were as follows: bituminous coal – 50.0 %, coke – 16.1 %, brown coal – 5.8 %, natural gas – 2.8 %, kaolin – 2.3% and cement – 2.1 %. Main import commodities were in the same year: crude oil – 47.6 %, natural gas – 34.2 %, and iron ore – 7.9 % (% of raw material import, resp. export in current prices). Detailed data are given in the following tables.
Minerals in the Czech foreign trade

8�
Export and import of selected raw materials registered in raw Material Policy * (in mill CZK)
Raw.materialCustoms
tariff.code
2002 2003 200� 2005 2006**
Metallic.ores.and.concentrates.total
.import 7.197 8.195 13.�19 12.787 13.803
.export 5 1 5 2 1
Fe-ores.and.concentrates
.import2601
7.129 8.125 13.352 12.70� 13.705.export 0 0 0 0 0
Mn-ores.and.concentrates.
.import2602
66 63 6� 79 71.export 1 0 3 1 0
Ni-ores.and.concentrates.
.import260�
1 2 3 3 5.export 3 0 2 1 1
Cu-ores.and.concentrates.
.import2603
0 1 0 0 0.export 0 0 0 0 0
Pb-ores.and.concentrates.
.import2607
0 2 0 0 20.export 0 0 0 0 0
Zn-ores.and.concentrates.
.import2608
0 0 0 0 1.export 0 0 0 0 0
Sn-ores.and.concentrates.
.import.2609
0 0 0 0 1.export 0 0 0 0 0
W-ores.and.concentrates.
.import2611
0 0 0 1 0.export 0 0 0 0 0
Ag-ores.and.concentrates.
.import261610
1 2 0 0 0.export 0 0 0 0 0
Au-ores.and.concentrates.
.import261690
0 0 0 0 0.export 0 0 0 0 0
Energy.minerals.total
.import 68.952 73.865 76.887 116.608 1�5.828
.export 10.779 10.7�2 13.667 15.�57 17.316Uranium-ores.and.concentrates.
.import261210
N N N N N
.export N N N N N
Crude.oil.import
270933.�55 36.361 �1.865. 68.287 82.53�
.export 565 675 �37 516 �22
Natural.gas.import
27112133.991 35.972 31.838 �5.560 59.�29
.export 1 172 389 �28 815Bituminous.coal.
.import2701
1.506 1.531 3.175 2.757 3.821.export 8.896 8.706 11.628 13.109 1�.397
Brown.coal..import
27020 1 9 � ��
.export 1.317 1.189 1.213 1.�0� 1.682
Minerals in the Czech foreign trade

85
Industrial.and.construction.minerals.total.
.import 1.276 1.2�6 1.711 1.71� 2.063
.export 2.713 2.836 3.196 2.733 2.821
Fluorspar.import 252921
25292281 6� 127 111 116
.export 53 61 6� 61 73
Barite.import
25111051 �2 �7 55 �1
.export 5 � � 8 5
Graphite.import
250�30 �2 73 116 128
.export 56 68 87 85 101
Kaolin..import
250758 52 58 69 87
.export 9�2 1.026 1.1�0 65� 626
Clays.import
2508123 1�8 195 193 216
.export 358 382 557 525 �59
Bentonite.import
250810�6 �7 6� 71 70
.export 160 16� 199 211 20�
Feldspars.import
2529102� 22 2� 33 39
.export 123 135 1�2 161 129Glass.and.foundry.sand
.import250510
65 95 127 136 180.export 199 208 262 271 298
Limestones.import
2521122 90 97 �0 39
.export 85 52 67 62 70
Gypsum..import
25201020 20 �2 36 8�
.export 2� 25 27 12 19
Dimension.stone
.import 251�-66801-3
5�2 530 571 558 733
.export 60� 580 531 520 559
Crushed.stone.import
251710�0 36 133 136 1�9
.export �9 6� 56 80 133
Sand.and.gravel
.import 250590251710
7� 58 153 160 181
.export 55 67 60 83 1�5raw materials total
import 77 425 83 306 92 017 131 109 161 694
export 13 496 13 578 16 868 18 192 20 138
Notes:* In 1999 by Decree no. 1311 of December 13 the Czech government approved the paper „Surovinová
politika v oblasti nerostných surovin a jejich zdrojů“ (Raw material policy in sphere of minerals and their resources) which defines main principles and strategies in the sphere of minerals and their resources
** data for 2006 are preliminary according to the Czech Statistical Office information
Minerals in the Czech foreign trade

86
Export and import of other chosen raw materials in mill CZK
Raw.material Customs.tariff.code 2002 2003 200� 2005 2006*
Al-ores.and.concentrates
import2606
57 39 62 68 78export 2 3 1� 0 0
Alumina.oxide import 281820 270 256 303 300 315export 9 5 � 5 3
Alumina.hydroxide import 281830 100 105 98 98 71export 3 10 � 2 1
Ti-ores.and.concentrates
import261�
185 176 189 �21 �58export 2 � 13 6 9
Nb-,.Ta-,.V-.and.Zr-ores.and.concentrates
import2615
53 37 30 18 ��export 0 1 1 0 0
Coke import 270� 1.263 1.8�� �.358 2.295 2.786export 2.873 3.221 5.32� 6.005 �.628
Rock.salt import 2501 760 775 1.070 995 1.�68export 28 36 �1 �3 8�
Asbestos import 252� 5 7 13 0 0export 0 0 0 8 0
Magnesite import 251910 15 22 26 2� 1�export 0 10 8 10 1
Talc import 2526 73 80 73 71 78export 2 2 2 2 2
Perlite import 25301010 15 15 13 12 13export 2 1 1 2 0
Sulphurimport 2503
28021�6 205 232 217 237
export 19 23 2� 22 19
Sulphuric.acid. import 2807 3� 33 39 �8 53export �� 58 60 5� 70
Natural.phosphates import 2510 72 �9 51 63 85export 22 27 1 19 2�
Phosphorus.substances
import2809
190 1�6 105 170 1�8export 58 321 �21 657 6�1
Nitrogenous.fertilizers. import 3102 1.��5 1.387 1.815 2.0�0 2.195export 1.123 1.617 1.717 1.870 2.110
Phosphatic.fertilizers import 3103 52 �5 50 51 50export � � 6 15 9
Potassic.fertilizers import 310� 329 32� �76 �59 506export 1� 16 31 �� �8
Fertilizers.of.more.elements
import3105
633 597 772 709 71�export 25� 202 182 197 161
Quicklime import 2522 126 130 1�� 135 173export 263 303 272 2�� 238
Cement import 2523 1.522 1.9�8 1.953 1.921 1.907export 573 586 782 677 590
Totalimport 7 345 8 220 11 872 10 115 11 393export 5 295 6 450 8 908 9 882 8 638
Note: * data for 2006 are preliminary according to the Czech Statistical Office
Minerals in the Czech foreign trade

87
MINING aND NaTUrE prOTECTION
1,505 reserved and 728 non-reserved mineral deposits were registered in the Czech Re-public as of December 31, 2006. The number of exploited deposits was markedly lower – 508 reserved and 219 non-reserved. Only 42 reserved and 17 non-reserved deposits were mined in the specially nature protected areas, which represents 8.3 % and 7.8 % of the total number, respectively.
Act No 114/1992 Sb. on nature and landscape protection in its present wording regulates activities in specially protected areas (ZCHÚ) of the Czech Republic (national parks – NP (Národní park), protected landscape areas – CHKO (Chráněná krajinná oblast), national na-ture reserves, nature reserves, national nature monuments and nature monuments). According to this Act, all mineral mining (section 16) in national parks (with exception of crushed stone and sand mining for construction in the territory of the national park), in the first zone of pro-tected landscape areas (section 26) and in national nature reserves (section 29) is prohibited. Although the mining of mineral resources is not prohibited by law in other areas (2nd to 4th zone of the CHKO, nature reserves, national nature monuments and nature monuments), it is very difficult to obtain authorization. Legal regulations which mention prohibition of the “per-manent damage of the soil surface” are the main reason – and they practically exclude mineral mining. A further reason is the civil activity in the field of environmental protection.
Mineral deposits are mined, and were in the past mined, in the CHKO in majority of cases where the mining claims were already determined before these CHKO were established. Min-ing in the CHKO declined after 1989 till 2002, after it certain backset comes to, which follows from the data in the table “Mining of reserved and non-reserved mineral deposits in CHKO” and also from the fact that reserved deposits were mined in 17 from 25 CHKO in 2006 (see the table “Mining of reserved and non-reserved mineral deposits in individual CHKO”) compared to 18 from 25 CHKO in 2005.
Specially protected areas (ZCHÚ) in the Czech Republic
Amount/Year 2002 2003 200� 2005 2006
Total.number 2.151 2.170 2.202 2.210 2.217
national.parks.(NP) � � � � �
protected.landscape.areas.(CHKO) 2� 2� 2� 25 25
others 2.123 2.1�2 2.17� 2.181 2.188
Source: AOPK ČR (2006)
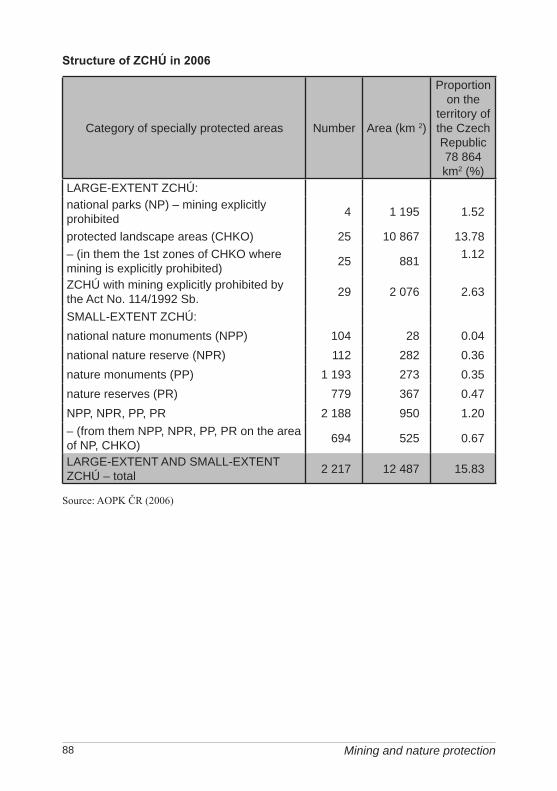
88
Structure of ZCHÚ in 2006
Category.of.specially.protected.areas Number Area.(km.2)
Proportion.on.the.
territory.of.the.Czech.Republic.78.86�.km2.(%)
LARGE-EXTENT.ZCHÚ:national.parks.(NP).–.mining.explicitly.prohibited � 1.195 1.52
protected.landscape.areas.(CHKO) 25 10.867 13.78–.(in.them.the.1st.zones.of.CHKO.where.mining.is.explicitly.prohibited) 25 881 1.12
ZCHÚ.with.mining.explicitly.prohibited.by.the.Act.No..11�/1992.Sb. 29 2.076 2.63
SMALL-EXTENT.ZCHÚ:national.nature.monuments.(NPP) 10� 28 0.0�national.nature.reserve.(NPR) 112 282 0.36nature.monuments.(PP) 1.193 273 0.35nature.reserves.(PR) 779 367 0.�7NPP,.NPR,.PP,.PR 2.188 950 1.20–.(from.them.NPP,.NPR,.PP,.PR.on.the.area.of.NP,.CHKO) 69� 525 0.67
LARGE-EXTENT.AND.SMALL-EXTENT.ZCHÚ.–.total 2.217 12.�87 15.83
Source: AOPK ČR (2006)
Mining and nature protection

89
Mining of reserved and non-reserved mineral deposits in CHKO, kt
Reserved.deposits Non-reserved.deposits
mineral 2002 2003 200� 2005 2006 2002 2003 200� 2005 2006
Gemstones 39 38 31 32 31 – – – – –Graphite � 0,5 0 0 0 – – – – –Bituminous.coal 25 0 0 0 0 – – – – –Crude.oil 0 1.2 1.5 1.1 0.9 – – – – –Natural.gas 2.6 3.1 3.0 �.9 1�.1 – – – – –Quartz.sand 0.1 0.� 0.� 0 0 – – – – –Feldspar 2�7 269 296 296 290 – – – – –Limestone 3.363 3.382 3.�27 3.096 3.111 – – – – –Dimension.stone 29 �3 37 37 39 1.5 �.5 3.8 2.8 3.6Crushed.stone 2.�85 3.0�0 2.797 3.171 3.739 109 63 �5 82 51Sand.and.gravel 1.812 1.7�0 1.755 1.6�9 1.737 1�3 89 91 81 116Brick.clay 70 63 31 99 0 0 0 � � 3.6Total 8.077 8.582 8.377 8.386 8.963 25� 157 1�3 169 17�Index,.1990=100 50 53 52 52 56 – – – – –Index,.2000=100 – – – – – 82 51 �6 55 57
Notes: • conversion to kt: natural gas (1,000,000 m3 = 1 kt), dimension and crushed stone (1,000m3 = 2.7
kt), sand and gravel and brick clays (1,000 m3 = 1.8 kt)• since 2002, mine production in deposits located within 1km zone outside the protected landscape
area (CHKO) is not included, i.e. the data represent the real mine production in the territory of the CHKO itself
Mining and nature protection

90
Mining of reserved and non-reserved mineral deposits in individual CHKO, kt
CHKO/year.* 2002 2003 200� 2005 2006
Beskydy.Mts. 35 �8 38 7� 68Bílé.Karpaty.Mts. �9 �0 21 28 28Blaník 0 0 0 0 0Blanský.les 582 600 583 �83 761Broumov.region 109 128 123 110 137České středohoří Mts. 1.198 1.�71 1.�00 1.736 1.876Český kras (Bohemian Karst) 3.2�5 3.�26 3.3�6 3.239 3.353Český les Mts. 0 0 0 0,2 0.2Český ráj 0 0 0 0 0Jeseníky.Mts. 97 119 135 105 173Jizerské.hory.Mts. 11 � 0 0 0Kokořín region 0 0 � � �Křivoklát region 271 312 269 27� 32�Labské.pískovce.(Elbe.sandstones) 0 0 0 0 0
Litovelské.Pomoraví.region 3�2 191 83 58 �9
Lužické hory Mts. 17 0 0 5 9Moravský.kras.(Moravian.Karst) 207 185 222 175 1�3
Orlické.hory.Mts. 0 0 0 0 0Pálava region 66 6� 71 0 0Poodří region 70 63 27 99 0Slavkovský.les.region 138 170 165 188 181Šumava.Mts. 19 38 30 57 70Třeboň region 1.�99 1.59� 1.737 1.713 1.813Žďárské vrchy Mts. �1 51 �9 38 68Železné hory Mts. 81 78 76 167 81Total.mine.production.(rounded) 8.077 8.582 8.377 8.5�5 9.138
* till 2004 only mine production of reserved deposits was given, starting from 2005 mine production both reserved and non-reserved deposits is stated
As far as the impact of mining on the area is concerned, the CHKO Český kras (Bohe-mian Karst – limestone mining) is especially unfavourably affected. The impact on some other CHKO, especially CHKO Třeboň region, Poodří, České středohoří Mts. and Blanský les, is still rather high (see Tab. “Impact of mining of reserved deposits in CHKO”).
Mining and nature protection

91
Impact of mining of reserved deposits in CHKO, t/km2 in a year(areas of CHKO as of December 31)
CHKO/year area.km2.in.2006 2002 2003 200� 2005 2006
Beskydy.Mts. 1.160 29 �0 32 62 59Bílé.Karpaty.Mts. 715 66 5� 28 38 39Blaník �0 0 0 0 0 0Blanský.les 212 2.6�7 2.729 2.653 2.199 3.592Broumov.region �10 252 296 286 233 33�České středohoří Mts. 1.070 1.122 1.378 1.311 1.626 1.753Český kras (Bohemian Karst) 132 24 536 25 905 25 301 24 495 25 402
Český les Mts. �73 0 0 0 0 0Český ráj 182 0 0 0 0 0Jeseníky.Mts. 7�0 131 160 182 1�2 23�Jizerské.hory.Mts. 350 29 12 0 0 0Kokořín region 270 0 0 13 13 13Křivoklát region 630 �3� �98 �30 �39 51�Labské.pískovce.(Elbe.sandstones) 2�5 0 0 0 0 0
Litovelské.Pomoraví 96 3.666 2.0�5 887 617 506Lužické hory Mts. 270 6� 0 0 19 3�Moravský.kras.(Moravian.Karst) 92 2.270 2.032 2.�37 1.918 1.559
Orlické.hory.Mts. 200 0 0 0 0 0Pálava region 70 773 750 832 0 0Poodří region 82 871 781 335 1.228 0Slavkovský.les. 6�0 225 278 269 307 283Šumava.Mts..(CHKO.+.NP) 168� 11 23 18 3� �2Třeboň region 700 2.180 2.318 2.526 2.�92 2.589Žďárské vrchy Mts. 715 57 72 69 53 95Železné hory Mts. 380 283 273 26� 585 213TOTAL(total.mining/total.area) 10.867 697 7�1 723 738 8�1
Note: an impact exceeding 10,000 t/km2 in a year is concerned critical
The area of mining claims was 589 km2 as of December 31, 2006. From this area re-served and non-reserved deposits took 577 km2 and 12 km2, respectively. Manifestations of mining and mining-related activities could be found on additional 148 km2, respectively 5 km2 outside the mining leases. Mining affected 742 km2 in total, i.e. 0.94 % of the ter-
Mining and nature protection

92
ritory of the Czech Republic, where mining still continues or was already terminated, but reclamation after mining has not been completed yet.
As well as the Act No 114/1992 Sb. on nature and landscape protection, Act No 100/2001 Sb. on environmental impact assessment and the Decree of the MŽP No 175/2006 Sb. (for-merly 395/1992 Sb.), by which some provisions of the Act No. 114/1992 Sb. are applied, have a fundamental influence on permission for exploration and mining.
The Mining Act No. 44/1988 Sb. obliges the mining companies by its section 31 to reclaim the areas with mining impacts and to create financial means for this reclamation. These are considered as mining costs from the viewpoint of the profit tax. Table “Develop-ment of reclamations after mining” shows that the areas with mining impact decreased and those reclaimed increased in 2002–2006.
Methods of reclamation are shown in another table below.
Development of reclamations after mining
km2 2002 2003 200� 2005 2006
Res
erve
d.de
posi
ts
Area.with.manifestation.of.mining,.not.yet.reclaimed 806 806 822 760 697
Reclamations.in.process 91 95 111 96 110Reclamations finished since the start.of.mining 155 160 169 170 178
Reclamations finished in the given year 6 � � 9 11
Non
-res
erve
d.de
posi
ts
Area.with.manifestation.of.mining,.not.yet.reclaimed 12 1� 16 16 17
Reclamations.in.process. 2 3 3 3 3Reclamations finished since the start.of.mining 1 2 2 2 2
Reclamations finished in the given year 0.3 0.7 0.6 0.5 0.5
Mining and nature protection

93
rec
lam
atio
n af
ter m
inin
g of
rese
rved
min
eral
s in
200
6(r
anke
d ac
cord
ing
to re
gion
s and
way
of r
ecla
mat
ion;
DP
= m
inin
g cl
aim
(in
= w
ithin
, out
= o
utsi
de),
area
s in
hect
ares
(1 k
m2 =
100
ha))
r
ecla
mat
ions
in p
roce
ss R
ecla
mat
ions
fini
shed
reg
ion
agric
ultu
ral
.fore
st.w
ater
.oth
er.a
gric
ultu
ral
.fore
st.w
ater
.oth
er
in
Dp
out
Dp
in D
pou
t D
pin
Dp
out
Dp
in D
pou
t D
pin
Dp
out
Dp
in D
pou
t D
pin
Dp
out
Dp
in D
pou
t D
pP
ragu
e1
00
00
01
32
10
00
00
�C
entra
l.Boh
emia
201
01�
611
520
111
539
869
�88
138
2332
16S
outh
.Boh
emia
100
370
�0
130
7055
1��
227
50
291
Plz
eň12
526
00
033
036
3636
613
00
0K
arlo
vy.V
ary
101
8870
31.
189
�98
139
3223
61.
07�
657
1.16
626
581�
018
Úst
í61
228
�1.
677
1.�0
838
2189
967
187
62.
002
1.�1
72.
765
3�1
209
306
1.22
7Li
bere
c33
069
2�0
00
065
�515
510
50
00
Hra
dec
Krá
lové
310
�95
20
120
627
89�
5739
61�
Par
dubi
ce8
022
7�0
02
2�7
01
71
08
2Vy
soči
na0
01
00
05
00
030
50
02
2S
outh
.Mor
avia
1�2
1256
03
037
950
130
1�9
76
021
8O
lom
ouc
172
7557
830
10
2��7
63
�80
85
Zlín
270
10
50
20
785�
310
128
698
�M
orav
ia.a
nd.
Sile
sia
699
71�
3720
30
13�
1598
535
528
361�
52
123
10
ČR
in to
tal
1 26
239
83
576
2 73
892
822
1 28
973
83
378
3 45
53
290
4 07
11
173
337
772
1 31
1
Mining and nature protection

9� Mining and nature protection

95
Mining of minerals influences the environment, changes the character of the landscape, and alters ecological conditions for flora and fauna. In some areas mining activities can lasts several human generations. This way the impact of mining persist and a more permanent new arrangement of natural conditions and relationships in its area is not quickly evident. The new arrangement can be equal to or even better than the original one, of course on a different level. Examples include artificial lakes formed e.g. in south Bohemia by sand and gravel mining, constructions and sport grounds in former quarries or specially protected na-ture areas proclaimed paradoxically in the territory of former quarries, and also 35 hectares of new vineyards planted as agricultural reclamation of one of closed brown coal mines in the north of Bohemia in the Most wine region. They represent by their area almost 6.5 % of the total 550 hectares of productive vineyards of the Czech wine region.
Mining and nature protection


GEOlOGy aND MINEralS

98
Geological evolution of the area of the Czech Republic
Arnošt Dudek
The Czech Republic is located in the very centre of Europe at the limit between the Hercynian Meso-Europe and the Neo-Europe (Fig. 1). There is hardly any country with such a variegated geological structure in such a small area and with such a complex geo-logical evolution. Practically all known rocks and the majority of geological formations and known types of ores and industrial minerals occur on the state territory. Even though most ore deposits are interesting mainly from a scientific and mineral collectors’ point of view, a number were of European importance during the Middle Ages and the beginning of modern time. The interesting and complex history of this area attracted attention of re-searchers already in early times and it strongly influenced the evolution of the mining and geological sciences. It was on this territory where one of the oldest mining laws, the Jihlava Mining Law (1260), and slightly later the mining law of the King Wenceslas II “Ius regale montanorum” (1300), which became basis of many mining laws in other states of the world especially in South America, came into being. The origin of the world-known works of Georgius Agricola, especially his book “Bermannus sive de re metallica dialogus” (1530), is also linked to the territory of the Bohemian Massif.
Three main structural complexes form the geological structure of Czech territory. The oldest one, consolidated already during the Precambrian orogenies, is Brunovistulicum, taking basically the area of Moravia. This segment of the Earth’s crust probably represents an extremity of the East European platform, even though some researchers consider it as a part of the African plate. The influence of the younger – Paleozoic and Alpine – orogenies was only minor and it served as a foreland of the nappe structures which were thrust over it. The Hercynian-consolidated Bohemian Massif, overlapping to the area of the neigh-bouring Austria, Germany and Poland in the south, west and north, forms the major part of the state territory. Bohemian Massif belongs to the Paleo-Europe. The Hercynian orogeny in the end of the Carboniferous put the finishing touches on it, even though it also contains older building elements. It already behaved as a consolidated block after the Hercynian orogeny, only sometimes flooded by epi-continental sea and affected only by fault tecton-ics. As a crustal block rising from young sedimentary formations, it broke up only during the younger mountain-building processes, morphologically only in the end of the Neogene and in the Quaternary. Geological continuation of the Hercynides towards the west is indi-cated by other crustal blocks which were created later - Schwarzwald, Vosges Mountains, the French Massif Central and Iberian Meseta, in the northern branch then the Armorican Massif and massifs in southern England and Ireland. The eastern margin of the Bohemian Massif was thrust over the Cadomian unit of the Brunovistulicum during the Hercynian orogeny. The Outer Flysh Carpathians – part of the Alpine-Carpathian orogeny (the Alpi-des), formed mainly by the Mesozoic and Tertiary mountain-building processes – extend to the eastern part of the Czech state. Horizontal nappes thrust over the Brunovistulian base-ment and its sedimentary cover over a distance of tens of kilometres only in the Neogene are characteristic of this unit.
Geology and minerals

99
Fig. 1. Geological position of the Czech Republic in Europe
Geological evolution of the area of the Czech Republic
100
As in the study of the history of mankind, there is little information on the oldest peri-ods of the evolution of the Earth we live on, and our findings are accompanied by a large number of uncertainties. This of course applies also for the Czech territory, even though it belongs to the areas where systematic geological research was in progress since the begin-ning of the 19th century.
Complexes of the Brunovistulicum crop out on the surface only in the western Moravia, but they reach far to the east below the overthrust nappes of the Outer Flysh Carpathians. They are formed by metamorphic rocks – mainly monotonous biotite paragneisses – which were altered during the Proterozoic orogenies, and intruded by huge massifs of abyssal magmatic rocks of about 550 Ma age at the boundary between the Proterozoic and Paleo-zoic. The Brno and Dyje Massifs represent the exposures of these rocks. Granitoid plutons covering large areas as well as smaller basic massifs of gabbros and norites compacted this unit and prevented its later reworking by younger mountain-building processes, which formed the Bohemian Massif. Western parts of the Brunovistulicum are built by variegated volcano-sedimentary complexes (involving limestones, graphitic rocks, quartzites, amphib-olites and orthogneisses). These parts were strongly affected by the Hercynian tectonometa-morphic processes. They crop out from beneath of the overthrust Hercynian complexes of the Moldanubicum and Lugicum in tectonic windows of the Dyje and Svratka Domes of the Moravicum and Desná Dome of the Silesicum. Their appurtenance to the Brunovistulicum has not been commonly accepted yet and these units are by some authors ranked to the Lower Paleozoic and to the Hercynian Bohemian Massif. Platform sediments – the Cambri-an conglomerates and sandstones in limited areas, marine Silurian shales sporadically and extensive and important sediments of the Devonian, Lower Carboniferous and continental sediments of the coal-bearing Upper Carboniferous – are deposited on the Cadomian base-ment. The younger platform cover is represented by sediments of the Jurassic, Cretaceous, Paleogene and the Neogene of the Carpathian Foredeep. This consolidated basement was overthrust by nappes of the Outer Flysh Carpathians from the east (Fig. 2).
The lower level (basement) of the Bohemian Massif – the epi-Variscan platform – is built by metamorphic rocks intruded by numerous and very large granitoids massifs, and by only weakly metamorphosed or unmetamorphosed but Hercynian-folded Lower Paleozoic. Re-gionally it is divided (Fig. 3) into the core, formed by the highly metamorphosed Moldanu-bicum and mostly only weakly metamorphosed Bohemicum. This core is rimmed by the Saxothuringicum (Krušné hory Mts.) on the NW, Lugicum (Krkonoše Mts., Orlické hory Mts., Králický Sněžník) on the north and Moravo-Silesicum (Jeseníky Mts., eastern part of the Českomoravská vrchovina Highlands) on the east (see Fig. 3). These marginal com-plexes are metamorphosed mostly less intensively than the central Moldanubicum.
The Moldanubicum is formed by rocks metamorphosed mainly in the amphibolite facies – sillimanite and cordierite gneisses and migmatites with intercalations of orthogneisses, marbles, quartzites, graphitic rocks and amphibolites. Bodies of high-temperature and high-pressure metamorphic rocks – granulites and garnet peridotites with eclogites – are numerous, too. Their occurrences mark course of old tectonic zones, along which these rocks were exhumed from depth. They are exposed mainly in southern Bohemia (Blanský les, Prachatice, Křišťanov and Lišov granulite massifs) and western Moravia (Bory and Náměšť granulite massifs). The age of the protolith of Moldanubian complexes is prob-ably Upper Proterozoic; their metamorphism under the amphibolite, granulite and eclogite facies conditions is linked to the Hercynian orogeny. Pre-Paleozoic, Cadomian metamor-
Geology and minerals
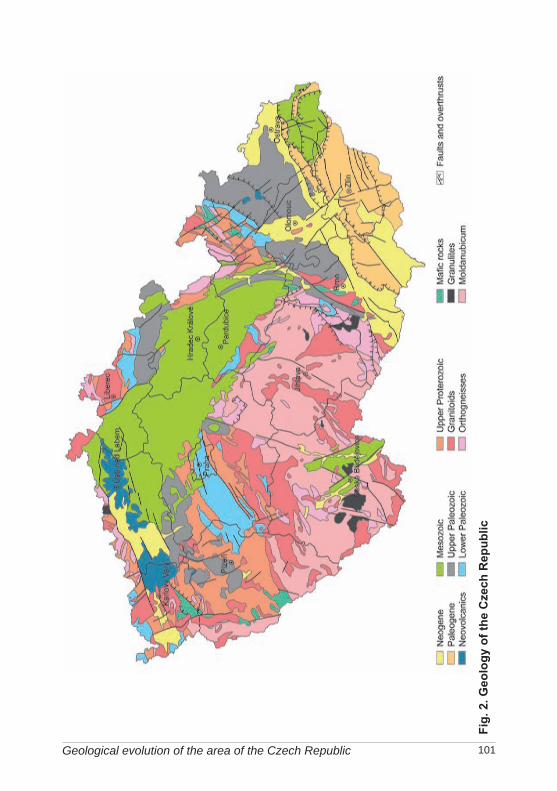
101
Fig.
2. G
eolo
gy o
f the
Cze
ch R
epub
lic
Geological evolution of the area of the Czech Republic
102
phism of regional extent, mostly overprinted by the Hercynian processes, is nevertheless documented. Minor bodies of old orthogneisses exhumed along deep-reaching faults in the southern Bohemia, the radiometric age of which is even 2.1 Ga, represent a single excep-tion. They document the existence of the Lower Proterozoic in the deeper crustal structure of the Bohemian Massif. Some Moldanubian rocks, especially gneisses, granulites and am-phibolites, represent common resources of building stone.
The metamorphic rock complexes of the central Bohemian Bohemicum as well as the marginal complexes of the Saxothuringicum, Lugicum and Moravo-Silesicum developed by regional metamorphism of mainly Upper Proterozoic protoliths (1,000–545 Ma). Dur-ing this period, the area of today’s Bohemian Massif was covered by a deep sea, in which sandy and clayey rocks were deposited. Surrounding continents, probably rather distant in the mainland formed by very old rocks, represented the source area of the deposited mate-rial. Some clastic minerals from metamorphic rocks of the southern Bohemia (up to 2.7 Ga old, in the neighbouring Bavaria even 3.8 Ga) were at least in part derived from the Archaic of the African shield. They were of course deposited much later. The sedimentation was accompanied by submarine volcanism of tholeiitic basalts, which formed linear structures tens of kilometres long, maybe in some cases standing out above the sea level (island arcs) as well as much less extensive acid volcanism. The volcanic activity was accompanied by deposition of black shales with abundant pyrite and of siliceous sediments – lydites. Finely banded structures resembling organogenic stromatolites, which would belong to the old-est organic remnants on the Czech territory, were found rarely in the latter. A set of these sediments and volcanic rocks was intensively folded and mostly also metamorphosed in the end of the Proterozoic. Very weakly metamorphosed Proterozoic rocks are nowadays exposed only in central Bohemia between Prague and Plzeň (in the so-called Barrandian). The intensity of their alteration increases towards the marginal mountains. A continuous succession of thin metamorphic zones of Barrovian type up to gneisses with kyanite and sillimanite developed especially towards the W and SW. Proterozoic rocks are altered into gneisses and amphibolites also in the Krušné hory Mts., Krkonoše Mts., Orlické hory Mts. and Hrubý Jeseník Mts. These complexes were intruded by numerous massifs of granites (especially Stod, Čistá-Jesenice and Lužice massifs) and gabbros (Kdyně and Poběžovice massifs) in the end of the tectonometamorphic processes especially in the western and northern Bohemia. The Pre-Paleozoic Cadomian orogeny represents one of the most im-portant magmatogennic and tectonometamorphic processes in the evolution of the Bohe-mian Massif.
The Earth’s crust in Czech territory was not completely solid after the Cadomian orogeny and it gradually broke into a number of smaller blocks, which moved away from each other and were partly flooded by sea again during the Lower Paleozoic (Cambrian, Ordovician, Silurian, Devonian to Lower Carboniferous). Unaltered sediments were preserved especial-ly in central Bohemia, in the area between Prague and Plzeň (Pilsen), named Barrandian, to a lesser extent also in other parts of the Bohemian Massif. In its marginal parts (excluding Brunovistulicum), Paleozoic complexes experienced strong metamorphism and therefore their identification and dating is commonly very difficult. In the Barrandian, sedimentation started already in the Lower Cambrian, represented by a formation of conglomerates and sandstones up to several hundred to thousand meters thick. Sporadic occurrences of shales of fresh-water or brackish origin, in which the oldest fossils of arthropods in Bohemia were found, are known here. Sea penetrated to central Bohemia in the Middle Cambrian and deposited sandstones and especially shales, which are world-known for their occurrences
Geology and minerals

103
Fig.
3. R
egio
nal b
asem
ent d
ivis
ion
of th
e B
ohem
ian
Mas
sif o
n th
e te
rrito
ry o
f the
Cze
ch R
epub
lic
Geological evolution of the area of the Czech Republic

10�
of trilobite fauna. The evolution of the Cambrian was terminated by extensive rhyolites and andesite terrestrial volcanism.
The Ordovician started by the sea again transgressing in central Bohemia and by the formation of the so-called Prague Basin, the evolution of which continued until the Mid-dle Devonian. The Ordovician rocks are represented mainly by clastic sediments, mostly various types of shales with thick quartzite intercalations), the deposition of which was ac-companied by intensive basaltic volcanism. Deposits of sedimentary iron ores (e.g. Nučice, Ejpovice etc.) which were of a high importance in the 19th and beginning of the 20th century originated in relation to the volcanic activity. The Bohemian Massif was located close to the southern polar circle in the Ordovician and sedimentation of rocks as well as volcanic activity proceeded in the sub-polar climate. This crustal segment moved rather rapidly to the north, into warmer waters of the tropic of Capricorn in the end of the Ordovician.
The change of the climate and by this also conditions of development of organisms and sedimentation during the Silurian resulted in formation of fine-grained black shales with abundant graptolite fauna, accompanied also by intensive volcanic activity and intrusions of numerous diabase sills. Mass development of organisms with carbonate shells occurred in its upper parts with regard to the increasing temperature and massive limestone forma-tions were formed.
Continuous carbonate sedimentation in the Prague Basin lasted until the Devonian, whereas in the surrounding parts of Europe as well as more distant areas the rock deposition was interrupted by the Caledonian orogeny. Gradual unaffected evolution of both the sedi-ments and organisms and their long-lasting detailed study by several generations of Czech paleontologists was a prerequisite for the determination of the first, globally valid strato-type between two systems (Silurian and Devonian) in Klonk u Suchomast SW of Prague. The limestone sedimentation in the Prague Basin terminated in the Middle Devonian and sandstones with terrestrial flora ended the Devonian sedimentation in this area.
Sedimentation of the Devonian rocks continued in the Upper Devonian only in the area of the Krkonoše Mts. (on Ještěd Mt.) and especially in Moravia in the Jeseníky Mts. and in the Moravian Karst. Evolution of the Devonian in Moravia differed from that on the Bohe-mian territory. Transgressive complex of the siliciclastic and volcanic rocks with stratiform deposits of Fe, Cu, Au, Zn and Pb overlie the old Brunovistulian basement in its western, more mobile part. This clastic sedimentation continues also in the Lower Carboniferous. The Devonian rocks on the more stable Brunovistulian basement in the south and east be-gin by clastic rocks, which in places reach over 1,000 m in thickness. Limestones appear only in the Upper Devonian and their evolution continues until the Lower Carboniferous. There is therefore no manifestation that the sedimentation was interrupted by the Hercynian orogeny in Moravia. Sedimentation spaces just moved to the east to Ostrava region and to today’s Carpathian basement. Limestones of the Upper Devonian form important deposits especially in central Moravia (e.g. Mokrá, Líšeň, Hranice etc.).
A change in the character of the sedimentation in the end of the Devonian is an expres-sion the Hercynian orogeny, which affected (about 340–310 Ma ago) the majority of the Czech lands with a high intensity and expressed itself by development of the nappe struc-ture and very strong metamorphism of large areas. Even the crystalline complexes formed during the Cadomian orogeny were metamorphosed again. Vast massifs of granitoid mag-matic rocks of several thousand km2 extent, not yet completely uncovered by denudation, formed practically simultaneously. Their intrusions were accompanied also by extensive
Geology and minerals

105
Fig.
4. C
arbo
nife
rous
and
per
mia
n in
the
Boh
emia
n M
assi
f and
in th
e ba
sem
ent o
f the
Wes
tern
Car
path
ians
on
the
terr
itory
of t
he C
zech
Rep
ublic
Geological evolution of the area of the Czech Republic
106
surface volcanic activity and the development of very numerous deposits of variable genet-ic types (e.g. Krušné Hory Mts. massifs and Sn, W, Li, Ag, U, Co, Ni mineralization in the Saxothuringicum or Central Bohemian and Moldanubian Plutons in the Moldanubicum and Au, Sb, Ag, Pb, Zn, U mineralization). Granitoid massifs represent an important resource of building and dimension stone as well as feldspar raw materials. Weathered crusts of grani-toids (e.g. Krušné hory Mts. massifs, Dyje Massif) are an important source of kaolin, too.
There are two different types of the Carboniferous and its rocks in the Bohemian Massif as a result of the Hercynian orogeny. The Lower Carboniferous is missing in Bohemia and sedimentation of the continental type begins in the intra-mountain basins only in the Upper Carboniferous (Westphalian) and continues in the Permian. Basins with partly individual evolution extend in the Plzeň (Pilsen) surroundings towards the south and southwest as far as the Broumov area in the SE tip of the Czech Republic (Fig. 4), where their stratigraphic extent is the largest and the sedimentation finishes as late as the Lower Triasic. They are to a large extent overlain by sediments of the Bohemian Cretaceous Basin. River and lake deposits – conglomerates, arkoses and shales with layers of tuffs and tuffites – are in many places accompanied also by formation of coal seams, which were and still are of a high economic importance. Some seams show an elevated U content making them even potential deposits. The Carboniferous arkoses in the Plzeň (Pilsen) and Podbořany regions gave rise to important deposits of kaolin. Carboniferous mainly refractory clay and claystone are important, too. The Bohemian Massif reached the equator on its way to the north and coal formation reflects the dominating tropical climate.
In Moravosilesian area, which was just weakly influenced by the Hercynian orogeny thanks to the solid Brunovistulian basement, the Devonian sedimentation was continuous until the Lower Carboniferous, when the formation of limestones terminated. It was fol-lowed by flyshoid sedimentation of conglomerates, greywackes and shales in multiple al-ternation of individual layers (Culm development). The Lower Carboniferous greywackes represent a resource of a high-quality building stone. Depositional environment gradually changed from marine to fresh-water during the Upper Carboniferous and important depos-its of hard coal (paralic basins of the Ostrava region) formed in the coastal marshes. The Czech part of the Upper Silesian Basin represents the most important hard coal mining district in the Czech Republic. The Carboniferous system in the Czech Republic was and remains not only an important energy base of the state but also a world-known classical area of Carboniferous flora and fauna.
The Hercynian mountains were rapidly lowered by erosion and denudation in the Per-mian, and thick formations of red-brown conglomerates, sandstones, arkoses and shales formed. Sedimentation was accompanied also by basaltoid volcanism of the intra-plate type and sedimentation of clastic rocks with elevated Cu content. A substantial change of climate, caused by the shift of the lithospheric plate with the Bohemian Massif further north, into the belt between the equator and tropic of Cancer, resulted in the formation of deserts, which covered most of Europe. These sediments are today preserved in the Bo-hemian Massif only in relics. They reach the highest thickness – up to 3 km – in tectonic troughs of roughly N-S direction, so-called grabens (Boskovice and Blanice Graben). Coal seams (today already mined out) occur locally on the basis of the Permian in these grabens and higher horizons contain restricted lake and river calcareous sediments. These are com-monly overfilled by relics of stegocephalians and especially of the Permian insects, which made the Boskovice Graben famous.
Geology and minerals

107
Fig.
5. U
pper
Cre
tace
ous
in th
e B
ohem
ian
Mas
sif o
n th
e te
rrito
ry o
f the
Cze
ch R
epub
lic
Geological evolution of the area of the Czech Republic

108
The Bohemian Massif was slowly uplifted as a compact block after the Hercynian con-solidation and it remained mainly land almost until present time. White lake sandstones of the Triassic are represented only to minor extent in NW Bohemia in the Krkonoše Mts. Piedmont and Intra-Sudetic Basins. Sea penetrated from the Carpathian area to northern Germany by a narrow channel across northern Bohemia (roughly between Brno and Dres-den) in the uppermost Jurassic. This channel linked the deep Tethys on the SE with the shallow shelf sea to the north from the Bohemian Massif. Limestones (Oxfordian–Kim-meridgian) are exposed only in small islands along the Lužice Fault. Transgression of the Upper Cretaceous sea, which flooded all the northern and partly also the central part of the Bohemian Massif, was of much higher importance. Several hundreds meters thick strata of the Upper Cretaceous claystones, marlites, sandy marlites and sandstones (the Bohemian Cretaceous Basin – Fig. 5) developed there. The Bohemian Cretaceous Basin is divided ito facies areas (developments) shown in Fig. 5 based on character of sedimentation in particular parts of the Basin. Rock complexes of the Basin represent the most important underground water reservoir in the Czech Republic and also an important raw material re-source (ceramic and refractory clay, glass, foundry and mortar sand, cement raw materials, building and sculpture stone but also uranium). Smaller, but fresh-water Upper Cretaceous basins formed also in southern Bohemia. It is the České Budějovice Basin localized more westward and the Třeboň Basin localized more eastward.
The evolution in Moravia was different. The Triassic is not represented at all, whereas in the Jurassic the sea penetrated from the Mediterranean area far to the NW and flooded the eastern margin of the Bohemian Massif. Jurassic sediments are nowadays to a large extent covered by rocks of the Neogene or the Outer Flysh Carpathian nappes. Tectonic blocks of the Jurassic limestones, exhumed from depth in front of the Carpathian nappes and form-ing isolated klippen by Štramberk and in the Pavlovské vrchy Hills, represent an important land-forming element and also an important resource of very pure carbonate raw material.
The character of the sedimentation in the Outer Carpathians markedly changed in the Cretaceous. Sediments formed in deeper sea from submarine slides and turbidite currents, transporting clastic material far from the land. They are characterized by multiple alterna-tions of sandy and clayey layers of a low thickness (dm to m) and infrequently also sandstone benches, which are collectively called flysh. The sediments reach even many thousand meters in thickness. The flysh sedimentation continued in this area also in the Paleogene (Fig. 6).
The Bohemian Massif remained land which was only occasionally flooded in the east by shallow epicontinental sea from the Carpathian area. Nevertheless, several depressions with intensive freshwater sedimentation were formed as a result of strong tectonic move-ments in the Alpine and Carpathian space in the end of the Paleogene and in the Neogene. This is the area of the South Bohemian basins (the České Budějovice Basin and the Třeboň Basin) with lignite, clay and diatomite deposits and also a marked tectonic trough of the SSW-NNE direction (Ohře Rift) in north-western Bohemia, where the Krušné Hory Pied-mont basins (Cheb, Sokolov, North Bohemian and Zittau) formed – see Fig. 6. Sandstones and especially clays and claystones with thick (locally up to 60 m) brown coal seams sedi-mented in these basins. Brown coal deposits in the North Bohemian and Sokolov basins represent the most important brown coal deposits in the Czech Republic. Important deposits of Neogene clays then occur in the Cheb Basin. Formation of basins was accompanied by very intensive volcanic activity and a large accumulation of lavas and pyroclastics (the Doupov Hills Volcanic Complex, České středohoří). The rocks are mainly various types of
Geology and minerals

109
Fig.
6. T
ertia
ry in
the
Boh
emia
n M
assi
f and
Wes
tern
Car
path
ians
on
the
terr
itory
of t
he C
zech
Rep
ublic
Geological evolution of the area of the Czech Republic

110
olivine basalts and alkaline basaltic rocks, to lesser extent also more acid phonolites. Vol-canic conduits and necks give today’s landscape a beautiful character. The main volcanic activity took place 35–17 Ma ago, a younger phase 8 Ma ago and the last minor volcanoes are just several thousand years old (Komorní and Železná hůrka). The area represents a classical example of alkaline volcanism and it played an important role in the evolution of geosciences. The rocks are important not only as a building stone but also as a raw material for manufacture of molten basalt products. Deposits of the Bohemian garnets at the south-ern margin of České středohoří are related to the volcanic activity, too (pyropes were car-ried up by volcanic necks from the ultrabasic rocks in the crystalline basement). Weathering and decomposition of tuffs of the Doupovské hory and České středohoří Mts. resulted in the formation of important bentonite deposits.
The flysh complexes of the Carpathian area were folded and thrust in the form of nappes (verified by exploration) over a distance of several tens of kilometres towards the west and southwest over the Bohemian Massif in the end of the Paleogene. The Carpathian Fore-deep, partly still covered by the arriving nappes, formed in front of the thrust nappes in the Neogene (Miocene). The sediments of the Vienna Basin (of up to 5 km in thickness) were subsequently hardly folded. These are represented mainly by marine clay, marl and sand, just partially diagenetically consolidated, which contain smaller deposits of oil and gas. The depositional setting of the younger formations became progressively fresh-water. The youngest ones contain deposits of lignite.
Important tectonic processes expressing themselves by marked vertical movements of individual crustal segments operated in the Bohemian Massif in the end of the Tertiary and beginning of the Quaternary. In this way, the marginal mountains – Šumava Mts., Český les Mts., Krušné hory Mts., Krkonoše Mts., Orlické hory Mts. as well as Hrubý Jeseník Mts. – were uplifted by up to 1,000 m and the Bohemian basin was formed. This is sometimes considered as being formed by the impact of a large meteorite, but this is a nonsense re-sulting from the interpretation of satellite images without knowledge of the real structure of the massif. The Bohemian Massif was influenced by several phases of continental and mountain glaciations during the Quaternary. A periglacial climate dominated here, which resulted in the formation of massive stony debris and block-seas, terrace system of the rivers (Fig. 7) as well as really extensive loesses. Terrace sediments of rivers especially form important deposits of sand and gravel and feldspar raw materials, and loesses of brick clays. The continental ice sheet reached as far as the northern margin of the massif and left sediments of frontal moraines in the Ostrava region, on the northern piedmont of the Hrubý Jeseník Mts. and in the Šluknov and Frýdlant extremities. Mountain glaciers modified mor-phology of the marginal mountains, especially the Krkonoše Mts., to a lesser extent also the Jeseníky Mts. and Šumava Mts., where even minor glacier lakes formed.
Figures in this chapter were adapted by the author from: Dudek, A., Svoboda, J. (1968): Geological position of Czechoslovakia in Europe. – IGC
Praha; Geologie České republiky, postcard – ČGÚ; Mísař, Z., Dudek, A., Havlena, V., Weiss, J.(1983): Geologie ČSSR. I. Český masiv. – SPN
Praha; Zpráva československé stratigrafické komise (1992): Regionálně geologické dělení Českého
masivu na území České republiky. – Časopis min. geol., 37, 257–276, Praha.
Geology and minerals
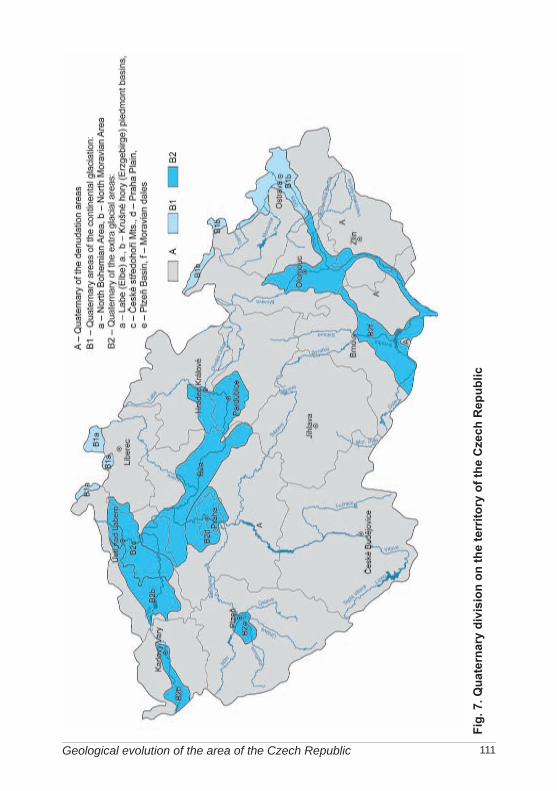
111
Fig.
7. Q
uate
rnar
y di
visi
on o
n th
e te
rrito
ry o
f the
Cze
ch R
epub
lic
Geological evolution of the area of the Czech Republic
112
regional geological terms
(used in sub-chapter 2. Mineral resources of the Czech Republic of the following chapters of the Summaries dealing with individual minerals)Arnošt Dudek
Bíteš orthogneiss – mostly muscovitic orthogneiss of the Cadomian age, characteristic of the Moravicum of the Dyje and Svratka domes between Krems in Austria and Svojanov in the Czech Republic (kaolin, crushed stone)
Blanice Graben – fault system of the NNE-SSW direction in central and southern Bohe-mia, marked also by downthrown islands of the uppermost Carboniferous and Permian with bituminous coal seams. It continues as Rodel line in Austria (Au-Ag-ores)
Bohemian Cretaceous Basin – sediments of the Upper Cretaceous (Cenomanian to San-tonian), overlying crystalline rocks in the northern part of the Bohemian Massif. Based on the lithological character, it has been regionally classified into facial developments as follows:
– Lužice (U-Zr-ores, glass and foundry sand)– Jizera (glass and foundry sand, dimension stone) – Orlice-Žďár (foundry sand) and its east Bohemian (clays) and Moravian parts (clay)– Ohře (Eger) – the Most, Teplice (quartzite, corrective additives for cement production)
and Louny part (clay) – Vltava-Beroun including Prague surroundings (clay, dimension stone)
Boskovice Graben – tectonic trench of the NNE-SSW direction in western Moravia filled with sediments of the uppermost Carboniferous and Permian (bituminous coal)
Bory granulite massif – a small granulite body in the Moldanubicum N of Velké Meziříčí in western Moravia (feldspar, crushed stone)
Brno Massif – a large massif in western Moravia built by a variable series of both acid and basic plutonic rocks of the Cadomian age (feldspar, crushed stone)
Carpathian Flysh – a part of the Outer Carpathians in eastern Moravia built by clayey and sandy Cretaceous and Paleogene sediments, with a marked nappe structure of the pre-Mi-ocene age. It composes the Chřiby Mts. and the Ždánice Forest and mountain ranges on the border with Slovakia – the Beskydy, Javorníky and Bílé Karpaty Mts. (natural gas)
Carpathian Foredeep – the external part of the Carpathian mountain chain in eastern Mora-via, which was formed in front of the Outer Carpathian nappes and overlies the south-eastern slope of the Bohemian Massif. It is filled with the Miocene sediments of the Egerian to Badenian (oil, natural gas, clay, bentonite, gypsum in the Opava Basin)
Geology and minerals

113
Central Bohemian Pluton – an extensive Hercynian granitoids pluton on the border be-tween Bohemicum and Moldanubicum, more basic than the massifs of the Krušné hory Mts. and in Českomoravská vrchovina Highlands (granodiorites, tonalite, diorite). Im-portant deposits in the exocontact (U, Au, Ag-Pb-Zn-ores, feldspar, quartz, dimension and building stone)
Cheb Basin – the westernmost of the Tertiary basins, at the crossing of the Ohře rift and the Tachov Furrow. Sedimentation continued until Oligocene (brown coal, kaolin, clay, diatomite, glass and foundry sand – numerous conflicts of interest)
České Budějovice Basin – a smaller, western South Bohemian basin, filled with fresh-wa-ter sediments of the Upper Cretaceous and to a minor extent Neogene and Quaternary. Episodic ingressions of the sea from the Alpine foredeep (lignite, tectites, diatomite, sand and gravel)
České středohoří Mts. – a classical area of the Tertiary alkaline volcanic rocks (olivine basalts to phonolites) exposed in the Ohře (Eger) rift between Chomutov and Nový Bor, with the main volcanic centre in Roztoky nad Labem (pyrope, diatomite, feldspar sub-stitutes, crushed stone)
Čistá-Jesenice Massif – a minor granitoid massif in western Bohemia composed of both Cadomian and Hercynian bodies. It is covered from a large part by Carboniferous and Permian sediments (feldspar, dimension and building stone)
Domažlice Crystalline Complex – south-western part of the upper Proterozoic of the Bohe-micum in the Šumava piedmont, metamorphosed during both Cadomian and Hercynian orogeny, with minor massifs of granitoids and gabbroic rocks and abundant pegmatites (feldspar)
Doupov Mts. – a volcanic complex of the Tertiary age at the crossing of the Ohře rift with the Jáchymov fault, between Karlovy Vary and Kadaň. Alkaline volcanites are repre-sented mainly by olivine basalt, “leucitic” tephrite and abundant tuffs. Phonolites are missing (bentonite, crushed stone)
Dyje Massif – a massif of the Cadomian granitoids in the Dyje Dome of the Moravicum in SW Moravia, extending from the northern vicinity of Znojmo almost to Danube. It was affected by a strong tropical weathering in the Jurassic and Neogene and from a large part covered by sediments of the Carpathian foredeep (kaolin, feldspar, building stone)
Hroznětín Basin – the northern extremity of the Sokolov Basin N of Karlovy Vary (ben-tonite)
Intrasudetic Basin – Carboniferous to Permian basin in the NW tip of Bohemia with sedi-mentary fill from the Lower Carboniferous to Upper Cretaceous about 3,000 meters in thickness and Permian volcanites. Southern extremity of the Lower Silesian Basin (bituminous coal)
Regional geological terms

11�
Islet zone of the Central Bohemian Pluton – a number of both large and minor blocks of the contact metamorphosed Proterozoic and Lower Paleozoic rocks from the mantle of the pluton, downthrown into granitoids (Au, building stone, barite, limestone)
Jílové Belt – a belt of the Upper Proterozoic volcanic (basalt, andesite, boninite and rhyo-lites), subvolcanic and acid plutonic rocks extending over 120 km in NNE-SSW direc-tion south of Prague, from a major part enclosed in granitoids of the Central Bohemian Pluton (Au-ores, building stone)
Kdyně Massif – a complex of metabasic, gabbroic and dioritic rocks in the Domažlice Crystalline Complex on the border of Šumava and Bohemian Forest (dimension and building stone)
Kladno-Rakovník Basin – one of the basins of the Central Bohemian limnic Permocarbon-iferous, partly covered by Cretaceous sediments (black coal, kaolin, claystone) – Fig. 4
Krkonoše-Jizera Crystalline Complex – western part of the Lužice area built by meta-morphic rocks of the Proterozoic and Lower Paleozoic age (limestone, dolomite) and intruded by plutons of the Cadomian (Lužice) and Hercynian (Krkonoše-Jizera) age (feldspar, dimension and building stone). Fe-bearing skarns, Sn and W-ores, fluorite and barite occur in the exocontact of the plutons
Krkonoše-Jizera Massif – Hercynian granitoid massif building the border range with Po-land (excellent dimension stone, feldspar)
Krkonoše Mts. piedmont basin – one of the Central Bohemian Permocarboniferous basins partially covered with Cretaceous sediments. Formations encompass whole Permian and extend up to the lowermost Trias (Cu-ores, Au paleoplacers, bituminous coal, pyrope)
Krušné hory Mts. piedmont basins – a group of limnic Tertiary basins associated with the Ohře Rift SE of the Krušné hory Mts. From WSW to ESE, these are: Cheb, Sokolov, north Bohemian and Zittau basins.
Krušné hory Mts. Pluton – a large Hercynian granitoid pluton underlying metamorphic rocks of the Krušné Hory and Smrčiny Mts., exposed by erosion only in numerous par-tial massifs (Sn-W-ores, kaolin, feldspar, quartz, building stone)
Krušné hory Mts. Crystalline Complex – a part of the Saxothuringicum built by metamor-phic complexes mostly of the Proterozoic, subordinately also of the Lower Paleozoic age (U, Ag, Bi, Co, As-ores, Cu-ores, Sn-skarns, fluorite, barite, kaolin) and intruded by Hercynian granitoids.
Lužice Massif – an extensive Cadomian granitoids massif predominantly on the German territory, extending into the Jizera Mts. (quartz, dimension and building stone)
Geology and minerals

115
Moldanubian Pluton – the largest Hercynian granitoids complex in the Bohemian Massif in Českomoravská vrchovina Highlands, Šumava and Waldviertel (dimension and build-ing stone; Au-W and U-ores and Ag-Pb-Zn-ores in the exocontact)
Moravian-Silesian Devonian – weakly metamorphosed volcano-sedimentary unites in the Jeseníky Mts. – Vrbno Strata, Šternberk-Benešov Belt (Fe-ores, Cu-ores, Pb-Zn-ores, barite, quartzite, dolomite)
Moravian-Silesian Carboniferous – marine flyshoid Lower Carboniferous of the Nízký Jeseník Mts. and Drahany Highlands (slate, quartz) and paralic to limnic Upper Carbon-iferous of the Ostrava region (Upper Silesian Basin – bituminous coal, natural gas)
Mšeno (Mělník) Basin – one of the Central Bohemian Carboniferous to Permian basins, completely overlain by the Bohemian Cretaceous Basin (bituminous coal)
Nasavrky Massif – a minor however very complex Hercynian granitoid body exposed in the Železné hory Mts. (pyrite, dimension and building stone; fluorite and barite in the exocontact)
North Bohemian Basin – the largest Tertiary basin of the Ohře Rift between the Doupov Mts. and České středohoří Mts. (brown coal, clay, bentonite, diatomite, quartzite)
Ohře rift – a prominent fault structure in the south-eastern piedmont of the Krušné hory Mts. and Litoměřice Fault, delimited by the Krušné hory and Litoměřice faults and their directional continuations. Tertiary alkaline volcanites, coal-bearing basins and mineral as well as thermal waters are associated with the rift
Orlické hory Mts.-Kłodzko Crystalline Complex – metamorphic complexes of probably Proterozoic age in the eastern part of the Lužice area in the Orlické hory and Rychleby Mts. and in Kłodzko
Outer klippen zone of the Western Carpathians – extensive fragments of Jurassic and Cretaceous sediments brought up from depth in front of the flysh nappes – Štramberk, Pavlovské vrchy (limestone)
Plzeň Basin – an independent basin at the SW margin of the Central Bohemian Carbonifer-ous to Permian (bituminous coal, kaolin, clay)
Quaternary alluvia – alluvia and terraces of majority of larger water courses (feldspar, sand and gravel, in south Bohemia and SW Moravia also tectites)
Quaternary placers – in piedmont of the Šumava and Jeseníky Mts. (Au), Krušné Hory Mts. (Sn), southern piedmont of the České středohoří Mts. (pyrope)
Sokolov Basin – the smallest Tertiary basin of the Ohře Rift WSW of the Doupov Mts. with important deposits of energy minerals (brown coal, U, clay, bentonite)
Regional geological terms

116
South Bohemian Basins – freshwater sedimentation space of the Upper Cretaceous and Tertiary age, where the Rudolfov horst separates the smaller České Budějovice Basin in the west from the larger Třeboň Basin in the east
Svratka Dome of the Moravicum – the northern of the domes built by metamorphic rocks of the Moravicum W of Brno (graphite, feldspar, limestone, building stone)
Syrovice-Ivaň terrace – a higher located Quaternary terrace between the Jihlava and Svrat-ka rivers S of Brno (feldspar)
Teplá Crystalline Complex – the NW part of the Proterozoic of the Central Bohemian area with a rapid succession of metamorphic zones from SE to NW into the Slavkov les For-est (feldspar)
Tertiary basins of the Plzeň region – relics of the formerly more extensive Tertiary sedi-ments on the site of a river paleostream discharging into the North Bohemian Basin (clay, bentonite)
Třebíč Massif – an extensive massif of the Hercynian melanocratic granitoids and syeni-toids (durbachites) in the Českomoravská vrchovina Highlands (amethyst, morion, feld-spar, dimension stone)
Třeboň Basin – a larger, eastern South Bohemian basin with continental Cretaceous and Teriary sediments (kaolin, clay, bentonite, diatomite)
Upper Silesian Basin – an Upper Carboniferous basin situated predominantly in Poland and extending to the Czech Republic only by its SW part. It is formed by clastic sedi-ments with numerous bituminous coal seams. On the Czech territory, it is further sub-divided into i) western, more mobile paralic Ostrava part, ii) eastern, platform limnic Karviná part and iii) southern Beskydy part (bituminous coal, natural gas)
Variegated Group of the Moldanubicum – metamorphic complexes of paragneisses and migm-atites with numerous intercalations of amphibolites, marbles, quartzites, graphitic rocks and skarns (Fe-skarns, graphite, feldspar, limestone, dolomite, fluorite, building stone)
Vienna Basin – an extensive Tertiary Neogene basin with marine and gradually becoming freshwater sedimentary fill of more than 5,000 m in thickness (lignite, oil, natural gas)
Železné hory Mts. area – part of Bohemicum built by weakly metamorphosed volcanosedi-mentary series of the Upper Proterozoic and sediments of the Lower Paleozoic (Mn-Fe-car-bonates, pyrite, fluorite, barite, limestone) and the Hercynian granitoid Nasavrky Massif
Zittau Basin – a Tertiary basin in the continuation of the Ohře Rift, extending only by a negligible south-eastern extremity into the Czech territory (brown coal, lignite, clay)
Žulová Massif – a minor Hercynian granitoid massif in the northern tip of the Moravian-Silesian area (kaolin, quartz, dimension and building stone)
Geology and minerals

117
ENErGy MINEralS – geological reserves and mine production
Significant geological reserves of energy minerals on the territory of the Czech Republic can be found only for uranium ores, bituminous (hard) coal and brown coal (subbituminous coal or lignite). Geological reserves of these raw materials take a share of the order of some percent in the world resources. Brown coal deposits are concentrated in the Krušné Hory Mts. Piedmont Basins. About 60 % of domestic electric energy and heat (heating plant) pro-duction is covered by coal from these basins. All the bituminous coal mining is at present concentrated in the Czech part of the Upper Silesian Basin. At still increasing world prices of uranium, the Czech territory is perspective also as resources of these energy mineral concerns. Prospective use of these resources can be however complicated and limited, first of all due to conflicts of interest with the environment protection.
Coal production started to thrive on the Czech territory in the 19th century in the beginning of the industrial revolution. After the World War II, uranium ore mining developed. Production of energy minerals as a whole reached its peak in the second half of the 1980’ and after that a recession came connected with the decline of U-ore and all kinds of coal mining. State sub-ventions for closure programs directed at social costs, technical liquidations, health and safety activities and reclaiming reached roughly CZK 38 billion in the coal industry and about CZK 29 billion in the uranium industry in 1990–2006. Out of mineral fuels, the quickest decline affected the uranium ore mining; however, this process has been re-valuated with regard to the marked increase of uranium world prices.
In the past, all uranium needs of the Czech Republic were covered from domestic pro-duction. This coverage from domestic sources has been continuously decreasing to the level of about one third of the total needs in 2006. The Czech Republic’s needs for coal are met from domestic production, and bituminous coal is also exported, but nearly all the oil and gas needed is imported. The world prices of crude oil and natural gas started to increase sig-nificantly in 2000. The Czech Republic then purchased both strategic raw materials for CZK 82.3 billion (in 1999 it was only 41 billion). This amount represented 90 % of all finances used for purchase of primary mineral raw materials. High sums were paid for purchase of crude oil and natural gas in 2001 (more than CZK 86 billion), 2002 (67 billion), 2003 (72 billion), 2004 (74 billion) and 2005 (116 billion). CZK 142 billion in 2006 represented twice as much than in 2003 at comparable volume.
Also other energy minerals i.e. all other coal types show an important increase of the world prices. Increase of uranium prices is, however, enormous. Its price has been increas-ing since a long period of stability until the year 2003 and it reached already almost ten times the value of the starting value from the end of 2003 in the closing date of this publica-tion (August 2007).

118
Mining of energy minerals
Raw.material Unit 2002 2003 200� 2005 2006
Uranium t.U �77 �58 �35 �20 383
Bituminous.coal kt 1�.097 13.382 1�.6�8 12.778 13.017
Brown.coal kt �8.83� �9.920 �7.8�0 �8.658 �8.915
Lignite kt 501 �70 �50 �67 �59
Crude.oil kt 253 310 299 306 259
Natural.gas mill.m3 91 131 175 356 1�8
lifetime of industrial reserves (economic explored disposable reserves) and so-called exploitable (recoverable) reserves, after the decrease of reserves by production incl. losses of registered deposits per year 2006 (A) and as the average annual decrement of reserves in period 2002–2006 (B) was as follows:
Raw.material Lifetime.–.A.(years) Lifetime.–.B.(years)
Reserves industrial exploitable industrial exploitable
Uranium.ore 11 3 1� �
Bituminous.coal 68 8 69 8
Brown.coal.a) 28 19 29 19
Lignite.b) 283 � 137 2
Crude.oil �8 8 �3 7
Natural.gas 15 190 12 156
a) including reserves blocked by territorial limitsb) (Czech) variety of brown coal with the lowest degree of coalification
Energy minerals

119
Uranium
1. Characteristics and useUranium, with its average abundance in the Earth’s crust of about 2.7 ppm, is rather com-
mon element like tin or zinc. Some rocks such as granites or shale contain concentrations substantially higher – from 5 to 25 ppm. Natural uranium has a lithophile character and it occurs in form of oxides and other compounds. It is a mixture of three isotopes: 99.2836 % of 238U, 0.711 % of 235U and 0.0054% of 234U. Natural uranium has to be enriched, which means to increase contents of 235U which is in contrast to 238U fissionable, for most of the industrial purposes. Fuel for majority of commercial nuclear reactors contains 3–5 % of 235U (LEU), nuclear weapons over 90 % (HEU). On the contrary, depleted uranium (DU), i.e. U with reduced proportion of 235U, mostly below 0.3 %, is suitable for other use (e.g. conven-tional weapons).
The uranium ores of various genetic types represent the only raw material for fuel produc-tion in the nuclear power plants. Uranium is present in several tens of minerals (exclusively oxide-bearing compounds), of which economically most important are oxides (uraninite – pitchblende), phosphates (torbernite, autunite), silicates (coffinite, uranophane), titanates (brannerite, davidite), vanadates (carnotite) and organic compounds (anthraxolite).
IAEA distinguishes 15 main categories of uranium deposits according to the geological position. Unconformity-related, sandstone-hosted, paleoplacer (quartz-pebble conglomer-ates), vein-zone, breccia complex and intrusive deposit types are of the highest economic importance. The mined grades vary strongly depending on the deposit type, amount of reserves and way of mining. Average U contents range usually between 0.05 and 0.4 %. Extraordinary rich “unconformity” type deposits, where average grade reaches even several per cent (even 20 %), represent an exception.
Products of U-ore processing are chemical concentrates containing 70–90 weight per-cent of uranium oxides. World Identified Resources of the U in ores (primary resources) consist of Reasonably Assured Resources (RAR) and Inferred Resources (IR). They are re-ported as amounting at 3.8 to 4.7 mill t (according to WNA and IAEA) recoverable at costs ≤ USD 80/kg U to ≤ USD 130/kg U, respectively. The largest resources are concentrated in Australia (24 %), Kazakhstan (17 %), Canada (9 %), South Africa and the USA (7 % each), further in Namibia and Brazil (6 % each), Niger (almost 5 %), Russia (almost 4 %) and Uzbekistan (above 2 %).
History of uranium utilization started only about 150 years ago when small quantities of uranium compounds were used in dyes for ceramics and glass production. Main demand started at the end of World War II for military purposes which was replaced by non-military consumption from the late 1960’s. All this history can be tracked today via inventories of depleted uranium from the enrichment process (uranium missing a substantial part of iso-tope 235U). Approximately 2.3 million tonnes of uranium have been mined worldwide since 1945 for all uses. The main usage of uranium is in power reactors, much less in research reactors (and e.g., for preparation of radioisotopes for medicine and detectors), as fuel in nuclear propulsion in navy, icebreakers, submarines and, depleted uranium in shielding, counterweights (boats, planes) and special ammunition. Minor quantities of uranium salts
Uranium

120
are still used for colouring stained glass. A lot of extracted uranium is stored as nuclear weapon charges.
2. Mineral resources of the Czech RepublicCzech Republic belonged to the most important uranium world producers. Historically
it occupies 8th position in the world with total production of almost 110 thousand tonnes of uranium in the years 1946–2006 in form of sorted ores and chemical concentrate. The main period of uranium mining in the Czech Republic lasted from the late 1940s to the beginning of 1990s, when the mining of all vein deposits mined until then (except the Rožná deposit) was terminated. Mining at the Hamr deposit was terminated in 1995 and at the Stráž deposit a year later, by which also the sandstone type deposit mining was terminated. Annual min-ing production of uranium amounted at 2,000–2,900 t (max. slightly above 3,000 t in 1960) in the period of the highest prosperity of the mining (1955–1990). Czech Republic now occupies 12th position with actual production of about 400 t per year, which represents less than 1 % share of the world production.
Exploitable uranium deposits were found both in the crystalline basement and in the cover formations of the Bohemian Massif. Two major periods of the formation of uranium accumulations can be distinguished: Late Variscan and Alpine.
Practically only two types of deposits occurred on the Czech territory according to the IAEA classification – vein type and sandstone type. Hydrothermal vein deposits (veins in metamorphic rocks, zone deposits in metamorphic rocks and along big dislocations in granitoids) were of the highest importance as the metal production concerns. Total mine production of U metal from these deposit types reached almost 80 kt. Deposits of uranium-bearing sandstones of the Bohemian Cretaceous Basin with 29.5 kt of U in total occupy the second position. Remaining almost 0.9 kt of U comes from deposits in Permo-Carbonifer-ous and Tertiary sediments (mainly of coal and lignite type, respectively, according to IEAE classification). Major part of the exploited uranium – about 85 % – was mined by the classic underground mining. Open pit mining produced about 400 t of uranium, which represents about 0.3 % of the total amount. Remaining part of uranium (almost 15 %) was obtained by other means, mainly by method of underground leaching from boreholes (ISL).
Vein uranium deposit type in the Czech Republic was divided into 3 subtypes:Veins and vein systems of hydrothermal origin in metamorphic rocks. Predominant
uraninite – pitchblende mineralization is very inhomogeneous and it is spatially and genetically associated with Variscan granitoid massifs. Usually steeply dipping ore bod-ies (veins) have several cm to 1 m in thickness, rarely more. U content in these deposits was mostly from 0.1 to 0.X %, exceptionally up to about 1 %. To this type the largest Czech and one of the largest world hydrothermal vein deposits Příbram belonged, further formerly important deposits of Jáchymov, Horní Slavkov and some smaller deposits, e.g. Licoměřice-Březinka, Zálesí u Javorníka, Přebořice, Chotěboř, Slavkovice, Lázně Kynžvart-Kladská, Planá u Mariánských Lázní-Svatá Anna et al.
Graphitised and chloritised or solely chloritised ore-bearing crashed zones in metamor-phic rocks with diffuse boundaries of mainly steep dip. The mineralization is irregularly distributed with main minerals uraninite, coffinite and brannerite. Tabular ore bodies are X m to 10 m thick and U contents was between 0.09 and 0.2 %. To this type belong the
Energy minerals

121
only still mined deposit Rožná, further Zadní Chodov, Olší, Dyleň, Okrouhlá Radouň, Jasenice-Pucov et al.
Metasomatic mineralization associated with chloritized tectonic zones in Variscan grani-toids predominantly with uraninite-coffinite-brannerite mineralization. This mineraliza-tion is relatively uniform and forms mostly steeply dipping pipe-like or lenticular ore bodies. Uranium content in deposits was mainly between 0.07–0.13 % (Vítkov 2, Lhota u Tachova, Nahošín).
Deposits of uranium-bearing sandstones:Predominantly stratabound mineralization in the Cretaceous sediments – ore bodies formed
mainly by uraninite and U-blacks, locally with zircon, confined to the water-bearing Ceno-manian sediments of the Laussicum development of the Bohemian Cretaceous Basin. Ore bodies are horizontally or subhorizontally positioned and have bedding, tabular and less lenticular shape with thickness from several decimeters to several meters. Mineralization is a matrix ingredient and is relatively uniformly disseminated. Uranium content in deposits varies in average from 0.03 % up to 0.14 %. Deposits in Stráž pod Ralskem surroundings, where both classical underground mining (e.g. Hamr, Křižany, Břevniště) and ore leach-ing from boreholes (Stráž) took place had crucial importance. Others explored deposits (Osečná-Kotel) and prognostic resources (Hvězdov, Mimoň, Heřmánky and others) have not been mined yet. More than 98 % of registered reserves in the Czech Republic (mostly potentially economic, i.e. irrecoverable resources in fact) are connected with this type of deposits. Uranium reserves (resources, better said) would be recoverable (economically) mainly by in situ leaching (ISL), however, this is excluded now from reason of ecology. If uranium prices held their present level in the long term, respectively over USD 100 per lb U3O8, then even conventional underground mining would not be entirely excluded in terms of economy.
Other deposits:Stratabound mineralization confined to the Late Paleozoic sediments, formed by ura-
nium-bearing coal seams and surrounding rocks of the Upper Carboniferous and Lower Permian in the Intra-Sudetic Basin (e.g. Radvanice, Rybníček, Svatoňovice) and Kladno-Rakovník Basin (Jedomělice, Rynholec). Mineralization of mainly uraninite was in form of small moderately dipping irregular lenses, resp. slabs of maximum thickness in deci-metres. Average U contents in the deposits ranged between 0.1 and 0.3 %.
Stratabound mineralization in the eastern part of the Sokolov (e.g. Mezirolí, Podlesí) Tertiary basin and its Hroznětín part (e.g. Hájek, Ruprechtov, Hroznětín). Irregular min-eralization in sediments enriched in organic material (including coal), formed mainly by uranium blacks had usually shape of smaller slabs and lenses from tens cm to several metres in thickness. U content was on average between 0.1 and 0.2 %.
Deposits of economic importance, which were intensively used especially in the past, are concentrated into five regions. Their list with type of mineralization and the most important deposits is given below. The regions are ordered according to their importance, given by the amount of the obtained uranium. The share of the individual region on bulk mining produc-tion in per cent is given in parentheses.
Uranium
122
Central Bohemian region – mineralization of the vein type: e.g. Příbram, Předbořice (almost 40 % of the total U mine production)
North Bohemian region – mineralization in the Cretaceous sediments: e. g. Stráž pod Ralskem, Hamr, Břevniště (more than 23 %)
• Moravian region – mineralized fracture zones and hydrothermal veins – Rožná, Olší (about 17 %)
• West Bohemian region – mineralization of the zone and vein type: e.g. Zadní Chodov, Vítkov 2, Horní Slavkov, Dyleň (10 %)
Krušné hory Mts. region – vein deposits and mineralization in Tertiary sediments: e.g. Jáchymov, Hájek (less than 7 %).Other small deposits and occurrences scattered in remaining parts of the Bohemian Mas-
sif such as in Železné hory Mts., Rychlebské hory Mts., Krkonoše Mts., and Okrouhlá Radouň deposit contributed by remaining 3 % to the total post-World War II production of 109,830 t U.
Two registered uranium ore deposits produced uranium in concentrate in 2006.Only one of them was mined – deposit of the zone type Rožná. The other – Stráž pod
Ralskem in the Bohemian Cretaceous Basin – produced within the frame of liquidation works. At the Rožná, underground mining took and takes place (average grading 0.2–0.3 % U in economic reserves), whereas the Stráž deposit (average grading 0.03 % U in economic reserves) has been exploited by means of in situ leaching till April 1, 1996. Since the date up to 150 tonnes of U a year, however, with a decreasing trend to the current of about 40 tonnes, have come as byproduct from underground waters and technological solutions treat-ment within the framework of mine liquidation and reclamation works.
All extracted ore was chemically processed to provide chemical concentrate (yellow cake). It was exported for further processing (conversion and enrichment) abroad. The main por-tion of domestic production was purchased by the Czech energy utility ČEZ, a. s. in the last 15 years. The present consumption of uranium in the nuclear power stations (NPP) Dukovany and Temelín are about 690 t U per year. The surplus of production from the beginning of the 1990’s was deposited in the State Material Reserves and after 2000 sold in the market.
Tailing pond in Stráž pod Ralskem, where waste from leaching of the deposit containing 0.030–0.063 % of rare earths accumulated for 30 years, is a potential source not only of rare earths (lanthanum–gadolinium) but also scandium, yttrium, niobium, zirconium and hafnium. With an exception of Zr, reserves of these metals have not been evaluated yet.
3. Registered deposits and other resources in the Czech Republic(see map)
Reserved registered deposits (Names of mined deposits are indicated in bold type)1 Rožná 3 Břevniště pod Ralskem 5 Jasenice-Pucov 7 Stráž pod Ralskem*2 Brzkov 4 Hamr pod Ralskem 6 Osečná-Kotel* uranium is extracted only as secondary effect of underground waters and technological solutions
treatment within the framework of mine liquidation and reclamation works after in situ leaching (ISL) of uranium ores
Energy minerals

123
rese
rved
.regi
ster
ed.d
epos
its
exha
uste
d.de
posi
ts.a
nd.o
ther
.reso
urce
s
Uranium
Ura
nium

12�
Exhausted deposits and other resources 8 Příbram 13 Okrouhlá Radouň 18 Předbořice 9 Jáchymov 14 Dyleň 19 Hájek + Ruprechtov10 Zadní Chodov + Vítkov 2 15 Javorník 20 Chotěboř11 Olší 16 Licoměřice-Březinka 21 Slavkovice12 Horní Slavkov 17 Radvanice + Rybníček
+ Svatoňovice22 Mečichov-Nahošín
4. Basic statistical data of the Czech Republic as of December 31
Year 2002 2003 200� 2005 2006
Deposits.–.total.number 7 7 7 7 7
. exploited 1 1 1 1 1
Total.mineral.*.reserves,.t.U 136.785 136.�09 136.0�� 135.990 135.812
. economic.explored.reserves 1.9�5 1.710 1.622 1.655 1.671
. economic.prospected.reserves 19.��8 19.��8 19.�18 19.�11 19.�76
. potentially.economic.reserves 115.392 115.251 115.00� 11�.92� 11�.665
. exploitable.(recoverable).reserves 92� 688 570 596 677
Mine.production,.t.U �77 �58 �35 �20 383
Production.of.concentrate,.t.U. ** �65 �52 �12 �09 358
* see NOTE on page 12 on a terminological difference between Czech official application of the term reserves and standard international application of the term
** sales production (without ore milling losses)
5. Foreign trade28441030 – Natural uranium – wrought
2002 2003 200� 2005 2006
Import,.t.U N N N N N
Export,.t.U 1.�22 1.016 665 867 529
Imports of uranium are witheld to avoid disclosure of private companies confidential data.
In the period 2000–2005 all domestic production of uranium was bought by the Czech energy utility ČEZ, a. s. and exported for processing and fuel fabrication to cover fuel needs of the nuclear power plant (NPP) Dukovany and the NPP Temelín. It covered ap-
Energy minerals

125
proximately 93 % of domestic needs in 2000–2002 and about 47 % in 2005. The remaining portion of uranium was purchased in the world market and imported as enriched uranium equivalent in fabricated fuel in case of the Russian supplier – TVEL Company, which deliv-ers fuel elements for Dukovany nuclear power station. Fuel elements for Temelín nuclear power station are delivered by Westinghouse company at present; TVEL Company will become its supplier in 2010.
According to the governement decision from October 2005, the last Czech uranium mine Rožná was scheduled to close in 2008. In May 2007 the governement decided on a possibil-ity to continue in mining at Rožná mine provided that its economic effectiveness (which will be yearly assessed by the governement).
6. prices of domestic market and foreign trade 28441030 – Natural uranium – wrought
2002 2003 200� 2005 2006
Average.import.prices.(CZK/kg.U) 0 0 0 0 0
Average.export.prices.(CZK/kg.U) 759 806 8�� 1.��5 1.3�5
7. Mining companies in the Czech Republic as of December 31, 2006DIAMO, s.p., Stráž pod Ralskem
8. World productionAccording to IAEA last world consumption of uranium as nuclear plant fuel was about
67–68 kt (2005) per year (65–66 kt according to WNA). This amount was covered from primary sources only from 55–60 %. Remaining 40–45 % of uranium consumption was covered from secondary sources such as strategic stockpiles of the natural and enriched uranium, mainly of the USA and Russia, uranium from dismantling of Russian nuclear warheads (so-called “HEU” source), reprocessed burned fuel including MOX, and uranium obtained by re-enrichment of depleted uranium from earlier processing.
In 2006 after 2 years of growth a year-on-year (definitely temporary) decrease of ura-nium production by 5 % took place to 39,429 tonnes U, i.e. even below 2004 level. This decrease was caused both „manufacturing difficulties and mined ore grades inferior to ex-pected ones at main producers at Canadian and Australian deposits.
Roughly 2.3 mill t of uranium has been exploited in the world for all uses since 1945. Large increase in world production of uranium ores began in the 1950s for military purposes, and this was replaced by civil power station demand, especially after the first “oil shock” in 1973. A record production of 45.6 kt of uranium was reached in 1990. The mining production fell due to surplus of supply on the world market in the following period. It has been slowly increasing again in the two recent years, especially in Australia, Kazakhstan, Uzbekistan and Russia. As European countries concerns, uranium is mined in Ukraine and the Czech Re-
Uranium

126
public, in small amount in Romania and within liquidation works in Germany. Share of the Czech Republic in the world production was about 1 % in 2005. Following states took part in uranium mine production (according to The Uranium Institute/World Nuclear Association, World Mineral Statistics and Welt Bergbau Daten):
Year 2002. 2003 200� 2005 2006.e
Mine.production,.t.U.(UI/WNA) 36.063 35.613 �0.251 �1.702 39.�29
Mine.production,.t.U.(WMS) 37.�00 36.�00 �2.800 N N
Main producers’ share in the world mine output (2006; according to WBD):
Canada 25.0 % Uzbekistan 5.7 %Australia 19.3 % USA 4.2 %Kazakhstan 13.4 % Ukraine e2.0 %Niger 8.7 % China e1.9 %Russia e8.3 % South Africa 1.4 %Namibia 7.8 % Czech Republic 0.9 %
24 % of the primary production of uranium was obtained by open-pit mining, 41 % by underground mining, over 26 % was exploited by in-situ leaching (ISL) or from dumps by leaching and around 9 % represented by-product of other ores (mainly Au and Cu) processing in 2006. The important uranium mining companies-founders fused in the nineties. Only 8 biggest world-mining companies (with the output volume more than 1,000 tonnes per year) covered 85.5 % of the world production in 2006. These were the following companies: Cameco, Rio-Tinto, Areva (former Cogema), KatAtomProm, TVEL, BHP Billiton, Na-voi, Uranium One (according to the WNA). McArthur River (Canada): 7,200 t U, Ranger (Australia): 4,026 t U, Rossing (Namibia): 3,067 t U, Krazbokamensk (Russia): 2,900 t U, Olympic Dam (Australia): 2,868 t U as by-product of Cu mining and Rabbit Lake (Canada): 1,972 t U represented the most important world deposits in 2006.
9. World market prices Unlike other raw materials uranium is was not traded on a commodity exchange un-
til recently. New-York commodity exchange NYMEX launched newly uranium trading, however, only in form of futures contracts, not physical supplies. World market prices are quoted in USD/lb U3O8. For the purpose of this report they have been recalculated to USD/kg U (multiplying index of 2.6 has been used).
Uranium price history was influenced by three main periods of uranium usage: (1) the weapons procurement era (1940–1969), (2) the inventory accumulation – commercial era (1970–1989) and (3) the inventory liquidation era (1990–2005). While the first period was characterized by subsidized production, or prices settled by governments as a customer, in the second one prices were derived from costs of already existing deposits. Prices had
Energy minerals

127
been also driven up by expectations of rapid development of nuclear energy in the late 1970’s, and reached their historic maximum of 112.8 USD/kg (43.4 USD/lb U3O8) in 1978; which would be almost 300 USD/kg in constant 2005 USD. Significant exploration boom appeared worldwide. However, expectations of rapid development of nuclear energy were frozen after Three-Mile Island and Chernobyl accidents. Overflow of cheap uranium from the former Soviet Union countries caused drop in the world price in the beginning of 1990’s. Pertaining surplus of uranium from secondary sources had further depressed prices of uranium in the market for many years which had lead to severe phasing out programmes and closures of uranium mines in many countries (e.g., France, the USA, Spain, Gabon, Czechoslovakia, Eastern Germany, South Africa) and caused delaying the next exploration cycle, as there was little economic incentive to invest in new developments.
Despite the common long-term perception that the price should rise, this happened only after several warning serious market disruptions of production in the period 2003–2004, which proved the vulnerability of the market:• Flooding at McArthur River mine (Canada) • Fire at Olympic Dam mill (Australia)• Gaseous UF leakage problems in ConverDyn’s conversion facility and temporary termi-
nation of production (the USA)• Weakness of USD relative to currencies of major uranium-producing and exporting
countries• Strike at Cameco’s in conversion facility at Port Hope (Canada)• Cutting US trader GNSS (Globe Nuclear Services and Supply Ltd) from sources of Rus-
sian uranium by Russian governmental company TENEX (Texcнaбэкcпopт)
In 2006 ongoing steep price growth was havily influenced by additional problems:• Partial production cuts in consequence of temporary flooding at Ranger Mine (Australia)• Flooding at developed Cigar Lake mine (Canada) with minimum 2 years delay in mining
initiation• Technical difficulties forced number of producers to buy uranium to perform their sup-
plier obligations, which motivated on prices to grow. In comparison with a situation 5–10 years ago, availability of uranium from strategic reserves markedly declined; on the con-trary consumer’s policy prevails to enlarge and to hold the reserves in the long term
In the situation when 3–4 main mining companies contribute with capacity of only 4–5 mines roungly 50 % to the world production, the main concern is not about adequacy of urani-um resources, but about the ability of the mining industry to meet near future supply require-ments and especially its supplier vulnerability. As a result, the market is facing a shortage of uranium since utilities are building inventories, and in addition to that since 2005 the price has been also driven by speculative purchases made by investment companies. In 2005, the World Nuclear Association declared nuclear renaissance under the circumstance of energy scarcity in countries like China and India and of a general growth of prices of all energy sources. For instance, only China plans to build 40 new nuclear power stations in future 15 years.
Uranium

128
The average prices of uranium concentrate in USD per kg of uranium (U) fluctuated as follows:
Price/Year 2002 2003 200� 2005 2006
Annual.average.spot.(TradeTech) 25.72 30.05 �8.�9 7�.92 129.8�
End.of.the.year.spot.(Ux.Weekly) 26.52 37.70 53.82 9�.25 187.20End.of.the.year.long-term.Indicator.(TradeTech).1) 27.95 �0.30 65.00 93.60 179.�0
Long-term.average.in.EU15.2) 32.16 3�.50 36.32 �1.76 �8.23
Notes: 1) the price indicator show the base price level for which it was possible to conclude long-term supply
contracts at that time2) ESA average prices for deliveries under long-term contracts in a respective year
10. recyclingOnly about 5 % of the total energy contained in uranium is used in present reactors in
the situation when majority of reactors is operated in so called “opened fuel cycle”. Spent fuel is in this case stored (for 40–50 years) in in-process stores with the perspective of final disposal at permanent repositories constructed in suitable geological milieu. Today, only a small portion (from economic even sanitary reasons) of world nuclear spent fuel is reproc-essed – recycled for recovery of remaining unburned fissile material (235U and 239Pu), which increases the efficiency of uranium utilization by up to 30 % within so-called “closed fuel cycle”. This also aims to lower volume of highly-active wastes. Reactors with fast neutrons, resp. their advanced form using other types of fuel than today water reactors, represent a perspective for considerably higher energy use of uranium.
11. possible substitutesThermal and atomic propulsion reactors are designed for usage of specific fuel and form
of processed uranium (low enriched or natural in thermal reactors, or highly enriched ura-nium in navy reactors). From this point of view there is not a substitute for uranium in those power stations/reactors. Thorium (Th) is other primary element which can be used as fuel in specifically designed nuclear reactors. Only India has been currently considering future exploitation of Th due to a shortage of domestic uranium resources for feeding its ambi-tious nuclear energy program, and also existing restrictions of other states on import of uranium to India due to no signature of the Non-proliferation treaty. Within the framework of the total energy balance the substitution is possible by another energy sources, e.g. fossil fuels, however, producing greenhouse gases. Problems of nuclear power supply are broadly discussed in the world, in particular in relation to electricity production from classical fuels – coal, oil and gas and their substitutes.
Energy minerals

129
Bituminous coal
1. Characteristics and useBituminous, hard or black coal and anthracite are caustobiolites exhibiting a higher de-
gree of coalification, i.e. more than 75.5 % carbon (in the US use between 69 to 86 % for bituminous coal and 86 % for anthracite), less than 50 % volatile matter and calorific value on an ash-free but moist basis exceeding 24 MJ/kg. The internationally recognized bound-ary between lignite and bituminous coal is the value of vitrinite reflectance (Rvi = 0.6 %), which in the case of bituminous coal is higher than 0.6 %.¨
According to the IEA 2003, the world proved recoverable reserves of bituminous coal reach about 480 bill t. Predominant part of these reserves is located on the territory of the USA (23 %), India (19 %), China (13 %), Russia and South Africa (each 10 %), further Australia (8 %), Kazakhstan (6 %), Ukraine and Poland (roughly 3 % each).
Coking coal by definition is a bituminous coal, which allows producing coke for blast-furnace production of pig iron and/or for heating. Other coal is classified as steam coal and it is used predominantly for electric energy production (40 % of electric energy in the world is generated by coal burning).
2. Mineral resources of the Czech RepublicBoth the coking coal and the steam coal deposits occur on the territory of the Czech Re-
public. Czech part of the Upper Silesian Basin with an area of about 1,550 km2 (about 30 % of coal reserves is in the Czech Republic and 70 % in Poland), is of a decisive importance. This part called the Ostrava-Karviná Coalfield containing an important portion of coking coal, represents essentially the only area with bituminous coal mining in the Czech Repub-lic at present. The Bludovice fault divides the Czech part of the Upper Silesian Basin into two sections:
the northern Ostrava-Karviná and the southern Beskydy Mts. Piedmont sub-basins. A major fault (the so-called Orlová structure) separates the western (Ostrava) and eastern (Karviná) part of the Ostrava-Karviná coalfield. The former is filled with older sedi-ments heavily affected by tectonics, of paralic character of sediments. The latter, less complex, exhibits both paralic and limnic character of the sediments as well as of coal. The western part consists of several tens of high-grade coking coal seams of relatively low thickness (about 0.7 m on average), whereas the eastern part is characterised by abundant seams of medium thickness (about 1.8 m on average) in mineable depths con-taining mixed coking coal and high volatile steam coal. 4 mines with 7 deposits (mining leases Darkov, Doubrava, Karviná-Doly I and II, Lazy, Louky, Stonava) in the Karviná part of the basin supply roughly 92 % of the basin production at present (mining of Dolní Suchá deposit was terminated in mid-2006). The calorific value of mined coal Qi
r is mostly 23–30 MJ/kg and ash kontent Ad between 10 and 30 %. A long-term intensive mining activity resulted in that the mining in the Ostrava part of the basin reached higher and higher depth (even above 1,000 m), which together with complex and unfavourable mining and geological conditions increased the mining costs. Consequently, the Ostrava mines became unprofitable and they were gradually closed and liquidated. The majority
Bituminous coal

130
of mines in the eastern part have enough reserves with a less complex geological struc-ture, which makes their extraction less expensive. This coal is, however, of a lower grade because of its poor coking properties.
Two deposits of predominantly coking coal in the Ostrava Formation are still extracted by a single mine in the northern part of the Beskydy piedmont part of the basin (mining lease Staříč). The calorific value of mined coal Qi
r is mostly 28–29 MJ/kg and ash content Ad
between 11 and 19 %. Relatively large reserves of coal were verified south of the original Upper Silesian Basin, particularly near Frenštát pod Radhoštěm, where Carboniferous sedi-ments are buried under Miocene sediments and the Beskydy nappes. Here, the coal would be extracted from the depths of 800 to 1,300 m under difficult geological and mining condi-tions. Besides, a part of the deposit extends into the Protected Landscape Area (CHKO) Beskydy Mts. and this is why its exploitation is not considered in the meantime.
Kladno-Rakovník Basin in central Bohemia, west of Prague, part of the Central Bohemian Basins, represented the second most important area with bituminous coal reserves until the mining in the three last mining leases (Kačice, Srby, Tuchlovice) was definitely ter-minated. The major part of the coal reserves (steam coal) were already mined out and the remaining ones lost their economic importance. The calorific value of mined coal Qi
r was 18–20 MJ/kg in average and ash content Ad between 20 and 35 %. Another deposit with a small share of coking coal of a rather high quality was discovered and explored in the 1950s and 1960s near Slaný. It is the north-eastern extension of the Kladno Basin and has about 342 mill tonnes of coal. In addition to a high depth of 700 to 1,300 m, the hydrogeological and gas situation is complicated, too. The average calorific value of the coal Qi
r is mostly 18–22 MJ/kg and ash content Ad between 20 and 40 %. The development of the deposit was terminated in the beginning of the 1990s after two shafts were put down.
The so-called Mšeno part of Mšeno-Roudnice Basin, having more than 1.1 bill tonnes of reserves of steam coal, has been explored northeast of Prague. The calorific value Qi
r is between 16–20 MJ/kg in average and ash content Ad between 24 and 40 %. However, economic aspects and conflicts of interest – the overlying Cretaceous sandstones repre-sent a source of potable water for central Bohemia – obstruct exploitation of this deposit. The neighbouring Roudnice part of the Basin and the eastward neighbouring Mnichovo Hradiště Basin appear to be completely unprospective at present.
A deposit of low-quality steam bituminous coal of a low prospectivity has been evalu-ated in the Krkonoše Mts. Piedmont Basin.
The underground mining of mainly steam coal in the Intra-Sudetic (Lower Silesian) Ba-sin was definitely terminated in the beginning of the 1990s. A surface mining of a very restricted extent has been taking place since 1998 on the Žacléř deposit.
The bituminous coal mining in the Plzeň (Pilsen) region (Plzeň and Radnice Basins) was definitely terminated in the first half of the 1990s, too. The remaining reserves were eliminated from The Register in 2002. Negligible short-time mining in adjacent Manětín and Žihle Basins and isolated relics in the Carboniferous by Mirošov, Merklín, Tlustice, Malé Přílepy etc. were of a limited local importance.
Steam coal mining in the Boskovice Graben (Rosice-Oslavany District) west of Brno was definitely terminated early in 1992.
Minor isolated relics of bituminous coal to anthracite in the Blanice Graben were locally mined, e.g., by Lhotice NE of České Budějovice and W of Vlašim in the past.
Neither the negligible anthracite mining in a small basin by Brandov in the Krušné Hory Mts. was of a higher importance.
Energy minerals

131
Bitu
min
ous
coal
rese
rved
.regi
ster
ed.d
epos
its
exha
uste
d.de
posi
ts.a
nd.o
ther
.reso
urce
s
Bituminous coal

132
3. Registered deposits and other resources in the Czech Republic(see map)Coal basins:1 Upper-Silesian Basin 2 Intra-Sudetic Basin 3 Krkonoše Mts. Piedmont Basin 4 Central Bohemian Basins (namely Kladno-Rakovník Basin) 5 Mšeno Part of Mšeno-Roudnice Basin 6 Plzeň Basin and Radnice Basin7 Boskovice Graben8 Roudnice Part of Mšeno-Roudnice Basin9 Mnichovo Hradiště Basin
4. Basic statistical data of the Czech Republic as of December 31
Year 2002 2003 200� 2005 2006
Deposits.–.total.number 63 62 62 63 63
. Exploited 12 11 11 11 10
Total.mineral.*reserves,.kt. 16.128.871 16.110.�31 16.093.��2 16.09�.030 16.063.718
. economic.explored.reserves
1.751.320 1.688.785 1.670.133 1.672.651 1.587.320
. economic.prospected.reserves
5.9�7.71� 5.891.179 5.891.506 5.880.�37 5.869.966
. potentially.economic.reserves
8.�29.837 8.530.�67 8.531.803 8.5�0.9�2 8.606.�32
. exploitable.(recoverable).reserves
298.5�8 279.310 271.120 269.198 13�.060
Mine.production,.kt 1�.097 13.382 1�.6�8 12.778 13.017
* see NOTE on page 12 on a terminological difference between Czech official application of the term reserves and standard international application of the term
Domestic production of selected intermediate products
Year/.kt 2002. 2003 200� 2005. 2006
coke 3.537 3.556 3.5�8 3.�12 3.�28
Energy minerals
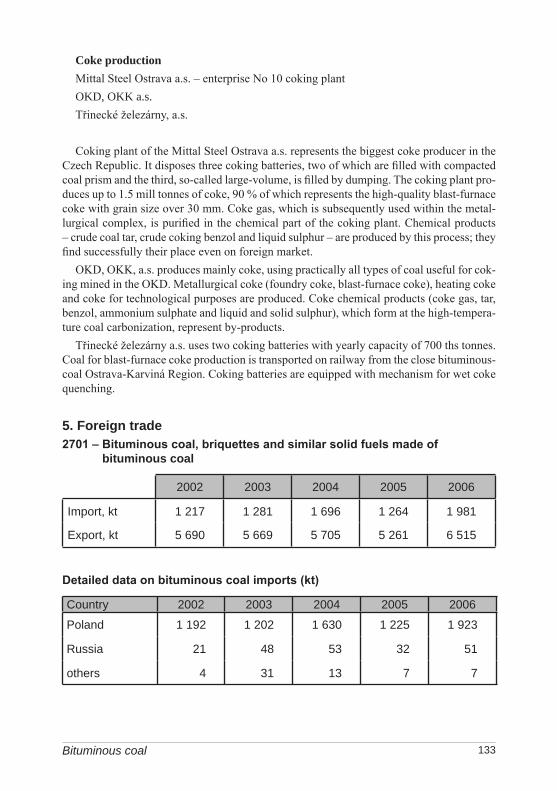
133
Coke productionMittal Steel Ostrava a.s. – enterprise No 10 coking plantOKD, OKK a.s.Třinecké železárny, a.s.
Coking plant of the Mittal Steel Ostrava a.s. represents the biggest coke producer in the Czech Republic. It disposes three coking batteries, two of which are filled with compacted coal prism and the third, so-called large-volume, is filled by dumping. The coking plant pro-duces up to 1.5 mill tonnes of coke, 90 % of which represents the high-quality blast-furnace coke with grain size over 30 mm. Coke gas, which is subsequently used within the metal-lurgical complex, is purified in the chemical part of the coking plant. Chemical products – crude coal tar, crude coking benzol and liquid sulphur – are produced by this process; they find successfully their place even on foreign market.
OKD, OKK, a.s. produces mainly coke, using practically all types of coal useful for cok-ing mined in the OKD. Metallurgical coke (foundry coke, blast-furnace coke), heating coke and coke for technological purposes are produced. Coke chemical products (coke gas, tar, benzol, ammonium sulphate and liquid and solid sulphur), which form at the high-tempera-ture coal carbonization, represent by-products.
Třinecké železárny a.s. uses two coking batteries with yearly capacity of 700 ths tonnes. Coal for blast-furnace coke production is transported on railway from the close bituminous-coal Ostrava-Karviná Region. Coking batteries are equipped with mechanism for wet coke quenching.
5. Foreign trade2701 – Bituminous coal, briquettes and similar solid fuels made of
bituminous coal
2002 2003 200� 2005 2006
Import,.kt 1.217 1.281 1.696 1.26� 1.981
Export,.kt 5.690 5.669 5.705 5.261 6.515
Detailed data on bituminous coal imports (kt)
Country 2002 2003 200� 2005 2006
Poland 1.192 1.202 1.630 1.225 1.923
Russia 21 �8 53 32 51
others � 31 13 7 7
Bituminous coal

13�
Detailed data on bituminous coal exports (kt)
Country 2002 2003 200� 2005 2006
Slovakia 2.1�7 2.197 2.013 1.757 1.822
Russia 1.735 1.809 2.170 1.97� 1.7�8
Poland 381 500 621 637 1.570
Germany 896 710 587 525 551
Hungary 529 �52 30� 251 516
Bosnia.and.Herzegovina 0 0 1 108 307
others 2 1 9 9 3
2704 – Coke and semi-coke from bituminous coal, lignite or peat, agglomerated retort coal
2002 2003 200� 2005 2006
Import,.kt 523 701 756 510 768
Export,.kt 9�6 9�� 958 980 971
Detailed data on coke imports (kt)
Country 2002 2003 200� 2005 2006
Poland �60 633 686 �23 70�
Slovakia 56 62 38 75 56
others 7 6 32 12 8
Detailed data on coke exports (kt)
Country 2002 2003 200� 2005 2006
Germany 389 ��2 �37 �09 372
Russia 353 3�0 323 3�� 280
Slovakia 63 65 �2 3� 103
Poland 10 12 �6 99 73
Finland 5� 51 31 0 50
others 77 3� 79 9� 93
Energy minerals

135
Bituminous coal represents one of the most important items of the Czech mineral ex-port expressed both in volume and finantially. The export volume oscillated traditionally around 5.5 mill tonnes. It increased to 6.7 mill tonnes in 2006, which represents more than one half of the domestic mine production. The bituminous coal import is roughly four times lower and it comes almost exclusively from Poland. Foreign trade with coke is more balanced. Whereas 500–800 kt has been traditionally imported almost exclusively from Poland, Czech export has been slightly below 1 mill tonnes and is directed to neighbouring countries, mainly Germany and Austria.
6. prices of domestic market and foreign trade2701 – Bituminous coal, briquettes and similar solid fuels made of
bituminous coal
2002 2003 200� 2005 2006
Average.import.prices.(CZK/t) 1.238 1.195 1.872 2.181 1.9�9
Average.export.prices.(CZK/t) 1.563 1.536 2.038 2.�92 2.168
2704 – Coke and semi-coke from bituminous coal, lignite or peat, agglomerated retort coal
2002 2003 200� 2005 2006
Average.import.prices.(CZK/t) 2.3�5 2.631 5.765 �.�98 3.560
Average.export.prices.(CZK/t) 2.986 3.�13 5.558 6.131 �.969
Bituminous coal prices are on agreement and the OKD a.s. mining company considers them to be commercially confidential. It can be, however, assumed that the prices considerably in-creased in 2003–2005. This increase roughly copies the increase of import and export prices.
7. Mining companies in the Czech Republic as of December 31, 2006OKD a.s., OstravaGEMEC – UNION a.s., Jívka
8. World productionWorld production of bituminous coal exceeded 3,000 million tonnes in 1985. Despite
the prognoses of the UNO European Economic Commission, the world mine production exceeded the limit of 4,000 mill tonnes already in 2003 (not after 2010). Rise of the mine production has been accelerating recently: it probably exceeded 5,000 mill t in 2005, which represented an increase by almost 20 % in two years. Mine production of steam coal mark-edly exceeds that of coking coal. A long-term decrease of the mine production in Europe is being replaced by mine production in Asia and South America. The Asian continent has a share of about 60 % in the world mine production of steam coal and of about 50 % in that of
Bituminous coal

136
coking coal. Increase of mine production in China, India, but also in Indonesia, Colombia and Kazakhstan is especially dynamic. The world mine production has been developing as follows in the last five years (according to the Welt Bergbau Daten and Coal Age):
Year 2002. 2003 200� 2005 2006.e
Mine.production,.mill.t.(IEA/OECD) 3.910 �.038 �.629 �.973 N
Mine.production,.mill.t.(WBD) 3.977 �.289 �.70� 5.018 N
Mine.production,.mill.t.(WMS) �.025 �.392 �.719 N N
Welt Bergbau Daten statistics give in addition classification of mine production accord-ing to the main technological type of bituminous coal:
Mine.production,.mill.t. 2002. 2003 200� 2005 2006.e
Steam.coal 3.�8� 3.770 �.150 �.37� N
Coking.coal �93 520 55� 6�� N
Main producers´ share in the world mine output (2005; according to WBD):
Steam coal Coking coalChina 44.9 % China 40.1 %USA 20.7 % Australia 19.6 %India 8.5 % Russia 11.1 %South Africa 5.5 % USA 7.0 %Australia 4.0 % Ukraine 5.1 %Russia 3.4 % India 4.1 %Indonesia 3.2 % Canada 3.9 %Poland 1.9 % Kazakhstan 2.5 %Kazakhstan 1.5 % Germany 2.4 %Colombia 1.4 % Poland 2.2 %Ukraine 1.0 % Czech Republic 1.1 %Vietnam 0.8 % New Zealand 0.4 %
9. World market pricesPrices for spot sales and future delivery prices are quoted on the coal world market.
Prices of both major technological types of coal (coking and steam coal) are further divided according to the calorific value and the contents of volatile constituents, sulphur and ash. According to IEA, roughly 750 mill t of bituminous coal was traded in 2004, of which 540 mill t was steam coal and roughly 210 mill t coking coal.
Energy minerals

137
Prices of the Australian and US coal have been traditionally representative, as their share in the world trade has been historically important. Prices are quoted in USD/t FOB, FAS or CIF. Prices of overseas coal on the European market (CIF) during the last decade were fluctuating between USD 34 and 100 per tonne of steam coal and between USD 48 to 120 per tonne of coking coal. Price variations were due to fluctuation in supplies and demands and also due to oscillations in sea transport costs. Lower prices of overseas coal lead in the last third of the 20th century to a gradual reduction of coal mining in European countries, where mining costs were considerably higher. Since 2004 strong grow of bituminous coal world market prices takes place.
The average annual prices of bituminous coal in USD per tonne CIF EU (according to the International IEA Statistics):
Commodity/Year 2002 2003 200� 2005 2006
Coking.bituminous.coal,.American,.CIF.EU USD/t 61.�8 6�.18 8�.75 110.91 123.��
Coking.bituminous.coal,.Australian,.CIF.EU USD/t 55.52 58.03 73.63 11�.89 135.52
Coking.bituminous.coal,.South.African,.CIF.EU USD/t 38.69 39.20 61.31 71.77 66.18
Coking.bituminous.coal,.Polish,.CIF.EU USD/t 50.15 62.2� 108.71 138.92 118.82
Steam.bituminous.coal,.American,.CIF.EU USD/t �3.�8 �7.37 61.50 86.75 82.08
Steam.bituminous.coal,.Australian,.CIF.EU USD/t �3.28 �6.83 69.05 106.�0 109.71
Steam.bituminous.coal,.South.African,.CIF.EU USD/t 36.65 39.10 58.00 67.6� 66.2�
Steam.bituminous.coal,.Chinese,.CIF.EU USD/t ��.30 51.38 60.61 93.�1 150.20
Steam.bituminous.coal,.Russian,.CIF.EU USD/t 36.79 �2.22 65.1� 68.�6 67.93
Steam.bituminous.coal,.Polish,.CIF.EU USD/t �0.75 �3.26 68.95 78.3� 75.65
Steam.bituminous.coal,.Columbian,.CIF.EU USD/t 36.99 �1.65 61.5� 67.98 66.07
Steam.bituminous.coal,.Indonesian,.CIF.EU USD/t 36.�8 39.29 52.56 N N
Steam.bituminous.coal,.Czech,.CIF.EU USD/t 53.68 6�.0� 83.2� N N
Important rise in all types of bituminous coal occurred in 2004. Year-on-year increase was 20–75 %. This was unequivocally caused by a break in raw material consumption in the third world countries. Number of these countries used to supply large volumes of bitu-
Bituminous coal

138
minous coal to developed countries until recently and their own domestic consumption was negligible. Domestic consumption of these countries (often) increases dramatically and raw materials are therefore in still larger volumes consumed already in the mother country. This however concerns nominal prices the rise of which reflects also long-term weakening of the US dollar. This rise continued and even forced sometimes in 2005 when namely prices of American and Australian coking bituminous coal and South African and American steam bituminous coal rose. In 2006 trend in prices differed by country: prices of American and Australian coking bituminous coal grew on and especially prices of Chinese coal grew due to demand excess (anually by 60 %). Others price quatations rather stagnated.
10. recyclingCoal is not recycled.
11. possible substitutesCoking coal can be replaced by steam coal or natural gas due to introduction of new tech-
nologies in production of pig iron (e.g. COREX®). Other energy minerals can replace coal in energy generation.
Energy minerals

139
Brown coal
1. Characteristics and useBrown coal (sub-bituminous coal and lignite, brown coal) is a caustobiolite showing
lower degree of coalification, i.e. having about 65 to 73.5 % carbon, more than 50 % vola-tile matter and calorific value on an ash-free but moist basis lower than 24 MJ/kg. Limit between sub-bituminous coal and lignite has not been internationally determined. Usually a raw material with carbon content in combustible matter below 65 % and calorific value below 17 MJ/kg (below about 19 MJ/kg in the USA) is considered as lignite. The coal terminology is not unified in the international practice. The English term lignite sometimes designates both coal of Czech (Central European) brown coal grade and Czech lignite grade whereas the latter is registered separately in the Czech Republic.
World proved recoverable reserves of sub-bituminous coal and lignite are estimated between 420 and 430 bill t, resp. (EIA 2004). About 250 bill t of this amount represent sub-bituminous coal and about 170 bill t lignite. Major part of these reserves is located on the territory of the USA (32 %), Russia (25 %), further China (12 %) and Australia (9 %). Rather big reserves are also on the territory of Ukraine (4 %), Serbia and Montenegro and Brazil (roughly 3 % each).
Brown coal is used mainly in the production of energy and to a smaller extent in chemi-cal industry.
2. Mineral resources of the Czech RepublicThe majority of brown coal in the Czech Republic has been used for energy generation.
The major Bohemian brown coal basins originated and are located in the graben along the Krušné hory Mts, which follows the Hercynian direction and the NW boundary of the Czech Republic. The total area of the coal-bearing sedimentation is 1,900 km2 large. The underlying sediments are of the Eocene age. The brown coal seams and overlying sedi-ments, of 400 m thickness or even more, are of the Early Miocene age. The sedimentation in the Cheb Basin was terminated as late as in the Pliocene. The following independent basins are recognized in the whole area of the Krušné hory Mts. Basin (from NE to SW): North Bohemian, Sokolov and Cheb Basins. The largest North Bohemian Basin is then divided into three parts. The share of the North Bohemian Basin on the total mine production of the brown coal in the Czech Republic is about 79 %, the remaning 21 % comes from the Sokolov Basin. The coal is exploited with one exception only by open-pit mining opera-tions.In the Chomutov part of the North Bohemian Basin, the coal seam is divided into 3 bench-
es. These become connected or are close to each other towards the north-western part of the basin, which allows their common open-pit mining. The raw material represents less calorific steam coal with a low degree of coalification. Its major use is burning in power plants. The problem with the elevated sulphur content in this coal (Sd of about 2.6 %) was solved by desulphurization of power plants exhaust gases. The ash content in general in-creases from NW to SE, where it can reach up to 50% (being about 35 % on average). The average thickness of the mined seam is about 23 meters and the calorific value of the coal
Brown coal

1�0
Qir is 10–11 MJ/kg. The coal in this part of the basin is extracted by one large open-pit mine
Tušimice-Libouš (mining lease Tušimice). Brown coal in the Most part of the North Bohemian Basin shows higher degree of coalifi-
cation and a lower content of ash (10–34 %). The coal is used in energy generation; sorted types for small customers are produced, too. Locally, however, it is very rich in sulphur (Sd between 1 and 1.5 % on average) and arsenic. The average thickness of the mined seam is between 20–30 meters, the calorific value of the coal Qi
r is 10–17 MJ/kg. The depth of open-pit mines continues to increase, being currently at about 150 m in some parts. The ex-traction takes place in four large open-pit mines (mining leases Bílina, Ervěnice, Holešice, Vršany) and one underground mine (mining lease Dolní Jiřetín u Mostu) at present.
Mine production of the Teplice part of the North Bohemian Basin was terminated in 1997 by closure of the Chabařovice open-pit mine. The remaining reserves of high-quality al-most sulphur- and ash-free brown coal located under the Chabařovice municipality cannot be mined out because of the conflicts of interests and complex hydrogeological conditions. Similar conflicts will probably block extraction of the other reserves of the high-quality coal also in other parts of the basin. Minor isolated occurrences of small sub-bituminous coal seams in the České středohoří area were from a large part mined out in the past.
The Sokolov Basin west of Karlovy Vary has two main groups of strata – Antonín and Josef. The major reserves are confined to the thickest and the uppermost seam called An-tonín, which is separated into 2 to 3 thin benches in its western part. The steam coal is of a lower to medium coalification, relatively poor in sulphur (Sd of about 1 %) and rich in water compared to the coal of the North Bohemian Basin. Only the east of the central part of the basin has been mined since 2001. The seam is extracted by two large open-pit mines Jiří (mining lease Alberov) and Družba (mining lease Nové Sedlo) and one smaller open-pit mine Marie (mining lease Královské Poříčí). The calorific value Qi
r is 12–13 MJ/kg and ash content Ad between 20 and 23 %. The coal is used mainly in energy generation (sorted brown coal, burning in power plants, gas and briquette production) but also in some carbochemical products. Coal of the lower Josef seam with higher degree of coalification but at the same time higher ash, Ge, sulphur and other impurities (As, Be) contents, is not used anymore. It was mined at isolated relics s. from Karlovy Vary in a smaller extent in the past.
The Cheb Basin has more than 1.7 billion tonnes of reserves of brown coal of a low coali-fication (the calorific value Qi
r is about 10 MJ/kg). The coal is characterised by a high con-tent of water, ash (20–40 %), sulphur (2-4 %) and other impurities. It might be suitable for chemical processing due to its locally high content of liptodetrite and therefore also mineral tar. It was shortly mined in a small extent in the Pochlovice part of the basin on the E in the past. Renewal of the mining operations in this basin are though excluded for the time being as major part of the reserves is blocked by protection of the mineral water sources of the Františkovy Lázně Spa.
The Zittau (Žitava) Basin extends into the Czech Republic by a minor part from Poland and Germany. The upper seam was already mined out by surface mining. Remaining two lower seams are difficult to be mined underground because of both technical and economical problems associated with overlying quicksand.
Minor occurrences of low-quality brown coal in the Bohemian Cretaceous Basin were in a negligible amount occassionally mined, e.g., near Moravská Třebová, Svitavy and others in the past.
Energy minerals

1�1
Bro
wn
coal
rese
rved
.regi
ster
ed.d
epos
its
exha
uste
d.de
posi
ts.a
nd.o
ther
.reso
urce
s
Brown coal

1�2
3. Registered deposits and other resources in the Czech Republic(see map)Coal basins:1 Cheb Basin 3 North-Bohemian Basin2 Sokolov Basin 4 Zittau (Žítava) Basin
4. Basic statistical data of the Czech Republic as of December 31
Year 2002 2003 200�. 2005. 2006Deposits.–.total.number 57 58 57 55 5�
. exploited 9 9 9 9 9Total.mineral.*reserves,... kt. 9.521.538 9.501.2�2 9.873.178 9.�23.625 9.192.305
. economic.explored.reserves 3.159.993 2.989.071 3.088.277 2.616.759 2.562.306
. economic.prospected.reserves 1.9�2.857 1.9�2.506 2.33�.200 2.305.�37 2.305.�37
. potentially.economic.reserves �.�18.688 �.569.665 �.�50.701 �.501.�29 �.32�.562
. exploitable.(recoverable).reserves
1.380.682 1.365.�06 1.091.28� 1.0�5.968 978.839
Mine.production,.kt �8.83� �9.920 �7.8�0 �8.658 �8.915
Notes:* see NOTE on page 12 on a terminological difference between Czech official application of the term
reserves and standard international application of the term• After MPO ČR report “A. Bufka: Uhlí, koks a brikety v České republice v roce 2006” (A. Bufka:
Coal, coke and briquettes in the Czech Republic in 2006) mine production after treatment of coal was 48,600 kt inclusive 3,692 kt sorted and 44,908 kt industrial brown coal in 2006.
Domestic production of selected intermediate products
Year./.kt 2002. 2003 200� 2005. 2006
Briquettes 302 31� 301 301 3�5
Energy minerals

1�3
5. Foreign trade 2702 – lignite, also agglomerated, except jet
2002 2003 200� 2005 2006
Import,.kt 0 0 � 2 25
Export,.kt 1.950 1.27� 1.233 1.�75 1.563
Note: jet is a compact black variety of brown coal used in (mourning) jewelry
Detailed data on brown coal exports (kt)
Country 2002 2003 200� 2005 2006
Slovakia 72� 803 7�3 862 938
Germany 981 169 158 17� 223
Hungary 220 276 272 3�7 366
others 25 26 60 92 36
Brown coal belongs to raw materials the domestic production of which covers fully the domestic consumption. The raw material therefore does not represent an import item and volume of import is relatively small compared to the volume of mine production. It has been oscillating between 1 and 2 mill tonnes per year and is directed mainly to the neighbouring Slovakia. Export to Germany decreased markedly during the last five years – it amounted at about 2 mill tonnes still in 1999–2001.
6. prices of domestic market and foreign trade2702 – lignite, also agglomerated, except jet
2002 2003 200� 2005 2006
Average.import.prices.(CZK/t) NA NA NA NA NA
Average.export.prices.(CZK/t) 676 933 983 952 1.111
Brown coal prices depend on calorific value and granularity. Severočeské doly a.s. offers sorted coal of the average calorific value of 17.6 MJ/kg in category small lump II for CZK 1,460–1,600 per tonne, in the category cube I for CZK 1,380–1,660 per tonne and cube II for CZK 1,120–1,340 per tonne. Brown coal rough powder prices fluctuate between CZK 660 and 960 per tonne, prices of brown coal mixtures used in industry (calorific value of 11.4 to 15.6 MJ/kg) between CZK 600 and 815 per tonne. Brown coal mixture from the mine Nástup Tušimice (calorific value of 10.5–11.5 MJ/kg) was offered for CZK 470 per tonne. Mostecká uhelná společnost a.s. offers sorted coal in category small lump for CZK 1,450–1,750 per tonne, in category cube I for CZK 1,380–1,660 per tonne and cube II for CZK 850–1,030 per tonne. Sokolovská uhelná offers small lump for CZK 860–1,010 per
Brown coal
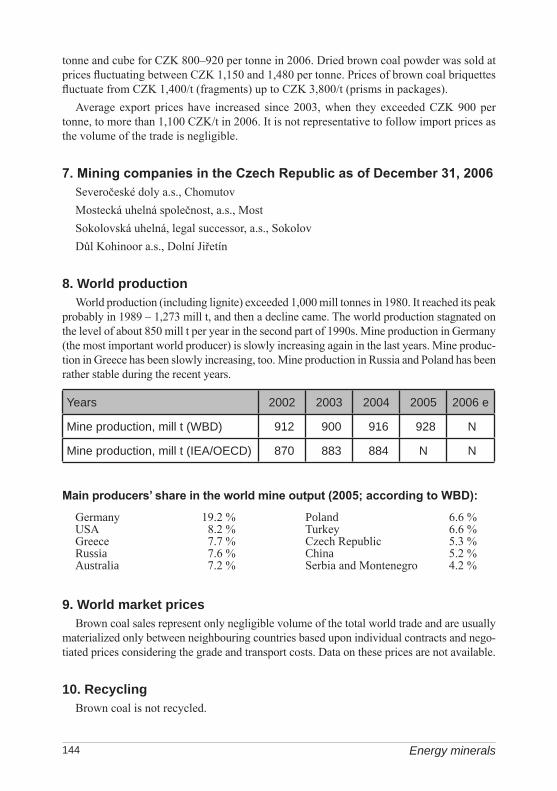
1��
tonne and cube for CZK 800–920 per tonne in 2006. Dried brown coal powder was sold at prices fluctuating between CZK 1,150 and 1,480 per tonne. Prices of brown coal briquettes fluctuate from CZK 1,400/t (fragments) up to CZK 3,800/t (prisms in packages).
Average export prices have increased since 2003, when they exceeded CZK 900 per tonne, to more than 1,100 CZK/t in 2006. It is not representative to follow import prices as the volume of the trade is negligible.
7. Mining companies in the Czech Republic as of December 31, 2006Severočeské doly a.s., ChomutovMostecká uhelná společnost, a.s., MostSokolovská uhelná, legal successor, a.s., SokolovDůl Kohinoor a.s., Dolní Jiřetín
8. World productionWorld production (including lignite) exceeded 1,000 mill tonnes in 1980. It reached its peak
probably in 1989 – 1,273 mill t, and then a decline came. The world production stagnated on the level of about 850 mill t per year in the second part of 1990s. Mine production in Germany (the most important world producer) is slowly increasing again in the last years. Mine produc-tion in Greece has been slowly increasing, too. Mine production in Russia and Poland has been rather stable during the recent years.
Years 2002 2003 200�. 2005 2006.e
Mine.production,.mill.t.(WBD) 912 900 916 928 N
Mine.production,.mill.t.(IEA/OECD) 870 883 88� N N
Main producers’ share in the world mine output (2005; according to WBD):
Germany 19.2 % Poland 6.6 %USA 8.2 % Turkey 6.6 %Greece 7.7 % Czech Republic 5.3 %Russia 7.6 % China 5.2 %Australia 7.2 % Serbia and Montenegro 4.2 %
9. World market pricesBrown coal sales represent only negligible volume of the total world trade and are usually
materialized only between neighbouring countries based upon individual contracts and nego-tiated prices considering the grade and transport costs. Data on these prices are not available.
10. recyclingBrown coal is not recycled.
Energy minerals
1�5Brown coal
11. possible substitutesPossible substitutes differ according to the type of brown coal and its use. In energy
generation, other fuels, particularly nuclear fuel, can replace it. This substitution, however, represents a big investment and it usually meets environmental and other problems. Use of brown coal in energy production is hampered by that it represents a source of emissions, similarly to bituminous coal, natural gas, fuel gas and biomass.

1�6 Energy minerals
lignite
1. Characteristics and useLignite in the Czech terminology is a variety of brown coal, which exhibits the lowest
degree of coalification, is mostly of xylitic character with large or small fragments of wood and tree trunks with preserved growth rings. Lignite is usually comprised in the term brown coal in the world use, whereas it has been traded separately in the Czech Republic. From the petrological viewpoints, it is a brown coal hemitype. Its calorific value on an ash-free but moist basis is lower than 17 MJ/kg (in the US use below about 19 MJ/kg).
However, no strong boundary between brown coal grade and lignite grade of coal has been internationally established and term lignite can designate both Czech brown coal grade and lignite grade of coal which are marketed separately in the Czech Republic.
World proved recoverable reserves of lignite are estimated at about 170 bill tonnes. Their predominant part is located on the territory of Australia (22 %), the USA (19 %), China (11%), Serbia and Montenegro (9 %) and Russia (6 %).
Lignite is used in energy generation and for heating. It represents the lowest quality mineral fuel, consumption of which gradually decreases.
2. Mineral resources of the Czech RepublicLargest deposits of lignite occur along the northern margin of the Vienna Basin, which
extends from Austria into southern Moravia. There are two lignite seams in the youngest sediments of the Pannonian and Pliocene age. Reserves of the northern Kyjov seam are already exhausted (the last mine Šardice was closed in the end of 1992). Those of the south-ern Dubňany seam have been mined by only one underground mine Hodonín-Mikulčice since 1994, when the mining at Dubňany deposit was terminated. The last mine should be closed in 2004, nevertheless negotiations on prolongation of the contract with ČEZ, a.s. and by that also continuation of the mining are in progress. Practically all production is burned in the Hodonín power station owned by ČEZ, a.s. Economic reserves are registered at six other deposits, but their exploitation is not anticipated. South Moravian lignite is of a xylo-detrital character with numerous tree trunks. It is rich in water (45–49 %), ash content Ad is between 23 and 26 %, average content of sulphur Sd is 1.5–2.2 % and its calorific value Qi
r
is 8–10 MJ/kg. Other deposits of low-quality lignite occur in narrow lobe-shaped extremities of the
České Budějovice Basin. Major part of the reserves has been mined out and the remain-ing ones are not of any economic importance.
Smaller isolated occurrences of lignite (Miocene) in the Zittau (Žitava) Basin were to a large extent mined out, too, and the remaining reserves are not of any economic importance.
3. Registered deposits and other resources in the Czech Republic(see map) Principal areas of deposits presence:
1 Vienna Basin 2 České Budějovice Basin 3 Zittau (Žitava) Basin

1�7
rese
rved
.regi
ster
ed.d
epos
its
exha
uste
d.de
posi
ts.a
nd.o
ther
.reso
urce
s
lign
ite
Lignite

1�8
4. Basic statistical data of the Czech Republic as of December 31
Year 2002 2003 200� 2005 2006
Deposits.–.total.number 13 11 11 11 9
. exploited 1 1 1 1 1
Total.mineral.reserves*,.kt 1.028.672 1.011.865 1.010.123 1.007.933 976.985
. economic.explored.reserves 215.866 21�.270 212.982 210.792 205.030
. economic.prospected.reserves
622.577 619.978 622.53� 622.53� 615.273
. potentially.economic.reserves 190.229 177.617 17�.607 17�.607 156.682
. exploitable.(recoverable) 3.676 3.��3 3.065 3.003 2.5��
Mine.production,.kt 501 �70 �50 �67 �59
* see NOTE on page 12 on a terminological difference between Czech official application of the term reserves and standard international application of the term
5. Foreign tradeNo separate customs tariff item exists for lignite.
6. prices of domestic market and foreign tradePrices of South Moravian lignite for energy production (predominant part of the mine
production) have been oscillating around CZK 500 per tonne during the last years. Sorted lignite was offerred in the category small lump at CZK 570 per tonne, in the category cube at CZK 580 per tonne in 2006. Calorific value of the offered lignite fluctuates between 8.0 and 10.0 MJ/kg.
7. Mining companies in the Czech Republic as of December 31, 2006Lignit Hodonín s.r.o., Mikulčice
8. World productionProduction of lignite in the world is included in the brown coal (lignite) production.
Mine production of lignite itself (in the Czech terminology) has been traditionally stated especially in central and south-east Europe (e.g. in Austria, Hungary, Bulgaria, Serbia, Slovenia, Bosnia and Herzegovina, Macedonia).
Energy minerals

1�9Lignite
9. World market pricesLignite is generally not traded outside a producing country.
10. recyclingLignite is not recycled.
11. possible substitutesOther energy minerals can replace lignite exclusively used as a fuel.

150
Crude oil
1. Characteristics and useOil (crude oil, petroleum) is a natural mixture of gaseous, liquid and solid chemical com-
pounds, predominantly hydrocarbons. Its specific gravity fluctuates between 0.75 and 1 t/m3, the average content of carbon is between 80 and 87.5 %, hydrogen between 10–15 % and its calorific value ranges between 38 and 42 MJ/kg. Hydrocarbons are derived from an organic matter originating from subaqueous biochemical decomposition of biomass under specific conditions. The crude oil originates at temperatures between 60 and 140°C in pe-litic oil-bearing sediments at depths between 1,300 and 5,000 m. From these sediments it subsequently migrates and accumulates in permeable, porous reservoirs or fractured collec-tor rocks. The extracted oil is called crude oil and it has highly variable properties such as colour, viscosity, molecular and specific gravity.
Crude oil is classified as light, medium or heavy according to its measured API degrees of gravity. At 60° F (15.6° C) light has higher gravity than 31.1° API, medium has gravity between 22.3–31.1° API, heavy has gravity below 22.3° API.
Principally 4 types of crude oil can be distinguished, based upon its chemical composi-tion – paraffin-base petroleum, asphalt-base petroleum, naphtene petroleum, and mixed bases (aromatic) petroleum.
Sweet and sour crude oil is also distinguished after its sulphur content (sweet below 0.5 wt. % S, sour above this limit).
Total world proved deposit reserves are estimated at 162,000 mill tonnes (almost 1.2 tril-lion barrels), about 75 % of which are located in the OPEC member countries. The highest amount of the proved reserves is found on the territory of Saudi Arabia (22 %), Iran (11 %), Iraq (almost 10 %), Kuwait and United Arab Emirates (8 % each), Russia and Venezuela (6 % each).
Tar sands, also referred to as oil or bituminous sands, resources of which are estimated at 3.5 trillion barrels (472,500 mill tonnes) represent a prospective petroleum source. The larg-est world deposits and resources are in Venezuela and Canada (Alberta). They are mined in a large amount only by open-pits in Canada as their extraction is economically and technically demanding. The content of bitumen (8–14° API) in sands ranges usually between 10 and 12 %. Tar sands are mined to extract the oil-like bitumen which is upgraded into synthetic crude oil or refined directly into petroleum products by specialized refineries.
Crude oil is processed mainly by distillation (refining) so that its individual fractions are separated: gasoline, petrol, kerosene, oil, and lubricating oil, asphalt. Higher carbohydrates (long carbohydrate chains) are processed (shortened) by cracking.
Oil is widely used in industry and new applications are still under way. Nevertheless, energy generation, petrochemical (feeding the transport sector) and chemical industries are the principal oil consumers.
Energy minerals

151Crude oil
2. Oil resources of the Czech RepublicIn contrast to coal, the Czech Republic does not possess sufficient resources of oil or
gas. Reserves and deposits of oil are concentrated mainly in southern Moravia and they are associated with geological units of the Western Carpathians and the south-eastern slopes of the Bohemian Massif. Even though the domestic mine production of crude oil has been increasing in recent years, it covers only roughly 5 % of domestic consumption. The deposits of the Vienna Basin (Moravian part) are distributed over a great number
of individual oil-bearing structures and producing horizons situated at the depth going down to 2,000 m. Sandstones of the Middle and the Upper Badenian represent the most productive oil-bearing rocks. The Hrušky deposit, major part of which has been already extracted, represents the largest deposit of this area. Prospecting in this area however still continues. A new oil deposit with a gas cap has been discovered in the area of Poštorná.
Another region with oil deposits lies in the Moravian part of the Carpathian Foredeep and on the south-eastern slope of the Bohemian Massif. The most important accumulations occur particularly in the collectors in the Miocene, Jurassic and jointed and weathered portions of the crystalline rocks. The Dambořice deposit represents the largest and most important deposit at present. Other important deposits – Žarošice and Uhřice-jih – have been discovered by a systematic exploration based on the 3D interpretation of the seis-mics. Oil is accumulated in the Jurassic sediments – the so-called Vranovice carbonates in the Žarošice deposit and sandstones of Gresten Formation In the Uhřice-jih deposit. These deposits are intensively exploited at present – they take a share of roughly 88 % in the total crude oil mine production in the Czech Republic. Technology of horizontal drilling has been used at the mining in order to reach the highest possible yield. Gas is moreover injected into the apical parts of the deposits to maintain the deposit pressure in case of the Uhřice-jih a Dambořice deposits. This method does not have to be applied in Žarošice deposit yet as the gas cap along with the active bedding water represent here an important source of pressure. Oil and gas deposits are mutually genetically related. Oil deposits of the Vienna Basin
are concentrated in the Badenian and Lower Miocene sediments, whereas in the Sarmatian only gas deposits occur. The light, sulphur-free paraffin to paraffin-naphtene oil prevails in the Czech Republic. Three grades of oil with specific gravity from 856 to 930 kg/m3 at 20°C, which corresponds to 20–33° API, with sulphur content of 0.08–0.32 wt %, were extracted in 2003.
3. Registered deposits and other resources in the Czech Republic(see map)
Principal areas of deposits presence:1 Vienna Basin 2 West-Carpathian Foredeep
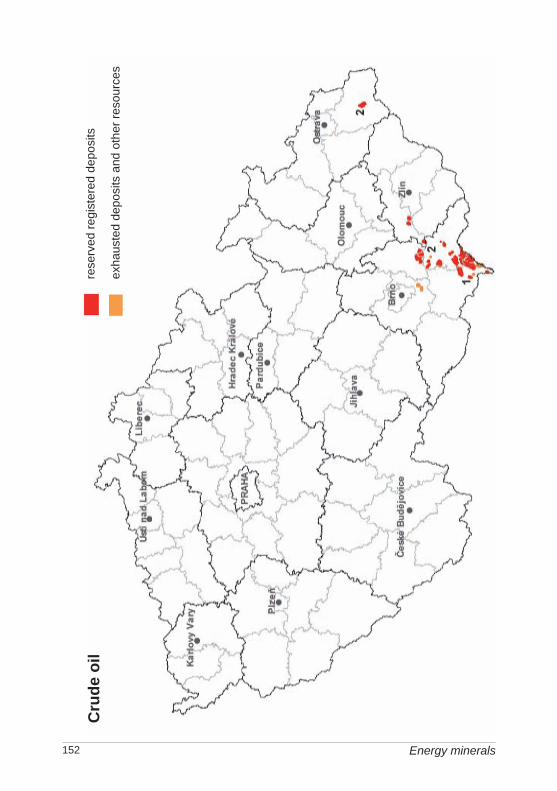
152 Energy minerals
Cru
de o
ilre
serv
ed.re
gist
ered
.dep
osits
exha
uste
d.de
posi
ts.a
nd.o
ther
.reso
urce
s

153
4. Basic statistical data of the Czech Republic as of December 31
Year 2002 2003 200� 2005 2006
Deposits.–.total.number 28 28 28 28 28
. exploited 17 18 19 19 21
Total.mineral.*reserves,.kt. 32.371 32.��3 32.790 32.536 32.277
. economic.explored.reserves 12.785 12.�8� 12.82� 12.526 12.315
. economic.prospected.reserves 8.183 8.557 8.567 8.613 8.609
. potentially.economic.reserves 11.�03 11.�02 11.399 11.397 11.353
. exploitable.(recoverable).reserves 2.577 2.331 3.065 2.325 2.135
Mine.production,.kt 253 310 299 306 259
* see NOTE on page 12 on a terminological difference between Czech official application of the term reserves and standard international application of the term
Crude oil refineries:Česká Rafinérská, a.s. – rafinérie ropy Kralupy nad VltavouČeská Rafinérská, a.s. – rafinérie ropy Litvínov-ZálužíPARAMO, a.s. – HS KolínPARAMO, a.s. – HS Pardubice
Česká Rafinérská, a.s. represents the largest crude oil processing and oil producing com-pany in the Czech Republic. This company operates crude oil refineries in Litvínov and Kralupy nad Vltavou. The company is owned by four share-holders: refinery-petrochemi-cal holding Unipetrol (51.0 %), and the foreign companies ENI, ConocoPhillips and Shell (equal share of 16.33 %).
PARAMO, a.s. is an important Czech producer of fuels (petrol, Diesel oil, light heating oil, heavy heating oil, other oils), car oils, plastic lubricants and vaseline, asphalt insula-tion products and road asphalts. PARAMO, a.s. operates two remaining Czech refineries in Kolín and Pardubice. Refinery in Kolín does not process crude oil but it is an oil refinery equipped with a modern unit of re-distilling of oil hydrogenates (raw material from the Litvínov refinery) producing intermediate products of a high quality for lubricating oil pro-duction. Unipetrol Company with 73.52 % share is the main share-holder of the PARAMO a.s..
Crude oil
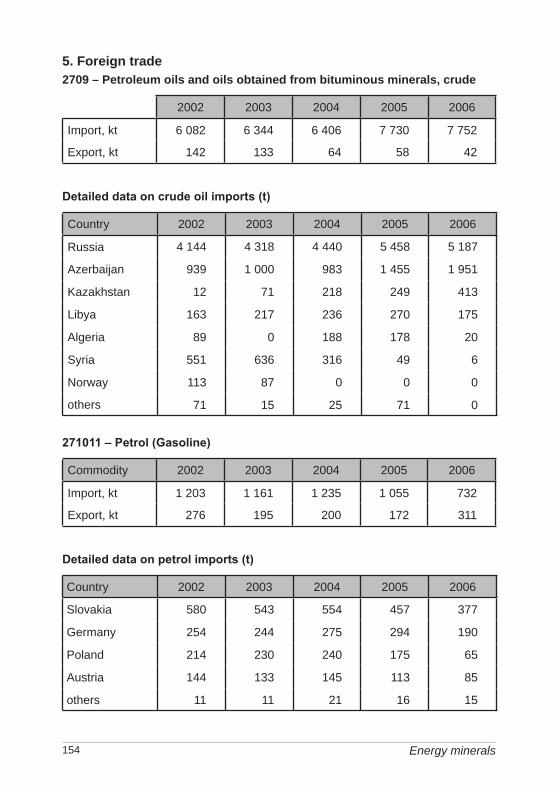
15�
5. Foreign trade2709 – petroleum oils and oils obtained from bituminous minerals, crude
2002 2003 200� 2005 2006
Import,.kt 6.082 6.3�� 6.�06 7.730 7.752
Export,.kt 1�2 133 6� 58 �2
Detailed data on crude oil imports (t)
Country 2002 2003 200� 2005 2006
Russia �.1�� �.318 �.��0 5.�58 5.187
Azerbaijan 939 1.000 983 1.�55 1.951
Kazakhstan 12 71 218 2�9 �13
Libya 163 217 236 270 175
Algeria 89 0 188 178 20
Syria 551 636 316 �9 6
Norway 113 87 0 0 0
others 71 15 25 71 0
271011 – Petrol (Gasoline)
Commodity 2002 2003 200� 2005 2006
Import,.kt 1.203 1.161 1.235 1.055 732
Export,.kt 276 195 200 172 311
Detailed data on petrol imports (t)
Country 2002 2003 200� 2005 2006
Slovakia 580 5�3 55� �57 377
Germany 25� 2�� 275 29� 190
Poland 21� 230 2�0 175 65
Austria 1�� 133 1�5 113 85
others 11 11 21 16 15
Energy minerals

155
As the domestic mine production covers only negligible part of the domestic crude oil consumption (about 4–5 %), predominant part of the raw material has to be imported. To-tal import volume has been increasing systematically – it increased by 27.5 % during the period 2002–2006, which represents an increase by 5.5 % per year. The largest part of the imported oil comes traditionally from Russia – it makes roughly two thirds of total import. Azerbaijan with a share which increased from about 15 % in 2002 to about 25 % in 2006 is the second most important country from which oil is imported. Kazakhstan and Libya rank to other more significant stable oil importing countries to the Czech Republic. Spectrum of the other countries is variable.
In addition to oil, also oil derivates, especially petrol, are imported in the Czech Repub-lic. Volume of the imported petrol fluctuates between 0.7 and 1.2 mill tonnes and its major part is imported from Slovakia and Germany.
6. prices of domestic market and foreign trade2709 – petroleum oils and oils obtained from bituminous minerals, crude
2002 2003 200� 2005 2006
Average.import.prices.(CZK/t) 5.501 5.732 6.536 8.83� 10.6�6
Average.export.prices.(CZK/t) 3.990 5.057 6.776 8.952 10.103
271011 – Petrol (Gasoline)
2002 2003 200� 2005 2006
Average.import.prices.(CZK/t) 8.12� 8.608 10.705 13.015 1�.636
Average.export.prices.(CZK/t) 8.15� 8.551 9.915 12.938 1�.519
Average import prices of oil in the Czech Republic have increased steeply in relation to a marked increase of crude oil world prices during recent years. In comparison with the year 1999, when crude oil was imported at average price of CZK 3,680 per tonne, the import prices were two times higher in 2000 (CZK 7,486 per tonne). That was caused by a violent increase of crude oil prices on the world market and by a significant weakening of the CZK against USD. Also in 2001, the import price of crude oil was still relatively high (CZK 6,808 per tonne) with regard to the situation on the world markets, irrespective of a repeated strengthen-ing of the CZK against USD. This unfavourable trend did not improve until 2002, when the average import price of CZK 5,501 per tonne was reached thanks to the lower oil prices on the world market and the long-term increase of the CZK rate to USD. Average import price increased again up to CZK 5,732 per tonne in 2003 due to the evolution on the world market and this trend continued in 2004, too. The average import price reached CZK 6,536/t (34.7 USD/bbl). Steep rise of the crude oil prices continued also in 2006, when even the limit of CZK 10 ths per tonne was overstepped. Average import price of oil oscillated around USD 66/bbl. Strengthening of the CZK against USD protects domestic economy against even more serious impacts.
Crude oil
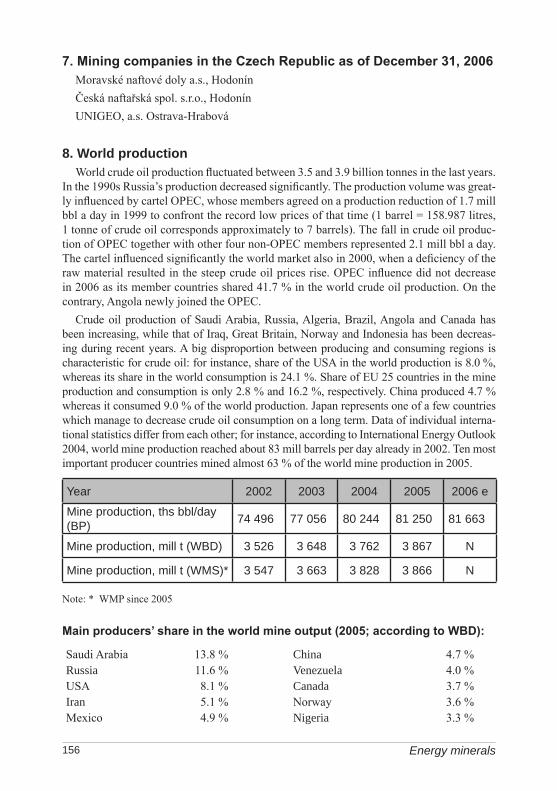
156
7. Mining companies in the Czech Republic as of December 31, 2006Moravské naftové doly a.s., HodonínČeská naftařská spol. s.r.o., HodonínUNIGEO, a.s. Ostrava-Hrabová
8. World productionWorld crude oil production fluctuated between 3.5 and 3.9 billion tonnes in the last years.
In the 1990s Russia’s production decreased significantly. The production volume was great-ly influenced by cartel OPEC, whose members agreed on a production reduction of 1.7 mill bbl a day in 1999 to confront the record low prices of that time (1 barrel = 158.987 litres, 1 tonne of crude oil corresponds approximately to 7 barrels). The fall in crude oil produc-tion of OPEC together with other four non-OPEC members represented 2.1 mill bbl a day. The cartel influenced significantly the world market also in 2000, when a deficiency of the raw material resulted in the steep crude oil prices rise. OPEC influence did not decrease in 2006 as its member countries shared 41.7 % in the world crude oil production. On the contrary, Angola newly joined the OPEC.
Crude oil production of Saudi Arabia, Russia, Algeria, Brazil, Angola and Canada has been increasing, while that of Iraq, Great Britain, Norway and Indonesia has been decreas-ing during recent years. A big disproportion between producing and consuming regions is characteristic for crude oil: for instance, share of the USA in the world production is 8.0 %, whereas its share in the world consumption is 24.1 %. Share of EU 25 countries in the mine production and consumption is only 2.8 % and 16.2 %, respectively. China produced 4.7 % whereas it consumed 9.0 % of the world production. Japan represents one of a few countries which manage to decrease crude oil consumption on a long term. Data of individual interna-tional statistics differ from each other; for instance, according to International Energy Outlook 2004, world mine production reached about 83 mill barrels per day already in 2002. Ten most important producer countries mined almost 63 % of the world mine production in 2005.
Year 2002 2003 200� 2005 2006.e
Mine.production,.ths.bbl/day.(BP). 7�.�96 77.056 80.2�� 81.250 81.663
Mine.production,.mill.t.(WBD) 3.526 3.6�8 3.762 3.867 N
Mine.production,.mill.t.(WMS)* 3.5�7 3.663 3.828 3.866 N
Note: * WMP since 2005
Main producers’ share in the world mine output (2005; according to WBD):
Saudi Arabia 13.8 % China 4.7 %Russia 11.6 % Venezuela 4.0 %USA 8.1 % Canada 3.7 %Iran 5.1 % Norway 3.6 %Mexico 4.9 % Nigeria 3.3 %
Energy minerals

157
9. World market pricesCrude oil is a commodity that is extremely sensitive to the global political and economic
conditions. Until recently the highest prices were reached in 1990 at over USD 40/barrel in consequence of the Gulf War. In 1991–1995, the crude oil price markedly decreased to USD 15–20/bbl. The price increased by about USD 24/bbl in 1996. However, the prices were de-creasing since the end of 1996 in consequence of uncontrollable growth of production. The crude oil price hit twelve-year minimum (USD 10/bbl) in December 1998. Therefore the OPEC members signed an agreement on the significant reduction in production in spring 1999, which was joined by some important producers – non-OPEC members (Mexico, Oman, Russia, Norway). A surprising respect of the production limits by the member states led to the considerable growth of prices. During 1999 the prices increased about three times and they settled in a range between USD 24 (Dubai) and USD 27 (Brent) per barrel by the end of the year. The OPEC influenced significantly the crude oil world prices also in 2000, when the prices were increasing even if the OPEC production increased several times and even if at year-end the total mine production of this cartel was higher than during of the price crisis at the beginning of 1999. The OPEC succeeded to drain a considerable part of crude oil stockpiles in particular countries by which it provoked impression of the raw ma-terial deficiency. At the beginning of September 2000, price of Brent was around USD 37 and of Dubai USD 31–32 per barrel. Also in 2001, the OPEC succeeded in ruling the world prices according to its ideas – price of Dubai was between USD 16 and 27 per barrel, of Brent USD 17–29 per barrel. In 2002 the oil prices on the world market were 18–30 USD per barrel (Brent) and 17–28 USD per barrel (Dubai), respectively. The year 2003 has seen a further increase of the world oil prices. Its major cause was a conflict in the Middle East, due to which the uncertainty concerning supply of the world market by this strategic raw material increased. Oil prices oscillated between 23 and 34 USD per barrel (Brent) and 22 and 31 USD per barrel (Dubai), respectively, as a result of the international situation.
World price of oil experienced a dramatic evolution in 2004. The uncertainty of deliver-ies from the Persian Gulf area all the time shaken by violence was combined with an even more important factor – steeply increasing oil consumption in rapidly growing economies of the emerging countries (China, India, Indonesia, Brazil etc.). Indonesia, until recently an important world producer of oil, represents an example: it considers leaving the OPEC cartel as it has become a pure oil importer during the last 2–3 years. In consequence of these factors, the oil price Brent increased systematically for whole ten months from value of USD 29 per barrel (January 2004) up to USD 52 per barrel (October 2004). The price evolution of oil Dubai followed a similar scenario in 2004; just the interval of the prices was narrower (USD 27 to 41 per barrel). Crude oil prices followed similar trends in 2005. The oil price Brent more or less gradually increased from 40 USD/bbl to 68 USD/bbl. Price interval of the oil Dubai fluctuated between 34 and 60 USD/bbl with a similar marked in-crease during January – September and a small correction and stagnation until the end of the year. World prices of oil remained on a high level in 2006, too – oil price Brent fluctuated in a large range of 58–78 USD/bbl. Almost continual price rise up to the nominal historical maximum of about USD 78/bbl in the first decade of August was characteristic of Janu-ary–August 2006. The prices decreased down to the level of USD 60/bbl in August–Octo-ber 2006. World crude oil prices were on a high level in the first half of 2007 as well. With regard to the fact that the cause of the growth trend will not cease to exist, we can expect further and further until recently hardly credible price maxima.
Crude oil

158
The major world commodity exchanges (IPE, NYMEX) quote prices of direct sales (spot) and prices of long-term contracts in USD per barrel, FOB. Daily quotations regularly include prices of the North Sea Brent, the American West Texas Intermediate (WTI) and the OPEC basket of crude oils (7 types of oils – Saharan Blend of Algeria, Minas of Indonesia, Bonny Light of Nigeria, Arab Light of Saudi Arabia, Dubai Fateh of Dubai, Tia Juana of Venezuela and Isthmus of Mexico). Different crude oil prices reflect its grade, which is ex-pressed in degrees of API (Brent 38°, WTI 34.5°, Arab Light 34°, Dubai Fateh 32°, Russia Export blend 32°).
The average spot price quotations (according to IEA)
Commodity/Year 2002 2003 200� 2005 2006
Brent.crude.oil,.CIF.Rotterdam USD/barrel 2�.99 28.85 38.26 5�.57 65.16
OPEC.basket.crude.oil,.CIF.Rotterdam USD/barrel 23.67 26.75 33.�3 �9.�0 61.38
West.Texas.Intermediate.(WTI).oil,.CIF.Rotterdam USD/barrel 26.18 31.08 �1.51 56.6� 66.05
10. recyclingCrude oil is not recycled. Some products made of oil can be nevertheless recycled, es-
pecially plastics. The Czech Republic belongs among important producers of plastic prod-ucts. Domestic production of plastics increased by 93 % in 2000–2004, the most in whole EU. Development of the branch is related especially to the increase of car production in the Czech Republic, as there is 100 to 200 kg of plastic products on a car. Demand of the wrapping industry has been rising, too – it represents a dominant plastics consumer in the Czech Republic (47 %). Average consumption of plastics per capita is about 60–70 kg in the Czech Republic, the most of the countries of central and Eastern Europe. Average of the EU countries is between 90 and 100 kg per capita.
The Czech Republic occupies the second place after Germany among the EU countries as plastics recycling concerns. 38 % of sorted plastics were recycled in 2004 in the Czech Republic; it was already 42 % in 2005. Fibres, which can be used as sleeping bag or win-ter jacket filling and can be added also in loaded carpets, can be made of recycled PETE bottles. Litter bags, waste baskets or garden furniture can be made by recycling of other plastics.
11. possible substitutesOil may be successfully substituted to certain extent by other types of fuels in energy gen-
eration. As for gasoline or other oil derivatives, these can be substituted to a certain degree by fuels based on plants.
Energy minerals

159
Natural gas
1. Characteristics and useNatural gas is a mixture of gaseous hydrocarbons, principally methane (CH4), with other
gases (nitrogen, carbon dioxide, hydrogen sulphide, hydrogen, inert gases). Methane domi-nates in the mixture from more than 50 %. There is also some natural blending with crude oil, water and sand when exploiting natural gas. Three principal grades of natural gas are recognized in the Czech Republic: dry gas (containing 96–99 % of methane), wet gas (85–95 % of methane plus admixture of other hydrocarbons) and gas containing higher portion of inert components (50–65 % of methane, more than 10 % of nitrogen – N2 and more than 20 % of carbon dioxide – CO2).
The world´s economic reserves of natural gas were estimated at about than 180 trillions of m3. The greatest part of economic reserves is situated in the territories of Russia – almost 27 %, Iran – above 15 % and Qatar (above 14 %). Rather large reserves are also on the ter-ritory of Saudi Arabia (almost 4 %), United Arabian Emirates (above 3 %), the USA (3 %), Niger (almost 3 %), Algeria and Venezuela (roughly 2.5 % each).
Solid methane in form of the so-called gas hydrate could represent a perspective re-source. Usually it occurs in sediments of the ocean floor or in permafrost. However, its extraction has not been completely technologically and economically solved.
Gas of usually Carboniferous age emitted out of coal seams (Coal Bed Methane – CBM) may be classified as natural gas, too. The Carboniferous gas contains 90–95 % of methane. Its volume varies from 0 to 25 m3 per tonne of coal. It depends on a degree of carbonification and on the depth of occurrence.
Natural gas is along with crude oil and coal main world natural fuel. It is a universal energy source – the most often it is used for heating and electric energy production.
2. Natural gas resources of the Czech RepublicAs with crude oil, the Czech Republic is not endowed with sufficient reserves of natural
gas either. Deposits and reserves are accumulated in southern and northern Moravia. They are associated with geological units of the Western Carpathians and the south-eastern slopes of the Bohemian Massif, where they usually occur together with crude oil. In northern Moravia they are also associated with coal seams of the Upper Silesian Basin. Extraction of natural gas in the Czech Republic has been rather stable on a long term and it covers roughly 1–2 % of domestic consumption. The exploatation has violently increased in 2005 due to a single-phase exhaust of recoverable reserves of gas cushion of the underground gas storage Dolní Bojanovice (Poddvorov deposit).Natural gas deposits, genetically associated with formation of oil, occur in the Moravian
part of the Vienna Basin. Crude oil deposits are concentrated mainly in the central part of the Basin, natural gas deposits prevail in peripheral areas. They occur in the Badenian sediments along with oil deposits either as independent natural gas deposits or in form of gas caps of the oil deposits or gas dissolved in the oil. The overlying Sarmatian sedi-ments contain almost exclusively only natural gas deposits. Exploited natural gas con-tains 87.2–98.8 % volume of CH4, its calorific value is 35.6–37.7 MJ/m3 (dry natural gas
Natural gas
160 Energy minerals
at 0°C), specific gravity is 0.72–0.85 kg/m3 (at 0°C) and content H2S is under l mg/m3. New natural gas resources have been discovered especially in the Prušánky area during exploration mostly using the 3D seismics. Based on these positive results, further explo-ration will focus on analogical types of deposit structures. The largest mined-out natural gas deposits from the Hrušky and Poddvorov fields have been used as underground gas storages Tvrdonice and Dolní Bojanovice.
The Carpathian Foredeep and south-eastern slopes of the Bohemian Massif represent another area with common oil and gas occurrences. Dolní Dunajovice and Horní Žukov (gas deposits converted into underground storages) and Lubná-Kostelany (today almost mined out) belong to the largest deposits. The most important accumulations are con-fined mainly to collectors in the Miocene, Jurassic and jointed and weathered portions of the crystalline rocks. The deepest exploited deposit is Karlín, where natural gas (and gas condensate) was mined from depth of more than 3,900 m. The composition of local gas deposits varies considerably. The Dolní Dunajovice deposit is characterized by high content of methane (98 %), whereas the deposit Kostelany–západ contains only 70 % methane and is rich in helium and argon, which can be extracted on industrial scale. Rather large reserves are bound in gas caps of the deposits with oil mining Ždánice-Mi-ocene and Kloboučky. Mining technology which would enable to extract economically not only the natural gas bound in gas caps but also a part of heavy oil reserves has been intensively searched for. New natural gas resources have been discovered especially in the Poštorná area during exploration mostly using the 3D seismics. Based on these positive results, further exploration will focus on analogical types of deposit structures. Gas deposits Dolní Dunajovice and Uhřice are secondarily used as underground gas storages. In northern Moravia, specifically between Příbor and Český Těšín, the gas de-posits are mostly associated with the weathered and tectonically affected Carboniferous paleorelief, or with the directly overlying clastic rocks of the Miocene. Several natural gas deposits have been opened in this area during the last years, with the most important deposit Janovice. The origin of gas in these deposits developed in the apical parts of the Carboniferous morphological elevations has not been explained yet – either the gas is formed during the coalification of coal deposits, or it is related to crude oil formation. This concerns especially Bruzovice and Příbor deposits. Part of the Příbor gas deposit or already mined-out Žukov deposit is used as underground gas reservoir.
Natural gas of obviously Carboniferous origin and age is extracted during so-called degas-sing (extraction from already closed underground mines) of coal seams of the Czech part of the Upper Silesian coal basin. Mine gases are diluted by air and the resulting concentration of such gases reaches about 50–55 % CH4. O2, N2, CO and CO2 are present, too. The natural gas quality varies considerably depending on the method of extraction and technical limita-tions related to degassing. CH4 content in non-diluted Carboniferous gas is 94–95 %. Gas from individual localities is delivered by more than 100 km long network of gas pipelines to local consumers (e.g. Mittal Steel). Natural gas adsorbed on coal seams makes less than 10 % of the total present production in the Czech Republic. Its proportion as recoverable reserves concerns however represents 85 % from the total roughly 28 billion m3. Natural gas from the mines Dukla, Lazy and Doubrava goes by 22 km long pipeline to the steel works Nová Huť in Ostrava. The Carboniferous gas contains from 94 to 95 % of CH4.
Numerous occurrences of natural carbohydrates both on the surface and in boreholes were found in the area of the Carpathian flysh nappes. Extraction of several deposits (e.g. Hluk) of restricted extent took place in the past.

161
Nat
ural
gas
rese
rved
.regi
ster
ed.d
epos
its.o
f.nat
ural
.gas
exha
uste
d.de
posi
ts.a
nd.o
ther
.reso
urce
s.of
.nat
ural
.gas
rese
rved
.regi
ster
ed.d
epos
its.o
f.nat
ural
.gas
.ads
orbe
d..
on.c
oal.s
eam
sot
her.r
esou
rces
.of.n
atur
al.g
as.a
dsor
bed.
on.c
oal.s
eam
sun
derg
roun
d.ga
s.re
serv
oirs
Natural gas
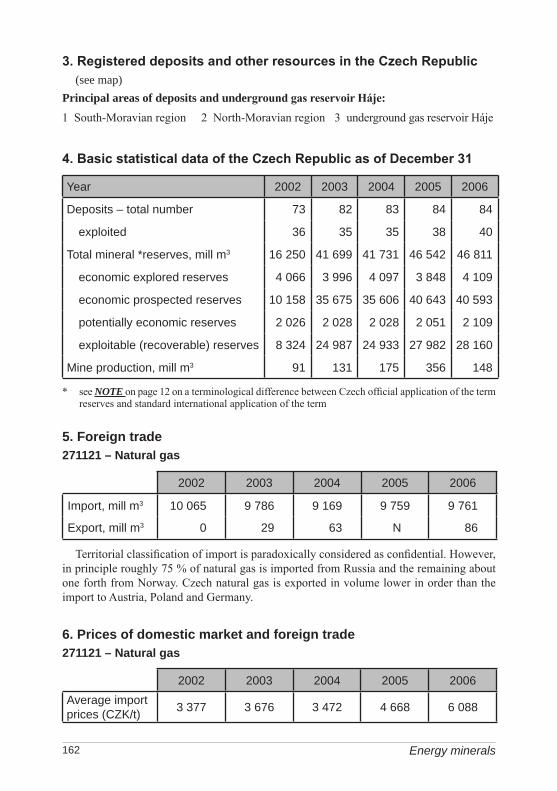
162
3. Registered deposits and other resources in the Czech Republic(see map)
Principal areas of deposits and underground gas reservoir Háje:1 South-Moravian region 2 North-Moravian region 3 underground gas reservoir Háje
4. Basic statistical data of the Czech Republic as of December 31
Year 2002 2003 200� 2005 2006
Deposits.–.total.number 73 82 83 8� 8�
. exploited 36 35 35 38 �0
Total.mineral.*reserves,.mill.m3. 16.250 �1.699 �1.731 �6.5�2 �6.811
. economic.explored.reserves �.066 3.996 �.097 3.8�8 �.109
. economic.prospected.reserves 10.158 35.675 35.606 �0.6�3 �0.593
. potentially.economic.reserves 2.026 2.028 2.028 2.051 2.109
. exploitable.(recoverable).reserves. 8.32� 2�.987 2�.933 27.982 28.160
Mine.production,.mill.m3 91 131 175 356 1�8
* see NOTE on page 12 on a terminological difference between Czech official application of the term reserves and standard international application of the term
5. Foreign trade271121 – Natural gas
2002 2003 200� 2005 2006
Import,.mill.m3 10.065 9.786 9.169 9.759 9.761
Export,.mill.m3 0 29 63 N 86
Territorial classification of import is paradoxically considered as confidential. However, in principle roughly 75 % of natural gas is imported from Russia and the remaining about one forth from Norway. Czech natural gas is exported in volume lower in order than the import to Austria, Poland and Germany.
6. prices of domestic market and foreign trade271121 – Natural gas
2002 2003 200� 2005 2006Average.import.prices.(CZK/t) 3.377 3.676 3.�72 �.668 6.088
Energy minerals

163
As in case of crude oil, the import prices multiplied twice in 2000 (CZK 2,063 for thousand m3 in 1999; CZK 4,059 on thousand m3 in 2000). Import prices of natural gas remained high also in the following years (2001: CZK 4,615/ths m3; 2002: CZK 3,377/ths m3, 2003: CZK 3,676/ths m3; 2004: CZK 3,472/ths m3; 2005: CZK 4,668/ths m3). A slight decrease of the average import price in 2004 was due to strengthening of the CZK against USD. Average im-port prices of natural gas continued to rise in 2006 by full 30 % in between the years.
7. Mining companies in the Czech Republic as of December 31, 2006Moravské naftové doly a.s., Hodonín OKD, Důlní průzkum a bezpečnost, a.s., Paskov UNIGEO a.s., Ostrava-HrabováČeská naftařská spol. s.r.o., Hodonín
In adition to natural gas production there was another major activity of Moravské naf-tové doly – construction of underground storage facilities. Storage in Dolní Bojanovice started to operate in October 1999. Its present capacity is 570 mill m3. Underground storage in Uhřice with capacity of 180 mill m3 started operation in April 2001.
Company RWE Transgas, a.s., owns six underground storage facilities (Dolní Dunajo-vice, Tvrdonice, Štramberk, Lobodice, Háje u Příbrami and Třanovice) on the territory of the Czech Republic with capacity of about 2.055 billion m3, which represents roughly one third of the annual consumption of the Czech Republic. RWE Transgas has been using also a rented storage capacity in Slovakia (0.5 billion m3) and in Germany (0.5 billion m3).
8. World productionWorld natural gas production persisted in the range of about 2,400 up to 2,800 billion m3 a
year during the last five years. It was unaffected by the decrease in production in Russia, the major world producer of natural gas, because that was offset by increased production in other countries, particularly in Canada, the Middle East countries, and elsewhere. World production was as follows (according to the British Petroleum, Welt Bergbau Daten – WBD and World Mineral Statistics):
Year 2002 2003 200�. 2005 2006.e
Mine.production,.bill..m3.(BP) 2.525 2.61� 2.703 2.780 2.865
Mine.production,.bill..m3.(WBD) 2.5�0 2.570 2.612 2.6�7 N
Mine.production,.bill..m3.(WMS)* 2.603 2.670 2.787 2.829 N
Note: * WMP since 2005
Natural gas

16�
Main producers’ share in the world mine output (2005; according to WBD):
Russia 23.0 % Indonesia 3.2 %USA 19.4 % Algeria 3.2 %Canada 7.1 % Iran 3.0 %Great Britain 3.5 % Saudi Arabia 3.0 %Norway 3.4 % The Netherlands 2.8 %
Russian natural gas production has been reported under the standard pressure of 0.1 MPa and temperature of 20 oC. To compare it with western standards it is necessary to multiply the values by a factor of 0.9315.
The gas of Carboniferous origin emitted during extraction of coal seams reached about 25 billion m3 per year. It represented 4–6 % of all methane emissions from both natural and artificial sources of methane in the world. About 1.6 billion m3 of gas, i.e. approximately 6 % of the given 25 billion m3, were used for industrial purposes. The remainder went to the atmosphere. According to 1996 data, 10 countries used the Carboniferous gas – China, Rus-sia, Czech Rep., Germany, Poland, Great Britain, the USA, Australia, France and Ukraine.
9. World market pricesMost of the natural gas contract prices are linked to crude oil market prices as there are
not internationally quoted world natural gas prices but there are bilateral long-term supply contracts.
General increase in natural gas consumption was accompanied by decrease in costs of transport paid by consumers for imported gas (approximately 75 % of gas is transported through pipelines and about 25 % in tankers in liquefied state). Natural gas prices are nego-tiated and are quoted in USD per mill Btu. Natural gas price for customer in Europe that had been still fluctuating between USD 3.6 and 4 per mill Btu in 1985 fluctuated around USD 2.25 per mill Btu in 1996. Prices fell down to USD 1.7–2.0 per mill Btu in 1998. Natural gas prices fluctuated between 1.8 and 2.9 per mill Btu in 1999. Natural gas prices increased significantly in connection with increase of crude oil prices during 2000. In autumn 2000, natural gas prices were for the first time in history higher than USD 5 per mill Btu. In 2001, the prices were oscillating between USD 1.9 and 3.4 mill Btu, in 2002 in a relatively broad range of 2.0–5.3 USD/mill Btu. The local maxima were reached in 2003, when natural gas was traded shortly in the end of February for 9.5 USD/mill Btu. The prices fluctuated mainly between 4.5 and 7.2 USD/mill Btu for the rest of the year, with the annual average of 5.5 USD/mill Btu. High prices of the natural gas in 2003 copied the record-breaking prices of the crude oil. Natural gas price remained rather high in 2004 in relation to the still record crude oil prices. The price oscillated between 4.5 and 9.0 USD/mill Btu and the an-nual average was 6.17 USD/mill Btu. World prices of natural gas oscillated in a wide range between USD 5.5/mill Btu and USD 15.5/mill Btu. High prices of the natural gas in 2003 copied the record-breaking prices of the crude oil. Natural gas price remained rather high in 2004 in relation to the still record crude oil prices. The price oscillated between 4.5 and 9.0 USD/mill Btu and the annual average was 6.17 USD/mill Btu. World prices of natural gas oscillated in a wide range between USD 5.5/mill Btu and USD 15.5./mill Btu in 2005. Prices markedly rose especially in the second half of the year, when they reached very high
Energy minerals
165
values. In 2006 natural gas prices ranged between 5.5 and 11.0 USD/mill Btu with pre-dominating decrease in the first and reincrease in the second half of the year. Increase of the world natural gas prices is due to the fact that this energy mineral represents an alternative to the other mineral fuels. As with oil and other minerals, the stated prices are nominal the rise of which is apart from fundamental factors partly influenced also by long-term decrease of the US dollar.
10. recyclingNatural gas is not recycled.
11. possible substitutesNatural gas can be successfully substituted to a certain extent by other types of fuel in
energy generation. However, natural gas itself represents economically and ecologically effec-tive substitute for all other mineral fuels.
Natural gas


167
INDUSTrIal MINEralS – geological reserves and mine production
In addition to energy minerals, industrial minerals represent the most important group of minerals on the territory of the Czech Republic. Raw materials for ceramic and glass industry are traditionally important as their geological reserves as well as mining concerns. Kaolin of the Plzeň (Pilsen) and Karlovy Vary regions as well as Kadaň and Podbořany re-gions is the most significant one. Other important raw materials are glass sand from Střeleč and Provodín surroundings, feldspar from Halámky and Krásno and clay from the Cheb Basin and central Bohemia. Reserves of limestone and raw materials for cement production are large and their mine production reaches high volume.
Kaolin, quartz sand, limestone, clays, feldspar and dimension stone are also important export commodities in mineral sector.
On the other hand, the production of formerly important graphite, pyrite, fluorite, barite and some other industrial minerals was already terminated, most likely definitely.
Mining of industrial minerals – reserved deposits
Raw.material Unit 2002 2003 200� 2005 2006
Graphite kt 16 9 5 3 5
Pyrope-bearing.rock kt 52 53 �2 �3 39
Kaolin kt 3.650 �.155 3.862 3.882 3.768
Clays kt 56� 55� 6�9 671 561
Bentonite kt 17� 199 201 186 220
Feldspar kt �01 �21 �88 �72 �87
Feldspar.substitute.(phonolite) kt 29 27 26 23 31
Glass.and.foundry.sand kt 1.527 1.616 1.659 1.727 1.736
Fusible.basalt kt 38 13 12 1� 19
Diatomite kt 28 �1 33 38 53
Limestones.(total). kt 9.872 10.236 10.568 9.912 10.193
. high.percentage.limestones kt 5.017 �.573 �.629 �.199 �.386
. other.limestones kt 3.632 �.��� �.666 �.500 �.6�3
Dolomites kt 31� �16 3�5 �19 �09Corrective.additives.for.cement.production kt 163 201 232 278 2�8
Gypsum kt 108 10� 71 25 16
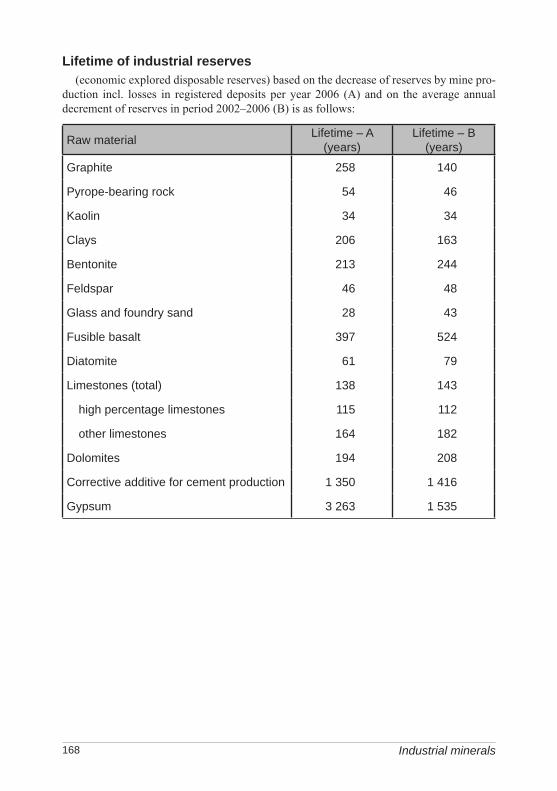
168
lifetime of industrial reserves(economic explored disposable reserves) based on the decrease of reserves by mine pro-
duction incl. losses in registered deposits per year 2006 (A) and on the average annual decrement of reserves in period 2002–2006 (B) is as follows:
Raw.material Lifetime.–.A.(years)
Lifetime.–.B.(years)
Graphite 258 1�0
Pyrope-bearing.rock 5� �6
Kaolin 3� 3�
Clays 206 163
Bentonite 213 2��
Feldspar �6 �8
Glass.and.foundry.sand 28 �3
Fusible.basalt 397 52�
Diatomite 61 79
Limestones.(total) 138 1�3
. high.percentage.limestones 115 112
. other.limestones 16� 182
Dolomites 19� 208
Corrective.additive.for.cement.production 1.350 1.�16
Gypsum 3.263 1.535
Industrial minerals

169
Fluorspar
1. Characteristics and useFluorspar is the commercial term of the mineral fluorite. Most fluorspar deposits are
veins of hydrothermal origin. Fluorspar deposits which originated by infiltration, meta-somatism and sedimentation are much less abundant. Other minerals like quartz, barite, calcite, etc. usually accompany fluorspar. According to the USGS, world economic reserves of fluorspar are given at 480 mill t (reserve base), about 230 mill t of which represent re-serves. The largest part of the reserves is located on the territory of China (23 %), South Africa (17 %) and Mexico (more than 8 %). Phosphate rock deposits containing about 3 % of fluorine on average could represent a potential fluorine source in future.
Three basic grades of fluorspar can be distinguished according to their quality and speci-fication:a) metallurgical grade (min. 85 % CaF2, max. 15 % SiO2);b) acid grade (min. 97 % CaF2, up to 1.5 % SiO2, 0.1–0.3 % S);c) ceramic grade (80–96 % of CaF2, up to 3 % SiO2).
More than half of the mined fluorspar is used in chemical industry for production of fluorine (F), hydrofluoric acid (HF), NaF and synthetic cryolite. Fluorine is contained in teflon and refrigerants (Freons). Metallurgical aluminium industry also consumes relatively large volumes of fluorspar (1/3 of the total fluorspar production). Other applications are for example in cement production, in glass industry (glass with 10 to 30 % CaF2 is milky, opaque and opalescent) in enamels, etc. Complex chemicals with fluorine and bromine are used in fire extinguishers and anaesthetics.
2. Mineral resources of the Czech RepublicAll Czech fluorspar deposits are of hydrothermal origin, i.e. vein, stockwork and rarely
even impregnation or metasomatic types. They are mostly located in marginal parts of the Bohemian Massif, associated with major fault zones of the Krušné hory Mts. (NE-SW) and the Labe-Lužice (NW-SE) lineaments direction. The most important deposits are located in the Krušné Hory Mts. (e.g. Moldava, Kovářská), less important ones in the Lužice area of the Bohemian Cretaceous Basin (Jílové u Děčína), Železné hory Mts. (Běstvina). Smaller deposits and occurrences are also in other parts of the Bohemian Massif (e.g. Krkonoše Mts. – Har-rachov, Ještěd Mts. piedmont – Křižany et al.)Fluorite accumulations are most often associated with a considerable proportion of barite
(for instance registered deposits Běstvina, Kovářská, and mined out deposits Krásná Lípa, Hradiště u Vernéřova, Harrachov, Křižany u Liberce et al.).
Smaller part of fluorite accumulations contains almost no barite (e.g. registered deposit Jílové u Děčína and mined out deposits Blahuňov u Chomutova, Kožlí u Ledče et al.) or there are just subordinate barite contents (e.g. registered deposit Moldava, mined-out deposit Vrchoslav et al.). Industrial mining of fluorite in the Czech Republic started in the beginning of the 1950s
(apart from a small mine in Kožlí u Ledče nad Sázavou during both of the world wars) and continued until the first quarter of 1994, when extraction from Jílové, Běstvina and Mol-
Fluorspar

170
dava deposits was terminated. Resumption of mining is not foreseen, as there is sufficient amount of raw material of higher quality and lower price especially from China. Czech deposits are of no economic use at present.
3. Registered deposits and other resources in the Czech Republic(see map)
Registered deposits and other resources are not mined1 Běstvina 3 Kovářská2 Jílové u Děčína 4 Moldava
4. Basic statistical data of the Czech Republic as of December 31
Year 2002 2003 200� 2005 2006
Deposits.–.total.number. a) � � � � �
. exploited 0 0 0 0 0
Total.mineral.*reserves,.kt. 2.033 2.033 2.033 2.033 2.033
. economic.explored.reserves 0 0 0 0 0
. economic.prospected.reserves 0 0 0 0 0
. potentially.economic.reserves 2.033 2.033 2.033 2.033 2.033
Mine.production,.kt 0 0 0 0 0
* see NOTE on page 12 on a terminological difference between Czech official application of the term reserves and standard international application of the term
a) deposits with registered fluorspar reserves
Fluorite processing, production of fluorite concentrateFLUORIT Teplice s.r.o.FLUORIT Teplice s.r.o. started its activity in 1954, when the flotation lines for fluorite
concentrate production for chemical industry in Teplické rudné doly in Sobědruhy went into operation. Fluorit Teplice s.r.o. founded in 1992 became a successor in fluorite and fluorite concentrates production in Sobědruhy. After the domestic fluorite exploitation was terminated in 1994, the company re-oriented to processing of imported mineral. Drying, grinding and sorting of the flotation fluorite concentrate represents the basic process of the production. The company produces various concentrates and also metallurgical fluorite. Almost half of the production is exported.
Industrial minerals

171
rese
rved
.regi
ster
ed.d
epos
its
exha
uste
d.de
posi
ts.a
nd.o
ther
.reso
urce
s
Fluorspar
Fluo
rspa
r
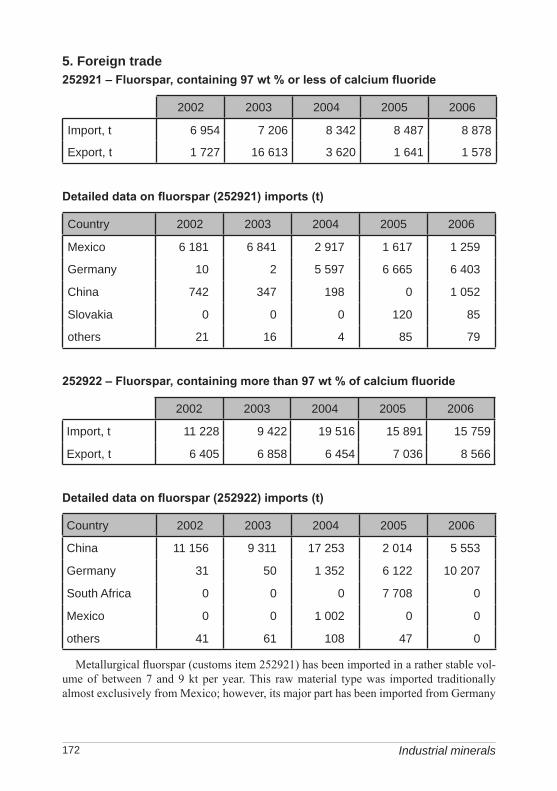
172
5. Foreign trade252921 – Fluorspar, containing 97 wt % or less of calcium fluoride
2002 2003 200� 2005 2006
Import,.t 6.95� 7.206 8.3�2 8.�87 8.878
Export,.t 1.727 16.613 3.620 1.6�1 1.578
Detailed data on fluorspar (252921) imports (t)
Country 2002 2003 200� 2005 2006
Mexico 6.181 6.8�1 2.917 1.617 1.259
Germany 10 2 5.597 6.665 6.�03
China 7�2 3�7 198 0 1.052
Slovakia 0 0 0 120 85
others 21 16 � 85 79
252922 – Fluorspar, containing more than 97 wt % of calcium fluoride
2002 2003 200� 2005 2006
Import,.t 11.228 9.�22 19.516 15.891 15.759
Export,.t 6.�05 6.858 6.�5� 7.036 8.566
Detailed data on fluorspar (252922) imports (t)
Country 2002 2003 200� 2005 2006
China 11.156 9.311 17.253 2.01� 5.553
Germany 31 50 1.352 6.122 10.207
South.Africa 0 0 0 7.708 0
Mexico 0 0 1.002 0 0
others �1 61 108 �7 0
Metallurgical fluorspar (customs item 252921) has been imported in a rather stable vol-ume of between 7 and 9 kt per year. This raw material type was imported traditionally almost exclusively from Mexico; however, its major part has been imported from Germany
Industrial minerals

173
since 2004. Chemical fluorspar (customs item 252922) represents a similar case – the origi-nal Chinese raw material has been newly imported via Germany. Volume of import of the chemical fluorspar is more fluctuating, roughly between 10 and 20 kt per year during the last five years. Major part of the exported fluorspar is a product of the Fluorit Teplice, s.r.o. which deals with processing of imported mineral.
6. prices of domestic market and foreign trade252921 – Fluorspar, containing 97 wt % or less of calcium fluoride
2002 2003 200� 2005 2006
Average.import.prices.(CZK/t) �.801 3.736 �.01� �.192 �.171
Average.export.prices.(CZK/t) 6.000 9�5 �.�69 5.958 6.311
252922 – Fluorspar, containing more than 97 wt % of calcium fluoride
2002 2003 200� 2005 2006
Average.import.prices.(CZK/t) �.230 3.901 �.690 �.762 5.017
Average.export.prices.(CZK/t) 6.709 6.625 7.�16 7.3�3 7.398
7. Mining companies in the Czech Republic as of December 31, 2006No mining companies were extracting fluorspar on the territory of the Czech Republic
in 2006.
8. World productionThe world production was increasing until 1989 when 5,925 kt of fluorspar were extract-
ed. Since then, there was a sharp fall in the production due to reduction of fluorspar con-sumption in steel and aluminium production and in chemical industry (reduction of Freon production). World mine production gradually increased from the minimum of 4,031 kt in 1993 to 4,670 kt in 1998. World production increased slowly from 4.4 to 5.3 mill tonnes during the last five years. In addition to China and Mexico, mine production has increased also in Mongolia and Iran. Production of South Africa has been rather stagnating recently, mine production in Russia has been decreasing. Data according to Mineral Commodity Summaries (MCS) and the Welt Bergbau Daten (WBD):
Year 2002 2003 200� 2005 2006.e
Mine.production,.kt.(MCS) �.550 �.750 5.060 5.260 5.350
Mine.production,.kt.(WBD) �.�26 �.712 5.199 5.207 N
Fluorspar

17�
Main producers’ share in the world mine output (2005; according to MCS):
China 51.3 % Spain 2.7 %Mexico 16.6 % Namibia 2.2 %Mongolia 7.0 % Kenya 1.8 %South Africa 5.0 % Morocco 1.8 %Russia 4.0 % France 1.7 %
9. World market pricesFluorspar prices were recently affected not only by fall in demand but also by supplies
of cheap Chinese fluorspar on the world market. Prices of majority of quoted types signifi-cantly increased in 2004. Price rise continued also during the year 2005 (by roughly 20 % year-on-year in case of the African and Chinese mineral; on the other hand, prices of the Mexican fluorspar declined). Prices of the Mexican fluorspar increased again in 2006 and the prices of the South African raw material increased as well. Fluorspar prices valid for various fluorspar grades and place of origin are monthly quoted in the Industrial Minerals magazine in GBP/t or in USD/t and at different transport rates.
The average prices of traded commodities at year-end were as follows:
Commodity/Year 2002 2003 200� 2005 2006Metallurgical,.min..85.%.CaF2,.ex-UK.mine GBP/t 115.00 115.00 – – –
Acidspar,.South.African,.dry.bulk,.FOB.Durban USD/t 115.00 115.00 137.00 162.00 182.00
Acidspar,.Chinese,.wet.filtercake, CIF Rotterdam USD/t 13�.00 131.50 – – –
Acidspar,.Mexican,.filtercake, FOB Tampico USD/t 115.00 115.00 173.00 1�0.00 190.00
Acidspar,.Chinese,.dry,.CIF.US.Gulf.Port USD/t 131.50 167.50 200.00 235.00 235.00
10. recyclingIn chemical industry where fluorspar consumption prevails, fluorspar recycling is virtu-
ally impossible because of its dissociation during acid leaching. However, maximum effort is evident to recycle or reduce the consumption of saturated fluorohydrocarbons (freons) due to their negative environmental impacts. Not too much fluorspar is recycled in metal-lurgy when producing aluminium.
11. possible substitutesFluorspar is virtually a unique source of fluorine for chemical industry and thus irre-
placeable. However, an extensive replacement of fluorohydrocarbon derivatives is under
Industrial minerals

175Fluorspar
way when using new agents and methods in cosmetics and refrigerants (fluorine and its compounds are replaced by carbon dioxide, nitrogen, air, mechanical sprays, etc.). Fluoro-hydrocarbons are replaced by hydrocarbons in production of foamed plastics. Fluorspar can be to a certain extent substituted by cryolite (incl. synthetic) in metallurgy when producing aluminium. Fluorspar can also be substituted by dolomite, limestone and/or olivine in fer-rous metallurgy.
176
Barite
1. Characteristics and useBarium, which is the major constituent of barite, occurs in igneous rocks. It is released
during their weathering and transferred into sediments and residual rocks. Barite deposits, in general, can be divided in fissure veins, metasomatic, residual and volcanosedimentary (stratabound) deposits. According to the USGS, world barite reserves are given at 740 mill t (reserve base), about 200 mill t of which represent reserves. Almost half of reserves is located in China (48 %), further in India (11 %) and the USA (more than 7 %).
Barite is widely used because of its specific properties such as whiteness, high density, chemical resistance, absorption of X-rays and gamma radiation, etc. Barite is used in glass-making to produce special glass, in ceramic glazes, porcelain enamels, paints, plastics, fireworks (signal flares, detonators, etc.), for radiation shielding, in insecticides, etc. The major use of barite, however, is as high-weight mud for petroleum and natural gas explora-tion drilling.
2. Mineral resources of the Czech RepublicBarite deposits of the Czech Republic are of hydrothermal origin, mainly of the vein or
stockwork type, to a lesser extent of the metasomatic or stratabound types. These deposits are randomly distributed over the Bohemian Massif, which is caused by a great number of barite-bearing formations of various age and origin. The most important deposits were lo-cated in the Krušné hory Mts. (e.g. Kovářská, Mackov), Železné hory Mts. (e.g. Běstvina), Krkonoše Mts. (e.g. Harrachov); smaller deposits and occurrences are known from the Jeseníky Mts. (e.g. Horní Benešov), from the Proterozoic of the western (e.g. Pernárec) and central Bohemia (e.g. Krhanice), Orlické hory Mts. (e.g. Bohousová), Čistá-Jesenice Massif (e.g. Otěvěky) etc. Hydrothermal veins, locally with base metals, are tens to hundreds metres, exception-
ally even 1 km, long, and having thickness between a few decimetres to several meters. The vein filling consisting of barite is in the form of lenses or columns. These veins are mostly confined to regional faults or faults of lower order trending mostly NW-SE and NWN-SES. Younger polymetallic (base metal) and the latest quartz mineralization, which downgrades the vein fillers in deeper parts, are common, too (e.g. the Mackov and Bohousová deposits). Mined out deposit of Pernárec (1924–1960), further the deposits and occurrences Mackov, Bohousová etc., belong to the deposit type where barite is sole or predominating mineral. Fluorite is present in substantial amount along with barite at deposits Běstvina, Moldava, Kovářská, Harrachov etc. A barite mineralization is known from the Květnice deposit near Tišnov in the Moravicum, where barite was mined in 1905–1908 and during World War II.
Stratabound barite deposits originated from submarine hydrothermal solutions ascending along the faults at sea floor. These deposits are in the Bohemian Massif represented by layers and lenses in the Proterozoic sediments of the islet zone (Krhanice nad Sázavou), Železné hory Mts. (Křižanovice) and in the Devonian of the Jeseníky Mountains (Horní Město-Skály, Horní Benešov, where barite was mined as a by-product in 1902–1914 and 1955–1960).
Industrial minerals

177Barite
Barite was exploited in Czech Republic until 1990 from Běstvina deposit, and until 1991 from Harrachov deposit. Renewal of mining is not foreseen in the near future. The deposits lost their industrial importance; their remaining reserves are gradually revaluated and in majority of the cases written off from The Register. Also, as with fluorite, there is a suffi-cient amount of higher-quality and less expensive raw material, first of all from China.
3. Registered deposits and other resources in the Czech Republic(see map)
Registered deposits and other resources are not mined1 Běstvina 2 Bohousová 3 Křižanovice
4. Basic statistical data of the Czech Republic as of December 31
Year 2002 2003 200� 2005 2006
Deposits.–.total.number. a) 3 3 3 3 3
. exploited 0 0 0 0 0
Total.mineral.*reserves,.kt. 569 569 569 569 569
. economic.explored.reserves 0 0 0 0 0
. economic.prospected.reserves 0 0 0 0 0
. potentially.economic.reserves 569 569 569 569 569
Mine.production,.kt 0 0 0 0 0
* see NOTE on page 12 on a terminological difference between Czech official application of the term reserves and standard international application of the term
a) deposits with registered barite reserves
5. Foreign trade 251110 – Natural barium sulphate (barite)
2002 2003 200� 2005 2006
Import,.t 10.396 8.090 7.386 8.552 7.195
Export,.t 755 �52 �05 512 280
251120 – Natural barium carbonate (witherite)
2002 2003 200� 2005 2006
Import,.t 358 358 1.399 0 0
Export,.t 231 ��3 211 �9 0
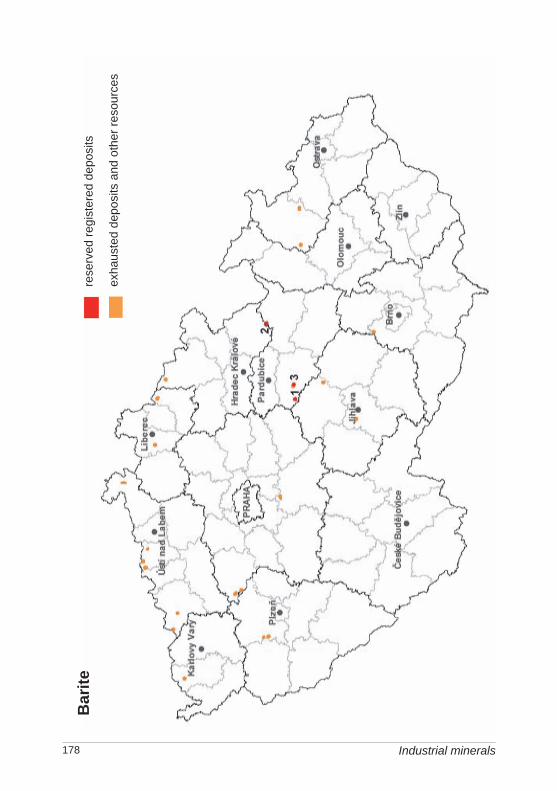
178 Industrial minerals
rese
rved
.regi
ster
ed.d
epos
its
exha
uste
d.de
posi
ts.a
nd.o
ther
.reso
urce
s
Bar
ite

179
Volume of the imported barite has been ranging roughly between 7 and 10 kt on a long term, only a negligible amount has been re-exported. Import in the Czech Republic comes traditionally from Germany, Slovakia, Great Britain and China.
6. prices of domestic market and foreign trade251110 – Natural barium sulphate (barite)
2002 2003 200� 2005 2006
Average.import.prices.(CZK/t) �.92� 5.218 6.�03 6.392 5.70�
Average.export.prices.(CZK/t) N N N N N
Average import prices have been ranging between about CZK 5,000 and 6,400 per tonne, i.e. about USD 150–270 per tonne. Import price of barite continued to increase during the first half of the year 2007 and it reached roughly 290 USD/t.
7. Mining companies in the Czech Republic as of December 31, 2006No mining companies were extracting barite on the territory of the Czech Republic
in 2006.
8. World productionWorld production of barite was gradually increasing until 1990 (8,209 kt). It then fell,
mainly because of global economic recession, which affected not only major barite consum-ing sectors (both crude oil and natural gas exploration), but also chemical industry. Then the barite production was increasing till 1997 (6,930 kt). Since 1999, the world production is increasing again. The increase of the world production is caused particularly by the increase of the Chinese mine production. Mine production in Mexico, Thailand and the USA has been increasing in recent years, too. Preliminary data for the year 2006 already reaches the almost historically highest production of 1990, which shows evidence of the actual world boom in the mineral sector. Data on the world mine production according to Mineral Commodity Sum-maries (MCS) and Welt Bergbau Daten (WBD):
Year 2002 2003 200�. 2005 2006.e
Mine.production,.kt.(MCS) 6.000 6.700 7.2�0 7.870 8.080
Mine.production,.kt.(WBD) 7.55� 7.680 7.�89 7.862 N
Main producers´ share in the world mine output (2005; according to MCS):
China 53.3 % Mexico 3.5 %India 7.9 % Turkey 2.0 %USA 6.2 % Thailand 1.5 %Morocco 4.6 % Kazakhstan 1.5 %Iran 3.6 % Vietnam 1.5 %
Barite

180 Industrial minerals
9. World market pricesBarite prices were in the past under pressure of oversupply, particularly of cheap Chinese
and Indian barite. Chinese barite acquired the leading position on the world market already in the seventies, being used not only in drilling mud but also in other sectors of various industries. As in the case of fluorite, world prices of barite of Asian provenance increased significantly in 2004. Prices of barite from China and India increased in 2006, too. Prices of various grade and origin are quoted monthly in the Industrial Minerals magazine in GBP/t or USD/t. The average prices of traded commodities at year-end were as follows:
Commodity/Year 2002 2003 200� 2005 2006API,.Chinese.lump,.CIF.Gulf.Coast. USD/t ��.00 ��.50 63.50 59.00 72.50
API,.Indian.lump,.CIF.Gulf.Coast USD/t �9.00 �8.00 70.00 70.00 83.50
API,.Moroccan.lump,.CIF.Gulf.Coast USD/t 51.00 51.00 63.50 68.00 68.00
Micro-ground.white.<.20.microns,.paint.grade,.min..99.%,.UK
GBP/t 1�5.00 1�5.00 1�5.00 1�5.00 1�5.00
10. recyclingBarite is actually continuously recycled when used in drilling mud. In other applications
(chemicals, paints, enamels, glass, rubber etc.) it is not recycled.
11. possible substitutesMagnetite, hematite (incl. synthetic), ilmenite, celestite and other heavy minerals can
be alternatively used instead of barite in drilling mud. Barite can be replaced by other fill-ers (e.g. by limestone, dolomite, soot) in production of rubber, in glassmaking partly by strontium salts, in lithopone by other whites (e.g. zinc white) etc. However, none of these substitutes is as good as barite.

181
Graphite
1. Characteristics and useGraphite represents one of the forms of carbon (C) occurring in the nature. Graphite is an
important technical mineral exhibiting perfect basal cleavage, very good electric and heat conductivity, high refractoriness and resistance to acids.
All rocks, which contain considerable amount of graphite that can be recovered, are considered as a graphite raw material. Graphite is graded primarily on the size of flakes – “crystalline” flake graphite with flakes exceeding 0.1 mm and “amorphous” graphite with flakes smaller than 0.1 mm, which appears like a massive material. The latter looks like a dull solid matter. There are no general rules about the division of crystalline graphite into large, medium, and small flake, and individual producers have different criteria.
Graphite deposits can be divided into early magmatic, contact metasomatic, metamorpho-genic (metamorphic and metamorphosed) and residual deposits. According to the USGS, world reserves of graphite are given at 290 mill tonnes (reserve base), out of which about 86 mill t represent reserves. More than three quarters of reserves are located on the territory of China (76 %), more important reserves are also on the territory of India, Mexico, Sri Lanka and the Czech Republic (where the deposits are though largely sub-economic).
Use of graphite is based upon its physical and chemical properties. It is used in foundry industry, electricity and electronics uses, electrochemistry, chemical, rocket, armament and nuclear industries, in manufacture of refractory materials, lubricants, protective coatings, pencils, threads, production of synthetic diamonds etc.
2. Mineral resources of the Czech RepublicAll graphite deposits in the Czech Republic belong to the metamorphogenic type. They
originated during regional metamorphism of clayey sandy sediments high in organic matter, which is also indicated by higher concentrations of S, P, V and abundant limestones. The deposits occur in the Bohemian Massif in the Moldanubicum, Moravicum and Silesicum regional geological units.The most important deposits occur in the Modanubicum, particularly in the so-called
Varied Group of Český Krumlov (deposits: Český Krumlov-Městský vrch, Lazec, where the mining was terminated in the middle of the year 2003; further deposits: Bližná, Spolí, Český Krumlov-Rybářská ulice). Other less important deposits occur in the Votice-Sušice Varied Group (a single, until 1967 mined deposit at Koloděje nad Lužnicí-Hosty) and in the Chýnov mica schists (Černovice – mined-out former deposit). South Bohemian graphitic rocks have a character of graphite-rich gneisses, quartzites and carbonates. Smaller occurrences, which are of no economic importance at present, are known also from the Moravian part of Moldanubicum (e.g. Lesná, Lubnice, Louka, Římov et al.).
Deposits in the Moravian-Silesian region occur in an area affected by lower grade met-amorphism. Graphite shows lower degree of crystallization and contains much more sulphur, which is confined to pyrite and pyrrhotite. The whole region is characterized by higher contents of combustibles and lower sulphur content in graphitic layers in lime-stones than those in graphitic schists and phyllites. The deposit Tresné, already mined

182
out, was considered the largest graphite deposit of the Moravicum. It is located in the Olešnice group of the Svratka dome. The major deposit in the Silesicum is Velké Vrbno-Konstantin, which makes a part of a graphitic zone at the western margin of the Velké Vrbno dome. Since the second half of the year 2003, this deposit remains the only one to be mined in the Czech Republic. Other 8 small deposits in Branná and Velké Vrbno sur-roundings were registered until 2006, of which only 1 has remained after revaluation.Underground mining of graphite deposits in the Czech Republic is economically un-
profitable and it is on decline, as there is a sufficient supply of cheaper, especially Chinese mineral, similarly to fluorite and barite. On the other hand, open-pit mining in Velké Vrbno surroundings still continues and its mine production is rather stable.
3. Registered deposits and other resources in the Czech Republic(see map)
Names of mined deposits are indicated in bold typeAmorphous graphite: Crystalline graphite:1 Velké Vrbno-Konstantin 5 Český Krumlov-Městský vrch2 Bližná-Černá v Pošumaví 6 Lazec-Křenov3 Český Krumlov-Rybářská ulice 7 Koloděje nad Lužnicí-Hosty4 Velké Vrbno-Luční hora 2
Mixed (from amorphous to crystalline) graphite:8 Spolí
4. Basic statistical data of the Czech Republic as of December 31
Year 2002 2003 200� 2005 2006
Deposits.–.total.number 15 15 15 15 8
. exploited. b) 3 1 1 1 1
Total.mineral.*reserves,.kt. a) 1�.366 1�.355 1�.350 1�.3�7 1�.165
. economic.explored.reserves 1.355 1.3�� 1.339 1.336 1.327
. economic.prospected.reserves �.15� �.15� �.15� �.15� �.0�1
. potentially.economic.reserves 8.857 8.857 8.857 8.857 8.797
Mine.production,.kt. a) 16 9 5 3 5
* see NOTE on page 12 on a terminological difference between Czech official application of the term reserves and standard international application of the term
a) reserves and mine production are given for crude graphite (graphite “ore”); average graphite contents in the raw material range between 15 and 20 % (crystalline grade) and 25–35 % (amorphous grade), respectively
b) mining at crystalline graphite deposits Český Krumlov-Městský vrch and Lazec-Křenov was terminated in the course of the year 2003

183
Gra
phite
rese
rved
.regi
ster
ed.d
epos
its
exha
uste
d.de
posi
ts.a
nd.o
ther
.reso
urce
s
Graphite

18�
processing of graphiteGraphite Týn, spol s r.o.Graphite Týn s.r.o. (before March 2007 Maziva Týn s.r.o.) produces highly refined natu-
ral graphite, micro-ground graphite, expandable graphite, graphite dispersions and pressed graphite. The tradition of graphite processing in Týn nad Vltavou dates back to 1965. The company has been a member of the international concern Graphit Kropfmühl AG since 1999.
5. Foreign trade2504 – Natural graphite
2002 2003 200� 2005 2006
Import,.t 1.�76 2.765 3.668 �.858 3.�8�
Export,.t 3.�87 �.058 3.92� 3.61� 3.518
Detailed data on territorial structure of graphite import in volume (t)
Country 2002 2003 200� 2005 2006
Germany �76 1.�29 1.862 2.265 1.871
China 576 807 1.098 2.027 1.171
Great.Britain 3�5 311 373 382 173
others 79 218 335 18� 269
Detailed data on territorial structure of graphite export in volume (t)
Country 2002 2003 200� 2005 2006
Germany 2.003 2.572 2.179 2.017 2.272
Italy 600 653 719 601 381
Poland 26� 261 553 �81 265
Slovakia 230 19� 166 172 211
Hungary 131 211 185 196 227
others 259 167 122 1�7 162
Industrial minerals

185
3801 – Synthetic graphite and graphite products; colloidal, semicolloidal graphite
2002 2003 200� 2005 2006
Import,.t 1.659 1.397 2.7�0 3.799 2.7�1
Export,.t 616 703 829 673 369
6903 – refractory ceramics products
2002 2003 200� 2005 2006
Import,.t 3.816 �.985 5.707 5.767 7.708
Export,.t 8.�28 10.158 12.186 12.�70 1�.18�
After the domestic mining at south Bohemian deposits was terminated in mid-2003, the vol-ume of imported graphite increased up to almost 5 kt in 2005. Graphite is imported to the Czech Republic first of all from China; imports reported as from Germany often contain Chinese raw material from deposits run in China by German companies. On the other hand, volume of ex-ported graphite has been rather stable, oscillating between 3.5 and 4 kt per year. The raw mate-rial is directed mainly to neighbouring countries. Products made of the Czech refractory graphite ceramics were exported to more than 70 countries in and outside Europe in 2006.
6. prices of domestic market and foreign trade2504 – Natural graphite
2002 2003 200� 2005 2006
Average.import.prices.(CZK/t) 20.308 15.295 19.8�9 23.8�9 36.859
Average.export.prices.(CZK/t) 16.006 16.793 22.121 23.520 28.638
Prices of domestic flotation concentrates of natural graphite oscillated between CZK 12 and 16 thousand per tonne depending on the content of combustion matters and sulphur and also on contents of moisture. Flotated crystalline flake graphite is sold for CZK 20,000 per tonne, flotated crystalline graphite with synthetic flake for CZK 15,000 per tonne. Graphite product (petroleum coke powder) was offered for roughly CZK 10,000 per tonne in 2004. A wide spectrum of final graphite products, including chemically treated, micro-ground, expandable, pressed graphite and graphite lubricants, is offered by Graphite Týn, s.r.o. (formerly Maziva Týn nad Vltavou, s.r.o.). Prices of chemically treated graphite (purity above 99.5 % C) oscillate between CZK 54,000 and CZK 100,000 per tonne (according to the granular composition). Prices of further processed micro-ground graphites start from CZK 62,000 per tonne.
Graphite

186
7. Mining companies in the Czech Republic as of December 31, 2006Grafitové doly Staré Město, s.r.o.
8. World productionWorld production of graphite remained consistently around 1 mill t/year till 1992, then
it markedly decreased. Graphite mine production has been increasing again in the last five years, during which many changes on the world market occurred: the Chinese dominant role was further strengthened whereas the mine production on Madagascar decreased sig-nificantly and that of Mexico, Zimbabwe, India and Brazil went down, too. Mining produc-tion in the Czech Republic reached 16 kt in 2002, i. e. around 2 % of the world production, about 1.2 % in 2003, and it can represent 0.5–1 % nowadays. Data in individual interna-tional yearbooks are variable and they are often backward-corrected. Data according to Mineral Commodity Summaries (MCS) and the Welt Bergbau Daten (WBD):
Year 2002 2003 200�. 2005 2006.e
Mine.production,.kt.(MCS) 810 7�2 982 1.060 1.070
Mine.production,.kt.(WBD) 613 5�0 582 676 N
Main producers’ share in the world mine output (2005; according to MCS):
China 67.9 % Canada 2.8 %India 12.3 % Madagascar 1.4 %Brazil 7.3 % Mexico 1.0 %North Korea 3.0 %
9. World market pricesPrices of graphite were at the end of eighties influenced by its surplus on the world mar-
ket. Prices of graphite of majority of grades dropped in 1993 down to 50 % of those in 1990. Prices were affected particularly by supplies of cheap Chinese graphite and by introduction of Russian graphite on the world market. World prices of graphite stagnate since the second half of the 1990s until 2004. The situation changed just during the year 2005, when prices of individual quotations increased by 10–20 %. Prices of the high-quality raw material continued to rise in 2006. Prices of natural graphite are published monthly in the Industrial Minerals magazine and quoted in USD/t, CIF UK ports. The average prices of traded grades of graphite at year-end were as follows:
Industrial minerals
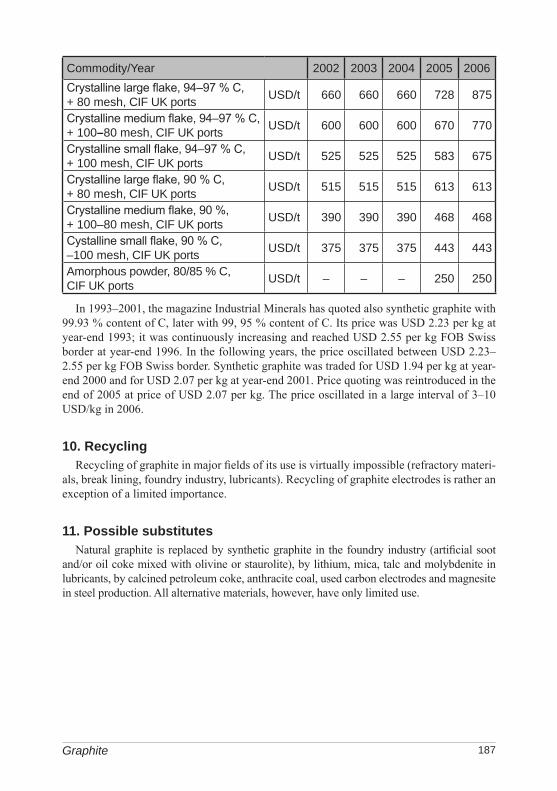
187
Commodity/Year 2002 2003 200� 2005 2006Crystalline large flake, 94–97 % C, .+.80.mesh,.CIF.UK.ports USD/t 660 660 660 728 875
Crystalline medium flake, 94–97 % C, +.100–80.mesh,.CIF.UK.ports USD/t 600 600 600 670 770
Crystalline small flake, 94–97 % C, .+.100.mesh,.CIF.UK.ports USD/t 525 525 525 583 675
Crystalline large flake, 90 % C, .+.80.mesh,.CIF.UK.ports USD/t 515 515 515 613 613
Crystalline medium flake, 90 %, .+.100–80.mesh,.CIF.UK.ports USD/t 390 390 390 �68 �68
Cystalline small flake, 90 % C, .–100.mesh,.CIF.UK.ports USD/t 375 375 375 ��3 ��3
Amorphous.powder,.80/85.%.C,..CIF.UK.ports USD/t – – – 250 250
In 1993–2001, the magazine Industrial Minerals has quoted also synthetic graphite with 99.93 % content of C, later with 99, 95 % content of C. Its price was USD 2.23 per kg at year-end 1993; it was continuously increasing and reached USD 2.55 per kg FOB Swiss border at year-end 1996. In the following years, the price oscillated between USD 2.23–2.55 per kg FOB Swiss border. Synthetic graphite was traded for USD 1.94 per kg at year-end 2000 and for USD 2.07 per kg at year-end 2001. Price quoting was reintroduced in the end of 2005 at price of USD 2.07 per kg. The price oscillated in a large interval of 3–10 USD/kg in 2006.
10. recyclingRecycling of graphite in major fields of its use is virtually impossible (refractory materi-
als, break lining, foundry industry, lubricants). Recycling of graphite electrodes is rather an exception of a limited importance.
11. possible substitutesNatural graphite is replaced by synthetic graphite in the foundry industry (artificial soot
and/or oil coke mixed with olivine or staurolite), by lithium, mica, talc and molybdenite in lubricants, by calcined petroleum coke, anthracite coal, used carbon electrodes and magnesite in steel production. All alternative materials, however, have only limited use.
Graphite

188 Industrial minerals
Gemstones
Jaroslav Hyršl (subchapters 1., 2., 6. – except tables, 8. – except data on world mine production of diamonds and garnets, 9. – Range of prices of the most important gemstones, 10., 11.)
1. Characteristics and useThe designation “gemstone” refers to such natural materials, which can be used in jewellery.
These can be minerals, rocks, natural glasses as well as organic material (e.g. pearls or ivory). Beauty (mainly an interesting colour, type of cutting, etc.), durability (hardness, toughness) and rarity represent their main properties. Gemstones were formerly classified according to their hardness (diamond, corundum, chrysoberyl, beryl, spinel, topaz, etc), because hardness of 7 and more is ideal for use in jewellery. Mineralogical system based on chemical composition is used at present. The most important gemstones belong to elements (diamond), oxides (corundum, spi-nel, chrysoberyl, quartz e.o.), and silicates (beryl, tourmaline, topaz e.o.). As gemstone formation and geological environment concerns, they occur in volcanic rocks (diamond, corundum, oliv-ine), pegmatites (beryl, tourmaline, topaz, chrysoberyl), hydrothermal veins (emerald, quartz), metamorphic rocks (corundum, spinel, emerald) as well as sediments (almost all given above).
Gemstones represent raw material differing completely from the others presented in these Summaries. This is given by an extreme range of their price depending on quality. The old precious and semi-precious stone classification has not been used in scientific lit-erature anymore, because e.g. high-quality amethyst can be more expensive than low-qual-ity ruby or emerald. For the most part, precious (used in jewellery when cut) and decorative (or ornamental) stone classifications (e.g. agates, malachite etc., primarily used only when polished) are used. Waste after gemstone processing can be in some cases (mainly garnets and corundum) used as an abrasive.
Technically speaking, stones used in jewellery must be classified into four categories as follows:1. natural stones, only polished2. natural stones treated by man (burning at high temperatures, irradiation, filling of cracks
by a foreign material, artificial colouring and many others)3. synthetic stones (they have similar properties as natural ones)4. imitation stones (e.g. glass, they have different properties than natural stones)
The correct identification of the gemstone and its classification in these categories is however possible only by an experienced expert disposing a very good instrumentation. Moreover, new processing methods appear every year. Differences in price (hereinafter, approximate wholesale prices in spring 2007 are presented) are huge. A red transparent cut ruby of about 2 carats (i.e. about 9 times 7 mm in size) can serve as an example. Its glass imitation is practically valueless. Synthetic stone can cost USD 2–400 depending on the method of synthesis. Processed natural stone can cost USD 20–5 000 depending on the processing method and its intensity. Completely unprocessed natural ruby of a top quality and weight of 2 carats can however cost up to USD 25,000!

189Gemstones
Diamond, the most known gemstone financially representing major part of gemstone market, can serve as another example. Diamonds are evaluated according to four C´s: carat (weight in carats), colour (from the most expensive completely colourless to cheap yellow-ish and brown stones), clarity (judged by a 10x loupe), and cut (quality of the cut). Depend-ing on these parameters, a diamond of 1 carat in weight (in case of a round brilliant cut it has 6.4 mm in diameter) can cost several hundred to USD 17 000, intensively coloured natural diamonds even much more. However, a number of treatments, which improve markedly an appearance of the stone, is known for diamond as well as almost all other gemstones. This logically has to result in a lower price than that of the similar natural stones. Synthetic cut diamonds are common as well on market nowadays (so far mainly coloured, as it is much more difficult to produce the colourless ones) and their proportion will rapidly increase in future.
It has to be pointed out once more that both examples given above represent stones which can appear very similar to a non-specialist. For this reason, statistical data which fol-low have to be taken with caution, as they do not say anything about quality of the stones.
2. Mineral resources of the Czech RepublicThe Czech Republic is very poor in gemstone occurrences, despite its complex geology
and abundance of various types of deposits. Only pyrope (Bohemian garnet) and moldavite deposits are of an international importance. Occurrences of some types of decorative quartz (rock crystal and smoky quartz in pegmatites in Velké Meziříčí and Liberec surroundings), agates in the Krkonoše Mts. piedmont, amethyst and jasper in the Krušné hory Mts., so-called porcelanite (original clay minerals burned at the contact with basalt) in southern Moravia, opals from Křemže surroundings in southern Bohemia e.o. have no economic importance.
Pyrope is a mineral from garnet group having the composition Mg3Al2[SiO4]O3, but al-ways with a Fe admixture and coloured by chromium. The so-called Bohemian garnet, world-known bloody-red pyrope, has been mined for several centuries in Quaternary sand and gravel at the České středohoří Mts. piedmont. Xenoliths of ultrabasic rocks enclosed in Tertiary volcanics represent their parent rock.
The Podsedice deposit in the České středohoří piedmont and a small Vestřev deposit in the Krkonoše Mts. piedmont are exploited at present. Genuine Bohemian garnets are always small; raw stones of more than 5–7 mm in diameter are rare. Much larger and more abundant almandine imported from abroad, which have however a brownish or violet shade, has been therefore used as a central stone in jewels.
Moldavite represents a unique Czech gemstone. It belongs to tectites, i.e. natural glasses, which occur in several places in the world. Their origin was always enigmatic; a theory that these are terrestrial rocks, molten in the course of a large meteorite impact with the melt sprayed over a large distance, predominates at present. A crater after the meteorite impact has been identified for majority of the world tectite occurrences, too. Czech moldavites come from the Ries crater by German town Nördlingen in Bavaria and were formed about 15 million years ago. They occur in southern Bohemia in Tertiary and Quaternary placers, mainly in southern vicinity of České Budějovice. They typically have a green colour and uneven surface with many corrugations, which were formed by natural etching. Moldavites usually reach 1–3 cm in size, larger ones are rare. They are used in jewels either in natural

190
state, faceted or as engraving. Smaller moldavite occurrences can be found in southern Moravia in Třebíč surroundings; these however have an unattractive brown-green colour and cannot be used as gemstones. Several small deposits were mined in southern Bohemia until recently, of which only Besednice and Ločenice deposits are mined at present.
3. Registered deposits and other resources in the Czech Republic(see map)
Names of mined deposits are indicated in bold typePyrope-bearing rock: Moldavite-bearing rock: Other gemstones:1 Podsedice-Dřemčice 7 Besednice 12 Bochovice *2 Vestřev 8 Ločenice 13 Rašov **3 Horní Olešnice 1 9 Chlum nad Malší-východ4 Horní Olešnice 2 10 Slavče-sever5 Linhorka-Staré 11 Vrábče-Nová Hospoda6 Třebívlice * amethyst, ** opal
4. Basic statistical data of the Czech Republic as of December 31
Year 2002 2003 200� 2005 2006
Deposits.–.total.number. a) 10 11 11 11 11
. exploited. b) � � � � �
Total.mineral.*reserves,.kt. a). 19.265 19.231 19.198 19.162 19.196
. economic.explored.reserves 3.510 3.�92 3.�69 3.��� 3.�12
. economic.prospected.reserves 12.866 12.850 12.8�0 12.829 12.895
. potentially.economic.reserves 2.889 2.889 2.889 2.889 2.889
Mine.production,.kt. a) 52 53 �2 �3 39
Mine.production,.ths.m3. c) 2� 36 11� 7� 95
* see NOTE on page 12 on a terminological difference between Czech official application of the term reserves and standard international application of the term
a) pyrope-bearing rockb) two deposits of pyrope, two deposits of moldavite in 2002–2006c) moldavite-bearing rock
5. Foreign trade7102 – Diamonds, also finished but unassembled, unmounted
2002 2003 200� 2005 2006
Import,.kg 2�5 121 138 1�0 175
Export,.kg 36 3� 26 �� �3
Industrial minerals

191Gemstones
rese
rved
.regi
ster
ed.d
epos
its.o
f.pyr
ope-
bear
ing.
rock
exha
uste
d.de
posi
ts.a
nd.o
ther
.res
ourc
es.o
f.py
rope
-be
arin
g.ro
ck.
rese
rved
.reg
iste
red.
depo
sits
.of.
mol
davi
te-b
earin
g.ro
ckex
haus
ted.
depo
sits
.and
.oth
er.re
sour
ces.
of.m
olda
vite
-be
arin
g.ro
ck.
rese
rved
.regi
ster
ed.d
epos
its.o
f.oth
er.g
emst
ones
exha
uste
d.de
posi
ts.a
nd.o
ther
.res
ourc
es.o
f.ot
her.
gem
ston
es
Gem
ston
es

192 Industrial minerals
7103 – Precious (other than diamond) and semi-precious stone, also finished, sized but unstrung, unassembled, unmounted
2002 2003 200� 2005 2006
Import,.kg 67.669 �7.232 51.882 95.925 �5.963
Export,.kg 8.�68 6.765 2.965 3.960 1.925
251320 – Emery, natural corundum, garnet and other natural abrasives
2002 2003 200� 2005 2006
Import,.t 1.357 1.375 3.089 2.882 2.662
Export,.t 100 1�1 1.063 35� 2�6
Detailed data on territorial structure of diamond import in volume (kg)
2002 2003 200� 2005 2006
South.Africa 1�9 69 51 63 110
Belgium � 8 1� 1� 26
Israel 16 25 18 12 8
Germany 36 2 23 26 8
Thailand 0 1 � 5 6
USA 11 1 1 5 5
India � 1 � � �
United.Kingdom 20 5 21 8 3
others 5 9 2 3 5

193
Detailed data on territorial structure of precious (other than diamond) and semi-precious stone import in volume (kg)
2002 2003 200� 2005 2006
Brazil 8.692 18.1�2 19.581 16.�92 33.102
South.Africa 52.596 18.279 30.�22 71.072 5.677
China 285 19� 89 �27 2.979
Hong.Kong 317 209 1�7 1.561 1.781
Russia 16� 558 0 62 �51
Uruguay 0 100 0 0 �05
Tanzania 1.990 7�8 1.026 985 301
Nigeria �56 297 197 277 288
Germany 2.31� 533 �5 216 206
Morocco 0 0 0 0 20�
Thailand 30 �1 102 169 189
Pakistan 60 �23 0 102 183
Mozambique 0 0 0 920 90
Namibia 80 6.980 0 1.220 0
Mongolia 253 232 29 0 0
India 16 �6 6 1.560 29
USA � 309 3 732 23
others �12 1�1 235 130 55
Detailed data on territorial structure of emery, natural corundum and garnet import in volume (t)
2002 2003 200� 2005 2006
Australia 792 8�0 2.5�3 2.206 1.822
India 37� 522 527 568 561
Germany 13 10 10 8 27�
others 178 3 9 100 5
Gemstones

19�
The customs item 7103 includes a large spectrum of precious stones (ruby, sapphire, emerald etc.), imported from many countries, such as the South Africa, Brazil, Namibia, Tanzania, Hong Kong, China, Germany, Niger, Russia etc. Export is by order lower and is directed to Germany, Poland and the USA. Emery, natural corundum and garnets are imported especially from Australia and India.
6. prices of domestic market and foreign tradeInternational trade with gemstones has been so globalized recently, that no substantial
differences in their prices wherever in the world including the Czech Republic exist. The only difference is that imported are rather gemstones of a lower quality due to the lower purchasing power as well as lower knowledge of both jewellers and customers; stones of a high quality are rare.
7102 – Diamonds, also finished but unassembled, unmounted
2002 2003 200� 2005 2006
Average.import.prices.(CZK/kg) 2�7.967 517.868 28�.370 �39.379 ��2.023
Average.export.prices.(CZK/kg) 169.833 ��8.79� 29�.077 35�.886 �52.209
7103 – Precious (other than diamond) and semi-precious stone, also finished, sized but unstrung, unassembled, unmounted
2002 2003 200� 2005 2006
Average.import.prices.(CZK/kg) 199 217 2�3 233 508
Average.export.prices.(CZK/kg) 587 1.�13 3.363 1635 3.391
251320 – Emery, natural corundum, garnet and other natural abrasives
2002 2003 200� 2005 2006
Average.import.prices.(CZK/t) 6.57� 5.532 �.�55 3.78� 5.773
Average.export.prices.(CZK/t) 17.176 9.11� 5.362 6.767 11.�90
7. Mining companies in the Czech Republic as of December 31, 2006Granát – družstvo umělecké výroby, Turnov FONSUS první těžební a.s., PrahaBohemia Deposits a.s., Besednice
Industrial minerals

195
8. World productionDiamond represents the only gemstone for which relatively reliable data on annual pro-
duction exist. There are practically no estimates for any other gemstone. This is mainly because mostly small deposits mined by primitive methods are concerned, as well as a large range of prices as explained above. On each locality in general major proportion of the extracted material is of a low quality; stones that can be cut commonly make up only several percent of the total mine production and financially only one top-quality stone can represent major part of the annual profit.
The most important gemstones and mining countries are as follows:diamond – Botswana, Russia, Canada, Australia, South Africa, Kongoruby – Myanmar (Burma), Madagascar, Kenya, Pakistansapphire – Sri Lanka, Madagascar, Tanzania, Australia, Thailandemerald – Columbia, Brazil, Zambia, Zimbabwe, Pakistanalexandrite – Brazil, Russia, Zimbabweaquamarin – Brazil, Madagascar, Mozambique, Pakistantanzanite – Tanzania (the only known deposit)topaz – Brazil, Pakistantourmaline – Brazil, Madagascar, Pakistan, Afghanistan, Mozambiqueolivine – USA, Pakistanamethyst – Brazil, Uruguay, Zambia World production of industrial diamonds reached about 84 mill carats in 2005. The main
producer was Zaire – 28.7 %, followed by Russia – 25.6 %, Australia – 22.0 %, South Af-rica – 11.3 % and Botswana – 8.9 %. These countries covered roughly 96 % of the world production.
World production of gem-quality diamonds was estimated at about 85 mill carats in 2005. In this case it was Russia – 25.1 % - in the first place, followed by Botswana – 20.4 %, Canada – 14.4 %, Australia – 14.4 %, South Africa – 7.4 %, Zaire – 7.0 % and Angola – 6.4 %. These seven countries covered roughly 95 % of the world production.
World mine production of garnet (mostly for industrial use) was about 324 kt in 2005. The largest mining capacity was in Australia – 47.8 %, other producers were India – 20.0 %, the USA – 12.4 % and China – 9.0 %.
Industrial diamonds 2002 2003. 200� 2005 2006.e
Mine.production,.ths.carats.(MCS) 55.200 69.500 67.000 81.000 85.000
Mine.production,.ths.carats.(WBD) 75.365 69.622 65.608 83.766 N
Gem-quality diamonds 2002 2003. 200� 2005 2006.e
Mine.production,.ths.carats.(WBD) 76.206 78.56� 7�.106 85.211 N
Gemstones
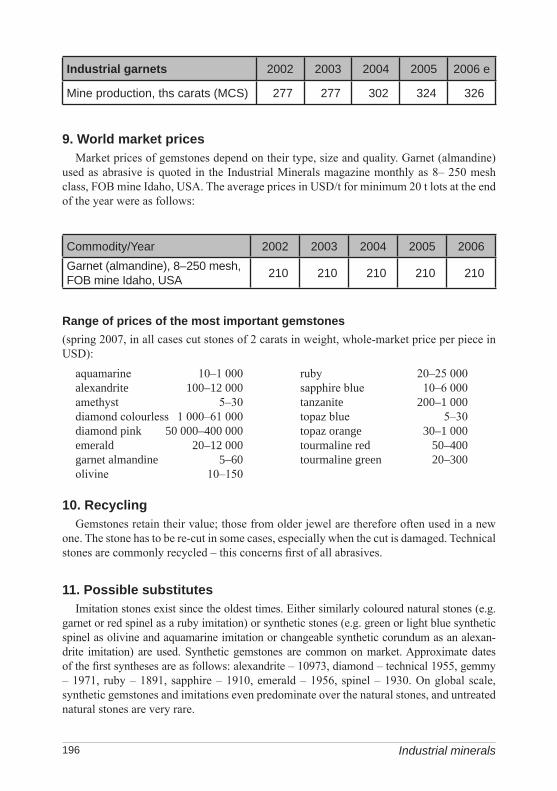
196
Industrial garnets 2002 2003. 200� 2005 2006.e
Mine.production,.ths.carats.(MCS) 277 277 302 32� 326
9. World market pricesMarket prices of gemstones depend on their type, size and quality. Garnet (almandine)
used as abrasive is quoted in the Industrial Minerals magazine monthly as 8– 250 mesh class, FOB mine Idaho, USA. The average prices in USD/t for minimum 20 t lots at the end of the year were as follows:
Commodity/Year 2002 2003 200� 2005 2006Garnet.(almandine),.8–250.mesh,.FOB.mine.Idaho,.USA 210 210 210 210 210
range of prices of the most important gemstones(spring 2007, in all cases cut stones of 2 carats in weight, whole-market price per piece in USD):
Industrial minerals
aquamarine 10–1 000alexandrite 100–12 000amethyst 5–30diamond colourless 1 000–61 000 diamond pink 50 000–400 000emerald 20–12 000garnet almandine 5–60olivine 10–150
ruby 20–25 000sapphire blue 10–6 000tanzanite 200–1 000topaz blue 5–30topaz orange 30–1 000tourmaline red 50–400tourmaline green 20–300
10. recyclingGemstones retain their value; those from older jewel are therefore often used in a new
one. The stone has to be re-cut in some cases, especially when the cut is damaged. Technical stones are commonly recycled – this concerns first of all abrasives.
11. possible substitutesImitation stones exist since the oldest times. Either similarly coloured natural stones (e.g.
garnet or red spinel as a ruby imitation) or synthetic stones (e.g. green or light blue synthetic spinel as olivine and aquamarine imitation or changeable synthetic corundum as an alexan-drite imitation) are used. Synthetic gemstones are common on market. Approximate dates of the first syntheses are as follows: alexandrite – 10973, diamond – technical 1955, gemmy – 1971, ruby – 1891, sapphire – 1910, emerald – 1956, spinel – 1930. On global scale, synthetic gemstones and imitations even predominate over the natural stones, and untreated natural stones are very rare.

197Kaolin
Kaolin
1. Characteristics and useKaolin is a mostly residual (primary), less often a sedimentary (secondary) white or
whitish rock, containing substantial amount of the kaolinite group clay minerals. It always contains quartz and it may contain other clay minerals, micas, feldspars, and other minerals, depending on the nature of the parent rock.
Kaolin originated mostly through weathering or hydrothermal alteration of various rocks, rich in feldspar, as granitoids, arkoses, gneisses, etc. These so-called residual (primary) kaolins can be transported, thus forming sedimentary (secondary) kaolins. The deposits are concentrated in areas of feldspar rocks presence in which the kaolinization had occurred. World economic reserves of kaolin are estimated at about 12,000 mill tonnes.
Kaolin is used for various purposes and the required grade depends on the use. Most often it is used as a raw material in the ceramic industry – in production of porcelain and other clay ware, then as a filler in the production of paper, rubber, plastics and pigments, in production of refractory materials, and in cosmetics, pharmaceutical and food industries. Kaolin is also used in the production of synthetic zeolites. Production of kaolin is often classified among the production of clays and vice versa.
2. Mineral resources of the Czech RepublicTechnological suitability of kaolin is assessed according to properties of the benefici-
ated (water-washed) kaolin. In the Czech Republic, kaolins are classified according to their use:Kaolin for production of porcelain and fine ceramics (KJ) – the highest quality kao-
lin with high requirements on purity, rheological properties, strength after drying, pure white-fired colour (content of Fe2O3 + TiO2 without high-intensity electromagnetic sepa-ration up to 1.2 %), refractoriness min. 33 PCE (1,730 °C).
Kaolin for other ceramics manufacturing (KK) has no specifically defined parameters and is used in many ceramic recipes. Specially appreciated are white-fired colours, low content of colorant oxides, etc.
Kaolin used in paper industry (KP) is employed both for fillers and coatings. Required properties are high whiteness and low content of abrasive particles. It is also used as filler in the production of rubber (requires minimum content of the so-called “rubber poisons” – Mn max. 0.002 %, Cu max. 0.001 % and Fe max. 0.15 %), in plastics, glass fibres etc.
Titanium-bearing kaolin (KT) contains over 0.5% TiO2 and this type of kaolin occurs only in the Karlovy Vary region, where it formed from granites with high content of Ti-minerals. Both tests and experience proved that in some cases TiO2 content can be reduced by high-intensity electromagnetic separation, after which part of these kaolins can be used as KJ, KP or KK and even KP grades.
Feldspar-bearing kaolin (KZ) contains higher amount of non-kaolinized feldspars and has been used mostly in ceramics for production of sanitary and technical ceramics.All kaolin deposits in the Czech Republic originated by kaolinitic weathering of feldspar
rocks. Decrease of kaolinization with increasing depth and transition into non-weathered

198 Industrial minerals
parent rock are characteristic of these deposits. Kaolinite is a strongly predominant clay mineral. The major regions with kaolin deposits are as follows:The Karlovy Vary region – parent rocks are represented by autometamorphosed and
younger granites of the Karlovy Vary massif. This is the most important source of the top quality kaolins for the production of porcelain (KJ) or their eventual substitutes (KT). There are also deposits of the KK, less of the KP grades. Deposits of Božičany, Jimlíkov, Mírová and Ruprechtov opened in 2005, where the KJ, KT and KK are mined together, represent the most important ones. KP is mined at the Otovice-Katzenholz deposit.
The Kadaň region – kaolins of this area originated from granulite gneiss of the Krušné hory Mts. crystalline complex. This kaolin is of the KK and KP grades. Kralupy u Cho-mutova-Merkur (KP) deposit was mined out in 2003, other deposits were mined out already earlier (e.g. Kadaň, Prahly). KP at the large Rokle deposit, where bentonite has been mined for a long time, has been exploited since 2003.
The Podbořany region – parent rock is subarkose of the Líně formation belonging to the Central Bohemian Permo-Carboniferous. All grades of kaolin given above occur here. Some of the kaolins classified as KJ are though of a lower quality (rather KK even KZ grade) and their use as an additive into the Karlovy Vary kaolins in production of porcelain is rather restricted due to their rheological properties. Large Krásný Dvůr-Podbořany deposit of the KJ kaolin grade represents the most important deposit.
The Plzeň region – parent rock is represented by Carboniferous arkoses of the Plzeň Basin. Kaolins of this area are of the KP grade (the largest reserves of the best quality kaolin) and the KK grade, and only negligible part of the reserves is of the KZ and KJ grades. Horní Bříza, Kaznějov-jih and Lomnička-Kaznějov deposits north of Plzeň and Chlumčany-Dnešice south of Plzeň represent the most important large mined deposits of KP and KK. The major portion of the KP grade was converted into KK grade due to re-evaluation in 2005.
The Znojmo region – these kaolins originated mostly from granitoids of the Dyje massif, to a lesser extent from the Bíteš orthogneiss of the Dyje dome of the Moravicum. These kaolins are of the KZ grade and less of the KP grade. A small deposit of KP Únanov-sever will be mined out shortly.
The Cheb Basin – these kaolins originated through kaolinization of granites of the Smrčiny massif. A single deposit in this area – Plesná-Velký Luh (KK, KP) – has not been mined yet.
The Třeboň Basin – less important deposits, local kaolins originated from granites and biotite paragneisses of the Moldanubicum. Only ceramic kaolins (KK) at two small de-posits: Kolenec and Klikov are evaluated here. The raw material is not mined and its exploitation is not foreseen due to its low quality.
Vidnava – kaolins formed from granites of the Žulová Massif. The raw material of a single, until now not mined deposit Vidnava has been alternatively evaluated as KP and KK. In The Register it is however listed under refractory clays for grog production to ensure its best use.
Other smaller kaolin occurrences have been either mined out (Lažánky) or not explored yet (Žlutice, Toužim, Javorník areas).The kaolin deposits of the Czech Republic are important also on a world scale, the most
important areas being Plzeň, Karlovy Vary, Podbořany and Kadaň. All Czech kaolin depos-its are extracted by open-pit mining operations at present.

199Kaolin
3. Registered deposits and other resources in the Czech Republic(see map)Principal areas of deposits presence:1 Karlovy Vary region 4 Plzeň region 7 Třeboň Basin2 Kadaň region 5 Znojmo region 8 Vidnava3 Podbořany region 6 Cheb Basin
4. Basic statistical data of the Czech Republic as of December 31
Year 2002 2003 200� 2005 2006Deposits..–.total.number 65 65 65 66 66
. exploited 13 15 15 1� 1�Total.mineral.*reserves,.kt. 1.127.292 1.121.0�5 1.120.869 1.10�.330 1.20�.3�9
. economic.explored.reserves 233.868 221.695 215.787 195.550 191.326
. economic.prospected.reserves
�95.636 �88.�0� �9�.16� �86.686 567.110
. potentially.economic.reserves
397.788 �10.9�6 �10.918 �22.09� ��5.913
Mine.production,.kt. a) 3.650 �.155 3.862 3.882 3.768Beneficiated (water-washed).kaolin.production,.kt
577 591 596 6�9 673
* see NOTE on page 12 on a terminological difference between Czech official application of the term reserves and standard international application of the term
a) raw kaolin, total production of all technological grades;
The data of kaolin for production of porcelain and fine ceramics (KJ) and kaolin used as fillers in paper industry (KP) have been stated separately due to great varieties of end use and prices of the individual kaolin types.

200
Kao
linre
serv
ed.re
gist
ered
.dep
osits
exha
uste
d.de
posi
ts.a
nd.o
ther
.reso
urce
s
Industrial minerals

201
Kaolin.for.production.of.porcelain.and fine ceramics (KJ) 2002 2003 200� 2005 2006
Deposits.–.total.number 29 29 29 29 29
. exploited. a) 6 7 7 7 7
Total.mineral.*reserves,.kt. 257.��1 258.622 257.119 256.232 255.331
. economic.explored.reserves 58.11� 56.5�1 56.008 55.�91 5�.965
. economic.prospected.reserves 110.155 108.362 107.762 107.762 107.762
. potentially.economic.reserves 89.172 93.719 93.3�9 92.979 92.60�
Mine.production,.kt �2� �02 ��8 �29 ��9
* see NOTE on page 12 on a terminological difference between Czech official application of the term reserves and standard international application of the term
a) exploited deposits of KJ: Božičany-Osmosa-jih, Jimlíkov, Krásný Dvůr-Podbořany, Mírová, Nepomyšl-Velká, Podlesí 2, Ruprechtov
Kaolin.for.paper.industry.(KP) 2002 2003 200� 2005 2006
Deposits.–.total.number 22 22 22 22 23
. exploited. a) 7 8 8 7 7
Total.mineral.*reserves,.kt. 380.352 376.722 365.127 266.832 3�9.689
. economic.explored.reserves 88.918 82.513 77.365 32.�62 31.228
. economic.prospected.reserves 190.399 186.1�9 185.975 176.07� 231.906
. potentially.economic.reserves 101.035 108.060 101.787 58.296 86.555
Mine.production,.kt. 2.768 3.�01 3.181 1.023 1.013
* see NOTE on page 12 on a terminological difference between Czech official application of the term reserves and standard international application of the term
a) Exploited deposits of KP: Horní Bříza-Trnová, Chlumčany-Dnešice, Kaznějov-jih, Kralupy u Chomutova-Merkur, Lomnička-Kaznějov, Otovice-Katzenholz, Rokle, Únanov-sever 3
Domestic production of selected intermediate products
Year/.ths.m2 2002. 2003 200� 2005. 2006
Ceramic.tiles.glazed 22.7�1 23.666 2�.08� 23.635 23.085
Ceramic.tiles.unglazed 5.976 6.952 8.567 8.175 7.967
Kaolin

202
porcelain productionThun Karlovarský porcelán a.s.Český porcelán a.s. DubíPorcelánová manufaktura Royal Dux Bohemia a.s.Leander, Porcelán Loučky s.r.o.G. Benedikt Karlovy VaryHaas & Czjzek, První porcelánová manufaktura v Čechách, s.r.o.Starorolský porcelán Moritz Zdekauer a.s.
Industrial production of special ceramic materialsGlazura s.r.o, Roudnice nad LabemElektroporcelán Louny a.s. – výroba keramických izolátorůTechnická keramika a.s.Jizerská porcelánka s.r.o.Thun Karlovarský porcelain a.s. is the biggest Czech producer of household porcelain. It
comprises the following plants: Concordia a.s. (yearly production of 1,000 tonnes of porcelain), Chodov (traditional pink china production, about 100 tonnes per year), Klášterec (production of 4,500 tonnes per year), Nová Role (production of 4,000 tonnes of china per year) and Thun Studio. Český porcelán a.s. Dubí is one of the producers of known china with onion décor. Apart from this, it produces other white china types, decorated china and hotel china. Český porcelain a.s. is the major share-holder of the Porcelánová manufaktura Royal Dux Bohemia in Duchcov, the traditional producer of figural and decorative china. Fine white ornamental and household china and a big assortment are produced by the Leander Porcelán Loučky s.r.o. G. Benedikt Karlovy Vary Company specializes in the china production for hotels and gas-tronomy. Haas & Czjzek, První porcelánová manufaktura v Čechách, s.r.o. operates a plant in Horní Slavkov, which produces hand-painted china dining sets. Starorolský porcelán Moritz Zdekauer a.s. is engaged in household, hotel and ornamental porcelain as well.
Glazura s.r.o. from Roudnice nad Labem is an important producer of ceramic frits and flux-ing agents. It produces namely a large variety of ceramic glazes which improve the surface of ceramic products by primarily ensuring their impermeability, increasing their chemical resist-ance and mechanical ruggedness and improving their aesthetic properties (colouring, lustre etc.). Elektroporcelán Louny a.s. specializes in the production of porcelain insulators and prod-ucts from special ceramic materials which show extraordinary resistance to abrasion and me-chanical and thermal stress. The assortment offered by Technická keramika a.s. includes pro-duction of technical oxide ceramics for the electrotechnical industry. Laboratory and technical porcelain is produced by e.g. Jizerská porcelánka s.r.o. seated in Desné in Jizerské hory Mts.
5. Foreign trade2507 – Kaolin and other kaolinitic clays, also calcined
2002 2003 200� 2005 2006Import,.t 12.791 15.�66 1�.0�6 16.901 22.961Export,.t. a) ���.820. ��1.500 �83.720 268.715 261.065
a) export of kaolin of the highest quality Sedlec Ia was limited by Ministry of Industry and Trade
Industrial minerals

203
As kaolin is a very important Czech export commodity, foreign trade numbers are given in detail below:25070020 – Kaolin
2002 2003 200� 2005 2006Import,.t 3.90� 5.626 6.888 11.697 12.227Export,.t. a) ��0.128 �38.��1 �82.251 265.195 259.395
a) export of kaolin of the highest quality Sedlec Ia was limited by Ministry of Industry and Trade
25070080 – Kaolinic clay (other than kaolin)
2002 2003 200� 2005 2006Import,.t 8.887 9.8�0 7.158 5.203 10.735Export,.t �.692 3.059 1.�69 3.520 1.670
Detailed data on kaolin imports (t)
Country 2002 2003 200� 2005 2006Great.Britain 9.193 10.5�6 7.585 5.122 11.270Ukraine 925 2.208 3.278 7.193 5.690Germany 1.82� 2.063 2.162 3.33� �.139others 8�9 629 1.021 1.252 1.862
Detailed data on kaolin exports (t)
Country 2002 2003 200� 2005 2006Germany 129.717 1�2.970 152.135 60.803 50.801Slovakia 86.6�0 65.807 75.0�5 80.819 82.555Austria 51.07� �8.53� ��.5�3 16.5�2 1�.226Italy 31.221 27.�31 30.83� 23.098 22.391Poland 22.710 23.8�6 27.895 26.027 29.056Belgium 25.027 3�.689 50.356 271 0the.Netherlands 33.00� 3�.692 �0.310 0 �9Romania 17.999 18.376 1�.610 13.�25 12.200Hungary 11.960 9.510 10.005 8.56� 5.7�5United.Arab.Emirates �.161 7.826 7.612 6.986 8.�06Slovenia 6.302 6.61� 7.525 6.952 5.992Iran 6.292 3.302 2.528 0 �.209others 18.713 17.902 20.322 17.280 25.�37
Kaolin

20�
Kaolin belongs to the most attractive items of the Czech foreign trade with raw materials – the fact that Czech kaolin was exported to more than 40 European and non-European coun-tries during the last five years documents this. Neighbouring countries (Germany, Slovakia, Austria, Poland or Italy) as well as distant and exotic ones (United Arab Emirates, Iran, Bangladesh, Malaysia etc.) represent the traditional and large consumers. According to the ČSÚ, the export volume of the Czech kaolin has decreased markedly during the last 2 years; this concerns especially exports to Germany, Austria, Belgium and the Netherlands. Import volumes are significantly lower; however, they have been increasing slightly every year. About half of the imported raw material is represented by high-quality British kaolins.
6. prices of domestic market and foreign tradeThe average prices of ceramic grade on the domestic market oscillated depending on
quality, between CZK 2,000–3,500 per tonne. The average export prices were CZK 3,600–3,900 per tonne. Paper filling kaolin has been sold at CZK 1,400–2,200 per tonne. Only a small part exceeded the price of CZK 2,500 per tonne (bulk kaolin). Prices above CZK 3,000 per tonne were attained only for products for the chemical industry, produced by grinding of paper kaolin. Crude kaolin for building ceramics was sold for CZK 200–300 per tonne. Beneficiated (water-washed) kaolin from Podbořany was sold on the domestic market at CZK 1,500 per tonne, kaolin for fine ceramics and glazes production roughly at CZK 2,000 per tonne and activated kaolin at CZK 2,400 per tonne.
25070020 – Kaolin
2002 2003 200� 2005 2006
Average.import.prices.(CZK/t) 7.281 5.159 5.278 �.085 �.�59
Average.export.prices.(CZK/t) 2.112 2.230 2.352 2.�26 2.393
Average import prices have been about twice as high as the export prices especially because high-quality British and German kaolin for the most demanding use has been im-ported into the Czech Republic. Average export prices for Czech kaolin have been rather stable, between 2,100 and 2,400 CZK/t.
7. Mining companies in the Czech Republic as of December 31, 2006LASSELSBERGER, a.s. PlzeňSedlecký kaolín a.s., BožičanyKaolin Hlubany a.s., Podbořany KERAMOST, a.s., Most KSB s.r.o., Božičany
8. World productionData on world production of kaolin vary considerably; the statistics quote alternately
dry or wet weight, raw or refined (floated) kaolin, exact figures on mined and produced
Industrial minerals

205
volumes of saleable product or their estimates. Considerably different numbers are quoted also in single year’s volumes of the same publications. Despite of these facts it can be estimated that world production since 1984 ranged above 20 mill tonnes per year, and in 1990 according to the Welt Bergbau Daten (WBD), it reached its top (27.7 mill t). After a fall to 21 mill t in 1993, world production of kaolin has been slowly increasing again. Numbers in World Mineral Statistics (WMS) are somewhat higher, and those in the Mineral Commodity Summaries (MCS) are markedly higher as they include some types of clays. In general, an increase of kaolin mining production in rapidly emerging countries (China, Brazil, Republic of Korea) and stagnation or decrease of mine production in developed countries (Germany, Great Britain, the USA) can be observed. Mine production of Australia and Jordan increased markedly during the last three years; on the other hand it decreased in Iran and Mexico.
Year 2002 2003 200�. 2005 2006.e
Mine.production,.kt.(MCS) �3.200 �1.000 ��.500 ��.700 ��.800
Mine.production,.kt.(WBD) 25.81� 26.563 26.617 26.759 N
Mine.production,.kt.(WMS) 21.900 22.300 22.600 N N
Main producers’ share in the world mine output (2005; according to the Welt Bergbau Daten):
USA 26.9 % Russia 4.3 %Germany 14.1 % Czech Republic 3.2 %China 10.1 % Spain 2.7 %Brazil 9.0 % Republic of Korea 2.6 %Great Britain 7.1 % Turkey 2.3 %
Note:Data on production share of the Czech Republic vary between the yearbooks. Welt Bergbau Daten gives about 3.2 % for 2005, while World Mineral Production gives 2.8 % for year 2004. The Industrial Minerals HandyBook quotes 8 % as the Czech share on the world production for 1997.
9. World market pricesPrices of kaolin on the world market – in spite of a lasting surplus of supply – kept at
a steady level. The Industrial Minerals magazine quotes each month the prices of British and US kaolin. However, the range of quotations was changed in 2002 and the prices of the British Cornwall kaolin have ceased to be published. The average prices of traded kaolin at year-end were as follows:
Kaolin

206
Commodity/Year 2002 2003 200� 2005 2006Kaolin refined, filler, .Ex.Georgia.plant,..USA
USD/st 90.00 90.00 90.00 90.00 90.00
Kaolin refined, coating, Ex.Georgia.plant,..USA
USD/st 135.00 135.00 135.00 135.00 135.00
Kaolin refined, calcined, Ex.Georgia.plant,..USA
USD/st 3�8.00 3�8.00 3�8.00 3�8.00 3�8.00
Kaolin refined (water-washed),.ceramic.grade,.bulk,.EXW.France
GBP/t,.since.2005.
EUR/t70.00 70.00 70.00 116.50 116.50
Kaolin refined (water-washed),.ceramic.grade,.bulk,.FOB.Rotterdam
GBP/t 80.00 80.00 80.00 80.00 80.00
10. recyclingIn ceramic production, a part of the shards is recycled. Increasing recycling of paper has
little influence on kaolin consumption, since recycled mineral fillers and coating pigments are separated and slurry is discarded. The recycled paper – used mainly for newsprint and wrapping – uses little if any kaolin.
11. possible substitutesDepending on the use, the following holds:
In production of porcelain, kaolin is irreplaceable.In ceramic formulations, kaolin can in some cases be partially substituted by clays, talc,
wollastonite or mullite (also synthetic mullite), but in most cases these substitutes are uncompetitive.
In production of paper (which consumes almost half of total production of kaolin), the possibilities for substitution are the highest – kaolin as a filler can be replaced by extra finely pulverized limestone, dolomite (also synthetic – precipitated), mica (muscovite), talc, wollastonite, etc.
In other cases, where kaolin is used as filler (insulation materials, pigments, glass fibres), the situation is analogous.
In production of refractory materials and applications in the building industry, other materials with adequate properties can successfully substitute kaolin.
Industrial minerals
207Clays
Clays
1. Characteristics and useClays are sedimentary or residual unconsolidated rocks consisting of more than 50 %
of clay fraction (particle size less than 0.002 mm), containing as the major constituent clay minerals, particularly those of the kaolinite group, but also hydromicas (illite) and montmorillonite (see bentonite). Depending on the composition of clay minerals, clays are divided into monomineral (e.g. kaolinite, illite, etc.) and polymineral clays (composed of more clay minerals). Clays can contain various admixtures, e.g. quartz, micas, carbonates, organic matter, oxides and hydroxides of Fe, etc. Their colour depends on admixtures and can be white, grey, yellow, brown, violet, etc. They can be also secondarily consolidated (claystones) or recrystallized unmetamorphosed (shales or clay shales).
From the point of view of deposits and further technological processing, this category includes a wide selection of rocks rich in clay minerals. Abroad, bentonite, brick-clays and even kaolins are often included in this category. Clays can be found in virtually all sedi-mentary formations all over the world.They are mostly used in production of ceramics, as refractory and sealing materials, fillers, in paper industry and for filtration of oils, etc.
2. Mineral resources of the Czech RepublicAccording to the technological properties and use, the clays in the Czech Republic are
classified as follows:Whiteware clays (JP) – they are used as a raw material for the production of ceramics
with white- or light-burning colour, sintering at temperatures over 1,200 °C. The clay minerals are represented mostly by kaolinite; the content of clastic particles is low.
Refractory clays for grog (JZ) – after firing, these clays are suitable as grog for pro-duction of fireclay products. The material is required to contain maximum Al2O3 and a minimum Fe2O3; other required parameters are very high refractoriness and the lowest possible absorption capacity after firing. The major clay mineral is again kaolinite (and/or dickite).
Other refractory clays (JO) – used as binding (plastic) clays in the production of mainly refractory products. Besides high binding properties they should contain as low amount of Fe2O3 and clasts as possible.
Non-refractory ceramic clays (JN) – the raw material of wide spectrum of technological properties and uses (production of floor and wall tiles, additives, etc.).
Aluminous underlying clays (JA) – kaolinite clays underlying the coal seams near Most in the North Bohemian Basin, containing about 40 % Al2O3, locally 3–7 % TiO2 and usu-ally a large amount of siderite. These clays were considered as a possible source of Al in the past. They are of no importance today due to the energy-intensive processing. They are moreover overlain by waste dumps of coal mines.
Clay deposits in the Czech Republic are concentrated in the following major areas:The Kladno-Rakovník Permo-Carboniferous – the deposits contain mostly high-grade
refractory claystones (shales or schistose clays) (JZ), which are used in the production

208
of refractory grogs. Less common are deposits of red-burning tile clays and grey non-re-fractory claystones (JN). A large Rynholec-Hořkovec 2 deposit and a smaller Lubná-Marta deposit represent the most important deposits.
Moravian and east Bohemian Cretaceous sediments – this is the area of the largest clay reserves (JZ grade), with the same use as the ones from the previous area (but of a slightly lower quality). A single deposit Březinka is mined at present.
Cretaceous sediments in the Prague surroundings – these clays are suitable as a highly refractory (non-plastics) grog (JZ) and refractory binding clays (JO), as well as white-ware clays (JP). The most important are deposits of JZ Vyšehořovice and Brník.
The Louny Cretaceous – these clays are suitable as whiteware clays (JP) and other re-fractory clays (JO), but particularly as ceramic clays (JN). A medium-sized Líšťany de-posit (JN) is the only deposit mined at present.
South Bohemian Basins – medium or high-grade refractory clays, suitable for use name-ly as binding clays (JO), whiteware clays (JP) and non-refractory clays (JN). Borovany-Ledenice (JO, diatomite is mined here, too) and Zahájí-Blana represent the main depos-its.
The Plzeň Basin and Tertiary relics of Central and Western Bohemia – mostly medium grade refractory clays, classified as binding clays (JO) and ceramic clays for production of floor and wall tiles, as well as for stoneware (JN). The large Kyšice-Ejpovice deposit (JO) is the most important deposit here.
The Cheb and Sokolov Basins – more significant is the Cheb Basin containing important binding clays (JO), whiteware clays (JP), refractory and sintering clays (JO, JN), etc. Nová Ves u Křižovatky 2 represents the significant exploited deposit of JO.
North Bohemian and the Žitava (Zittau) Basins – apart from high aluminous underlying clays (JA), there are also overlaying ceramic (mostly sintering and tile) clays (JN). Only a medium-sized deposit of JN Tvršice in the North Bohemian Basin is mined.
Tertiary and Quaternary sediments in Moravia – mostly ceramic (sintering and tile) clays (JN). The mining in this region was terminated in 1997 (Poštorná, Šatov).
The most important areas with clay deposits in the Czech Republic are nowadays Cheb Ba-sin, south Bohemian Basins, Cretaceous in the Prague surroundings, Permo-Carboniferous of Rakovník region and less Cretaceous of Moravia and eastern Bohemia. Clays and claystones in the Czech Republic are extracted by open-pit mining and only locally by underground op-erations (Lubná, Březinka).
3. Registered deposits and other resources in the Czech Republic(see map)
Principal areas of deposits presence:1 Kladno-Rakovník Permo-Carboniferous 7 Tertiary relics of Central Bohemia2 Moravian and East-Bohemian Cretaceous 8 Tertiary relics of Western Bohemia 3 Cretaceous in the Prague surroundings 9 Cheb Basin and Sokolov Basin4 Louny Cretaceous 10 North-Bohemian Basin5 South-Bohemian Basins 11 Zittau Basin6 Plzeň Basin 12 Tertiary and Quaternary in Moravia
Industrial minerals

209Clays
Cla
ysre
serv
ed.re
gist
ered
.dep
osits
exha
uste
d.de
posi
ts.a
nd.o
ther
.reso
urce
s

210 Industrial minerals
4. Basic statistical data of the Czech Republic as of December 31
Year. 2002 2003 200� 2005 2006Deposits.–.total.number 116 112 111 111 111
. exploited 26 26 25 25 22Total.mineral.*reserves,.kt. 1.0�9.�96 960.60� 959.285 956.937 9��.607
. economic.explored.reserves 231.500 19�.�80 193.861 193.230 188.102
. economic.prospected.reserves
511.233 �16.399 �16.3�8 �1�.01� �11.630
. potentially.economic.reserves
306.763 3�9.729 3�9.076 3�9.693 3��.875
Mine.production,.kt 56� 55� 6�9 661 561
* see NOTE on page 12 on a terminological difference between Czech official application of the term reserves and standard international application of the term
Domestic production of selected intermediate products
Year./.kt 2002. 2003 200� 2005. 2006
Fire-clay 22.� 2�.1 26.1 2�.9 23.8
Ganister 6.7 8.� 8.7 8.8 10.5
Non-shaped.refractories 51.� 62.� 82.0 96.1 85.6
Other.refractories 33.9 37.7 67.0 66.2 68.�
5. Foreign trade2508 – Other clays (except expanded clays), andalusite, kyanite, sillimanite, also baked, mullite, fire-clay or ganister earths
2002 2003 200� 2005 2006
Import,.t 36.853 �1.95� 59.00� 57.63� 62.289
Export,.t 157.918 1�5.597 230.108 209.718 189.086
As the item 2508 includes various raw materials (often with a different way of applica-tion), also numbers on foreign trade on chosen sub-items are given below:

211
250830 – Refractory (fire) clay
2002 2003 200� 2005 2006
Import,.t 8.1�0 9.388 11.937 11.29� 18.087
Export,.t �6.785 �6.678 �1.722 35.1�0 36.623
Detailed data on refractory clay imports (t)
Country 2002 2003 200� 2005 2006
Poland 7.178 6.973 9.869 8.�21 1�.655
Ukraine 67� 1.902 1.236 892 1.720
Germany 2�3 �62 767 1.891 1.531
others �5 51 65 90 181
Detailed data on refractory clay exports (t)
Country 2002 2003 200� 2005 2006
Germany 16.975 17.395 13.787 21.509 23.729
Slovakia 10.123 9.852 8.07� 5.780 5.507
Austria 8.158 8.22� 11.558 201 23�
Italy 5.�03 5.313 2.�52 1.�13 1.1�8
others 6.126 5.89� 5.851 6.237 6.005
Refractory clays belong to the most important items of clay foreign trade. The volume of imports roughly doubled between 2003 and 2006 as a result of increased imports from Poland. In contrast, traditionally high export has been decreasing during the last years. Czech refractory clays are exported mainly to Germany and Slovakia. Whereas the volume of exports to Germany has been increasing, exports to Slovakia decreased to one half during the period 2002–2006.
250840 – Other clays
2002 2003 200� 2005 2006
Import,.t 5.317 6.�9� 16.892 23.955 17.63�
Export,.t 37.285 35.827 ��.383 6.979 8.9�0
Clays

212
250870 – Fire-clay or ganister earths
2002 2003 200� 2005 2006
Import,.t 7.553 9.755 5.889 2.235 2.168
Export,.t �1.758 �5.597 81.891 82.2�6 56.615
6. prices of domestic market and foreign trade250830 – Refractory (fire) clay
2002 2003 200� 2005 2006
Average.import.prices.(CZK/t) 1.231 1.017 1.26� 1.625 1.896
Average.export.prices.(CZK/t) 1.379 1.361 1.766 1.�02 1.2�9
250840 – Other clays
2002 2003 200� 2005 2006
Average.import.prices.(CZK/t) 3.068 3.589 2.906 1.920 1.981
Average.export.prices.(CZK/t) 801 821 83� 1.863 1.815
250870 – Fire-clay or ganister earths
2002 2003 200� 2005 2006
Average.import.prices.(CZK/t) 2.0�5 2.172 3.21� 5.8�7 5.309
Average.export.prices.(CZK/t) 2.�79 2.720 3.009 3.035 3.301
Different qualities of clay and schistose clay have different market prices. For example, crude refractory clay is delivered at CZK 450–830 per tonne, average price is roughly CZK 600 per tonne, dried refractory clay reaches CZK 860–2,000 per tonne, and average prices are about CZK 1,400 per tonne. Kaolinic clay with high plasticity and refractoriness of about 1,700 oC were sold for CZK 450–1,050 in crude state and for CZK 2,500–5,000 dried.
Prices of crude sintering clay oscillate between CZK 200–800 per tonne, average price is CZK 400 per tonne. Dry sintering clay is sold at CZK 1,150 per tonne. Prices of crude bleaching clay oscillate between CZK 350 and CZK 1,630 per tonne, average price is about CZK 1,300 per tonne, prices of dry bleaching clay reach CZK 1,375–2,950 per tonne, and average price is about CZK 2,160 per tonne. The average prices of other crude clays are CZK 300 per tonne; prices of dry ones are about CZK 1,450 per tonne.
Prices of crude schistose clay on the domestic market oscillate between CZK 400–600 per tonne. Calcined schistose clay is sold at CZK 2,600–4,000 per tonne.
Industrial minerals

213
7. Mining organizations in the Czech Republic as of December 31, 2006LASSELSBERGER, a.s. PlzeňKERAMOST a.s., Most České lupkové závody a.s., Nové StrašecíP-D Refractories CZ a.s., Velké OpatoviceRAKO – Lupky s.r.o., Lubná u RakovníkaKaolin Hlubany a.s., Podbořany
8. World productionOverall data on the world production of clays are not available. There are some partial sta-
tistics on certain grades of clays; according to these, the production of clays has been slowly but steadily growing.
9. World market pricesThe average prices of most of the clays were steadily growing. Prices of some of the
clays were quoted each month in the Industrial Minerals magazine. Only quotations of the refractory clay world prices have been published since 2002. The overview of average prices of sales at yearend for the following commodities:
Commodity/Year 2002 2003 200� 2005 2006Refractory.clay,.�5.%.Al2O3,.FOB.China USD/t 67.50 67.50 67.50 8�.00 8�.00
Calcined.kaolinic.clay,..�7.%.Al2O3,.FOB.EU USD/t 120.00 120.00 1�0.00 1�0.00 1�0.00
10. recyclingThe material is not recycled.
11. possible substitutesA majority of the clays are used in various fields of ceramics production. Depending on
the use, the following substitutes are possible:Whiteware clays used in ceramic recipes – here the clays are irreplaceable. On the con-
trary, the selection of clays used is still wider, depending on local resources and new recipes.
Clays for grogs – especially in production of fire-clay and similar materials, the clays can be successfully substituted by a number of refractory materials – andalusite, mullite (recently even synthetic mullite), etc. – depending on the use and local availability.
The same applies to clays used in production of other refractory products; there are a number of possible substitutes, which depend on the purpose and use of these products, economic limits, and local resources.
Clays

21�
Clays for non-refractory ceramic products (earthenware pipes, tanks for acids, floor and wall tiles, jars, etc.) – besides natural mineral substitutes (such as halloysite for floor tiles, mineral pigments instead of colour-burning clays, cast basalt), other possible sub-stitutes can be glass (tiles), artificial stoneware (floor tiles, paving bricks, slabs), metals, plastics, etc. However, in the ceramic production itself, the clays are irreplaceable.
Titanium-bearing and aluminous clays are a potential source of titanium and aluminium and as such represent a substitute for traditional metallic ores of these elements.
Industrial minerals

215Bentonite
Bentonite
1. Characteristics and useBentonite is a soft, very fine-grained heterogeneous rock of various colours, composed
mostly of clay mineral montmorillonite, which originated mostly by submarine or atmos-pheric weathering of basic (to a smaller extent also of acid) volcanic rocks (mainly tuffs). Montmorillonite gives to bentonite its typical properties – high sorption capacity, char-acterized by a high value of cation exchange (the ability to receive certain cations from solutions, and replace them with its own molecules – Mg, and in some cases also Ca and alkalies); internal swelling after contact with water (some bentonites do not swell, but have a high absorptive capacity as bleaching clays, especially when they are activated); high plasticity and binding ability. Bentonite also contains other clay minerals (kaolinite, illite, beidellite), Fe compounds, quartz, feldspars, volcanic glass, etc., which represent impuri-ties and if possible they are removed during the mineral processing.
World economic reserves of bentonite are estimated at more than 1,400 mill t. Bentonite has many uses, which depend upon its mineralogical composition and tech-
nological properties. It is mostly used in the foundry industry, for pelletizing of iron ores (4–10 kg per tonne of pellets), as an adsorbent (decolourization, catalysis, refining, filtra-tion, drying, waste water treatment, pesticide carrier), in drilling mud, as a filler (dyes, varnishes, pharmaceutical and cosmetic products), a suspension (lubricating oils), in the building industry (sealing material), in agriculture, etc. Bentonite use as a bedding (cat lit-ter) and a granulated food binder has been increasing recently.
2. Mineral resources of the Czech RepublicAll bentonite deposits in the Czech Republic were formed by clay weathering of vol-
canic rocks. Bentonite deposits and reserves in the Czech Republic are almost exclusively concentrated in the area of the Doupovské hory Mts. and the České středohoří Mountains. A large portion of bentonite from these deposits is of the highest grade, suitable especially for the foundry industry (bonding agent for moulding sand) – both activated (Ca2+ and Mg2+
ions replaced by Na+ ions) and non-activated bentonites are used for this purpose.Mining, mineral processing and use of bentonite in the Czech Republic started only in
the late 1950s, particularly due to its use in the foundry industry. The mining culminated first at the beginning and end of the 1980s (207 kt in 1987). Decreased demand from the foundry industry in the first half of the 1990s resulted in reduced mine production (54 kt in 1995). Mine production increased substantially in 1996–2000 especially due to the higher demand for non-traditional bentonite use (bedding, use in animal food, insulation materials etc.). This trend still continues.The eastern margin of the Doupovské hory Mts. at the contact with the North Bohemian
Basin represents the most important area with bentonite deposits. A major part of the reserves and the largest bentonite deposits are concentrated in Kadaň and Podbořany surroundings. Rokle is the most important deposit mined at present.
Bentonite deposits of the western margin of the Doupovské hory Mts. at the contact with the Hroznětín Basin are concentrated mainly in Hroznětín surroundings. Mining and
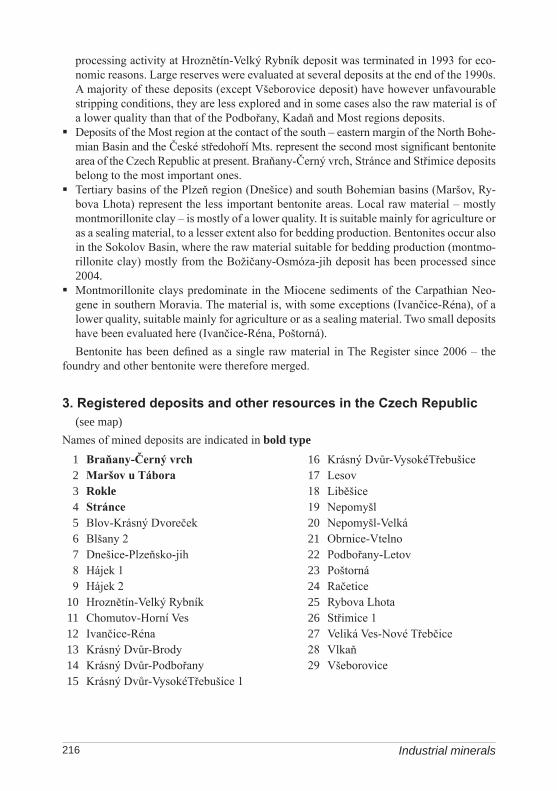
216 Industrial minerals
processing activity at Hroznětín-Velký Rybník deposit was terminated in 1993 for eco-nomic reasons. Large reserves were evaluated at several deposits at the end of the 1990s. A majority of these deposits (except Všeborovice deposit) have however unfavourable stripping conditions, they are less explored and in some cases also the raw material is of a lower quality than that of the Podbořany, Kadaň and Most regions deposits.
Deposits of the Most region at the contact of the south – eastern margin of the North Bohe-mian Basin and the České středohoří Mts. represent the second most significant bentonite area of the Czech Republic at present. Braňany-Černý vrch, Stránce and Střimice deposits belong to the most important ones.
Tertiary basins of the Plzeň region (Dnešice) and south Bohemian basins (Maršov, Ry-bova Lhota) represent the less important bentonite areas. Local raw material – mostly montmorillonite clay – is mostly of a lower quality. It is suitable mainly for agriculture or as a sealing material, to a lesser extent also for bedding production. Bentonites occur also in the Sokolov Basin, where the raw material suitable for bedding production (montmo-rillonite clay) mostly from the Božičany-Osmóza-jih deposit has been processed since 2004.
Montmorillonite clays predominate in the Miocene sediments of the Carpathian Neo-gene in southern Moravia. The material is, with some exceptions (Ivančice-Réna), of a lower quality, suitable mainly for agriculture or as a sealing material. Two small deposits have been evaluated here (Ivančice-Réna, Poštorná).Bentonite has been defined as a single raw material in The Register since 2006 – the
foundry and other bentonite were therefore merged.
3. Registered deposits and other resources in the Czech Republic(see map)
Names of mined deposits are indicated in bold type 1 Braňany-Černý vrch 16 Krásný Dvůr-VysokéTřebušice 2 Maršov u Tábora 17 Lesov 3 Rokle 18 Liběšice 4 Stránce 19 Nepomyšl5 Blov-Krásný Dvoreček 20 Nepomyšl-Velká6 Blšany 2 21 Obrnice-Vtelno7 Dnešice-Plzeňsko-jih 22 Podbořany-Letov8 Hájek 1 23 Poštorná9 Hájek 2 24 Račetice
10 Hroznětín-Velký Rybník 25 Rybova Lhota11 Chomutov-Horní Ves 26 Střimice 112 Ivančice-Réna 27 Veliká Ves-Nové Třebčice13 Krásný Dvůr-Brody 28 Vlkaň14 Krásný Dvůr-Podbořany 29 Všeborovice15 Krásný Dvůr-VysokéTřebušice 1

217Bentonite
Ben
toni
tere
serv
ed.re
gist
ered
.dep
osits
exha
uste
d.de
posi
ts.a
nd.o
ther
.reso
urce
s

218
4. Basic statistical data of the Czech Republic as of December 31
Year 2002 2003 200� 2005 2006
Deposits.–.total.number 27 28 28 28 29
. exploited 3 � � � �
Total.mineral.*reserves,.kt. 318.�91 317.390 315.256 315.�13 327.155
. economic.explored.reserves 5�.268 5�.201 5�.035 53.997 53.893
. economic.prospected.reserves 169.969 168.982 168.10� 168.10� 177.893
. potentially.economic.reserves 9�.25� 9�.207 93.117 93.312 95.369
Mine.production,.kt 17� 199 232** 223** 267**
* see NOTE on page 12 on a terminological difference between Czech official application of the term reserves and standard international application of the term
** including montmorillonite clays from kaolin deposits overburden
5. Foreign trade250810 – Bentonite
2002 2003 200� 2005 2006
Import,.t 12.623 11.795 19.9�� 15.08� 18.521
Export,.t. 32.002 17.�58 62.012 85.1�6 86.300
250820 – Decolourizing earths and Fuller’s earth
2002 2003 200� 2005 2006
Import,.t 5�7 702 56� 1.333 1.10�
Export,.t 53 32 27 0 1
Detailed data on bentonite imports (t)
Country 2002 2003 200� 2005 2006
Slovakia 8.318 8.598 13.721 8.�09 12.065
Germany 3.656 2.080 �.115 �.267 3.997
Italy 207 395 623 995 1.329
others ��2 722 1.�85 1.�13 1.130
Industrial minerals

219
Detailed data on bentonite exports (t)
Country 2002 2003 200� 2005 2006
Germany 19.280 10.388 ��.032 60.129 60.75�
Austria 7.192 55� 8.2�7 13.��7 12.700
Poland 1.730 3.09� 3.703 �.967 5.838
Slovakia 3.332 2.686 3.317 �.052 �.0�8
others �68 736 2.713 2.551 2.960
Bentonite belongs to minerals the export of which is several times higher than import (about five times in the last two years). It has been traditionally imported mainly from Slovakia, from where also the high-quality raw material from the Stará Kremnička-Jelšový potok deposit is imported, and from Germany. The volume of import from Italy has been increasing recently. Czech bentonite is exported mainly to Germany (three-fold increase between 2002 and 2005) and to Austria.
6. prices of domestic market and foreign trade250810 – Bentonite
2002 2003 200� 2005 2006
Average.import.prices.(CZK/t) 3.619 3.956 3.192 �.688 3.778
Average.export.prices.(CZK/t) 5.00� 9.�09 3.216 2.�81 2.365
Technical bentonite, which can be used as sealing and backfilling material or as an addi-tive in fertilizers, has been sold on domestic market for prices from CZK 3,000 per tonne. Import prices have been fluctuating between 3,200 and 4,700 CZK/t during the last five years. Export prices show much larger variations. However, they have decreased recently significantly in consequence of the marked increase of the volume of export to Germany.
7. Mining companies in the Czech Republic as of December 31, 2006KERAMOST a.s., MostLITH s.r.o., Malé Chvojno
8. World productionAnnual world production of bentonite is about 12 mill tonnes. World production oscillated
between 10 and 13 mill tonnes in the last 5 years. Data of the individual statistical reviews differ considerably. The amount of mine production of the biggest producers (the USA, Greece, and Germany) does not show large fluctuations. Mining production in Great Brit-ain, Italy and Russia markedly decreased whereas that of Mexico increased during the last five years. World production of the so-called Fuller´s earth (Ca-bentonite in fact) has been
Bentonite

220
oscillating between 4 and 5.6 mill t during the recent years (according to the Mineral Com-modity Summaries).
Year 2002 2003 200� 2005. 2006.e
Mine.production,.kt.(MCS) 10.000 10.200 10.500 11.700 11.800
Mine.production,.kt.(WBD) 9.893 10.261 10.790 10.789 N
Mine.production,.kt.(WMP) 11.800 12.800 13.900 1�.�00 N
Main producers’ share in the world mine output (2005; according to WBD):USA 41.1 % Japan 4.2 %Greece 11.1 % Mexico 4.0 %Russia 7.9 % Germany 3.3 %Turkey 5.4 % Argentina 2.3 %Italy 4.6 % Brazil 2.0 %
The share of the Czech Republic for 2005 is about 1.7 % (11th place) as given by WBD.
9. World market pricesBentonite prices showed short-term fluctuations in the last few years. The higher in-
crease in price of some types of bentonite came in 2000. The prices of a majority of the mentioned categories continued to increase in 2001 and stagnated in 2002–2004. The price of the foundry bentonite of Indian provenance rose markedly in 2005. Subsequently prices of American bentonite from Wyoming increased by 7–40 % in 2006. According to quota-tions in the Industrial Minerals magazine, the average prices at year-end were as follows:
Commodity/Year 2002 2003 200� 2005 2006Wyoming,.crude,.bulk,.rail.hopper.cars,.FOB.ex-works USD/st ��.50 ��.50 ��.50 �6.50 59.00
Wyoming,.foundry.grade,.bagged,.rail.cars,.FOB.ex-works USD/st 63.00 63.00 63.00 63.00 67.50
Wyoming,.API,.bagged,.rail.cars,.FOB.ex-works USD/st �8.00 �8.00 �8.00 �8.00 67.50
Indian.bentonite,.cat.litter.grade,.crushed,.dried,.bulk,.FOB.Kandla USD/t 36.00 36.00 36.00 36.00 36.00
Indian.bentonite,.foundry.grade,.crushed,.dried,.bulk,.FOB.Kandla USD/t �2.50 �2.50 �2.50 67.50 67.50
Cat.litter.grade,.1–5.mm,.bulk,.FOB.main.European.port EUR/t 50.00 �3.50 �0.00 �3.50 �3.50
10. recyclingBentonite can be recycled on a very limited scale only.
Industrial minerals

221
11. possible substitutesIn moulding sand, bentonite can be replaced by bonding agents containing graphite, syn-
thetic polymers, or other clay minerals. Drilling mud can use similar substitutes; fillers can use chalk, dolomite, limestone, etc., in ecological applications bentonite can be replaced by zeolites. In production of iron ore pellets, burnt lime, polymers and other binders can replace bentonite.
Bentonite

222 Industrial minerals
Diatomite
1. Characteristics and use Diatomite is a sedimentary rock, consisting mainly of the microscopic cells of fresh-
water or marine diatoms. This rock shows various degrees of consolidation – it is either loose (diatomaceous earth) or consolidated (diatomaceous shale or chert). Loose rock has a character of very fine-grained sediment. Shells are partly dissolved during diagenesis and the sediment is impregnated by released opal, which leads to consolidation and schis-tosity development. Polishable and absorbing shales, sometimes even opal cherts are distin-guished depending on the degree of porosity. Chemically, diatomite is dominated by SiO2, the content of which should be the highest possible. From the technological point of view, important parameters are porosity, resistance against acids, refractoriness, thermal and elec-tric conductivity, density, moisture, chemical composition et al. Clastic, clayey and organic particles (sponges) and higher Al2O3, Fe2O3 and CaO contents are contaminants. Deposits originate in water basins with low content of CaCO3 and suspended aluminosilicate mate-rial. The most favourable conditions are in cool water near volcanic areas. The world eco-nomic reserves are estimated at 800 mill t, about 250 mill t of which occurs in the USA.
The material is used for filtration purposes (the highest grades), in production of fillers (rubber, paper, cosmetics), as abrasives, as carrier for catalysts, and in building industry for manufacturing of thermal and sound insulating materials.
2. Mineral resources of the Czech RepublicDiatomite accumulations in the Czech Republic are confined to areas with Tertiary and
Quaternary lake sediments, first of all to the Tertiary sediments of the South Bohemian basins and volcanic rocks of the České středohoří Mts. Smaller occurrences are known from other areas of the Bohemian Massif and in the Neogene of the Carpathian Foredeep and flysh. The biggest accumulations of diatomite in Bohemia are situated in the south Bohemian
basins. Spongy diatomites and diatomaceous clays (low-grade building diatomites) oc-cur together with lignite. The only registered and also mined deposit in the Czech Re-public – Borovany-Ledenice – is located in the Třeboň Basin. Tertiary sediments were deposited in tectonically confined space on the Moldanubian basement. Deposit layer of diatomites, diatomite clays and spongy diatomites occur in the upper part of the Mydlo-vary Formation. Diatomites are in subhorizontal position, of whitish grey to ochre col-our, unconsolidated with average thickness about 8.5 m (15 m at maximum). High-grade diatomite is used after processing for filtration purposes or as filler in food, chemical, pharmaceutical industries, etc. The highest-grade (extra pure) diatomite is used in wine, spirits, beer, edible oil or fat filtration. Diatomite of lower grade is suitable mostly for building and insulation materials production. It is partly used for cat litter production at present.
Many diatomite outcrops, which were occasionally mined already in the first half of the 19th century as a raw material for abrasives and polishing materials production, are known in the České středohoří Mts. The most significant deposit Kučlín was mined out in 1966. These occurrences are of no importance at present.

223
Lens-shaped occurrences of diatomites in the Carpathian flysh south of Brno (Pouzdřany) were prospected, with a negative result.
Quaternary diatomites are known from the Most (together with lake mud rich in organic matter) and Františkovy Lázně surroundings (deposit Hájek – earlier mined together with peat, nowadays a natural preserved area Soos).
3. Registered deposits and other resources in the Czech Republic(see map)Mined deposit:1 Borovany-Ledenice
4. Basic statistical data of the Czech Republic as of December 31
Year 2002 2003 200� 2005 2006
Deposits.–.total.number 1 1 1 1 1
. exploited 1 1 1 1 1
Total.mineral.*reserves,.kt. �.661 �.607 �.562 �.519 �.361
. economic.explored.reserves �.333 �.279 �.23� �.191 �.123
. economic.prospected.reserves 328 328 328 328 328
. potentially.economic.reserves 0 0 0 0 0
Mine.production,.kt 28 �1 33 38 53
* see NOTE on page 12 on a terminological difference between Czech official application of the term reserves and standard international application of the term
5. Foreign trade2512 – Siliceous fossil meal, siliceous earth
2002 2003 200� 2005 2006
Import,.t 1.6�7 1.562 1.969 2.267 2.292
Export,.t. 5.288 5.081 �.73� �.27� �.566
Detailed data on diatomite imports (t)
Country 2002 2003 200� 2005 2006
France 737 722 67� 675 �38
USA 298 �33 767 8�3 996
Denmark 291 287 310 �79 567
others 321 120 218 270 291
Diatomite

22�
Dia
tom
itere
serv
ed.re
gist
ered
.dep
osits
exha
uste
d.de
posi
ts.a
nd.o
ther
.reso
urce
s
Industrial minerals
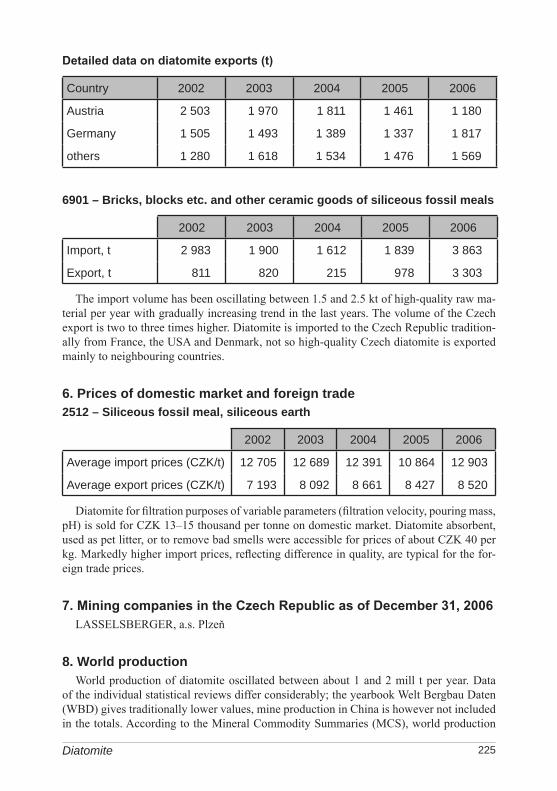
225
Detailed data on diatomite exports (t)
Country 2002 2003 200� 2005 2006
Austria 2.503 1.970 1.811 1.�61 1.180
Germany 1.505 1.�93 1.389 1.337 1.817
others 1.280 1.618 1.53� 1.�76 1.569
6901 – Bricks, blocks etc. and other ceramic goods of siliceous fossil meals
2002 2003 200� 2005 2006
Import,.t 2.983 1.900 1.612 1.839 3.863
Export,.t. 811 820 215 978 3.303
The import volume has been oscillating between 1.5 and 2.5 kt of high-quality raw ma-terial per year with gradually increasing trend in the last years. The volume of the Czech export is two to three times higher. Diatomite is imported to the Czech Republic tradition-ally from France, the USA and Denmark, not so high-quality Czech diatomite is exported mainly to neighbouring countries.
6. prices of domestic market and foreign trade2512 – Siliceous fossil meal, siliceous earth
2002 2003 200� 2005 2006
Average.import.prices.(CZK/t) 12.705 12.689 12.391 10.86� 12.903
Average.export.prices.(CZK/t) 7.193 8.092 8.661 8.�27 8.520
Diatomite for filtration purposes of variable parameters (filtration velocity, pouring mass, pH) is sold for CZK 13–15 thousand per tonne on domestic market. Diatomite absorbent, used as pet litter, or to remove bad smells were accessible for prices of about CZK 40 per kg. Markedly higher import prices, reflecting difference in quality, are typical for the for-eign trade prices.
7. Mining companies in the Czech Republic as of December 31, 2006LASSELSBERGER, a.s. Plzeň
8. World productionWorld production of diatomite oscillated between about 1 and 2 mill t per year. Data
of the individual statistical reviews differ considerably; the yearbook Welt Bergbau Daten (WBD) gives traditionally lower values, mine production in China is however not included in the totals. According to the Mineral Commodity Summaries (MCS), world production
Diatomite

226
during the last 5 years oscillated between 1.7 and 2.0 mill t per year with a slightly in-creasing tendency; according to the World Mineral Statistics (WMS), it actually stagnated around 1.65 mill t per year.
Year 2002 2003 200�. 2005 2006.e
Mine.production,.kt.(MCS) 1.730 1.950 1.930 2.020 2.020
Mine.production,.kt.(WBD) 1.366 1.�00 1.351 1.373 N
Main producers’ share in the world mine output (2005; according to MCS):USA 32.3 % France 3.7 %China 20.3 % Mexico 3.0 %Denmark 11.6 % Germany 2.7 %Japan 6.4 % Spain 1.7 %Countries of the former USSR 4.0 % Czech Republic 1.7 %
9. World market pricesOnly prices of the American diatomite are published on the world market. Prices on the
American market ex-works oscillated between USD 255 and 270 per tonne. Diatomite is quoted in the renowned magazine Industrial Minerals monthly as CIF, UK. Prices of both diatomite sorts have been very stable. Average prices at year-end reached:
Commodity/Year 2002 2003 200� 2005 2006Diatomite.calcined,.filtration, CIF UK GBP/t 390.00 390.00 390.00 390.00 390.00
Diatomite.calcined,.burned, filtration, CIF UK GBP/t �00.00 �00.00 �00.00 �00.00 �00.00
10. recyclingDiatomite can be recycled only on a very restricted scale.
11. possible substitutesDiatomite, which has a number of applications due to its unique properties, can be re-
placed by a number of materials. In filtration – the dominant area of use – it can be replaced by expanded perlite or quartz sand, respectively by various types of membranes. Substi-tutes are, however, seldom as effective as diatomite. As filler, diatomite can be replaced by talc, ground quartz sand, crushed mica, some clay types, perlite, vermiculite or ground limestone. As a heat insulating material, it can be replaced also by various types of clay and bricks, mineral wool, expanded perlite or vermiculite. As friction material, it can be replaced by asbestos, barite, bauxite, alumina, clays, graphite, gypsum, mice, pumice, py-rophyllite, silica, slate, vermiculite and zircon.
Industrial minerals
227
Feldspar
1. Characteristics and useFeldspar is economic geological term for rocks with the predominance of some mineral
of the feldspar group or feldspar mixture in such a form, quantity and quality, which al-low their industrial extracting. Feldspars are a group of monoclinic (orthoclase, sanidine) and triclinic (microcline, plagioclases) potassium and sodium-calcium alumosilicates, and together with quartz they represent the most common rock-forming minerals, which create 60 % of the Earth’s crust. Potassium feldspars (orthoclase, microcline) and acid plagioclas-es (Na > Ca; albite, oligoclase, andesine) are suitable for industrial use. Basic plagioclases (Ca > Na; labradorite, bytownite, anorthite) are of a marginal importance. Suitable feldspar resources are dike rocks (pegmatites, aplites), igneous rocks (granites) and sediments (feld-spar-bearing sand and sand and gravel), eventually also residues of incompletely kaolinized rocks and metamorphic rocks. The major impurity represents higher content of iron in the feldspar structure (unremoveable) or in the form of admixtures (removeable).
Because of their low melting point, feldspars are used as a melting agent in ceramic mix-tures, glass batches, glazes, enamels and recently also as casting powders. Almost 90 % of feldspars are consumed by the glass and ceramic industry. A small amount is used as filler, especially in colours and plastic materials.
Rocks containing alkalies in other mineral than feldspar (mostly nepheline – anhydrous sodium-potassium alumosilicate) can be used as substitutes for feldspar raw materials. Par-ticularly nepheline syenites, to a lesser extent nepheline phonolites, are used for this pur-pose in the world.
2. Mineral resources of the Czech RepublicDeposits of feldspar raw materials in the Czech Republic are first of all associated with
primary sources, formed mainly by leucocratic granitoids and pegmatite bodies. Neverthe-less, the importance of secondary sources, represented by feldspar sand and gravel, has been increasing. Fluvial Quaternary feldspar placer deposits represent at present the most important feld-
spar resource. They were formed by deposition of disintegrated granitic rocks with a high content of mainly potassium feldspar phenocrysts. The major deposits are concentrated into two regions. 1. the upper course of the Lužnice River with the crucial exploited deposit Halámky, mined
from water. Other deposits of the region – Tušť, Dvory nad Lužnicí and Majdalena – are not mined yet. A large part of reserves of these deposits is blocked by con-flicts of interests with nature protection, especially with the Protected Landscape Area (CHKO) Třeboňsko.
2. the area south of Brno with sediments of the Jihlava River – the so-called Syrovice-Ivaň terrace with deposits Bratčice, Žabčice-Smolín, Hrušovany, Ledce, etc. Quality of feldspar is slightly lower, as it has higher Fe contents. A major part of the local raw material is used only as a construction sand and gravel at present. Only a portion – size fraction 4–8 mm – has been stored in depots for later use as feldspar raw material
Feldspar

228
since 2000. Similar deposits of feldspar accumulations of the Jihlava River are located in the Ivančice area southwest of Brno.
Feldspar sand and gravel with a predominance of potassium feldspar over plagioclase represents the raw material of fluvial deposits. It is suitable for production of utility china, sanitary ceramics, glass and to a limited extent also glazes.
Fine to medium-grained leucocratic granitoids (granites and granite aplites, quartz dior-ites) represent another important feldspar raw material. Feldspar deposits are developed for instance in the Krušné hory Mts. Pluton (with the fundamental deposit Krásno mined by open pit: albite-bearing aplitic granite), Mračnice Granitoid Massif (Mračnice: quartz diorite-trondhjemite), Třebíč Massif (Velké Meziříčí-Lavičky: aplitic granite). Prospecting was carried out also in other massifs such as the Brno Massif (Moravský Krumlov), Dyje Massif (Přímětice), Chvaletice Massif, Babylon, Blatná and other individual massifs of the Central Bohemian Pluton (all granites and granodiorites). Mineral consists mainly of sodium-potassium feldspars and it is used for sanitary ceramics, coloured glass, china and abrasive disc production.
Coarse-grained to porphyric leucocratic granitoids could represent an important resource of the feldspar raw material in future. Such rocks occur in the Říčany Massif (Štíhlice), in the Čistá-Jesenice and Bory massifs, the Krkonoše-Jizera (Izera-Karkonosze) Plu-ton (Liberec granite) etc. Raw material consists mainly of sodium-potassium feldspars, which mostly require high-intensity magnetic separation to decrease the Fe content.
Deposits of feldspar materials forming lenses in metamorphosed rocks have recently been the subjects of new prospecting. Deposit of orthoclasite to microclinite Markvartice by Třebíč is located in the western branch of the Varied Group of the Moldanubicum in Moravia. The albitite deposit Malé Tresné is situated at the north-western margin of the Svratka dome at the contact of the Micaschist Zone and Olešnice Unit. A small deposit of anorthosite to gabbro Chvalšiny occurs within amphibolites of the Český Krumlov Varied Group of the Moldanubicum in Šumava.
Pegmatite deposits known from several regions represented the only source of the raw material used mainly for ceramic production in the past. Pegmatites of medium to lower quality occur in south-west Bohemia in the Poběžovice-Domažlice region (e.g. Luženičky, Meclov, Otov). These pegmatites contain equal proportions of sodium and potassium feldspars and an admixture of dark minerals. In this region there are also de-posits of high-quality sodium and sodium-calcium feldspars, used for glazes and pellucid glass (Ždánov). K-feldspars are dominant in pegmatites in the other regions. Abundant occurrences of relatively high-quality feldspar with low contents of impurities (Beroun, Křepkovice, Zhořec) are in the Teplá region in western Bohemia. The Písek region with its pegmatites appears to be promising but has not been well explored yet. Some smaller deposits of feldspar are known from the Humpolec, Tábor and Rozvadov (Česká Ves) areas, from western Moravia (Smrček) etc. Feldpars from pegmatites do not represent too perspective feldspar resource anymore at present due to irregular shape of deposit bodies, small and to a large extent mined-out reserves and also conflicts of interests. Large amount of the highest-quality raw material of the pegmatite deposits (mainly from the Poběžovice-Domažlice and Písek regions) has been to a large extent exhausted by mining in the past – this involves especially the more easily accessible subsurface parts. This holds true also for the area of the Bory Granulite Massif with a small deposit Bory-Olší, linked to a classical but mined-out deposit Dolní Bory.
Industrial minerals

229
Feld
spar
rese
rved
.regi
ster
ed.d
epos
its.o
f.fel
dspa
r.min
eral
s.ex
haus
ted.
depo
sits
.and
.oth
er.re
sour
ces.
of.fe
ldsp
ar.
min
eral
sre
serv
ed.re
gist
ered
.dep
osits
.of.f
elds
par.m
iner
al.s
ubst
itute
sex
haus
ted.
depo
sits
.and
.oth
er.re
sour
ces.
of.fe
ldsp
ar.m
iner
al.
subs
titut
es.
Feldspar

230
Kaolinized feldspar materials with unaltered or imperfectly altered feldspars can represent another promising resource of the feldspar. This concerns most of all arkoses of the Plzeň and Podbořany regions and gneisses and granitoids of the Znojmo region (see Kaolin – KZ).
Tertiary volcanic rocks – nepheline phonolites from České středohoří (Želenice deposit) – are used as feldspar substitutes in the Czech Republic. They can be used in the glass and ceramic industry only as a melting agent in coloured materials, due to high contents of colouring oxides. A high content of alkalis (10–10.5 % Na2O and 3.5–5 % K2O) results in a lower melting temperature and a shorter burning time.
3. Registered deposits and other resources in the Czech Republic(see map)
Names of mined deposits are indicated in bold typeFeldspar minerals: 1 Bratčice 12 Bory-Olší 23 Meclov-Letiště 2 Halámky 13 Bozdíš 24 Meclov-západ 3 Hrušovany u Brna 14 Dvory nad Lužnicí-Tušť 25 Medlov 4 Hrušovany u Brna-Protlas 15 Chvalšiny 26 Medlov-Smolín 5 Krásno-žula 16 Ivančice-Němčice 27 Smolín-Žabčice 6 Ledce-Hrušovany u Brna 17 Krásno-Vysoký Kámen 28 Smrček 7 Luženičky 18 Křepkovice 29 Štíhlice 8 Mračnice 19 Majdalena 30 Tušť-Halámky 9 Žabčice-Smolín 20 Malé Tresné 31 Velké Meziříčí-Lavičky10 Ždánov 21 Markvartice u Třebíče 32 Zhořec 111 Beroun-Tepelsko 22 Meclov 2 33 Zhořec 2-Hanovské pásmo
Feldspar mineral substitutes:
34 Želenice 35 Tašov-Rovný 36 Valkeřice-Zaječí vrch
4. Basic statistical data of the Czech Republic as of December 31Feldspar
Year 2002 2003 200� 2005 2006
Deposits.–.total.number 33 33 33 3� 33
. exploited 6 8 8 10 10
Total.mineral.*reserves,.kt. 8�.0�8 83.372 68.093 67.610 65.�97
. economic.explored.reserves 35.957 35.367 25.�32 2�.979 2�.518
. economic.prospected.reserves �0.7�7 �0.670 35.516 35.590 27.566
. potentially.economic.reserves 7.3�� 7.335 7.1�5 7.0�1 13.�13
Mine.production,.kt. �01 �21 �88 �72 �87
* see NOTE on page 12 on a terminological difference between Czech official application of the term reserves and standard international application of the term
Industrial minerals

231
Feldspar substitutes
Year 2002 2003 200� 2005 2006
Deposits.–.total.number 3 3 3 3 3
. exploited 1 1 1 1 1
Total.mineral.*reserves,.kt. 200.137 200.110 200.08� 200.061 200.030
. economic.explored.reserves 0 0 0 0 0
. economic.prospected.reserves 200.137 200.110 200.08� 200.061 200.030
. potentially.economic.reserves 0 0 0 0 0
Mine.production,.kt 29 27 26 23 31
* see NOTE on page 12 on a terminological difference between Czech official application of the term reserves and standard international application of the term
5. Foreign trade252910 – Feldspar
2002 2003 200� 2005 2006
Import,.t 7.976 7.388 8.785 13.315 16.032
Export,.t 122.206 133.862 1�3.9�1 160.�90 15�.671
Detailed data on feldspar imports (kt)
Country 2002 2003 200� 2005 2006
Germany 6.256 6.189 6.28� 9.800 12.�11
Austria 0 2� 1.169 2.211 2.563
Finland 666 595 313 �31 38�
Turkey 22 19 597 870 625
others 1.032 561 �22 3 �9
Feldspar

232
Detailed data on feldspar exports (kt)
Country 2002 2003 200� 2005 2006
Poland 88.322 97.139 109.72� 121.856 111.85�
Hungary 18.008 15.�22 15.732 19.250 17.295
Slovakia 10.8�2 11.958 8.956 6.990 10.59�
Germany 17� 3.050 �.252 8.955 11.677
Austria 3.�99 �.0�6 3.�95 658 18
Russia 0 908 35� 1.1�2 1.290
Croatia 877 806 832 730 61�
others �8� 533 596 609 1.329
252930 – leucite, nepheline and nepheline syenite
2002 2003 200� 2005 2006
Import,.t 699 736 916 1.089 1.321
Export,.t 0 0 0 0 0
Feldspars rank among the Czech minerals which are successfully traded on foreign mar-kets. As the west European markets are dominated by Italian and Turkish feldspar, the Czech feldspar finds its place almost exclusively in central European region. Poland, fol-lowed after a big gap by Hungary, Slovakia and Germany, are the biggest importers of the Czech feldspar. Total volume of feldspar export has increased twice between 1999 and 2000 and since 2005 it represents 150 kt per year. Lower in order import has been gradually increasing, however, it amounted only at about 10 % of the export volume. Cheap Turkish feldspar started to appear more systematically on domestic market since 2002, the traded amounts are though still negligible. Nepheline syenite is imported to the Czech Republic traditionally from Norway, since 2004 also from Spain.
6. prices of domestic market and foreign tradePotassium feldspar, which can be used for flat and utility glass and package glassware
production, is sold on domestic market for CZK 950–1,150; feldspar for special utility glass, lights and TV-screens production for CZK 1,100–1,250. Potassium feldspar, which can be used for ceramics, china, glazes and electroporcelain production, was offered for 1,350–1,700 CZK in 2003. Sodium-potassium feldspar used as fluxing agent and grog in ceramic materials is offered on domestic market for CZK 500 per tonne. The material is delivered crushed down to a size 0–5 mm. Feldspars from Krásno were offered at CZK 500 per tonne on domestic market.
Industrial minerals

233
252910 – Feldspar
2002 2003 200� 2005 2006Average.import.prices.(CZK/t) 3.0�� 2.9�3 2.733 2.51� 2.��0Average.export.prices.(CZK/t) 1.008 1.010 989 1.005 83�
252930 – leucite, nepheline and nepheline syenite
2002 2003 200� 2005 2006Average.import.prices.(CZK/t) 7.662 7.918 8.913 8.88� 7.3�6
Decrease of the average import prices of feldspar has been caused by strengthening of the Czech crown against foreign currencies. Special feldspar types imported from Finland are the most expensive, Austrian mineral is the cheapest. German and Turkish feldspar are slightly less expensive than the annual averages. Export prices of Czech feldspar oscillate on average around CZK 1 000 per tonne. Export prices to Poland, the biggest importer of Czech feldspar, are usually by 10–15 % lower than the annual price averages.
7. Mining companies in the Czech Republic as of December 31, 2006LASSELSBERGER, a.s., PlzeňKMK Granit s.r.o., SokolovIng. František Čtverák, Tišnov Družstvo DRUMAPO, NěmčičkyAGRO Brno-Tuřany a.s.Brněnské papírny s.p., PředklášteříKERAMOST a.s., Most (feldspar substitutes)
8. World productionAnnual world production (including nepheline syenite and aplite) is about 10–15 mill
tonnes. The production continues to rise owing to an increase of use in metallurgy and other industrial branches. Mining production increased rather rapidly in Turkey, Thailand, Iran, Germany and the Czech Republic and slightly in France and Spain during the last five years. Feldspar production stagnated in the USA and Mexico. Mine production in Italy decreased until 2002, though it has increased during the two recent years. Data from various sources often considerably differ. For instance, the last issue of Welt Bergbau Daten gives Germany as the largest world producer with a huge increase of mine production in the last three years. Data on the mine production come from Mineral Commodity Summaries (MCS) and Welt Bergbau Daten (WBD). Overall lower values given by WBD and MCS are probably because Chinese production (about 2 mill tonnes) is not included.
Year 2002 2003 200� 2005 2006.e
Mine.production,.kt.(MCS) 9.800 10.800 11.100 12.900 13.300
Mine.production,.kt.(WBD) 9.�75 11.029 12.665 1�.611 N
Feldspar

23�
Main producers’ share in the world mine output (2005; according to MCS):Italy 19.4 % France 5.0 %Turkey 17.1 % Rep. of Korea 4.2 %Japan 7.8 % Germany 3.9 %Thailand 7.8 % Spain 3.5 %USA 5.8 % Czech Republic 3.1 %
According to the yearbook Mineral Commodity Summaries as well as Welt Bergbau Dat-en, the Czech Republic occupies the 10th position in the world with a share of 3.1 %. On the European scale, it occupies the 5th place.
The largest producers of nepheline syenite were Canada, Norway and Russia. Nepheline phonolite was mined in France, Germany and in the Czech Republic.
9. World market pricesThe average indicative prices of sales quoted in the Industrial Minerals magazine were
constant during the period 1990–1992. Feldspar prices were increasing in 1993 and in 1995 in consequence of the recovery of demand. Feldspar prices stagnated in the last years. The average feldspar prices at the year-end were as follows:
Commodity/Year 2002 2003 200� 2005 2006Feldspar,.ceramic.grade,.bagged,.FOB.Durban,.South.Africa
USD/t 1�0.00 1�0.00 138.50 138.50 138.50
Feldspar,.micronised,.bagged,.FOB.Durban,.South.Africa USD/t 205.00 205.00 205.00 205.00 205.00
Sodium.feldspar,.crude,.max..10.mm,.bulk,.FOB.Gulluk,.Turkey
USD/t 13.50 13.50 13.50 13.50 13.50
Sodium.feldspar,.ground,.max..63.microns,.bagged,.FOB.Gulluk,.Turkey
USD/t 77.50 77.50 77.50 77.50 77.50
Sodium.feldspar,.glass.grade,.max..500.microns,.bagged,.FOB.Gulluk,.Turkey
USD/t 55.00 55.00 55.00 55.00 55.00
Potassium.feldspar,.ceramic.grade,.bulk,.FOB.India USD/t 26.00 26.00 26.00 26.00 26.00
Nepheline.syenite,.Norwegian;.glass.grade,.0.5.mm,.bulk,.FOL.UK.port
GBP/t 97.00 97.00 97.00 97.00 97.00
Nepheline.syenite,.Norwegian;.ceramic.grade,.�5.microns,.bulk,.FOL.UK.port
GBP/t 1�6.00 1�6.00 1�6.00 1�6.00 1�6.00
Industrial minerals

235
10. recyclingThe recycling of glass reduces the consumption of virgin materials, including feldspar in
glass production. The recycling rate is about 33 % in the USA and as high as 90 % in some European countries like Switzerland.
11. possible substitutesFeldspar substitutes are materials having alkali metals bound in other minerals than feld-
spars, like nepheline syenites or – in the case of the Czech Republic – nepheline phonolites. These materials replace feldspars used as a melting agent. In other applications (fine abra-sives, filler in rubber, plastics and paints), feldspars can be replaced by bauxite, corundum, diatomite, garnet, magnetite, nepheline syenite, olivine, perlite, pumice, silica sand, stauro-lite, ilmenite, barite, kaolin, mica, wollastonite, calcined alumina, clays, talc, spodumene, pyrophyllite or their mixtures.
Feldspar
236 Industrial minerals
Silica minerals
1. Characteristics and useSilica minerals are represented by various rocks high in SiO2 (usually min. 96 %). These
are various quartzites (sedimentary or metamorphosed rocks, consisting mostly of quartz and originated through silicification of sandstones or by cementing of silica sand by sili-ceous cement), silicified sandstones, siliceous rocks, quartz sands and pebbles, and vein and pegmatite quartz. The grade is established by various standards. The observed parameters are the content of SiO2 and refractoriness. High Al2O3, Fe2O3 and possibly other oxides represent impurities.
Silica raw materials are used in production of ferroalloys for the metallurgical indus-try, silicon metal (in metallurgy, in semiconductors), refractory building materials (silica - bricks, mortars, ramming masses), porcelain and ceramics. Vein quartz, rock crystal and quartz pebbles are used in production of pure silica glass, UV glass and optical glass (fi-bre).
2. Mineral resources of the Czech RepublicIn the Czech Republic, silica raw materials are classified into two groups: common silica
raw materials, and silica raw materials for production of special glass. Silica mineral de-posits are formed especially by the occurrences of the Tertiary “amorphous” quartz, Cre-taceous “crystalline” quartz and Ordovician quartz, to lesser extent by the occurrences of vein quartz and lydites of the Upper Proterozoic. These raw materials are practically not mined in the Czech Republic anymore and they are mostly replaced by quartz sand (that completely replaced the previous materials in ceramic and glass industry), of which there is a sufficient amount at the market and which are moreover less variable and cheaper.Vein quartz deposits can be found almost all over the territory of the Czech Republic.
The raw material is suitable for ferrosilicon and silicon production and for ceramics and glass. Vein quartz accumulations are not economic at present due to their low and vari-able quality and they are gradually eliminated from The Register. Deposits and occur-rences can be divided into the following genetic groups:1. Deposits of a very pure quartz in pegmatites (Dolní Bory) – of no significance at
present2. Quartz dikes (silicified fault zones) in Tachov region (Tachov-Světecká hora), in north-
ern (Rumburk) and southern (Římov-Velešín) Bohemia and in the Jeseníky Mts. (Bílý Potok-Vrbno, Žárová)
3. Quartz veins related to granitoid massifs (the Žulová Massif – Velká Kraš, the Karlovy Vary Massif – Černava-Tatrovice, the Lužice Massif – Rumburk et al.)
Deposits of “amorphous” quartzite (quartz grains are cemented by a very fine quartz ma-trix) originated through silicification of Tertiary and Upper Cretaceous sediments in the Most region (Lužice u Mostu-Dobrčice, Stránce, Skršín) and Chomutov region (Cho-mutov-Horní Ves). In the Podbořany (Skytaly, Vroutek) and Žlutice regions this quartzite occurs only as relic boulders. Quartzite is a traditional material for production of silica bricks and the quartzite of the highest purity is suitable even for silicon metal production. Quartzites in the Podbořany region were used also for ceramic manufacture.

237Silica minerals
Tertiary silicification of Cretaceous sandstones gave origin to important deposits of “crystalline” quartzites (isometric grains of quartz) in the Teplice (mined deposit of Jeníkov-Lahošť, Střelná) and Most (Bečov) regions. Quartzites are suitable mostly for metallurgy and partly also for production of silica bricks and silicon metal.
The Ordovician quartzites of the Barrandian zone (Kublov, Mníšek pod Brdy, Drahoňův Újezd-Bechlov, Sklenná Huť, Železná) were the most important of the Paleozoic quartz-ites. They are usually classified as of a lower grade for production of ferrosilicon and to a lesser extent silica bricks. Other larger accumulations of quartzites occur in the Devonian rocks of the Silesicum (Vikýřovice) et al. These quartzites are of a low grade and they are suitable after processing for production of silica bricks of a lower quality.
Deposits of the Upper Proterozoic silicites (lydites) might be promising for future industrial use because of their reserves and quality. This concerns especially the Rokycany (Lito-hlavy, Kyšice-Pohodnice) and Přeštice (Kaliště, Kbelnice) regions. Tests showed that the material might be suitable for production of siliceous alloys, and to a lesser extent perhaps for production of silica bricks.
Quartz pebbles from sand and gravel mined in alluvial deposits of the Labe and Dyje rivers and in the Cheb region used to be considered as a potential source of silica, too. Fraction 16–50 mm at Vrábče-Boršov deposit in the České Budějovice Basin is used this way at present. This fraction is formed almost exclusively just by quartz pebbles; other rocks, limonitized pebbles and other impurities are taken out by hand. Gravel is exported to Germany (about 20–30 kt per year) as a silica mineral for ferrosilicon production.
Only milky white vein quartz (after mineral processing) is suitable for production of special glass. It is associated with the Central Bohemian Pluton in the Příbram region (Krašovice in the metamorphosed islet zone) and with hydrothermal veins, which were metamorphosed together with the country rocks (phyllites) in the Prostějov region (Dětkovice).
3. Registered deposits and other resources in the Czech Republic(see map)Registered deposits and other resources are not minedQuartz – quartzites:
1 Jeníkov-Lahošť 6 Kaliště 12 Sklená Huť2 Stránce 7 Kbelnice 13 Střelná3 Černava-Tatrovice 8 Kublov-Dlouhá Skála 14 Tachov-Světecká hora4 Drahoňův Újezd-Bechlov 9 Kyšice-Pohodnice 15 Velká Kraš5 Chomutov-Horní Ves 10 Litohlavy-Smrkový vrch 16 Vikýřovice
11 Lužice u Mostu-Dobrčice 17 Železná
Quartz for special glass:
18 Dětkovice 19 Krašovice
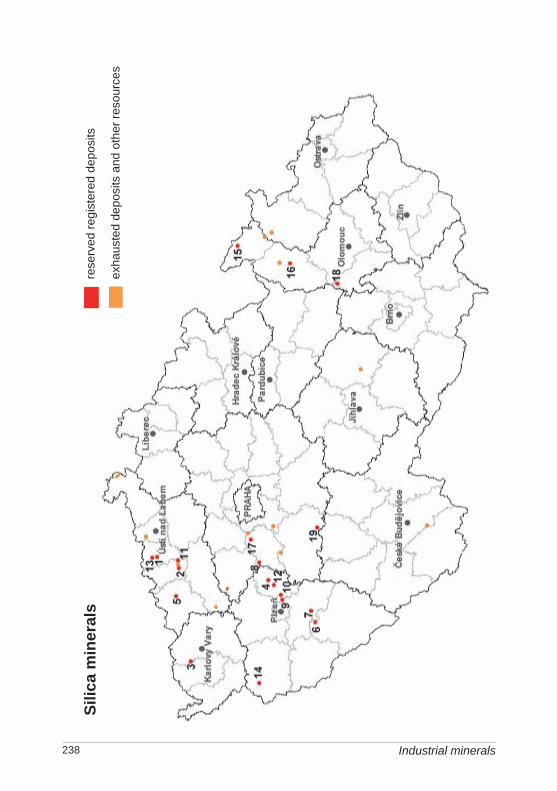
238
Silic
a m
iner
als
rese
rved
.regi
ster
ed.d
epos
its
exha
uste
d.de
posi
ts.a
nd.o
ther
.reso
urce
s
Industrial minerals

239
4. Basic statistical data of the Czech Republic as of December 31
Year 2002 2003 200� 2005 2006
Deposits.–.total.number 20 20 19 18 18
. exploited 2 2 0 0 0
Total.mineral.*reserves,.kt. 35.361 35.361 31.379 28.�55 28.�55
. economic.explored.reserves 5.�79 5.�79 �.607 �.�63 �.�63
. economic.prospected.reserves 26.063 26.063 26.063 23.283 23.283
. potentially.economic.reserves 3.819 3.819 709 709 709
Mine.production,.kt 0 0 0 0 0
* see NOTE on page 12 on a terminological difference between Czech official application of the term reserves and standard international application of the term
5. Foreign trade2506 – Quartz (except natural sand), crude quartzite, also dressed
2002 2003 200� 2005 2006
Import,.t 12.70� 1�.686 18.329 19.352 1�.372
Export,.t 65 259 38� 653 36
Detailed data on quartz and quartzites imports (t)
Country 2002 2003 200� 2005 2006
Slovenia �.162 7.07� 8.87� 9.828 7.360
Germany �.980 3.886 3.808 �.1�6 �.218
Poland 3.373 .3.187 �.986 �.785 2.217
others 189 539 661 593 577
720221 – Ferrosilicon
2002 2003 200� 2005 2006
Import,.t 17.956 2�.652 30.�71 31.682 3�.182
Export,.t 3.127 5.810 7.120 5.157 6.230
Silica minerals

2�0
Detailed data on ferrosilicon imports (t)
Country 2002 2003 200� 2005 2006
Poland 3.377 9.�10 10.852 10.179 �.923
Slovakia 1.668 1.951 7.027 8.839 8.970
Ukraine 8.870 7.080 3.637 1.579 3.938
Macedonia 0 1.285 3.075 �.827 6.525
others �.0�1 �.926 5.880 6.258 9.826
6. prices of domestic market and foreign trade2506 – Quartz (except natural sand), crude quartzite, also dressed
2002 2003 200� 2005 2006
Average.import.prices.(CZK/t) 2.5�2 2.339 2.713 2.�11 2.722
720221 – Ferrosilicon
2002 2003 200� 2005 2006
Average.export.prices.(CZK/t) 15.6�8 17.233 20.281 18.561 19.5�2
Lump quartz has been sold at CZK 50–200 per tonne on domestic market. Import prices of quartzites oscillate in a rather narrow interval of 2,300–2,700 CZK/t. The average import prices of ferrosilicon oscillated between 15 and 20 ths CZK/t in period 2002–2006. Ferrosili-con imported from Macedonia and Poland is cheaper than that from Slovakia.
7. Mining companies in the Czech Republic as of December 31, 2006Silica minerals were not mined on the territory of the Czech Republic in 2006.
8. World productionAmong many known silica raw materials (except sand), special attention is paid to materi-
als for production of synthetic quartz crystals for use in electronics and optics, and then to mining for (finding) natural quartz crystals for direct use in industrial applications. Mining for natural crystals is limited (Brazil, China, Namibia, Madagascar and the USA) and that is why number of countries have built plants for production of synthetic crystals – the largest factories are in the USA and Japan, smaller ones are in Belgium, Brazil, Bulgaria, France, Germany, South Africa and Great Britain. Among the largest exporters of raw material for production of synthetic crystals were Brazil and Namibia. Production in the USA reached its peak 778 t in 1992; in 1993 the production decreased to 500 t. The production in the USA became stabilized in the following years: 1995 – 435 t, 1996 – 435 t, 1997 – 450 t. During the last years, the pro-
Industrial minerals

2�1
duction was not published in the international reviews. World production of silicon (combined totals of silicon content of ferrosilicon and silicon metal) is described in the following table:
Year 2002. 2003 200� 2005 2006.e
Production,.kt.(MCS) 3.720 �.390 �.900 �.720 �.700
Main producers’ share in the world mine output (2005; according to MCS):
China 50.0 % USA 5.7 %Russia 11.1 % Brazil 4.8 %Norway 5.9 % Ukraine 3.4 %
9. World market pricesSilica materials (except for glass and foundry sand) are not quoted. Prices of raw mate-
rial for production of synthetic quartz crystals dropped in the USA from USD 1.43 per kg in 1988 to USD 0.85 per kg in 1990. The price stagnated on a level of USD 1.20 per kg. The magazine Industrial Minerals has been publishing quotations of ferrosilicon since 2002. The average prices of trades at the year-end were as follows:
Commodity/Year 2002 2003 200� 2005 2006Silicon.carbide,.99.%.SiC,.grade.1,.CIF.UK
GBP/t 825.00 825.00 825.00 825.00 825.00
Silicon.carbide,.min..98.%.SiC,.refractory.grade,.CIF.UK
USD/t;.EUR/t.since.2005
7�5.00 7�5.00 7�5.00 1.000.00 1.000.00
Silicon.carbide,.min..95.%.SiC,.refractory.grade,.CIF.UK
USD/t;.EUR/t.since.2005
5�0.00 5�0.00 5�0.00 875.00 790.00
10. recyclingSilica material is not recycled.
11. possible substitutesQuartz had been, as a strategic mineral, irreplaceable until the fifties. At present it is be-
ing more and more replaced, both in electronics and optics, by synthetic crystals. Synthetic quartz competes with natural quartz also in production of clear silica glass. More accessible glass sand represents the major source of quartz for ceramics and pellucid quartz glass pro-duction at present. Other types of lining can replace silica bricks.
Silica minerals

2�2
Glass sand
1. Characteristics and useGlass sand is granular, light or even white-coloured rock (quartz sand or sandstone),
which is used, after processing, as a raw material for production of glass. Required param-eters (grain size, mineral and chemical composition) vary according to the type of glass. Sand of required grade does not usually occur in the nature; therefore the sand has to be processed by crushing, washing (to remove floating particles) and grading (to reach the required grain size). To obtain high grade glass sand, it is necessary to apply more so-phisticated methods of mineral processing (electromagnetic separation, flotation, etc.); it is of utmost importance to reduce the content of colouring oxides (Fe2O3, TiO2, Al2O3) in order to meet rigid specifications with respect to purity of silica and its maximum content. Sand for glass melting is used for making of glass batches for production of flat glass, package glassware and some technical glasses (max. content of Fe2O3 0.023–0.040 %), and utility glass (up to 0.021 % Fe2O3); glass sand of higher grade is used for production of non-transparent silica glass (max. 0.020 % Fe2O3) and the top quality sand (max. 0.012 % and 0.015 % Fe2O3) are used for production of crystal glass, semi-optical glass and some special technical glasses.
Natural quartz sand is after washing, separation and drying often coloured by inorganic pigments and used for plasters, as gunite sand and for other decorative purposes.
2. Mineral resources of the Czech RepublicThe largest and most important deposits of glass sand in the Czech Republic are located in
the Bohemian Cretaceous Basin, smaller ones occur in the Cheb Basin. Some potentially inter-esting areas of the Bohemian Cretaceous Basin are of no perspective especially due to nature protection reasons – this concerns for instance Lužické hory Mts., Český ráj (The Bohemian Paradise), Adršpašsko-teplické skály (Adršpach-Teplice Rocks) etc. The Střeleč deposit in the Jizera facies development area of the Bohemian Cretaceous
Basin represents the most important deposit of the Czech Republic. The mined raw mate-rial consists of weakly consolidated quartz sandstone of the Coniacian age and its quality meets world specifications. A reserve deposit Mladějov v Čechách has been evaluated in its southern foreland.
Southern surroundings of Česká Lípa in the Lužice facies development area of the Bohe-mian Cretaceous Basin represent the second most significant deposit area. The raw material consists of weakly consolidated quartz sandstone of the Middle Turonian age. Srní 2-Veselí and Provodín deposits which are exploited at present will be soon mined out and they will be replaced by Srní-Okřešice deposit in the near future.
Non-traditional deposit of Velký Luh consists of the Pliocene sand and gravel of the Cheb Basin (redeposited material from kaolinic weathered Smrčiny granite). The raw material is used in technical, ceramic and filtering sand for water-plants, most of the potentially economic raw material as building sand. No glass sand is produced here, as it would require a complex processing (abrasion, electromagnetic separation, grinding).
Industrial minerals

2�3
Gla
ss s
and
rese
rved
.regi
ster
ed.d
epos
its
exha
uste
d.de
posi
ts.a
nd.o
ther
.reso
urce
s
Glass sand

2��
3. Registered deposits and other resources in the Czech Republic(see map)Names of mined deposits are indicated in bold type
1 Provodín* 3 Střeleč* 5 Mladějov v Čechách*2 Srní 2-Veselí* 4 Velký Luh* 6 Srní-Okřešice*
* deposits of glass and foundry sands
4. Basic statistical data of the Czech Republic as of December 31
Year 2002 2003 200� 2005 2006
Deposits.–.total.number 6 6 6 6 6
. exploited � � � 5 5
Total.mineral*.reserves,.kt. 275.162 270.935 268.876 265.673 260.917. economic.explored... reserves 89.206 97.282 96.595 93.283 92.382
. economic.prospected..
. reserves 22.601 15.375 15.305 26.077 25.9�7
. potentially.economic..
. reserves 163.355 158.278 156.976 1�6.313 1�2.588
Mine.production,.kt. 851 90� 828 920 963 see NOTE on page 12 on a terminological difference between Czech official application of the term
reserves and standard international application of the term
Industrial glass productionGlaverbel Czech a.s. Speglass s.r.oSklárna Heřmanova huťSklárny Kavalier a.s.Sklárna Slavia s.r.o.Nižborská sklárna RÜCKL CRYSTAL a.s.VITRUM, s. r.o. Sklárna Janov
Glaverbel Czech a.s. produces flat glass, a large assortment of security glass both glued and toughened, sun glass, thermal insulating glass, metallized glass, antifire glass etc. Spe-cial, primarily bent glass and various types of security glass are produced by Speglass s.r.o. Glass works Heřmanova Huť produces among others glass for beverages. Glass works Kavalír produces boiling glassware, technical and laboratory glass and borosilicate glass.
There is a number of traditional glass works in the Czech Republic, products of which are commonly renowned in many countries. Glass works Slavia in Nový Bor specializes in
Industrial minerals

2�5
hand glass production, glass works RÜCKL CRYSTAL in Nižbor produces cut lead crystal, Sklárna Janov of the Vitrum s.r.o. focuses on pressed, hollow and hand-painted glass.
5. Foreign trade250510 – Silica sand and quartz sand
2002 2003 200� 2005 2006
Import,.t 99.�09 189.130 2�5.139 263.151 360.157
Export,.t �61.��2 �90.218 555.118 290.336 56�.600
Detailed data on silica sand and quartz sand imports (t)
Country 2002 2003 200� 2005 2006
Slovakia 61.663 98.610 12�.302 1�7.997 150.�3�
Poland 6.500 �0.351 �8.�13 52.�27 95.8�2
Austria 17.5�6 3�.319 53.�96 �1.568 88.�39
Germany 11.835 12.686 16.332 17.181 18.52�
others 1.865 3.16� 2.596 3.978 6.918
Detailed data on silica sand and quartz sand exports (t)
Country 2002 2003 200� 2005 2006
Austria 180.568 218.250 261.065 �.790 230.075
Slovakia 95.151 90.10� 96.01� 99.366 115.537
Germany 99.063 91.679 100.032 87.853 111.690
Croatia 52.353 56.933 66.836 67.889 67.58�
others 3�.307 33.252 31.171 256.872 39.71�
7001 – Cullet and other waste and scrap of glass; massive glass in pieces
2002 2003 200� 2005 2006
Import,.t 37.100 65.9�2 77.588 79.315 71.260
Export,.t 16.051 18.110 11.959 5.60� 7.90�
Glass sand

2�6
Item 250510 of the customs tariff unfortunately evidently combines glass and foundry sand and also a part of sand and gravel. In general, data of the ČSÚ on foreign trade with items sand and construction minerals have to be taken only as information on the main trends in this field, not as precise data. This can be documented, e.g., on atypical numbers for export in 2005, when the remaining volume of export to Austria was evidently shown under a different item of the customs tariff then usual.
Roughly half of silica sand and quartz sand import shown is declared as import from Slovakia. Import from Poland and Austria markedly increased in 2002–2006, too. Czech quartz sand was exported to about 50 countries in 2002–2006. The largest volume of export is directed logically to neighbouring countries (Austria, Slovakia, Germany), but also to the area of Balkan etc. Whereas in case of export to Austria and especially to Germany sand and gravel is concerned, glass or foundry sand is exported to Slovakia and Slovenia. Finan-cially, the export value has been oscillating between CZK 200 and 300 mill per year.
Volume of cullet import has been oscillating between 65 and 80 kt per year since 2003. Valuable secondary raw material has been imported mainly from Germany, Austria, Hun-gary, but also from Great Britain, France and China. The fact that this material is not ex-ported in large amounts - unlike many other secondary raw materials – is positive since its recycling in the Czech Republic represents significant savings of electrical energy.
6. prices of domestic market and foreign tradePrices of glass sands are differentiated according to their properties and their quality.
Domestic prices of wet glass sand oscillate between CZK 300 and 1,000 per tonne. Prices of dry glass sand (not bagged) are about CZK 750–1,500 per tonne, of the bagged ones at CZK 1,100–1,850. Prices of very finely milled sand oscillate between CZK 2,950 and 4,600 depending on the quality. Prices of filtration sand are as follows: wet CZK 375–550 per tonne; dry CZK 740–910 per tonne.
Average import prices of silica and quartz sand have been very stable, oscillating in a nar-row interval of 500–520 CZK/t. Average export price of the Czech sand has been increasing slowly. Both import and export prices of cullet and waste and scrap of glass increased in 2004; the atypical average export price in this year was caused by a small volume of trade.
250510 – Silica sand and quartz sand
2002 2003 200� 2005 2006
Average.import.prices.(CZK/t) 653 500 518 517 500
Average.export.prices.(CZK/t) �31 �2� �72 52� 529
7001 – Cullet and other waste and scrap of glass; massive glass in pieces
2002 2003 200� 2005 2006
Average.import.prices.(CZK/t) 1.160 1.290 1.7�0 1.736 1.6�3
Average.export.prices.(CZK/t) 2.29� 2.116 2.676 �.17� 2.550
Industrial minerals

2�7
7. Mining companies in the Czech Republic as of December 31, 2006Sklopísek Střeleč, a.s., Mladějov Provodínské písky, a.s., ProvodínLASSELSBERGER, a.s., Plzeň
8. World productionWorld statistics provide data only on total production of sand for industrial use (glass
production, foundry industry, abrasives etc.). These numbers are incomplete by the fact that they are not available for all countries. The world mine production had been rising until 1988 (119 mill t). Since then the production was decreasing due to general economic reces-sion. The volume of production returned back to the level of about 120 mill t in 1995. World production slowly increased between 1996 and 2002. The change did not arrive until 2003 when world production increased again to about 110 mill tonnes. Mine production con-tinued to rise up to the limit of 120 mill tonnes in 2004–2006 in relation to the worldwide economic growth. Numbers on world mine production according to Mineral Commodity Summaries (MCS):
Year 2002 2003 200� 2005 2006.e
Mine.production,.mill.t.(MCS) 95 110 115 118 120
Main producers’ share in the world mine output (2005; according to MCS):
USA 25.9 % Spain 5.5 %Slovenia 9.3 % Japan 4.0 %Germany 6.9 % Great Britain 3.8 %Austria 5.8 % Australia 3.4 %France 5.5 % Italy 2.5 %
9. World market pricesQuartz sand for industrial use was traded on European market at average price GBP
11.00 per tonne at the first half of the 1990s. The price increased to GBP 13.50 per tonne in 1995. The prices increased again to GBP 15.00 per tonne in 2000 and to GBP 16.00 per tonne in 2001. The price stagnates since 2001. Prices of sand quoted by the Industrial Min-erals magazine in GBP/t EXW GB at year-end were as follows:
Commodity/Year 2002 2003 200� 2005 2006Glass sand, flint, container, EXW.GB GBP/t 16.00 16.00 16.00 16.00 16.00
Glass sand

2�8
10. recyclingGlass sand, for obvious reasons, cannot be recycled; however, it is possible to use sorted
glass waste in a glass batch, which is being done on a long term. However, demand of glass works on the input quality of glass scrap has been increasing recently. Another problem is, that there is a demand first of all for scrap of separated colours (white, green, brown) in glass industry. Interest in mixed cullet is minimal. Surplus of supply of mixed processed cullet from foreign recycling companies (first of all strongly subsidized glass from Ger-many and Austria) over demand results in permanent pressure on decrease of sale price of recycled glass on the territory of the Czech Republic. Price of mixed unprocessed glass on the territory of the Czech Republic has been oscillating between CZK 650 and 1,100 per tonne (EUR 22–37) including transport to the recycling facilities. At these prices on the input on the recycling line, the output price is unfortunately markedly higher than in the EU countries. Glass works ask from the Czech processing companies for a price comparable with that paied abroad. They refuse to take all the mixed glass collected on the territory of the Czech Republic and they prefer to buy a substantial part abroad.
The highest proportion of recycling of sorted glass scrap in 2003 reported Switzerland (96 %), Sweden (92%), Germany and Belgium (88 % each), Austria and Norway (both 86 %). Contrastingly, the proportion was very low in Turkey (22 %), Greece (30 %), Great Britain (32 %), Spain and Portugal (38 % each). The largest volume of collected glass was in 2003 in Germany, France and Italy. Average production of glass scrap on citizen reaches roughly 77 kg in the Czech Republic. 65 % of the sorted glass scrap was used again (recy-cled) in 2004; in 2005 it was already 68 %.
11. possible substitutesIn glass production, the sand is in fact only a source of SiO2, therefore it can be replaced
by sorted vein quartz, waste glass, synthetic SiO2, etc.
Industrial minerals
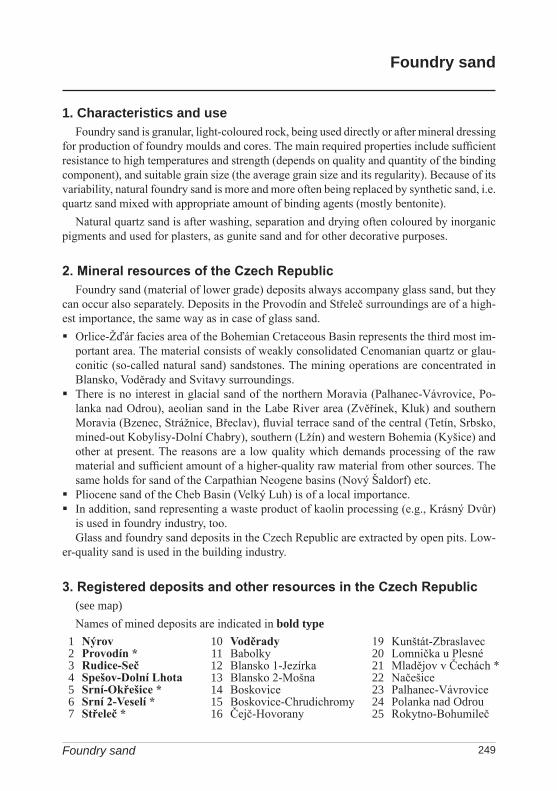
2�9Foundry sand
Foundry sand
1. Characteristics and use Foundry sand is granular, light-coloured rock, being used directly or after mineral dressing
for production of foundry moulds and cores. The main required properties include sufficient resistance to high temperatures and strength (depends on quality and quantity of the binding component), and suitable grain size (the average grain size and its regularity). Because of its variability, natural foundry sand is more and more often being replaced by synthetic sand, i.e. quartz sand mixed with appropriate amount of binding agents (mostly bentonite).
Natural quartz sand is after washing, separation and drying often coloured by inorganic pigments and used for plasters, as gunite sand and for other decorative purposes.
2. Mineral resources of the Czech RepublicFoundry sand (material of lower grade) deposits always accompany glass sand, but they
can occur also separately. Deposits in the Provodín and Střeleč surroundings are of a high-est importance, the same way as in case of glass sand. Orlice-Žďár facies area of the Bohemian Cretaceous Basin represents the third most im-
portant area. The material consists of weakly consolidated Cenomanian quartz or glau-conitic (so-called natural sand) sandstones. The mining operations are concentrated in Blansko, Voděrady and Svitavy surroundings.
There is no interest in glacial sand of the northern Moravia (Palhanec-Vávrovice, Po-lanka nad Odrou), aeolian sand in the Labe River area (Zvěřínek, Kluk) and southern Moravia (Bzenec, Strážnice, Břeclav), fluvial terrace sand of the central (Tetín, Srbsko, mined-out Kobylisy-Dolní Chabry), southern (Lžín) and western Bohemia (Kyšice) and other at present. The reasons are a low quality which demands processing of the raw material and sufficient amount of a higher-quality raw material from other sources. The same holds for sand of the Carpathian Neogene basins (Nový Šaldorf) etc.
Pliocene sand of the Cheb Basin (Velký Luh) is of a local importance.In addition, sand representing a waste product of kaolin processing (e.g., Krásný Dvůr)
is used in foundry industry, too.Glass and foundry sand deposits in the Czech Republic are extracted by open pits. Low-
er-quality sand is used in the building industry.
3. Registered deposits and other resources in the Czech Republic(see map)Names of mined deposits are indicated in bold type
1 Nýrov 10 Voděrady 19 Kunštát-Zbraslavec2 Provodín * 11 Babolky 20 Lomnička u Plesné3 Rudice-Seč 12 Blansko 1-Jezírka 21 Mladějov v Čechách *4 Spešov-Dolní Lhota 13 Blansko 2-Mošna 22 Načešice5 Srní-Okřešice * 14 Boskovice 23 Palhanec-Vávrovice6 Srní 2-Veselí * 15 Boskovice-Chrudichromy 24 Polanka nad Odrou7 Střeleč * 16 Čejč-Hovorany 25 Rokytno-Bohumileč

250
Foun
dry
sand
rese
rved
.regi
ster
ed.d
epos
its
exha
uste
d.de
posi
ts.a
nd.o
ther
.reso
urce
s
Industrial minerals

251
8 Svitavy-Vendolí 17 Deštná-Dolní Smržov 26 Rudka-Kunštát9 Velký Luh * 18 Kluk-Mostkový Les 27 Velký Luh 1
28 Zvěřínek-Polabí* deposits of glass and foundry sands
4. Basic statistical data of the Czech Republic as of December 31
Year 2002 2003 200� 2005 2006
Deposits.–.total.number 29 29 29 29 28
. exploited 11 11 12 12 10
Total.mineral.*reserves,.kt. ��7.�99 ���.218 ��2.305 �18.30� 387.667. economic.explored.
reserves 157.821 158.57� 1�2.13� 138.820 137.955
. economic.prospected.reserves 100.015 96.230 85.786 81.956 81.907
. potentially.economic.reserves 189.663 189.�1� 21�.385 197.528 167.805
Mine.production,.kt 676 712 831 807 773
* see NOTE on page 12 on a terminological difference between Czech official application of the term reserves and standard international application of the term
5. Foreign tradeItem 250510 (Silica sand and quartz sand) of the customs tariff unfortunately clearly
includes both glass and foundry sand, and also a part of sand and gravel. The data below therefore correspond to those presented in chapter on glass sand, in which also a more de-tailed classification of export and import according to countries.250510 – Silica sand and quartz sand
2002 2003 200� 2005 2006
Import,.t 99.�09 189.130 2�5.139 263.151 360.157
Export,.t �61.�22 �90.218 555.118 516.770 56�.600
6. prices of domestic market and foreign trade250510 – Silica sand and quartz sand
2002 2003 200� 2005 2006
Average.import.prices.(CZK/t) 653 500 518 517 500
Average.export.prices.(CZK/t) �31 �2� �72 52� 529
Foundry sand
252
Prices of foundry sand are lower than prices of glass sand. Wet sand was sold at CZK 210–390 per tonne, dry (not bagged) at CZK 730–800 per tonne, in bags for CZK 1,065 to 1,610 per tonne.
7. Mining companies in the Czech Republic as of December 31, 2006Provodínské písky a.s., ProvodínSklopísek Střeleč a.s., MladějovMoravské keramické závody a.s., Rájec – JestřebíLASSELSBERGER, a.s., Plzeň PEDOP s.r.o., LipovecJaroslav Sedláček – SEDOS, Drnovice P-D Refractories CZ a.s., Velké OpatoviceSETRA s.r.o., Brno
8. World productionWorld statistics provide only data on total production of sand for industrial use (glass
production, foundry industry, abrasives etc.). Therefore the data given below are identical to those presented in the chapter on glass sand. These numbers are moreover distorted by that they are not available for all countries.
The production had been rising until 1988 (119 mill t). Since then the production was decreasing due to general economic recession. The volume of production returned back to the level of about 120 mill t in 1995. World mine production slowly increased between 1996 and 2002. The change did not arrive until 2003, when the production increased again to about 110 mill tonnes. The increase continued during the last three years. Numbers of world production volume according to Mineral Commodity Summaries (MCS):
Year 2002 2003 200� 2005 2006.e
Mine.production,.mill.t.(MCS) 95 110 115 118 120
Main producers’ share in the world mine output (2005; according to MCS):
USA 25.9 % Spain 5.5 %Slovenia 9.3 % Japan 4.0 %Germany 6.9 % Great Britain 3.8 %Austria 5.8 % Australia 3.4 %France 5.5 % Italy 2.5 %
Industrial minerals

253
9. World market pricesThe average price of foundry sand for industrial use on the European market was steady
(around 10 GBP/t) in the first half of the 1990s. It slowly increased in the period 1995 – 2001. World prices remain stable since 2002. Prices of foundry sand quoted by the Industrial Min-erals magazine at year-end were as follows:
Commodity/Year 2002 2003 200� 2005 2006Foundry.sand,.dry,.bulk,.EXW.UK GBP/t 16.00 16.00 16.00 16.00 16.00
Foundry.sand,.dry,.bulk,.EXW.USA USD/t 19.50 19.50 19.50 19.50 27.00
10. recyclingFoundry sand used in moulding is mixed with bentonites, water glass, etc; having been
exposed to high temperatures, their properties change to such extent, which makes their full recycling impossible. A research with an objective to increase a share of recycled sand in new mixtures is carried out in many countries, also in the Czech Republic.
11. possible substitutesFoundry sand for moulding mixtures, especially in precision casting and few other uses,
can be replaced by crushed olivine, staurolite or chromite with graphite binder.
Foundry sand

25�
limestones and corrective additives for cement production
1. Characteristics and useLimestones as a mineral are sedimentary (limestones) and metamorphic rocks (crystalline
limestone or marble) containing CaCO3 (calcite or aragonite). Limestones originated through chemical, biogenic and mechanical processes or their combination. Primary and secondary admixtures in limestones are dolomite, silicates, phosphates, etc. Limestones of different ori-gin show variations in physical characteristics, texture, hardness, colour, weight, and porosity, ranging from loosely consolidated marls through chalk to compact limestones. Their colour depends on sort of admixture (pyrite and organic substance – black, pure – light to white). Calcitic marble (crystalline limestone) is a metamorphic rock formed of limestone under increased temperature and pressure. Limestones occur in practically all the sedimentary geo-logical formations and their metamorphosed equivalents worldwide.
Limestones are used for production of building materials (lime, cement, mortar mixtures, granulated gravel, dimension and crushed stone, etc.), in the metallurgical, chemical and food industries, recently also for desulphurization of industrial flue gas (e.g. in thermal power stations), in agriculture, glass and ceramic industries, etc.
This group of minerals also includes corrective additives for cement production (CK), e.g. shales, clays, loess, loams, sand, etc., which correct the content of SiO2, Al2O3 and Fe2O3 in the basic raw material for clinker mix. These corrective materials mostly occur directly in deposits of portland limestones or separately in their close neighbourhood.
2. Mineral resources of the Czech RepublicAccording to use, the limestones in the Czech Republic are classified in the following
grades:Limestones with very high percentage of CaCO3 (VV), containing at least 96 % of car-
bonate component (with max. 2 % MgCO3). These limestones are used mostly in chemi-cal, glass, ceramics, rubber, food and metallurgical industries, for desulphurization, and for production of the top quality lime (quick lime);
Other limestones (VO) – with carbonate content at least 80 % – are used mostly for pro-duction of cement, further for production of lime, desulphurization, etc. Also dolomites and dolomitic limestones were included in this group in the Czech Republic until 1997.
Clayey limestones (VJ) – with CaCO3 content over 70 % and higher content of SiO2 and Al2O3. These limestones are used for production of cement, all kinds of lime, and for desulphurization;
Carbonates for use in agriculture (VZ) – with the content of carbonates at least 70–75%. They are used for agricultural land and forest soils conditioning;Limestone deposits in the Czech Republic are concentrated in the following main ar-
eas:The Devonian of the Barrandian area – the most important and the largest mining district
in Bohemian part of the Czech Republic. Almost all types of limestones occur there, particularly those of VV and VO grades, but also VZ and CK grades. Limestone deposits
Industrial minerals
255
are hosted by sediments of mostly Lower Devonian age, and consist usually of several lithological types. The Upper Koněprusy limestones are of the highest grade (average content of CaCO3 is about 98 %). A considerable part of reserves and hypothetical re-sources is however located in Protected Landscape Area Český kras, hence cannot be ac-cessed. The most important deposits are Koněprusy (VV), Kozolupy-Čeřinka (VV+VO), Kosoř-Hvížďalka (VO), Loděnice (VO), Radotín-Špička (VO) and Tetín (VV+VO).
The Paleozoic of Chrudim region (of the Železné hory Mts.) – relatively small surface area with important deposits. They are composed of the Podolí crystalline limestones (VV grade, 95 % CaCO3) and less pure darker marbles of VO grade (90 % CaCO3). Mined deposit Prachovice (VV+VO) represents the only and decisive deposit.
Central Bohemian metamorphosed “islands” (Islet Zone) – small isolated areas with rather pure metamorphosed limestones (mostly VV a VO grades). Skoupý deposit (VV) is the most important one.
Crystalline complex of the Krkonoše–Jizerské hory Mts. – medium and small-size de-posits, mostly in the form of lenses within phyllitic and mica schistous rocks. Limestones are crystalline, often with variable contents of MgCO3 (dolomitic limestones to calcitic dolomites) and SiO2 (mostly VO and VZ grades). Apart from dolomite deposit Lánov, the almost exhausted Černý důl deposit (VO) is the only exploited deposit.
Moldanubicum – small-size deposits of crystalline limestones, forming bands or lens-es in metamorphic rocks. Dolomitic limestones or dolomites usually accompany the limestones here. The majority of local limestones are of VZ and VO grades. The high-est number of deposits and amount of reserves is concentrated in the Šumava part of the Moldanubicum, with an important exploited deposit Velké Hydčice-Hejná (VO).
The Moravian Devonian – represents the most important and very large region with lime-stone deposits of various sizes in Moravian part of the Czech Republic. The Vilémovice limestones (VV grade, 96–97 % CaCO3) represent the major mineral in almost all deposits. Further types represented are the Křtiny, Hády and Lažánky limestones (VO). They are mostly registered as corrective additives for cement production. The largest and the most important deposits are concentrated in particular areas of the Moravian Karst with a large mined deposit Mokrá u Brna (VV+VO+CK) and of the Hranice Devonian with a large mined deposit Hranice-Černotín (VO+CK). Other mostly not mined deposits occur in the Konice-Mladeč Devonian, Čelechovice-Přerov Devonian and in the Devonian of the Boskovice Graben.
The Silesicum (the Branná Group), the Zábřeh Group and the Orlické hory Mts.– Kłodzko Crystalline Complex – smaller deposits of crystalline limestones forming bands in metamorphic rocks. Limestones are often of high grade (VV grade, up to 98 % CaCO3, less of VO grade) and in the northern part of the area there are limestones suitable for dimension stones (KA). Horní and Dolní Lipová (VV+VO) in the Silesicum and Vitošov (VV), located at the border of the Desná Dome and the Zábřeh Group, represent the most important mined deposits of this type.
The Bohemian Cretaceous Basin (the Ohře and Kolín regions) – large and medium-size deposits. Deposits contain clayey limestones and marls with content of CaCO3 ranging between 80 and 60 % (the most important deposits of clayey limestones – VJ). Exploited deposit Úpohlavy-Chotěšov (VJ) is of a fundamental importance.
Outer Klippen Belt of the Western Carpathians – limestones form tectonically isolated blocks in surrounding rocks (so-called “klippen”). The limestones – Štramberk lime-stones in the NE and Ernstbrunn limestones in the SW – are of a very high grade, with
Limestones

256
an average content of CaCO3 95.0–98.0 %, and MgCO3 about 1.0 % (VV). Štramberk (VV+VO) is the most important mined deposit of this type. It has been the only mined deposit since 2005, when the operation of the Mikulov deposit was terminated.Other regions with carbonate rocks occurrences, such as Krušné hory Mts. Crystalline
Complex, the Culm of the Nízký Jeseník Mts., Moravicum, the Tertiary of the southern and central Moravia etc. are mostly of just local interest. Deposits of limestones, additives for cement production and dolomites are extracted by open-pit mines.
3. registered deposits and other resources.in the Czech Republic(see map)Principal areas of deposits presence:
1 Devonian of the Barrandian area
4 Krkonoše Mts.-Jizerské hory Mts. Crystalline Complex
7 Silesicum (Branná Group), Orlické hory Mts.-Kłodzko Crystalline Complex and Zábřeh Group
2 Paleozoic of the Železné hory Mts.
5 South-Bohemian and Moravian Moldanubicum
8 Bohemian Cretaceous Basin
3 Central Bohemian Islet Zone
6 Moravian Devonian 9 Outer Klippen Belt of the Western Carpathians
4. Basic statistical data of the Czech Republic as of December 31limestones – total number
Year 2002 2003 200� 2005 2006Deposits.–.total.number 100 99 95 91 88
. exploited 2� 2� 25 25 23Total.mineral.*reserves,.kt. �.776.75� �.525.78� �.��7.00� �.�53.558 �.295.55�
. economic.explored.reserves 1.826.3�5 1.815.869 1.8�5.807 1.709.72� 1.699.360
. economic.prospected.reserves
2.291.983 2.039.737 1.931.626 1.912.168 1.80�.009
. potentially.economic.reserves
658.�26 670.178 669.571 831.666 792.185
Mine.production,.kt 9.871 10.236 10.568 9.912 10.193
* see NOTE on page 12 on a terminological difference between Czech official application of the term reserves and standard international application of the term
Industrial minerals

257
lim
esto
nes
rese
rved
.regi
ster
ed.d
epos
its
exha
uste
d.de
posi
ts.a
nd.o
ther
.reso
urce
s
Limestones

258
Owing to the importance and considerable differences in technological use and prices, high-percentage limestones (VV), corrective additives for cement production (CK) and other limestones (VO) are monitored separately. High-percentage limestones containing 96 % or more of CaCO3 (VV)
Year 2002 2003 200� 2005 2006Deposits.–.total.number 31 30 30 30 28
. exploited 12 12 12 11 11Total.mineral.*reserves,.kt. 1.676.78� 1.�31.653 1.�26.550 1.�23.616 1.388.�33
. economic.explored.reserves 69�.808 690.135 685.191 6�8.966 626.781
. economic.prospected.reserves
82�.378 572.168 572.009 565.0�0 553.972
. potentially.economic.reserves
157.598 169.350 169.350 209.610 207.680
Mine.production,.kt 5.017 �.573 �.629 �.199 �.386
* see NOTE on page 12 on a terminological difference between Czech official application of the term reserves and standard international application of the term
Other limestones (VO)
Year 2002 2003 200� 2005 2006Deposits.–.total.number �9 50 50 �6 �7
. exploited 1� 1� 15 15 1�Total.mineral.*reserves,.kt. 2.��1.609 2.�37.066 2.362.6�0 2.375.637 2.258.386
. economic.explored.reserves 1.012.138 1.007.595 993.551 89�.967 908.015
. economic.prospected.reserves
981.106 981.106 919.718 907.2�2 81�.�9�
. potentially.economic.reserves
��8.365 ��8.365 ��9.371 573.�28 535.877
Mine.production,.kt 3.632 �.��� �.666 �.500 �.6�3
* see NOTE on page 12 on a terminological difference between Czech official application of the term reserves and standard international application of the term
Industrial minerals
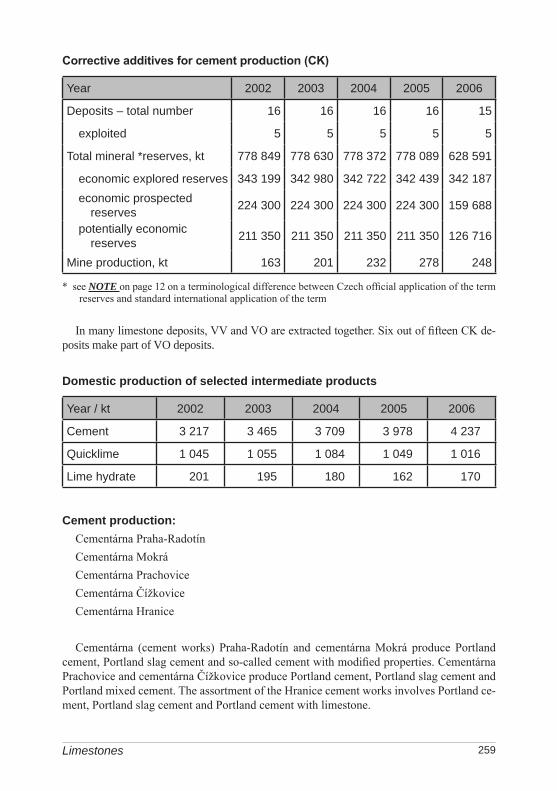
259
Corrective additives for cement production (CK)
Year 2002 2003 200� 2005 2006
Deposits.–.total.number 16 16 16 16 15
. exploited 5 5 5 5 5
Total.mineral.*reserves,.kt. 778.8�9 778.630 778.372 778.089 628.591
. economic.explored.reserves 3�3.199 3�2.980 3�2.722 3�2.�39 3�2.187
. economic.prospected.reserves 22�.300 22�.300 22�.300 22�.300 159.688
. potentially.economic.reserves 211.350 211.350 211.350 211.350 126.716
Mine.production,.kt 163 201 232 278 2�8
* see NOTE on page 12 on a terminological difference between Czech official application of the term reserves and standard international application of the term
In many limestone deposits, VV and VO are extracted together. Six out of fifteen CK de-posits make part of VO deposits.
Domestic production of selected intermediate products
Year./.kt 2002. 2003 200� 2005. 2006
Cement 3.217 3.�65 3.709 3.978 �.237
Quicklime 1.0�5 1.055 1.08� 1.0�9 1.016
Lime.hydrate 201 195 180 162 170
Cement production:Cementárna Praha-RadotínCementárna MokráCementárna PrachoviceCementárna ČížkoviceCementárna Hranice
Cementárna (cement works) Praha-Radotín and cementárna Mokrá produce Portland cement, Portland slag cement and so-called cement with modified properties. Cementárna Prachovice and cementárna Čížkovice produce Portland cement, Portland slag cement and Portland mixed cement. The assortment of the Hranice cement works involves Portland ce-ment, Portland slag cement and Portland cement with limestone.
Limestones

260
lime production:Vápenka Čertovy schody a.s.Vápenka Vitošov s.r.o.Vápenka Vitoul s.r.o.Kotouč Štramberk s.r.o.Carmeuse Czech Republic, s.r.o.Hasit Šumavské vápenice a omítkárny, a.s.Krkonošské vápenky Kunčice, a.s.
The assortment of the vápenka (lime works) Čertovy schody involves apart from natural products (lump and ground limestone and lump and grinded dolomite) also burnt products (lump and ground lime, lime hydrate) and special products. Vápenka Vitošov produces lump lime, lime briquettes (used for iron production), lime hydrate and also mortar and plaster mixtures SALITH®. Vápenka Vitoul produces ground and finely ground lime-stones, used for instance at desulphurization of flue gases from thermal power stations, as a filler in rubber-making industry or at production of plastics. Kotouč Štramberk s.r.o. produces a large variety of products, e.g. lump sorted limestone, ground limestone, lump lime, ground lime, lime hydrate. Hasit Šumavské vápenice a omítkárny a.s. produces e.g. lime hydrate, magnesium-lime fertilizers, fillers, plaster mixtures etc. The assortment of Krkonošské vápenky Kunčice includes e.g. dry mortar and plaster mixtures, maintenance plaster, masonry mortar.
5. Foreign trade2521 – Limestone flux, limestone and other calcareous stone, for lime or cement manufacturing
2002 2003 200� 2005 2006
Import,.t �78.187 52�.152 398.670 170.303 215.210
Export,.t 211.956 103.111 133.18� 123.299 161.380
2522 – Quicklime, slaked and hydraulic lime
2002 2003 200� 2005 2006
Import,.t 100.252 10�.552 10�.807 95.01� 123.038
Export,.t. 18�.3�8 198.�79 171.160 155.322 1�5.282
Industrial minerals

261
2523 – portland, aluminous, slag, supersulphate and similar hydraulic cements also coloured or in the form of clinkers
2002 2003 200� 2005 2006
Import,.t 838.750 1.1�8.58� 1.308.919 1.206.097 1.163.105
Export,.t. �65.85� 562.�7� 67�.1�9 55�.803 �95.128
Detailed data on limestone imports (kt)
Country 2002 2003 200� 2005 2006
Slovakia �7�.557 520.008 39�.663 168.669 21�.175
Poland 2.71� 2.969 2.871 9�8 371
Germany 61 231 310 21� �08
others 855 9�� 826 �72 256
Detailed data on limestone exports (kt)
Country 2002 2003 200� 2005 2006
Poland 66.3�8 �7.035 96.56� 85.303 102.1�5
Germany 138.795 53.725 21.60� 31.097 ��.826
Austria 3.3�7 0 1.077 2.06� 1�.110
Slovakia 2.310 2.351 1.667 1.061 299
others 1.156 0 12.272 3.77� 0
Volume of foreign trade with cement (more than billion tonnes per year imported since 2003) has been the most important. About two thirds are imported from Slovakia, the rest namely from Germany and Poland. Czech cement export has been ranging between 0.45 and 0.7 tonnes and is directed in Germany and other neighbouring countries. The long-term trend of the Czech export being several times higher than the import turned into a completely opposite situation in 2002 and since than the foreign trade balance has been unfavourable for the Czech Republic.
Natural limestone has been imported to the Czech Republic almost exclusively from Slovakia; imported volume has been gradually decreasing (to almost one half during 2004-2006), as the trade has been shifting rather to intermediate products. The Czech limestone export has been fluctuating between 100 and 200 kt per year; the export to Poland at the expense of Germany has increased in recent years. Trade with lime represents the smallest volume –import has been oscillating around 100 kt on a long term and it comes traditionally mainly from Slovakia. The lime export decreased from 225 kt in 2001 to 145 kt in 2006.
Limestones

262
6. prices of domestic market and foreign tradePrices are influenced by quality requirements. Prices of high percentage limestones used
especially in metallurgy and in chemical and sugar industries are the highest. The average prices of lump high-purity limestone oscillated between CZK 195–470 per tonne during the last years. Prices of bulk cement oscillated depending on the quality between CZK 2,100–2,600 per tonne, cement on pallets between CZK 2,450 and 2,800 per tonne. Prices of ground lime were CZK 1,150–2,800 per tonne, lump lime CZK 2,000–2,500 per tonne. Lime hydrate was sold at CZK 2,400–2,830 per tonne. Prices of crushed limestone were CZK 150–250 per tonne depending on CaCO3 content. Prices of ground limestones were CZK 400–1,200 depending on the way of use and grain fraction.
2521 – Limestone flux, limestone and other calcareous stone, for lime or cement manufacturing
2002 2003 200� 2005 2006
Average.import.prices.(CZK/t) 256 172 2�3 237 182
Average.export.prices.(CZK/t) 399 501 507 506 �37
2522 – Quicklime, slaked and hydraulic lime
2002 2003 200� 2005 2006
Average.import.prices.(CZK/t) 1.260 1.2�2 1.371 1.�19 1.�02
Average.export.prices.(CZK/t) 1.�29 1.529 1.588 1.571 1.6�0
2523 – portland, aluminous, slag, supersulphate and similar hydraulic cements also coloured or in the form of clinkers
2002 2003 200� 2005 2006
Average.import.prices.(CZK/t) 1.815 1.696 1.�92 1.593 1.639
Average.export.prices.(CZK/t) 1.229 1.0�2 1.161 1.219 1.191
7. Mining companies in the Czech Republic as of December 31, 2006limestones:
Českomoravský cement a.s., nástupnická společnost (succession company), BerounVelkolom Čertovy schody a.s., Tmaň Lafarge Cement, a.s., ČížkoviceCement Hranice, a.s.
Industrial minerals

263
Holcim (Česko), a.s., člen koncernu (trust member), PrachoviceVápenka Vitošov s.r.o., LeštinaLomy Mořina, s.r.o., MořinaKotouč Štramberk, s.r.o.OMYA a.s, VápennáHASIT Šumavské vápenice a omítkárny, a.s., Velké HydčiceLom Skalka, s.r.o., Ochoz u BrnaKalcit, s.r.o., BrnoKrkonošské vápenky Kunčice, a.s.Vápenka Vitoul s.r.o., MladečLASSELSBERGER, a.s., PlzeňAGIR s.r.o., PetroviceKamenolom a vápenka Malá dohoda, s.r.o., HolštejnAgrostav Znojmo, a.s.
Corrective additives for cement production:Českomoravský cement a.s., nástupnická společnost (succession company), BerounCement Hranice, a.s.Holcim (Česko), a.s., člen koncernu (trust member), Prachovice
8. World productionOverall data on production of limestones in the world are not available. Accessible are
data on mine production in some of the neighbouring countries – the average annual mine production in Slovakia (high-percentage limestones and other limestones) oscillated be-tween 6.5 and 7.5 mill t in the last years. The annual mine production in Poland (including limestones used as crushed stone) has been roughly between 33 and 42 mill t. The major producing areas can be indirectly traced based on production of cement and lime, which consumes most of the mined limestone. In the last five years, the largest world producers were then China, India, the USA, Japan, Rep. of Korea, Spain, Russia, Brazil, Turkey and Italy, which together produced almost 70 % of the world production of cement. China, the USA, Russia, Japan, Germany, Brazil and Mexico produced about two thirds of the world lime production (64 % in 2006).
World production of cement
Year 2002. 2003 200�. 2005 2006.e
Production,.mill.t.(MCS) 1.800 1.950 2.130 2.310 2.500
Limestones

26�
World production of lime
Year 2002. 2003 200� 2005 2006.e
Production,.mill.t.(MCS) 116 120 126 127 130
9. World market pricesPrices of limestone are not quoted. Prices of lime on the US market oscillated between
USD 59 and 81 per tonne in 2002-2006, prices of lime hydrate were between USD 89 and 93 per tonne. The Industrial Minerals magazine has been publishing prices of calcium car-bonate of various grades.
Commodity/Year 2002 2003 200� 2005 2006Calcium.carbonate.ground.(GCC), coated fine grade, EXW.UK
GBP/t 91.50 91.50 91.50 91.50 91.50
Calcium.carbonate.precipitated.(PCC),.coated.fine grade, EXW UK
GBP/t 358.50 358.50 358.50 358.50 385.00
Calcium.carbonate.precipitated (PCC), fine (0.�–1.0.microns),.FOB.USA
USD/st 260.00 260.00 260.00 260.00 260.00
Calcium.carbonate.precipitated.(PCC),.very.fine (0.02–0.36 microns), FOB.USA
USD/st 562.50 562.50 562.50 562.50 562.50
10. recyclingThe material is not recycled. Recycled are just some products of glass industry, construc-
tion materials, etc.
11. possible substitutesLimestones of all grades have various uses. Limestones can be replaced in many applica-
tions. Limestones, dolomites and variously burnt lime are often mutually replaceable (e.g. in agriculture). Also in the desulphurization, various mixtures of carbonates can replace limestones. Limestone and products made of limestone (lime, hydrated lime) used for acid neutralization can be replaced by MgO minerals, natural and synthetic zeolites and anaero-bic bacteria; biological technologies are successfully used in acid rain effects suppression and acid mine water neutralization.
Yet the limestone are irreplaceable in many of their uses – for instance in production of cement and lime, or in the metallurgical industry (melting agent for production of pig iron).
Industrial minerals

265Dolomite
Dolomite
1. Characteristics and useIn the Czech Republic, carbonates containing at least 27.5% of MgCO3 and more than 80
% of MgCO3 + CaCO3 are classified as dolomites.Pure dolomite is important material for glass, ceramic and chemical industries. Dolo-
mitic rocks are used in production of dolomitic lime, hydrated lime, magnesium cements, and magnesia refractories for metallurgy, in desulphurization of power station waste gases. They are also used as dimension stone and in production of fertilizers and fillers, and often also for crushed stone production and other building purposes.
2. Mineral resources of the Czech RepublicDolomite and calcitic dolomite deposits and occurrences are located in the following
main regions of the Czech Republic:Crystalline Complex of the Krkonoše–Jizerské hory Mts. – crystalline calcitic dolomite
and dolomite deposits in the form of lenses in host rocks. This region is the most impor-tant in the Czech Republic, because it has the highest number of deposits and the largest volume of reserves. The largest and the most important deposit of dolomites in the Czech Republic Horní Lánov contains raw material with 32 % of CaO and nearly 19 % of MgO on average.
Šumava Mts. and Bohemian Moldanubicum – it contains several smaller pure dolomite deposits (mined deposit Bohdaneč, abandoned deposit Jaroškov) and calcitic dolomite deposits (Podmokly, Krty).
Crystalline Complex of the Krušné hory Mts. – several small deposits near Kovářská and Přísečnice (for instance mined-out deposit of pure dolomite Vykmanov).
Moravian branch of the Moldanubicum with small but often high-quality dolomite oc-currences (mined-out deposit Dolní Rožínka) and little explored prognostic resources (Lukov at Moravské Budějovice, Číchov et al.).
Devonian of the Barrandian – a typical dolomite deposit (Velká Chuchle) already mined out.
The Orlické hory Mts.–Kłodzko crystalline complex and Silesicum (Velké Vrbno group) – several smaller deposits (Bílá Voda).
Moravian (Čelechovice–Přerov) Devonian near Olomouc – with two larger deposits of Lažánky calcitic dolomites (Hněvotín, Bystročice), associated here with Vilémovice limestones (VO). The average content of Mg in both deposits is 17 %. Another medium-sized deposit of Lažánky calcitic dolomites occurs near Čelechovice. The reserves are blocked by the spa protection zone. Krkonoše–Jizerské hory Mts. Crystalline Complex and Moravian Devonian are the most
important regions where dolomites partly occur in some deposits (Lánov, Hněvotín), but these are mainly calcitic dolomites. Deposits of the Šumava branch of the Moldanubicum are usually smaller or they are formed by impure calcitic dolomites. In the other regions, dolomites form only smaller lenses and they are often not enough explored (especially in the western Moravia).

266
3. Registered deposits and other resources in the Czech Republic(see map)Names of mined deposits are indicated in bold type
1 Bohdaneč 5 Hněvotín 9 Kryštofovo Údolí2 Lánov 6 Horní Rokytnice 10 Křížlice3 Bystročice 7 Jesenný-Skalka 11 Machnín-Karlov pod Ještědem 4 Čelechovice na Hané 8 Koberovy 12 Podmokly
4. Basic statistical data of the Czech Republic as of December 31
Year 2002 2003 200� 2005 2006
Deposits.–.total.number 12 12 12 12 12
. exploited 2 2 2 2 2
Total.mineral.*reserves,.kt. 510.528 511.�69 515.382 51�.963 51�.55�. economic.explored.
reserves 80.510 80.601 80.255 79.836 79.�27
. economic.prospected.reserves 335.807 336.58� 3�0.8�3 3�0.8�3 3�0.8�3
. potentially.economic.reserves 9�.211 9�.28� 9�.28� 9�.28� 9�.28�
Mine.production,.kt 31� �16 3�5 �19 �09
* see NOTE on page 12 on a terminological difference between Czech official application of the term reserves and standard international application of the term
5. Foreign trade2518 – Dolomite calcined, roughly worked or cut; agglomerated
2002 2003 200� 2005 2006
Import,.t 662.887 578.828 �63.601 36�.125 ��7.�2�
Export,.t. 1�.557 1�.2�5 1�.�03 13.16� 19.0�7
Predominant part of dolomite (and dolomitic limestones in form of crushed stone) comes from the neighbouring Slovakia. In contrast, predominant part of the Czech export is direct-ed to Poland. High-quality white dolomite is exported for markedly higher export prices.
Industrial minerals

267
3. Registered deposits and other resources in the Czech Republic(see map)Names of mined deposits are indicated in bold type
1 Bohdaneč 5 Hněvotín 9 Kryštofovo Údolí2 Lánov 6 Horní Rokytnice 10 Křížlice3 Bystročice 7 Jesenný-Skalka 11 Machnín-Karlov pod Ještědem 4 Čelechovice na Hané 8 Koberovy 12 Podmokly
4. Basic statistical data of the Czech Republic as of December 31
Year 2002 2003 200� 2005 2006
Deposits.–.total.number 12 12 12 12 12
. exploited 2 2 2 2 2
Total.mineral.*reserves,.kt. 510.528 511.�69 515.382 51�.963 51�.55�. economic.explored.
reserves 80.510 80.601 80.255 79.836 79.�27
. economic.prospected.reserves 335.807 336.58� 3�0.8�3 3�0.8�3 3�0.8�3
. potentially.economic.reserves 9�.211 9�.28� 9�.28� 9�.28� 9�.28�
Mine.production,.kt 31� �16 3�5 �19 �09
* see NOTE on page 12 on a terminological difference between Czech official application of the term reserves and standard international application of the term
5. Foreign trade2518 – Dolomite calcined, roughly worked or cut; agglomerated
2002 2003 200� 2005 2006
Import,.t 662.887 578.828 �63.601 36�.125 ��7.�2�
Export,.t. 1�.557 1�.2�5 1�.�03 13.16� 19.0�7
Predominant part of dolomite (and dolomitic limestones in form of crushed stone) comes from the neighbouring Slovakia. In contrast, predominant part of the Czech export is direct-ed to Poland. High-quality white dolomite is exported for markedly higher export prices.
Dol
omite
rese
rved
.regi
ster
ed.d
epos
its
exha
uste
d.de
posi
ts.a
nd.o
ther
.reso
urce
s
Dolomite

268
6. prices of domestic market and foreign trade2518 – Dolomite calcined, roughly worked or cut; agglomerated
2002 2003 200� 2005 2006
Average.import.prices.(CZK/t) 257 196 288 261 213
Average.export.prices.(CZK/t) 2.219 2.051 2.205 2.863 2.587
Prices of lump dolomite are CZK 75 per tonne; prices of dolomite aggregates reach CZK 190–330 per tonne depending on granularity. Ground calcitic dolomite is sold in bulk at CZK 510–610 per tonne, on pallets at CZK 1,580 per tonne. Crushed white dolomite is of-fered crushed from 950 CZK/t (0–2 mm) to 1,330 CZK/t (2–5, 5–8, 8–16 mm).
7. Mining companies in the Czech Republic as of December 31, 2006Krkonošské vápenky Kunčice a.s.UNIKOM a.s., Kutná Hora
8. World productionThe dolomite production and consumption are not statistically followed in the world
market. Annual market production in Slovakia has been oscillating roughly between 1.7 and 2.0 mill t during the last five years. The Polish annual mine production of dolomite has been between 5 and 6 mill tonnes. The USA production of dolomite crushed stone was 91 mil t in 2004 and 95 mill t in 2005.
9. World market pricesWorld market prices are not given in the international statistical surveys.
10. recyclingDolomite is not recycled.
11. possible substitutesDolomite as source of Mg is substituted by magnesite, by Mg obtained from seawater
and salt brines and by brucite.
Industrial minerals

269
Gypsum
1. Characteristics and useGypsum is a sedimentary rock, consisting mostly or completely of monoclinic mineral
gypsum (CaSO4.2H2O), which is usually colourless or white. The rock often contains impu-rities (clay minerals, quartz, iron oxides, limestone, dolomite, anhydrite, etc.). The major-ity of gypsum deposits was formed as evaporites from marine or lake water in arid areas. Deposits of different origin (weathering and decomposition of sulphides, hydration of an-hydrite, metasomatic processes, etc.) are of no economic importance. Anhydrous CaSO4 is often classified in the gypsum group. It is usually transformed to gypsum by wet grinding. Present world reserves of gypsum are estimated at 2,600 mill tonnes.
Gypsum is used mostly for production of building materials (calcined gypsum, cement, plasters, prefabricated elements) and small amount for other purposes (in agriculture, glass and paper manufacturing, in pharmacy, also as a filler, etc.).
2. Mineral resources of the Czech RepublicGypsum deposits in the Czech Republic are confined to the Miocene (Badenian-Wielic-
zkien) sediments of the Opava Basin (marginal part of the Carpathian Foredeep). Larger part of the productive Badenian is on the Polish side of the basin. The average content of gypsum in the rock is 70–80 %. The impurities are mostly clay and to a smaller extent sand. Close to surface deposit parts are often karstified. The mining for gypsum (in the past there were also underground mines) in the Opava region has been going on continu-ously since the second half of the 19th century. At present, there is only one open-pit mine at Kobeřice-jih deposit.
3. Registered deposits and other resources in the Czech Republic(see map)Names of mined deposits are indicated in bold type
1 Kobeřice ve Slezsku-jih 3 Rohov-Strahovice 5 Třebom2 Kobeřice ve Slezsku-sever 4 Sudice
Gypsum
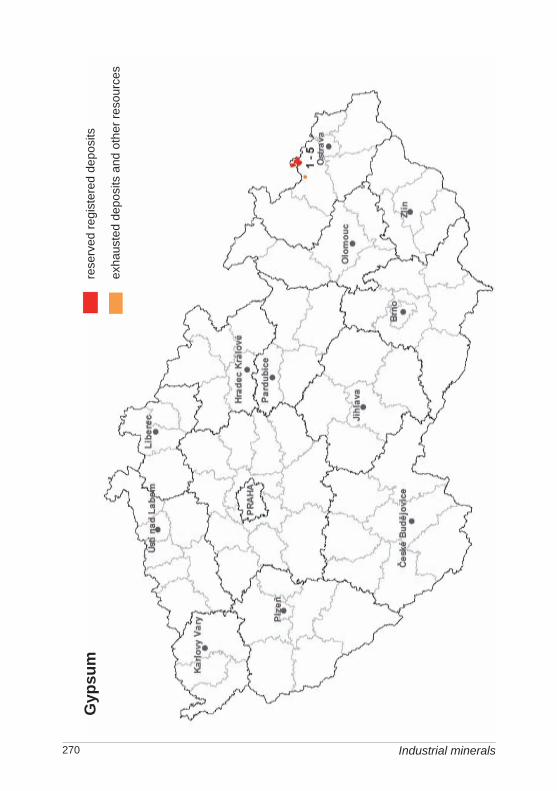
270
Gyp
sum
rese
rved
.regi
ster
ed.d
epos
its
exha
uste
d.de
posi
ts.a
nd.o
ther
.reso
urce
s
Industrial minerals
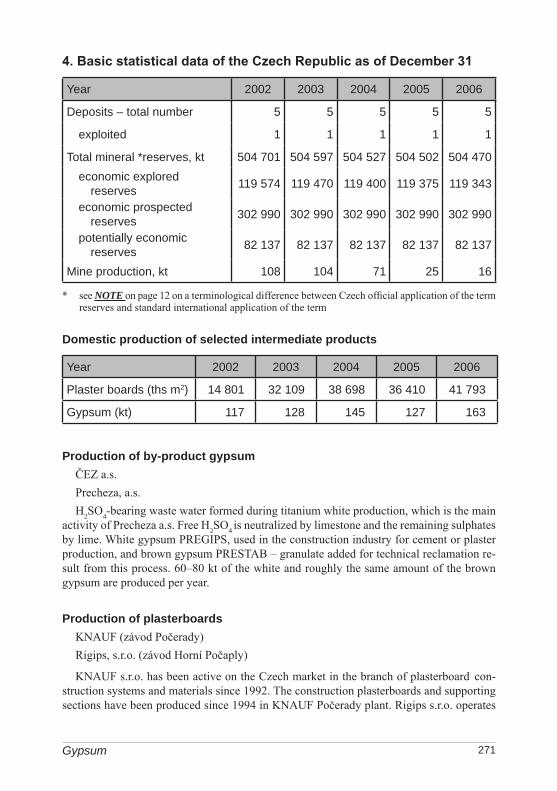
271
4. Basic statistical data of the Czech Republic as of December 31
Year 2002 2003 200� 2005 2006
Deposits.–.total.number 5 5 5 5 5
. exploited 1 1 1 1 1
Total.mineral.*reserves,.kt. 50�.701 50�.597 50�.527 50�.502 50�.�70. economic.explored.
reserves 119.57� 119.�70 119.�00 119.375 119.3�3
. economic.prospected.reserves 302.990 302.990 302.990 302.990 302.990
. potentially.economic.reserves 82.137 82.137 82.137 82.137 82.137
Mine.production,.kt. 108 10� 71 25 16
* see NOTE on page 12 on a terminological difference between Czech official application of the term reserves and standard international application of the term
Domestic production of selected intermediate products
Year 2002. 2003 200� 2005. 2006
Plaster.boards.(ths.m2) 1�.801 32.109 38.698 36.�10 �1.793
Gypsum.(kt) 117 128 1�5 127 163
production of by-product gypsum ČEZ a.s.Precheza, a.s.H2SO4-bearing waste water formed during titanium white production, which is the main
activity of Precheza a.s. Free H2SO4 is neutralized by limestone and the remaining sulphates by lime. White gypsum PREGIPS, used in the construction industry for cement or plaster production, and brown gypsum PRESTAB – granulate added for technical reclamation re-sult from this process. 60–80 kt of the white and roughly the same amount of the brown gypsum are produced per year.
production of plasterboardsKNAUF (závod Počerady)Rigips, s.r.o. (závod Horní Počaply)
KNAUF s.r.o. has been active on the Czech market in the branch of plasterboard con-struction systems and materials since 1992. The construction plasterboards and supporting sections have been produced since 1994 in KNAUF Počerady plant. Rigips s.r.o. operates
Gypsum

272
a plant for the plasterboard production in Horní Počaply by Mělník. The plant has a yearly capacity of 20 mill m2 of plasterboards.
5. Foreign trade252010 – Gypsum, anhydrite
2002 2003 200� 2005 2006
Import,.t 1�.790 20.266 29.19� 19.619 38.983
Export,.t 87.2�7 92.133 90.803 33.306 �6.837
Detailed data on gypsum imports (t)
Country 2002 2003 200� 2005 2006
Germany 1�.393 19.76� 28.653 19.305 38.056
others 397 502 5�1 31� 927
Detailed data on gypsum exports (t)
Country 2002 2003 200� 2005 2006
Slovakia 87.2�6 92.10� 90.803 33.305 �1.606
others 1 29 0 1 5.231
Gypsum foreign trade, the same way as domestic production of natural gypsum, has been significantly influenced by over-production of synthetic, waste gypsum, which originates as a desulphurization by-product of flue gas in thermal power stations. Surplus of the waste gypsum on Central European market resulted in a pronounced decrease of the domestic mine production of natural gypsum and of volume of gypsum exported from the Czech Republic, especially in 2005 and 2006. Czech gypsum from Kobeřice has been exported traditionally especially to Slovakia, and since 2005 newly also to Poland. Gypsum import has been oscillating between 15 and 40 kt per year and imported raw material comes pre-dominantly from Germany.
6. prices of domestic market and foreign trade252010 – Gypsum, anhydrite
2002 2003 200� 2005 2006
Average.import.prices.(CZK/t) 1.369 977 1.��1 1.81� 2.155
Average.export.prices.(CZK/t) 270 273 296 361 �16
Industrial minerals

273
The average price of domestically mined gypsum fluctuated around CZK 300 per tonne depending on the quantity, taken in 2006. Gypstrend s.r.o. offers further plaster binder the prices of which differ according to the quantity and colour of the material. Price of grey plaster binder in packages of 30 kg on pallets with foil oscillated around CZK 2,600 per tonne and price of white one was about CZK 4,400 per tonne in 2006. Gypsum blocks rep-resent a new product, which can substitute plasterboard at construction of internal partition walls. Their advantage compared to gypsum plasterboards is a higher surface rigidity. Their prices oscillate around CZK 370 and 480 per m2.
7. Mining companies in the Czech Republic as of December 31, 2006GYPSTREND, s.r.o., Kobeřice
8. World productionWorld production of gypsum (including anhydrite) has been for a long time in the range
of 80–100 million tonnes. The highest mine production was in the year 2005 (105 mill tonnes), according to the yearbook Welt Bergbau Daten. The production is closely related to building activities, the reduction of which caused also a temporary reduction of mining for gypsum after 1989. There appeared a big competitor of natural gypsum, so-called “syn-thetic gypsum”, in some countries in the last years. It originates as a byproduct of desul-phurizing (flue gas desulfurisation – FGD) of thermal power stations. Mining production as recorded in USGS yearbooks Mineral Commodity Summaries (MCS) are higher than those of the Welt Bergbau Daten (WBD).
Year 2002. 2003 200�. 2005 2006.e
Mine.production,.kt.(MCS) 101.000 10�.000 109.000 118.000 119.000
Mine.production,.kt.(WBD) 97.202 95.3�9 100.101 105.005 N
Main producers’ share in the world mine output (2005; according to MCS):
USA 17.9 % Mexico 6.1 %Iran 11.0 % Thailand 5.9 %Spain 9.7 % Japan 5.3 %Canada 8.0 % Australia 3.7 %China 6.2 %
9. World market pricesPrices of natural gypsum have been steady in the last years. Even in times of more exten-
sive building activities, the prices were stable, which was also caused by a supply of waste gypsum (desulphurization by-product of flue gas in thermal power stations, chemical indus-try), production of which highly exceeded the demand. Crude gypsum prices were quoted by the Industrial Minerals magazine until 2001. It oscillated around 9.00 GBP/t EXW UK.
Gypsum

27�
10. recyclingWaste gypsum wallboards from construction sites are recycled in a limited volume.
11. possible substitutesNatural gypsum is replaceable to some extent by by-product gypsum for example from
production of phosphoric acid, titanium dioxide and flue gas desulphurisation (FGD). The latter is the main type of by-product gypsum used (wallboards, cement production).
Industrial minerals

275
CONSTrUCTION MINEralS – geological reserves and mine production
There are very high geological reserves of construction minerals – dimension stone, crushed stone, sand and gravel and brick clays and related minerals (brick minerals) – in the Czech Republic. The volume of mine production of construction minerals decreased significantly – to about one half – in the beginning of the 1990s and remained very stable (typically for dimension stone and sand and gravel) in the years afterwards. The change did not arrive until 2003, when the demand for construction minerals increased in relation to reparation of damages after the destructive flood which affected a substantial part of the Czech Republic in August 2002. Mine production stayed at a high level also in 2004–2006; however, the flood-related demand was gradually replaced by a higher consumption (espe-cially of crushed stone) at the renovation of infrastructure and road and railway construc-tions.
Mining of construction minerals in reserved deposits (decrease of mineral reserves volume by mining)
Mineral Unit 2002 2003 200� 2005 2006
Dimension.stone ths.m3 235 2�� 273 288 2�2
Crushed.stone ths.m3 9.65� 11.210 11.966 12.822 1�.093
Sand.and.gravel ths.m3 8.26� 9.105 8.859 9.075 9.110
Brick.minerals ths.m3 1.525. 1.626 1.55� 1.5�3 1.286
Converted to kt:• dimension and crushed stone 1,000 m3 = 2.7 kt• sand and gravel and brick minerals 1,000 m3 = 1.8 kt
Mineral Unit 2002 2003 200� 2005 2006
Dimension.stone kt 635 659 737 778 653
Crushed.stone kt 26.066 30.267 32.308 3�.619 38.051
Sand.and.gravel kt 1�.875 16.389 15.9�6 16.335 16.398
Brick.minerals kt 2.7�5 2.927 2.797 2.777 2.315

276
lifetime of industrial reserves(economic explored disposable reserves) based on the decrease of reserves by mining including losses in registered deposits per year 2006 (A) and on the average annual decrement of reserves in period 2002–2006 (B) was as follows:
Mineral Lifetime.A.(years) Lifetime.B.(years)
Dimension.stone 253 269
Crushed.stone 75 88
Sand.and.gravel 98 103
Brick.minerals 166 1�3
Data on construction mineral production presented by the Czech Geological Survey – Geofond were distorted to a certain extent before 1999 due to the classification of de-posits as reserved and non-reserved. Producers were not obliged to submit the state statisti-cal statement Geo (MŽP) V3-01 when non-reserved deposit was exploited and therefore their production could not be recorded. The actual production of construction minerals was therefore higher than data presented.
Since 1999, the non-reserved deposit production has been recorded by way of the state statistical statements Hor (MPO) 1-01. These data give a more precise figure for total build-ing material production (crushed stone included) in the Czech Republic. As the response rate was about 90 to 95 %, the actual mine output of non-reserved deposits is about 5 to 10 % higher than shown in the table.
Mine production of construction minerals in non-reserved deposits is as follows:
Mineral Unit 2002 2003 200� 2005 2006
Dimension.stone ths.m3 50 60 65 55 55
Crushed.stone ths.m3 900 .960 960 1.270 1.300
Sand.and.gravel ths.m3 �.200 �.�00 �.800 5.000 6.000
Brick.minerals ths.m3 120 180 330 220 300
Construction minerals
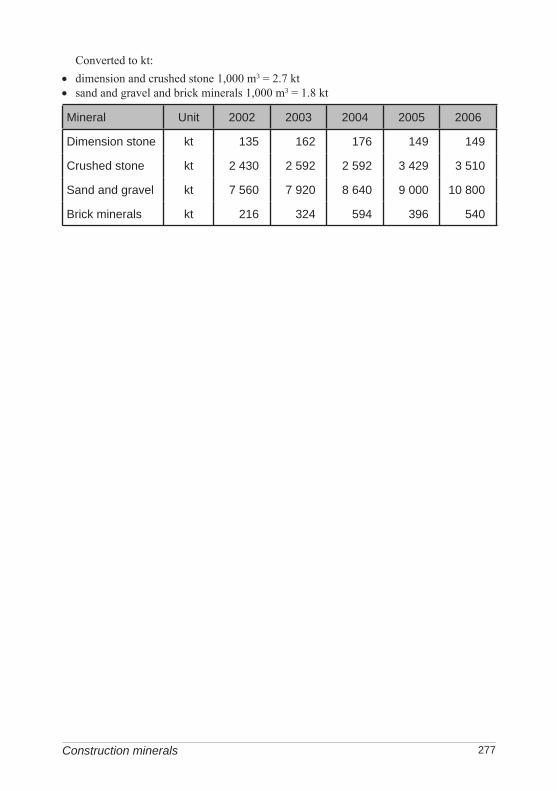
277
Converted to kt:• dimension and crushed stone 1,000 m3 = 2.7 kt• sand and gravel and brick minerals 1,000 m3 = 1.8 kt
Mineral Unit 2002 2003 200� 2005 2006
Dimension.stone kt 135 162 176 1�9 1�9
Crushed.stone kt 2.�30 2.592 2.592 3.�29 3.510
Sand.and.gravel kt 7.560 7.920 8.6�0 9.000 10.800
Brick.minerals kt 216 32� 59� 396 5�0
Construction minerals

278 Construction minerals
Dimension stone
1. Characteristics and useRock, which has been specially cut or shaped for use in buildings, curbing or other con-
struction or special use, is termed “dimension stone” or “decorative stone”. Architectural specifications for dimension stone concern primarily aesthetic qualities such as design, sur-face appearance, etc. Important requirements include mineralogical composition, strength, weather resistance, colourfastness, porosity, texture, structure, etc. Dimension stone in-cludes all kinds of solid rocks of magmatic, sedimentary or metamorphic origin which can be quarried in the form of blocks and which are suitable for cutting to specific dimensions. A weathered surface, altered or crushed zones or intercalation of unsuitable rocks represent undesirable imperfections.
2. Mineral resources in the Czech RepublicMostly deep-seated igneous rocks (predominantly granitoids), forming about 70 % of
exploited reserved deposits, are used as dimension stone in the Czech Republic at present. Their share of the total geological reserves is higher than 50 %. Their share of the total mine production of dimension stone is 65 % at reserved and 60 % at non-reserved deposits of dimension stone. Higher than 20 % share of the mine production at reserved deposits have shales and slates and about 8 % sandstones. In the case of non-reserved deposits, more than 30 % of the mine production is represented by sandstone. The share of marbles is low – around 1 %.Dimension stone used in buildings, curbing and other applications (paving cubes, curb
stones, guard stones, stairs etc.) mostly involves igneous rocks, much less other rocks (basalt columns, dike rocks). Deposits, similarly to those of crushed and broken stone, are bounded to the Central Bohemian Pluton and Moldanubian Pluton, the Nasavrky Massif, eventually other plutonic bodies of the Bohemian Massif (Štěnovice massif, Žulová Pluton, etc.).
Mostly marbles and plutonic rocks are exploited for architectural and sculpture dimen-sion stone production. Light granites and granodiorites, which occur in the Central Bohe-mian and Central Moldanubian plutons, the Štěnovice, the Krkonoše Mts.-Jizerské hory Mts., the Jeseníky Mts. and Nasavrky massifs in Bohemia, and in Třebíč and Žulová massifs in Moravia, are mostly used. Less important are dark igneous rocks – diabase, di-orite and gabbro, which also occur in the Central Bohemian Pluton, further in the Kdyně and the Lužice massifs. These rocks are used for wall lining (also polished), paving, for building of monuments and in sculpture, etc.
Neovolcanic rocks are not very suitable, apart from some trachytes of the České středohoří Mts. and Doupovské hory Mts., which are used in sculpture and as a polished lining.
Among sedimentary rocks in Bohemia, the most important are Cenomanian sandstones from the area east of Prague and from Hořice and Broumov regions. Less important are Triassic and red Permian sandstones from the Krkonoše Mts. Piedmont Basin. In Moravia, there are the Cretaceous Těšín sandstones or red Permian sandstones of the Tišnov region. Sandstones are used for production of cut and polished wall linings. Very

279Dimension stone
suitable are also Devonian limestones of the Barrandian area and of the Moravian Karst (wall lining, terrazzo, etc.). Pleistocene travertines, used for interior wall lining, terazzo and conglomerates, were quarried in the Přerov region. Slates of the Moravian–Silesian Paleozoic are used as lining, covering and paving material, and as expanded materials. Greywackes of the Culm were often used, too.
Crystalline limestones and dolomites – marbles – are the most widely used metamorphic rocks (polished wall linings, paving materials, terrazzo, conglomerates, and sculptures). Large deposits are in the Šumava region and the Czech part of the Moldanubicum, in the Krkonoše Mts.-Jizerské hory Mts. Crystalline Complex and the Orlické hory Mts.-Kłodzko Crystalline Complex, the Svratka Anticline, in the Silesicum, and in the Branná Group (Silesia). Proterozoic phyllites (slates) of the western Bohemia (the Střela valley) and the Železný Brod Crystalline Complex are used for roofing and wall lining (the waste as a filler). Serpentinites of Moravia and Western Bohemia are used, too.
3. Registered deposits in the Czech Republic(see map)There are many registered dimension stone deposits in the Czech Republic and therefore
they are not listed.
4. Basic statistical data of the Czech Republic as of December 31
Year 2002 2003 200� 2005 2006
Deposits.–.total.number 171 165 16� 163 162
. exploited 7� 75 72 73 72
Total.mineral.*reserves,.ths.m3. 197.576 198.263 197.503 192.98� 191.821
. economic.explored.reserves 8�.237 8�.656 8�.537 8�.287 83.667
. economic.prospected.reserves 68.771 69.081 68.��0 68.2�9 67.998
. potentially.economic.reserves ��.568 ��.527 ��.527 �0.��8 �0.156
Mine.production.in.reserved.deposits,.ths.m3. a) 235 2�� 273 288 2�2
Mine.production.in.non-reserved.deposits,.ths.m3. b) 50 60 65 55 55
* see NOTE on page 12 on a terminological difference between Czech official application of the term reserves and standard international application of the term
a) decrease of mineral reserves by mine productionb) estimate

280
Dim
ensi
on s
tone
min
ed.re
serv
ed.d
epos
its.(7
2).
unm
ined
.rese
rved
.dep
osits
.(90)
min
ed.n
on-r
eser
ved.
depo
sits
.(29)
unm
ined
.non
-res
erve
d.de
posi
ts.(3
8)
Construction minerals

281
5. Foreign trade2514 – Slate, also roughly worked or cut
2002 2003 200� 2005 2006
Import,.t 757 1.528 836 2.09� 5.376
Export,.t 8.520 26.�1� 50.13� 50.69� 56.668
Detailed data on slate exports (t)
Country 2002 2003 200� 2005 2006
Poland �.386 13.791 20.058 29.378 39.252
Ukraine 5�2 3.622 12.672 13.33� 10.291
Russia 780 6.211 11.182 �.166 2.530
Lithuania 2.202 165 �.66� 2.956 3.7�5
others 610 2.625 1.558 860 850
2515 – Marble, travertine, ecaussine and other calcareous stone
2002 2003 200� 2005 2006
Import,.t 1.063 1.038 1.203 1.168 1.516
Export,.t. 90 60 3� 21 �
Detailed data on marble imports (t)
Country 2002 2003 200� 2005 2006
Italy 282 193 358 517 536
Greece �93 380 250 �3 10
Croatia 0 79 �3 138 312
Spain 1 0 168 113 165
others 287 386 38� 357 �93
Dimension stone

282
2516 – Granite, porphyry, basalt, sandstone and other stone
2002 2003 200� 2005 2006
Import,.t 10.305 12.693 7.�23 8.6�0 8.016
Export,.t. 15.126 11.�86 10.0�3 11.392 7.588
Detailed data on granite e.o. imports (t)
Country 2002 2003 200� 2005 2006
Italy 1.311 2.1�8 1.387 1.150 1.�13
India 1.059 1.627 1.296 1.�85 1.118
South.Africa 873 827 1.357 1.535 911
others 7.062 8.091 3.383 �.�70 �.57�
Detailed data on granite e.o. exports (t)
Country 2002 2003 200� 2005 2006
Germany 10.602 8.008 8.315 10.2�1 6.776
Slovakia 1.985 1.�31 580 537 397
Poland 1.59� 980 3�5 359 200
others 9�5 1.067 803 255 215
6801 – Setts, curbstones and flagstones of natural stone (except slate)
2002 2003 200� 2005 2006
Import,.t 2.622 5.3�� 3.919 �.�87 2.336
Export,.t. 170.739 166.18� 125.789 123.759 116.193
6802 – Worked monumental and crushed stone (except slate) and stonework
2002 2003 200� 2005 2006
Import,.t 20.�91 22.�08 22.895 26.�28 29.957
Export,.t. �9.13� �8.520 �6.00� 5�.381 73.539
Construction minerals
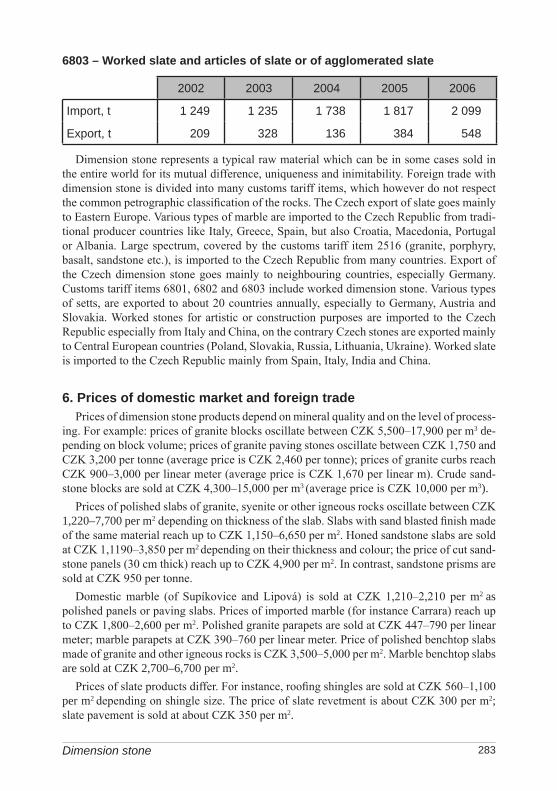
283
6803 – Worked slate and articles of slate or of agglomerated slate
2002 2003 200� 2005 2006
Import,.t 1.2�9 1.235 1.738 1.817 2.099
Export,.t. 209 328 136 38� 5�8
Dimension stone represents a typical raw material which can be in some cases sold in the entire world for its mutual difference, uniqueness and inimitability. Foreign trade with dimension stone is divided into many customs tariff items, which however do not respect the common petrographic classification of the rocks. The Czech export of slate goes mainly to Eastern Europe. Various types of marble are imported to the Czech Republic from tradi-tional producer countries like Italy, Greece, Spain, but also Croatia, Macedonia, Portugal or Albania. Large spectrum, covered by the customs tariff item 2516 (granite, porphyry, basalt, sandstone etc.), is imported to the Czech Republic from many countries. Export of the Czech dimension stone goes mainly to neighbouring countries, especially Germany. Customs tariff items 6801, 6802 and 6803 include worked dimension stone. Various types of setts, are exported to about 20 countries annually, especially to Germany, Austria and Slovakia. Worked stones for artistic or construction purposes are imported to the Czech Republic especially from Italy and China, on the contrary Czech stones are exported mainly to Central European countries (Poland, Slovakia, Russia, Lithuania, Ukraine). Worked slate is imported to the Czech Republic mainly from Spain, Italy, India and China.
6. prices of domestic market and foreign tradePrices of dimension stone products depend on mineral quality and on the level of process-
ing. For example: prices of granite blocks oscillate between CZK 5,500–17,900 per m3 de-pending on block volume; prices of granite paving stones oscillate between CZK 1,750 and CZK 3,200 per tonne (average price is CZK 2,460 per tonne); prices of granite curbs reach CZK 900–3,000 per linear meter (average price is CZK 1,670 per linear m). Crude sand-stone blocks are sold at CZK 4,300–15,000 per m3 (average price is CZK 10,000 per m3).
Prices of polished slabs of granite, syenite or other igneous rocks oscillate between CZK 1,220–7,700 per m2 depending on thickness of the slab. Slabs with sand blasted finish made of the same material reach up to CZK 1,150–6,650 per m2. Honed sandstone slabs are sold at CZK 1,1190–3,850 per m2 depending on their thickness and colour; the price of cut sand-stone panels (30 cm thick) reach up to CZK 4,900 per m2. In contrast, sandstone prisms are sold at CZK 950 per tonne.
Domestic marble (of Supíkovice and Lipová) is sold at CZK 1,210–2,210 per m2 as polished panels or paving slabs. Prices of imported marble (for instance Carrara) reach up to CZK 1,800–2,600 per m2. Polished granite parapets are sold at CZK 447–790 per linear meter; marble parapets at CZK 390–760 per linear meter. Price of polished benchtop slabs made of granite and other igneous rocks is CZK 3,500–5,000 per m2. Marble benchtop slabs are sold at CZK 2,700–6,700 per m2.
Prices of slate products differ. For instance, roofing shingles are sold at CZK 560–1,100 per m2 depending on shingle size. The price of slate revetment is about CZK 300 per m2; slate pavement is sold at about CZK 350 per m2.
Dimension stone

28�
2514 – Slate, also roughly worked or cut
2002 2003 200� 2005 2006
Average.import.prices.(CZK/t) 11.93� 8.827 5.339 3.120 2.�23
Average.export.prices.(CZK/t) 2.153 1.206 1.362 1.063 1.032
2515 – Marble, travertine, ecaussine and other calcareous stone
2002 2003 200� 2005 2006
Average.import.prices.(CZK/t) 10.258 13.120 17.3�7 12.907 16.2�1
Average.export.prices.(CZK/t) �.196 6.290 11091 28.8�8 23.977
2516 – Granite, porphyry, basalt, sandstone and other stone
2002 2003 200� 2005 2006
Average.import.prices.(CZK/t) 6.2�7 �.522 6.875 7.896 7.069
Average.export.prices.(CZK/t) 2.503 3.533 2.727 2.921 2.580
7. Mining companies in the Czech Republic (reserved deposits) as of December 31, 2006
REVLAN s.r.o., Horní BenešovGranit Lipnice s.r.o., Dolní MěstoSlezský kámen a.s., JeseníkHERLIN s.r.o., PříbramBohumil Vejvoda, obchodní činnost VEDA CS, Krakovany v ČecháchPrůmysl kamene a.s., PříbramMEDIGRAN s.r.o., PlzeňČeská žula s.r.o., StrakoniceCOMING PLUS a.s., Praha 4DCK – Družstvo cementářů a kameníků Holoubkov Bohemia, a.s.Q – GRANIT s.r.o., BlatnáGranit Málkov s.r.o., BlatnáGRANIO s.r.o., ChomutovLigranit s.r.o., LiberecJosef Máca ml. – Kamenososchařství, TřešťJindřich Zedníček, Kamenná
Construction minerals

285
Kámen Hudčice s.r.o.Obec StudenáRALUX s.r.o., UhelnáAnna Mrázová, MukařovGranit – Zach s.r.o., ProsetínKámen Ostroměř s.r.o.Krákorka a.s., Červený KostelecSLEZSKÁ ŽULA s.r.o., JavorníkLom Matula Hlinsko a.s.Těžba nerostů a.s., PlzeňKamenolom Nová Červená Voda s.r.o., PrahaPražský kamenoservis s.r.o., Praha 10Kamenoprůmyslové závody s.r.o., ŠluknovJIHOKÁMEN, výrobní družstvo, PísekLadislav Peller – Těžba a úprava surovin, Praha 4M.& H. Granit s.r.o., PlzeňCZECH – TRADING s.r.o., Rychnov nad KněžnouLucie Salavcová Babická, Vrchotovy JanoviceCHARLTON a.s., PrahaMšenské pískovce s.r.o., Mšené-lázněMax Boegl & Josef Krýsl k.s., SušiceK – Granit s.r.o., Jeseník
The most important mining organizations in non-reserved deposits as of December 31, 2006
HERLIN s.r.o., PříbramKOKAM s.r.o., KocbeřeRENO Šumava s.r.o., PrachaticeHERKU – kamenolomy s.r.o., SušiceK – Granit s.r.o., JeseníkLom Horní Dvorce s.r.o., StrmilovLom Studená, s.r.o., KolínProfistav s.r.o., LitomyšlObec StudenáJosef Máca ml. – Kamenosochařství, TřešťJiří Sršeň – TEKAM, ZámělLesostavby Frýdek - Místek, a.s.KAJA – TRADING, spol. s r.o., Praha
Dimension stone

286
Kamenolom Javorka s.r.o., Lázně BělohradIng. Danuše Plandorová, HážoviceAlfonz Dovičovič, HořiceKrákorka a.s., Červený KostelecJIHOKÁMEN, výrobní družstvo, Písek
8. World productionPrecise statistics on a worldwide basis are lacking, since often producers are not required
to record dimension stone production. Data when available are either given in tonnes or in m3. According to the USGS Mineral Yearbook, world production was estimated at 93 mill t in 2005. Main producers were China, India, Italy, Iran and Spain. These countries produced about 68 % of the world production. Annual production of the USA has been about 1.5 mill tonne in the recent years. Carbonate represents 38 %, granite 27 %, , marble 14 %, sandstone 13 %, slate 1 % and other types 7 % of the total amount. Annual production of the architectural and sculpture dimension stone in Poland has been oscillating between 600 and 1,100 ths m3. Mining production in Slovakia fluctuates between only 10 and 20 ths m3 per year (the only mined deposit Spišské Podhradie – travertine).
9. World market pricesPrices of dimension stone in international market depend on mineral quality and degree
of working. In general they are not officially published.
10. recyclingThe material is recycled to a limited extent (setts, worked slate, worked building stone
etc.).
11. possible substitutesIndividual types of dimension stone are mutually replaceable. Synthetic materials, ce-
ramics, metals, glass, etc can replace all types. However, an opposite tendency has been evident recently – a growing interest in natural materials.
Construction minerals
287
Crushed stone
1. Characteristics and useCrushed stone involve all kinds of solid magmatic, sedimentary, or metamorphic rocks,
which have suitable technical properties to be used in construction works. They must have certain physical and mechanical properties based on their origin, mineralogical and petro-graphic composition, structure, texture, secondary alterations, etc. The rocks are used in the form of quarried stone or mostly in the form of crushed and broken aggregates. Impurities are represented by fractured, crushed, weathered or altered zones, inclusions of technically unsuitable rocks, higher content of sulphur, amorphous SiO2, etc. The world resources are virtually inexhaustible.
2. Mineral resources in the Czech RepublicCommercially usable deposits of stone suitable for crushing can be found throughout the
Bohemian Massif, but much less frequently in its basin regions. Western Carpathians are rather poor in stone suitable for crushing.Volcanic rocks represent the major source of stone for production of crushed aggregates
in the Czech Republic. Deposits of paleovolcanic rocks (pre-Tertiary volcanites) occur only in the Barrandian area (suitable are also consolidated pyroclastics), in the Krkonoše Mts. Piedmont Basin and in the Intra-Sudetic Depression. They locally enclose also lay-ers or bodies of pyroclastic or altered rocks. Especially important are deposits of mafic rocks – spilites, diabases, etc. Among neovolcanic rocks (post-Cretaceous volcanites), mafic (especially basaltic) varieties appear to be the most important, too. They are most abundant in the České středohoří and Doupovské hory Mountains, less abundant in the neovolcanic area of the Bohemian Cretaceous Basin, eastern Sudetes and in the Železný Brod region. Share of basic volcanic rocks in the total mine production of crushed stone in the Czech Republic is higher than 30 %.
Igneous rocks (particularly granites and quartz-diorites) represent an important source of crushed stone. Various types of igneous rocks (including accompanying swarms of dike rocks) are quarried at many localities in the Central Bohemian Pluton, Central Moldanu-bian Pluton, the Železné hory Mts. Pluton (the Nasavrky Massif), the Brno Massif and in other plutonic bodies. Single deposits of dike rocks are of small importance. Share of deep-seated igneous rocks in the total mine production of crushed stone in the Czech Republic is about 18 %.
Among the sedimentary rock deposits there prevail the ones of consolidated clastic sedi-ments (siltstones, greywackes, etc.). Culmian greywackes of the Nízký Jeseník Moun-tains and the Drahanská vrchovina plateau are the most important source of crushed stone. Similar rocks also occur in the Proterozoic of the Barradian area, Moravian Devo-nian and the flysh belt of the Western Carpathians. Sedimentary rocks (mainly grey-wackes) make about 23 % of the crushed stone production in the Czech Republic.
Carbonates (the Lower Paleozoic of the Barrandian area, the Moravian–Silesian Devo-nian) and siliceous rocks (lydites or cherts in the Upper Proterozoic of the Plzeň region) represent deposits of chemical and organogenous origin.
Crushed stone

288
Regionally metamorphosed rock deposits, represented by crystalline schists or gneisses, which occur exclusively in crystalline complexes of the Bohemian Massif in Moldanu-bicum, Moravicum, Silesicum, crystalline areas of the Slavkovský les, West Sudetes etc. are of a high importance, too. Besides technologically very suitable rocks (orthogneisses, granulites, amphibolites, serpentinites, crystalline limestones, etc.) there occur also some less suitable rocks (mica-schists, paragneisses, quartzites).
Less important are deposits of contact metamorphosed rocks (hornfelses, schists) occur-ring along the contact of the Central Bohemian and the Nasavrky Plutons with Late Pro-terozoic and Paleozoic sediments. Metamorphosed (both regionally and contact) rocks contribute to more than 25 % in the total mine production of crushed stone.
A small proportion of suitable clays of the Cypris formation, representing the overburden of the Sokolov coal basin, have been used for expanded stone production (commercial name LIAPOR).
3. Registered deposits in the Czech Republic(see map)Because of the large number of crushed stone deposits in the Czech Republic, they are
not listed.
4. Basic statistical data of the Czech Republic as of December 31
Year 2002 2003 200� 2005 2006Deposits.–.total.number 336 329 32� 319 319
. exploited 169 169 168 169 170Total.mineral.*reserves,.ths.m3. 2.321.��� 2.338.03� 2.281.082 2.315.902 2.25�.873
. economic.explored.reserves 1.156.151 1.158.022 1.1�2.528 1.166.229 1.130.527
. economic.prospected.reserves
1.016.280 1.028.320 983.239 1.01�.798 996.531
. potentially.economic.reserves
1�9.013 151.692 155.315 13�.875 127.815
Mine.production.in.reserved.deposits,.ths.m3. a)
9.65� 11.210 11.966 12.822 1�.093
Mine.production.in.non-reserved.deposits,.ths.m3;. b)
900 960 960 1.270 1.300
* see NOTE on page 12 on a terminological difference between Czech official application of the term reserves and standard international application of the term
a) decrease of mineral reserves by mine productionb) estimate
Construction minerals

289
Cru
shed
sto
nem
ined
.rese
rved
.dep
osits
.(170
).
unm
ined
.rese
rved
.dep
osits
.(1�9
)
min
ed.n
on-r
eser
ved.
depo
sits
.(55)
unm
ined
.non
-res
erve
d.de
posi
ts.(1
52)
Crushed stone

290
5. Foreign trade251710 – pebbles, gravel, broken or crushed stone
2002 2003 200� 2005 2006
Import,.kt 126 1�� �55 �80 632
Export,.kt 290 32� 210 3�0 599
Definition of the item 251710 of the customs tariff clearly shows that not only crushed stone but also sand and gravel and other sand types are included in this item. However, especially in case of Slovakia the import does not concern crushed stone s.s. Customs tariff items in the group of construction materials characteristically overlap or they are not un-equivocally specified. Given data, as well as the territorial structure of foreign trade, should be understood rather as an information on trends rather than exact numbers.
Detailed data on crushed stone imports (kt)
Country 2002 2003 200� 2005 2006
Slovakia 98 117 397 397 553
Germany 7 6 26 62 38
Poland 17 17 19 16 31
other � � 13 5 10
Detailed data on crushed stone exports (kt)
Country 2002 2003 200� 2005 2006
Austria 221 281 190 196 25�
Slovakia 3 2 2 138 322
Germany 63 39 16 6 18
other 3 2 2 0 5
6. prices of domestic market and foreign trade251710 – pebbles, gravel, broken or crushed stone
2002 2003 200� 2005 2006
Average.import.prices.(CZK/t) 315 2�6 293 28� 236
Average.export.prices.(CZK/t) 169 197 266 23� 221
Construction minerals

291
Crushed stone prices oscillate depending on the rock quality, grain size and also on availability of the mineral in certain region. Size fraction 4–8 mm was offered at following prices in CZK/t: spilite – about 310, amphibolite – about 295, granite – about 290, gneiss and porphyry – about 288, granodiorite – about 282, greywacke – about 270, basalt – about 260, chert – about 250, limestone – about 215. In size fraction 8–16 mm, the prices in CZK/t were as a whole lower: spilite – about 280, amphibolite – about 245, basalt – 240, chert and gneiss – about 230, granodiorites – 227, greywacke – 224, granite – 222, porphyry – 213, limestone – about 185. Prices of crushed stone in size fraction 16–32 mm were still lower (in CZK/t): spilite – about 250, basalt – about 238, amphibolite – about 235, gneiss – about 225, chert and porphyry – about 220, granodiorite – 207, greywacke – about 200, granite – 187, limestone – about 180. Prices of crushed stone in size fraction 32–63 mm as a whole were between 163 and 219 CZK/t in 2006; the cheapest was again limestone and the most expensive spilite.
As classification according to the region concerns, prices of crushed stone have been higher in Liberec, South Bohemian and Pilsen Regions. Relatively low prices were noted in Moravian-Silesian, Olomouc and Karlovy Vary Regions.
7. Mining companies in the Czech Republic (reserved deposits) as of December 31, 2006
TARMAC CZ a.s., LiberecKAMENOLOMY ČR s.r.o., Ostrava – SvinovČeskomoravské štěrkovny a.s., MokráLom Jakubčice s.r.o.Kámen a písek s.r.o., Český KrumlovLomy s.r.o., BrnoHanson ČR a.s., Veselí nad LužnicíCOLAS CZ a.s., PrahaKÁMEN Zbraslav, spol. s.r.o.M – SILNICE a.s., PardubiceBerger Bohemia a.s., PlzeňSTONE s.r.o., kamenolom VšechlapyGranita s.r.o., SkutečMax Boegl & Josef Krýsl k.s., SušiceŠtěrkovny spol. s r.o., Dolní BenešovStavby silnic a železnic a.s., Praha 1DOBET s.r.o., Ostrožská Nová VesSHB s.r.o., BernarticeBasalt s.r.o., ZabrušanyKamenolom Císařský a.s., BrnoPIKASO s.r.o., Praha 4
Crushed stone

292
Kámen Brno, s.r.o.Žula Rácov s.r.o., BatelovLom Klecany, s.r.o., Praha 9ATS – Silnice s.r.o., ŠtěnoviceLOMY MOŘINA spol. s.r.o., MořinaROSA s.r.o., DrásovZAPA beton a.s., Praha 4RENO Šumava s.r.o., PrachaticeFormanservis s.r.o., NebřeniceŽelezniční průmyslová stavební výroba Uherský Ostroh, a.s.BES s.r.o., BenešovVít Karásek – VPAS, Ústí nad LabemSilnice Čáslav – Holding, a.s.František Matlák, MochovPETRA – lom Číměř, s.r.o.ZD Šonov u BroumovaEKOZIS, spol. s.r.o., ZábřehHUTIRA – OMICE, s.r.o., OmiceKozákov – družstvo, ZáhoříFroněk s.r.o., RakovníkPEDOP s.r.o., LipovecStavební recyklace s.r.o., SokolovLesostavby Šumperk, a.s.Weiss s.r.o., DěčínAgrostav Znojmo, a.s.JHF Heřmanovice spol. s.r.o.NATRIX a.s., BojkoviceCZ Lom Družec s.r.o., KladnoPavel Dragoun, ChebJosef Žirovnický, VlašimThorssen s.r.o., Kamenolom MladeckoKamenolom KUBO s.r.o., Malé ŽernosekyLibinská AGRO a.s., LibinaJan Hamáček – Stavby PrunéřovEKOSTAVBY Louny s.r.o.KATORGA s.r.o., Praha
Construction minerals

293
The most impotrant mining organizations in non-reserved deposits as of December 31, 2006
Sokolovská uhelná, právní nástupce, a.s., SokolovLOMY MOŘINA spol. s.r.o., MořinaSILNICE MORAVA s.r.o., KrnovKÁMEN Zbraslav, spol. s.r.o.Kamenolom Žlutava s.r.o.Mostecká uhelná a.s., MostKAMENOLOMY ČR s.r.o., Ostrava - SvinovSENECO, s.r.o., PolnáZUD, a.s., ZbůchZETKA Strážník a.s., StudenecTS služby, s.r.o., Nové Město na MoravěGranita, s.r.o., SkutečCOLAS CZ a.s., PrahaStavoka Kosice, a.s.RENO Šumava s.r.o., PrachaticeBAK a.s., TrutnovLB, s.r.o., MezirolíJihočeské lesy České Budějovice, a.s.Zemní a dopravní stavby Hrdý Milan, s.r.o., DobrnáLesostavby Frýdek Místek, a.s.EKOZIS spol. s.r.o., ZábřehValašské lesotechnické meliorace, a.s.Vojenské lesy a statky ČR, s.p., Praha 6Obec HošťálkováPetr Vaněk – Lomstav, Horní MaršovKATORGA s.r.o., PrahaKamena, výrobní družstvo BrnoLesy obcí Trhové Sviny a Besednice s.r.o.TATI s.r.o., Praha 6
8. World production Mining production of the crushed stone has not been individually monitored in the in-
ternational statistical reviews or it is reported together with sand and gravel under the term aggregates. According to the Raw Materials Supply Group at the European Commission, the annual production of the aggregates was about 2,500 mill t in the EU25 in 2004. Annual pro-duction of aggregates in Germany was roughly 480 mill t, about 400 mill t in France, about
Crushed stone

29�
440 mill t in Spain, about 200 mill t in Great Britain, about 70 mill t in Sweden and about 100 mill t in Finland. The Austrian production of the aggregates was 90 mill tonnes, in Belgium about 60 mill t, in Denmark 40 mill t, in the Netherlands about 70 mill t, in Ireland about 100 mill t, in Portugal 90 mill t, and in Hungary roughly 45 mill t, according to the same source. Polish production of the aggregates is about 90 mill t according to the Polish sources (25 mill t crushed stone, 65 mill t sand and gravel). Production of the crushed stone in Slovakia has been oscillating between 8 and 12 mill t per year.
9. World market prices Crushed stone is not traded on the international market. Trade exchange takes place
only between neighbouring countries. For this reason, quotes for this raw material are not published.
10. recyclingBecause of low prices of the mineral, recycling has been of minimum importance. Con-
struction waste can be recycled following crushing up, sorting and/or screening and washing. The “Association for recycling of building materials development” (Asociace pro rozvoj re-cyklace stavebních materiálů – ARSM) is active in the Czech Republic, which associates per-sons and organizations dealing with problems in waste building materials processing. Apart from other activities, the association regularly organizes expert seminars and popularises us-age of recycled building materials.
11. possible substitutesCrushed stone can be replaced, depending on their use and grade, by gravel sand, syn-
thetic aggregates, slag and various waste materials.
Construction minerals

295Sand and gravel
Sand and gravel
1. Characteristics and useSand and gravel belong to the principal construction minerals worldwide. Sand and
gravel represent loose sediments originated by transport and deposition of more or less reworked rock fragments of certain size (gravel e.g. 2 to 128 mm, sand e.g. 0.063 to 2 mm), which are products of the weathering of rocks. They consist mostly of pebbles and boulders of resistant rocks and minerals (quartz, feldspar, quartzite, granite, etc.), to a smaller extent of less resistant rocks and minerals (mostly of crystalline or metamorphic and sedimentary rocks). Sand and gravel also contain silty and clayey fractions. Major impurities are humus, clay intercalations, higher content of floatable particles and sulphur, high content of unsuit-able (as shape concerns) or weathered grains. Other impurities are opal, chalcedony, chert and diatomite – hydrous compounds of silicon react with alkalies from feldspars to form a siliceous gel, which adsorbs water and causes fracturing of concrete.
Gravel and sand deposits are common all over the world.The ultimate use of sand and gravel is determined by gravel particles size, their shape
and type and composition of particle forming minerals and rocks. Sand and gravel are used mostly in the building industry in concrete mixtures, as drainage and filtration layers, road base, fill, etc. Sand is used in the building industry in mortar and concrete mixtures, as a filler material in production of bricks, in plasters, as a filling of abandoned stopes in mines, etc.
2. Mineral resources of the Czech RepublicMost of the deposits in the Czech Republic are of the Quaternary age mainly of fluvial
origin, less often of fluviolacustrine, fluvioglacial, glaciolacustrine and eolian origin. Indus-trially exploitable deposits occur particularly in large river basins.The Labe (Elbe) River basin – deposits along the right bank of the middle course (im-
portant deposits for central and eastern Bohemia) and lower course are characterised by well rounded pebbles and boulders, varying ratio of gravel and sand and suitability for concrete mixtures. Other important deposits are in basins of the rivers Orlice and Ohře, along the lower course of the rivers Cidlina and Jizera, and along the middle course of the Ploučnice River. The material requires processing when used for concrete.
The Vltava River basin – important deposits are at lower course but there are common conflicts of interests. Important deposits are along the Berounka River, too. Major depos-its in the southern Bohemia occur along the Lužnice River. The right bank of the Nežárka River shows good prospects for extraction of sand and gravel.
The Morava River basin – along the upper and middle course of the Morava River there are deposits of gravel and sand with prevailing coarse fraction, which are after process-ing suitable for concrete mixtures. Deposits in the Hornomoravský úval (Upper Mora-vian Depression) contain abundant fine fractions. Reserves are parts of the flood plains; the material is suitable for road construction and for mortar mixtures. Important deposits of sand and gravel in southern Moravia occur along the middle and lower course of the Dyje River and its tributaries, particularly the Dyje–Svratka Depression and area around Brno (Svitava, Svratka).

296
The Odra River basin – important deposits of sand and gravel are at the middle course of the Opava River and near confluence of rivers Opava and Odra. The material is suitable for reinforcing of road shoulders and stabilization.Less important are deposits of glacial origin in northern Bohemia (the Frýdlant region)
and in the Ostrava and Opava regions. Aeolian sand of the Labe River basin and those located in southern Moravia are used mostly in mortar mixtures. Proluvial sediments of northern Bohemia, the Ostrava region, the Olomouc region, etc., are only of local impor-tance. Variable facies of Tertiary sand in the Cheb region, in north Bohemian and south Bohemian basins, in the Plzeň region (mortar sands), and particularly in Moravia (e.g. the Prostějov and Opava regions) is exploited more often. Weathered sandstones of the Bohemian and Moravian Cretaceous sediments and sand from washing of kaolin are used in construction works.
3. Registered deposits in the Czech Republic(see map)Because of their large number, deposits of sand and gravel are not listed.
4. Basic statistical data of the Czech Republic as of December 31
Year 2002 2003 200� 2005 2006Deposits.–.total.number 21� 211 210 211 209
. exploited 81 80 77 78 79Total.mineral.*reserves,.ths.m3 2.22�.061 2.202.�15 2.201.697 2.180.635 2.151.237
. economic.explored.reserves 1.183.0�1 1.187.283 1.178.�95 1.165.983 1.150.�63
. economic.prospected.reserves
78�.321 780.157 792.129 783.676 772.580
. potentially.economic.reserves
256.699 23�.975 231.073 230.976 228.19�
Mine.production.in.reserved.deposits,.ths.m3. a)
8.26� 9.105 8.859 9.075 9.110
Mine.production.in.non-reserved.deposits,.ths.m3;. b)
�.200 �.�00 �.800 5.000 6.000
* see NOTE on page 12 on a terminological difference between Czech official application of the term reserves and standard international application of the term
a) decrease of mineral reserves by mine productionb) estimate
Construction minerals

297
Sand
and
gra
vel
min
ed.re
serv
ed.d
epos
its.(7
9).
unm
ined
.rese
rved
.dep
osits
.(130
)
min
ed.n
on-r
eser
ved.
depo
sits
.(131
)
unm
ined
.non
-res
erve
d.de
posi
ts.(2
06)
Sand and gravel

298
5. Foreign trade250590 – Other sand (natural sand of all kinds, also coloured, except sand containing metals and except silica sand and quartz sand)
2002 2003 200� 2005 2006
Import,.kt 95 �� �2 73 52
Export,.kt 7 6 1 0 0
251710 – pebbles, gravel, broken or crushed stone
2002 2003 200� 2005 2006
Import,.kt 126 1�� �55 �80 632
Export,.kt. 290 32� 210 3�0 599
Detailed data on the territorial structure of import and export of the customs tariff item 251710 are given in chapter crushed stone. Volume of trade with item 250590 is negligi-ble.
6. prices of domestic market and foreign tradeSorted products of gravel-pits are markedly cheaper than washed products. Regional
prices of sorted products are very stable and do not show bigger differences (e.g. size frac-tion 0–4 mm: state average 88 CZK/t, average of South Moravian Region 89 CZK/t, aver-age of Central Bohemian region 88 CZK/t in 2006). In contrast, prices of washed products differ quite a lot depending on the region. Average price of the mined stone in size fraction 4–8 mm was about 210 CZK/t, size fraction 8–16 mm cost 199 CZK/t in 2006. The lowest prices were reached for instance in Central Bohemia, the highest in the Zlín region, where there is a deficit of construction materials resources.
7. Mining companies in the Czech Republic (reserved deposits) as of December 31, 2006
Českomoravské štěrkovny a.s., MokráKÁMEN Zbraslav, spol. s.r.o.LASSELSBERGER, a.s., PlzeňTARMAC CZ a.s., LiberecHolcim (Česko) a.s. člen koncernu, PrachoviceHanson ČR a.s., Veselí nad LužnicíGZ – SAND s.r.o., NapajedlaDružstvo DRUMAPO, NěmčičkyFrantišek Jampílek, Lázně Toušeň
Construction minerals

299
Václav Maurer, Lužec nad VltavouŠtěrkovny Olomouc a.s.DOBET s.r.o., Ostrožská Nová VesŠtěrkovny spol. s r.o., Dolní BenešovIng. František Čtverák, TišnovTVARBET Moravia a.s., HodonínPIKASO s.r.o., Praha 4ILBAU s.r.o, PrahaTEKAZ s.r.o., ChebTěžba štěrkopísku s.r.o., BrodekPrefa Pardubice a.s., Rosice nad LabemS-MOST s.r.o., Hradec KrálovéZemědělské obchodní družstvo Zálabí, OvčáryPísky – J. Elsnic s.r.o., PostoloprtyPískovna Sojovice, s.r.o.BUILDING SP s.r.o., SadskáKM Beta Moravia s.r.o., HodonínPískovna Černovice s.r.o., BrnoTAPAS Borek s.r.o., Stará BoleslavOldřich Psotka, Mikulovice u JeseníkaNZPK s.r.o., PodbořanyKAMENOLOMY ČR s.r.o., Ostrava-SvinovKaolin Hlubany, a.s.Ladislav Šeda, TurnovZechmeister s.r.o., ValticeLubomír Kruncl, TravčiceAgropodnik Humburky, a.s.Zemědělská společnost Kratonohy, a.s.Zemědělské obchodní družstvo BrništěMPC s.r.o., pískovna RačiněvesMiláček a spol. s.r.o., PoděbradyFrantišek Dvořák, Dolní DunajoviceBrněnské papírny s.p., Předklášteří
The most important mining companies in non-reserved deposits as of December 31, 2006
ZEPIKO, s.r.o., BrnoPískovny Hrádek, a.s., Hrádek nad Nisou
Sand and gravel

300
Vltavské štěrkopísky s.r.o., ChlumínFrantišek Jampílek, Lázně ToušeňGZ – Sand s.r.o., NapajedlaAGKV s.r.o., ŽatecREALMA s.r.o., ZlínLubomír Kruncl, TravčicePísek – Beton a.s., Veltruby-HradištkoPísek Žabčice, s.r.o.Rovina Písek a.s., Písek u Chlumce nad CidlinouAGRO Brno-Tuřany, a.s.MPC s.r.o., pískovna RačiněvesBudějovické štěrkopísky spol. s.r.o., VrábčeObec KonětopyPlzeňské štěrkopísky s.r.o., PlzeňMax Boegl & Josef Krýsl stavební a lomařská, SušiceAG Skořenice, a.s.SABIA s.r.o., Bohušovice nad OhříLadislav Šeda, TurnovACHP s.r.o., Hradec KrálovéBEST a.s., RybniceAgropodnik Humburky, a.s.Sušárna a.s., KratonohyHradecký písek a.s., BrnoPísník Kinský, s.r.o., Kostelec nad OrlicíStavby silnic a železnic a.s., Praha 1Pískovny Morava spol. s.r.o., BrnoZS Kratonohy a.s.META Servis s.r.o., ČernošiceAgrodružstvo Klas, Staré ŽdániceLadislav Peller – Těžba a úprava surovin, Praha 4Luděk Měchura, KyjovVratislav Matoušek, TurskoSTAVOKA Kosice a.s.Silnice Klatovy, a.s.Ing. Václav Luka, Český BrodAGROSPOL Hrádek, spol. s.r.o.ZEPOS a.s., Radovesice
Construction minerals

301
Mgr. Milan Roček, TurnovSlužby Frýdlant nad Ostravicí s.r.o.Ladislav Mazura, PístyObec PoliceSTAVOKA Hradec Králové, a.s.Pískovna Klíčany HBH s.r.o.Kobra Údlice, s.r.o.České štěrkovny spol. s r.o., PrahaObecní lesy Bludov s.r.o.Vlastimil Beran, Daleké DušníkyŠtěrkovna Zaječí s.r.o., Velké PavloviceIng. Milan Tichý – Inženýrské stavby VOKA, ZahrádkyTechnické služby města Strakonice s.r.o.Město BorohrádekTEZZAV spol. s r.o., PrahaIng. Josef Novák – NOBI, Praha 5Václav Merhulík, prodej a těžba písku, LetyUNIGEO a.s., Ostrava-Hrabová REALSTAV MB spol. s.r.o., Mladá BoleslavDOBET s.r.o., Ostrožská Nová VesPísky – Skviřín, s.r.o. TachovSpráva a údržba silnic Jihočeského kraje, České BudějoviceObec PolešoviceJF TAKO s.r.o., TatceIng. František Klika, KladnoJiří Zach, MarkvarticeObec MalhoticeIlona Hejzlarová, JetřichovJSK – Rozhraní, s.r.o.STAKUS – písek s.r.o., TachovLesy České republiky, s.p., Hradec KrálovéDopravní a zemědělské služby s.r.o., N. BystřiceJiří Bartoš, Dolní ÚjezdMORAS a.s., MoravanyŠtěrkopísky Milhostov s.r.o., SokolovRadomír Kopecký, Suchdol nad OdrouObec Senomaty
Sand and gravel

302
Obec Rabštejnská LhotaDemorecykla s.r.o., CítovZemědělské družstvo KokoryHYDROSPOL spol. s.r.o., Staré Město u BruntáluZD v PňovicíchTOP – PLYN s.r.o., BohušovVáclav Mašek, HýskovVHS Břeclav, s.r.o.Pražské vodovody a kanalizace a.s.II. severočeská stavební spol. s.r.o., OkounovJiří Řezáček, PostřekovVladislav Durczok – pískovna PetroviceTechnické služby města Úpice
8. World productionThe world production of sand and gravel is not statistically monitored. The annual pro-
duction of the USA was fluctuating between 700–1,300 mill t in the last ten years, reaching about 1,28 mill t in 2006. The production of all the EU states reached 1,115 mill t in 1995. The highest mine production in EU on a long-term states Germany (about 400 mill t per year), followed by France (about 200 mill t per year), Great Britain and Spain (both about 100 mill t) and Poland (about 65 mill t). The sand and gravel production in Slovakia oscil-lates roughly between 2 and 3 mill t per year.
9. World market pricesThe average prices of sand and gravel on the world market are not published. In the
USA, prices of sand and gravel were oscillating between USD 5.07 and 6.15 per tonne in 2002–2006.
10. recyclingSimilar to all construction minerals, recycling is problematic and is important for con-
crete only.
11. possible substitutesCrushed aggregate, artificial aggregate, slags, etc can replace coarser fractions of sand
and gravel. Finer fractions, i.e. sand, cannot be replaced because of reduced strength of the final products. Substitution of sand and gravel on large scale is questionable also from the economic point of view.
Construction minerals

303
Brick clays and related minerals
1. Characteristics and useMinerals for production of bricks are all varieties of minerals applicable to a brick manu-
facturing separately or in a mixture. For this purpose following types of rocks are used: loess, loams, clays and claystones, marls, weathered shales, etc. The brick manufacturing material itself (under common term “brick clay”) contains two main components – plastic and non-plastic (grog) in correct proportions either directly in the material, or alternative-ly their optimum ratio can be reached by their mixing. The prevailing component in the mixture forms the base whereas the complementary component, which is correcting the properties of the base, serves as a plasticizing agent or a non-plastic component. Harmful substances in brick minerals are mostly carbonates, gypsum, siderite, organic matter, larger fragments of rocks, etc.
Deposits of brick minerals are common all over the world and usually they are not reg-istered.
2. Mineral resources of the Czech RepublicQuaternary loams of various origins prevail among brick minerals in the Czech Repub-
lic. Mostly pre-Quaternary sediments represent the source of corrective minerals.• Deposits of Quaternary brick minerals (loess and loess-loam, loam, sand, sandy-clayey
residues) are common all over the country and they are mined extensively. The most important of them are formed by sediments of aeolian, deluvio-aeolian or glacial origin (northern Bohemia and Silesia). Impurities in aeolian sediments are represented by bur-ied soil horizons, clastics and calcareous nodules, in deluvial sediments by detritus of hard rocks. Aeolian materials are suitable (usually in a mixture) for production of exact-ing thin-walled elements. Deluvial materials can be used as corrective components for more plastic soils, or directly for production of thick-walled brick elements.
• Neogene pelites are a common pre-Quaternary brick mineral in the Bohemian limnic ba-sins and in the Vienna Basin. They are characterized by sandy intercalations and locally also by a higher content of montmorillonite or clastics, in the Vienna Basin and the Car-pathian Foredeep also by a higher content of soluble salts. They have been exploited for a very long period of time. They are suitable also for production of exacting thin-walled bearing and shaped elements.
• Paleogene claystones (also calcareous) are exploited in eastern and south-eastern Mora-via. They represent weathered parts of flysh layers of outer nappes of the Western Car-pathians. Efflorescence-forming salts and layers of sandstones are their major harmful substances. They are used for production of solid or perforated bricks.
• Upper Cretaceous clays and claystones (often calcareous) are used as the base in brick manufacturing material in areas of the Bohemian Cretaceous Basin and in South Bohe-mian Basins. Marl, marlstone and sand are used as corrective materials. The material is suitable for production of the most demanding perforated bricks and ceiling elements. In southern Bohemia, because of contamination by limonitized sandstone, it can be used only for production of less demanding building elements.
Brick clays

30�
• Permocarboniferous pelites and aleuropelites are used for brick production in Permocar-boniferous basins and grabens of Bohemia and Moravia. These deposits are character-ized by the occurrence of sandstones and by complex structure. The minerals can be used also for production of roof tiles and thin-walled elements.
• The Late Proterozoic and Early Paleozoic weakly weathered slates and their residues are used around Prague, in the Plzeň and Rokycany regions, etc. Harmful substances are clastics and pyrite. They are not suitable for production of exacting bricks.
3. Registered deposits in the Czech Republic(see map)There are large numbers of brick mineral deposits registered in the Czech Republic
and thus they are not listed in this overview. Their distribution over the Czech territory is rather uneven and consequently in some regions there is a shortage of these minerals (e.g. Českomoravská vrchovina Highlands).
4. Basic statistical data of the Czech Republic as of December 31
Year 2002 2003 200� 2005 2006
Deposits.–.total.number 156 1�� 1�3 1�� 1�1
. exploited �� �1 �0 39 33
Total.mineral.*reserves,.ths.m3. 588.523 58�.108 567.069 571.1�� 566.217
. economic.explored.reserves 253.675 2�8.��� 238.�08 232.879 229.270
. economic.prospected.reserves 2�9.679 2�6.312 2�1.152 2�1.390 2�0.315
. potentially.economic.reserves 85.169 89.352 87.509 96.875 96.632
Mine.production.in.reserved.deposits,.ths.m3. a) 1.525 1.626 1.55� 1.5�3 1.286
Mine.production.in.non-reserved.deposits,.ths.m3. b) 120 180 330 220 290
* see NOTE on page 12 on a terminological difference between Czech official application of the term reserves and standard international application of the term
a) decrease of mineral reserves by mine productionb) estimate
Domestic production of selected intermediate products
Year 2002. 2003 200� 2005. 2006
Burnt.bricks.(kt) 1.27� 1.320 1.379 1.�50 1.317
Burnt.roof.tiles.(kt) 22� 226 20� 2�2 N
Construction minerals
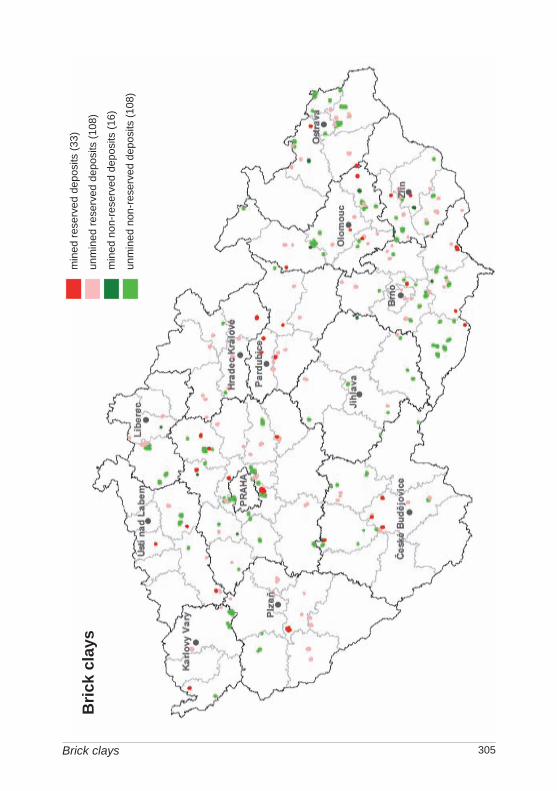
305
Bric
k cl
ays
min
ed.re
serv
ed.d
epos
its.(3
3)
unm
ined
.rese
rved
.dep
osits
.(108
)
min
ed.n
on-r
eser
ved.
depo
sits
.(16)
unm
ined
.non
-res
erve
d.de
posi
ts.(1
08)
Brick clays

306
5. Foreign trade690410 – Building bricks
2002 2003 200� 2005 2006
Import,.t �2.15� 95.712 213.831 17�.275 209.19�
Export,.t. 102.775 89.6�3 23.262 6.�87 25.185
Detailed data on building bricks imports (t)
Country 2002 2003 200� 2005 2006
Germany 29.�89 �0.629 108.238 61.819 1��.588
Austria �00 7.�57 62.915 8�.095 �0.795
Poland 2.111 �0.339 27.26� 15.737 9.�91
Belgium �.789 �.552 7.283 7.879 7.900
others 5.365 2.735 8.131 �.7�5 6.�20
690510 – roof tiles
2002 2003 200� 2005 2006
Import,.t 6.5�6 7.291 12.087 10.890 12.96�
Export,.t. 83.618 112.2�5 102.697 93.578 82.1�8
Detailed data on roof tiles exports (t)
Country 2002 2003 200� 2005 2006
Germany 3�.258 50.767 38.079 29.168 2�.776
Slovakia 19.388 2�.365 31.7�1 37.113 29.981
Poland 23.372 2�.957 20.23� 17.208 19.�90
Austria 6.260 8.163 7.853 7.582 6.851
others 3�0 3.993 �.790. 2.507 1.050
They are not the brick minerals which are traded on foreign market but goods with higher value added, i.e. final products (bricks, roof tiles). Trading partners are nevertheless mainly neighbouring countries. A typical feature of foreign trade with bricks is that the Czech Republic turned into a pure importer from exporter in 2002–2004. Contrastingly, roof tiles export has been roughly twice as high then their import in the long term.
Construction minerals

307
6. prices of domestic market and foreign tradePrice of brick clays on domestic market has been about CZK 500/t. Clay (for tennis courts)
is offered at CZK 1,050–1,800 per tonne. Prices of full bricks oscillate between CZK 5.00 and 10.50 a piece depending on their quality (especially resistance against frost) and producer. The average price is CZK 5.20/piece. Lightened full bricks were sold at about CZK 5.00 a piece. Honeycomb bricks were sold at CZK 6.00–12.00 a piece, on average for CZK 10.00 a piece. The average price of drain tiles was CZK 5.40–11.50/piece according to diameter; the average price of ceiling drain tiles was CZK 14.70–18.80/piece. Roof tiles are sold at CZK 13.00–27.50 a piece. Brick blocks “Porotherm” are offered at CZK 50.00 a piece. Evolution of the average import and export prices are contained in the following tables.
690410 – Building bricks
2002 2003 200� 2005 2006
Average.import.prices.(CZK/t) 2.150 1.�1� 1.�60 1.858 1.�72
Average.export.prices.(CZK/t) 1.125 97� 1.350 1.5�5 1.216
690510 – roof tiles
2002 2003 200� 2005 2006
Average.import.prices.(CZK/t) 6.818 6.626 �.637 �.329 5.687
Average.export.prices.(CZK/t) �.890 �.707 �.717 �.57� �.558
7. Mining companies in the Czech Republic (reserved deposits) as of December 31, 2006
WIENERBERGER Cihlářský průmysl a.s., České BudějoviceHELUZ cihlářský průmysl, v.o.s., Dolní BukovskoTONDACH Česká republika s.r.o., HraniceCihelna Kinský s.r.o., Kostelec nad OrlicíCihelny KRYRY a.s., PlzeňCihelna Hodonín s.r.o.Cihelna Vysoké Mýto s.r.o.Zlínské cihelny s.r.o., ZlínCihelna Polom, s.r.o.Cihelna Hlučín s.r.o., OstravaPARALAX a.s., Praha 8Cihlářský závod v Horkách nad Jizerou, s.r.o.Sofron Trade a.s., Plzeň
Brick clays

308
Bratři Řehounkové – cihelna Časy s.r.o.LASSELSBERGER, a.s., Plzeň
The most important mining organization in non-reserved deposits as of December 31, 2006
WIENERBERGER cihelna Jezernice, spol. s.r.o.WIENERBERGER Cihlářský průmysl, a.s., České BudějoviceBohumil Křesťan, BohdalovSTAMP s.r.o, NáchodGEOPOS spol. s.r.o., DřínovVlastimil Bělák, cihelna BořinovIng. Jiří Hercl, cihelna Bratronice, KyšicePARALAX a.s., Praha 8
8. World productionProduction of brick clays is not recorded on the global scale. The annual mine production
in Slovakia oscillates roughly between 300 and 600 ths m3, in Poland it has been between 2.5 and 3.5 mill m3 during the last five years.
9. World market pricesBrick clays and related minerals are not subjects of the world trade.
10. recyclingBrick clays and related minerals cannot be recycled, but the final products – bricks, tiles
and blocks – can be reused. It is possible to recycle construction detritus and mixed con-struction waste (for instance recycled material “Remexit”).
11. possible substitutesIn production of conventional brick elements, brick minerals are irreplaceable. Other
types of bricks can be produced from other materials (e.g. calcareous-acid bricks, sintered light ashes, foamed concrete), of course. In such a case, various natural and artificial materi-als (quartz, lime, powder aluminium, artificial aggregates, cinder and flue ashes of thermal power plants, tailings, etc.) can be used as substitutes.
Construction minerals

309
METallIC OrES – geological reserves and mine production
Deposits of Mn, Cu, Pb, Zn, Ag, Sn, W, Li, Au and Ge were registered in the Register to 31. 12. 2006 on the Czech territory. Geological reserves of metallic ores represent mostly potentially economic resources. More significant volume of economic reserves was pre-sented only for gold bearing ores. As the most common metal ores concerns, there were no deposits of Al, Ti and Cr ores mined in the history and no deposits occurred on the Czech territory.
There is a very old tradition of ore mining on the territory of the Czech Republic. The oldest archaeological evidence on gold panning dates back to the 9th century B.C. In the Middle Ages Bohemia became the centre of European gold, silver and tin mining. Con-tinued mining activities have nearly exhausted the resources. With a few exceptions (e.g. the Au-W deposit of Kašperské Hory), only low-grade ores remain on the territory of the Czech Republic. The mining industry´s last boom occurred in the cold war period after 1948, when ore deposits were exploited, even at considerable economic loss, to ensure the independence of the communist state from mineral imports from western countries. After 1989 there were many closures and cutbacks; with the closure of mining in the polymetal-lic deposit with gold Zlaté Hory, the mining of metallic ores on the territory of the Czech Republic terminated in 1994. State subventions for closure programs directed towards so-cial costs, technical liquidations, health and safety activities (maintenance) and reclamation exceeded CZK 2.6 billion in 1990–2006.
All deposits of Fe ores, Ni ores and Sb ores, majority of Ge ores deposits, a large number of Cu ore, base metal (Pb, Zn, Ag) and Sn-W ores deposits were revaluated and gradually eliminated from The Register in the course of the revaluation carried out since 1993. Major-ity of small deposits of scheelite W ores was eliminated from the Register in 2006.
A steady increase in prices of basic ores (Cu, Pb, Zn, Sn, Ni and Al) and Ag has been observed since 2003. Prices of Fe and W have been increasing since 2004 and 2005, respec-tively. The most important rise show prices of Cu, W, Pb and Zn, to a lesser extent Fe, Pb, Al, Ag, Sn, Mn and Ni. Prices of rare metals such as Pt and Au have increased significantly, too. Aside the trend stands Pd, the price of which steeply increased more than three times by the end of 2000. Its price decreased back to the original level the next year and has been rather stable since then.
The Au-W ores deposit Kašperské Hory, from the European viewpoint exceptionally large and rich, is the most important and perspective ore deposit in the Czech Republic. Large deposits mineable by open pits like e.g. Mokrsko or Vacíkov are very promising at present high Au prices, too. Exploitation of all these deposits is however excluded at present time due to the unsolvable conflicts with the nature protection.

310
Iron
1. Characteristics and useThe highest concentrations of iron ores are associated with the Precambrian sedimentary
formations, which represent the largest world source of hematite and magnetite ores. Deposits of magnetite also originate either by segregation of magnetite in mafic magmatic bodies or through contact metasomatic processes. Iron ores are mostly formed by hematite Fe2O3 and magnetite Fe3O4 containing up to 72 % Fe, in less extent by limonite Fe2O3.nH2O (48–63 % Fe), eventually siderite FeCO3 (48,3 % Fe) and sometimes also by another minerals such as Fe-silicates (27–38 % Fe). Over 90 % of mining production has been obtained by surface mining. World reserves are estimated at 800,000 mill tonnes of ores.
Iron ores are used for the production of pig iron either in the form of crude lump ore or in the form of fines or sintered or pelletized concentrates. Modern technologies of iron manufac-turing such as DRI process, COREX®, etc. enable the use of fines and concentrates without sintering or pelletization.
A very small amount of iron is used for other than metallurgical purposes, such as heavy media, and the manufacture of cement, ferrites, feed, colouring agents, etc.
2. Mineral resources of the Czech RepublicThere are no economically exploitable iron ore deposits in the Czech Republic. Ores
occurring on the territory of the republic are of a low grade, altogether having Fe contents below 40 % and in the majority of cases workable by underground mining. Deposits of much richer ores with Fe contents around 50 % and more are exploited mainly by open pit mining in the world at present. The average grade of iron ores traded on the world market is 60 % and more. The availability of much higher-quality and relatively cheaper iron ores from import led to gradual cessation of iron ore mining on the territory of the Czech Repub-lic. At the same time, reserves of these ores were gradually eliminated from The Register as completely non-economic.Sedimentary iron ores occur in the Barrandian. These are Paleozoic ores of marine origin
in sediments of the Ordovician age. The deposits have mostly a form of rather extensive lenses. The ores consist mainly of hematite, siderite and Fe-silicates (leptochlorites). The content of iron is on average 25 to 30 %. Oolitic texture and high SiO2 content character-ize these ores. These ores were intensively mined on many sites (e.g. Nučice, Ejpovice, Mníšek pod Brdy, Zdice etc.) mainly in the 19th and the first half of the 20th century. The mining was definitely terminated in the beginning of the 1960s and the remaining reserves of all the sedimentary deposits of Fe in the Czech Republic were written off from the Reg-ister in 1997–1999.
Volcano-sedimentary deposits of the Lahn-Dill type occur in the Moravian–Silesian Devonian. The ores containing mainly hematite, magnetite and to a lesser extent Fe-sili-cates form smaller lense-shaped bodies, which are often intensively folded. Magnetite ores had average Fe contents around 35 to 40 % Fe; ores with predominance of hematite slightly lower (about 30 %). The ores were mined on many places (Medlov, Benkov, Králová, Horní Město etc.). Mining activity reached its climax in the 19th century and it
Metallic ores

311
was definitely terminated in the mid-sixties of the 20th century. All remaining reserves of deposits of the Lahn-Dill type were written off the Register in 1997–1999.
Small magnetite lenses are typical of skarns of the Moldanubicum (Vlastějovice, Županovice, Malešov, Budeč etc.) and Saxothuringicum (Měděněc, Přísečnice, Kovářská) of the Bohemian Massif, Krkonoše Mts.-Jizerské hory Mts. crystalline unit etc. Fe contents of the ores were mainly about 33 to 38 %. The mining activity was ter-minated largely already in the sixties, at Přísečnice and Měděnec deposits in 1992. The remaining reserves of these deposits were to a large extent cancelled before the 1990s.
Other genetic types of Fe mineralization were of only a marginal importance. This con-cerned for instance banded ores of Sydvaranger type (Sobotín et al.), hydrothermal ores (Krušné hory Mts. et al.), stratabound (Hraničná et al.), sedimentary (except the Ordovi-cian ones), residual, metasomatic ores etc.Iron ore deposits were mined in the past (peak in the 19th and beginning of the 20th
century) on a large scale and the ore was dressed at high cost and used mostly for pig iron production. This applies particularly for low-grade and siliceous sedimentary ores of the Barrandian, which were thermally treated through the Krupp-Renn process. Magnetite was mostly – and in 1970s to 1990s almost exclusively – used for other than metallurgic purposes, such as for production of cement (heavy concrete), as a heavy medium of jigs in coal processing plants, etc.
3. Registered deposits and other resources in the Czech Republic (see map)Principal areas of deposits presence:
1 Barrandian 3 Krušné hory Mts. (Erzgebirge Mts.) Crystalline Complex
2 Silesicum + Moravo-Silesian Devonian 4 Moldanubicum
4. Basic statistical data of the Czech Republic as of December 31
Year 2002 2003 200� 2005 2006
Deposits.–.total.number 2 1 0 0 0
. exploited 0 0 0 0 0
Total.mineral.*reserves,.kt.ores 21.000 1�.770 0 0 0
. economic.explored.reserves 0 0 0 0 0
. economic.prospected.reserves 11.520 11.520 0 0 0
. potentially.economic.reserves 9.�80 3.250 0 0 0
Mine.production,.kt.Fe 0 0 0 0 0
* see NOTE on page 12 on a terminological difference between Czech official application of the term reserves and standard international application of the term
Iron

312
exha
uste
d.de
posi
ts.a
nd.o
ther
.reso
urce
sIro
n
Metallic ores

313
Domestic production of selected intermediate products
Year/ths.t 2002. 2003 200� 2005. 2006
Pig.iron �.8�0 5.207 5.385 �.627 5.192
Crude.steel 6.512 6.783 7.033 6.189 6.862
Rolled.stock 6.019 6.261 6.395 5.782 6.268
Tubes 639 70� 706 707 775
Source: HUTNICTVÍ ŽELEZA a.s.
Crude iron productionVysoké pece Ostrava a.s. (filial of Mittal Steel)Třinecké železárny a.s.
Steel production and processing Mittal Steel Ostrava a.s. (Ispat – Nová huť)Třinecké železárny a.s. Vítkovické železárny –Vítkovice Steel a.s.FERROMET GROUP s.r.o. (železárny Hrádek, Veselí a Chomutov)Vítkovice Heavy Mashinery a.s.ŠKODA TVC s.r.o. ŽDB a.s. Mittal Steel Ostrava a.s. represents the largest metallurgical enterprise in the Czech Re-
public. Its production includes long products, flat products, tubes and engineering prod-ucts. Steel works of the Mittal Steel a.s. produce about 3 million tonnes of steel per year. Třinecké železárny a.s. makes crude iron and steel long rolled products. It was founded already in 1839. It has about one-third share in present steel production in the Czech Re-public. Vítkovice Steel a.s. produces namely crude steel both noble and not, long products, thick plates, iron bars and rolled material. This company represents the biggest Czech pro-ducer of thick plates.
FERROMET GROUP s.r.o. operates three steel works which re-process iron scrap – Železárny Hrádek a.s. (rolled and drawn steel), Železárny Veselí a.s. (drawn steel) and Železárny Chomutov a.s. (drawn steel). Vítkovice Heavy Machinery a.s. produces castings, ingots, steel constructions, machines, equipment and investment units of heavy engineering. ŠKODA TVC s.r.o. (Škoda Plzeň) is engaged in metal working and metal components production. ŽDB a.s. produces shaped iron and iron bars, ingots, steel wire ropes, steel lining of tyres and wire netting. This company represents an important central European producer of high-C and low-C wires.
Iron
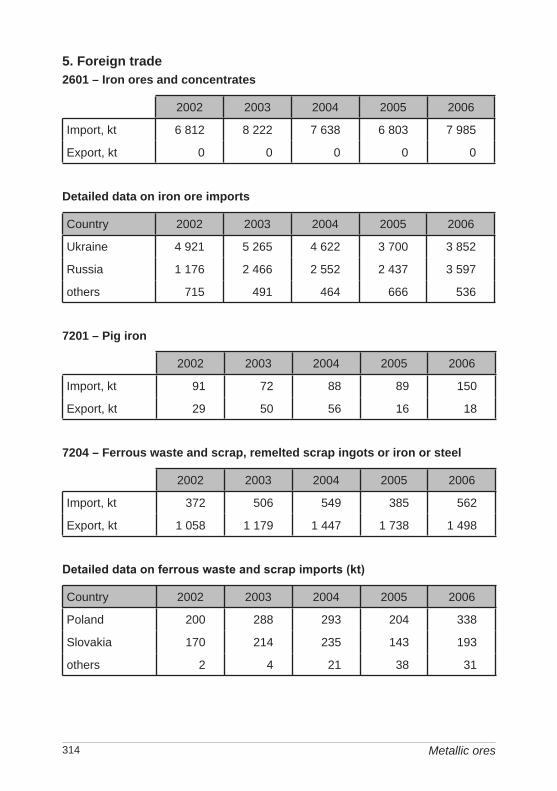
31�
5. Foreign trade2601 – Iron ores and concentrates
2002 2003 200� 2005 2006
Import,.kt 6.812 8.222 7.638 6.803 7.985
Export,.kt 0 0 0 0 0
Detailed data on iron ore imports
Country 2002 2003 200� 2005 2006
Ukraine �.921 5.265 �.622 3.700 3.852
Russia 1.176 2.�66 2.552 2.�37 3.597
others 715 �91 �6� 666 536
7201 – pig iron
2002 2003 200� 2005 2006
Import,.kt 91 72 88 89 150
Export,.kt 29 50 56 16 18
7204 – Ferrous waste and scrap, remelted scrap ingots or iron or steel
2002 2003 200� 2005 2006
Import,.kt 372 506 5�9 385 562
Export,.kt 1.058 1.179 1.��7 1.738 1.�98
Detailed data on ferrous waste and scrap imports (kt)
Country 2002 2003 200� 2005 2006
Poland 200 288 293 20� 338
Slovakia 170 21� 235 1�3 193
others 2 � 21 38 31
Metallic ores

315
Detailed data on ferrous waste and scrap exports (kt)
Country 2002 2003 200� 2005 2006
Germany �5� 523 80� 1.133 830
Austria �71 500 3�5 276 3�2
Poland �0 82 195 172 210
Slovakia 82 61 58 27 29
Italy 0 1 18 85 68
others 11 12 27 �5 19
The Czech Republic imports 7–8 mill t of iron ores per year, mainly from Ukraine and Russia. Whereas volume of import from Ukraine predominated in the past, the ratio was more or less balanced in 2006. Ferrous waste and scrap represents the second most impor-tant item. Export of this item is 2–4 times higher than import, which shows that in this case the secondary raw material in not economically used. That is to say that iron production from ferrous waste and scrap represents savings of about 60 % of energy compared to pro-duction from iron ore. Ferrous waste and scrap is exported mainly to Germany and Austria, and imported namely from Poland and Slovakia.
6. prices of domestic market and foreign trade2601 – Iron ores and concentrates
2002 2003 200� 2005 2006
Average.import.prices.(CZK/t) 1.0�7 988 1.7�8 1.867 1.716
Average.export.prices.(CZK/t) N N N N N
7204 – Ferrous waste and scrap, remelted scrap ingots or iron or steel
2002 2003 200� 2005 2006
Average.import.prices.(CZK/t) 2.813 3.�75 5.671 5.�76 5.59�
Average.export.prices.(CZK/t) 3.23� �.086 6.119 �.261 6.�67
Import prices of iron ore increased significantly during the year 2004, when the average nominal import prices almost doubled from 30–40 USD/t to 70–90 USD/t. Import price increase reflected the rise of iron ore world prices.
Iron

316
7. Mining and processing companies in the Czech Republic as of December 31, 2006
As in the preceding years, no mining companies were extracting iron ores in the Czech Republic in 2006.
8. World productionWorld production of iron ores rose since the 1930s’ average of approx. 100 million
tonnes to exceed the 1 bill t level by the mid 1990s. It stagnated for the next ten years and has recently increased sharply. The increase is related to an important increase of pig iron and steel consumption in populated, rapidly developing countries (China, India, Brazil et al.). The limit of 1.5 billion tonnes was overstepped according to some sources in 2005. Based on a preliminary data, world production increased by about 10 % between the years 2005 and 2006.
World mine production of iron ores
Year 2002 2003 200�. 2005 2006
Mine.production,.mill.t.(according.to.MCS) 1.080 1.160 1.3�0 1.5�0 1.690
Mine.production,.mill.t.(according.to.WMS) 1.115 1.237 1.363 N N
Main producers’ share in the world mine output (2005, according to MCS):
China 27.3 % Russia 6.3 %Brazil 18.2 % Ukraine 4.5 %Australia 17.0 % USA 3.5 %India 9.1 % South Africa 2.6 %
Brazil and Australia reached also high share in the world export of iron ores.
World production of pig iron
Year 2002. 2003. 200�. 2005 2006.e
Production,.mill.t.(according.to.MCS) 60� 6�7 712 825 858
Production,.mill.t.(according.to.IISI) 611 670 72� 792 871
Production,.mill.t.(according.to.WMMR) 65� 718 773 N N
Metallic ores

317
Main producers of pig iron (2005, according to MCS):
China 40.0 % USA 4.5 %EU 13.0 % Brazil 4.0 %Japan 10.1 % Ukraine 3.8 %Russia 5.8 %
World production of steel
Year 2002. 2003. 200�. 2005 2006.e
Production,.mill.t.(according.to.MCS) 90� 962 1.050 1.130 1.200
Production,.mill.t.(according.to.IISI) 90� 969 1.067 1.132 1.239
Production,.mill.t.(according.to.WMMR) 90� 969 1.057 N N
Main producers of crude steel (2005, according to MCS):
China 30.9 % Russia 5.8 %EU 16.5 % Rep. of Korea 4.2 %Japan 10.0 % Ukraine 3.5 %USA 8.4 %
According to the International Iron and Steel Institute (IISI), following companies ranked among the ten biggest world producers of crude steel in 2006: Arcelor Mittal, Nippon Steel, JFE, POSCO, Baosteel, US Steel, Nucor, Tangshan, Corus Group and Riva Group. These 10 companies covered about 25 % of the world production of crude steel.
9. World market pricesPrices of the European market are quoted in FOB for calendar year in USc/mtu. The final
price of 1 tonne of the ore is a multiple of the unit price in mtu and the metal content in the relevant ore. Prices FOB are being established with regard to shipping costs of the major importers in order to maintain similar prices of ores having a similar grade in CFR North Sea ports. This is why the FOB prices of ores of similar grade of suppliers from various regions differ from each other.
A steep increase in world iron ore prices occurred in 2004, as a result of an elevated demand from the side of China, which, though the biggest world producer, has become an important iron ore importer recently, too. Companhia Vale do Rio Dolce (CVDR) company, the biggest world producer of iron ores, announced in February 2005, that it concluded an agreement on raw material supply for Japan (Nippon Steel Corporation), Taiwan and Aus-tralia at prices by 71.5 % higher than those of the year 2004. Prices reached 79.58 USc/mtu (Carajás Lump) and even 115.51 USc/mtu (Blast Furnace Pellets) in the first half of the year 2005. Total year-on-year rise in iron ore prices was 70–90 %.
Iron
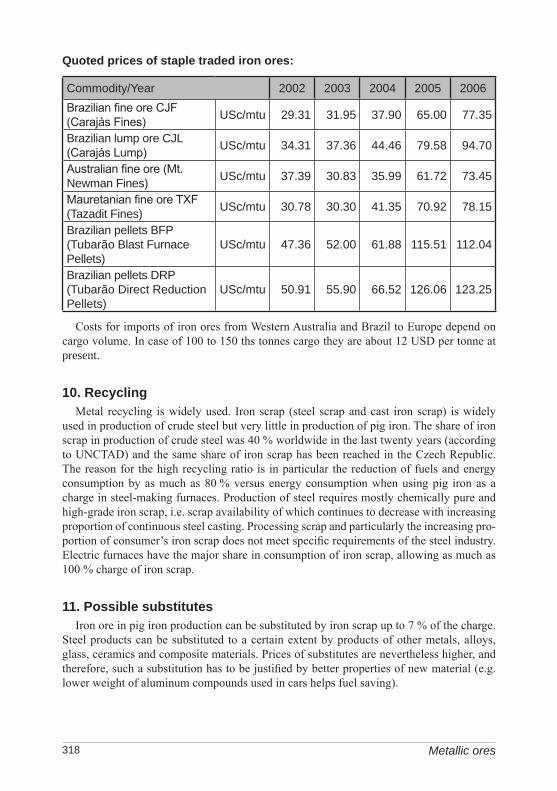
318
Quoted prices of staple traded iron ores:
Commodity/Year 2002 2003 200� 2005 2006Brazilian fine ore CJF (Carajás Fines) USc/mtu 29.31 31.95 37.90 65.00 77.35
Brazilian.lump.ore.CJL.(Carajás Lump) USc/mtu 3�.31 37.36 ��.�6 79.58 9�.70
Australian fine ore (Mt. Newman.Fines) USc/mtu 37.39 30.83 35.99 61.72 73.�5
Mauretanian fine ore TXF (Tazadit.Fines) USc/mtu 30.78 30.30 �1.35 70.92 78.15
Brazilian.pellets.BFP.(Tubarão.Blast.Furnace.Pellets)
USc/mtu �7.36 52.00 61.88 115.51 112.0�
Brazilian.pellets.DRP.(Tubarão.Direct.Reduction.Pellets)
USc/mtu 50.91 55.90 66.52 126.06 123.25
Costs for imports of iron ores from Western Australia and Brazil to Europe depend on cargo volume. In case of 100 to 150 ths tonnes cargo they are about 12 USD per tonne at present.
10. recyclingMetal recycling is widely used. Iron scrap (steel scrap and cast iron scrap) is widely
used in production of crude steel but very little in production of pig iron. The share of iron scrap in production of crude steel was 40 % worldwide in the last twenty years (according to UNCTAD) and the same share of iron scrap has been reached in the Czech Republic. The reason for the high recycling ratio is in particular the reduction of fuels and energy consumption by as much as 80 % versus energy consumption when using pig iron as a charge in steel-making furnaces. Production of steel requires mostly chemically pure and high-grade iron scrap, i.e. scrap availability of which continues to decrease with increasing proportion of continuous steel casting. Processing scrap and particularly the increasing pro-portion of consumer’s iron scrap does not meet specific requirements of the steel industry. Electric furnaces have the major share in consumption of iron scrap, allowing as much as 100 % charge of iron scrap.
11. possible substitutesIron ore in pig iron production can be substituted by iron scrap up to 7 % of the charge.
Steel products can be substituted to a certain extent by products of other metals, alloys, glass, ceramics and composite materials. Prices of substitutes are nevertheless higher, and therefore, such a substitution has to be justified by better properties of new material (e.g. lower weight of aluminum compounds used in cars helps fuel saving).
Metallic ores

319
Manganese
1. Characteristics and useManganese is one of the most abundant elements in the Earth´s crust and it forms easily
various compounds in nature due to its chemical character. There are two principal types of manganese deposits – marine chemical sediments and deposits of oxidation zone enriched in manganese. The former type represents the majority of known reserves of manganese. Re-sources occurring in the Earth’s crust are equal to 3,630 mill tonnes, of which reserves of high grade ore having over 44 % Mn represent 500 to 600 mill tonnes. Projected resources con-fined to deep-sea nodules having an average content of 25 % Mn represent about 358 million tonnes of metal. Among 300 known manganese minerals only 12 are principal constituents of economic deposits. The following are the most important: pyrolusite, psilomelane, manganite, braunite and hausmannite. Manganese world reserves are estimated at 805 mill tonnes. Man-ganese contents in traded ores range between 35 and 54 %.
More than 90 % of manganese is used for production of manganese ferro-alloys for the iron industry, both in production of pig iron and particularly in the steel industry as a des-ulphurizing and deoxidizing agent, and as an important alloying metal. The average world consumption of manganese is 10 kg in 1 tonne of crude steel, in up-to-date steelworks the minimum is 6 kg. Manganese is also used in alloys with non-ferrous metals (Al, Cu, Ti, Ag, Au, Bi). Another applications are in the manufacture of dry batteries, colouring agents, soft ferrites, fertilizers, feed for animals, fuel additives, welding electrodes, water treatment, etc. Manganese raw materials are classified into metallurgical, chemical and batteries grades, based on the quality of ores or concentrates required in the main uses.
2. Mineral resources of the Czech Republic The Czech Republic has no Mn ore reserves other than the Chvaletice deposit with low-
grade ores, exploitation of which is problematic. Mn contents in currently mined ores in the world are about 30–50 % in primary, mainly metamorphic ores, and significantly over 10 % in sedimentary ores. The most significant accumulations of Mn ores are known from the Železné hory Mts.
area, where they are confined to volcano-sedimentary deposits of the Proterozoic. The mineralization is associated with a horizon of graphitic-pyritic slates, which have been metamorphosed together with neighbouring rocks. The ore horizon extending from Chvaletice to Sovolusky is composed of a mixture of Mn and Fe carbonates (mainly Fe-rhodochrosite), quartz, graphite and Fe-sulphides. Silicates of Mn originated during the regional metamorphic processes. The ore contains up to 13 % Mn.
Major mining operations were executed at the Chvaletice deposit. First, only Fe ores of the gossan type (since the 17th century) and since World War I also experimentally Mn ores were mined on the outcrops. Pyrite was mined from the 1950s until the termination of mining operations in 1975 as a raw material for the chemical industry. Mn ores were extracted along with pyrite but due to incomplete technology were not processed and were deposited in tailing ponds at the former mineral processing plant. An average Mn content in the tailing pond No 3 is 9–11 % and in the tailing ponds No 2 and 3 between 5 and 8 %. Desulphurization of combustion products could represent a potential use of these ores.
Manganese

320
Other occurrences of Mn ores in the Czech Republic (e.g. Horní Blatná, Arnoštov, Maršov near Veverská Bítýška et al.) were not of any economic importance.
3. Registered deposits and other resources in the Czech Republic(see map)Registered deposits and other resources are not mined
1 Chvaletice 2 Chvaletice-tailing ponds Nos 1 & 2 3 Řečany-tailing pond No 3
4. Basic statistical data of the Czech Republic as of December 31
Year 2002 2003 200� 2005 2006
Deposits.–.total.number 3 3 3 3 3
. exploited 0 0 0 0 0
Total.mineral.*reserves,.kt.ores 138.801 138.801 138.801 138.801 138.801
. economic.explored.reserves 0 0 0 0 0
. economic.prospected.reserves 0 0 0 0 0
. potentially.economic.reserves 138.801 138.801 138.801 138.801 138.801
Mine.production,.kt.Mn 0 0 0 0 0
* see NOTE on page 12 on a terminological difference between Czech official application of the term reserves and standard international application of the term
No ferro-alloys were produced in the Czech Republic in 2006. The most important pro-ducer of ferro-alloys in the central European region is OFZ a.s., formerly Oravské ferozli-atinárske závody Istebné, in Slovakia. This company produces a large assortment of ferro-alloys on the basis of manganese, silicon and chromium – FeMnC, FeSiMn, FeSi 45%, FeSi 65%, FeSi 75%, FeSiCa, FeCrC.
Huta Łaziska S.A. in Poland (ferrosilicium, ferrosilicomanganese) and Treibacher In-dustrie AG in Austria (ferrovanadium, ferromolybdene) belong to important ferro-alloys producers in the Central Europe region.
5. Foreign trade2602 – Manganese ores and concentrates
2002 2003 200� 2005 2006
Import,.t 11.507 11.966 11.665 13.8�6 1�.375
Export,.t 163 33 558 5� �5
Metallic ores
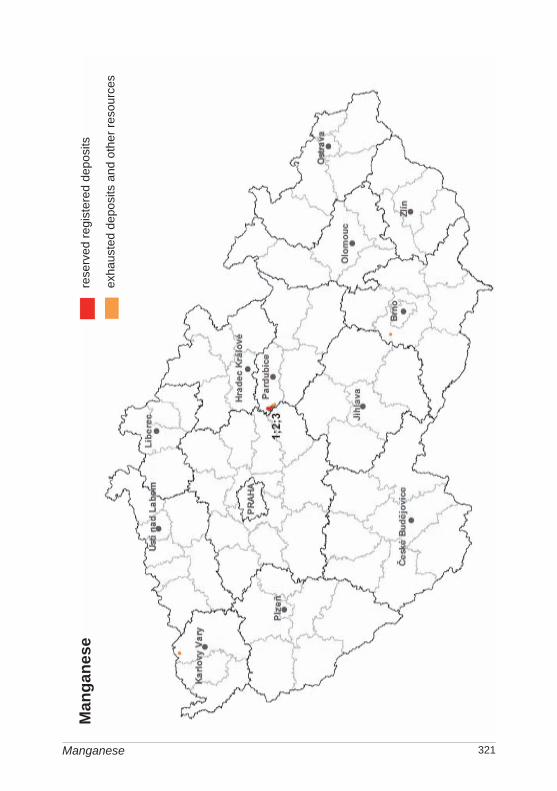
321
Other occurrences of Mn ores in the Czech Republic (e.g. Horní Blatná, Arnoštov, Maršov near Veverská Bítýška et al.) were not of any economic importance.
3. Registered deposits and other resources in the Czech Republic(see map)Registered deposits and other resources are not mined
1 Chvaletice 2 Chvaletice-tailing ponds Nos 1 & 2 3 Řečany-tailing pond No 3
4. Basic statistical data of the Czech Republic as of December 31
Year 2002 2003 200� 2005 2006
Deposits.–.total.number 3 3 3 3 3
. exploited 0 0 0 0 0
Total.mineral.*reserves,.kt.ores 138.801 138.801 138.801 138.801 138.801
. economic.explored.reserves 0 0 0 0 0
. economic.prospected.reserves 0 0 0 0 0
. potentially.economic.reserves 138.801 138.801 138.801 138.801 138.801
Mine.production,.kt.Mn 0 0 0 0 0
* see NOTE on page 12 on a terminological difference between Czech official application of the term reserves and standard international application of the term
No ferro-alloys were produced in the Czech Republic in 2006. The most important pro-ducer of ferro-alloys in the central European region is OFZ a.s., formerly Oravské ferozli-atinárske závody Istebné, in Slovakia. This company produces a large assortment of ferro-alloys on the basis of manganese, silicon and chromium – FeMnC, FeSiMn, FeSi 45%, FeSi 65%, FeSi 75%, FeSiCa, FeCrC.
Huta Łaziska S.A. in Poland (ferrosilicium, ferrosilicomanganese) and Treibacher In-dustrie AG in Austria (ferrovanadium, ferromolybdene) belong to important ferro-alloys producers in the Central Europe region.
5. Foreign trade2602 – Manganese ores and concentrates
2002 2003 200� 2005 2006
Import,.t 11.507 11.966 11.665 13.8�6 1�.375
Export,.t 163 33 558 5� �5
Man
gane
sere
serv
ed.re
gist
ered
.dep
osits
exha
uste
d.de
posi
ts.a
nd.o
ther
.reso
urce
s
Manganese

322
Detailed data on manganese ore imports (t)
Country 2002 2003 200� 2005 2006
Ukraine 5.360 6.�83 2.6�2 9.721 �.559
Georgia 0 1.583 6.292 510 5.673
the.Netherlands 2.6�0 2.538 2.15� 3.�32 1.978
Australia 2.�05 610 �8 5 11
South.Africa 1 0 0 7 1.881
others 1.101 752 529 171 273
720211; 720219 – Ferro-manganese
2002 2003 200� 2005 2006
Import,.t 21.055 2�.15� 27.028 31.728 32.357
Export,.t 233 533 2.032 �.089 �.113
720230 – Ferrosilicomanganese
2002 2003 200� 2005 2006
Import,.t 26.130 55.989 59.361 58.1�2 57.856
Export,.t 331 50 2.0�0 9.320 9.122
Detailed data on ferrosilicomanganese imports (t)
Country 2002 2003 200� 2005 2006
Slovakia 5.001 31.610 30.62� 27.852 33.�86
Ukraine 13.002 12.053 10.769 20.026 12.355
Norway 7.666 1.986 2.020 1.815 2.13�
Romania 0 5.166 6.950 1.095 0
Poland 1�� 0 7.32� �.579 1.017
others 317 5.17� 1.67� 2.775 8.86�
Metallic ores

323
8111 – Manganese and articles thereof, including waste and scrap
2002 2003 200� 2005 2006
Import,.t 376 386 593 629 67�
Export,.t 0 � 9 2� 5
2820 – Manganese oxides
2002 2003 200� 2005 2006
Import,.t 1.660 1.386 888 787 1.316
Export,.t 223 238 318 29� �15
Ferrosilicomanganese import, oscillating steadily between 55 and 60 t per year in the last years, represents the most important volume. Ferrosilicomanganese has been imported namely from Slovakia, Ukraine and Norway. Ferromanganese is imported to the Czech Republic in about a half volume of c. 30 kt per year. Manganese ores represent a tradition-ally important item; between 11.5 and 14.5 t is imported annually, mainly from Ukraine and the Netherlands. Import of manganese ores from Georgia has been gaining importance in recent years, whereas the import of the Australian raw material was terminated.
6. prices of domestic market and foreign trade2602 – Manganese ores and concentrates
2002 2003 200� 2005 2006
Average.import.prices 5.713 5.289 5.50� 5.702 �.960
7. Mining companies in the Czech Republic as of December 31, 2006No mining companies were extracting manganese ores in the Czech Republic in 2006.
8. World productionProduction of manganese ores moves in line with the production of iron ores, because
their consumption is connected with the production of pig iron and steel. The individual yearbooks differ significantly as the estimates of the world production concerns: whereas mine production of about 8–10 mill tonnes was given in Mineral Commodity Summaries (MCS), the mine production was considerably higher in individual years according to the Welt Bergbau Daten (WBD).
Manganese

32�
Year 2002. 2003 200�. 2005 2006.e
Mine.production,.kt.Mn.(MCS) 8.100 8.200 9.350 10.500 11.000
Mine.production,.kt.Mn.(WBD) 12.133 12.621 13.26� 13.916 N
Main producers’ share in the world mine output (2005; according to MCS):
South Africa 20.0 % China 10.5 %Brazil 15.1 % Ukraine 7.3 %Australia 13.8 % India 6.1 %Gabon 12.3 %
Operating technologies of manganese nodules offshore mining were by the end of the 2006 at disposal in France, Japan, Germany, the USA, Russia, Republic of Korea, India and China. Czech Republic as a member of the international Interoceanmetal (IOM), established in 1987 with the main aim to utilize mineral resources from the seabed, has one fifth share in about 75,000 km2 IOM lease of the ocean bottom in the north-eastern part of the tectonic zone Clarion–Clipperton in the subtropical part of the northern Pacific, where nodules with promising contents of Mn, Cu, Co, Ni but also Zn, Pb, Mo et al. occur.
9. World market pricesBasically three types of manganese ore are traded on the world market – metallurgical
ore (38 to 55 % Mn), raw material with a content of 48–50 % Mn as a standard for produc-tion of manganese ferro-alloys, and chemical and battery grade ores with 70 to 85 % Mn. Only metallurgical ore of grade 48–50 % Mn with maximum 0.1 % P is quoted on a long-term basis on the world market. The price is quoted on an USD/mtu basis CFR Europe. Fi-nal price of 1 tonne of ore is a multiple of the unit price in mtu and the metal content in the relevant ore. E.g. at price of 2.03 USD/mtu for 48 % manganese ore of metallurgical grade the final price is 97.44 USD/t. The price in the eighties fluctuated on average around USD 1.5 per mtu until 1988. Then price increased and reached its peak in 1990 and 1991 (USD 4 per mtu). Since this period the prices had been decreasing for a number of years. The major cause was decline in market demand owing to a world economic recession and continuous reduction of Mn content in pig iron. The change didn’t come until during the year 2005 in relation to price rise of iron ores and other metal commodities. The average prices of the given manganese ore grade at year-end:
Commodity/Year 2002 2003 200� 2005 2006metallurgical.ore.of.grade.�8–50.%.Mn.with.maximum.0.1.%.P,.CFR.Europe
USD/mtu 1.99 1.99 1.97 2.�0 2.60
Metallic ores

325
10. recyclingRecycling of manganese is of only minor importance because of easy availability and
relatively low price of primary manganese raw materials. Only scrap from iron and non-fer-rous metals production and particularly steel slag rich in Mn in form of MnO and MnS are recycled to a certain extent. Manganese from used electric dry batteries is also recycled to a lesser extent.
11. possible substitutesNo substitute for manganese in principal areas of use exists. In steel manufacture, other
deoxidising additives – silicon, aluminium, complex alloys and rare earth elements – can substitute it to a certain extent, conditioned by economic parameters.
Manganese

326
Copper
1. Characteristics and useCopper deposits can be divided into five main groups (according to their origin) – por-
phyry copper deposits with Mo, stratiform, stratabound (sulphides in greenschists), mag-matic with Ni (Pt) and vein deposits. About one half of known mined Cu deposits belong to porphyry type. Among 300 known Cu minerals only a few sulphides are of economic importance: chalcopyrite, covellite, Cu-pyrite, chalcosine, bornite and enargite. Economic world reserves of Cu in ore are estimated at 0.3 billion tonnes, reserves of Cu in deep-sea nodules are estimated at 0.7 billion tonnes.
Much copper is used in electricity and electronics uses (50 %), in the engineering (20 %) and building industries. Important amount of copper is used in alloys, particularly in brass and bronze.
2. Mineral resources of the Czech RepublicThere are no economically exploitable Cu ore deposits in the Czech Republic. Cu ores of
various genetic types occur here and were exploited in the past. Major mining activities were focused on volcanosedimentary sulphide deposits of the
Zlaté Hory mining district. The mineralization is associated with the spilite-keratophyre volcanism and is localized in volcanosedimentary complex of the Vrbno Formation of the Devonian. Individual types of local ores – Cu monometallic, complex Cu-Pb-Zn with Au and Pb-Zn – occur separately in space and show a certain zonation. About 50 % of the economic reserves have been confined to complex ores, 25 % to monometallic, and 25 % to Pb-Zn ores. Monometallic ores consist of chalcopyrite with varying admixture of pyrite or pyrrhotite. Their grade ranges between 0.4 % and 0.7 % Cu. These ores were mined at deposits Zlaté Hory-jih and Zlaté Hory-Hornické skály. Mining of these ores at the Zlaté Hory deposit was terminated in 1990. 5,808 kt of ore containing 34,741 t of copper were mined in 1965–1990 period.
Stratabound monometallic Cu ores (chalcopyrite) confined to a low-grade metamor-phosed volcanosedimentary complex were discovered and their reserves evaluated and explored in the former deposit of Tisová near Kraslice. Mining of local ores, having about 1 % Cu, was terminated in 1973. A mineral exploration project was then executed in the ore district in the eighties, but mining was not resumed and the deposit was tem-porarily flooded.
Less important Cu mineralizations and/or Cu-Zn-Pb ores of stratabound type pyrite for-mation are known at numerous localities of the Bohemian Massif (e.g. Staré Ransko, Křižanovice, Svržno).
• Hydrothermal (vein) Cu deposits (Rybnice, Rožany, Tři Sekery) and sedimentary Cu ores (Krkonoše Mts. Piedmont Basin) were of a historical importance only. A very poor deposit Horní Vernéřovice–Jívka was exploited here in 1958–1965.Mining of Cu ores in the Czech Republic was terminated in 1990 and the deposits have
been gradually eliminated from The Register.
Metallic ores

327
3. Registered deposits and other resources in the Czech Republic(see map)Registered deposits and other resources are not mined
Reserved registered deposits:
1 Křižanovice 3 Újezd u Kasejovic 5 Zlaté Hory-východ2 Kutná Hora 4 Zlaté Hory-Hornické Skály
Exhausted deposits and other resources:
6 in Krušné hory Mts. (Erzgebirge Mts.) and Tisová
8 in Krkonoše Mts. Piedmont Basin and Intrasudetic Basin
7 Tři Sekery and surroundings 9 Staré Ransko
4. Basic statistical data of the Czech Republic as of December 31
Year 2002 2003 200� 2005 2006
Deposits.–.total.number. a) 7 5 5 5 5
. exploited 0 0 0 0 0
Total.mineral.*reserves,.kt.Cu 111 51 51 51 51
. economic.explored.reserves 0 0 0 0 0
. economic.prospected.reserves 0 0 0 0 0
. potentially.economic.reserves 111 51 51 51 51
Mine.production,.kt.Cu 0 0 0 0 0
* see NOTE on page 12 on a terminological difference between Czech official application of the term reserves and standard international application of the term
Note:a) deposits with registered Cu content
Copper and copper alloys processingMěď Povrly, a.s.Kovohutě Čelákovice, a.s.Kovohutě Rokycany, a.s.Slévárna Vysoké Mýto s.r.o.Měď Povrly a.s. located in northern Bohemia close to Ústí nad Labem is engaged in cop-
per and brass (copper-zinc base alloys) processing into rolled intermediate products. The company produces wires, bars, tubes and other products from copper and brass. These prod-ucts are used e.g. in the production of imitation jewellery and fancy goods, artistic objects,
Copper

328
Cop
per
rese
rved
.regi
ster
ed.d
epos
its
exha
uste
d.de
posi
ts.a
nd.o
ther
.reso
urce
s
Metallic ores
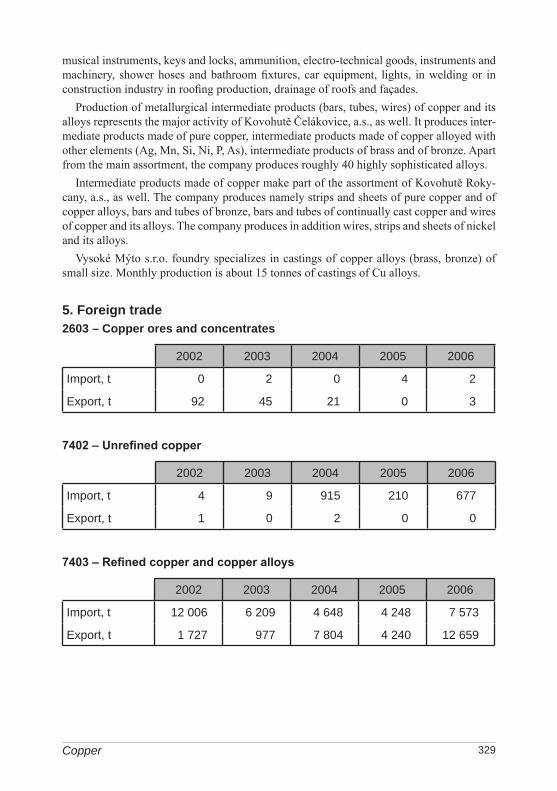
329
musical instruments, keys and locks, ammunition, electro-technical goods, instruments and machinery, shower hoses and bathroom fixtures, car equipment, lights, in welding or in construction industry in roofing production, drainage of roofs and façades.
Production of metallurgical intermediate products (bars, tubes, wires) of copper and its alloys represents the major activity of Kovohutě Čelákovice, a.s., as well. It produces inter-mediate products made of pure copper, intermediate products made of copper alloyed with other elements (Ag, Mn, Si, Ni, P, As), intermediate products of brass and of bronze. Apart from the main assortment, the company produces roughly 40 highly sophisticated alloys.
Intermediate products made of copper make part of the assortment of Kovohutě Roky-cany, a.s., as well. The company produces namely strips and sheets of pure copper and of copper alloys, bars and tubes of bronze, bars and tubes of continually cast copper and wires of copper and its alloys. The company produces in addition wires, strips and sheets of nickel and its alloys.
Vysoké Mýto s.r.o. foundry specializes in castings of copper alloys (brass, bronze) of small size. Monthly production is about 15 tonnes of castings of Cu alloys.
5. Foreign trade2603 – Copper ores and concentrates
2002 2003 200� 2005 2006
Import,.t 0 2 0 � 2
Export,.t 92 �5 21 0 3
7402 – Unrefined copper
2002 2003 200� 2005 2006
Import,.t � 9 .915 210 677
Export,.t 1 0 2 0 0
7403 – Refined copper and copper alloys
2002 2003 200� 2005 2006
Import,.t 12.006 6.209 �.6�8 �.2�8 7.573
Export,.t 1.727 977 7.80� �.2�0 12.659
Copper

330
Detailed data on refined copper and copper alloys imports (t)
Country 2002 2003 200� 2005 2006
Germany �.�26 3.191 1.�02 1.731 �.115
Poland �.891 1.9�7 1.9�� 1.3�2 1.017
Austria 803 567 88� 91 11�
Russia 555 �9 0 382 1.200
Italy 25 136 233 66 26
others 1.306 319 185 636 1.101
7404 – Copper waste and scrap
2002 2003 200� 2005 2006
Import,.t 1.656 2.080 �.027 6.09� 8.338
Export,.t 38.212 36.87� �5.571 5�.198 57.396
Detailed data on copper waste and scrap imports (t)
Country 2002 2003 200� 2005 2006
Slovakia 271 365 1.380 2.073 �.650
Russia 975 1.159 1.621 2.��5 1.�51
Germany 292 �28 732 528 �8�
Austria 6� 50 � 212 1.207
Hungary 9 0 191 769 376
others �5 78 99 67 170
Metallic ores

331
Detailed data on copper waste and scrap exports (t)
Country 2002 2003 200� 2005 2006
Germany 25.�59 23.811 2�.926 27.09� 33.809
Slovakia 3.515 2.727 �.306 5.760 5.3�9
Austria �.215 3.579 3.750 3.708 �.119
Italy 3.177 �.065 2.151 1.70� �.�23
Belgium 1.211 1.582 2.616 5.390 �.1�3
China 0 25� 1.875 3.660 1.758
others 635 856 5.9�7 6882 3.795
Foreign trade with refined copper, copper alloys and copper waste and scrap is the most important of the above given items of the customs tariff. Unrefined copper has been im-ported traditionally from Germany and Poland. Copper waste and scrap migrates from the East to the West, similarly to other non-ferrous metals. Amount of the copper waste leav-ing the Czech Republic is alarming (about 50 kt in 2005–2006). Recent years have seen a gradual shift of the main traded volume from unrefined metal and intermediate products to final copper products (wires, sheet metal, rods etc.)
6. prices of domestic market and foreign trade740311 – copper cathodes and sections of cathodes unwrought
2002 2003 200� 2005 2006
Average.import.prices.(CZK/t) 53.138 �8.221 66.938 81.329 138.869
Average.export.prices.(CZK/t) 5�.199 N 70.788 82.123 1��.661
740321 – copper-zinc base alloys, unwrought
2002 2003 200� 2005 2006
Average.import.prices.(CZK/t) 79.85� 190.86� 82.075 86.257 17�.992
Average.export.prices.(CZK/t) 80.326 110.109 59.7�1 60.702 97.088
740322 copper-tin base alloys, unwrought
2002 2003 200� 2005 2006
Average.import.prices.(CZK/t) �21.665 667.091 383.785 355.912 233.653
Average.export.prices.(CZK/t) 8�.�29 156.925 67.120 90.763 113.971
Copper
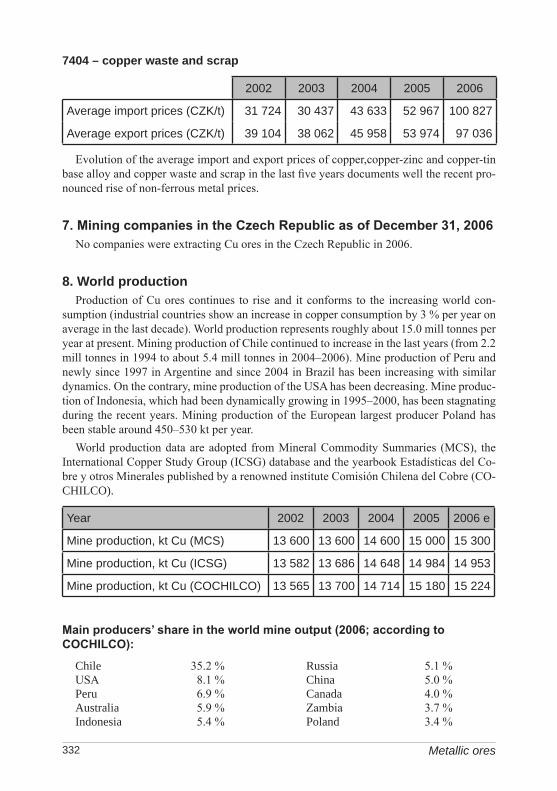
332
7404 – copper waste and scrap
2002 2003 200� 2005 2006
Average.import.prices.(CZK/t) 31.72� 30.�37 �3.633 52.967 100.827
Average.export.prices.(CZK/t) 39.10� 38.062 �5.958 53.97� 97.036
Evolution of the average import and export prices of copper,copper-zinc and copper-tin base alloy and copper waste and scrap in the last five years documents well the recent pro-nounced rise of non-ferrous metal prices.
7. Mining companies in the Czech Republic as of December 31, 2006No companies were extracting Cu ores in the Czech Republic in 2006.
8. World productionProduction of Cu ores continues to rise and it conforms to the increasing world con-
sumption (industrial countries show an increase in copper consumption by 3 % per year on average in the last decade). World production represents roughly about 15.0 mill tonnes per year at present. Mining production of Chile continued to increase in the last years (from 2.2 mill tonnes in 1994 to about 5.4 mill tonnes in 2004–2006). Mine production of Peru and newly since 1997 in Argentine and since 2004 in Brazil has been increasing with similar dynamics. On the contrary, mine production of the USA has been decreasing. Mine produc-tion of Indonesia, which had been dynamically growing in 1995–2000, has been stagnating during the recent years. Mining production of the European largest producer Poland has been stable around 450–530 kt per year.
World production data are adopted from Mineral Commodity Summaries (MCS), the International Copper Study Group (ICSG) database and the yearbook Estadísticas del Co-bre y otros Minerales published by a renowned institute Comisión Chilena del Cobre (CO-CHILCO).
Year 2002 2003 200�. 2005 2006.e
Mine.production,.kt.Cu.(MCS) 13.600 13.600 1�.600 15.000 15.300
Mine.production,.kt.Cu.(ICSG) 13.582 13.686 1�.6�8 1�.98� 1�.953
Mine.production,.kt.Cu.(COCHILCO) 13.565 13.700 1�.71� 15.180 15.22�
Main producers’ share in the world mine output (2006; according to COCHILCO):
Chile 35.2 % Russia 5.1 %USA 8.1 % China 5.0 %Peru 6.9 % Canada 4.0 %Australia 5.9 % Zambia 3.7 %Indonesia 5.4 % Poland 3.4 %
Metallic ores

333
9. World market pricesCopper ore concentrates are not quoted on the world market; sales are based upon negoti-
ated prices only. Prices of Cu metal (Grade A Electrolytic Copper) are commonly quoted at London Metal Exchange (LME). Copper price reached high values in 1973 and 1974 and another local maximum was reached in 1989 (annual average USD 2,847 per tonne). The following temporary decrease in prices was caused by a surplus production, particularly due to supplies from the East European countries and by the decrease in consumption resulting from the global economic recession. The prices hit twelve-year minimum in the first part of the year 1999. This trend has not changed until the second half of the year 2003, by the end of which the prices reached the limit of USD 2,300 per tonne. Prices of all non-ferrous metals on the world marked significantly hardened during the year 2004. Copper prices increased up to 3,300 USD/t in this period, the cause being especially a high demand from the side of rap-idly growing economies of Asia. For instance, the copper consumption in China increased by 9.3 % in 2004 according to ICSG. Continual rise in copper price on the world market during the year 2005 had similar causes: whereas the price was below USD 3,100 per tonne in Janu-ary 2005, it reached USD 4,650 per tonne in the end of the year. The price rose by about 50 % just during the year 2005. Price of copper, as of a number of other metals, was to a certain extent also under influence of speculators, attracted by the high price rise.
The average annual metal price at LME in USD per tonne (Cash) was as follows:
Commodity/Year 2002 2003 200� 2005 2006Cu.metal.at.the.LME,.Grade.A.Electrolytic.Copper,.cash USD/t 1.558 1.779 2.866 3.679 6.709
10. recyclingCopper belongs to metals, which are recycled on a large scale. The proportion of recy-
cled copper in the metal consumption reaches 30–40 % according to the International Cop-per Study Group. This proportion is even higher in developed countries, e.g. in Germany it exceeds 50 %. Copper is recovered mainly through pyrometallurgical processes, to lesser extent through hydrometallurgy.
11. possible substitutesAluminium replaces copper in electrical and electronics uses, in the manufacture of car
radiators and refrigerators. Titanium and steel despite their worse conductivity substitute for copper in the production of heat exchangers. Steel substitutes for copper in the manufacture of ammunition, too. Optical fibres in telecommunication and plastics in water distribution (lines) and the building industry are other substitutes.
Copper
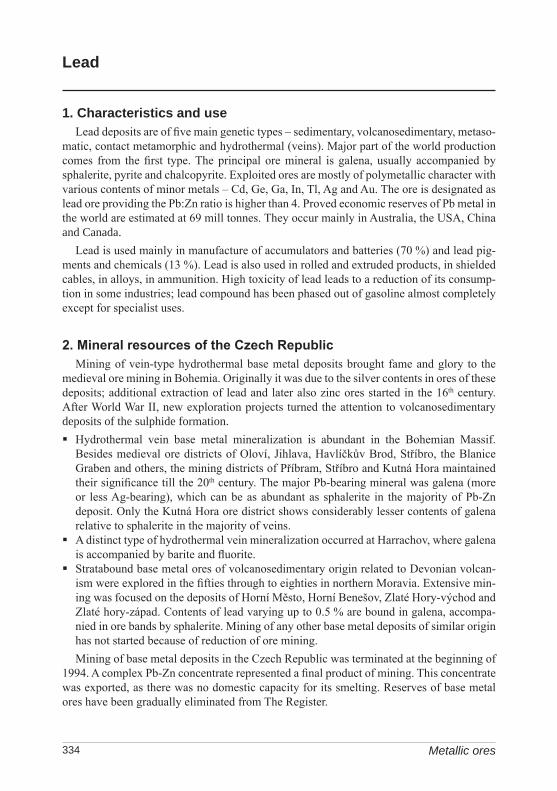
33�
lead
1. Characteristics and useLead deposits are of five main genetic types – sedimentary, volcanosedimentary, metaso-
matic, contact metamorphic and hydrothermal (veins). Major part of the world production comes from the first type. The principal ore mineral is galena, usually accompanied by sphalerite, pyrite and chalcopyrite. Exploited ores are mostly of polymetallic character with various contents of minor metals – Cd, Ge, Ga, In, Tl, Ag and Au. The ore is designated as lead ore providing the Pb:Zn ratio is higher than 4. Proved economic reserves of Pb metal in the world are estimated at 69 mill tonnes. They occur mainly in Australia, the USA, China and Canada.
Lead is used mainly in manufacture of accumulators and batteries (70 %) and lead pig-ments and chemicals (13 %). Lead is also used in rolled and extruded products, in shielded cables, in alloys, in ammunition. High toxicity of lead leads to a reduction of its consump-tion in some industries; lead compound has been phased out of gasoline almost completely except for specialist uses.
2. Mineral resources of the Czech RepublicMining of vein-type hydrothermal base metal deposits brought fame and glory to the
medieval ore mining in Bohemia. Originally it was due to the silver contents in ores of these deposits; additional extraction of lead and later also zinc ores started in the 16th century. After World War II, new exploration projects turned the attention to volcanosedimentary deposits of the sulphide formation.Hydrothermal vein base metal mineralization is abundant in the Bohemian Massif.
Besides medieval ore districts of Oloví, Jihlava, Havlíčkův Brod, Stříbro, the Blanice Graben and others, the mining districts of Příbram, Stříbro and Kutná Hora maintained their significance till the 20th century. The major Pb-bearing mineral was galena (more or less Ag-bearing), which can be as abundant as sphalerite in the majority of Pb-Zn deposit. Only the Kutná Hora ore district shows considerably lesser contents of galena relative to sphalerite in the majority of veins.
A distinct type of hydrothermal vein mineralization occurred at Harrachov, where galena is accompanied by barite and fluorite.
Stratabound base metal ores of volcanosedimentary origin related to Devonian volcan-ism were explored in the fifties through to eighties in northern Moravia. Extensive min-ing was focused on the deposits of Horní Město, Horní Benešov, Zlaté Hory-východ and Zlaté hory-západ. Contents of lead varying up to 0.5 % are bound in galena, accompa-nied in ore bands by sphalerite. Mining of any other base metal deposits of similar origin has not started because of reduction of ore mining.Mining of base metal deposits in the Czech Republic was terminated at the beginning of
1994. A complex Pb-Zn concentrate represented a final product of mining. This concentrate was exported, as there was no domestic capacity for its smelting. Reserves of base metal ores have been gradually eliminated from The Register.
Metallic ores

335
3. Registered deposits and other resources in the Czech Republic (see map)Registered deposits and other resources are not mined
Reserved registered deposits:
1 Horní Benešov 4 Křižanovice 7 Ruda u Rýmařova-sever2 Horní Město 5 Kutná Hora 8 Újezd u Kasejovic3 Horní Město-Šibenice 6 Oskava 9 Zlaté Hory-východ
Exhausted deposits and other resources:
10 Březové Hory + Příbram-Bohutín
12 Stříbro 14 Ratibořské Hory + Stará Vožice
11 Oloví 13 Havlíčkův Brod (Dlouhá Ves + Bartoušov + Stříbrné Hory)
15 Černovice
4. Basic statistical data of the Czech Republic as of December 31
Year 2002 2003 200� 2005 2006
Deposits.–.total.number. a) 9 8 8 8 8
. exploited 0 0 0 0 0
Total.mineral.*reserves,.kt.Pb 173 152 152 152 152
. economic.explored.reserves 0 0 0 0 0
. economic.prospected.reserves 0 0 0 0 0
. potentially.economic.reserves 173 152 152 152 152
Mine.production,.kt.Pb 0 0 0 0 0
* see NOTE on page 12 on a terminological difference between Czech official application of the term reserves and standard international application of the term
a) deposits with registered Pb content
recycling and lead productionKovohutě Příbram nástupnická a.s.Activity of Kovohutě Příbram nástupnická a.s. can be divided into four main branches.
Recycling division is engaged with bulk buying and recycling of waste and scrap of lead and its alloys, 80 % of which represent old scrap lead accumulators. Its production assort-ment represents lead and its alloys in pigs. Products division is engaged with the production and sale of a large assortment of products on lead, tin and antimony basis. All the assort-ment of about 2,000 types is used e.g. in construction industry, electro-technics, electronics, chemical industry, health services, engineering in measuring technique and at ammunition
Lead

336
lead
rese
rved
.regi
ster
ed.d
epos
its
exha
uste
d.de
posi
ts.a
nd.o
ther
.reso
urce
s
Metallic ores

337
production. Lead plates, lead stripes and sections, lead wires and bars, lead seals etc. Elec-tric waste division is engaged with ecological processing of collected electrical equipment and separately collected electric waste. Precious metals division is engaged with bulk buy-ing and ecologically harmless usage and recycling of waste – secondary raw materials containing precious metals.
5. Foreign trade2607 – lead ores and concentrates
2002 2003 200� 2005 2006
Import,.t 0 506 0 0 1.7�1
Export,.t 0 0 0 0 0
7801 – Unwrought lead
2002 2003 200� 2005 2006
Import,.t 56.9�1 55.699 73.�72 N 67.92�
Export,.t 5.72� 7.112 7.230 8.666 10.�30
Detailed data on unwrought lead imports (t)
Country 2002 2003 200� 2005 2006
Germany �3.�91 39.068 50.101 N �2.696
Sweden �.995 7.615 10.976 1�.600 16.510
Poland �.256 3.7�2 �.899 1.093 809
Romania 1.385 1.32� 1.381 2.161 2.7�0
Austria 2� 22 2.�16 N 3.12�
others 2.790 3.928 3.699 N 2.0�5
7802 – lead waste and scrap
2002 2003 200� 2005 2006
Import,.t 18� 908 1.3�8 �.10� �.�11
Export,.t 3.3�6 2.926 3.032 �.9�8 6.6�8
Lead

338
Detailed data on lead waste and scrap imports (t)
Country 2002 2003 200� 2005 2006
Poland 65 785 391 1.2�� 1.�55
Germany 51 100 22� 9�6 93�
Hungary 0 23 586 732 636Bosnia.and.Herzegovina 0 0 0 671 956
others 68 0 1�6 509 �30
Detailed data on lead waste and scrap exports (t)
Country 2002 2003 200� 2005 2006
Germany 3.337 2.926 3.023 �.9�8 6.583
others 9 0 9 0 65
Foreign trade with unwrought lead, the import of which represents 55 to 70 kt per year, i.e. CZK 1.5–2.1 billion, is the most important of the above given customs tariff items. Unwrought lead is imported traditionally from Germany and Sweden. Gradual decrease of unwrought lead from Poland in favour of lead waste and scrap is interesting. Import of lead waste and scrap increased more than twenty times in 2002–2005. Export of this item from the Czech Republic is nevertheless still higher. Almost all lead waste and scrap is exported to Germany. Volume of trade with lead ores and concentrates is negligible.
6. prices of domestic market and foreign trade7801 – Unwrought lead
2002 2003 200� 2005 2006
Average.import.prices.(CZK/t) 17.877 16.689 21.355 N 30.936
Average.export.prices.(CZK/t) 18.705 18.087 25.728 22.338 3�.362
7802 – lead waste and scrap
2002 2003 200� 2005 2006
Average.import.prices.(CZK/t) 11.56� 12.838 18.5�0 18.883 2�.028
Average.export.prices.(CZK/t) 8.391 8.963 12.29� 23.566 23.�70
Metallic ores

339
7. Mining companies in the Czech Republic as of December 31, 2006In 2006, no companies exploiting ores with Pb content were operating in the Czech
Republic.
8. World productionThe world production exceeded the level of 3 mill tonnes of metal content first in 1968.
The largest production so far was recorded in 1977 – 3,657 kt. Since the second part of 1990s until 2003, the world mine production had been oscillating
around 3,000 kt. The last three years have seen a repeated rise in mine production, especially in case of two largest world producers – Australia and China. The Chinese production in-creased from 640 kt in 2002 to 950 kt in 2004 and about 1,050 kt in 2006. Data according to Mineral Commodity Summaries (MCS), International Lead and Zinc Study Group (ILZSG) database and yearbook Welt-Bergbau-Daten (WBD):
Year 2002 2003 200�. 2005. 2006.e
Mine.production,.kt.Pb.(MCS) 2.910 2.950 3.150 3.270 3.360
Mine.production,.kt.Pb.(ILZSG) 2.830 3.111 3.129 3.�15 3.�92
Mine.production,.kt.Pb.(WBD) 2.912 3.265 3.265 3.358 N
Main producers’ share in the world mine output (2005; according to MCS):
China 30.6 % Mexico 4.0 %Australia 23.7 % Canada 2.2 %USA 13.0 % Ireland 2.0 %Peru 9.8 % Sweden 1.9 %
Metal production
Year 2002. 2003 200�. 2005. 2006.eMetal.production,.kt.Pb.(according.to.ILZSG) 6.670 6.76� 6.957 7.637 8.02�
9. World market pricesOn the world market, mines receive the lead metal price less a treatment and refining
charge (per unit of contained lead), with some adjustments for their lead concentrates. The treatment charge (T/C) for lead concentrate grading 70–80 % Pb is quoted in USD/t, CIF Europe. It exceeded a limit of USD 100 per tonne at the end of 1987 and since then it was gradually increasing by almost 100 %. Then it decreased again and it stabilized at about USD 110 per tonne during the last years.
Lead
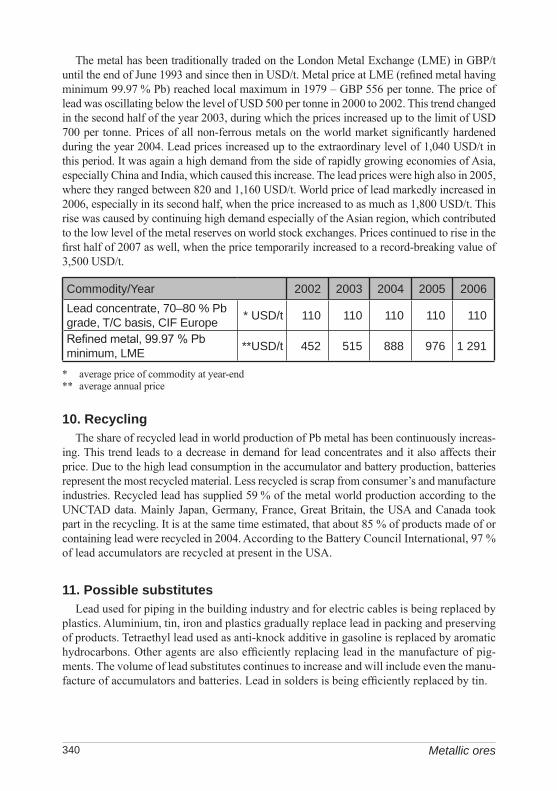
3�0
The metal has been traditionally traded on the London Metal Exchange (LME) in GBP/t until the end of June 1993 and since then in USD/t. Metal price at LME (refined metal having minimum 99.97 % Pb) reached local maximum in 1979 – GBP 556 per tonne. The price of lead was oscillating below the level of USD 500 per tonne in 2000 to 2002. This trend changed in the second half of the year 2003, during which the prices increased up to the limit of USD 700 per tonne. Prices of all non-ferrous metals on the world market significantly hardened during the year 2004. Lead prices increased up to the extraordinary level of 1,040 USD/t in this period. It was again a high demand from the side of rapidly growing economies of Asia, especially China and India, which caused this increase. The lead prices were high also in 2005, where they ranged between 820 and 1,160 USD/t. World price of lead markedly increased in 2006, especially in its second half, when the price increased to as much as 1,800 USD/t. This rise was caused by continuing high demand especially of the Asian region, which contributed to the low level of the metal reserves on world stock exchanges. Prices continued to rise in the first half of 2007 as well, when the price temporarily increased to a record-breaking value of 3,500 USD/t.
Commodity/Year 2002 2003 200� 2005 2006Lead.concentrate,.70–80.%.Pb.grade,.T/C.basis,.CIF.Europe *.USD/t 110 110 110 110 110
Refined metal, 99.97 % Pb minimum,.LME **USD/t �52 515 888 976 1.291
* average price of commodity at year-end** average annual price
10. recyclingThe share of recycled lead in world production of Pb metal has been continuously increas-
ing. This trend leads to a decrease in demand for lead concentrates and it also affects their price. Due to the high lead consumption in the accumulator and battery production, batteries represent the most recycled material. Less recycled is scrap from consumer’s and manufacture industries. Recycled lead has supplied 59 % of the metal world production according to the UNCTAD data. Mainly Japan, Germany, France, Great Britain, the USA and Canada took part in the recycling. It is at the same time estimated, that about 85 % of products made of or containing lead were recycled in 2004. According to the Battery Council International, 97 % of lead accumulators are recycled at present in the USA.
11. possible substitutesLead used for piping in the building industry and for electric cables is being replaced by
plastics. Aluminium, tin, iron and plastics gradually replace lead in packing and preserving of products. Tetraethyl lead used as anti-knock additive in gasoline is replaced by aromatic hydrocarbons. Other agents are also efficiently replacing lead in the manufacture of pig-ments. The volume of lead substitutes continues to increase and will include even the manu-facture of accumulators and batteries. Lead in solders is being efficiently replaced by tin.
Metallic ores

3�1Zinc
Zinc
1. Characteristics and useThe major economic mineral of zinc is sphalerite, which is usually accompanied by ga-
lena, pyrite and chalcopyrite in base metal deposits. The ore is marked as zinc ore providing the Zn:Pb ratio is higher than 4. Sphalerite usually contains cadmium, whose concentra-tions vary from traces up to 2 %, then germanium, gallium, indium and thallium. Zinc ores occur mostly in base metal deposits of various origins, the same way as lead ores. Economic demonstrated reserves of Zn in the world are estimated at 144 mill tonnes. Potential source of zinc may be also zinc-bearing coal, in which the content of zinc is estimated at an order of millions of tonnes.
Much zinc is used in zinc galvanizing (47 %), in alloys (particularly brass – 19 %), in castings (14 %), in rolled materials for the building industry and manufacture of batteries (7 %), etc. As for the volume, zinc represents the 3rd most used non-ferrous metal after aluminium and copper.
2. Mineral resources of the Czech RepublicZinc ores almost exclusively occur as a part of polymetallic ores [Pb-Zn±Ag (±Cu)] of
hydrothermal or volcanosedimentary origin.• Large volume of zinc ores represented mostly by sphalerite was extracted from the vein-
type base metal deposits of the Březové Hory, Bohutín and Vrančice ore districts in the vi-cinity of Příbram (until 1962). The grade of these ores ranges between 1.0 and 2.9 %. Other base metal deposits were explored and partly mined in the period after World War II: in the northern part of the Kutná Hora district (Rejské pásmo, Turkaňské pásmo and Staročeské pásmo zones), in the Havlíčkův Brod district (Stříbrné Hory, Dlouhá Ves, Bartoušov) and in western Bohemia (Stříbro, Kšice).
• The most important base metal deposits of volcanosedimentary origin occur in the Jeseníky Mountains. Disseminated sulphide ores grading 1.1–1.8 % Zn were mined in the deposits of Horní Město (1967–1970) and Horní Benešov (1963–1992). 6,561 kt of ore containing 39,210 t of lead and 90,711 t of zinc were mined from both deposits in 1963–1992. Mining of the Au-Zn ores at Zlaté Hory-východ deposit in the Zlaté Hory ore district was termi-nated in 1994. 771.6 kt of base metal ores containing 9,111 t Zn, 395 t Pb and 1,559 kg Au were mined at Zlaté Hory-východ and Zlaté Hory-západ deposits in 1988–1994.
The deposit of Staré Ransko-Obrázek is probably of polygenetic origin. Sphalerite-barite ore, having up to 1.8 % Zn, was mined here until 1990. The Křižanovice deposit of Pb-Zn-Cu ores with barite belongs to deposits of unclear genesis, too. The ore contained about 4–6 % Zn. The deposit was discovered during an exploration project in the eight-ies.The production of Zn ores in the Czech Republic was terminated at the beginning of
1994, in line with the policy of a gradual reduction of ore mining adopted by the Govern-ment. A composite Pb-Zn concentrate was the final product of the base metal ores mining. The concentrate was exported because there was no smelter in the Czech Republic. Base metal reserves have been gradually eliminated from The Register.

3�2
3. Registered deposits and other resources in the Czech Republic(see map)Registered deposits and other resources are not mined
Reserved registered deposits:
1 Horní Benešov 4 Křižanovice 7 Ruda u Rýmařova-sever2 Horní Město 5 Kutná Hora 8 Újezd u Kasejovic3 Horní Město-Šibenice 6 Oskava 9 Zlaté Hory-východ
Exhausted deposits and other resources:
10 Březové Hory + Příbram + Bohutín 12 Havlíčkův Brod (Dlouhá Ves + Bartoušov + Stříbrné Hory)
11 Stříbro 13 Staré Ransko
4. Basic statistical data of the Czech Republic as of December 31
Year 2002 2003 200� 2005 2006
Deposits.–.total.number. a) 10 9 9 9 9
. exploited 0 0 0 0 0
Total.mineral.*reserves,.kt.Zn 652 �77 �77 �77 �77
. economic.explored.reserves 0 0 0 0 0
. economic.prospected.reserves 0 0 0 0 0
. potentially.economic.reserves 652 �77 �77 �77 �77
Mine.production,.t.Zn 0 0 0 0 0
* see NOTE on page 12 on a terminological difference between Czech official application of the term reserves and standard international application of the term
a) deposits with registered Zn content
Production of zinc alloys and castingsCOMAX, spol. s.r.o.ALFE Brno, s.r.o.Casting of both iron and non-ferrous metals, production of painted steel and alumini-
um stripes, plates and its forming represents the main activity of COMAX s.r.o. (formerly Kovohutě Velvary). Metallurgical part produces various alloys including Zn alloys. These are continually cast intermediate products – bronzes (tin, lead, aluminium, red), brasses (casting, modified), alloys (aluminium, zinc) and master alloys. ALFE Brno, s.r.o. ensures
Metallic ores

3�3
Zinc
rese
rved
.regi
ster
ed.d
epos
its
exha
uste
d.de
posi
ts.a
nd.o
ther
.reso
urce
s
Zinc

3��
production of precise castings of zinc and modern technology of centrifuge casting in rub-ber forms apart from classical casting production.
5. Foreign trade2608 – Zinc ores and concentrates
2002 2003 200� 2005 2006
Import,.t 2 0 0 1 17
Export,.t 0 0 21 0 0
7901– Unwrought zinc
2002 2003 200� 2005 2006
Import,.t 27.102 28.7�8 3�.205 36.��� �0.592
Export,.t 1.251 1.670 5.659 8.110 6.158
Detailed data on unwrought zinc imports (t)
Country 2002 2003 200� 2005 2006
Poland 13.653 10.�81 17.110 19.115 12.899
Germany 5.32� 6.02� 5.160 6.785 8.7�7
Belgium 1.68� 3.259 2.925 3.383 �.589
Slovakia �7 206 1.566 1.038 �.098
Romania 0 1.016 1.773 1.003 1.187
the.Netherlands 650 520 1.309 1.033 92�
Kazakhstan 8�8 317 376 21 2.335
Russia 1.163 983 �9 0 893
others 3.733 5.9�2 3.937 �.066 �.920
7902 – Zinc waste and scrap
2002 2003 200� 2005 2006
Import,.t 16 25 10� 565 33�
Export,.t 2.328 2.2�7 2.517 2.739 3.086
Metallic ores

3�5
Detailed data on zinc waste and scrap exports (t)
Country 2002 2003 200� 2005 2006
Germany 1.713 1.�07 8�6 777 1.006
Austria 287 518 625 6�2 520
Belgium 0 116 286 �87 537
India 0 63 261 379 183
Poland 62 88 101 128 �36
others 266 55 398 326 �0�
Foreign trade with zinc is materialized through two main commodities – unwrought metal and zinc waste and scrap. Volume of unwrought zinc import has been increasing continuously in recent years and it oscillates around 40 kt in present. Substantial part of un-wrought zinc has been traditionally imported from Poland and Germany, share of Belgium has been newly increasing. 15–20 % of zinc is re-exported into other countries. In contrast, zinc waste and scrap has been mostly exported from the Czech Republic in volume of about 2–3 kt per year. Export is directed mainly to Germany, Austria and Belgium.
6. prices of domestic market and foreign trade7901– Unwrought zinc
2002 2003 200� 2005 2006
Average.import.prices.(CZK/t) 29.675 27.�10 30.233 35.139 6�.6�7
Average.export.prices.(CZK/t) 31.2�9 22.571 27.75� 31.777 69.867
7902 – Zinc waste and scrap
2002 2003 200� 2005 2006
Average.import.prices.(CZK/t) 62.�36 50.892 20.201 3�.229 38.�5�
Average.export.prices.(CZK/t) 1�.371 13.982 16.795 20.00� �3.529
The average import prices of unwrought zinc increased from about 27 ths CZK/t in 2002–2003 to more than double in 2006. This illustrates well the zinc world price increase in recent years.
7. Mining companies in the Czech Republic as of December 31, 2006No companies were extracting Zn ores in the Czech Republic in 2006.
Zinc

3�6
8. World productionProduction of zinc ores exceeded 7 mill tonnes in metal content in 1985. Increase in
production terminated in 1992 and in the next years mine production was decreasing. High increase in stock and increase of recycled metal proportion in the total production, cover-ing increase of demand, were the cause of the above mentioned decline. The production has been increasing again since 1994. It was higher than 8 mill t in 1999; the 9 mill tonne limit was according to the international statistics exceeded in the 2002–2003 period. While the Canadian production has been decreasing, mine production of Peru has been increas-ing in the recent years. The most significant increase in mine production was monitored in China (1,000 kt in 1995; 1,476 kt in 1999; 1,700 kt in 2001; 2,200 kt in 2003; 2,450 kt in 2005). Data come from Mineral Commodity Summaries (MCS), International Lead and Zinc Study Group (ILZSG) database and the yearbook Welt Bergbau Daten (WBD).
Year 2002. 2003 200� 2005 2006.e
Mine.production,.kt.Zn.(MCS) 8.360 9.010 9.600 9.800 10.000
Mine.production,.kt.Zn.(ILZSG) 8.90� 9.520 9.733 10.110 10.�25
Mine.production,.kt.Zn.(WBD) 9.237 9.237 9.5�2 9.�36 N
Main producers’ share in the world mine output (2005; according to MCS):
China 25.0 % USA 7.6 %Australia 13.6 % Mexico 4.8 %Peru 12.2 % Kazakhstan 4.1 %Canada 7.7 %
Metal production
Year 2002. 2003 200�. 2005 2006.eMetal.production,.kt.Zn.(according.to.ILZSG) 9.710 9.879 10.353 10.229 10.70�
9. World market pricesSince 1992 basic treatment charges for two grades of zinc concentrate have been quoted
on the world market – sulphide concentrate grade 49–55 % Zn and sulphide concentrate grade 56–61 % Zn in USD/t of dry substance, in transport parity CIF main European ports. The price of pure metal grading 99.995 % Zn has been quoted at LME in USD/t since September 1988 (before in GBP/t). Zinc mines are paid the price for pure metal less treat-ment and refining charges under complex formulae which allow for assumed losses during smelting and refining, for the content of by-products and for changes in metal prices from the basis set out in the contracts.
Metallic ores

3�7
Treatment charges for sulphide concentrates (different in quality than above mentioned) and prices of pure metal reached their local maxima in 1989. Later on, a significant fall in prices occurred owing to a continuous increase in stock. Treatment charges for zinc concentrates decreased below the limit of USD 150 per tonne in the years 2002–2003. The same way, the pure metal prices were very low in the years 2001 and 2002 – about half compared to the year 1997. The world prices of the pure zinc started to increase again only in the second half of the year 2003. Prices of all non-ferrous metals on the world market significantly hardened during the year 2004. Zinc prices oscillated between 940 and 1,220 USD/t in 2004. The increase of prices was caused by an increasing demand from the side of rapidly developing (mainly Asian) economies. World prices of zinc continued to rise also in 2005, especially in its second half, when they continually increased from 1,150 to 1,900 USD/t. The growth trend continued during all the year 2006 and the price increased from the level of about 2,000 USD/t up to the record value of 4,500 USD/t towards the end of the year. The price rise was caused by durable high demand from the Asian economies in combination with low reserves at LME.
The trend in average prices of the commodities was as follows:
Commodity/Year 2002 2003 200� 2005 2006*.Sulphide.concentrate.grade.
�9–55.%.Zn,.T/C.basis,.CIF.main.European.ports
USD/t 169 1�6 1�6 165 –
*.Sulphide.concentrate.grade.56–61.%.Zn,.T/C.basis,.CIF.main.European.ports
USD/t 170 1�6 1�6 165 –
*.Zinc.concentrate,.CIF.main.ports USD/t – – – 70 70
**.99.995.%.Zn,.LME. USD/t 778 828 1.0�7 1.382 3.26�
Notes: * year-end, ** annual
10. recyclingZinc scrap – metal scrap, galvanized plates, alloys, flue dust, oxides and chemicals con-
taining zinc – is being reworked by both the pyrometallurgical and hydrometallurgical proc-esses. An increase of share in recycled metal consumption has reached 35 % of the whole consumption in the world according to the UNCTAD data. According to the Zinc Associa-tion, the proportion of recovered zinc in the US consumption was about 40 % in 2000.
11. possible substitutesAluminium, plastics and magnesium replace zinc in foundry work. Coatings of alumin-
ium alloys, pigments, plastics and cadmium replace galvanic zinc plating. Zinc plates are completely replaced by other materials like stainless steel, aluminium, plastics etc. Alumin-ium alloys substitute for brass. Other materials in the manufacture of chemicals, electronic devices and pigments also efficiently replace zinc.
Zinc
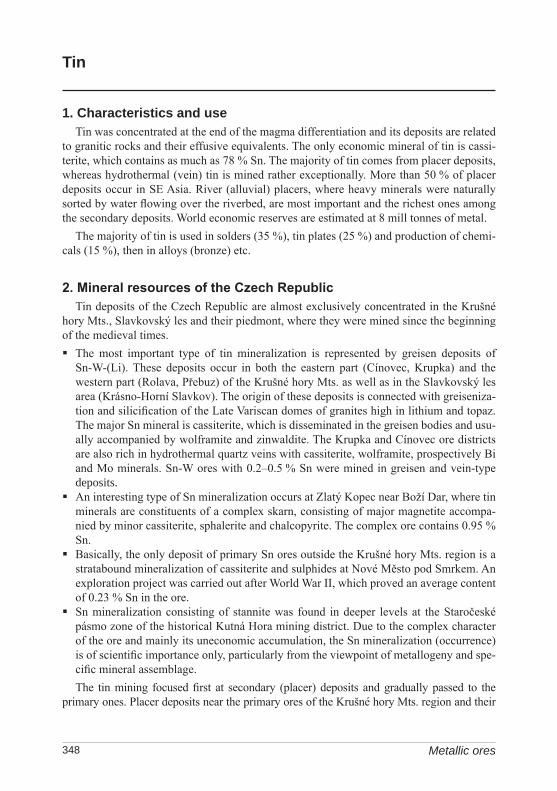
3�8
Tin
1. Characteristics and useTin was concentrated at the end of the magma differentiation and its deposits are related
to granitic rocks and their effusive equivalents. The only economic mineral of tin is cassi-terite, which contains as much as 78 % Sn. The majority of tin comes from placer deposits, whereas hydrothermal (vein) tin is mined rather exceptionally. More than 50 % of placer deposits occur in SE Asia. River (alluvial) placers, where heavy minerals were naturally sorted by water flowing over the riverbed, are most important and the richest ones among the secondary deposits. World economic reserves are estimated at 8 mill tonnes of metal.
The majority of tin is used in solders (35 %), tin plates (25 %) and production of chemi-cals (15 %), then in alloys (bronze) etc.
2. Mineral resources of the Czech RepublicTin deposits of the Czech Republic are almost exclusively concentrated in the Krušné
hory Mts., Slavkovský les and their piedmont, where they were mined since the beginning of the medieval times.The most important type of tin mineralization is represented by greisen deposits of
Sn-W-(Li). These deposits occur in both the eastern part (Cínovec, Krupka) and the western part (Rolava, Přebuz) of the Krušné hory Mts. as well as in the Slavkovský les area (Krásno-Horní Slavkov). The origin of these deposits is connected with greiseniza-tion and silicification of the Late Variscan domes of granites high in lithium and topaz. The major Sn mineral is cassiterite, which is disseminated in the greisen bodies and usu-ally accompanied by wolframite and zinwaldite. The Krupka and Cínovec ore districts are also rich in hydrothermal quartz veins with cassiterite, wolframite, prospectively Bi and Mo minerals. Sn-W ores with 0.2–0.5 % Sn were mined in greisen and vein-type deposits.
An interesting type of Sn mineralization occurs at Zlatý Kopec near Boží Dar, where tin minerals are constituents of a complex skarn, consisting of major magnetite accompa-nied by minor cassiterite, sphalerite and chalcopyrite. The complex ore contains 0.95 % Sn.
Basically, the only deposit of primary Sn ores outside the Krušné hory Mts. region is a stratabound mineralization of cassiterite and sulphides at Nové Město pod Smrkem. An exploration project was carried out after World War II, which proved an average content of 0.23 % Sn in the ore.
Sn mineralization consisting of stannite was found in deeper levels at the Staročeské pásmo zone of the historical Kutná Hora mining district. Due to the complex character of the ore and mainly its uneconomic accumulation, the Sn mineralization (occurrence) is of scientific importance only, particularly from the viewpoint of metallogeny and spe-cific mineral assemblage.The tin mining focused first at secondary (placer) deposits and gradually passed to the
primary ones. Placer deposits near the primary ores of the Krušné hory Mts. region and their
Metallic ores

3�9
piedmont are in principle exhausted. Only small primary and secondary accumulations of cassiterite and wolframite in the Slavkovský les area and its piedmont have been preserved. Majority of the reserves of the primary deposits has been mined out, too, the remaining ones do not have any economic significance at present. Sn ores mining in the Czech Republic was terminated in 1991 by closing down the Krásno deposit. Mining at Cínovec deposit was terminated one year earlier. Larger resources of low-grade ores remained just at Krásno and Cínovec deposits. These could represent even a possible source of trace and rare elements (e.g. Li, Rb, Cs, Nb, Ta, Sc etc.) in future.
3. Registered deposits and other resources in the Czech Republic(see map)Registered deposits and other resources are not mined
1 Cínovec-jih 2 Krásno 3 Krásno-Horní Slavkov
4. Basic statistical data of the Czech Republic as of December 31
Year 2002 2003 200� 2005 2006
Deposits.–.total.number. a) 6 6 3 3 3
. exploited 0 0 0 0 0
Total.mineral.*reserves,.t.Sn 17�.000 17�.000 163.809 163.809 163.809
. economic.explored.reserves 3.01� 3.01� 0 0 0
. economic.prospected.reserves 6.88� 6.88� 0 0 0
. potentially.economic.reserves 16�.102 16�.102 163.809 163.809 163.809
Mine.production,.t.Sn 0 0 0 0 0
* see NOTE on page 12 on a terminological difference between Czech official application of the term reserves and standard international application of the term
a) Sn-W ore deposits
production of tin intermediate products and tin-bearing alloysKovohutě Příbram nástupnická, a. s.COMAX, spol. s.r.o.Kovohutě Příbram nástupnická a.s. produces tin products and intermediate products, e.g.
tin foil, tin plates, pressed tin stripes and pressed tin tubes apart from a number of other products. It produces in addition a big assortment of printing metal of tin, lead and anti-mony alloy. COMAX, s.r.o. produces among others tin bronzes.
Tin

350
Tin
rese
rved
.regi
ster
ed.d
epos
its
exha
uste
d.de
posi
ts.a
nd.o
ther
.reso
urce
s
Metallic ores

351
5. Foreign trade2609 – Tin ores and concentrates
2002 2003 200� 2005 2006
Import,.t 0 0 0 1 1
Export,.t 0 0 0 0 0
8001– Unwrought tin
2002 2003 200� 2005 2006
Import,.t 531 635 550 63� 665
Export,.t 20 66 191 2�2 7�
Detailed data on unwrought tin imports (t)
Country 2002 2003 200� 2005 2006
China 22� �13 2�6 235 159
Indonesia 198 65 37 1�5 1�0
Germany 66 66 155 137 159
Thailand 10 5 80 20 �0
Bolivia 0 0 0 0 99
Malaysia 0 5 0 20 20
France 9 7 12 11 3
Austria � 25 3 10 0
others 20 �9 17 56 �5
8002 – Tin waste and scrap
2002 2003 200� 2005 2006
Import,.t 1� 37 63 69 75
Export,.t 15 25 105 70 2�9
Tin

352
Detailed data on waste and scrap imports (t)
Country 2002 2003 200� 2005 2006
Slovakia 1� 37 63 69 73
other 0 0 0 0 2
Detailed data on waste and scrap exports (t)
Country 2002 2003 200� 2005 2006
Belgium 0 0 �7 36 229
Germany 1� 15 19 25 18
The.Netherlands 0 0 2� 0 0
Austria 1 8 5 7 2
others 0 2 10 2 0
Unwrought tin import has been rather stable, amounting at roughly 550–650 t per year. Unwrought tin has been imported traditionally from China, Germany and Indonesia. An important part of the imported tin was re-exported to third countries in some years. Volume of tin waste and scrap was relatively balanced, however, export was three times as high as import in 2006. Tin waste and scrap has been imported to the Czech Republic almost exclu-sively from Slovakia, export is directed to western Europe. Foreign trade with the item tin ores and concentrates is negligible.
6. prices of domestic market and foreign trade8001– Unwrought tin
2002 2003 200� 2005 2006
Average.import.prices.(CZK/t) 138.�32 1�1.196 19�.066 185.732 200.185
Average.export.prices.(CZK/t) 1�7.685 1�7.705 193.066 189.772 229.�21
8002 – Tin waste and scrap
2002 2003 200� 2005 2006
Average.import.prices.(CZK/t) 36.761 32.510 115.387 73.018 115.963
Average.export.prices.(CZK/t) 72.900 69.11� 1�1.17� 116.025 56.871
Metallic ores

353
7. Mining companies in the Czech Republic as of December 31, 2006No mining companies extracted Sn ores on the territory of the Czech Republic in 2006.
8. World productionFor a long time the world production of tin concentrates was about 200 kt of Sn metal
per year. This level has been significantly overstepped each year since 2000. According to statistical data, the production reached its peak in 2005 – roughly 290 kt. In contrast to decreasing mine production of Brazil, Indonesia and Portugal, production in China, Indo-nesia and Bolivia has been increasing, whereas that of Brazil and Peru has been stagnating. Yearbook MCS nevertheless substantially corrected its data on the Chinese and Peruvian mine production in 2003. Data according to Mineral Commodity Summaries (MCS) and the World Mineral Statistics (WMS):
Year 2002 2003 200�. 2005. 2006.e
Mine.production,.kt.Sn.(MCS) 2�9 207 26� 290 273
Mine.production,.kt.Sn.(WMS) 236 257 275 N N
Main producers’ share in the world mine output (2005; according to MCS):
China 41.4 % Brazil 4.3 %Indonesia 27.6 % Vietnam 1.2 %Peru 14.5 % Russia 1.0 %Bolivia 6.4 % Malaysia 1.0 %
In the past, tin concentrate production and its export quotas were to a large extent affect-ed by ATPC, the members of which are Indonesia, Bolivia, Malaysia, Australia, Thailand, Nigeria, Zaire, China and Brazil. ATPC originated one year after the tin world market crisis in autumn 1985. China intervenes in the price evolution significantly recently, influencing the amount of the commodity on world market by means of export licences.
Following companies belonged among 10 most important tin producers in 2006 (ac-cording to ITRI): Yunnan Tin (China), PT Timah (Indonesia), Minsur (Peru), Thaisarco (Thailand), Malaysia Smelting Corp. (Malaysia), Yunnan Chengfeng (China), PT Koba Tin (Indonesia), CM Vinto (Bolivia), Liuzhou China Tin (China) and Gejui Zi-Li (China).
Year 2002 2003. 200� 2005 2006Smelting.production,.kt.Sn.(according.to.WMS;.EIU) 257 263 308 335 N
9. World market pricesTreatment charges (T/C) for three grades of tin concentrates were quoted on the world mar-
ket in the past: 40–60 % Sn , 60–70 % Sn and 70–75 % Sn in USD/t CIF Europe. Subject to
Tin

35�
certain adjustments tin mines receive the price for pure tin metal less these treatment charges. Pure metal grading 99.85 % Sn (A Grade) Cash has been quoted at London Metal Exchange (LME). The metal was formerly quoted in GBP/t, since 1989 it has been quoted in USD/t. Prices of all non-ferrous metals on the world marked significantly hardened during the year 2004. Tin prices oscillated between 6,200 and 10,200 USD/t, reaching roughly fifteen years´ maxima. The cause of this was again a high demand from the side of rapidly grow-ing Asian economies. Whereas world tin prices decreased from the level of 8,500 USD/t to roughly 6,000 USD/t in 2005, further rise of demand caused a continual price increase as high as the level of 12,000 USD/t. World tin consumption increased to 189 kt only in the first half of the year 2006, which was by 30 kt more than in the preceding year (China has seen a year-by-year consumption increase by 34 %). Price oscillated even between 13,000 and 15,000 USD/t in the first half of the year 2007.
average annual price of metal:
Commodity/Year 2002 2003 200� 2005 2006
99,85.%.Sn.(LME,.A.Grade),.Cash USD/t �.056 �.890 8.�95 7.370 7.982
10. recyclingThe last decades have seen a significant increase in the amount of recycled tin. The sec-
ondary production of the metal gained by recycling reached about 40,000 tonnes in 2004. Rate of recycling of tinplate scrap oscillates in developed countries between 50 and 75 %; the share of recycled metal in total consumption of the commodity is however considerably lower.
11. possible substitutesAluminium, glass, stainless steel, paper and plastic foils are the major substitutes for
tin in the food industry. Multicomponent epoxy resins are more and more used instead of solders. Tin alloys are replaced by Cu and Al alloys or by plastics. Pb and Na compounds replace some Sn chemicals.
Metallic ores

355
Tungsten
1. Characteristics and useHigher concentrations of tungsten are nearly always associated to granites. Primary tung-
sten ores are confined to pegmatite and greisen deposits genetically associated with acid granitoid intrusions and to scheelite skarn deposits. Tungsten ores often occur together with Sn, Mo, Cu, Au and Bi ores. Among the known tungsten minerals, only wolframite (having as much as 76.5 % WO3) and scheelite (up to 80.5 % WO3) are of economic importance. Wolframite contains besides Fe and Mn also some minor or trace concentrations of Nb and Ta. Tungsten placers occur in close vicinity of primary ores. World economic reserves of tungsten ores are estimated at 40 mill tonnes, 40 % of which occur in China.
Tungsten ores and concentrates are processed to obtain intermediate products – am-monium paratungstate (APT), tungstic acid, sodium tungstate, metal powder and powder tungsten carbide. Much tungsten is consumed in steel alloying used in heavy engineering, particularly in the armaments industry, and in the manufacture of metal-cutting tools and tools for oil and gas drilling and for mining of solid minerals (drilling bits made of tungsten carbide). About 80 % W is consumed in the aforementioned fields. Some tungsten is used in electricity and electronics.
2. Mineral resources of the Czech RepublicWolframite concentrate was obtained as a by-product during the mining and processing of
vein and greisen Sn-W ores of the Cínovec (where also an important Li mineralization – zin-waldite - occurred) and Krásno mining districts of the Czech Republic. Besides that, numerous occurrences of scheelite and wolframite mineralization were found and verified in various places of the Bohemian Massif, particularly during the last few years. Tungsten ores mining was terminated along with the Sn ores in 1990 at Cínovec deposit and a year later at deposit Krásno. Some small occurrences in the Moldanubicum were mined out during the exploration in the end of 1980s and beginning of 1990s (Malý Bor-Vrbík, Nekvasovy-Chlumy).Quartz veins and greisens mainly rich in Sn (Krásno, Cínovec), less frequently rich in
W (Krupka 4) occur in the Krušné hory Mts. region. Greisen ores have usually contents ranging between 0.02 and 0.07 % W. Only ores of the former deposit Krupka 4 showed up to 0.1–0.2 % W. A tungsten mineralization is known from quartz veins and stock-works at Rotava and disseminated scheelite in calc-silicate rocks (erlans – Ca-pyroxenic gneisses) of Vykmanov near Perštejn.
Typical contact metasomatic scheelite mineralization occurs in the exocontact of the Krkonoše Mts.–Jizerské hory and Žulová plutons. However, known localities of Obří důl and Vápenná are of no economic importance.
A number of mainly small new localities of the W-ores was found in the Moldanubicum. They are represented by both quartz veins with wolframite eventually scheelite which mostly occur along the exocontacts of the Variscan granitoids and disseminated or vein scheelite in calc-silicate rocks (erlans – Ca-pyroxenic gneisses). Some bodies represent bigger stratabound deposits of scheelite-bearing crystalline schist or skarn type. So far the most important stratabound deposit of Au-W ores is located at Kašperské Hory. Dis-seminated and banded scheelite occurs there in silicified layers underlying gold-bearing
Tungsten

356
quartz veins. The average W content of the ore is 1.32 %. Even though all reserves are subeconomic due to conflicts of interests with nature protection, the Kašperské Hory deposit nowadays represents the only economically exploitable deposit of W ores in the Czech Republic. As a complex Au-W deposit it is large and important even from Euro-pean viewpoint.
Introduction of more sophisticated exploration methods allowed discovering numerous localities of W ores in the Czech Republic, mostly of enigmatic origin. In contrast to former ideas about the common occurrence of Sn-W ores, it was proved that wolframite or scheelite ores occur mostly as separate mineralizations, and only a minor part belongs to combined Sn-W assemblages. After the Sn-W ores mining was terminated in 1991, the remaining reserves have been
revaluated and gradually eliminated from The Register. This concerned also 8 small de-posits in the Moldanubicum, which were revaluated and eliminated from The Register in 2006.
3. Registered deposits and other resources in the Czech Republic(see map)Registered deposits and other resources are not mined
1 Cínovec-jih 3 Krásno-Horní Slavkov2 Kašperské Hory 4 Krásno-Horní Slavkov
4. Basic statistical data of the Czech Republic as of December 31
Year 2002 2003 200� 2005 2006
Deposits.–.total.number. a) 13 13 12 12 �
. exploited 0 0 0 0 0
Total.mineral.*reserves,.t.W 73.611 73.611 72.7�0 72.7�0 70.253
. economic.explored.reserves 0 0 0 0 0
. economic.prospected.reserves 2.623 2.623 1.752 1.752 0
. potentially.economic.reserves 70.988 70.988 70.988 70.988 70.253
Mine.production,.t.W 0 0 0 0 0
* see NOTE on page 12 on a terminological difference between Czech official application of the term reserves and standard international application of the term
a) Sn-W and W ore deposits
production of tungsten intermediate productsOSRAM Bruntál spol. s r.o.
Metallic ores

357
Tung
sten
rese
rved
.regi
ster
ed.d
epos
its
exha
uste
d.de
posi
ts.a
nd.o
ther
.reso
urce
s
Tungsten
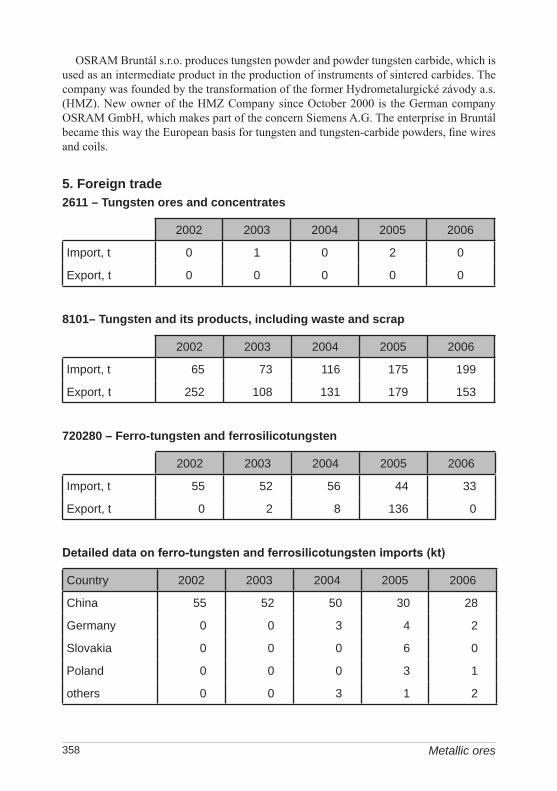
358
OSRAM Bruntál s.r.o. produces tungsten powder and powder tungsten carbide, which is used as an intermediate product in the production of instruments of sintered carbides. The company was founded by the transformation of the former Hydrometalurgické závody a.s. (HMZ). New owner of the HMZ Company since October 2000 is the German company OSRAM GmbH, which makes part of the concern Siemens A.G. The enterprise in Bruntál became this way the European basis for tungsten and tungsten-carbide powders, fine wires and coils.
5. Foreign trade 2611 – Tungsten ores and concentrates
2002 2003 200� 2005 2006
Import,.t 0 1 0 2 0
Export,.t 0 0 0 0 0
8101– Tungsten and its products, including waste and scrap
2002 2003 200� 2005 2006
Import,.t 65 73 116 175 199
Export,.t 252 108 131 179 153
720280 – Ferro-tungsten and ferrosilicotungsten
2002 2003 200� 2005 2006
Import,.t 55 52 56 �� 33
Export,.t 0 2 8 136 0
Detailed data on ferro-tungsten and ferrosilicotungsten imports (kt)
Country 2002 2003 200� 2005 2006
China 55 52 50 30 28
Germany 0 0 3 � 2
Slovakia 0 0 0 6 0
Poland 0 0 0 3 1
others 0 0 3 1 2
Metallic ores

359
6. prices of domestic market and foreign trade Tungsten ore and concentrates import from the Netherlands or Germany is negligible.
Crude tungsten (including waste and scrap), the import of which increased three times between 2002 and 2006, represents the largest volume. Tungsten wires, to a lesser extent tungsten powder, make predominant part of the import. Crude tungsten and its intermedi-ate products are imported mainly from Germany, the USA and China, export goes back to Germany or to Great Britain and Poland. 20-60 tonnes per year of ferro-tungsten and ferro-silico tungsten is imported on a long term. Ferro-alloys are imported mainly from China and Slovakia, recently also from Germany and Poland. Unusual import was directed to the Netherlands in 2005.
810196 – Tungsten wires
2002 2003 200� 2005 2006
Average.import.prices.(CZK/t) 2.�81 3.02� 2.557 2.82� 1.837
Average.export.prices.(CZK/t) 5.603 12.813 10.�58 5.053 5.�28
720280 – Ferro-tungsten and ferrosilicotungsten
2002 2003 200� 2005 2006
Average.import.prices.(CZK/t) 166 150 212 ��1 556
Customs tariff item 8101 tungsten and its products, including waste and scrap, covers such variety of goods, that it makes no sense to give import prices of the item as a whole. Only prices of sub-item 810196 tungsten wires are therefore presented. Big difference be-tween import and export prices is given among others by substantially lower volume of export of this sub-item compared to its import. Average import prices of ferro-tungsten and ferrosilicotungsten document increase of tungsten world prices of the last years.
7. Mining companies in the Czech Republic as of December 31, 2006No mining companies were extracting W ores on territory of the Czech Republic in
2006.
8. World productionWorld production of tungsten metal in ores and concentrates exceeded 40 kt in 1970
and reached its peak – 52 kt at the end of 1980s. The subsequent drop in prices was re-lated to restriction of demand on the world market resulting from the economic recession and from structural changes in major consumer branches. The world production has been again slowly increasing since 2000. China is the dominant world producer, and also has the greatest potential for increasing its mine output. The data on the world mining production in individual yearbooks partly differ from each other: According to Mineral Commodity
Tungsten

360
Summaries (MCS), the world production is higher and it has increased significantly in the last four years.
Year 2002 2003. 200�. 2005 2006.e
Mine.production,.t.W.(MCS) 59.100 62.100 73.700 70.100 73.300
Mine.production,.t.W.(WBD) ��.556 �9.0�3 56.720 56.322 N
Main producers’ share in the world mine output (2005; according to MCS):
China 87.0 % Canada 1.0 %Russia 6.3 % Korea, D.P.R. of 0.9 %Austria 1.9 % Bolivia 0.7 %Portugal 1.2 %
9. World market pricesAmong all W raw materials traded on the world market (ores, concentrates, oxides, hy-
droxides, tungstates, FeW, tungsten carbide and raw metal), the ores and concentrates rep-resented traditionally the major share of the trade. The price of wolframite – standard, grad-ing min. 65 % WO3 – on the world market has been quoted in USD/mtu WO3, CIF Europe. Final price of 1 t of the ore is a multiple of the unit price in mtu and the metal content in the relevant ore. Quotation of scheelite was abandoned in 1992 due to small extent of trade. Quoted price now includes both types of ore. The local maximum of the average wolframite price peak was reached in 1977 – USD 180 per mtu WO3. The subsequent drop in price was caused by global economic recession and particularly by a surplus of cheap Chinese wolf-ramite, import of which was restricted in some countries, which imposed high antidumping import taxes. Wolframite prices increased again from 42–50 USD/mtu up to 62–64 USD/mtu in the beginning and end of the year 2004, respectively. Prices continued to rise up to the limit of 100 USD/t in 2005 and very high prices were reached in 2006, too.
Of other W raw materials, an intermediate product ammonium paratungstate (APT) powder – quoted on the European free market in USD/mtu W – has been achieving more and more significant position. Dramatic price rise can be followed during the last two years. Majority of trading has been based on ATP. The average annual prices of the ore and the average price of the APT at year-end were as follows:
Commodity/year 2002 2003 200� 2005 2006Ore,.grading.min..65.%.WO3,.CIF.Europe
USD/mtu.WO3
38 �5 55 123 165
Ammonium.paratungstate.(APT).powder,.European.free.market
USD/mtu.W 50 6� 92 262 2�5
Metallic ores

361
10. recyclingRecycling of W (especially alloys containing tungsten) is carried out only in Japan, the
USA and Western Europe. According to incomplete data, recycling roughly accounts for 30 % of the total metal production.
11. possible substitutesThe metal remains irreplaceable in the steel-making industry as an alloying additive,
in the manufacture of armament, cutting and drilling tools and electricity and electronics uses. Some attempts were made during the period of the tungsten price rise to replace W by molybdenum in armoured tank ammunitions or even by depleted uranium showing large surplus worldwide. Replacement of W by ceramic materials is reasonable in some fields and replacement of W by Mo in automobile industry is more than equivalent. Sintered tungsten carbide used in the manufacture of cutting and drilling tools can be partly replaced by carbides of other metals or by nitrides and oxides and/or new composite materials or synthetic diamond, particularly in less exposed fields and where the price of tungsten and tungsten carbide plays a decisive role.
Tungsten

362
Silver
1. Characteristics and useSilver is an element of chalcophile character, which during the magmatic differentiation
tends to concentrate in minerals of late stages or hydrothermal fluids. About 2/3 of the silver world reserves occur in polymetalic (Cu and Pb-Zn) deposits of various origin. The remain-ing 1/3 of Ag occurs in hydrothermal vein deposits, where it is the major economic element. The major silver-bearing mineral is Ag-bearing galena, the other ones are mainly sulphides and sulphosalts of Ag, such as e.g. argentite, hessite, proustite, kerargyrite, polybasite, pyr-argyrite, stromeyerite, sylvanite and tetrahedrite (freibergite). Silver fineness is expressed in thousandths of total alloy; sterling silver, its commonest alloy, contains of 92.5 % silver (fineness of 925/1,000). World economic reserves of silver metal are estimated at 300 kt.
The majority of silver (in 2004) was used in industry (electrical technology, catalysts, coatings, etc.) (45 %), in jewellery and silverware (28 %), in photography (20 %), in coin-age and investments (bars) (7 %). Industrial utilization of silver includes its utilization in medicine and in nuclear power generation for control rods manufacture for water reactors (an alloy consisting of 80 % Ag, 15 % In and 5 % Cd).
2. Mineral resources of the Czech RepublicMining for silver played a decisive role in medieval ore mining in Bohemia and in the
prosperity of old mining towns.• The major portion of silver resources in the Czech Republic occurs in polymetalic (Pb-
Zn and Cu) deposits, where it forms an isomorphous admixture particularly in galena. Some Ag was extracted as a byproduct when mining high-grade polymetalic ores (58–70 ppm Ag) and U-Ag ores (high grade Ag ores with native silver and Ag minerals exhibit-ing around 480 ppm Ag) of the Příbram uranium-polymetalic deposit, until the mining operations were reduced and ceased completely in the early nineties. Polymetalic ores of the Horní Benešov and Horní Město deposits contained obtainable amount of Ag, too. The 50 % lead concentrate showed average Ag content of 846 g/t, the 49 % zinc concentrate contained 86.6 g/t Ag on average in 1963–1992. Deposit Zlaté Hory-východ was the one containing silver in polymetalic ores in the Zlaté Hory district. The Pb-Zn concentrate produced from the ores of this deposit in 1988–1992 displayed average Ag content of 0.19 g/t.
Numerous recently abandoned deposits of Pb-Zn-Ag and deposits of so-called five ele-ment assemblage (U-Bi-Co-Ni-Ag) in medieval mining districts of Kutná Hora, Jihlava, Příbram, Jáchymov, Stříbro, Rudolfov, Havlíčkův Brod, Stará Vožice etc. were an impor-tant source of European silver in the past. The deposits represent classic deposit types.Silver reserves have been gradually eliminated from The Register in connection with the
revaluation of polymetalic ores.
Metallic ores

363
3. Registered deposits and other resources in the Czech Republic(see map)Registered deposits and other resources are not mined
Reserved registered deposits:
1 Horní Benešov 4 Kutná Hora 7 Újezd u Kasejovic2 Horní Město 5 Oskava 8 Zlaté Hory-východ3 Horní Město-Šibenice 6 Ruda u Rýmařova-sever
Exhausted deposits and other resources:
9 Příbram surroundings 13 Ratibořské hory + Stará Vožice
16 Hrob + Mikulov
10 Jáchymov surroundings 14 Rudolfov 17 Nalžovské hory11 Havlíčkův Brod surroundings 15 Stříbro 18 Vejprty + Hora sv. Kateřiny12 Jihlava surroundings
4. Basic statistical data of the Czech Republic as of December 31
Year 2002 2003 200� 2005 2006
Deposits.–.total.number. a) 10 9 8 8 8
. exploited 0 0 0 0 0
Total.mineral.*reserves,.t.Ag 56� 533 533 533 533
. economic.explored.reserves 0 0 0 0 0
. economic.prospected.reserves 0 0 0 0 0
. potentially.economic.reserves 56� 533 533 533 533
Mine.production,.t.Ag 0 0 0 0 0
* see NOTE on page 12 on a terminological difference between Czech official application of the term reserves and standard international application of the term
a) deposits with registered Ag content
Refining and processing of precious metalsSAFINA, a.s.SAFINA a.s. is engaged in refining of precious metals [up to 3N (99.9 %) – 4N5
(99.995 %) purity], with production of intermediate products and products of precious metals, production of alloys of precious metals for jewellery and dentistry, production of
Silver

36�
Silv
erre
serv
ed.re
gist
ered
.dep
osits
exha
uste
d.de
posi
ts.a
nd.o
ther
.reso
urce
s
Metallic ores

365
chemicals containing precious metals, bulk buying and refining of waste containing pre-cious metals and recycling of electric waste.
5. Foreign trade261610 – Silver ores and concentrates
2002 2003 200� 2005 2006
Import,.kg 21 115 38 0 0
Export,.kg 13 2 5 1 1
7106 – Silver, unwrought or in semi-manufactured or powder form
2002 2003 200� 2005 2006
Import,.kg 173.805 238.752 257.623 103.373 N
Export,.kg 1�0.600 171.398 285.526 N N
6. prices of domestic market and foreign tradeSince data of the Czech Statistical Institute (ČSÚ) are not reliable, neither these data nor
import and export prices have been reported since 2005. Foreign trade with silver ores and concentrates was negligible.
7. Mining companies in the Czech Republic as of December 31, 2006No mining companies were extracting Ag ores on the territory of the Czech Republic in
2006.
8. World productionThe world production exceeded 10 kt per year in 1976. Since then it was increasing and
reached its peak in 1989 – 15.8 kt. Mining production was gradually decreasing and reached 13.8 kt (1994). Since 1996, the world production of silver has been increasing again and it oscillated between 18.5 and 20 kt in the last five years. The high mine production was one of the causes of low silver prices in 1998–2003. Mine production of silver increased the most in China and Peru during the last five years. Mine production of Mexico and Australia in-creased significantly, too. Mine production in Chile, Canada and Kazakhstan has not shown big variations. In contrast, mine production of the USA and Poland decreased. In 2006, mainly mine production of Peru and Chile increased; on the contrary, Australian mine pro-duction decreased back to the level of 1999. Data on silver production according to Mineral Commodity Summaries (MCS), Silver Institute (SI) and the yearbook Estadísticas del Cobre y otros Minerales published by Comisión Chilena del Cobre (COCHILCO):
Silver

366
Year 2002 2003. 200�. 2005 2006.e
Mine.production,.t.Ag.(MCS) 20.000 18.800 19.700 19.300 19.500
Mine.production,.t.Ag.(COCHILCO) 18.986 18.�75 18.730 19.258 18.898
Mine.production,.t.Ag.(SI) 18.�69 18.68� 19.352 20.083 20.096
Main producers´ share in the world mine output (2006; according to COCHILCO):
Peru 18.4 % Poland 7.0 %Mexico 15.9 % USA 6.1 %China 10.6 % Canada 5.2 %Australia 9.1 % Kazakhstan 4.3 %Chile 8.5 % Bolivia 2.3 %
According to the Silver Institute (SI), only 25 % of silver came from the mine produc-tion and processing of silver ores in 2006. Majority of silver was a by-product of dressing of lead-zinc (35 %), copper (25 %) and gold-bearing (15 %) ores. Extracted silver covered about 60 % of consumption. Jewellery represents an important consumer of silver.
Following companies belonged to ten most important silver world producers in 2006: Industrias Peńoles (Mexico), KGHM Polska Miedz (Poland), BHP Billiton (Australia), Ka-zakhmys (Kazakhstan), Polymetal (Russia), Cia. de Minas Buenaventura (Peru), Grupo Mexico (Mexico), Rio Tinto (Great Britain), Coeur d´Alene Mines (the USA) and Goldcorp (Canada). Following localities ranked among 10 most productive world silver deposits in 2006: Fresnillo (Mexico), Cannington (Australia), Dukat (Russia), Uchucchacua (Peru), Greens Creek (the USA), Imiter (Morocco), Rochester (the USA), Arcata (Peru), Tayahua (Mexico) and Selene (Peru).
9. World market pricesOnly price of pure metal 99.9 % Ag is quoted on the world market. It is quoted in GBp
or USc/troy oz. The highest price since 1880 (London Brokers’ Official Yearly Average Prices) was recorded in 1980 – GBp 905.2 per troy oz. World price of silver reached an im-portant maximum exceeding 9 dollars in spring 1987. Silver prices than oscillated basically between USD 4 and 6 per troy oz. Local maximum from February 1998, when the price temporarily increased to USD 7.8 per troy oz, represented the only exception. Qualitative change did not arrive until during the year 2004, when the prices were between 5.5 and 8.5 USD/t oz. The price almost reached the level of 9 USD/t oz by the end of the year 2005. Price rise continued also in the first half of 2006, when the prices reached the limit of 15 USD/t oz. The prices oscillated between 10 and 14 USD/t oz in the second half of 2006 and between 12 and 14.5 USD/t oz in the first half of 2007. High demand from the side of rapidly developing economies of the third world, significantly exceeding supply, caused the price rise. Price fluctuations of silver on the world marked reflect among others political
Metallic ores

367
situation and speculations, similarly to the other precious metals. An average annual price trend in USD/t oz is given in a summary as follows:
Commodity/Year 2002 2003 200� 2005 2006
Silver,.Handy.&.Harman USD/t.oz �.59 �.88 6.66 7.31 11.55
10. recyclingRecycling of silver, which is technologically a very simple operation, dramatically dropped
in the early nineties to about one half of Ag recycled during the same period of the eighties. The drop in recycling was attributed to low prices of silver, its lower content in secondary raw materials and restrictive measures in government stockpile policy and changes in the photo-graphic industry (switch to digital cameras etc.). Share of the recycled silver in the offer of the world market was estimated at 20 % in 2004.
11. possible substitutesSilver is efficiently replaced in numerous fields. Photo materials are produced with lower
content of silver or without silver at all. Photograph continues to be largely replaced by xerography and electronic displays. Digital photograph has marked a violent rise especially during recent years. Aluminium and rhodium substitute for silver in the manufacture of spe-cial mirrors and other reflecting surface coatings, tantalum and special steels are now used in surgical tools and artificial joints. Silver is being also replaced in batteries and ceramic materials replace dental alloys. Sterling silver was, except memorial mints and several ex-ceptions (e.g. Mexico put again in circulation silver coins in 1992), replaced by common metals, particularly by Cu alloys.
Silver

368 Metallic ores
Gold
1. Characteristics and usePrimary gold deposits can be divided into three large groups according to their origin:
volcano-hydrothermal, plutonic-hydrothermal and metamorphic. Secondary deposits – re-cent and fossil placers – resulted from physical weathering processes. Gold occurs in the form of native metal, in a natural alloy with silver (electrum) or other metals or in some cases in the form of tellurides. It occurs in sulphides of antimony, arsenic, copper, iron and silver. During their processing and smelting, gold is recovered as a byproduct. The grade or fineness of gold is given in carats or in 1,000 units (fine gold 24 carats = 1,000, 10 carats = 10/24 = 41.7 % = 417/1,000). Total economic world reserves are estimated at about 100 kt of Au, 15 % to 20 % of which occur as a minor constituent in ores of other metals (first of all Cu and Ag).
Much gold (in 2004) was used in jewellery (80 %), then in industry (10 %), in invest-ment (9 %), in dentistry (2 %).
2. Mineral resources of the Czech RepublicThe tradition of mining for primary and secondary gold in the Bohemian Massif dates
back almost three millennia. Bohemia used to be one of the most important producers of gold in Europe in the Middle Ages.The major part of gold mineralization is associated with regionally metamorphosed vol-
canosedimentary complexes locally penetrated by Variscan granitoids. Such a complex in the central Bohemian region is represented by the Jílové zone of the Proterozoic age, with abundant gold-quartz mineralization (deposits of Jílové, Mokrsko, Čelina and some others). Gold mineralization in the Jeseníky Mountains area is confined to stratabound base metal deposits related to Devonian volcanism (Zlaté Hory-západ). Gold ores min-ing was terminated in 1994 by closure of the Zlaté Hory-západ deposit. 1,524 kg Au was mined at this deposit in 1990–1994. Mokrsko deposit represents an explored deposit containing substantial Au reserves – 98 t Au in ores exploitable by open pit mining with average content of economic disposable reserves of 1.9 g/t Au and further more than 20 t Au exploitable by underground mining. Other 12.5 t of Au reserves exploitable by un-derground mining of Au with 1.6 g Au/t has been registered in a close deposit Prostřední Lhota-Čelina. There is therefore more than 131 t Au in whole Psí hory district (Čelina, Mokrsko). Vacíkov deposit SW of Příbram, were more than 33 t Au in ores containing 1.1 g Au/t, exploitable by open-pits, is similar.
Some hydrothermal quartz veins with gold as well as stratabound gold mineralization with scheelite (Kašperské Hory) and quartz veins and stockworks with Ag (Roudný) occur in the crystalline complex of the Moldanubicum. Deposit Kašperské Hory, where the exploration was not completed, contains 189 t Au (officially 55 t of average content 4.7 g Au/t of ore) in potentially economic reserves of average content of 3.44 g/t of ore.
Placer gold deposits are spatially and genetically linked to the primary gold deposits. Permo-Carboniferous paleoplacers occur in western Bohemia (Křivce) as well as in the

369Gold
Krkonoše Mts. Piedmont and in the Intra-Sudetic basins. The largest areas of Quaternary placers are located in the foothills of the Šumava Mountains and in northern Moravia and Silesia. Still recognizable remnants of placer gold panning indicate extensive mining for gold, which goes back to Celtic times.No gold mining is currently taking place in the Czech Republic, following the end of
mining operations at the Krásná Hora Au-Sb deposit in 1992 and at the Zlaté Hory-západ base metal deposit in 1994. Unsolved conflicts of interests with nature protection and from the world aspect an unusual prohibition of the cyanide process in mining in the Czech Republic block the use of the explored Au reserves at Mokrsko and Kašperské Hory de-posits.
3. Registered deposits and other resources in the Czech Republic(see map)Registered deposits and other resources are not mined
1 Břevenec 8 Mokrsko 15 Újezd u Kasejovic2 Dražetice-šachtice č.IV 9 Mokrsko-východ 16 Vacíkov3 Jílové u Prahy 10 Podmoky 17 Voltýřov4 Kašperské Hory 11 Prostřední Lhota-Čelina 18 Voltýřov-rozsyp5 Libčice 12 Sepekov 19 Zlaté Hory-východ6 Mikulovice u Jeseníka 13 Smolotely-Horní Líšnice 20 Zlaté Hory-Zlatý potok7 Modlešovice 14 Suchá Rudná-střed
4. Basic statistical data of the Czech Republic as of December 31
Year 2002 2003 200� 2005 2006
Deposits.–.total.number 26 23 20 20 19
. exploited 0 0 0 0 0
Total.mineral.*reserves,.kg.Au. 2�8.989 2�2.62� 2�0.677 2�0.677 239.518
. economic.explored.reserves �8.7�0 �8.7�0 �8.7�0 �8.7�0 �8.7�0
. economic.prospected.reserves 36.9�8 36.�67 35.777 35.777 3�.618
. potentially.economic.reserves 163.301 157.�17 156.160 156.160 156.160
Mine.production,.kg.Au 0 0 0 0 0
* see NOTE on page 12 on a terminological difference between Czech official application of the term reserves and standard international application of the term

370
Gol
dre
serv
ed.re
gist
ered
.dep
osits
exha
uste
d.de
posi
ts.a
nd.o
ther
.reso
urce
s
Metallic ores

371
5. Foreign trade 7108 – Gold in unwrought or semi-manufactured form, gold powder
2002 2003 200� 2005 2006
Import,.kg 1.288 1.599 1.62� N N
Export,.kg 5.567 5.182 5.831 5.715 �.722
Detailed data on gold imports (kg)
Country 2002 2003 200� 2005 2006
Germany �.269 �.375 �.5�2 �.561 276
Switzerland 812 321 10 785 �.076
Slovakia 317 2�5 190 233 155
others 169 2�1 1.089 136 215
About 1.2–2.2 tonnes of gold per year were traditionally imported in the Czech Repub-lic. Data of the Czech Statistical Institute on gold imports in 2005 and 2006 are not reliable. Gold has been imported mainly from Germany, Austria, Switzerland and Italy. About 5–6 t has been exported every year mainly to Germany. Gold-bearing ores are not imported in the Czech Republic.
6. prices of domestic market and foreign tradeCustoms tariff item 7108 include so variable products and intermediate products, that it
would be misleading to give average import or export prices.
7. Mining companies in the Czech Republic as of December 31, 2006No mining companies were extracting Au ores on the territory of the Czech Republic in
2006.
8. World productionWorld production of gold, following a slight decrease in the early seventies, continued
to rise steadily and reached its peak so far in 2001–2003 (about 2,500 to 2,600 t in metal content). According to the statistics Gold Survey, published by renowned company GFMS Limited, world consumption of gold was 3,851 t in 2005. Roughly 64 % of this amount came from the primary metal production and about 22 % was recovered. Based on the information from Peter Hambro Mining Company, average world expense on Au production from de-posits reach 224 USD/t oz, whereas average expenses on production from deposits in Rus-sia represent only 166 USD/t oz (MBM, Febr. 2004, p. 12). Data on bulk production of Au from mined ores slightly differ depending on the source (according to Mineral Commodity Summaries-MCS, World Mineral Statistics-WMS and the Welt Bergbau Daten-WBD):
Gold

372
Year 2002 2003 200�. 2005 2006.e
Mine.production,.t.Au.(MCS) 2.550 2.590 2.�30 2.�70 2.500
Mine.production,.t.Au.(WBD) 2.508 2.�62 2.�2� 2.�29 N
Mine.production,.t.Au.(WMS) 2.530 2.520 2.�90 N N
Main producers´ share in the world mine output (2005; according to MCS):
South Africa 11.9 % Peru 8.4 %Australia 10.6 % Russia 6.8 %USA 10.4 % Indonesia 5.6 %China 9.1 % Canada 4.8 %
The first three countries produce roughly one third of the world production. More than 60 % of world reserves are concentrated on their territories.
According to The Gold Institute, following mines belonged to those with the highest gold mine production in the last years: Grasberg (Indonesia), Yanacocha (Peru), Muruntau (Uzbekistan), Betze Post (USA), Driefontein (South Africa), Twin Creeks (USA), Carlin (USA), Kloof (South Africa), Cortez (USA), Great Noligwa (South Africa), Porgera (Papua New Guinea), Randfontein (South Africa), Pierina (Peru), Meikle (USA), Kalgoorlie Con-solidated Gold Mines Pty. Ltd. (Australia), Kumtor (Kyrgizstan), Obuasi (Ghana), Round Mountain (USA), Sadiola (Mali) and Lihir (Papua New Guinea).
Newmont Mining (mine production in 2003: 7.38 mill t oz), AngloGold Ashanti (5.63 mill t oz), Barrick Gold (5.51 mill t oz), Gold Fields (4.20 mill t oz), Placer Dome (3.86 mill t oz) and Harmony Gold Mining (3.33 mill t oz) represent six most important gold mining companies.
9. World market pricesAs for prices, gold represents a special metal. Its price is affected by many factors, among
which speculative trade and global political climate are the most important. Consequently, the major world gold market centres quote gold prices twice a day (morning and afternoon fixing) in USD/troy oz. The price development is observed in actual and real prices using deflator of USD. The highest average price during the last 25 years was reached in 1980 – USD 614.63 per troy oz (actual price). This highest price was due to the global political situation, which reflected the revolution in Iran, the Soviet invasion of Afghanistan, the petroleum shock, high inflation and the onset of the Iraqi–Iranian war. The average annual prices were below USD 400 per troy oz in London in the last 5 years (average p.m. fixing) and fell under USD 300 per troy oz in the end of 1997. Prices of gold hit twenty-years´ minimum in 1999. Low gold prices (along with the attempt of banks to diversify their port-folios) represented one of the reasons why a number of the National Banks began to sell parts of gold reserves, which resulted in further price decrease. No significant price changes followed in 2000. Agreement among the most important national banks about co-ordination and limitation of gold sale of their reserves caused only a short-term price increase. Gold
Metallic ores

373
prices remained on a very low level major part of the year. The low prices were characteris-tic also for 2001, when the metal prices were oscillating between 255 and 295 USD/troy oz. This trend changed during 2002, when the price of gold started to increase from about 280 USD/troy oz up to 350 USD/troy oz in the end of the year. World price oscillated between 320 and 400 USD/troy oz for major part of the year 2003 and it reached its highest level since February 1996, i.e. 411.70 USD/troy oz (1 troy oz = 31.1035 g), in December 2003. In 2004, in line with the increasing trend of other raw materials, a marked increase of gold prices occurred. The prices oscillated between 375 and 455 USD/troy oz, which represented the highest maxima since 1988. Rise of the world gold prices continued also in the year 2005, especially its second half, when prices increased from about 420 to 540 USD/troy oz. Gold price increased also in the first half of 2006, when it reached 725 USD/troy oz. The price fluctuated between 550 and 650 USD/troy oz in the rest of the year. In the first half of 2007, gold prices were still higher, between 610 and 690 USD/troy oz. Gold price increase is related to price increase of other commodities, however, it has to be evaluated also taking into account continuously falling price of the US dollar, in which gold is quoted. On the other hand, the trend seems to be long-term and a number of mining companies started to revaluate some formerly uneconomic projects.
Commodity/Year 2002 2003 200� 2005 2006
Gold, London, average p.m. fixing USD/t.oz 310 36� �10 ��5 603
10. recyclingGold is widely recycled from jewellery and other industries. Recycling may reach as
much as 20–25 % worldwide, even though the data on recycling are rather difficult to ob-tain.
11. possible substitutesThe consumption of gold and its alloys in jewellery and electricity and electronics uses
is decreasing due to the introduction of parts made of common but gold plated metals. Gold can be replaced by palladium, platinum and silver. Gold could be replaced by rhodium or other precious metals only in a very limited extent. In classic jewellery, however, gold and its alloys are indispensable.
Gold


375
BaSIC DaTa ON SElECTED raW MaTErIalS NOT prODUCED IN THE CZECH rEpUBlIC
Many types of raw materials were not included in this yearbook, as they have not been produced in the Czech Republic. As some of them are though important items in Czech foreign trade of mineral raw materials, at least basic data on the following commodities are given below: aluminium, titanium, rock salt, asbestos, minerals of the sillimanite group, mullite, magnesite, talc, perlite, sulphur, raw materials used in industrial fertilizers produc-tion.
aluminiumBauxite deposits form industrial exploitable Al-resources. Bauxite is an impure mixture
of Al-minerals – gibbsite (Al2O3.3H2O), boehmite (Al2O3.H2O) and diaspore (Al2O3.H2O). From a genetic standpoint bauxite is divided in type “terra rossa” alias genuine bauxite, connected to carbonate rocks weathering (for example Jamaica, Haiti, Dominican Repub-lic, Hungary), and lateritic bauxite, created by lateritic weathering of various rocks with Al-contents (Guyana, Surinam, Brazil, India, Ghana, Australia). Al-clays were registered in the North Bohemian (brown coal) Basin (deposit Ležáky) in the Czech Republic until recently.
World production of primary Al reached almost 30 mill t in 2005. The most important world producers are China (26 %), Russia (12 %), Canada (8 %), the USA (8 %), Australia (6 %), Brazil (5 %) and Norway (5 %).
Foreign trade2606 – aluminium ores and concentrates
2002 2003 200� 2005 2006
Import,.t 15.391 13.871 21.20� 25.1�7 2�.829
Export,.t. 390 5�6 502 13 20
281820 – Aluminium oxide (other than synthetic corundum)
2002 2003 200� 2005 2006
Import,.t 22.117 23.1�2 26.908 28.�81 2�.078
Export,.t. 85 93 126 195 297

376
281830 – aluminium hydroxide
2002 2003 200� 2005 2006
Import,.t. 11.981 12.767 17.279 10.997 9.797
Export,.t. 68 205 1�0 139 61
7601 – Raw (unwrought) aluminium
2002 2003 200� 2005 2006
Import,.t 1�2.957 1�9.570 165.980 166.877 180.365
Export,.t. 3�.63� �3.0�� �8.6�6 �8.077 52.51�
7602 – aluminium waste and scrap
2002 2003 200� 2005 2006
Import,.t 2�.006 2�.336 27.606 3�.0�9 �9.050
Export,.t. 33.716 33.13� 37.7�6 39.388 5�.295
TitaniumPrimary Ti-ores deposits are created by bodies of magmatogenous origin in anorthosite
and gabbro (Canada, Russia) and also in alkaline rocks, in which they are enriched by weathering (Brazil, South Africa, India). Placers represent the most important deposit type for industry, especially placers of a beach type (Australia, India). An important share in Ti-ores mine production have Australian beach sands, which represents about one fourth of world production of ilmenite (FeTiO3) (1.2 mill t) and nearly one half of world production of rutile (TiO2) (220 kt) concentrates and practically the total world mine production of leu-coxene (mixture of Fe-Ti oxides) (35 kt). South Africa (Richards Bay Minerals Co.) repre-sents another important producer. World production of ilmenite represented about 4.8 mill t in 2005 and 5 mill t in 2006 (estimate). After Australia with 24 % share in ilmenite mine production, South Africa (18 %), Canada (15 %), China (9 %) and Norway (8 %) belong to the largest ilmenite producers. World production of rutile is substantially lower, amounting to 0.35 mill t in 2005 and 0.44 mill t in 2006 (estimate). Australia (46 %) and South Africa (30 %) followed by Ukraine (16 %) and India (5 %) belong to the biggest rutile producers.
Basic data on selected raw materials not produced in the Czech Republic

377
Foreign trade2614 – Titanium ores and concentrates
2002 2003 200� 2005 2006
Import,.t 60.976 7�.709 75.101 80.�07 1�9.92�
Export,.t. 106 177 873 3�0 �92
8108 – Titanium and products of it, including waste and scrap
2002 2003 200� 2005 2006
Import,.t 372 620 800 1.0�5 1.156
Export,.t. 82 239 191 338 �3�
rock saltRock salt (halite) is a sedimentary rock composed mostly or completely of sodium chlo-
ride (NaCl). It usually originates by chemical sedimentation (evaporation) from true solu-tions. There are two genetic types of halite deposits in solid state – fossil bedded deposits and salt domes. New hypotheses of evaporate sedimentation presume sedimentation both on coastal supratidal mud flats, or sabkhas and in deep sea basins that did not dry up and were not salt pans at all. Rock salt is used mainly in chemical industry for production of chlorine, soda and some inorganic salts (60 %), in the food industry as preservative (23 %), for roads sprinkling in winter (8 %), in rubber, paints, ceramics and agriculture. Salt is pro-duced in more than 120 countries in the world; world mine production of rock salt reached about 225 mill t in 2005. Leaders in salt production are the USA (20 %), China (17 %), Germany (8 %), India (7 %) and Canada (6 %).
Foreign trade2501 – Salt (inclusive table and denaturated salt), and pure sodium chloride; also in water solution
2002 2003 200� 2005 2006
Import,.t 622.�80 681.13� 909.965 8�0.20� 1.152.389
Export,.t. 7.76� 10.�90 12.986 15.�2� 30.653
Rock salt

378
asbestos Term asbestos is used for technically utilizable solid mineral fibres of variable mineral
composition. The asbestos of the highest quality is formed by flexible chrysotile fibres, less commonly by amosite and crocidolite. Brittle fibres are usually composed of anthophyllite. Less important is amphibole asbestos formed by tremolite or actinolite.
Asbestos deposits originate by hydrothermal processes connected with metamorphism of ultramafic rocks, dolomitic limestones or ferruginous sedimentary formations.
The asbestos quality is given by length of fibres and their flexibility. The most expensive is so-called textile asbestos; the raw material of the lowest quality is used in production of asbestos-concrete products. The extent of asbestos use (e.g. in brake lining in car indus-try) has been restricted for health and ecological reasons during the last years. Chrysotile asbestos covers about 90 % of the world production, two thirds of the remaining 10 % are represented by crocidolite and one third by amosite. World mine production of asbestos was estimated at 2,24 kt in 2005, 875 kt of which produced Russia, about 350 kt Kazakhstan, 330 kt China, about 260 kt Canada, about 240 kt Brazil and 120 kt Zimbabwe.
Foreign trade2524 – asbestos
2002 2003 200� 2005 2006
Import,.t 785 1.�6� 2.891 0 0
Export,.t 0 0 2�8 1 N
andalusite, kyanite, sillimanite, mullite Andalusite, kyanite (formerly named also disthen) and sillimanite are mutually poly-
morph minerals with a high Al content. Andalusite is a typical mineral of metamorphosed rocks. Kyanite occurs especially in crystalline schists (micaschists, gneisses) rich in Al, less frequently also on contacts, in granulites and eclogites. Locally it forms even individually mineable deposits of the practical importance. Sillimanite occurs in pegmatites, especially though also in metamorphic rocks. Mullite – the main component of special refractory materials – is formed at temperatures above 1,100 °C. Mullite (2Al2O3.2SiO2) is a mineral, which forms by heating of all aluminosilicates. Elongated acicular crystals, which form during cooling of the melt, penetrate it and strenghten the burnt material. Mullite gives the most important technological properties to a number of refractory products (e.g. fire-clay). Refractoriness, heat resistance, resistance against temperature changes etc. increase with increasing mullite content. All the sillimanite group minerals represent a very valuable raw material appreciated especially for its toughness, resistance against high temperatures, low expansion, and excellent isolation properties as well as resistance against corrosion. It serves for production of special types of porcelain, furnace lining etc. World mine produc-tion is estimated at 350 ths tonnes per year. South Africa (andalusite, sillimanite), the USA, France and India represent the main producers.
Basic data on selected raw materials not produced in the Czech Republic

379
Foreign trade250850 – andalusite, kyanite and sillimanite
2002 2003 200� 2005 2006
Import,.t 2.373 3.�80 3.333 3.18� 5.2�8
Export,.t 23 0 0 15 0
250860 – Mullite
2002 2003 200� 2005 2006
Import,.t 300 3�0 ��6 5�9 1.518
Export,.t 12 5 72 192 608
MagnesiteMagnesite (MgCO3) is the most important mineral of magnesium. It occurs in crystal-
line and massive (crypto-crystalline) form. Crystalline magnesite grain size is more than 10 mm. Massive magnesite is characterised by grain size of 0.004 to 0.01 mm and conchoi-dal fracture resemblant porcelain. Magnesite deposits are related to rocks rich in magne-sium – dolomites and serpentinites. Crystalline magnesite originates by hydrothermal Mg influx into carbonate rocks; massive magnesite originates by CO2 addition to serpentine or is of sedimentary origin. Magnesite usually contains various contents of CaO, Fe2O3, MnO, Al2O3, SiO2 and others, which affect the quality of the material. The mineral is considered as magnesite providing MgO content more than 40% and CaO content max. 4%. Both magnesite types are used for caustic clinker production for refractory materials, insulations and special cements. Magnesite is also used in chemical industry and in paper and synthetic silk production. Magnesite world mine production fluctuated between 12 and 14 mill t in recent years. The major producer of magnesite is China (35 %), followed by Turkey (18 %), Slovakia (11 %), Russia (7 %), DPR Korea (6 %), and Austria (6 %).
Foreign trade251910 – Natural magnesium carbonate (magnesite)
2002 2003 200� 2005 2006
Import,.t 3.516 5.528 5.973 6.860 5.320
Export,.t. 7 1.569 1.033 1.586 �8
Magnesite

380
251990 – Magnesia, fused, dead-burned, other magnesium oxides
2002 2003 200� 2005 2006
Import,.t 32.090 3�.�07 �2.�11 �3.53� 51.678
Export,.t �� 355 2.758 �.695 �.067
TalcTalc is a soft scaled magnesium silicate Mg3Si4O10(OH)2 of melting-point from 1,200 to
1,500 °C. All inclusions containing Fe3+, pyrite and Mn oxides represent undesirable impuri-ties. Talc is characterised by chemical (acid and lye) resistance, low electric and heat con-ductivity, high sorption ability, perfect basal cleavability and pure white colour (some high grade varieties). Talc originates by SiO2 addition to rocks rich in magnesium (dolomites, dolomitic limestone, magnesites and ultrabasic rocks) during the hydrothermal processes and regional metamorphism. Well-workable massive cryptocrystalline talc variety with high electric resistance is called steatite. Also rock mixtures of talc and magnesite, often with high chlorite content, called soapstone, are of the similar properties like talc. World mine production reached about 8.25 mill t in 2005 according to Mineral Commodity Summaries. The major producer of talc is China (36 %), followed with a large gap by Republic of Korea (11 %), the USA (10 %), India (8 %), Brazil (7 %), Finland (7 %), and Japan (5 %).
Foreign trade2526 – Natural steatite; talc
2002 2003 200� 2005 2006
Import,.t 9.299 10.278 9.��6 10.213 10.898
Export,.t 191 133 172 292 201
perlitePerlite is a natural volcanic glass (hyaloclastite) formed largely of SiO2 (65–78 %), main-
ly of rhyolite and sometimes andesite composition. It originates by lava disintegration in contact with water. Heating up to temperatures of about 1,000 oC results in abrupt expan-sion and formation of glass foam, during which the volume increases four to twenty times so that the density reaches values of 0.08 to 0.2 t/m3. Expanded perlite is used in building industry for its both heat and sound insulation properties, for production of light weight concrete and in adsorption mixtures used for removing of oil slicks on the water surface. Adsorption properties of perlite are used also in production of feeding mixtures and litter. World mine production of perlite was estimated at 2,328 kt for the year 2005. The largest producers are Greece (about 1000 kt), the USA (500 kt) followed by Japan (240 kt), Turkey (160 kt) and Mexico (90 kt). Slovakia with its deposit Lehôtka pod Brehy represents an important producer, too.
Basic data on selected raw materials not produced in the Czech Republic
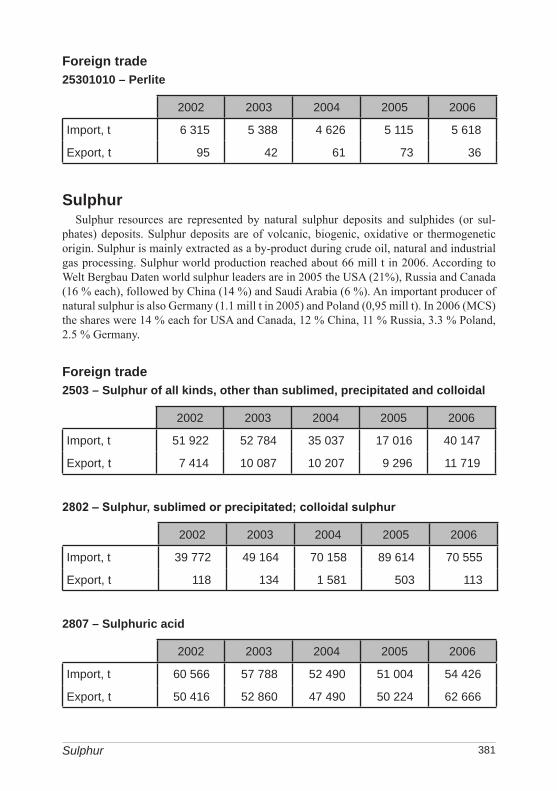
381
Foreign trade25301010 – perlite
2002 2003 200� 2005 2006
Import,.t 6.315 5.388 �.626 5.115 5.618
Export,.t. 95 �2 61 73 36
SulphurSulphur resources are represented by natural sulphur deposits and sulphides (or sul-
phates) deposits. Sulphur deposits are of volcanic, biogenic, oxidative or thermogenetic origin. Sulphur is mainly extracted as a by-product during crude oil, natural and industrial gas processing. Sulphur world production reached about 66 mill t in 2006. According to Welt Bergbau Daten world sulphur leaders are in 2005 the USA (21%), Russia and Canada (16 % each), followed by China (14 %) and Saudi Arabia (6 %). An important producer of natural sulphur is also Germany (1.1 mill t in 2005) and Poland (0,95 mill t). In 2006 (MCS) the shares were 14 % each for USA and Canada, 12 % China, 11 % Russia, 3.3 % Poland, 2.5 % Germany.
Foreign trade2503 – Sulphur of all kinds, other than sublimed, precipitated and colloidal
2002 2003 200� 2005 2006
Import,.t 51.922 52.78� 35.037. 17.016 �0.1�7
Export,.t. 7.�1� 10.087 10.207 9.296 11.719
2802 – Sulphur, sublimed or precipitated; colloidal sulphur
2002 2003 200� 2005 2006
Import,.t 39.772 �9.16� 70.158 89.61� 70.555
Export,.t. 118 13� 1.581 503 113
2807 – Sulphuric acid
2002 2003 200� 2005 2006
Import,.t 60.566 57.788 52.�90 51.00� 5�.�26
Export,.t. 50.�16 52.860 �7.�90 50.22� 62.666
Sulphur

382
Other raw materials used in industrial fertilizers productionThe raw materials used in production of industrial fertilizers, either singly, or in combina-
tion, are divided in nitrogenous, phosphatic and potassic. Also microelements needful for sus-tenance of organisms (Ca, Mg, B, Cu, Fe, Mn, Mo and Zn) are included into this group. World consumption of industrial fertilizers reached about 91 mill t N, 37 mill t P2O5 and 26 mill t K2O in 2005/06.
Natural nitrates are known as the Chile saltpetre, they form a long narrow deposits zone (100 km) in desert Atacama in Chile. Production capacity of the Chile saltpetre reaches 1 mill t, whereas world production capacity of synthetic NH3 is fluctuating about 150 mill t. The most used fertilizers with N contents are (NH4)2 HPO4 and Ca(NH2)2.
There are two genetic types of natural phosphorus resources – endogenous type and exogenous type. Exogenous deposits in sea sediments (about 80 % of the world produc-tion) and endogenous apatite deposits in alkaline igneous rocks (almost the total remain-ing production) are of the most important resources for industrial fertilizers production. World production of P2O5 contained in phosphorus-bearing rocks oscillates between 130 and 150 mill t. The most important producers of sedimentary phosphorites are the USA (about 25 %), China (about 20 %) and Morocco (about 20 % including the Western Sahara area). The major world apatite supplier is Russia.
Resources of potassic raw materials are represented almost exclusively by evaporite de-posits occurring together with rock salt. There are two chemical types of evaporite deposits: deposits rich on Mg-sulphates (main minerals are carnallite, polyhalite and epsomite) and deposits poor on Mg (main minerals are sylvite and carnallite). World K2O production reached about 29.5 mill t in 2005. Leader of producers is Canada (36 %), followed by Rus-sia (17 %), Belarus (13 %) and Germany (12 %).
Foreign trade3102 – Nitrogenous fertilizers
2002 2003 200� 2005 2006
Import,.t �63.680 �31.�89 515.058 518.701 522.851
Export,.t. �03.762 5�7.62� 600.230 533.128 537.115
2510 – Natural phosphates
2002 2003 200� 2005 2006
Import,.t 27.955 2�.299 2�.282 22.63� 28.1�1
Export,.t. 592 683 33 5�5 726
Basic data on selected raw materials not produced in the Czech Republic
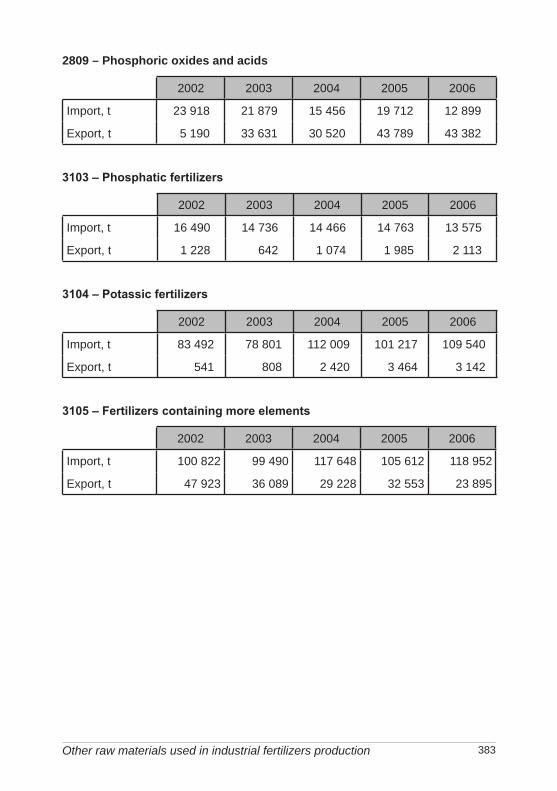
383
2809 – phosphoric oxides and acids
2002 2003 200� 2005 2006
Import,.t 23.918 21.879 15.�56 19.712 12.899
Export,.t. 5.190 33.631 30.520 �3.789 �3.382
3103 – Phosphatic fertilizers
2002 2003 200� 2005 2006
Import,.t 16.�90 1�.736 1�.�66 1�.763 13.575
Export,.t. 1.228 6�2 1.07� 1.985 2.113
3104 – Potassic fertilizers
2002 2003 200� 2005 2006
Import,.t 83.�92 78.801 112.009 101.217 109.5�0
Export,.t. 5�1 808 2.�20 3.�6� 3.1�2
3105 – Fertilizers containing more elements
2002 2003 200� 2005 2006
Import,.t 100.822 99.�90 117.6�8 105.612 118.952
Export,.t. �7.923 36.089 29.228 32.553 23.895
Other raw materials used in industrial fertilizers production
