mineral commodity summaries 2017 · each chapter of the 2017 edition of the u.s. geological survey...
TRANSCRIPT

MINERAL COMMODITY SUMMARIES 2017

Cover: 160913-N-KR702-410 STRAIT OF GEORGIA (Sept. 13, 2016) The Arleigh-Burke-class guided-missile destroyer USS Shoup (DDG 86) conducts a high-speed turn during a torpedo evasion exercise. Shoup is underway conducting routine training exercise. (U.S. Navy photo by Mass Communication Specialist 2nd Class/Released)

U.S. Department of the Interior U.S. Geological Survey
MINERAL COMMODITY SUMMARIES 2017
Abrasives Fluorspar Mercury Silicon Aluminum Gallium Mica Silver Antimony Garnet Molybdenum Soda Ash Arsenic Gemstones Nickel Stone Asbestos Germanium Niobium Strontium Barite Gold Nitrogen Sulfur Bauxite Graphite Palladium Talc Beryllium Gypsum Peat Tantalum Bismuth Hafnium Perlite Tellurium Boron Helium Phosphate Rock Thallium Bromine Indium Platinum Thorium Cadmium Iodine Potash Tin Cement Iron and Steel Pumice Titanium Cesium Iron Ore Quartz Crystal Tungsten Chromium Iron Oxide Pigments Rare Earths Vanadium Clays Kyanite Rhenium Vermiculite Cobalt Lead Rubidium Wollastonite Copper Lime Salt Yttrium Diamond Lithium Sand and Gravel Zeolites Diatomite Magnesium Scandium Zinc Feldspar Manganese Selenium Zirconium
U.S. Department of the Interior SALLY JEWELL, Secretary
U.S. Geological Survey Suzette M. Kimball, Director
U.S. Geological Survey, Reston, Virginia: 2017
Manuscript approved for publication January 19, 2017.
For more information on the USGS—the Federal source for science about the Earth, its natural and living resources, natural hazards, and the environment— visit http://www.usgs.gov or call 1–888–ASK–USGS.
For an overview of USGS information products, including maps, imagery, and publications, visit http://www.usgs.gov/pubprod For sale by the Superintendent of Documents, U.S. Government Publishing Office Mail: Stop IDCC; Washington, DC 20402–0001 Phone: (866) 512–1800 (toll-free); (202) 512–1800 (DC area) Fax: (202) 512–2104 Internet: bookstore.gpo.gov
Any use of trade, product, or firm names is for descriptive purposes only and does not imply endorsement by the U.S. Government.
Although this report is in the public domain, permission must be secured from the individual copyright owners to reproduce any copyrighted material contained within this report.
Suggested citation: U.S. Geological Survey, 2017, Mineral commodity summaries 2017: U.S. Geological Survey, 202 p., https://doi.org/10.3133/70180197.
ISBN 978-1-4113-4104-3

1
CONTENTS Page Page
General:
Introduction .................................................................... 3 Growth Rates of Leading and Coincident Indexes for
Mineral Products ......................................................... 4 The Role of Nonfuel Minerals in the U.S. Economy ...... 5 2016 U.S. Net Import Reliance for Selected Nonfuel
Mineral Materials ........................................................ 6
Significant Events, Trends, and Issues .......................... 7 Appendix A—Abbreviations and Units of Measure .... 196 Appendix B—Definitions of Selected Terms Used in
This Report .............................................................. 196 Appendix C—Reserves and Resources ..................... 197 Appendix D—Country Specialists Directory ............... 201
Mineral Commodities:
Abrasives (Manufactured) ............................................ 20 Aluminum ..................................................................... 22 Antimony ...................................................................... 24 Arsenic ......................................................................... 26 Asbestos ...................................................................... 28 Barite ............................................................................ 30 Bauxite and Alumina .................................................... 32 Beryllium ...................................................................... 34 Bismuth ........................................................................ 36 Boron ............................................................................ 38 Bromine ........................................................................ 40 Cadmium ...................................................................... 42 Cement......................................................................... 44 Cesium ......................................................................... 46 Chromium..................................................................... 48 Clays ............................................................................ 50 Cobalt ........................................................................... 52 Copper ......................................................................... 54 Diamond (Industrial) ..................................................... 56 Diatomite ...................................................................... 58 Feldspar and Nepheline Syenite .................................. 60 Fluorspar ...................................................................... 62 Gallium ......................................................................... 64 Garnet (Industrial) ........................................................ 66 Gemstones ................................................................... 68 Germanium .................................................................. 70 Gold .............................................................................. 72 Graphite (Natural) ........................................................ 74 Gypsum ........................................................................ 76 Helium .......................................................................... 78 Indium .......................................................................... 80 Iodine ........................................................................... 82 Iron and Steel ............................................................... 84 Iron and Steel Scrap .................................................... 86 Iron and Steel Slag ...................................................... 88 Iron Ore ........................................................................ 90 Iron Oxide Pigments .................................................... 92 Kyanite and Related Minerals ...................................... 94 Lead ............................................................................. 96 Lime ............................................................................. 98 Lithium........................................................................ 100 Magnesium Compounds ............................................ 102 Magnesium Metal ....................................................... 104 Manganese ................................................................ 106
Mercury ....................................................................... 108 Mica (Natural) ............................................................. 110 Molybdenum ............................................................... 112 Nickel .......................................................................... 114 Niobium (Columbium) ................................................. 116 Nitrogen (Fixed)—Ammonia ....................................... 118 Peat ............................................................................ 120 Perlite ......................................................................... 122 Phosphate Rock ......................................................... 124 Platinum-Group Metals ............................................... 126 Potash ........................................................................ 128 Pumice and Pumicite .................................................. 130 Quartz Crystal (Industrial) .......................................... 132 Rare Earths ................................................................ 134 Rhenium ..................................................................... 136 Rubidium .................................................................... 138 Salt ............................................................................. 140 Sand and Gravel (Construction) ................................. 142 Sand and Gravel (Industrial) ...................................... 144 Scandium .................................................................... 146 Selenium ..................................................................... 148 Silicon ......................................................................... 150 Silver ........................................................................... 152 Soda Ash .................................................................... 154 Stone (Crushed) ......................................................... 156 Stone (Dimension) ...................................................... 158 Strontium .................................................................... 160 Sulfur .......................................................................... 162 Talc and Pyrophyllite .................................................. 164 Tantalum ..................................................................... 166 Tellurium ..................................................................... 168 Thallium ...................................................................... 170 Thorium ...................................................................... 172 Tin ............................................................................... 174 Titanium and Titanium Dioxide ................................... 176 Titanium Mineral Concentrates .................................. 178 Tungsten ..................................................................... 180 Vanadium ................................................................... 182 Vermiculite .................................................................. 184 Wollastonite ................................................................ 186 Yttrium ........................................................................ 188 Zeolites (Natural) ........................................................ 190 Zinc ............................................................................. 192 Zirconium and Hafnium .............................................. 194

2
INSTANT INFORMATION Information about the U.S. Geological Survey, its programs, staff, and products is available from the Internet at <http://www.usgs.gov> or by calling (888) ASK–USGS [(888) 275–8747]. This publication has been prepared by the National Minerals Information Center. Information about the Center and its products is available from the Internet at <http://minerals.usgs.gov/minerals/> or by writing to Director, National Minerals Information Center, 988 National Center, Reston, VA 20192.
KEY PUBLICATIONS Minerals Yearbook—These annual publications review the mineral industries of the United States and of more than 180 other countries. They contain statistical data on minerals and materials and include information on economic and technical trends and developments. The three volumes that make up the Minerals Yearbook are Volume I, Metals and Minerals; Volume II, Area Reports, Domestic; and Volume III, Area Reports, International. Mineral Commodity Summaries—Published on an annual basis, this report is the earliest Government publication to furnish estimates covering nonfuel mineral industry data. Data sheets contain information on the domestic industry structure, Government programs, tariffs, and 5-year salient statistics for more than 90 individual minerals and materials. Mineral Industry Surveys—These periodic statistical and economic reports are designed to provide timely statistical data on production, shipments, stocks, and consumption of 30 mineral commodities. The surveys are issued monthly, quarterly, or at other regular intervals. Metal Industry Indicators—This monthly publication analyzes and forecasts the economic health of three metal industries (primary metals, steel, and copper) using leading and coincident indexes. Nonmetallic Mineral Products Industry Indexes—This monthly publication analyzes the leading and coincident indexes for the nonmetallic mineral products industry (NAICS 327). Materials Flow Studies—These publications analyze global supply chains and characterize major components of mineral and material flows from ore extraction through processing to first-tier products to ultimate disposition to help better understand the economy, manage the use of natural resources, and protect the environment. Recycling Reports—These studies illustrate the recycling of metal commodities and identify recycling trends. Historical Statistics for Mineral and Material Commodities in the United States (Data Series 140)—These reports provide a compilation of statistics on production, trade, and use of approximately 90 mineral commodities since as far back as 1900.
WHERE TO OBTAIN PUBLICATIONS • Mineral Commodity Summaries and the Minerals Yearbook are sold by the U.S. Government Publishing Office.
Orders are accepted over the Internet at <http://bookstore.gpo.gov>, by telephone toll free (866) 512–1800; Washington, DC area (202) 512–1800, by fax (202) 512–2104, or through the mail (P.O. Box 979050, St. Louis, MO 63197–9000).
• All current and many past publications are available in PDF format (and some are available in XLS format)
through <http://minerals.usgs.gov/minerals/>.

3
INTRODUCTION Each chapter of the 2017 edition of the U.S. Geological Survey (USGS) Mineral Commodity Summaries (MCS) includes information on events, trends, and issues for each mineral commodity as well as discussions and tabular presentations on domestic industry structure, Government programs, tariffs, 5-year salient statistics, and world production and resources. The MCS is the earliest comprehensive source of 2016 mineral production data for the world. More than 90 individual minerals and materials are covered by two-page synopses. For mineral commodities for which there is a Government stockpile, detailed information concerning the stockpile status is included in the two-page synopsis. Abbreviations and units of measure, and definitions of selected terms used in the report, are in Appendix A and Appendix B, respectively. “Appendix C—Reserves and Resources” includes “Part A—Resource/Reserve Classification for Minerals” and “Part B—Sources of Reserves Data.” A directory of USGS minerals information country specialists and their assigned countries is Appendix D. The USGS continually strives to improve the value of its publications to users. Constructive comments and suggestions by readers of the MCS 2017 are welcomed.

GROWTH RATES OF LEADING AND COINCIDENT INDEXES FOR MINERAL PRODUCTS
Sources: U.S. Geological Survey, Metal Industry Indicators and Nonmetallic Mineral Products Industry Indexes.
The leading indexes historically give signals several months in advance of major changes in the corresponding coincident index, which measures current industry activity. The growth rates, which can be viewed as trends, are expressed as compound annual rates based on the ratio of the current month's index to its average level during the preceding 12 months.
NONMETALLIC MINERAL PRODUCTS: LEADING AND COINCIDENT GROWTH RATES, 1994–2016
PRIMARY METALS: LEADING AND COINCIDENT GROWTH RATES, 1994–2016
4

THE ROLE OF NONFUEL MINERALS IN THE U.S. ECONOMY
(ESTIMATED VALUES IN 2016)
NET EXPORTS OF MINERAL RAW MATERIALS
GOLD, SODA ASH, ZINC CONCENTRATES, ETC.
Imports: $4.5 billion Exports: $7.5 billion Net exports: $3.0 billion
DOMESTIC MINERAL RAW MATERIALS FROM MINING
COPPER ORES, IRON ORE, SAND AND GRAVEL, STONE, ETC.
Value: $74.6 billion
METALS AND MINERAL PRODUCTS RECYCLED DOMESTICALLY
ALUMINUM, GLASS, STEEL, ETC.
Value of old scrap: $20.9 billion
NET EXPORTS OF OLD SCRAP
GOLD, STEEL, ETC.
Imports: $4.5 billion Exports: $14.9 billion Net exports: $10.4 billion
MINERAL MATERIALS PROCESSED DOMESTICALLY
ALUMINUM, BRICK, CEMENT, COPPER, FERTILIZERS, STEEL, ETC.
Value of shipments: $675 billion
NET IMPORTS OF PROCESSED MINERAL MATERIALS
METALS, CHEMICALS, ETC.
Imports: $122 billion Exports: $91 billion Net imports: $31 billion
Sources: U.S. Geological Survey and the U.S. Department of Commerce
1Major consuming industries of processed mineral materials are construction, durable goods manufacturers, and some nondurable goods manufacturers. The value of shipments for processed mineral materials cannot be directly related to gross domestic product.
U.S. ECONOMY
Gross Domestic Product: $ 18,860 billion
VALUE ADDED TO GROSS DOMESTIC PRODUCT BY MAJOR INDUSTRIES THAT CONSUME PROCESSED MINERAL MATERIALS1
Value: $ 2,780 billion
5

Commodity Percent Major import sources (2012–15)2
ARSENIC 100 China, JapanASBESTOS 100 BrazilCESIUM 100 Canada FLUORSPAR 100 Mexico, China, South Africa, MongoliaGALLIUM 100 China, Germany, United Kingdom, UkraineGRAPHITE (natural) 100 China, Mexico, Canada, BrazilINDIUM 100 Canada, China, France, BelgiumMANGANESE 100 South Africa, Gabon, Australia, GeorgiaMICA, sheet (natural) 100 China, Brazil, Belgium, AustriaNIOBIUM (columbium) 100 Brazil, CanadaQUARTZ CRYSTAL (industrial) 100 China, Japan, Romania, United KingdomRARE EARTHS3 100 China, Estonia, France, JapanRUBIDIUM 100 CanadaSCANDIUM 100 China STRONTIUM 100 Mexico, Germany, ChinaTANTALUM 100 China, Kazakhstan, Germany, ThailandTHALLIUM 100 Germany, RussiaTHORIUM 100 India, France, United KingdomVANADIUM 100 Czech Republic, Canada, Republic of Korea, AustriaYTTRIUM 100 China, Estonia, Japan, GermanyGEMSTONES 99 Israel, India, Belgium, South AfricaBISMUTH 95 China, Belgium, Peru, United KingdomTITANIUM MINERAL CONCENTRATES 91 South Africa, Australia, Canada, MozambiquePOTASH 90 Canada, Russia, Chile, IsraelGERMANIUM 85 China, Belgium, Russia, CanadaSTONE (dimension) 84 China, Brazil, Italy, TurkeyANTIMONY 83 China, Thailand, Bolivia, BelgiumZINC 82 Canada, Mexico, Peru, AustraliaRHENIUM 81 Chile, Poland, GermanyGARNET (industrial) 79 Australia, India, South Africa, ChinaBARITE 78 China, India, Morocco, MexicoFUSED ALUMINUM OXIDE (crude) >75 China, Canada, VenezuelaBAUXITE >75 Jamaica, Brazil, Guinea, GuyanaTELLURIUM >75 Canada, China, Belgium, PhilippinesTIN 75 Peru, Indonesia, Malaysia, BoliviaCOBALT 74 China, Norway, Finland, JapanDIAMOND (dust grit, and powder) 73 China, Ireland, Romania, RussiaPLATINUM 73 South Africa, Germany, United Kingdom, ItalyIRON OXIDE PIGMENTS (natural) >70 Cyprus, France, Austria, SpainIRON OXIDE PIGMENTS (synthetic) >70 China, Germany, Canada, BrazilPEAT 69 Canada SILVER 67 Mexico, Canada, Peru, PolandCHROMIUM 58 South Africa, Kazakhstan, RussiaMAGNESIUM COMPOUNDS 53 China, Brazil, Canada, AustraliaALUMINUM 52 Canada, Russia, United Arab Emirates, ChinaIODINE >50 Chile, JapanLITHIUM >50 Chile, Argentina, ChinaSILICON CARBIDE (crude) >50 China, South Africa, Netherlands, RomaniaZIRCONIUM MINERAL CONCENTRATES >50 South Africa, Australia, SenegalZIRCONIUM (unwrought) >50 China, Japan, GermanyBROMINE <50 Israel, China, JordanMICA, scrap and flake (natural) 48 Canada, China, India, FinlandPALLADIUM 48 South Africa, Russia, Italy, United KingdomTITANIUM (sponge) 41 Japan, Kazakhstan, ChinaSILICON 38 Russia, China, Canada, Brazil, South AfricaCOPPER 34 Chile, Canada, MexicoLEAD 30 Canada, Mexico, Republic of Korea, PeruVERMICULITE 30 Brazil, South Africa, China, ZimbabweMAGNESIUM METAL <30 Israel, Canada, China, MexicoNITROGEN (fixed)—AMMONIA 28 Trinidad and Tobago, Canada, Russia, UkraineTUNGSTEN >25 China, Canada, Bolivia, GermanyNICKEL 25 Canada, Australia, Norway, Russia
2In descending order of import share.3Data include lanthanides.
2016 U.S. NET IMPORT RELIANCE1
1Not all mineral commodities covered in this publication are listed here. Those not shown include mineral commodities for which the United States is a net exporter (alumina; boron; clays; diatomite; helium; iron and steel scrap; iron ore; kyanite; molybdenum; sand and gravel, industrial; selenium; soda ash; titanium dioxide pigment; wollastonite; and zeolites) or less than 25% import reliant (abrasives, metallic; beryllium; cadmium; cement; diamond, industrial stones; feldspar; gypsum; iron and steel; iron and steel slag; lime; perlite; phosphate rock; pumice; sand and gravel, construction; salt; stone, crushed; sulfur; and talc). For some mineral commodities (gold, hafnium, and mercury), not enough information is available to calculate the exact percentage of import reliance.
6

7 SIGNIFICANT EVENTS, TRENDS, AND ISSUES
In 2016, the estimated value of total nonfuel mineral production in the United States of $74.6 billion was a slight increase from the revised total of $73.4 billion in 2015. Increased construction activity spurred increased production of industrial minerals, especially those used in infrastructure and residential construction. Although starting the year relatively low, prices for several metals, especially for some of the precious metals, began to trend upward. Decreased production of most metals produced in the United States, however, contributed to an overall decline in the value of metal production. Several U.S. metal mines and processing facilities were idled or closed permanently in 2016, including iron ore mines in Michigan and Minnesota; three primary aluminum smelters in Indiana, Missouri, and Washington; one secondary zinc smelter in North Carolina; a titanium sponge facility in Utah, the only such facility in the United States; and titanium mineral operations in Virginia. In addition, in May, the weekly average rig count for oil and gas drilling reached its lowest level since the 1940s when that measurement was first recorded. The reduced drilling activity resulted in decreased production of some industrial mineral products used in the drilling sector. The U.S. Geological Survey (USGS) generates composite leading and coincident indexes to measure economic activity in the primary metals and the nonmetallic minerals industries. As shown in the charts on page 4, for each of the indexes, a growth rate is calculated to measure its change relative to the previous 12 months. The indexes’ growth rate is a 6-month smoothed compound annual rate that measures near-term trend. Usually, a growth rate above +1.0% signals an increase in primary metals or nonmetallic minerals industry activity, and a growth rate below -1.0% indicates a downturn in activity. The primary metals leading index growth rate increased steadily January through November 2016 (−4.4 to 6.8, respectively). Additionally, November 2016 represented the seventh consecutive month with a primary metals index growth rate greater than +1.0%, which may signal near-term strength in primary metals industry activity. The nonmetallic mineral products industry leading index growth rate, after declining from January through March 2016, moved above the growth rate threshold (+1.0%) in April and May, declined below the threshold in June, then moved above in July, below in August, and above September through November. This may suggest gathering strength in the nonmetallic mineral products industry in the near term. As shown in the figure on page 5, minerals remained fundamental to the U.S. economy, contributing to the real gross domestic product at several levels, including mining, processing, and manufacturing finished products. The estimated value of nonfuel mineral raw materials produced at mines in the United States in 2016 was $74.6 billion, a slight increase from the revised total of $73.4 billion in 2015. Domestic raw materials and domestically recycled materials were used to process mineral materials worth $675 billion. These mineral materials were, in turn, consumed by downstream industries with an estimated
value of $2.78 trillion in 2016, a 3% increase from the revised figure of $2.69 trillion in 2015. The figure on page 6 illustrates the reliance of the United States on foreign sources for raw and processed mineral materials. In 2016, imports made up more than one-half of the U.S. apparent consumption of 50 nonfuel mineral commodities, and the United States was 100% import reliant for 20 of those. This is an increase from 47 and 19 nonfuel mineral commodities, respectively, in 2015. The figure on page 8 shows the countries from which the majority of these mineral commodities were imported and the number of mineral commodities for which each highlighted country was a leading supplier. China, followed by Canada, supplied the largest number of nonfuel mineral commodities. Additionally, the United States was import reliant for an additional 30 commodities and was a net exporter of 16 nonfuel mineral commodities. The estimated value of U.S. metal mine production in 2016 was $23.0 billion (table 1), 5% less than that of 2015. Principal contributors to the total value of metal mine production in 2016 were gold (37%), copper (29%), iron ore (15%), and zinc (7%). The estimated value of U.S. industrial minerals production in 2016 was $51.6 billion, about 5% more than that of 2015. The value of industrial minerals production in 2016 was dominated by crushed stone (31%), cement (18%), and construction sand and gravel (17%). In 2016, U.S. production of 13 mineral commodities was valued at more than $1 billion each. These were, in decreasing order of value, crushed stone, cement, construction sand and gravel, gold, copper, industrial sand and gravel, iron ore (shipped), lime, phosphate rock, salt, soda ash, zinc, and clays (all types). In 2016, 11 States each produced more than $2 billion worth of nonfuel mineral commodities. These States were, in descending order of production value, Nevada, Arizona, Texas, California, Minnesota, Florida, Alaska, Michigan, Wyoming, Missouri, and Utah (table 3). The Defense Logistics Agency (DLA) Strategic Materials is responsible for providing safe, secure, and environmentally sound stewardship for strategic and critical materials in the U.S. National Defense Stockpile (NDS). DLA Strategic Materials stores 37 commodities at 6 locations in the United States. In fiscal year 2016, DLA Strategic Materials acquired $3.72 million of new materials and sold $42.5 million of excess materials from the NDS. At the end of fiscal year 2016, materials valued at $1.1 billion remained in the NDS. Of the remaining material, some was being held in reserve, some was offered for sale, and sales of some of the materials were suspended. Additional detailed information can be found in the “Government Stockpile” sections in the mineral commodity chapters that follow. Under the authority of the Defense Production Act of 1950, the U.S. Geological Survey advises the DLA on acquisitions and disposals of NDS mineral materials.

180°
180°
160°
160°
140°
140°
120°
120°
100°
100°
80°
80°
60°
60°
40°
40°
20°
20°
0°
0°
-20°
-20°
-40°
-40°
-60°
-60°
-80°
-80°
-100°
-100°
-120°
-120°
-140°
-140°
-160°
-160°
-180°
-180°
40° 4
20°
0° 0°
-20° -2
-40°
80° 80°
60° 60°
-60°
-80° -80°
1 - 3
4 - 6
7 - 12
13 - 18
19 - 24
0
1 to 3
4 to 6
13 to 18
7 to 12
19 to 28
UNITED STATES
CANADA
SOUTH AFRICA
CHINA
Number of commodities, 2016EXPLANATION
BRAZIL
MEXICO
RUSSIA
AUSTRALIA
INDIA
JAPAN
PERUBOLIVIACHILE
ARGENTINA
THAILAND
MONGOLIA
JAMAICA
GUINEA
MOZAMBIQUE
GABON
REPUBLIC OF KOREA
MALAYSIA
PHILIPPINES
INDONESIA
ISRAEL
KAZAKHSTAN
NORWAY FINLAND
TURKEY
UKRAINEIRELANDUNITED KINGDOM
CYPRUSMOROCCO
AUSTRIABELGIUMCZECH REPUBLICESTONIAFRANCEGEORGIAGERMANYITALYNETHERLANDSPOLANDROMANIASPAIN
GUYANA
SENEGAL
VENEZUELA
UNITED ARAB EMIRATES
MAJOR IMPORT SOURCES OF NONFUEL MINERAL COMMODITIESFOR WHICH THE UNITED STATES WAS GREATER THAN 50% NET IMPORT RELIANT IN 2016
Source: U.S. Geological Survey
8

9 TABLE 1.—U.S. MINERAL INDUSTRY TRENDS
2012 2013 2014 2015 2016e Total mine production (million dollars):
Metals 34,600 31,600 30,700 24,300 23,000 Industrial minerals 41,000 43,200 50,100 49,100 51,600 Coal 40,600 36,700 34,800 28,500 23,800
Employment (thousands of production workers): Coal mining 74 67 62 55 46 Nonfuel mineral mining 101 100 100 100 96 Chemicals and allied products 491 490 497 510 521 Stone, clay, and glass products 273 275 282 299 302 Primary metal industries 317 306 311 310 294
Average weekly earnings of production workers (dollars): Coal mining 1,348 1,361 1,442 1,383 1,332 Chemicals and allied products 910 919 918 928 950 Stone, clay, and glass products 766 782 828 841 850 Primary metal industries 907 961 991 983 1,001
eEstimated. Sources: U.S. Geological Survey, U.S. Department of Energy, U.S. Department of Labor.
TABLE 2.—U.S. MINERAL-RELATED ECONOMIC TRENDS
2012 2013 2014 2015 2016e Gross domestic product (billion dollars) 16,155 16,663 17,348 17,947 18,860 Industrial production (2012=100): Total index 100 102 105 105 105
Manufacturing: 100 101 102 104 104 Nonmetallic mineral products 100 105 110 113 117 Primary metals: 100 103 103 97 95
Iron and steel 100 102 100 88 89 Aluminum 100 107 106 104 95 Nonferrous metals (except aluminum) 100 107 108 109 115
Chemicals 100 97 96 98 96 Mining: 100 106 118 116 107
Coal 100 97 98 86 67 Oil and gas extraction 100 111 127 136 131 Metals 100 101 104 97 89 Nonmetallic minerals 100 103 113 118 119
Capacity utilization (percent): Total industry: 77 77 78 77 76 Mining: 88 88 91 83 78
Metals 72 73 77 73 67 Nonmetallic minerals 78 81 88 90 90
Housing starts (thousands) 781 925 1,003 1,111 1,167 Light vehicle sales (thousands)1 14,400 15,300 16,350 17,340 17,540 Highway construction, value, put in place (billion dollars) 80 81 84 90 92 eEstimated.
1Excludes imports. Sources: U.S. Department of Commerce, Federal Reserve Board, Autodata Corp., and U.S. Department of Transportation.

10 TABLE 3.—VALUE OF NONFUEL MINERAL PRODUCTION IN THE UNITED STATES AND
PRINCIPAL NONFUEL MINERALS PRODUCED IN 2016e, 1
State Value
(millions) Rank2
Percent of U.S. total Principal minerals, in order of value
Alabama $1,370 21 1.83 Stone (crushed), cement (portland), lime, sand and gravel (construction), cement (masonry).
Alaska 3,090 7 4.15 Zinc, gold, lead, silver, sand and gravel (construction). Arizona 5,560 2 7.45 Copper, sand and gravel (construction), molybdenum
concentrates, cement (portland), stone (crushed). Arkansas 959 27 1.29 Stone (crushed), bromine, sand and gravel (industrial), cement
(portland), sand and gravel (construction). California 3,520 4 4.71 Sand and gravel (construction), cement (portland), boron
minerals, stone (crushed), soda ash. Colorado 1,510 19 2.02 Gold, cement (portland), sand and gravel (construction),
molybdenum concentrates, stone (crushed). Connecticut3 352 41 0.47 Stone (crushed), sand and gravel (construction), clays (common),
stone (dimension), gemstones (natural). Delaware3 20 50 0.03 Sand and gravel (construction), stone (crushed), magnesium
compounds, gemstones (natural). Florida 3,260 6 4.37 Phosphate rock, stone (crushed), cement (portland), sand and
gravel (construction), cement (masonry). Georgia 1,790 13 2.41 Stone (crushed), clays (kaolin), cement (portland), sand and
gravel (construction), cement (masonry). Hawaii 133 47 0.18 Stone (crushed), sand and gravel (construction), gemstones
(natural). Idaho 654 33 0.88 Phosphate rock, sand and gravel (construction), silver, lead, stone
(crushed). Illinois 1,720 15 2.30 Sand and gravel (industrial), stone (crushed), cement (portland),
sand and gravel (construction), tripoli. Indiana 1,010 25 1.35 Stone (crushed), cement (portland), sand and gravel
(construction), lime, cement (masonry). Iowa 644 29 1.20 Stone (crushed), cement (portland), sand and gravel (industrial),
sand and gravel (construction), lime. Kansas 623 24 0.84 Helium (Grade–A), cement (portland), salt, stone (crushed),
helium (crude). Kentucky3 525 30 0.70 Stone (crushed), lime, cement (portland), sand and gravel
(construction), sand and gravel (industrial). Louisiana3 530 34 0.71 Salt, sand and gravel (construction), stone (crushed), sand and
gravel (industrial), lime. Maine3 102 44 0.14 Sand and gravel (construction), cement (portland), stone
(crushed), stone (dimension), peat. Maryland3 310 35 0.41 Cement (portland), stone (crushed), sand and gravel
(construction), cement (masonry), stone (dimension). Massachusetts3 405 38 0.54
Stone (crushed), sand and gravel (construction), stone (dimension), lime, clays (common).
Michigan 2,830 8 3.80 Iron ore, cement (portland), stone (crushed), sand and gravel (construction), nickel concentrates.
Minnesota3 3,270 5 4.38 Iron ore, sand and gravel (construction), sand and gravel (industrial), stone (crushed), stone (dimension).
Mississippi 220 43 0.30 Sand and gravel (construction), stone (crushed), clays (fuller's earth), clays (ball), sand and gravel (industrial).
Missouri 2,490 11 3.33 Cement (portland), stone (crushed), sand and gravel (industrial), lime, lead.
Montana 925 28 1.24 Palladium metal, copper, platinum metal, sand and gravel (construction), molybdenum concentrates.
See footnotes at end of table.

11 TABLE 3.—VALUE OF NONFUEL MINERAL PRODUCTION IN THE UNITED STATES AND
PRINCIPAL NONFUEL MINERALS PRODUCED IN 2016e, 1—Continued
State Value
(millions) Rank2
Percent of U.S. total Principal minerals, in order of value
Nebraska3 $196 39 0.26 Cement (portland), stone (crushed), sand and gravel (construction), sand and gravel (industrial), lime.
Nevada 7,650 1 10.26 Gold, copper, sand and gravel (construction), stone (crushed), silver.
New Hampshire 131 48 0.18
Stone (crushed), sand and gravel (construction), stone (dimension), gemstones (natural).
New Jersey 333 42 0.45 Stone (crushed), sand and gravel (construction), sand and gravel (industrial), peat, gemstones.
New Mexico 1,460 20 1.95 Copper, potash, sand and gravel (construction), cement (portland), stone (crushed).
New York 1,770 14 2.37 Stone (crushed), salt, sand and gravel (construction), cement (portland), clays (common).
North Carolina3 1,170 18 1.57 Stone (crushed), phosphate rock, sand and gravel (construction), sand and gravel (industrial), clays (common).
North Dakota3 132 45 0.18 Sand and gravel (construction), stone (crushed), lime, clays (common), sand and gravel (industrial).
Ohio3 1,270 17 1.70 Stone (crushed), sand and gravel (construction), salt, lime, cement (portland).
Oklahoma 777 32 1.04 Stone (crushed), cement (portland), sand and gravel (industrial), sand and gravel (construction), gypsum (crude).
Oregon 507 36 0.68 Stone (crushed), sand and gravel (construction), cement (portland), diatomite, perlite (crude).
Pennsylvania3 1,830 12 2.45 Stone (crushed), cement (portland), lime, sand and gravel (construction), sand and gravel (industrial).
Rhode Island3 72 49 0.10 Sand and gravel (construction), stone (crushed), sand and gravel (industrial), gemstones (natural).
South Carolina3 823 31 1.10 Cement (portland), stone (crushed), sand and gravel (construction), sand and gravel (industrial), cement (masonry).
South Dakota 363 40 0.49 Gold, cement (portland), sand and gravel (construction), stone (crushed), lime.
Tennessee 1,210 23 1.62 Stone (crushed), cement (portland), zinc, sand and gravel (construction), sand and gravel (industrial).
Texas 4,840 3 6.48 Stone (crushed), cement (portland), sand and gravel (construction), sand and gravel (industrial), salt.
Utah 2,490 10 3.34 Copper, sand and gravel (construction), magnesium metal, salt, cement (portland).
Vermont3 137 46 0.18 Stone (crushed), sand and gravel (construction), stone (dimension), talc (crude), gemstones (natural).
Virginia 1,230 22 1.65 Stone (crushed), cement (portland), sand and gravel (construction), lime, clays (fuller's earth).
Washington 965 26 1.29 Sand and gravel (construction), stone (crushed), gold, zinc, cement (portland).
West Virginia 425 37 0.57 Stone (crushed), cement (portland), sand and gravel (industrial), lime, cement (masonry).
Wisconsin 1,730 16 2.32 Sand and gravel (industrial), stone (crushed), sand and gravel (construction), lime, stone (dimension).
Wyoming 2,530 9 3.39 Soda ash, helium (Grade-A), clays (bentonite), sand and gravel (construction), cement (portland).
Undistributed 2,760 XX 3.70 Total 74,600 XX 100.00
eEstimated. XX Not applicable. 1Data are rounded to no more than three significant digits; may not add to totals shown. 2Rank based on total, unadjusted State values; ranking includes values that must be withheld to avoid disclosing company proprietary data. 3Partial total; excludes values that must be withheld to avoid disclosing company proprietary data, which are included in "Undistributed."

Be
B2B1
B2B1
B1
B2 B2B1
B2
B1
B1
P3
B1
B2B2
B1
B2
Au
Au
P2
B1P2
P2
P2P2 P2
P2 P2AuP2
P2
P2
P2
Au
P2
Au
Au
FeFe
FeFeFe
FeFe
B3
B3
Mg
MoMo
B5
P4
P1P1
P2P2
ZnZn
0 150 300 MILESB3
B4Au
AuAu
0 250 500 KILOMETERS
0 300 600 MILES
0 250 500 750 1,000 KILOMETERS
0 150 300 MILES
0 250 500 KILOMETERS
MAJOR METAL-MINING AREAS
B3
B4
Au Gold
B1 Copper and molybdenum
± gold and silver
B2 Copper ± silver
B3 Lead and zinc ± copper
± silver
B4 Zinc and silver
+ lead and gold
B5 Nickel, copper, and cobalt
Be Beryllium
Fe Iron ore
Mg Magnesium
Mo Molybdenum
P1 Silver ± base metals
± gold
P2 Gold and silver
P3 Gold and silver
± base metals
P4 Platinum and palladium
+ gold and silver
Zn Zinc
EXPLANATION
12

Bar
Bar Bar
Bar
B
B
Br
DiaDia
Dia
Dia
Dia
Dia
Dia
He
He
He
He
HeHe
He
I
Kya
Mica
Mica
Mica
Mica
O
P
PP
P
P
P
K
K
K
Pyrp
Salt
Salt
Salt
SaltSalt
Salt
Salt
SaltSalt Salt
SaltSalt
Salt
Salt Salt
SaltSalt
SaltSalt
Salt
Salt
Salt
Salt
Salt
Salt
Salt
Salt
SaltNaC
SS
S
S
S
S SS
S S
S
S
S
SS
S
S
S
S
S
SS
SS
S
S
S
S
S
S
S
S
S
S
SS
S
S
S
S
S
SS
S
S
S
S
S
Talc
Talc
Talc
Ver
Ver
Gyp
Gyp
Gyp
GypGyp
Gyp
Gyp
Gyp
GypGyp
Gyp
Gyp
Gyp
Gyp
Gyp
Gyp
Gyp
Gyp
Gyp
Gyp
Gyp
Gyp
Gyp
Gyp
Gyp
GypGyp
Gyp
Peat
PeatPeat
Peat
Peat
Peat
Peat
Peat
Peat
Peat
Peat Peat
Peat
K
Salt
Salt
Salt
Salt
Salt
NaC
S
S
SS
S
S
Talc
Gyp
Gyp
Gyp
PeatPeat
MgCp
MgCp
MgCp
MgCp
MgCp
MgCp
0 150 300 MILES
0 250 500 KILOMETERS
0 150 300 MILES
0 500 1,000 KILOMETERS
0 150 300 MILES
0 250 500 KILOMETERS
MAJOR INDUSTRIAL-MINERAL-PRODUCING AREAS—PART I
Ba Barite
B Borates
Br Bromine
Dia Diatomite
Gar Garnet
Gyp Gypsum
He Helium
IRZ Ilmenite, rutile, and zircon
I Iodine
Ky Kyanite
MgCp Magnesium compounds
Mica Mica
O Molybdenum
Peat Peat
P Phosphate rock
K Potash
Pyrp Pyrophyllite
Salt Salt
NaC Soda ash
S Sulfur
Talc Talc
Ver Vermiculite
Wol Wollastonite
Zeo Zeolites
EXPLANATION
13

BC
BC
BC
BC
BC
Bent
Bent
Bent
Bent
Bent
Bent
BentBent
Bent
Bent
Bent
Bent
Clay
Clay
Clay
Clay
Clay
Clay
Clay
Clay
Clay
DS
Clay
Clay
Clay
Clay
Clay
Clay
Clay
Clay
Clay
Clay
Clay
Clay
Clay
Clay
Clay
Clay
FC
FC
Ful
Ful
Ful
Ful
Ful
KaKa
Ka
Ka
Bent
ClayClay
Clay
Clay
Clay
Clay
ClayFul
Ful
Ful
Ka
IS
IS
IS
ISIS
IS
IS
ISIS
IS
IS
IS
IS
IS
IS
IS
IS
IS
IS
IS
IS
IS
IS
IS
IS
IS
ISIS
ISIS
DS
DS
DS
DS
DS
DS
DS
DS
DSDS
DSDS
DSDS
DS
DS
DS
DS
DS
DS
DS
DS
DS
DS
DS
DS
DS
DS
DS
DS
DS
DS
DS
DS
DS
Fel
Fel
Fel
Gar
Gar
IOP
Li
Per
Per
Per
Per
Per
Pum
Pum
Pum
Pum Pum
Pum
Pum Fel
Fel
Fel
IOP
Per
0 150 300 MILES
0 250 500 KILOMETERS
0 300 600 MILES
0 250 500 750 1,000 KILOMETERS
0 150 300 MILES
0 250 500 KILOMETERS
MAJOR INDUSTRIAL-MINERAL-PRODUCING AREAS—PART II
BC Ball clay
Bent Bentonite
Clay Common clay
DS Dimension stone
FC Fire clay
Fel Feldspar
Ful Fuller's earth
IOP Iron oxide pigments
IS Industrial sand
Ka Kaolin
Li Lithium
Per Perlite
Pum Pumice
EXPLANATION
BC
Clay
Clay
DS
DSDS
DS
DS
BentBent
Clay
14

*Partial total; excludes values that must be withheld to avoid disclosing company proprietary data, which are included with "Undistributed" in table 3.
0
1
2
3
4
5
6
7
8
Valu
e, in
billi
on d
ollar
s
Aggregates$25.1 billion
Industrial minerals$26.5 billion
Metals$23.0 billion
U.S. total: $74.6 billion
VALUE OF NONFUEL MINERALS PRODUCED IN 2016, BY STATE
EXPLANATIONValue, in billion dollars
<11 to 2>2 to 4>4 to 8
15

West
West
West
NortheastMidwest
South
VALUE OF METALSPRODUCED IN 2016, BY REGION
EXPLANATIONValue, in billion dollars
0>0 to 1>1 to 518.1
16

0
500
1,000
1,500
2,000
2,500
Valu
e, in
milli
on d
ollar
sVALUE OF INDUSTRIAL MINERALS
PRODUCED IN 2016, BY STATE
EXPLANATIONValue, in million dollars
<250250 to 775>775 to 2,000>2,000
17

0
200
400
600
800
1,000
1,200
1,400
1,600
Valu
e, in
milli
on d
ollar
sVALUE OF CRUSHED STONE
PRODUCED IN 2016, BY STATE
EXPLANATIONValue, in million dollars
Withheld<100100 to 300>300 to 600>600Crushed stone operation
18

0
200
400
600
800
1,000
1,200
1,400
Valu
e, in
milli
on d
ollar
sVALUE OF CONSTRUCTION SAND AND GRAVEL
PRODUCED IN 2016, BY STATE
EXPLANATIONValue, in million dollars
<8080 to 200>200 to 400>400Sand and gravel operation
19

20
ABRASIVES (MANUFACTURED)
(Fused aluminum oxide, silicon carbide, and metallic abrasives) (Data in metric tons unless otherwise noted)
Domestic Production and Use: Fused aluminum oxide was produced by two companies at three plants in the United States and Canada. Production of crude fused aluminum oxide had an estimated value of $1.92 million. Silicon carbide was produced by two companies at two plants in the United States. Domestic production of crude silicon carbide had an estimated value of about $26.4 million. Domestic production of metallic abrasives had an estimated value of about $124 million. Bonded and coated abrasive products accounted for most abrasive uses of fused aluminum oxide and silicon carbide. Salient Statistics—United States: 2012 2013 2014 2015 2016e Production: Fused aluminum oxide, crude1, 2 10,000 10,000 10,000 10,000 10,000 Silicon carbide2 35,000 35,000 35,000 35,000 35,000 Metallic abrasives 193,000 191,000 194,000 196,000 191,000 Imports for consumption: Fused aluminum oxide 244,000 209,000 198,000 164,000 157,000 Silicon carbide 100,000 119,000 130,000 139,000 116,000 Metallic abrasives 22,000 23,900 23,500 52,800 66,900 Exports: Fused aluminum oxide 19,200 24,500 19,500 15,000 14,700 Silicon carbide 20,000 18,400 22,300 19,700 7,580 Metallic abrasives 39,000 35,900 41,000 35,900 29,300 Consumption, apparent: Fused aluminum oxide3 225,000 185,000 179,000 149,000 142,000 Silicon carbide4 115,000 136,000 143,000 154,000 143,000 Metallic abrasives4 176,000 179,000 177,000 213,000 229,000 Price, value of imports, dollars per ton: Fused aluminum oxide, regular 563 663 659 579 445 Fused aluminum oxide, high-purity 1,080 971 1,420 1,290 1,440 Silicon carbide, crude 877 638 660 552 470 Metallic abrasives 988 1,030 1,020 584 468 Net import reliance5 as a percentage of apparent consumption: Fused aluminum oxide >75 >75 >75 >75 >75 Silicon carbide >50 >50 >50 >75 >50 Metallic abrasives E E E 8 16
Recycling: Up to 30% of fused aluminum oxide may be recycled, and about 5% of silicon carbide is recycled. Import Sources (2012–15): Fused aluminum oxide, crude: China, 84%; Canada, 7%; Venezuela, 5%; other, 4%. Fused aluminum oxide, grain: Jamaica, 15%; Austria, 15%; Germany, 14%; Brazil, 14%; other, 42%. Silicon carbide, crude: China, 71%; South Africa, 14%; Netherlands, 9%; Romania, 4%; other, 2%. Silicon carbide, grain: China, 47%; Brazil, 21%; Russia, 15%; Germany, 5%; other, 12%. Metallic abrasives: Canada, 35%; Sweden, 21%; China, 10%; Germany, 9%; other, 25%. Tariff: Item Number Normal Trade Relations 12–31–16 Artificial corundum, crude 2818.10.1000 Free. White, pink, ruby artificial corundum, greater than 97.5% aluminum oxide, grain 2818.10.2010 1.3% ad val. Artificial corundum, not elsewhere specified or included, fused aluminum oxide, grain 2818.10.2090 1.3% ad val. Silicon carbide, crude 2849.20.1000 Free. Silicon carbide, grain 2849.20.2000 0.5% ad val. Iron, pig iron, or steel granules 7205.10.0000 Free. Depletion Allowance: None. Prepared by Christine L. Thomas [(703) 648–7713, [email protected]]

21 ABRASIVES (MANUFACTURED)
Government Stockpile: None. Events, Trends, and Issues: In 2016, China was the world’s leading producer of abrasive fused aluminum oxide and abrasive silicon carbide, with producers operating nearly at capacity. Imports, especially from China where operating costs were lower, continued to challenge abrasives producers in the United States and Canada. Foreign competition, particularly from China, is expected to persist and continue to limit production in North America. Abrasives consumption in the United States is greatly influenced by activity in the manufacturing sectors, in particular the aerospace, automotive, furniture, housing, and steel industries. The U.S. abrasive markets also are influenced by technological trends. World Production Capacity: Fused aluminum oxidee Silicon carbidee 2015 2016 2015 2016 United States 60,400 60,400 42,600 42,600 Argentina — — 5,000 5,000 Australia 50,000 50,000 — — Austria 60,000 60,000 — — Brazil 50,000 50,000 43,000 43,000 China 800,000 800,000 455,000 455,000 France 40,000 40,000 16,000 16,000 Germany 80,000 80,000 36,000 36,000 India 40,000 40,000 5,000 5,000 Japan 15,000 15,000 60,000 60,000 Mexico — — 45,000 45,000 Norway — — 80,000 80,000 Venezuela — — 30,000 30,000 Other countries 80,000 80,000 190,000 190,000 World total (rounded) 1,280,000 1,280,000 1,010,000 1,010,000 World Resources: Although domestic resources of raw materials for the production of fused aluminum oxide are rather limited, adequate resources are available in the Western Hemisphere. Domestic resources are more than adequate for the production of silicon carbide. Substitutes: Natural and manufactured abrasives, such as garnet, emery, or metallic abrasives, can be substituted for fused aluminum oxide and silicon carbide in various applications. eEstimated. E Net exporter. — Zero. 1Production data for aluminum oxide are combined production data from Canada and United States to avoid disclosing company proprietary data. 2Rounded to the nearest 5,000 tons to avoid disclosing company proprietary data. 3Defined as imports – exports because production includes data from Canada. 4Defined as production + imports – exports. 5Defined as imports – exports.
U.S. Geological Survey, Mineral Commodity Summaries, January 2017

22
ALUMINUM1
(Data in thousand metric tons of metal unless otherwise noted) Domestic Production and Use: In 2016, three companies operated eight primary aluminum smelters in six States, at the beginning of the year; however, one smelter was permanently shut down and two smelters were temporarily idled later in the year. Three smelters operated at reduced capacity throughout the year. One smelter remained on standby throughout the year. Based on published market prices, the value of primary aluminum production was $1.48 billion, one-half of the value in 2015. Aluminum consumption was centered in the Midwest United States. Transportation applications accounted for an estimated 41% of domestic consumption; in descending order of consumption, the remainder was used in packaging, 20%; building, 15%; electrical, 8%; machinery, 7%; consumer durables, 6%; and other, 3%. Salient Statistics—United States: 2012 2013 2014 2015 2016e Production: Primary 2,070 1,946 1,710 1,587 840 Secondary (from old scrap) 1,630 1,630 1,700 1,470 1,490 Imports for consumption Crude and semimanufactures 3,760 4,160 4,290 4,560 5,370 Scrap 589 565 559 521 610 Exports, total 3,480 3,390 3,230 3,010 3,000 Consumption, apparent2 4,130 4,530 5,070 5,220 4,840 Price, ingot, average U.S. market (spot), cents per pound 101.0 94.2 104.5 88.2 80.0 Stocks, yearend: Aluminum industry, stocks 1,140 1,130 1,280 1,350 1,350 London Metal Exchange U.S. warehouses3 2,120 1,950 1,190 507 370 Employment, number4 31,500 30,100 30,900 31,000 27,000 Net import reliance5 as a percentage of apparent consumption 11 21 33 41 52 Recycling: In 2016, aluminum recovered from purchased scrap in the United States was about 3.54 million tons, of which about 58% came from new (manufacturing) scrap and 42% from old scrap (discarded aluminum products). Aluminum recovered from old scrap was equivalent to about 31% of apparent consumption. Import Sources (2012–15): Canada, 59%; Russia and United Arab Emirates, 6% each; China, 5%; and other, 24%. Tariff: Item Number Normal Trade Relations 12–31–16 Aluminum, not alloyed: Unwrought (in coils) 7601.10.3000 2.6% ad val. Unwrought (other than aluminum alloys) 7601.10.6000 Free. Aluminum alloys: Unwrought (billet) 7601.20.9045 Free. Aluminum waste and scrap: Used beverage container scrap 7602.00.0030 Free. Other 7602.00.0090 Free. Depletion Allowance: Not applicable.1 Government Stockpile: None. Events, Trends, and Issues: U.S. production of primary aluminum decreased for the fourth consecutive year, declining by about 47% in 2016 to the lowest level since 1951. During the year, three primary smelters were shut down. High power prices, low aluminum prices, and technical issues were cited for shutdowns. In January, a 263,000-ton-per-year smelter in New Madrid, MO, shut down two-thirds of its capacity following an electrical supply circuit failure. In February, the owner filed for bankruptcy protection, citing low prices for aluminum and bauxite from its mine in Jamaica, which was sold to a third party. In March, the remaining capacity was shut down and in October, the owner agreed to sell the smelter. In March, a 269,000-ton-per-year smelter in Evansville, IN, was permanently shut down. Also in March, the same company temporarily shut down the 184,000-ton-per-year smelter in Wenatchee, WA. In May, the company signed a power supply agreement that would last through February 2018 for its 279,000-ton-per-year smelter in Ferndale, WA, forestalling a scheduled shutdown. In October, domestic smelters were operating at about 44% of capacity of 1.73 million tons per year, down from 2 million tons per year in October 2015. Prepared by E. Lee Bray [(703) 648–4979, [email protected]]

23 ALUMINUM
U.S. import reliance increased in 2016 because primary production decreased and U.S. manufacturers were increasingly supplied by imports. U.S. imports of aluminum (crude and semimanufactures) increased by 18% in 2016 compared with those in 2015. Canada was the leading supplier of imported aluminum. Imports of crude aluminum (metal and alloys) and scrap in 2016 were 22% and 13% higher, respectively, than the quantities imported in 2015, but imports of semimanufactures were 5% lower. Imports of semimanufactures from China decreased by 18% in 2016 compared with those in 2015; China accounted for 31% of semimanufactures imported in 2016 compared with 54% in 2015. Total aluminum exports (crude, semimanufactures, and scrap) from the United States decreased by 6% in 2016 compared with those in 2015. At the request of the U.S. House of Representatives Committee on Ways and Means, the U.S. International Trade Commission (USITC) launched an investigation to examine the global aluminum industry and impact on U.S. producers. The USITC investigation is to examine industry characteristics, factors related to increased capacity, competitive strengths and weaknesses, recent trade trends, and the effect of government policies on production and trade of aluminum. The USITC also is to assess the impact of foreign government policies in select countries on their domestic production, consumption, exports, and prices of aluminum. The USITC held a public hearing concerning this investigation on September 29. Despite low prices, world primary aluminum production increased slightly in 2016 compared with production in 2015. The U.S. market price for primary ingot quoted by Platts Metals Week averaged $0.67 per pound in January and gradually increased through August when it averaged $0.74 per pound. In September, the average price decreased to $0.72 per pound. U.S. market prices generally followed the trend of prices on the London Metal Exchange (LME). Prices decreased despite a drawdown in global LME warehouse inventories of primary aluminum metal to 2.11 million tons in mid-October 2016 from 2.89 million tons at yearend 2015. Inventories at LME-bonded warehouses in the United States decreased to 287,000 tons in mid-October 2016 from 460,000 tons at yearend 2015. World Smelter Production and Capacity: Production Yearend capacity 2015 2016e 2015 2016e United States 1,587 840 2,000 1,730 Australia 1,650 1,680 1,720 1,720 Bahrain 961 970 970 970 Brazil 772 790 1,400 1,400 Canada 2,880 3,250 3,270 3,270 China 31,400 31,000 38,600 40,100 Iceland 800 800 840 840 India 2,360 2,750 3,850 3,850 Norway 1,230 1,230 1,550 1,550 Qatar 610 640 640 640 Russia 3,530 3,580 4,180 4,180 Saudi Arabia 682 740 740 740 South Africa 695 690 715 715 United Arab Emirates 2,400 2,400 2,400 2,400 Other countries 5,900 6,240 8,350 8,370 World total (rounded) 57,500 57,600 71,200 72,500 World Resources: Global resources of bauxite are estimated to be between 55 to 75 billion tons and are sufficient to meet world demand for metal well into the future.1 Substitutes: Composites can substitute for aluminum in aircraft fuselages and wings. Glass, paper, plastics, and steel can substitute for aluminum in packaging. Composites, magnesium, steel, and titanium can substitute for aluminum in ground transportation uses. Composites, steel, vinyl, and wood can substitute for aluminum in construction. Copper can replace aluminum in electrical and heat-exchange applications. eEstimated. 1See also Bauxite and Alumina. 2Defined as domestic primary metal production + recovery from old aluminum scrap + net import reliance; excludes imported scrap. 3Includes aluminum alloy. 4Alumina and aluminum production workers (North American Industry Classification System—3313). Source: U.S. Department of Labor, Bureau of Labor Statistics. 5Defined as imports – exports + adjustments for industry stock changes.
U.S. Geological Survey, Mineral Commodity Summaries, January 2017

24
ANTIMONY
(Data in metric tons of antimony content unless otherwise noted) Domestic Production and Use: In 2016, no marketable antimony was mined in the United States. A mine in Nevada that had extracted about 800 tons of stibnite ore from 2013 through 2014 was placed on care-and-maintenance status in 2015 and had no reported production in 2016. Primary antimony metal and oxide were produced by one company in Montana using imported feedstock. Secondary antimony production was derived mostly from antimonial lead recovered from spent lead-acid batteries. The estimated value of secondary antimony produced in 2016, based on the average New York dealer price for antimony, was about $26 million. Recycling supplied about 17% of estimated domestic consumption, and the remainder came mostly from imports. The value of antimony consumption in 2016, based on the average New York dealer price, was about $152 million. The estimated distribution of domestic primary antimony consumption was as follows: nonmetal products, including ceramics and glass and rubber products, 36%; flame retardants, 34%; and metal products, including antimonial lead and ammunition, 30%. Salient Statistics—United States: 2012 2013 2014 2015 2016e Production: Mine (recoverable antimony) — — — — — Smelter: Primary W W W W W Secondary 3,050 4,410 4,230 3,850 4,000 Imports for consumption: Ore and concentrates 380 342 365 320 200 Oxide, unwrought, powder, waste and scrap1 22,300 24,300 23,800 22,500 22,000 Exports: Ore and concentrates 106 36 41 31 30 Oxide, unwrought, powder, waste and scrap1 4,710 3,980 3,240 3,190 3,000 Consumption, apparent2 20,600 24,700 24,900 23,300 23,000 Price, metal, average, cents per pound3 565 463 425 327 300 Stocks, yearend 1,430 1,470 1,400 1,260 1,200 Employment, plant, number (yearend)e 24 24 27 27 27 Net import reliance4 as a percentage of apparent consumption 85 82 83 83 83 Recycling: The bulk of secondary antimony is recovered at secondary lead smelters as antimonial lead, most of which was generated by, and then consumed by, the lead-acid battery industry. Import Sources (2012–15): Metal: China, 67%; India, 18%; Hong Kong, 4%; and other, 11%. Ore and concentrate: Italy, 67%; China, 23%; India, 7%; and other, 3%. Oxide: China, 59%; Thailand, 11%; Bolivia, 11%; Belgium, 8%; and other, 11%. Total: China, 60%; Thailand, 9%; Bolivia, 9%; Belgium, 7%; and other, 15%. Tariff: Item Number Normal Trade Relations 12–31–16 Ore and concentrates 2617.10.0000 Free. Antimony oxide 2825.80.0000 Free. Antimony and articles thereof: Unwrought antimony; powder 8110.10.0000 Free. Waste and scrap 8110.20.0000 Free. Other 8110.90.0000 Free. Depletion Allowance: 22% (Domestic), 14% (Foreign). Government Stockpile: None. Events, Trends, and Issues: U.S. Antimony Corp. (USAC) operated a smelter in Montana that produced antimony metal and oxides from imported intermediate products (antimony oxides and sodium antimonate), primarily from Canada and Mexico, and a smelter in Mexico that processed concentrates from Australia and Mexico. USAC sold about 746 tons of antimony (antimony content of metal and oxides) in the first half of 2016, 38% more than that sold in the same period of 2015.5 At the end of 2014, a Canadian mining company completed a preliminary feasibility study for the Stibnite Gold Project in the Stibnite-Yellow Pine mining district in Idaho. In 2016, the company began drilling to expand mineral reserves and resources and took steps to initiate the environmental assessment and permitting process. Prepared by David E. Guberman [Contact Amy C. Tolcin, (703) 648–4940, [email protected]]
25 ANTIMONY
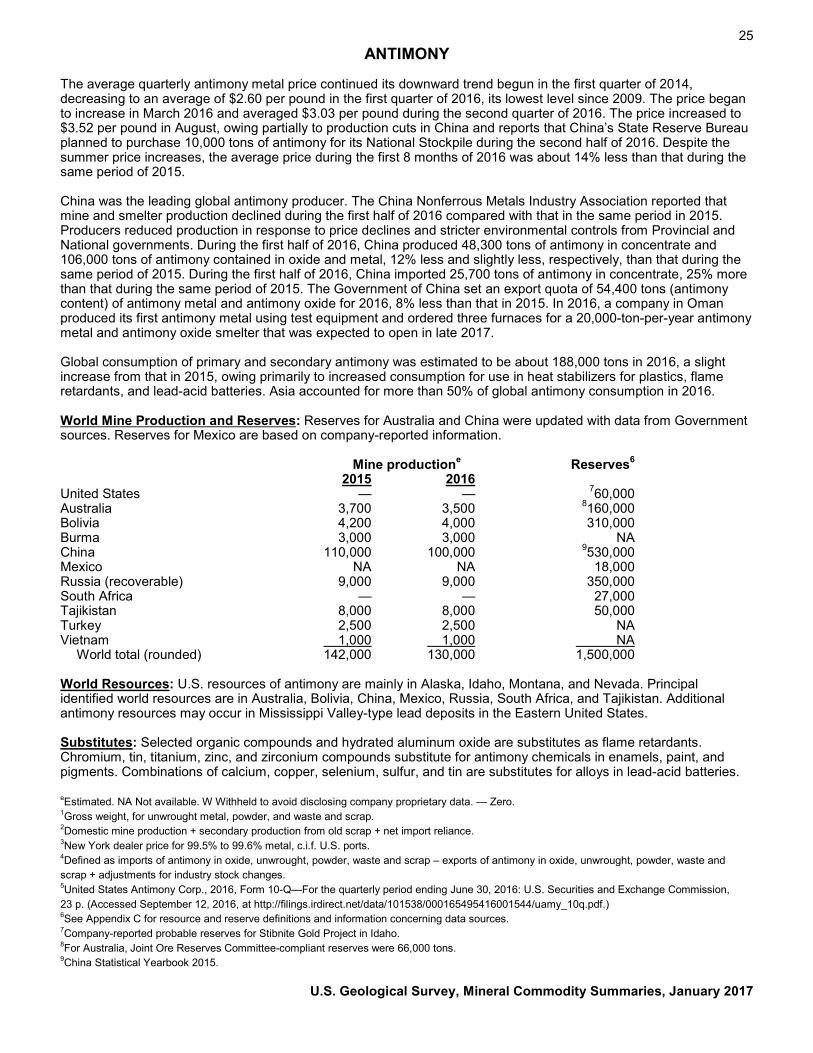
The average quarterly antimony metal price continued its downward trend begun in the first quarter of 2014, decreasing to an average of $2.60 per pound in the first quarter of 2016, its lowest level since 2009. The price began to increase in March 2016 and averaged $3.03 per pound during the second quarter of 2016. The price increased to $3.52 per pound in August, owing partially to production cuts in China and reports that China’s State Reserve Bureau planned to purchase 10,000 tons of antimony for its National Stockpile during the second half of 2016. Despite the summer price increases, the average price during the first 8 months of 2016 was about 14% less than that during the same period of 2015. China was the leading global antimony producer. The China Nonferrous Metals Industry Association reported that mine and smelter production declined during the first half of 2016 compared with that in the same period in 2015. Producers reduced production in response to price declines and stricter environmental controls from Provincial and National governments. During the first half of 2016, China produced 48,300 tons of antimony in concentrate and 106,000 tons of antimony contained in oxide and metal, 12% less and slightly less, respectively, than that during the same period of 2015. During the first half of 2016, China imported 25,700 tons of antimony in concentrate, 25% more than that during the same period of 2015. The Government of China set an export quota of 54,400 tons (antimony content) of antimony metal and antimony oxide for 2016, 8% less than that in 2015. In 2016, a company in Oman produced its first antimony metal using test equipment and ordered three furnaces for a 20,000-ton-per-year antimony metal and antimony oxide smelter that was expected to open in late 2017. Global consumption of primary and secondary antimony was estimated to be about 188,000 tons in 2016, a slight increase from that in 2015, owing primarily to increased consumption for use in heat stabilizers for plastics, flame retardants, and lead-acid batteries. Asia accounted for more than 50% of global antimony consumption in 2016. World Mine Production and Reserves: Reserves for Australia and China were updated with data from Government sources. Reserves for Mexico are based on company-reported information. Mine productione Reserves6 2015 2016 United States — — 760,000 Australia 3,700 3,500 8160,000 Bolivia 4,200 4,000 310,000 Burma 3,000 3,000 NA China 110,000 100,000 9530,000 Mexico NA NA 18,000 Russia (recoverable) 9,000 9,000 350,000 South Africa — — 27,000 Tajikistan 8,000 8,000 50,000 Turkey 2,500 2,500 NA Vietnam 1,000 1,000 NA World total (rounded) 142,000 130,000 1,500,000 World Resources: U.S. resources of antimony are mainly in Alaska, Idaho, Montana, and Nevada. Principal identified world resources are in Australia, Bolivia, China, Mexico, Russia, South Africa, and Tajikistan. Additional antimony resources may occur in Mississippi Valley-type lead deposits in the Eastern United States. Substitutes: Selected organic compounds and hydrated aluminum oxide are substitutes as flame retardants. Chromium, tin, titanium, zinc, and zirconium compounds substitute for antimony chemicals in enamels, paint, and pigments. Combinations of calcium, copper, selenium, sulfur, and tin are substitutes for alloys in lead-acid batteries.
eEstimated. NA Not available. W Withheld to avoid disclosing company proprietary data. — Zero. 1Gross weight, for unwrought metal, powder, and waste and scrap. 2Domestic mine production + secondary production from old scrap + net import reliance. 3New York dealer price for 99.5% to 99.6% metal, c.i.f. U.S. ports. 4Defined as imports of antimony in oxide, unwrought, powder, waste and scrap – exports of antimony in oxide, unwrought, powder, waste and scrap + adjustments for industry stock changes. 5United States Antimony Corp., 2016, Form 10-Q—For the quarterly period ending June 30, 2016: U.S. Securities and Exchange Commission, 23 p. (Accessed September 12, 2016, at http://filings.irdirect.net/data/101538/000165495416001544/uamy_10q.pdf.) 6See Appendix C for resource and reserve definitions and information concerning data sources. 7Company-reported probable reserves for Stibnite Gold Project in Idaho. 8For Australia, Joint Ore Reserves Committee-compliant reserves were 66,000 tons. 9China Statistical Yearbook 2015.
U.S. Geological Survey, Mineral Commodity Summaries, January 2017

26
ARSENIC
(Data in metric tons of arsenic content1 unless otherwise noted) Domestic Production and Use: Arsenic trioxide and primary arsenic metal have not been produced in the United States since 1985. The principal use for arsenic trioxide was for the production of arsenic acid used in the formulation of chromated copper arsenide (CCA) preservatives for the pressure treating of lumber used primarily in nonresidential applications. Three companies produced CCA preservatives in the United States in 2016. Ammunition used by the U.S. military was hardened by the addition of less than 1% arsenic metal, and the grids in lead-acid storage batteries were strengthened by the addition of arsenic metal. Arsenic metal was also used as an antifriction additive for bearings, to harden lead shot, and in clip-on wheel weights. Arsenic compounds were used in herbicides and insecticides. High-purity arsenic (99.9999%) was used by the electronics industry for GaAs semiconductors that are used for solar cells, space research, and telecommunications. Arsenic also was used for germanium-arsenide-selenide specialty optical materials. Indium-gallium-arsenide was used for short-wave infrared technology. The value of arsenic compounds and metal imported domestically in 2016 was estimated to be about $6.5 million. Salient Statistics—United States: 2012 2013 2014 2015 2016e Imports for consumption: Arsenic 883 514 688 514 800 Compounds 5,720 6,290 5,260 5,920 5,600 Exports, arsenic2 444 1,630 2,970 1,670 1,900 Estimated consumption3 6,620 6,810 5,940 6,430 6,400 Value, cents per pound, average4 Arsenic (China) 75 72 75 84 88 Trioxide (Morocco) 24 27 30 29 31 Net import reliance5 as a percentage of estimated consumption 100 100 100 100 100 Recycling: Arsenic metal was contained in new scrap recycled during GaAs semiconductor manufacturing. Arsenic was also contained in the process water, which was recycled at wood treatment plants where CCA was used. Although electronic circuit boards, relays, and switches may contain arsenic, no arsenic was known to have been recovered from them during recycling to recover other contained metals. No arsenic was recovered domestically from arsenic-containing residues and dusts generated at nonferrous smelters in the United States. Import Sources (2012–15): Arsenic: China, 89%; Japan, 10%; and other, 1%. Arsenic trioxide: Morocco, 55%; China, 35%; Belgium, 8%; and other, 2%. Tariff: Item Number Normal Trade Relations 12–31–16 Arsenic 2804.80.0000 Free. Arsenic acid 2811.19.1000 2.3% ad val. Arsenic trioxide 2811.29.1000 Free. Arsenic sulfide 2813.90.1000 Free. Depletion Allowance: 14% (Domestic and foreign). Government Stockpile: None. Events, Trends, and Issues: China and Morocco continued to be the leading global producers of arsenic trioxide, accounting for 87% of estimated world production and supplying almost all of U.S. imports of arsenic trioxide in 2016. China was the leading world producer of arsenic metal and supplied about 89% of U.S. arsenic metal imports in 2016. Given that arsenic metal has not been produced domestically since 1985, it is likely that only a small portion of the material reported by the U.S. Census Bureau as arsenic exports was pure arsenic metal, and most of the material that has been reported under this category reflects the gross weight of compounds, alloys, and residues containing arsenic. Therefore, the estimated consumption reported under salient U.S. statistics reflects only imports of arsenic products. Prepared by Mark Brininstool [Contact Micheal W. George, (703) 648–4962, [email protected]]

27 ARSENIC
High-purity (99.9999%) arsenic metal was used to produce gallium-arsenide (GaAs), indium-arsenide, and indium gallium-arsenide semiconductors that were used in biomedical, communications, computer, electronics, and photovoltaic applications. In 2015, the value of global GaAs device sales increased slightly to an estimated $7 billion, with wireless applications accounting for about 80% of revenue. See the Gallium chapter for additional details. Concern over the adverse effects of arsenic from natural and anthropogenic sources has led to numerous studies of arsenic in food and water. In March, the U.S. Food and Drug Administration (FDA) released a revised risk assessment for arsenic in rice and rice products. In April, the FDA took steps to reduce inorganic arsenic in infant rice cereal, a leading source of arsenic exposure in infants, and proposed a limit or “action level” of 100 parts per billion for inorganic arsenic. FDA testing found that the majority of infant rice cereal currently on the market either meets, or is close to, the proposed action level. World Production and Reserves: Production6 Reserves7 (arsenic trioxide) 2015 2016e United States — — Belgium 1,000 1,000 World reserves data are Bolivia 50 50 unavailable but are thought to be China 25,000 25,000 more than 20 times world production. Japan 45 45 Morocco 6,900 7,000 Namibia 1,960 1,900 Russia 1,500 1,500 World total (rounded) 36,500 36,500 World Resources: Arsenic may be obtained from copper, gold, and lead smelter flue dust, as well as from roasting arsenopyrite, the most abundant ore mineral of arsenic. Arsenic has been recovered from realgar and orpiment in China, Peru, and the Philippines; has been recovered from copper-gold ores in Chile; and was associated with gold occurrences in Canada. Orpiment and realgar from gold mines in Sichuan Province, China, were stockpiled for later recovery of arsenic. Arsenic also may be recovered from enargite, a copper mineral. Substitutes: Substitutes for CCA in wood treatment include alkaline copper quaternary, ammoniacal copper quaternary, ammoniacal copper zinc arsenate, copper azole, and copper citrate. Treated wood substitutes include concrete, plastic composite material, plasticized wood scrap, or steel. eEstimated. — Zero. 1Arsenic content of arsenic metal is 100%; arsenic content of arsenic compounds is calculated at 75.71%. 2Most of the materials reported to the U.S. Census Bureau as arsenic exports are thought to be arsenic-containing compounds or residues. 3Estimated to be the same as imports. 4Calculated from U.S. Census Bureau import data. 5Defined as imports. 6Chile, Mexico, and Peru were believed to be significant producers of commercial-grade arsenic trioxide, but have reported no production in recent years. 7See Appendix C for resource and reserve definitions and information concerning data sources.
U.S. Geological Survey, Mineral Commodity Summaries, January 2017

28
ASBESTOS
(Data in metric tons unless otherwise noted) Domestic Production and Use: The last U.S. producer of asbestos ceased operations in 2002 as a result of the decline in U.S. and international asbestos markets associated with health and liability issues. The United States has since been wholly dependent on imports to meet manufacturing needs. In 2016, U.S. consumption of asbestos was estimated to be about 340 tons, essentially unchanged from that of 2015. The chloralkali industry, which uses asbestos to manufacture semipermeable diaphragms that prevent chlorine generated at the anode of an electrolytic cell from reacting with sodium hydroxide generated at the cathode, likely accounted for 100% of asbestos consumption during 2016. Insufficient data were available to reliably identify any additional markets, but most industrial applications for asbestos have been significantly curtailed in the United States since the first domestic ban on some asbestos-containing products was implemented in 1973. In addition to asbestos minerals, an unknown quantity of asbestos was imported within manufactured products, possibly including brake linings and pads, building materials, gaskets, millboard, and yarn and thread, among others. Salient Statistics—United States: 2012 2013 2014 2015 2016e Imports for consumption 1,610 772 406 343 340 Exports1 — — — — — Consumption, estimated2 1,020 772 406 343 340 Price, average U.S. Customs value, dollars per ton 1,570 1,510 1,830 1,780 2,100 Net import reliance3 as a percentage of estimated consumption 100 100 100 100 100 Recycling: None. Import Sources (2012–15): Brazil, 100%. Tariff: Item Number Normal Trade Relations 12–31–16 Crocidolite 2524.10.0000 Free. Amosite 2524.90.0010 Free. Chrysotile: Crudes 2524.90.0030 Free. Milled fibers, group 3 grades 2524.90.0040 Free. Milled fibers, group 4 and 5 grades 2524.90.0045 Free. Other 2524.90.0055 Free. Other, asbestos 2524.90.0060 Free. Depletion Allowance: 22% (Domestic), 10% (Foreign). Government Stockpile: None. Prepared by Daniel M. Flanagan [(703) 648–7726, [email protected]]

29 ASBESTOS
Events, Trends, and Issues: Consumption of asbestos minerals in the United States has steadily declined during the past several decades, falling from a record high of 803,000 tons in 1973 to an estimated 340 tons in 2016. This decline has taken place as a result of health and liability issues associated with asbestos use, leading to the displacement of asbestos from traditional domestic markets by substitutes, alternative materials, and new technology. The chloralkali industry is currently the only major user of asbestos and accounted for an estimated 100% of domestic consumption in 2016, rising from an estimated 35% of consumption in 2010. The quantity of asbestos used by the chloralkali industry will likely continue to decline, however, as companies make greater use of nonasbestos diaphragms and membrane cells. Globally, asbestos-cement products are expected to continue to be the leading market for asbestos. Owing to continued demand for asbestos products in many regions of the world, global production is likely to remain steady at approximately 2.0 million metric tons per year for the near future. In 2016, about 95% of the asbestos minerals imported into and used within the United States were shipped from Brazil, with the remainder originating in Russia. All imports of asbestos minerals consisted of chrysotile. Although Canada was a major source of imports in the past, the United States has not imported asbestos from Canada since 2011. World Mine Production and Reserves: Mine productione Reserves4 2015 2016 United States — — Small Brazil 311,000 300,000 10,000,000 China 400,000 400,000 Large India 200 200 Moderate Kazakhstan 215,000 200,000 Large Russia 1,100,000 1,100,000 Large World total (rounded) 2,000,000 2,000,000 Large World Resources: Reliable evaluations of global asbestos resources have not been published recently, and the available information is insufficient to make accurate estimates. However, world resources are large and more than adequate to meet anticipated demand in the foreseeable future. U.S. resources are large, but are composed mostly of short-fiber asbestos for which use in asbestos-based products is more limited than long-fiber asbestos. Substitutes: Numerous materials substitute for asbestos. Substitutes include calcium silicate, carbon fiber, cellulose fiber, ceramic fiber, glass fiber, steel fiber, wollastonite, and several organic fibers, such as aramid, polyethylene, polypropylene, and polytetrafluoroethylene. Several nonfibrous minerals or rocks, such as perlite, serpentine, silica, and talc, are also considered to be possible asbestos substitutes for products in which the reinforcement properties of fibers are not required. For the chloralkali industry, membrane cell technology is one alternative to asbestos diaphragms. eEstimated. — Zero. 1Exports of asbestos minerals reported by the U.S. Census Bureau were 47 tons in 2012, 27 tons in 2013, 279 tons in 2014, 517 tons in 2015, and an estimated 980 tons in 2016. These shipments likely consisted of materials misclassified as asbestos, reexports, and (or) waste because the United States no longer mines asbestos. 2Assumed to equal imports, except in 2012, when an estimated 590 tons of asbestos were put into company stocks for future use. 3Defined as imports – exports. 4See Appendix C for resource and reserve definitions and information concerning data sources.
U.S. Geological Survey, Mineral Commodity Summaries, January 2017

30
BARITE
(Data in thousand metric tons unless otherwise noted) Domestic Production and Use: In 2016, about 316,000 tons of domestically mined crude barite valued at an estimated $37.7 million was sold or used for grinding. Most of the production came from four mines in Nevada; a significantly smaller quantity came from a single mine in Georgia. An estimated 1.35 million tons of barite (from domestic production and imports) was sold by crushers and grinders operating in eight States. More than 90% of the barite sold in the United States was used as a weighting agent in fluids used in the drilling of oil and natural gas wells. The majority of Nevada crude barite was ground in Nevada and then sold to companies drilling in the Central and Western United States. Offshore drilling operations in the Gulf of Mexico and onshore drilling operations in other regions primarily used imported barite. Barite also is used as a filler, extender, or weighting agent in products such as paints, plastics, and rubber. Some specific applications include use in automobile brake and clutch pads, automobile paint primer for metal protection and gloss, use as a weighting agent in rubber, and in the cement jacket around underwater petroleum pipelines. In the metal-casting industry, barite is part of the mold-release compounds. Because barite significantly blocks x-ray and gamma-ray emissions, it is used as aggregate in high-density concrete for radiation shielding around x-ray units in hospitals, nuclear powerplants, and university nuclear research facilities. Ultrapure barite is used as a contrast medium in x-ray and computed tomography examinations of the gastrointestinal tract. Salient Statistics—United States: 2012 2013 2014 2015 2016e Production: Sold or used, mine 666 723 663 425 316 Ground and crushed1 3,310 3,550 3,410 2,060 1,350 Imports for consumption 2,920 2,250 2,700 1,660 1,200 Exports 151 199 153 139 70 Consumption, apparent2 (crude and ground) 3,430 2,770 3,210 1,960 1,450 Estimated price, ground, average value, dollars per ton, f.o.b. mill 187 180 191 197 198 Employment, mine and mill, number 554 624 614 458 331 Net import reliance3 as a percentage of apparent consumption 81 74 79 78 78 Recycling: None. Import Sources (2012–15): China, 70%; India, 14%; Morocco, 7%; Mexico, 7%; and other, 2%. Tariff: Item Number Normal Trade Relations 12–31–16 Ground barite 2511.10.1000 Free. Crude barite 2511.10.5000 $1.25 per metric ton. Oxide, hydroxide, and peroxide 2816.40.2000 2% ad val. Other chlorides 2827.39.4500 4.2% ad val. Other sulfates of barium 2833.27.0000 0.6% ad val. Carbonate 2836.60.0000 2.3% ad val. Depletion Allowance: 14% (Domestic and foreign). Government Stockpile: None. Prepared by Michele E. McRae [(703) 648–7743, [email protected]]

31 BARITE
Events, Trends, and Issues: The count of active oil and gas drilling rigs has long been considered a good barometer of barite consumption. In 2016, the U.S. weekly average rig count reached its lowest level since the inception of the count in the 1940s. Domestic mine production and sales of ground barite are estimated to have reached the lowest levels since the 1990s. Furloughs, reductions in staff, and reduced operating hours were common throughout the domestic barite industry. Activity at many mines was minimal, although operations were known to have been temporarily suspended at only one mine and its associated grinding plant. That same mine, however, continued work on a planned mine expansion. Another small mining project to remove existing benches and stockpiles from an abandoned mine in Nevada was completed in 2016. A third company began operations at a new grinding plant in Corpus Christi, TX. World Mine Production and Reserves: In response to concerns about dwindling global reserves of 4.2-specific gravity barite used by the oil and gas drilling industry, the American Petroleum Institute issued an alternate specification for 4.1-specific gravity barite in 2010. This has likely stimulated exploration and expansion of global barite resources. Estimated reserves data are included only if developed since the adoption of the 4.1-specific gravity standard. Reserves data for China and Pakistan were revised based on Government information. Mine production Reserves4 2015 2016e United States 425 316 NA China 3,000 2,800 30,000 India 700 1,000 32,000 Iran 300 400 24,000 Kazakhstan 300 300 85,000 Mexico 266 250 NA Morocco 1,000 700 NA Pakistan 122 120 14,000 Russia 210 210 12,000 Thailand 171 170 18,000 Turkey 300 250 35,000 Vietnam 100 100 NA Other countries 520 520 29,000 World total (rounded) 7,410 7,140 > 320,000 World Resources: In the United States, identified resources of barite are estimated to be 150 million tons, and undiscovered resources contribute an additional 150 million tons. The world’s barite resources in all categories are about 2 billion tons, but only about 740 million tons is identified resources. However, no known systematic assessment of either U.S. or global barite resources has been conducted since the 1980s. Substitutes: In the drilling mud market, alternatives to barite include celestite, ilmenite, iron ore, and synthetic hematite that is manufactured in Germany. None of these substitutes, however, has had a major impact on the barite drilling mud industry. eEstimated. NA Not available. 1Imported and domestic barite, crushed and ground, sold or used by domestic grinding establishments. 2Defined as sold or used by domestic mines + imports – exports. 3Defined as imports – exports. 4See Appendix C for resource and reserve definitions and information concerning data sources.
U.S. Geological Survey, Mineral Commodity Summaries, January 2017

32
BAUXITE AND ALUMINA1
(Data in thousand metric dry tons unless otherwise noted) Domestic Production and Use: In 2016, the quantity of bauxite consumed, nearly all of which was imported, was estimated to be 6.8 million tons, a reduction of 28% from that in 2015, with an estimated value of $231 million. More than 90% of the bauxite was converted to alumina, and the remainder went to nonmetallurgical products, such as abrasives, chemicals, proppants, and refractories. Four domestic Bayer-process refineries had a combined alumina production capacity of 5.6 million tons per year but produced 2.5 million tons in 2016. About 70% of the alumina produced went to primary aluminum smelters and the remainder went to nonmetallurgical products, such as abrasives, ceramics, chemicals, and refractories. Salient Statistics—United States: 2012 2013 2014 2015 2016e Bauxite: Production, mine W W W W W Imports for consumption2 11,000 10,800 11,800 11,300 6,300 Exports2 42 21 15 20 40 Stocks, industry, yearend2 1,530 1,300 1,210 1,500 880 Consumption: Apparent3 W W W W W Reported 9,560 10,200 9,840 9,420 6,800 Price, average value, U.S. imports (f.a.s.), dollars per ton 28 27 27 26 29 Net import reliance,4 as a percentage of apparent consumption >75 >75 >75 >75 >75 Alumina: Production, refinery 4,370 4,320 4,460 4,540 2,500 Imports for consumption5 1,900 2,050 1,630 1,570 1,200 Exports5 1,720 2,250 2,130 2,180 1,500 Stocks, industry, yearend5 363 280 276 274 100 Consumption, apparent3 5,140 4,210 3,970 3,930 2,370 Price, average value U.S. imports (f.a.s.) dollars per ton 374 368 394 400 360 Net import reliance,4 as a percentage of apparent consumption 15 E E E E Recycling: None. Import Sources (2012–15):6 Bauxite: Jamaica, 42%; Brazil, 26%; Guinea, 23%; Guyana, 5%; and other, 4%. Alumina: Australia, 37%; Suriname, 32%; Brazil, 15%; Jamaica, 4%; and other, 12%. Tariff: Item Number Normal Trade Relations 12–31–16 Bauxite, calcined (refractory grade) 2606.00.0030 Free. Bauxite, calcined (other) 2606.00.0060 Free. Bauxite, crude dry (metallurgical grade) 2606.00.0090 Free. Alumina 2818.20.0000 Free. Aluminum hydroxide 2818.30.0000 Free. Depletion Allowance: 22% (Domestic), 14% (Foreign). Government Stockpile: None Events, Trends, and Issues: In 2016, two of the four domestic alumina refineries shut down; a 2.3-million-ton-per-year alumina refinery in Point Comfort, TX, completely shut down in March, having already shut down 1.2 million tons per year of capacity in the fourth quarter of 2015, and a 1.6-million-ton-per-year alumina refinery in Corpus Christi, TX, shut down in September citing a price dispute with its bauxite supplier. It had been producing at about 80% of capacity since October 2014. At a 1.2-million-ton-per-year alumina refinery in Gramercy, LA, 100,000 tons per year of capacity was modified to produce higher value-added specialty alumina instead of smelter-grade alumina. The average price free alongside ship (f.a.s.) for U.S. imports for consumption of metallurgical-grade alumina during the first 9 months of 2016 was $358 per ton, 13% lower than that of the same period in 2015, and ranged between $283 per ton and $449 per ton. According to production data from the International Aluminium Institute, world alumina Prepared by E. Lee Bray [(703) 648–4979, [email protected]]

33 BAUXITE AND ALUMINA
production through September 2016 decreased slightly compared with that of the same period in 2015. For the first 9 months of 2016, the estimated average price (f.a.s.) for U.S. imports for consumption of crude-dry bauxite was $29 per ton, 3% higher than that of the same period in 2015. A significant portion of bauxite consumed at alumina refineries in the United States came from mines owned by the same companies that owned the refineries. In 2016, global bauxite production decreased by 11% owing to reduced production of 34 million tons in Malaysia. Although the Government of Malaysia banned bauxite mining in January pending stricter environmental laws, exports of stockpiled bauxite continued throughout the year. In October, the Government of Indonesia announced that it would issue 5-year bauxite export permits to companies building alumina refineries. Export of bauxite and other unprocessed mineral ores from Indonesia had been prohibited since January 2014. A 1-million-ton-per-year alumina refinery in Indonesia was completed in May, and rampup of production had started. Global alumina production decreased slightly in 2016. Alumina imports to China, which totaled 4.65 million tons in 2015, decreased by 30%. World Alumina Refinery and Bauxite Mine Production and Bauxite Reserves: Reserves for China, Greece, Malaysia, and Saudi Arabia were revised based on Government and company reports. Alumina Bauxite Reserves7 2015 2016e 2015 2016e United States 4,540 2,500 W W 20,000 Australia 20,100 20,700 80,900 82,000 6,200,000 Brazil 10,500 10,800 33,900 34,500 2,600,000 Canada 1,570 1,550 — — — China 59,000 58,500 65,000 65,000 980,000 Greece 807 810 1,820 1,800 130,000 Guinea — — 18,100 19,700 7,400,000 Guyana — — 1,700 1,600 850,000 India 5,510 5,860 23,800 25,000 590,000 Indonesia 70 450 202 1,000 1,000,000 Ireland 1,980 1,900 — — — Jamaica 1,870 1,850 9,630 8,500 2,000,000 Kazakhstan 1,450 1,400 4,680 4,600 160,000 Malaysia — — 35,000 1,000 110,000 Russia 2,590 2,700 5,900 5,400 200,000 Saudi Arabia 846 1,700 1,600 4,000 210,000 Spain 1,630 1,550 — — — Suriname 748 — 1,600 — 580,000 Vietnam 484 500 1,150 1,500 2,100,000 Other countries 5,290 5,500 7,580 6,860 2,700,000 World total (rounded) 119,000 118,000 293,000 262,000 28,000,000 World Resources: Bauxite resources are estimated to be 55 to 75 billion tons, in Africa (32%), Oceania (23%), South America and the Caribbean (21%), Asia (18%), and elsewhere (6%). Domestic resources of bauxite are inadequate to meet long-term U.S. demand, but the United States and most other major aluminum-producing countries have essentially inexhaustible subeconomic resources of aluminum in materials other than bauxite. Substitutes: Bauxite is the only raw material used in the production of alumina on a commercial scale in the United States. Although currently not economically competitive with bauxite, vast resources of clay are technically feasible sources of alumina. Other raw materials, such as alunite, anorthosite, coal wastes, and oil shales, offer additional potential alumina sources. Some refineries in China recover alumina from coal ash, and processes for recovering alumina from clay were being tested in Australia and Canada to determine if they would be economically competitive. Synthetic mullite, produced from kaolin, bauxitic kaolin, kyanite, and sillimanite, substitutes for bauxite-based refractories. Although more costly, silicon carbide and alumina-zirconia can substitute for bauxite-based abrasives. eEstimated. E Net exporter. W Withheld to avoid disclosing company proprietary data. — Zero. 1See also Aluminum. As a general rule, 4 tons of dried bauxite is required to produce 2 tons of alumina, which, in turn, produces 1 ton of aluminum. 2Includes all forms of bauxite, expressed as dry equivalent weights. 3Defined as production + imports – exports + adjustments for industry stock changes. 4Defined as imports – exports + adjustments for industry stock changes. 5Calcined equivalent weights. 6Based on aluminum equivalents. 7See Appendix C for resource and reserve definitions and information concerning data sources.
U.S. Geological Survey, Mineral Commodity Summaries, January 2017

34
BERYLLIUM
(Data in metric tons of beryllium content unless otherwise noted) Domestic Production and Use: One company in Utah mined bertrandite ore and converted it, along with imported beryl, into beryllium hydroxide. Some of the beryllium hydroxide was shipped to the company’s plant in Ohio, where it was converted into metal, oxide, and downstream beryllium-copper master alloy, and some was sold. Based on the estimated unit value for beryllium in imported beryllium-copper master alloy, beryllium apparent consumption of 210 tons was valued at about $107 million. Based on value-added sales revenues, approximately 21% of beryllium products were used in industrial components, 20% in consumer electronics, 16% in automotive electronics, 12% in defense applications, 9% in telecommunications infrastructure, 5% in energy applications, 2% in medical applications, and 15% in other applications. Beryllium alloy strip and bulk products, the most common forms of processed beryllium, were used in all application areas. The majority of unalloyed beryllium metal and beryllium composite products were used in defense and scientific applications. Salient Statistics—United States: 2012 2013 2014 2015 2016e Production, mine shipments 225 235 270 205 190 Imports for consumption1 100 57 68 66 51 Exports2 55 35 26 29 32 Government stockpile releases3 (4) 10 1 1 1 Consumption: Apparent5 265 262 318 233 210 Reported, ore 220 250 280 220 200 Unit value, annual average, beryllium-copper master alloy, dollars per pound contained beryllium6 204 208 215 220 231 Stocks, ore, consumer, yearend 15 20 15 25 25 Net import reliance7 as a percentage of apparent consumption 15 10 15 12 10 Recycling: Beryllium was recovered from new scrap generated during the manufacture of beryllium products and from old scrap. Detailed data on the quantities of beryllium recycled are not available but may account for as much as 20% to 25% of total beryllium consumption. The leading U.S. beryllium producer established a comprehensive recycling program for all of its beryllium products, recovering approximately 40% of the beryllium content of the new and old beryllium alloy scrap. Beryllium manufactured from recycled sources requires only 20% of the energy as that of beryllium manufactured from primary sources. Import Sources (2012–15):1 Kazakhstan, 43%; Japan, 13%; United Kingdom, 9%; China, 9%; and other, 26%. Tariff: Item Number Normal Trade Relations 12–31–16 Beryllium ores and concentrates 2617.90.0030 Free. Beryllium oxide and hydroxide 2825.90.1000 3.7% ad val. Beryllium-copper master alloy 7405.00.6030 Free. Beryllium: Unwrought, including powders 8112.12.0000 8.5% ad val. Waste and scrap 8112.13.0000 Free. Other 8112.19.0000 5.5% ad val. Depletion Allowance: 22% (Domestic), 14% (Foreign). Government Stockpile: The Defense Logistics Agency Strategic Materials had a goal of retaining 47 tons of beryllium metal in the National Defense Stockpile.
Stockpile Status—9–30–168 Disposal Plan Disposals Material Inventory FY 2016 FY 2016 Beryl ore 1 — — Metal 72 14 3 Structured powder 4 — — Prepared by Brian W. Jaskula [(703) 648–4908, [email protected]]

35 BERYLLIUM
Events, Trends, and Issues: Apparent consumption of beryllium-based products was estimated to have decreased by about 10% in 2016 from that of 2015, and by 34% from that in 2014. During the first 6 months of 2016, the leading U.S. beryllium producer reported that net sales of its beryllium alloy strip/bulk products and beryllium metal/composite products were 11% lower than those during the first 6 months of 2015. Sales of beryllium products to the energy market decreased owing to a significant decline in activity in the oil and gas sector. Sales of beryllium hydroxide, and beryllium products to the automotive electronics, consumer electronics, and industrial components markets, also decreased. Sales of beryllium products to the defense industry increased, most likely owing to Government spending on previously delayed defense programs. In recent years, beryl production in Mozambique has decreased, while beryl production in Madagascar has increased. Because of the toxic nature of beryllium, various international, national, and State guidelines and regulations have been established regarding beryllium in air, water, and other media. Industry is required to carefully control the quantity of beryllium dust, fumes, and mists in the workplace. World Mine Production and Reserves: Mine productione Reserves9 2015 2016 United States 205 190 The United States has very little beryl that can be China 20 20 economically hand sorted from pegmatite deposits. Madagascar 5 5 The Spor Mountain area in Utah, an epithermal Other countries 1 1 deposit, contains a large bertrandite resource, World total (rounded) 230 220 which is being mined. Proven bertrandite
reserves in Utah total about 14,000 tons of contained beryllium. World beryllium reserves are not available.
World Resources: The world’s identified resources of beryllium have been estimated to be more than 100,000 tons. About 60% of these resources are in the United States; by size, the Spor Mountain area in Utah, the McCullough Butte area in Nevada, the Black Hills area in South Dakota, the Sierra Blanca area in Texas, the Seward Peninsula in Alaska, and the Gold Hill area in Utah account for most of the total. Substitutes: Because the cost of beryllium is high compared with that of other materials, it is used in applications in which its properties are crucial. In some applications, certain metal matrix or organic composites, high-strength grades of aluminum, pyrolytic graphite, silicon carbide, steel, or titanium may be substituted for beryllium metal or beryllium composites. Copper alloys containing nickel and silicon, tin, titanium, or other alloying elements or phosphor bronze alloys (copper-tin-phosphorus) may be substituted for beryllium-copper alloys, but these substitutions can result in substantially reduced performance. Aluminum nitride or boron nitride may be substituted for beryllium oxide. eEstimated. — Zero. 1Includes estimated beryllium content of imported ores and concentrates, oxide and hydroxide, unwrought metal (including powders), beryllium articles, waste and scrap, beryllium-copper master alloy, and beryllium-copper semifabricates. 2Includes estimated beryllium content of exported unwrought metal (including powders), beryllium articles, and waste and scrap. 3Change in total inventory level from prior yearend inventory. 4Less than ½ unit. 5The sum of U.S. mine shipments and net import reliance. 6Calculated from gross weight and customs value of imports; beryllium content estimated to be 4%. 7Defined as imports – exports + adjustments for Government and industry stock changes. 8See Appendix B for definitions. 9See Appendix C for resource and reserve definitions and information concerning data sources.
U.S. Geological Survey, Mineral Commodity Summaries, January 2017

36
BISMUTH
(Data in metric tons of bismuth content unless otherwise noted) Domestic Production and Use: The United States ceased production of primary refined bismuth in 1997 and is highly import dependent for its supply. Bismuth is contained in some lead ores mined domestically, but the last domestic primary lead smelter closed at yearend 2013, and all lead concentrates now are exported for smelting. In 2016, the estimated value of apparent consumption of bismuth was approximately $17 million. About two-thirds of domestic bismuth consumption was for chemicals used in cosmetic, industrial, laboratory, and pharmaceutical applications. Bismuth use in pharmaceuticals included bismuth salicylate (the active ingredient in over-the-counter stomach remedies) and other compounds used to treat burns, intestinal disorders, and stomach ulcers. Bismuth also is used in the manufacture of ceramic glazes, crystalware, and pearlescent pigments. Bismuth has a wide variety of metallurgical applications, including use as a nontoxic replacement for lead in brass, free-machining steels, and solders, and as an additive to enhance metallurgical quality in the foundry industry. The Safe Drinking Water Act Amendment of 1996, which required that all new and repaired fixtures and pipes for potable water supply be lead free after August 1998, opened a wider market for bismuth as a metallurgical additive to lead-free pipe fittings, fixtures, and water meters. Bismuth is used as a triggering mechanism for fire sprinklers and in holding devices for grinding optical lenses, and bismuth-tellurium oxide alloy film paste is used in the manufacture of semiconductor devices. Salient Statistics—United States: 2012 2013 2014 2015 2016e Production: Refinery — — — — –– Secondary (old scrap)e 80 80 80 80 80 Imports for consumption, metal 1,700 1,710 2,270 1,950 2,200 Exports, metal, alloys, and scrap 764 816 567 519 500 Consumption: Reported 647 774 727 662 700 Apparent 940 978 1,420 1,370 1,740 Price, average, domestic dealer, dollars per pound 10.10 8.71 11.14 6.43 4.50 Stocks, yearend, consumer 134 50 329 464 500 Net import reliance1 as a percentage of apparent consumption 93 92 95 95 95 Recycling: Bismuth-containing new and old alloy scrap was recycled and thought to compose less than 5% of U.S. bismuth apparent consumption, or about 80 tons. Import Sources (2012–15): China, 69%; Belgium, 22%; Peru, 2%; United Kingdom, 2%; and other, 5%. Tariff: Item Number Normal Trade Relations 12–31–16 Bismuth and articles thereof, including waste and scrap 8106.00.0000 Free. Depletion Allowance: 22% (Domestic), 14% (Foreign). Government Stockpile: None. Events, Trends, and Issues: In China, the Yunnan Provincial government instructed the municipal government of Kunming to launch an official investigation into the trading activities of the Fanya Metal Exchange Co. Ltd. (FME), which began trading bismuth in March 2013. The municipal government was instructed to determine if the FME had any physical assets in warehouses, concealed facts, created a capital pool and taken control of the funds within, and illegally possessed and used the funds that it had raised. In February, the owner of the FME was arrested and, in March, the Public Security Bureau announced that it was expanding its investigation into FME activities. The 19,228 tons of bismuth that was reported to be in FME warehouses has not been verified by the government or a third party. Prepared by C. Schuyler Anderson [(703) 648–4985, [email protected]]

37 BISMUTH
The U.S. domestic dealer price of bismuth, which had trended upward in 2014, started 2015 at $10.90 per pound, decreased steadily throughout the year, and ended the year with a December average of $4.56 per pound. The price then remained relatively stable throughout 2016, ranging between $4.00 per pound and $4.70 per pound. Industry analysts attributed the sharp decrease in price in 2015 to the events surrounding the FME. Masan Resource Corp.’s Nui Phao Mine in Vietnam had its first full year of production in 2015, producing tungsten, fluorspar, copper, and bismuth. Masan did not report how much bismuth was produced, but its tungsten production increased by 63% in 2015 from that in 2014. In 2014, Nui Phao produced 4,945 tons of bismuth concentrate.2 Based on original projections, Nui Phao was expected to produce up to 2,000 tons per year of bismuth.3 Bismuth vanadate, traditionally used as a yellow pigment, is being investigated as a heterojunction material for splitting water using light to generate hydrogen for use in fuel cells. Although still under development, advances have been made to improve the efficiency of the process. World Mine Production and Reserves: Mine production Reserves4 2015 2016e United States — — — Bolivia 10 10 10,000 Canada 3 3 5,000 China 7,500 7,400 240,000 Mexico 700 700 10,000 Russia 40 40 NA Vietnam 2,000 2,000 53,000 Other countries — — 50,000 World total (rounded) 10,300 10,200 370,000 World Resources: Bismuth, at an estimated 8 parts per billion by weight, ranks 69th in elemental abundance in the Earth’s crust and is about twice as abundant as gold. World reserves of bismuth are usually estimated based on the bismuth content of lead resources because bismuth production is most often a byproduct of processing lead ores. In China and Vietnam, bismuth production is a byproduct or coproduct of tungsten and other metal ore processing. Bismuth minerals rarely occur in sufficient quantities to be mined as principal products; the Tasna Mine in Bolivia and a mine in China are the only mines where bismuth has been the primary product. The Tasna Mine in Bolivia has been inactive since 1996. Substitutes: Bismuth compounds can be replaced in pharmaceutical applications by alumina, antibiotics, and magnesia. Titanium dioxide-coated mica flakes and fish-scale extracts are substitutes in pigment uses. Indium can replace bismuth in low-temperature solders. Resins can replace bismuth alloys for holding metal shapes during machining, and glycerine-filled glass bulbs can replace bismuth alloys in triggering devices for fire sprinklers. Free-machining alloys can contain lead, selenium, or tellurium as a replacement for bismuth. Bismuth is an environmentally friendly substitute for lead in plumbing and many other applications, including fishing weights, hunting ammunition, lubricating greases, and soldering alloys. eEstimated. NA Not available. — Zero. 1Defined as imports – exports + adjustments for industry stock changes. 2Masan Resources Corp., 2015, 2014 sustainable development report: Ho Chi Minh City, Vietnam, Masan Resources Corp., 39 p. 3Masan Resources Corp., 2016, 2015 annual report: Ho Chi Minh City, Vietnam, Masan Resources Corp., 192 p. 4See Appendix C for resource and reserve definitions and information concerning data sources.
U.S. Geological Survey, Mineral Commodity Summaries, January 2017
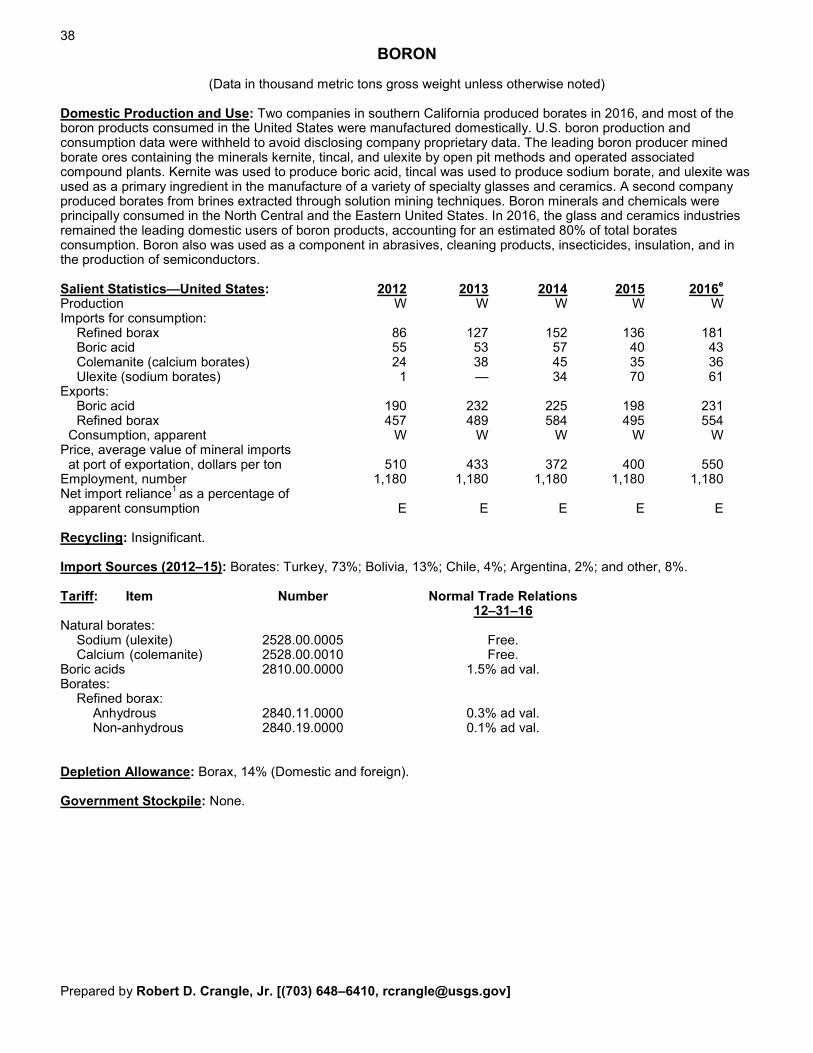
38
BORON
(Data in thousand metric tons gross weight unless otherwise noted) Domestic Production and Use: Two companies in southern California produced borates in 2016, and most of the boron products consumed in the United States were manufactured domestically. U.S. boron production and consumption data were withheld to avoid disclosing company proprietary data. The leading boron producer mined borate ores containing the minerals kernite, tincal, and ulexite by open pit methods and operated associated compound plants. Kernite was used to produce boric acid, tincal was used to produce sodium borate, and ulexite was used as a primary ingredient in the manufacture of a variety of specialty glasses and ceramics. A second company produced borates from brines extracted through solution mining techniques. Boron minerals and chemicals were principally consumed in the North Central and the Eastern United States. In 2016, the glass and ceramics industries remained the leading domestic users of boron products, accounting for an estimated 80% of total borates consumption. Boron also was used as a component in abrasives, cleaning products, insecticides, insulation, and in the production of semiconductors. Salient Statistics—United States: 2012 2013 2014 2015 2016e Production W W W W W Imports for consumption: Refined borax 86 127 152 136 181 Boric acid 55 53 57 40 43 Colemanite (calcium borates) 24 38 45 35 36 Ulexite (sodium borates) 1 — 34 70 61 Exports: Boric acid 190 232 225 198 231 Refined borax 457 489 584 495 554 Consumption, apparent W W W W W Price, average value of mineral imports at port of exportation, dollars per ton 510 433 372 400 550 Employment, number 1,180 1,180 1,180 1,180 1,180 Net import reliance1 as a percentage of apparent consumption E E E E E Recycling: Insignificant. Import Sources (2012–15): Borates: Turkey, 73%; Bolivia, 13%; Chile, 4%; Argentina, 2%; and other, 8%. Tariff: Item Number Normal Trade Relations 12–31–16 Natural borates: Sodium (ulexite) 2528.00.0005 Free. Calcium (colemanite) 2528.00.0010 Free. Boric acids 2810.00.0000 1.5% ad val. Borates: Refined borax: Anhydrous 2840.11.0000 0.3% ad val. Non-anhydrous 2840.19.0000 0.1% ad val. Depletion Allowance: Borax, 14% (Domestic and foreign). Government Stockpile: None. Prepared by Robert D. Crangle, Jr. [(703) 648–6410, [email protected]]

39 BORON
Events, Trends, and Issues: Elemental boron is a metalloid with limited commercial applications. Although the term “boron” is commonly referenced, it does not occur in nature in an elemental state. Boron combines with oxygen and other elements to form boric acid, or inorganic salts called borates. Boron compounds, chiefly borates, are commercially important; therefore, boron products are priced and sold based on their boric oxide content (B2O3), varying by ore and compound and by the absence or presence of calcium and sodium. The four borate minerals—colemanite, kernite, tincal, and ulexite—make up 90% of the borate minerals used by industry worldwide. Although borates were used in more than 300 applications, more than three-quarters of world consumption was used in ceramics, detergents, fertilizers, and glass. Canada, China, India, Malaysia, and the Netherlands are the countries that imported the largest quantities of refined borates from the United States in 2016. Because China has low-grade boron reserves and demand for boron is anticipated to rise in that country, imports to China from Chile, Russia, Turkey, and the United States were expected to remain steady during the next several years. In Europe and developing countries, more stringent building standards with respect to heat conservation were being enacted. Consequently, increased consumption of borates for fiberglass insulation was expected. Continued investment in new borate refineries and technologies and the continued rise in demand were expected to fuel growth in world production during the next several years. World Production and Reserves: Production—All forms2 Reserves3 2015 2016e United States W W 40,000 Argentina 450 450 NA Bolivia 150 150 NA Chile 500 500 35,000 China 150 160 32,000 Kazakhstan 500 510 NA Peru 240 240 4,000 Russia 80 80 40,000 Turkey 7,300 7,300 230,000 World total (rounded) 49,370 49,400 380,000 World Resources: Deposits of borates are associated with volcanic activity and arid climates, with the largest economically viable deposits located in the Mojave Desert of the United States, the Alpide belt in southern Asia, and the Andean belt of South America. U.S. deposits consist primarily of tincal, kernite, and borates contained in brines, and to a lesser extent ulexite and colemanite. About 70% of all deposits in Turkey are colemanite, primarily used in the production of heat-resistant glass. Small deposits are being mined in South America. At current levels of consumption, world resources are adequate for the foreseeable future. Substitutes: The substitution of other materials for boron is possible in detergents, enamels, insulation, and soaps. Sodium percarbonate can replace borates in detergents and requires lower temperatures to undergo hydrolysis, which is an environmental consideration. Some enamels can use other glass-producing substances, such as phosphates. Insulation substitutes include cellulose, foams, and mineral wools. In soaps, sodium and potassium salts of fatty acids can act as cleaning and emulsifying agents. eEstimated. E Net exporter. NA Not available. W Withheld to avoid disclosing company proprietary data. — Zero. 1Defined as imports – exports. 2Gross weight of ore in thousand metric tons. 3See Appendix C for resource and reserve definitions and information concerning data sources. 4Excludes U.S. production.
U.S. Geological Survey, Mineral Commodity Summaries, January 2017

40
BROMINE
(Data in metric tons of bromine content unless otherwise noted) Domestic Production and Use: Bromine was recovered from underground brines by two companies in Arkansas. Bromine often is the leading mineral commodity, in terms of value, produced in Arkansas. The two bromine companies in the United States account for a large percentage of world production capacity. Globally, the leading applications of bromine compounds are in the production of flame retardants, intermediates and industrial uses such as pesticides and pharmaceuticals, drilling fluids, and water treatment, in descending order by quantity. Bromine compounds are also used in a variety of other applications, including chemical synthesis, control of mercury emissions from coal-fired powerplants, and paper manufacturing. Salient Statistics—United States: 2012 2013 2014 2015 2016e Production W W W W W Imports for consumption, elemental bromine and compounds1 53,400 36,300 57,700 58,000 70,000 Exports, elemental bromine and compounds2 13,000 18,200 20,600 25,000 19,500 Consumption, apparent W W W W W Employment, numbere 1,050 1,050 1,050 1,050 1,050 Net import reliance3 as a percentage of apparent consumption <50 <50 <50 <50 <50 Recycling: Some bromide solutions were recycled to obtain elemental bromine and to prevent the solutions from being disposed of as hazardous waste. Hydrogen bromide is emitted as a byproduct in many organic reactions. This byproduct waste is recycled with virgin bromine brines and is a source of bromine production. Plastics containing bromine flame retardants can be incinerated as solid organic waste, and the bromine can be recovered. This recycled bromine is not included in the virgin bromine production reported to the U.S. Geological Survey by companies but may be included in data collected by the U.S. Census Bureau. Import Sources (2012–15): Israel, 84%; China, 7%; Jordan, 4%; and other, 5%. Tariff: Item Number Normal Trade Relations 12–31–16 Bromine 2801.30.2000 5.5% ad val. Hydrobromic acid 2811.19.3000 Free. Potassium or sodium bromide 2827.51.0000 Free. Ammonium, calcium, or zinc bromide 2827.59.2500 Free. Potassium bromate 2829.90.0500 Free. Sodium bromate 2829.90.2500 Free. Ethylene dibromide 2903.31.0000 5.4% ad val. Methyl bromide 2903.39.1520 Free. Dibromoneopentyl glycol 2905.59.3000 Free. Tetrabromobisphenol A 2908.19.2500 5.5% ad val. Decabromodiphenyl and octabromodiphenyl oxide 2909.30.0700 5.5% ad val. Depletion Allowance: Brine wells, 5% (Domestic and foreign). Government Stockpile: None. Prepared by Emily K. Schnebele [(703) 648–4945, [email protected]]

41 BROMINE
Events, Trends, and Issues: The United States maintained its position as one of the leading bromine producers in the world. China, Israel, and Jordan also are major producers of elemental bromine. U.S. imports of bromine and bromine compounds increased in 2016 in response to increased domestic demand. U.S. exports presented in this publication include calcium bromide (HTS code 2827.59.2500), potassium bromide (2827.51.0000), and sodium bromide (HTS code 2827.51.0000). These are in addition to exports of elemental bromine (HTS code 2801.30.2000), ethylene dibromide (HTS code 2903.31.000), and methyl bromide (HTS code 2903.39.1520) that were published in the 2016 Mineral Commodity Summary. The addition of these compounds has more than doubled the amount of exported bromine presented in this report, as compared with prior years, and more accurately reflects the domestic industry activity. The data series was modified back to 2011. U.S. companies did not announce prices for bromine and bromine compounds in 2016. Trade publications, however, reported that U.S. bromine prices ranged from about $4,400 to $5,400 per ton during the year, an increase compared with 2015 prices. Global sales of brominated flame retardants (BFRs) were strong; particularly for products developed to replace hexabromocyclododecane (HBCD), a BFR used in polystyrene building insulation foams. Owing to environmental and toxicological concerns, the production of HBCD was phased out in the European Union in 2015. Global sales of BFRs for electric and electronic applications, especially in the automotive industry, were also strong in 2016. Bromine production in Israel increased following the settlement of a workers’ strike, which took place during the first half of 2015. The use of bromine to mitigate mercury emissions at powerplants continued to increase. Bromine compounds bond with mercury in flue gases from coal-fired powerplants creating mercuric bromide, a substance that is more easily captured in flue-gas scrubbers than the mercuric chloride that is produced at many facilities. World Production and Reserves Production Reserves4 2015 2016e United States W W 11,000,000 Azerbaijan — — 300,000 China 100,000 95,000 NA India 1,700 1,700 NA Israel 116,000 170,000 NA Japan 20,000 20,000 NA Jordan 100,000 100,000 NA Turkmenistan 500 500 700,000 Ukraine 3,500 3,500 NA World total (rounded) 5342,000 5391,000 Large World Resources: Bromine is found principally in seawater, evaporitic (salt) lakes, and underground brines associated with petroleum deposits. In the Middle East, the Dead Sea is estimated to contain 1 billion tons of bromine. Seawater contains about 65 parts per million of bromine, or an estimated 100 trillion tons. Bromine is also recovered from seawater as a coproduct during evaporation to produce salt. Substitutes: Chlorine and iodine may be substituted for bromine in a few chemical reactions and for sanitation purposes. There are no comparable substitutes for bromine in various oil and gas well completion and packer applications. Because plastics have a low ignition temperature, alumina, magnesium hydroxide, organic chlorine compounds, and phosphorus compounds can be substituted for bromine as fire retardants in some uses. eEstimated. NA Not available. W Withheld to avoid disclosing company proprietary data. — Zero. 1Imports calculated from items shown in Tariff section. 2Exports calculated from HTS numbers 2801.30.2000, 2827.51.0000, 2827.59.2500, 2903.31.0000, and 2903.39.1520. 3Defined as production (sold or used) + imports – exports. 4See Appendix C for resource and reserve definitions and information concerning data sources. 5Excludes U.S. production.
U.S. Geological Survey, Mineral Commodity Summaries, January 2017

42
CADMIUM
(Data in metric tons of cadmium content unless otherwise noted) Domestic Production and Use: Two companies in the United States produced refined cadmium in 2015. One company, operating in Tennessee, recovered primary refined cadmium as a byproduct of zinc leaching from roasted sulfide concentrates. The other company, operating in Ohio, recovered secondary cadmium metal from spent nickel-cadmium (NiCd) batteries and other cadmium-bearing scrap. Domestic production and consumption of cadmium from 2011 to 2016 were withheld to avoid disclosing company proprietary data. Cadmium metal and compounds are mainly consumed for alloys, coatings, NiCd batteries, pigments, and plastic stabilizers. Salient Statistics—United States: 2012 2013 2014 2015 2016e Production, refined1 W W W W W Imports for consumption: Unwrought cadmium and powders 170 284 133 237 260 Wrought cadmium and other articles (gross weight) 21 104 6 18 (2) Cadmium waste and scrap (gross weight) 1 (2) — 71 20 Exports: Unwrought cadmium and powders 253 131 198 350 210 Wrought cadmium and other articles (gross weight) 378 266 72 246 410 Cadmium waste and scrap (gross weight) — 20 — (2) 12 Consumption of metal W W W W W Price, metal, annual average,3 dollars per kilogram 2.03 1.92 1.94 1.47 1.30 Stocks, yearend, producer and distributor W W W W W Net import reliance4 as a percentage of apparent consumption E <25 E E <25 Recycling: Secondary cadmium is mainly recovered from spent consumer and industrial NiCd batteries. Other waste and scrap from which cadmium can be recovered includes copper-cadmium alloy scrap, some complex nonferrous alloy scrap, and cadmium-containing dust from electric arc furnaces. Import Sources (2012–15):5 Canada, 47%; China, 18%; Australia, 14%; Mexico, 7%; and other, 14%. Tariff: Item Number Normal Trade Relations 12–31–16 Cadmium oxide 2825.90.7500 Free. Cadmium sulfide 2830.90.2000 3.1% ad val. Pigments and preparations based on cadmium compounds 3206.49.6010 3.1% ad val. Unwrought cadmium and powders 8107.20.0000 Free. Cadmium waste and scrap 8107.30.0000 Free. Wrought cadmium and other articles 8107.90.0000 4.4% ad val. Depletion Allowance: 22% (Domestic), 14% (Foreign). Government Stockpile: None. Events, Trends, and Issues: Most of the world’s primary cadmium metal was produced in Asia, and leading global producers were China, the Republic of Korea, and Japan. A smaller amount of secondary cadmium metal was recovered from recycling NiCd batteries. Although detailed data on the global consumption of primary cadmium were not available, NiCd battery production was thought to have continued to account for the majority of global cadmium consumption. Other end uses for cadmium and cadmium compounds included alloys, anticorrosive coatings, pigments, polyvinyl chloride (PVC) stabilizers, and semiconductors for solar cells. The average monthly cadmium price began 2016 at $0.94 per kilogram in January and trended upward to $1.61 per kilogram in May. Prices then decreased during the next 4 months to an average of $1.12 per kilogram in September. News sources attributed the price rise in the earlier part of the year to increased demand in India, and the price decrease in the latter half of the year was speculated to have been as a result of consumers operating off of high stock levels. Prepared by Amy C. Tolcin [(703) 648–4940, [email protected]]

43 CADMIUM
In October 2013, the European Parliament amended the European Union (EU) Battery Directive (2006/66/EC) to prohibit the inclusion of NiCd batteries in cordless power tools beginning December 31, 2016, after which nickel-cadmium batteries could only be used in emergency systems and medical equipment in the EU. In May 2015, the European Parliament voted against extending an exemption for cadmium-containing quantum dots under the Restriction of Hazardous Substances directive. Cadmium-containing quantum dots are used in light-emitting diode displays. In February 2016, the European Parliament amended its restrictions on the use cadmium in certain paints by limiting the content of cadmium in those paints to no more than 0.01% by weight and prohibiting the placement of such paints on the market. Despite these restrictions, cadmium-containing residues will continue to be generated as a byproduct during the zinc smelting process. If the applications and markets for cadmium continue to decline, excess cadmium-containing waste may need to be permanently stockpiled and managed. World Refinery Production and Reserves: Refinery production Reserves6
2015 2016e United States1 W W Quantitative estimates of reserves are Australia 380 380 not available. The cadmium content of Bulgaria 360 300 typical zinc ores averages about 0.03%. Canada 1,160 1,140 See the Zinc chapter for zinc reserves. China 7,600 7,400 Japan 1,960 1,900 Kazakhstan 1,500 1,500 Korea, Republic of 4,200 4,500 Mexico 1,300 1,250 Netherlands 640 640 Peru 760 760 Poland 630 500 Russia 1,300 1,350 Other countries 1,410 1,380 World total (rounded) 723,200 723,000 World Resources: Cadmium is generally recovered from zinc ores and concentrates. Sphalerite, the most economically significant zinc mineral, commonly contains minor amounts of cadmium, which shares certain similar chemical properties with zinc and often substitutes for zinc in the sphalerite crystal lattice. The cadmium mineral greenockite is frequently associated with weathered sphalerite and wurtzite. Zinc-bearing coals of the Central United States and Carboniferous age coals of other countries also contain large subeconomic resources of cadmium. Substitutes: Lithium-ion and nickel-metal hydride batteries can replace NiCd batteries in many applications. Except where the surface characteristics of a coating are critical (for example, fasteners for aircraft), coatings of zinc or vapor-deposited aluminum can be substituted for cadmium in many plating applications. Cerium sulfide is used as a replacement for cadmium pigments, mostly in plastics. Barium-zinc or calcium-zinc stabilizers can replace barium-cadmium stabilizers in flexible PVC applications. eEstimated. E Net exporter. W Withheld to avoid disclosing company proprietary data. — Zero. 1Cadmium metal produced as a byproduct of zinc refining plus metal from recycling. 2Less than ½ unit. 3Average New York dealer price for 99.95% purity in 5-short-ton lots. Source: Platts Metals Week (2012–2015), Metal Bulletin (2016). 4Defined as imports of unwrought metal and metal powders – exports of unwrought metal and metal powders + adjustments for industry stock changes. 5Imports for consumption of unwrought metal and metal powders (HTS number 8107.20.0000). 6See Appendix C for resource and reserve definitions and information concerning data sources. 7Excludes U.S. production.
U.S. Geological Survey, Mineral Commodity Summaries, January 2017

44
CEMENT
(Data in thousand metric tons unless otherwise noted) Domestic Production and Use: Production of cement in 2016 in the United States increased slightly to about 82.9 million tons of portland cement and 2.5 million tons of masonry cement; output was from 97 plants in 34 States. Cement also was produced at two plants in Puerto Rico. Production remained well below the record level of 99 million tons in 2005, and reflected continued full-time idle status at a few plants, underutilized capacity at many others, and plant closures in recent years. Sales of cement increased significantly in 2016, with much of the increase accounted for by imports; overall, sales were nearly 32 million tons lower than the record volume in 2005. The overall value of sales was about $10.7 billion. Most of the sales of cement were to make concrete, worth at least $60 billion. As in recent years, about 70% of cement sales went to ready-mixed concrete producers, 10% to concrete product manufacturers, 9% to contractors (mainly road paving), 4% each to oil and gas well drillers and to building materials dealers, and 3% to others. Texas, California, Missouri, Florida, and Alabama were, in descending order, the five leading cement-producing States and accounted for nearly 50% of U.S. production. Salient Statistics—United States:1 2012 2013 2014 2015 2016e Production: Portland and masonry cement2 74,151 76,804 82,600 e83,700 85,400 Clinker 67,173 69,420 74,372 e76,000 77,000 Shipments to final customers, includes exports 79,951 83,187 90,070 93,340 96,300 Imports of hydraulic cement for consumption 6,107 6,289 7,584 10,376 12,000 Imports of clinker for consumption 786 806 720 942 1,700 Exports of hydraulic cement and clinker 1,749 1,670 1,397 1,294 1,100 Consumption, apparent3 77,900 81,800 89,200 e93,300 96,200 Price, average mill value, dollars per ton 89.50 95.00 100.50 e105.50 111.00 Stocks, cement, yearend 6,900 6,570 6,140 e5,600 5,700 Employment, mine and mill, numbere 10,500 10,300 10,000 10,000 9,500 Net import reliance4 as a percentage of apparent consumption 7 7 8 11 13 Recycling: Cement kiln dust is routinely recycled to the kilns, which also can make use of a variety of waste fuels and recycled raw materials such as slags and fly ash. Various secondary materials can be incorporated as supplementary cementitious materials (SCMs) in blended cements and in the cement paste in concrete. Cement is not directly recycled, but significant quantities of concrete are recycled for use as construction aggregate. Import Sources (2012–15):5 Canada, 46%; Republic of Korea, 15%; Greece, 11%; China, 10%; and other, 18%. Tariff: Item Number Normal Trade Relations 12–31–16 Cement clinker 2523.10.0000 Free. White portland cement 2523.21.0000 Free. Other portland cement 2523.29.0000 Free. Aluminous cement 2523.30.0000 Free. Other hydraulic cement 2523.90.0000 Free. Depletion Allowance: Not applicable. Certain raw materials for cement production have depletion allowances. Government Stockpile: None. Events, Trends, and Issues: On a year-on-year basis, monthly cement sales in 2016 were erratic and the overall increase for the year was lower than had been expected at yearend 2015. Construction spending levels were moderately higher during the year, but continued low oil and gas prices significantly constrained the amount of oil and gas well drilling, as well as the consumption of general and oil well cements for this activity. This contributed to reduced overall cement sales in a number of States, especially Texas. Production of cement remained well below capacity, with some multikiln plants continuing to rely primarily on a single kiln during the year. As in 2015, much of the growth in cement sales in 2016 was of imported rather than domestic material; this appears to reflect technical, economic, and environmental difficulties in returning long-idle kilns to full production at some plants. Imports resumed or increased at several terminals that had been idle or substantially inactive during the recession. Prepared by Hendrik G. van Oss [(703) 648–7712, [email protected]]

45 CEMENT
The purchase, announced in 2015, of one major Europe-based international company by another led to the merger of the U.S. subsidiaries of both companies in July 2016 following regulatory approval. Approval of the merger had been expected to require the sale of two cement plants (one in Indiana, and another plant in either Maryland or West Virginia); only one plant (West Virginia) was, in fact, required to be sold. As part of a debt-reduction effort, a major cement company announced the sale of a plant in northern Texas and later, of one in Ohio. The Texas plant was sold in November 2016, and the Ohio plant sale was expected to be completed in January 2017. No new plants opened in 2016, however, a dry kiln plant in Maryland was upgraded to precalciner technology during the year, and two plants (one in Oklahoma, and another in New York) had nearly completed upgrades from wet to precalciner dry technology at yearend. The 2010 National Emissions Standards for Hazardous Air Pollutants (NESHAP) protocol for cement plants went into effect in September 2015 and reduced the acceptable emissions levels of mercury and certain other pollutants. Many plants installed emissions reduction technologies to comply with the NESHAP, but it remained unclear if such modifications would be economic at all plants or for all individual kilns (some being of older technology) at multikiln plants. It was possible that some kilns would be shut down, or used only sparingly, in light of the NESHAP limits, with a proportional reduction in overall U.S. clinker production capacity. World Production and Capacity: Cement production Clinker capacitye 2015 2016e 2015 2016 United States (includes Puerto Rico) 84,300 85,900 107,000 109,000 Brazil 65,300 60,000 60,000 60,000 China 2,350,000 2,410,000 2,000,000 2,000,000 Egypt 55,000 55,000 46,000 46,000 India 300,000 290,000 280,000 280,000 Indonesia 58,000 63,000 64,000 78,000 Iran 58,600 53,000 79,000 79,000 Japan 54,800 56,000 53,000 53,000 Korea, Republic of 51,700 55,000 50,000 50,000 Russia 62,100 56,000 80,000 80,000 Saudi Arabia 61,900 61,000 65,000 75,000 Turkey 71,400 77,000 76,000 77,000 Vietnam 67,400 70,000 80,000 90,000 Other countries (rounded) 760,000 810,000 560,000 620,000 World total (rounded) 4,100,000 4,200,000 3,600,000 3,700,000 World Resources: Although individual plant reserves are subject to exhaustion, limestone and other cement raw materials are geologically widespread and abundant and overall shortages are unlikely in the future. Substitutes: Almost all portland cement is used in making concrete, mortars, or stuccos, and competes in the construction sector with concrete substitutes, such as aluminum, asphalt, clay brick, fiberglass, glass, gypsum (plaster), steel, stone, and wood. A number of materials, especially fly ash and ground granulated blast furnace slag, develop good hydraulic cementitious properties by reacting with the lime released by the hydration of portland cement. Where readily available (including as imports), these SCMs are increasingly being used as partial substitutes for portland cement in many concrete applications, and are components of finished blended cements. eEstimated. 1Portland plus masonry cement unless otherwise noted; excludes Puerto Rico. 2Includes cement made from imported clinker. 3Production of cement (including from imported clinker) + imports (excluding clinker) – exports + adjustments for stock changes. 4Defined as imports (cement and clinker) – exports. 5Hydraulic cement and clinker.
U.S. Geological Survey, Mineral Commodity Summaries, January 2017

46
CESIUM
(Data in metric tons of cesium oxide unless otherwise noted) Domestic Production and Use: In 2016, there was no domestic mine production of cesium and the United States was 100% import reliant for cesium minerals. The United States sourced the majority of its pollucite, the principal cesium mineral, from the largest known deposit in North America at Bernic Lake, Manitoba, Canada; however, that operation ceased mining at the end of 2015 and continued to produce cesium products from stocks. Cesium minerals are used as feedstocks to produce a variety of cesium compounds and cesium metal. By gross weight, cesium formate brines used for high-pressure, high-temperature well drilling for oil and gas production and exploration are the primary applications for cesium. Cesium nitrate is used as a colorant and oxidizer in the pyrotechnic industry, in petroleum cracking, in scintillation counters, and in x-ray phosphors. Cesium chloride is used in analytical chemistry applications as a reagent, in high-temperature solders, as an intermediate in cesium metal production, in isopycnic centrifugation, as a radioisotope in nuclear medicine, as a repellent in agricultural applications, and in specialty glasses. Cesium metal is used in the production of cesium compounds and in photoelectric cells. Cesium carbonate is used in the alkylation of organic compounds and in energy conversion devices, such as fuel cells, magneto-hydrodynamic generators, and polymer solar cells. Cesium bromide is used in infrared detectors, optics, photoelectric cells, scintillation counters, and spectrophotometers. Cesium hydroxide is used as an electrolyte in alkaline storage batteries. Cesium iodide is used in fluoroscopy equipment—Fourier Transform Infrared spectrometers—as the input phosphor of x-ray image intensifier tubes, and in scintillators. Cesium isotopes, which are obtained as a byproduct in nuclear fission or formed from other isotopes, such as barium-131, are used in electronic, medical, and research applications. Cesium isotopes are used as an atomic resonance frequency standard in atomic clocks, playing a vital role in global positioning satellites, Internet and cellular telephone transmissions, and aircraft guidance systems. Cesium clocks monitor the cycles of microwave radiation emitted by cesium’s electrons and use these cycles as a time reference. Owing to the high accuracy of the cesium atomic clock, the international definition of 1 second is based on the cesium atom. The U.S. civilian time and frequency standard is based on a cesium fountain clock at the National Institute of Standards and Technology in Boulder, CO. The U.S. military frequency standard, the United States Naval Observatory Time Scale, is based on 48 weighted atomic clocks, including 25 cesium fountain clocks. Fission byproducts cesium-131 and cesium-137 are used primarily to treat cancer. A company in Richland, WA, produced a range of cesium-131 medical products for treatment of various cancers. Cesium-137 also is widely used in industrial gauges, in mining and geophysical instruments, and for sterilization of food, sewage, and surgical equipment. Cesium isotopes can be used in metallurgy to remove gases and other impurities, and in vacuum tubes. Salient Statistics—United States: Consumption, import, and export data for cesium have not been available since the late 1980s. Because cesium metal is not traded in commercial quantities, a market price is unavailable. Only a few thousand kilograms of cesium are consumed in the United States every year. The United States is 100% import dependent for its cesium needs. In 2016, one company offered 1-gram ampoules of 99.8% (metal basis) cesium for $61.49 and 99.98% (metal basis) cesium for $76.41, an increase of 3.0% and 4.1%, respectively, from those in 2015. The prices that the company offered for 50 grams of 99.9% (metal basis) cesium acetate, cesium bromide, cesium carbonate, cesium chloride, and cesium nitrate were $114.74, $70.33, $99.50, $100.06, and $173.00, respectively. The price for a cesium-plasma standard solution (10,000 micrograms per milliliter) was $65.12 for 50 milliliters and $127.72 for 100 milliliters. Recycling: Cesium formate brines are typically rented by oil and gas exploration clients. After completion of the well, the used cesium formate brine is returned and reprocessed for subsequent drilling operations. Cesium formate production from Canada was estimated to be 5,630 tons per year, including 3,890 tons of cesium from 17,300 tons of pollucite ore. The formate brines are recycled with a recovery rate of 85%, which can be retrieved for further use. Import Sources (2012–15): Canada is the chief source of pollucite concentrate imported by the United States. Prepared by Christopher A. Tuck [(703) 648–4912, [email protected]]

47 CESIUM
Tariff: Item Number Normal Trade Relations 12–31–16 Alkali metals, other 2805.19.9000 5.5% ad val. Chlorides, other 2827.39.9000 3.7% ad val. Bromides, other 2827.59.5100 3.6% ad val. Nitrates, other 2834.29.5100 3.5% ad val. Carbonates, other 2836.99.5000 3.7% ad val. Cesium-137, other 2844.40.0021 Free Depletion Allowance: 14% (Domestic and foreign). Government Stockpile: None. Events, Trends, and Issues: Domestic cesium occurrences will likely remain uneconomic unless market conditions change. No known human health issues are associated with naturally occurring cesium, and its use has minimal environmental impact. Radioactive isotopes of cesium have been known to cause adverse health effects. During 2016, several projects that were primarily aimed at developing lithium resources were at various stages of development in Manitoba, Canada. The projects focused on pollucite and spodumene deposits, which primarily contain lithium, tantalum, or both, but may also contain minor quantities of cesium and rubidium. A pollucite operation at Bernic Lake completed a development project in November 2015 after mine collapses in 2010 and 2013, but ceased mining at the site that year. The company indicated it had sufficient stocks of raw materials to continue producing its cesium products for the foreseeable future. The company also planned to continue exploring possibilities for accessing the mine’s reserves, as well as alternative sources of cesium as needed. World Mine Production and Reserves: Pollucite, mainly found in association with lithium-rich, lepidolite-bearing or petalite-bearing zoned granite pegmatites, is the principal cesium ore mineral. Cesium reserves are, therefore, estimated based on the occurrence of pollucite, which is mined as a byproduct of the lithium mineral lepidolite. Most pollucite contains 5% to 32% cesium oxide (Cs2O). Data on cesium resources, other than those listed, are either limited or not available. The main pollucite zone at Bernic Lake in Canada contains approximately 120,000 tons of contained cesium oxide in pollucite ore, with premining average ore grades of 23.3% Cs2O. Sites near Lake Ontario have identified cesium resources; exploration of those deposits has been ongoing since 2013. Zimbabwe and Namibia produced cesium in small quantities as a byproduct of lithium mining operations. Reserves for Canada were removed from the list because mining operations ceased in 2015. Reserves1 Namibia 30,000 Zimbabwe 60,000 Other countries NA World total (rounded) 90,000 World Resources: World resources of cesium have not been estimated. Cesium is associated with lithium-bearing pegmatites worldwide, and cesium resources have been identified in the United States, Canada, Namibia, and Zimbabwe. In the United States, pollucite occurs in pegmatites in Alaska, Maine, and South Dakota. Lower concentrations are also known in brines in Chile and China and in geothermal systems in Germany, India, and Tibet. China was believed to have cesium-rich deposits of pollucite, lepidolite, and geyserite, with concentrations highest in Yichun, Jiangxi, China, although no resource or production estimates were available. Substitutes: Cesium and rubidium can be used interchangeably in many applications because they have similar physical properties and atomic radii. Cesium, however, is more electropositive than rubidium, making it a preferred material for some applications. However, rubidium is mined from similar deposits, in relatively smaller quantities, as a byproduct of cesium production in pegmatites and as a byproduct of lithium production from lepidolite (hard rock) mining and processing, making it no more readily available than cesium. NA Not available. 1See Appendix C for resource and reserve definitions and information concerning data sources.
U.S. Geological Survey, Mineral Commodity Summaries, January 2017
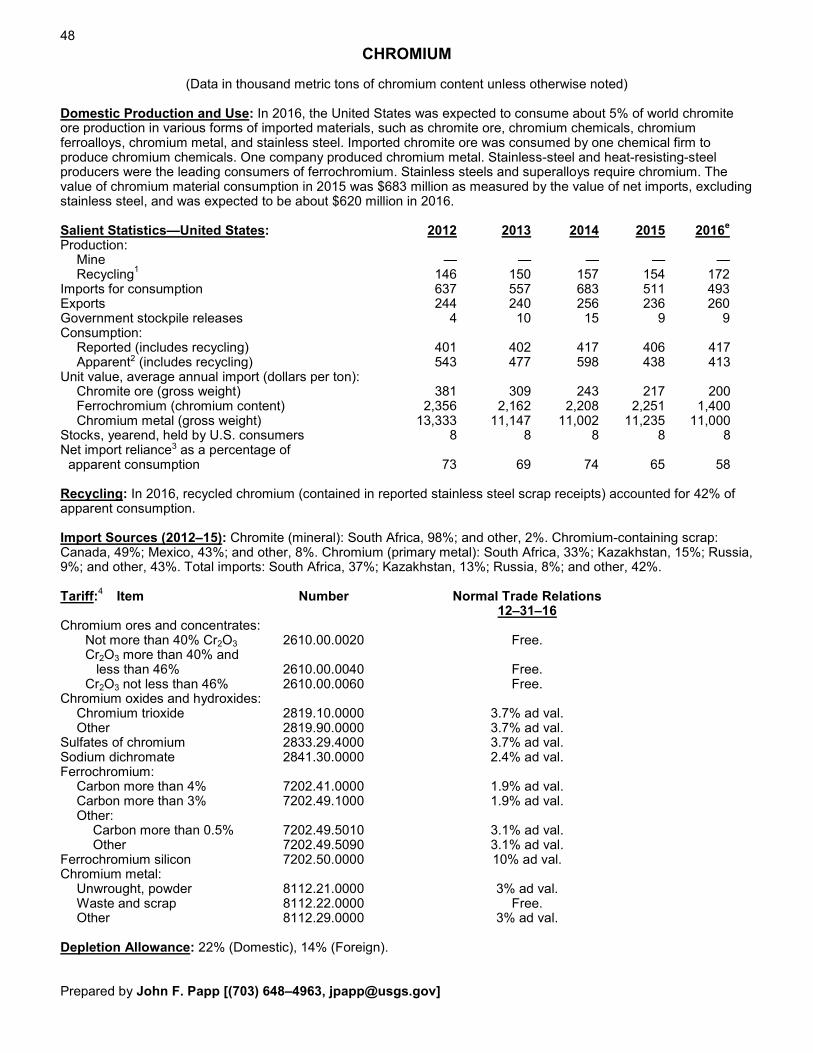
48
CHROMIUM
(Data in thousand metric tons of chromium content unless otherwise noted) Domestic Production and Use: In 2016, the United States was expected to consume about 5% of world chromite ore production in various forms of imported materials, such as chromite ore, chromium chemicals, chromium ferroalloys, chromium metal, and stainless steel. Imported chromite ore was consumed by one chemical firm to produce chromium chemicals. One company produced chromium metal. Stainless-steel and heat-resisting-steel producers were the leading consumers of ferrochromium. Stainless steels and superalloys require chromium. The value of chromium material consumption in 2015 was $683 million as measured by the value of net imports, excluding stainless steel, and was expected to be about $620 million in 2016. Salient Statistics—United States: 2012 2013 2014 2015 2016e Production: Mine — — — — — Recycling1 146 150 157 154 172 Imports for consumption 637 557 683 511 493 Exports 244 240 256 236 260 Government stockpile releases 4 10 15 9 9 Consumption: Reported (includes recycling) 401 402 417 406 417 Apparent2 (includes recycling) 543 477 598 438 413 Unit value, average annual import (dollars per ton): Chromite ore (gross weight) 381 309 243 217 200 Ferrochromium (chromium content) 2,356 2,162 2,208 2,251 1,400 Chromium metal (gross weight) 13,333 11,147 11,002 11,235 11,000 Stocks, yearend, held by U.S. consumers 8 8 8 8 8 Net import reliance3 as a percentage of apparent consumption 73 69 74 65 58 Recycling: In 2016, recycled chromium (contained in reported stainless steel scrap receipts) accounted for 42% of apparent consumption. Import Sources (2012–15): Chromite (mineral): South Africa, 98%; and other, 2%. Chromium-containing scrap: Canada, 49%; Mexico, 43%; and other, 8%. Chromium (primary metal): South Africa, 33%; Kazakhstan, 15%; Russia, 9%; and other, 43%. Total imports: South Africa, 37%; Kazakhstan, 13%; Russia, 8%; and other, 42%. Tariff:4 Item Number Normal Trade Relations 12–31–16 Chromium ores and concentrates: Not more than 40% Cr2O3 2610.00.0020 Free. Cr2O3 more than 40% and less than 46% 2610.00.0040 Free. Cr2O3 not less than 46% 2610.00.0060 Free. Chromium oxides and hydroxides: Chromium trioxide 2819.10.0000 3.7% ad val. Other 2819.90.0000 3.7% ad val. Sulfates of chromium 2833.29.4000 3.7% ad val. Sodium dichromate 2841.30.0000 2.4% ad val. Ferrochromium: Carbon more than 4% 7202.41.0000 1.9% ad val. Carbon more than 3% 7202.49.1000 1.9% ad val. Other: Carbon more than 0.5% 7202.49.5010 3.1% ad val. Other 7202.49.5090 3.1% ad val. Ferrochromium silicon 7202.50.0000 10% ad val. Chromium metal: Unwrought, powder 8112.21.0000 3% ad val. Waste and scrap 8112.22.0000 Free. Other 8112.29.0000 3% ad val. Depletion Allowance: 22% (Domestic), 14% (Foreign). Prepared by John F. Papp [(703) 648–4963, [email protected]]

49 CHROMIUM
Government Stockpile: For FY 2017, the Defense Logistics Agency (DLA) Strategic Materials announced maximum disposal limits for chromium materials of about 21,300 tons of ferrochromium and 181 tons of chromium metal. No acquisitions were planned.
Stockpile Status—9–30–165 Disposal Plan Disposals Material6 Inventory FY 2016 FY 2016 Ferrochromium: High-carbon 57.4 721.3 5.58 Low-carbon 30.7 — 2.15 Chromium metal 3.91 0.181 0.059 Events, Trends, and Issues: Chromium is consumed in the form of ferrochromium to produce stainless steel. China was the leading chromium-consuming and ferrochromium-producing country and the leading stainless steel producer. South Africa was the leading chromite ore and a leading ferrochromium producer upon which world stainless steel producers depend directly or indirectly for chromium supply. Ferrochromium production is electrical energy intensive, so constrained electrical power supply results in constrained ferrochromium production. World stainless steel production rose from the first to the second quarter of 2016 and then declined from the second to the third quarter; however, third quarter production still exceeded that of the first quarter. China was the leading stainless-steel producer, accounting for about one-half of world production. As result of declining chromite ore prices early in 2016, it was thought that chromite ore stocks on the ground may have increased; however, moving that material into the market place was limited by the availability of transportation in South Africa and Zimbabwe. The price of South African Upper Group Reef seam 2 chromite concentrate, used in China to produce ferrochromium for its stainless-steel-producing industry, nearly doubled during the year. In Turkey, miners shifted away from chromite ore production when chromite ore prices declined early in the year. DLA Strategic Materials planned to continue selling ferrochromium in fiscal year 2017 until it reaches its limit; however, DLA Strategic Materials would need congressional authority to continue sales into fiscal year 2018. World Mine Production and Reserves: Mine production8 Reserves9 2015 2016e (shipping grade)10 United States — — 620 India 3,200 3,200 54,000 Kazakhstan 5,490 5,500 230,000 South Africa 14,000 14,000 200,000 Turkey 3,500 3,500 12,000 Other countries 4,220 4,200 NA World total (rounded) 30,400 30,400 500,000 World Resources: World resources are greater than 12 billion tons of shipping-grade chromite, sufficient to meet conceivable demand for centuries. About 95% of the world’s chromium resources is geographically concentrated in Kazakhstan and southern Africa; U.S. chromium resources are mostly in the Stillwater Complex in Montana. Substitutes: Chromium has no substitute in stainless steel, the leading end use, or in superalloys, the major strategic end use. Chromium-containing scrap can substitute for ferrochromium in some metallurgical uses. eEstimated. NA Not available. — Zero. 1Recycling production is based on reported stainless steel scrap receipts. 2Defined as production (from mines and recycling) + imports – exports + adjustments for Government and industry stock changes. 3Defined as imports – exports + adjustments for Government and industry stock changes. 4In addition to the tariff items listed, certain imported chromium materials (see 26 U.S.C. sec. 4661, 4662, and 4672) are subject to excise tax. 5See Appendix B for definitions. 6Units are thousand tons of material by gross weight. 7High-carbon and low-carbon ferrochromium, combined. 8Mine production units are thousand tons, gross weight, of marketable chromite ore. 9See Appendix C for resource and reserve definitions and information concerning data sources. 10Reserves units are thousand tons of shipping-grade chromite ore, which is deposit quantity and grade normalized to 45% Cr2O3.
U.S. Geological Survey, Mineral Commodity Summaries, January 2017

50
CLAYS
(Data in thousand metric tons unless otherwise noted) Domestic Production and Use: Production of clays (sold or used) in the United States was estimated to be 25.7 million tons valued at $1.43 billion in 2016, with about 145 companies operating clay and shale mines in 40 States. The leading 20 firms produced approximately 60% of the U.S. tonnage and 80% of the value for all types of clay. The United States accounted for 15% to 25% of the global production of refined clays, excluding common clay and shale. Principal uses for specific clays were estimated to be as follows: ball clay—41% floor and wall tile and 21% sanitaryware; bentonite—38% pet waste absorbents, 31% drilling mud, and 21% foundry sand and iron ore pelletizing (combined); common clay—40% brick, 32% cement, and 22% lightweight aggregate; fire clay—62% refractory products and miscellaneous uses and 38% heavy clay products (for example, brick and cement); fuller’s earth—67% pet waste absorbents; and kaolin—43% paper coating and filling, 19% ceramics, and 8% refractories. Lightweight ceramic proppants for use in hydraulic fracturing are also a significant market for kaolin, but available data are insufficient for a reliable estimate of the market size. U.S. exports of bentonite and kaolin decreased by an estimated 36% and 28%, respectively, in 2016 relative to the prior year. Canada, Japan, and Saudi Arabia (in decreasing order by tonnage) were the leading destinations for U.S. bentonite and accounted for 68% of exports. About 1.7 million tons of kaolin (30% of production) was exported primarily to Japan, Mexico, China, Finland, and Canada (in decreasing order by tonnage), which collectively received 62% of U.S. international kaolin shipments. Based on the ports from which fire clay was shipped, up to 70% of listed fire clay exports were thought to be misclassified refractory-grade kaolin. Salient Statistics—United States: 2012 2013 2014 2015 2016e Production (sold or used): Ball clay 973 1,000 1,030 1,030 1,020 Bentonite 4,980 4,350 4,800 4,040 3,800 Common clay 11,900 11,000 11,400 12,200 12,800 Fire clay 183 194 222 225 448 Fuller’s earth1 1,980 1,990 1,980 1,930 1,850 Kaolin 5,900 6,140 6,250 5,990 5,710 Total1, 2 25,900 24,700 25,600 25,400 25,700 Imports for consumption: Artificially activated clays and earths 31 24 26 24 27 Kaolin 472 467 518 426 353 Other 21 27 33 61 52 Total2 524 518 576 511 432 Exports: Ball clay 77 52 33 48 30 Bentonite 1,030 890 901 938 600 Clays, not elsewhere classified 315 304 282 268 190 Fire clay3 289 268 237 217 135 Fuller’s earth 107 86 92 77 65 Kaolin 2,450 2,540 2,640 2,420 1,740 Total2 4,270 4,140 4,190 3,970 2,760 Consumption, apparent4 22,200 21,100 22,300 21,900 23,400 Price, ex-works, average, dollars per ton: Ball clay 46 43 44 46 45 Bentonite 62 65 69 74 74 Common clay 12 12 11 13 13 Fire clay 27 18 17 14 11 Fuller’s earth1 92 88 86 106 99 Kaolin 149 146 144 130 132 Employment (excludes office workers): Mine (may not include contract workers) 1,190 1,110 1,140 1,130 1,370 Mill 4,720 4,820 4,930 4,730 4,470 Net import reliance5 as a percentage of apparent consumption E E E E E Recycling: Insignificant. Import Sources (2012–15): All clay types combined: Brazil, 85%; Mexico, 5%; China, 4%; United Kingdom, 2%; and other, 4%. Prepared by Daniel M. Flanagan [(703) 648–7726, [email protected]]

51 CLAYS
Tariff: Item Number Normal Trade Relations 12–31–16 Kaolin and other kaolinic clays, whether or not calcined 2507.00.0000 Free. Bentonite 2508.10.0000 Free. Fire clay 2508.30.0000 Free. Common blue clay and other ball clays 2508.40.0110 Free. Decolorizing earths and fuller’s earth 2508.40.0120 Free. Other clays 2508.40.0150 Free. Chamotte or dina’s earth 2508.70.0000 Free. Activated clays and activated earths 3802.90.2000 2.5% ad val. Expanded clays and other mixtures 6806.20.0000 Free. Depletion Allowance: Ball clay, bentonite, fire clay, fuller’s earth, and kaolin, 14% (Domestic and foreign); clay used in the manufacture of common brick, lightweight aggregate, and sewer pipe, 7.5% (Domestic and foreign); clay used in the manufacture of drain and roofing tile, flower pots, and kindred products, 5% (Domestic and foreign); clay from which alumina and aluminum compounds are extracted, 22% (Domestic). Government Stockpile: None. Events, Trends, and Issues: Total sales of U.S. clay increased slightly in 2016 compared with those in 2015. Increases in construction spending and housing starts led to a 5% growth in sales of common clay, but bentonite sales declined by 6%, driven by decreased domestic oil drilling activity. Lower kaolin production was likely a result of declining sales to paper markets and reduced demand for ceramic proppants used by the oil and gas industry. World Mine Production and Reserves:6 Global reserves are large, but country-specific data are not available. Mine productione Bentonite Fuller’s earth Kaolin 2015 2016 2015 2016 2015 2016 United States 74,040 3,800 1, 71,930 11,850 75,990 5,710 Brazil (beneficiated) 405 405 — — 1,800 1,800 China 3,650 3,650 — — 3,200 3,200 Czech Republic 7369 370 — — 7, 83,450 83,500 Germany 395 360 — — 4,300 4,300 Greece 81,010 81,200 — — — — India 1,100 1,100 6 6 84,770 84,800 Iran 420 600 — — 820 1,500 Mexico 470 500 250 250 7320 320 Senegal — — 190 190 — — Spain 113 115 647 645 8247 8330 Turkey 1,090 1,200 10 10 2,030 2,000 Ukraine 210 210 — — 1,430 1,450 United Kingdom — — — — 1,090 1,100 Other countries 2,710 2,700 276 275 6,980 7,000 World total (rounded) 16,000 16,200 13,310 13,230 36,400 37,000 World Resources: Resources of all clays are extremely large. Substitutes: Clays compete with calcium carbonate in filler and extender applications; diatomite, organic litters, polymers, silica gel, and zeolites as absorbents; and various siding and roofing types in building construction. eEstimated. E Net exporter. — Zero. 1Does not include U.S. production of attapulgite. 2Data may not add to totals shown because of independent rounding. 3Includes refractory-grade kaolin. 4Defined as production (sold or used) + imports – exports. 5Defined as imports – exports. 6See Appendix C for resource and reserve definitions and information concerning data sources. 7Reported figure. 8Includes production of crude ore.
U.S. Geological Survey, Mineral Commodity Summaries, January 2017

52
COBALT
(Data in metric tons of cobalt content unless otherwise noted) Domestic Production and Use: In 2016, a nickel-copper mine in Michigan produced cobalt-bearing nickel concentrate. Most U.S. cobalt supply comprised imports and secondary (scrap) materials. Six companies were known to produce cobalt chemicals. About 45% of the cobalt consumed in the United States was used in superalloys, mainly in aircraft gas turbine engines; 8% in cemented carbides for cutting and wear-resistant applications; 16% in various other metallic applications; and 31% in a variety of chemical applications. The total estimated value of cobalt consumed in 2016 was $250 million. Salient Statistics—United States: 2012 2013 2014 2015 2016e Production: Minee — — 120 760 690 Secondary 2,160 2,160 2,200 2,750 2,700 Imports for consumption 11,100 10,400 11,300 11,400 11,900 Exports 3,760 3,850 4,500 3,830 4,200 Shipments from Government stockpile excesses1 — — — — — Consumption: Reported (includes secondary) 8,660 8,090 8,560 8,780 8,900 Apparent2 (includes secondary) 9,540 8,650 8,710 10,300 10,400 Price, average, dollars per pound: U.S. spot, cathode3 14.07 12.89 14.48 13.44 11.90 London Metal Exchange (LME), cash 13.06 12.26 14.00 12.90 11.50 Stocks, yearend: Industry 980 1,080 1,420 1,330 1,300 LME, U.S. warehouse 51 41 9 165 195 Net import reliance4 as a percentage of apparent consumption 77 75 75 73 74 Recycling: In 2016, cobalt contained in purchased scrap represented an estimated 30% of cobalt reported consumption. Import Sources (2012–15): Cobalt contained in metal, oxide, and salts: China, 18%; Norway, 14%; Finland, 10%; Japan, 9%; and other, 49%. Tariff: Item Number Normal Trade Relations5 12–31–16 Cobalt ores and concentrates 2605.00.0000 Free. Chemical compounds: Cobalt oxides and hydroxides 2822.00.0000 0.1% ad val. Cobalt chlorides 2827.39.6000 4.2% ad val. Cobalt sulfates 2833.29.1000 1.4% ad val. Cobalt carbonates 2836.99.1000 4.2% ad val. Cobalt acetates 2915.29.3000 4.2% ad val. Unwrought cobalt, alloys 8105.20.3000 4.4% ad val. Unwrought cobalt, other 8105.20.6000 Free. Cobalt mattes and other intermediate products; cobalt powders 8105.20.9000 Free. Cobalt waste and scrap 8105.30.0000 Free. Wrought cobalt and cobalt articles 8105.90.0000 3.7% ad val. Depletion Allowance: 22% (Domestic), 14% (Foreign). Government Stockpile:
Stockpile Status—9–30–166
Disposal Plan Disposals Material Inventory FY 2016 FY 2016 Cobalt 301 — — Lithium cobalt oxide e0.145 — — Lithium nickel cobalt aluminum oxide e0.089 — — Prepared by Kim B. Shedd [(703) 648–4974, [email protected]]

53 COBALT
Events, Trends, and Issues: Congo (Kinshasa) continued to be the world’s leading source of mined cobalt, supplying more than one-half of world cobalt mine production. With the exception of production in Morocco and artisanally mined cobalt in Congo (Kinshasa), most cobalt is mined as a byproduct of copper or nickel. In 2016, global cobalt mine production decreased, mainly owing to lower production from nickel operations. Growth in world refined cobalt supply was forecast to increase at a lower rate than that of world cobalt consumption, which was driven mainly by strong growth in the rechargeable battery and aerospace industries. As a result, the global cobalt market was expected to shift from surplus to deficit. China was the world’s leading producer of refined cobalt and the leading supplier of cobalt imports to the United States. Much of China’s production was from ore and partially refined cobalt imported from Congo (Kinshasa); scrap and stocks of cobalt materials also contributed to China’s supply. In 2015 and 2016, China’s State Reserve Bureau purchased cobalt for its stockpile. China was the world’s leading consumer of cobalt, with nearly 80% of its consumption being used by the rechargeable battery industry. World Mine Production and Reserves: Reserves for Australia, Canada, New Caledonia, the Philippines, South Africa, the United States, and “Other countries” were revised based on company or Government reports. Mine production Reserves7 2015 2016e United States e760 690 21,000 Australia 6,000 5,100 81,000,000 Canada 6,900 7,300 270,000 China 7,700 7,700 80,000 Congo (Kinshasa) 63,000 66,000 3,400,000 Cuba 4,300 4,200 500,000 Madagascar 3,700 3,300 130,000 New Caledonia9 3,680 3,300 64,000 Philippines 4,300 3,500 290,000 Russia 6,200 6,200 250,000 South Africa 3,000 3,000 29,000 Zambia 4,600 4,600 270,000 Other countries 11,600 8,300 690,000 World total (rounded) 126,000 123,000 7,000,000 World Resources: Identified cobalt resources of the United States are estimated to be about 1 million tons. Most of these resources are in Minnesota, but other important occurrences are in Alaska, California, Idaho, Michigan, Missouri, Montana, Oregon, and Pennsylvania. With the exception of resources in Idaho and Missouri, any future cobalt production from these deposits would be as a byproduct of another metal. Identified world terrestrial cobalt resources are about 25 million tons. The vast majority of these resources are in sediment-hosted stratiform copper deposits in Congo (Kinshasa) and Zambia; nickel-bearing laterite deposits in Australia and nearby island countries and Cuba; and magmatic nickel-copper sulfide deposits hosted in mafic and ultramafic rocks in Australia, Canada, Russia, and the United States. More than 120 million tons of cobalt resources have been identified in manganese nodules and crusts on the floor of the Atlantic, Indian, and Pacific Oceans. Substitutes: In some applications, substitution for cobalt would result in a loss in product performance. Potential substitutes include barium or strontium ferrites, neodymium-iron-boron, or nickel-iron alloys in magnets; cerium, iron, lead, manganese, or vanadium in paints; cobalt-iron-copper or iron-copper in diamond tools; copper-iron-manganese for curing unsaturated polyester resins; iron, iron-cobalt-nickel, nickel, cermets, or ceramics in cutting and wear-resistant materials; iron-phosphorous, manganese, nickel-cobalt-aluminum, or nickel-cobalt-manganese in lithium-ion batteries; nickel-based alloys or ceramics in jet engines; nickel in petroleum catalysts; and rhodium in hydroformylation catalysts. eEstimated. — Zero. 1Cobalt metal. In 2014–16, the Defense Logistics Agency acquired cobalt-bearing battery precursor materials. 2The sum of U.S. net import reliance and secondary production, as estimated from consumption of purchased scrap. 3As reported by Platts Metals Week. 4Defined as imports – exports + adjustments for Government and industry stock changes for refined cobalt. 5Tariffs for certain countries and items may be eliminated under special trade agreements. 6See Appendix B for definitions. 7See Appendix C for resource and reserve definitions and information concerning data sources. 8For Australia, Joint Ore Reserves Committee-compliant reserves were about 480,000 tons. 9Overseas territory of France. One company reported zero reserves owing to recent nickel prices, although it continued to produce from that deposit.
U.S. Geological Survey, Mineral Commodity Summaries, January 2017

54
COPPER
(Data in thousand metric tons of copper content unless otherwise noted) Domestic Production and Use: U.S. mine production of copper in 2016 increased slightly, to about 1.41 million tons, and was valued at about $6.8 billion. Arizona, New Mexico, Utah, Nevada, Montana, and Michigan, in descending order of production, accounted for more than 99% of domestic mine production; copper also was recovered in Missouri. Twenty-four mines recovered copper, 17 of which accounted for about 99% of production. Three primary smelters, 3 electrolytic and 4 fire refineries, and 15 electrowinning facilities operated during 2016. Refined copper and scrap were used at about 30 brass mills, 13 rod mills, and 500 foundries and miscellaneous consumers. Copper and copper alloy products were used in building construction, 44%; transportation equipment, 19%; electric and electronic products, 18%; consumer and general products, 12%; and industrial machinery and equipment, 7%.1 Salient Statistics—United States: 2012 2013 2014 2015 2016e Production: Mine, recoverable 1,170 1,250 1,360 1,380 1,410 Refinery: Primary 962 993 1,050 1,090 1,160 Secondary 39 47 46 49 50 Copper from old scrap 164 166 173 167 170 Imports for consumption: Ores and concentrates 6 3 (2) (2) (2) Refined 630 734 620 686 670 General imports, refined 628 729 614 664 660 Exports: Ores and concentrates 301 348 410 392 340 Refined 169 111 127 86 100 Consumption: Reported, refined 1,760 1,830 1,760 1,810 1,790 Apparent, unmanufactured3 1,760 1,750 1,780 1,820 1,800 Price, average, cents per pound: Domestic producer, cathode 367.3 339.9 318.1 256.2 220.0 London Metal Exchange, high-grade 360.6 332.3 311.1 249.5 216.0 Stocks, yearend, refined, held by U.S. producers, consumers, and metal exchanges 236 258 190 209 160 Employment, mine and mill, thousands 11.4 12.0 12.1 11.2 10.0 Net import reliance4 as a percentage of apparent consumption (refined copper) 36 34 32 32 34 Recycling: Old scrap, converted to refined metal and alloys, provided 170,000 tons of copper, equivalent to 9% of apparent consumption. Purchased new scrap, derived from fabricating operations, yielded 640,000 tons of contained copper. Of the total copper recovered from scrap (including aluminum- and nickel-based scrap), brass mills recovered 73%; copper smelters, refiners, and ingot makers, 21%; and miscellaneous manufacturers, foundries, and chemical plants, 6%. Copper in all scrap contributed about 31% of the U.S. copper supply. Import Sources (2012–15): Unmanufactured (ore and concentrates, blister and anodes, refined, etc.): Chile, 50%; Canada, 28%; Mexico, 16%; and other, 6%. Refined copper accounted for 86% of unmanufactured copper imports. Tariff: Item Number Normal Trade Relations5 12–31–16 Copper ores and concentrates 2603.00.0000 1.7¢/kg on lead content. Unrefined copper anode 7402.00.0000 Free. Refined and alloys; unwrought 7403.00.0000 1.0% ad val. Copper wire (rod) 7408.11.6000 3.0% ad val. Depletion Allowance: 15% (Domestic), 14% (Foreign). Government Stockpile: None. Events, Trends, and Issues: In the first 10 months of 2016, the monthly average COMEX spot copper price fluctuated between $2.01 per pound (January) and $2.23 per pound (May), and was projected to average $2.15 per pound for the full year, a decrease from $2.51 per pound in 2015. The decrease in the average copper price compared with that of 2015 was in large part attributed to lower consumption growth in China. At the end of July, Prepared by Mark Brininstool [Contact Daniel M. Flanagan, (703) 648–7726, [email protected]]

55 COPPER
domestic stocks of refined copper were 26% lower than those at yearend 2015. The International Copper Study Group (ICSG) projected that in 2016, global refined copper consumption and production would be essentially balanced. Global production of refined copper was projected to increase by 2.2% and consumption was projected to increase by 1.5%.6 U.S. mine production increased slightly in 2016. Significant mine production increases occurred at the Bingham Canyon Mine in Utah, the Chino Mine in New Mexico, and the Morenci Mine in Arizona. During the second half of 2015, the two leading domestic producers had announced planned production decreases at mines in Arizona owing to low copper prices, but through the first half of 2016, production cuts had not been as large as expected. Total U.S. refined production increased by about 6% because in 2015, there were smelter maintenance shutdowns and a concentrate shortfall that did not impact 2016 output. In 2017, according to ICSG projections, global refined copper production was expected to exceed consumption by 160,000 t (1%) owing to production growth of 1.7% outpacing a 1.0% growth in global refined consumption. Mine and refined production were expected to be greater than in earlier projections because previously announced production cuts have not taken place. World Mine Production and Reserves: Reserves for Australia, China, and Peru were revised based on new information from the Governments of those countries. Reserves for the United States were revised based on reported company data. Mine production Reserves7 2015 2016e United States 1,380 1,410 35,000 Australia 971 970 889,000 Canada 697 720 11,000 Chile 5,760 5,500 210,000 China 1,710 1,740 28,000 Congo (Kinshasa) 1,020 910 20,000 Mexico 594 620 46,000 Peru 1,700 2,300 81,000 Russia 732 710 30,000 Zambia 712 740 20,000 Other countries 3,800 3,800 150,000 World total (rounded) 19,100 19,400 720,000 World Resources: A 1998 U.S. Geological Survey (USGS) assessment estimated 550 million tons of copper were contained in identified and undiscovered resources in the United States.9 A 2014 USGS global assessment of copper deposits indicated that identified resources contain about 2.1 billion tons of copper (porphyry deposits accounted for 1.8 billion tons of those resources), and undiscovered resources contained an estimated 3.5 billion tons.10 (For a listing of USGS regional copper resource assessments, go to http://minerals.usgs.gov/global.) Substitutes: Aluminum substitutes for copper in power cable, electrical equipment, automobile radiators, and cooling and refrigeration tube; titanium and steel are used in heat exchangers; optical fiber substitutes for copper in telecommunications applications; and plastics substitute for copper in water pipe, drain pipe, and plumbing fixtures. eEstimated. 1Some electrical components are included in each end use. Distribution for 2016 by the Copper Development Association, Inc., 2016. 2Less than ½ unit. 3Defined as primary refined production + copper from old scrap converted to refined metal and alloys + refined imports – refined exports ± changes in refined stocks. General imports were used to calculate apparent consumption. 4Defined as imports – exports + adjustments for industry stock changes for refined copper. 5No tariff for Canada, Chile, Mexico, and Peru for items shown. Tariffs for other countries may be eliminated under special trade agreements. 6International Copper Study Group, 2016, Forecast 2016–2017: Lisbon, Portugal, International Copper Study Group press release, October 26, 2 p. 7See Appendix C for resource and reserve definitions and information concerning data sources. 8 For Australia, Joint Ore Reserves Committee-compliant reserves were about 24 million tons. 9U.S. Geological Survey National Mineral Resource Assessment Team, 2000, 1998 assessment of undiscovered deposits of gold, silver, copper, lead, and zinc in the United States: U.S. Geological Survey Circular 1178, 21 p. 10Johnson, K.M., Hammarstrom, J.M., Zientek, M.L., and Dicken, C.L., 2014, Estimate of undiscovered copper resources of the world, 2013: U.S. Geological Survey Fact Sheet 2014–3004, 3 p., http://dx.doi.org/10.3133/fs20143004.
U.S. Geological Survey, Mineral Commodity Summaries, January 2017

56
DIAMOND (INDUSTRIAL)
(Data in million carats unless otherwise noted) Domestic Production and Use: In 2016, total domestic production of industrial diamond was estimated to be 125 million carats with a value of $123 million. Domestic output was synthetic grit, powder, and stone. One firm in Ohio and one firm in Pennsylvania accounted for all of the production. At least nine firms produced polycrystalline diamond from diamond powder. Three companies recovered used industrial diamond as one of their principal operations. Total domestic secondary production of industrial diamond was estimated to be 66.5 million carats with a value of $4.13 million. The United States was one of the world’s leading markets. The major consuming sectors of industrial diamond are computer chip production; construction; drilling for minerals, natural gas, and oil; machinery manufacturing; stone cutting and polishing; and transportation (infrastructure and vehicles). Stone cutting and highway building, milling, and repair consumed most of the industrial diamond stone. About 98% of the U.S. industrial diamond market now uses synthetic industrial diamond because its quality can be controlled and its properties can be customized. Salient Statistics—United States: 2012 2013 2014 2015 2016e Bort, grit, and dust and powder; natural and synthetic: Production: Manufactured diamonde 44 46 53 40 42 Secondary 36.5 38.1 43.7 63.5 66.3 Imports for consumption 595 728 682 275 412 Exports 174 149 163 140 114 Consumption, apparent 501 663 615 238 406 Price, value of imports, dollars per carat 0.13 0.11 0.11 0.20 0.20 Net import reliance1 as a percentage of apparent consumption 84 87 84 57 73 Stones, natural and synthetic: Production: Manufactured diamonde 60 63 72 79 83 Secondary 0.33 0.34 0.52 0.19 0.19 Imports for consumption2 2.33 1.94 2.16 1.31 1.35 Exports — — — — — Sales from Government stockpile excesses — — — — — Consumption, apparent 62.3 64.8 74.6 80.7 84.7 Price, value of imports, dollars per carat 15.30 15.50 14.40 17.50 16.80 Net import reliance1 as a percentage of apparent consumption 4 3 3 2 2 Recycling: In 2016, the amount of diamond bort, grit, and dust and powder recycled was estimated to be 66.3 million carats with an estimated value of $3.64 million. It was estimated that 195,000 carats of diamond stone was recycled with an estimated value of $486,000. Import Sources (2012–15): Bort, grit, and dust and powder; natural and synthetic: China, 78%; Ireland, 8%; Romania, 4%; Russia, 3%; and other, 7%. Stones, primarily natural: India, 23%; South Africa, 22%; Botswana, 20%; Ghana, 11%; and other, 24%. Tariff: Item Number Normal Trade Relations 12–31–16 Industrial Miners’ diamonds, carbonados 7102.21.1010 Free. Industrial Miners’ diamonds, other 7102.21.1020 Free. Industrial diamonds, simply sawn, cleaved, or bruted 7102.21.3000 Free. Industrial diamonds, not worked 7102.21.4000 Free. Grit or dust and powder of natural diamonds, 80 mesh or finer 7105.10.0011 Free. Grit or dust and powder of natural diamonds, over 80 mesh 7105.10.0015 Free. Grit or dust and powder of synthetic diamonds, coated with metal 7105.10.0020 Free. Grit or dust and powder of synthetic diamonds, not coated with metal, 80 mesh or finer 7105.10.0030 Free. Grit or dust and powder of synthetic diamonds, not coated with metal, over 80 mesh 7105.10.0050 Free. Prepared by Donald W. Olson [(703) 648–7721, [email protected]]

57 DIAMOND (INDUSTRIAL)
Depletion Allowance: 14% (Domestic and foreign). Government Stockpile: None. Events, Trends, and Issues: In 2016, China was the world’s leading producer of synthetic industrial diamond, with annual production exceeding 4 billion carats. The United States is likely to continue to be one of the world’s leading markets for industrial diamond into the next decade and likely will remain a significant producer and exporter of synthetic industrial diamond as well. U.S. demand for industrial diamond is likely to be strong in the construction sector as the United States continues building, milling, and repairing the Nation’s highway system. Industrial diamond coats the cutting edge of saws used to cut cement in highway construction and repair work. Demand for synthetic diamond grit and powder is expected to remain greater than that for natural diamond material. Constant-dollar prices of synthetic diamond products probably will continue to decline as production technology becomes more cost effective; the decline is even more likely if competition from low-cost producers in China and Russia continues to increase. During 2016, several new diamond mines opened around the world. Among them were two in Canada, the Gahcho Kué Mine in the Northwest Territories, which is expected to be one of the world’s largest diamond mines, and the Renard Mine in Quebec. Four new mines opened in Lesotho—the Liqhobong, Mothae, Kolo, and Lemphane Mines. World Mine Production and Reserves:3 Reserves for Australia and Russia were revised based on new Government information. Mine production Reserves4 2015 2016e United States — — NA Australia 13 13 210 Botswana 6 6 130 Congo (Kinshasa) 13 11 150 Russia 18 18 100 South Africa 1 4 70 Zimbabwe 3 2 NA Other countries 3 3 90 World total (rounded) 57 57 750 World Resources: Natural diamond deposits have been discovered in more than 35 countries. Natural diamond accounts for about 1% of all industrial diamond used; synthetic diamond accounts for the remainder. At least 15 countries have the technology to produce synthetic diamond. Substitutes: Materials that can compete with industrial diamond in some applications include manufactured abrasives, such as cubic boron nitride, fused aluminum oxide, and silicon carbide. Globally, synthetic diamond rather than natural diamond is used for about 99% of industrial applications. eEstimated. NA Not available. — Zero. 1Defined as imports – exports + adjustments for industry stock changes. 2May include synthetic miners’ diamond. 3Natural industrial diamond only. Note that synthetic diamond production far exceeds natural industrial diamond output. Worldwide production of manufactured industrial diamond totaled at least 4.41 billion carats in 2016; the leading producers included Belarus, China, Ireland, Japan, Russia, South Africa, Sweden, and the United States. 4See Appendix C for resource and reserve definitions and information concerning data sources.
U.S. Geological Survey, Mineral Commodity Summaries, January 2017

58
DIATOMITE
(Data in thousand metric tons unless otherwise noted) Domestic Production and Use: In 2016, production of diatomite was estimated to be 850,000 tons with an estimated processed value of $250 million, f.o.b. plant. Six companies produced diatomite at 12 mining areas and nine processing facilities in California, Nevada, Oregon, and Washington. Diatomite is used in filtration, 60%; lightweight aggregates, 25%; fillers, 10%; absorbents, 4%; and other applications, 1%, including specialized pharmaceutical and biomedical uses. The unit value of diatomite varied widely in 2016, from approximately $10 per ton when used as a lightweight aggregate in portland cement concrete to more than $500 per ton for limited specialty markets, including art supplies, cosmetics, and DNA extraction. Salient Statistics—United States: 2012 2013 2014 2015 2016e Production1 735 782 901 832 850 Imports for consumption 3 1 4 7 8 Exports 96 92 82 75 66 Consumption, apparent 642 691 823 764 792 Price, average value, dollars per ton, f.o.b. plant 286 293 298 291 294 Stocks, producer, yearende 40 40 40 40 40 Employment, mine and plant, numbere 660 660 660 660 660 Net import reliance2 as a percentage of apparent consumption E E E E E Recycling: None. Import Sources (2012–15): Canada, 52%; France, 16%; Mexico, 16%; China, 6%; and other, 10%. Tariff: Item Number Normal Trade Relations 12–31–16 Siliceous fossil meals, including diatomite 2512.00.0000 Free. Depletion Allowance: 14% (Domestic and foreign). Government Stockpile: None. Prepared by Robert D. Crangle, Jr. [(703) 648–6410, [email protected]]
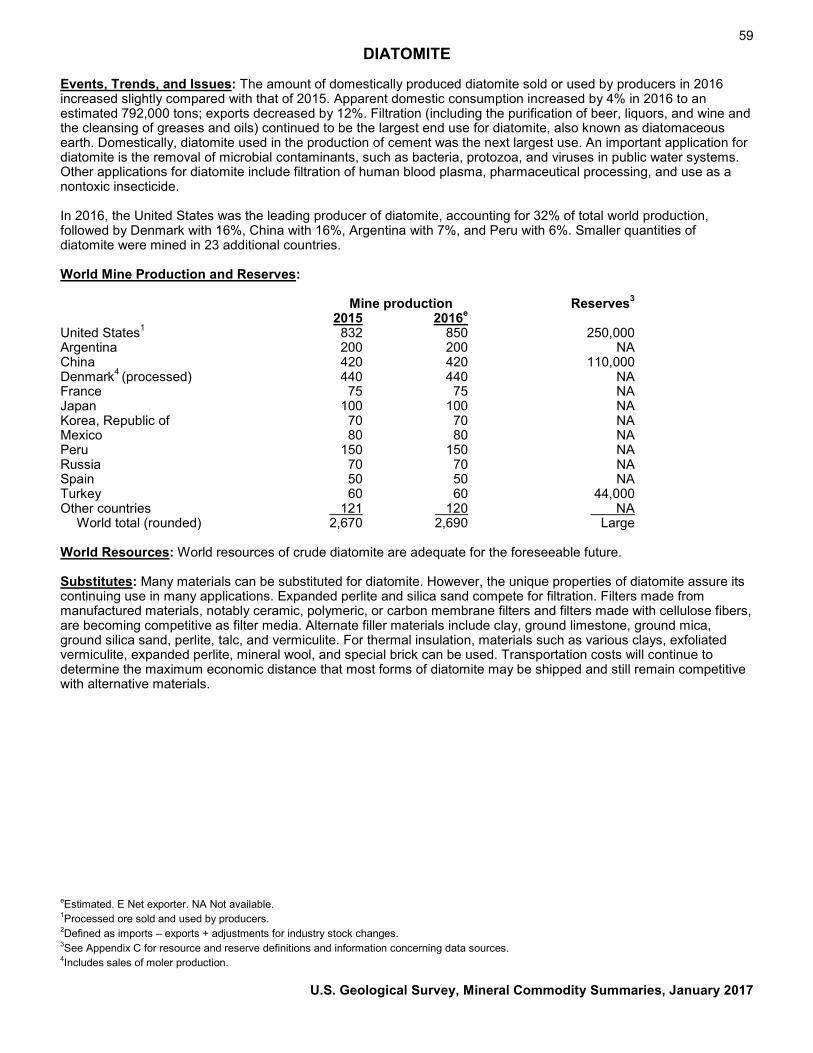
59 DIATOMITE
Events, Trends, and Issues: The amount of domestically produced diatomite sold or used by producers in 2016 increased slightly compared with that of 2015. Apparent domestic consumption increased by 4% in 2016 to an estimated 792,000 tons; exports decreased by 12%. Filtration (including the purification of beer, liquors, and wine and the cleansing of greases and oils) continued to be the largest end use for diatomite, also known as diatomaceous earth. Domestically, diatomite used in the production of cement was the next largest use. An important application for diatomite is the removal of microbial contaminants, such as bacteria, protozoa, and viruses in public water systems. Other applications for diatomite include filtration of human blood plasma, pharmaceutical processing, and use as a nontoxic insecticide. In 2016, the United States was the leading producer of diatomite, accounting for 32% of total world production, followed by Denmark with 16%, China with 16%, Argentina with 7%, and Peru with 6%. Smaller quantities of diatomite were mined in 23 additional countries. World Mine Production and Reserves: Mine production Reserves3 2015 2016e United States1 832 850 250,000 Argentina 200 200 NA China 420 420 110,000 Denmark4 (processed) 440 440 NA France 75 75 NA Japan 100 100 NA Korea, Republic of 70 70 NA Mexico 80 80 NA Peru 150 150 NA Russia 70 70 NA Spain 50 50 NA Turkey 60 60 44,000 Other countries 121 120 NA World total (rounded) 2,670 2,690 Large World Resources: World resources of crude diatomite are adequate for the foreseeable future. Substitutes: Many materials can be substituted for diatomite. However, the unique properties of diatomite assure its continuing use in many applications. Expanded perlite and silica sand compete for filtration. Filters made from manufactured materials, notably ceramic, polymeric, or carbon membrane filters and filters made with cellulose fibers, are becoming competitive as filter media. Alternate filler materials include clay, ground limestone, ground mica, ground silica sand, perlite, talc, and vermiculite. For thermal insulation, materials such as various clays, exfoliated vermiculite, expanded perlite, mineral wool, and special brick can be used. Transportation costs will continue to determine the maximum economic distance that most forms of diatomite may be shipped and still remain competitive with alternative materials. eEstimated. E Net exporter. NA Not available. 1Processed ore sold and used by producers. 2Defined as imports – exports + adjustments for industry stock changes. 3See Appendix C for resource and reserve definitions and information concerning data sources. 4Includes sales of moler production.
U.S. Geological Survey, Mineral Commodity Summaries, January 2017
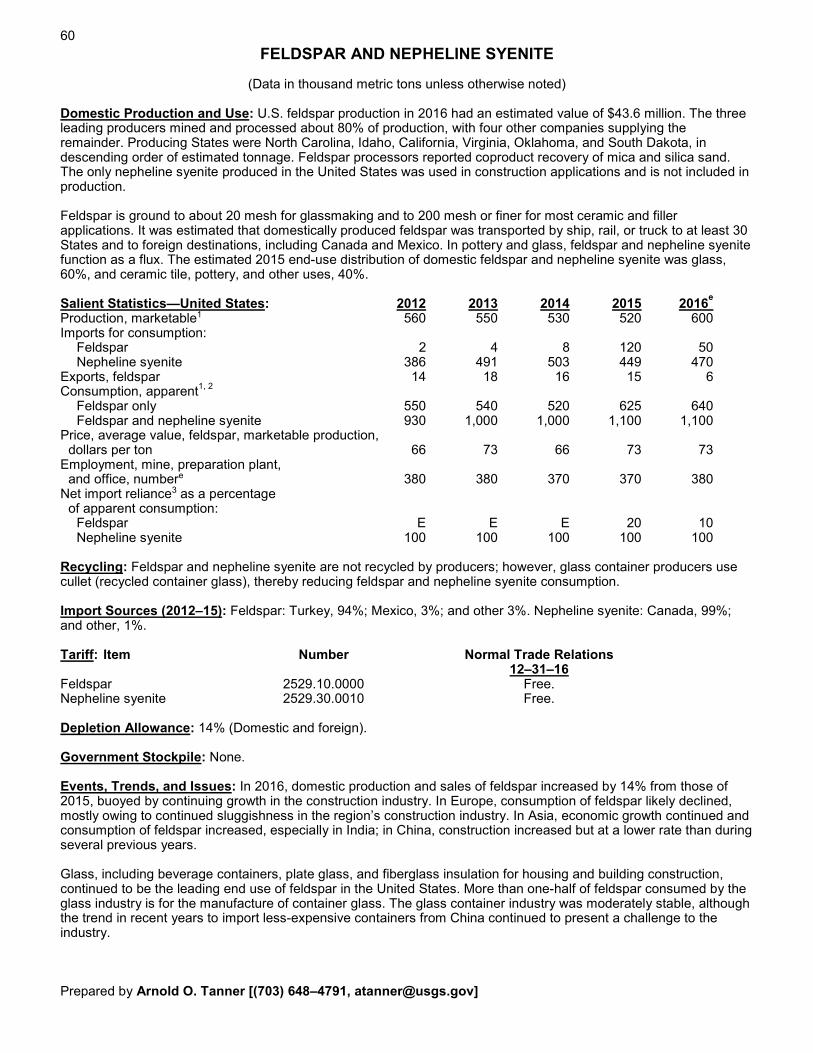
60
FELDSPAR AND NEPHELINE SYENITE
(Data in thousand metric tons unless otherwise noted) Domestic Production and Use: U.S. feldspar production in 2016 had an estimated value of $43.6 million. The three leading producers mined and processed about 80% of production, with four other companies supplying the remainder. Producing States were North Carolina, Idaho, California, Virginia, Oklahoma, and South Dakota, in descending order of estimated tonnage. Feldspar processors reported coproduct recovery of mica and silica sand. The only nepheline syenite produced in the United States was used in construction applications and is not included in production. Feldspar is ground to about 20 mesh for glassmaking and to 200 mesh or finer for most ceramic and filler applications. It was estimated that domestically produced feldspar was transported by ship, rail, or truck to at least 30 States and to foreign destinations, including Canada and Mexico. In pottery and glass, feldspar and nepheline syenite function as a flux. The estimated 2015 end-use distribution of domestic feldspar and nepheline syenite was glass, 60%, and ceramic tile, pottery, and other uses, 40%. Salient Statistics—United States: 2012 2013 2014 2015 2016e Production, marketable1 560 550 530 520 600 Imports for consumption: Feldspar 2 4 8 120 50 Nepheline syenite 386 491 503 449 470 Exports, feldspar 14 18 16 15 6 Consumption, apparent1, 2
Feldspar only 550 540 520 625 640 Feldspar and nepheline syenite 930 1,000 1,000 1,100 1,100 Price, average value, feldspar, marketable production, dollars per ton 66 73 66 73 73 Employment, mine, preparation plant, and office, numbere 380 380 370 370 380 Net import reliance3 as a percentage of apparent consumption: Feldspar E E E 20 10 Nepheline syenite 100 100 100 100 100 Recycling: Feldspar and nepheline syenite are not recycled by producers; however, glass container producers use cullet (recycled container glass), thereby reducing feldspar and nepheline syenite consumption. Import Sources (2012–15): Feldspar: Turkey, 94%; Mexico, 3%; and other 3%. Nepheline syenite: Canada, 99%; and other, 1%. Tariff: Item Number Normal Trade Relations 12–31–16 Feldspar 2529.10.0000 Free. Nepheline syenite 2529.30.0010 Free. Depletion Allowance: 14% (Domestic and foreign). Government Stockpile: None. Events, Trends, and Issues: In 2016, domestic production and sales of feldspar increased by 14% from those of 2015, buoyed by continuing growth in the construction industry. In Europe, consumption of feldspar likely declined, mostly owing to continued sluggishness in the region’s construction industry. In Asia, economic growth continued and consumption of feldspar increased, especially in India; in China, construction increased but at a lower rate than during several previous years. Glass, including beverage containers, plate glass, and fiberglass insulation for housing and building construction, continued to be the leading end use of feldspar in the United States. More than one-half of feldspar consumed by the glass industry is for the manufacture of container glass. The glass container industry was moderately stable, although the trend in recent years to import less-expensive containers from China continued to present a challenge to the industry. Prepared by Arnold O. Tanner [(703) 648–4791, [email protected]]

61 FELDSPAR AND NEPHELINE SYENITE
In the United States, residential construction, in which feldspar is a raw material commonly used in the manufacture of plate glass, ceramic tiles and sanitaryware, and insulation, increased in the first half of 2016. Housing starts and completions rose by about 13% and 14%, respectively, compared with those of the same period in 2015, and increases were expected to continue in 2017. Spending on nonresidential construction, which accounted for about 60% of construction expenditures, increased by about 4% in the first 8 months of 2016 compared with the same period in 2015. Spending on residential construction increased by more than 6% during the first 8 months of 2016 compared with the same period in 2015. Increased residential and nonresidential construction is expected to continue in 2017 leading to an increase in feldspar consumption in this sector. Domestic feldspar consumption has been gradually shifting toward glass markets from that of ceramics. A growing segment in the glass industry was solar glass, used in the production of solar panels. Imports of nepheline syenite, which may be substituted for feldspar in some glass and more commonly in ceramic tile manufacture applications, increased by about 5% in the first 8 months of 2016 compared with the same period in 2015; virtually all nepheline syenite imports came from Canada. A company based in Canada proceeded with development of its White Mountain high-purity calcium feldspar (anorthosite) deposit in southwestern Greenland. Owing to the feldspar’s purity and tests indicating an alumina recovery of greater than 90%, the company targeted the paints and coatings industry for the product’s use as a filler. Additional potential nonmetallurgical applications include refractories and ceramics, all of which require the higher purity feldspar. World Mine Production and Reserves:4 Reserves for the Czech Republic were revised based on new Government information. Mine production Reserves5 2015 2016e United States1 520 600 NA Brazil 330 330 320,000 China 2,500 2,500 NA Czech Republic 430 430 28,000 Egypt 300 300 1,000,000 India 1,500 1,500 45,000 Iran 1,200 1,300 630,000 Italy 4,700 4,700 NA Korea, Republic of 601 400 NA Malaysia 343 350 NA Poland 400 400 14,000 Russia 400 400 NA Spain 600 600 NA Thailand 1,300 1,500 NA Turkey 5,000 5,000 240,000 Venezuela 500 500 NA Other countries 2,090 2,200 NA World total (rounded) 22,700 23,000 Large World Resources: Identified and undiscovered resources of feldspar are more than adequate to meet anticipated world demand. Quantitative data on resources of feldspar existing in feldspathic sands, granites, and pegmatites generally have not been compiled. Ample geologic evidence indicates that resources are large, although not always conveniently accessible to the principal centers of consumption. Substitutes: Imported nepheline syenite was the major alternative material for feldspar. Feldspar also can be replaced in some of its end uses by clays, electric furnace slag, feldspar-silica mixtures, pyrophyllite, spodumene, or talc. eEstimated. E Net exporter. NA Not available. 1Rounded to two significant digits to avoid disclosing company proprietary data. 2Defined as production + imports – exports. 3Defined as imports – exports. 4Feldspar only. 5See Appendix C for resource and reserve definitions and information concerning data sources.
U.S. Geological Survey, Mineral Commodity Summaries, January 2017

62
FLUORSPAR
(Data in thousand metric tons unless otherwise noted) Domestic Production and Use: In 2016, minimal fluorspar (calcium fluoride, CaF2) was produced in the United States. One company sold fluorspar from stockpiles produced as a byproduct of its limestone quarrying operation in Cave-in-Rock, IL. The same company also continued development work and stockpiling of ore for future processing at the Klondike II fluorspar mine in Kentucky. Synthetic fluorspar may have been recovered as a byproduct of petroleum alkylation, stainless steel pickling, and uranium processing, but no data were collected from any of these operations. U.S. fluorspar consumption was satisfied by imports and small amounts of byproduct synthetic fluorspar. Domestically, production of hydrofluoric acid (HF) in Louisiana and Texas was by far the leading use for acid-grade fluorspar. HF is the primary feedstock for the manufacture of virtually all fluorine-bearing chemicals and is also a key ingredient in the processing of aluminum and uranium. Fluorspar was also used in cement production, in enamels, as a flux in steelmaking, in glass manufacture, in iron and steel casting, and in welding rod coatings. An estimated 64,500 tons of fluorosilicic acid (FSA), equivalent to about 105,000 tons of fluorspar grading 100%, was recovered from five phosphoric acid plants processing phosphate rock. FSA was used primarily in water fluoridation. Salient Statistics—United States: 2012 2013 2014 2015 2016e Production: Finished, all grades NA NA NA NA NA Fluorspar equivalent from phosphate rock 120 121 114 105 105 Imports for consumption: Acid grade 464 512 291 328 350 Metallurgical grade 156 130 123 48 54 Total fluorspar imports 620 643 414 376 404 Hydrofluoric acid 133 119 125 120 128 Aluminum fluoride 50 43 38 32 19 Cryolite 8 19 16 19 16 Exports 24 16 13 14 13 Consumption: Apparent1 525 548 518 411 401 Reported 416 441 W W W Price,2 acid grade, yearend, dollars per ton: Filtercake 400–450 350 290–330 260–280 260–280 Arsenic <5 parts per million 540–550 540–550 370–420 280–310 280–310 Stocks, yearend, consumer and dealer3 234 313 e195 e146 136 Employment, mine, numbere 5 6 6 5 4 Net import reliance4 as a percentage of apparent consumption 100 100 100 100 100 Recycling: Synthetic fluorspar may be produced from neutralization of waste in the enrichment of uranium, petroleum alkylation, and stainless steel pickling; however, undesirable impurities constrain usage. Primary aluminum producers recycle HF and fluorides from smelting operations. Import Sources (2012–15): Mexico, 72%; China, 9%; South Africa, 9%; Mongolia, 4%; and other, 6%. Tariff: Item Number Normal Trade Relations 12–31–16 Metallurgical grade (less than 97% CaF2) 2529.21.0000 Free. Acid grade (97% or more CaF2) 2529.22.0000 Free. Natural cryolite 2530.90.1000 Free. Hydrogen fluoride (hydrofluoric acid) 2811.11.0000 Free. Aluminum fluoride 2826.12.0000 Free. Synthetic cryolite 2826.30.0000 Free. Depletion Allowance: 22% (Domestic), 14% (Foreign). Prepared by Michele E. McRae [(703) 648–7743, [email protected]]

63 FLUORSPAR
Government Stockpile: None. Events, Trends, and Issues: The Frank R. Lautenberg Chemical Safety for the 21st Century Act was signed into law in June. The law amends The Toxic Substances Control Act of 1976 and all new and existing chemicals will be subject to a safety review by the Environmental Protection Agency, which will further prioritize potentially harmful chemicals for full, risk-based assessment. Prolonged adverse market conditions have affected numerous mining projects. In the past several years, mines in Bulgaria, Kenya, Namibia, Russia, and South Africa have been put on care-and-maintenance status or permanently closed. However, one project in Canada began mine construction in 2016 with mining anticipated to begin in 2017. Another company announced its intention to construct a new manufacturing facility to produce hydrofluoroolefin HFO-1234yf in Texas. The facility, expected to begin production in late 2018, will triple production capacity of this chemical, which has a low global-warming potential and is used as a refrigerant in automotive air-conditioning and other applications. World Mine Production and Reserves: Production estimates for individual countries were made using country or company-specific data whenever available; other estimates were made based on general knowledge of end-use markets. Reserves data for China were revised based on data from the National Bureau of Statistics China. Mine production Reserves5, 6
2015 2016e United States NA NA 4,000 China 4,400 4,200 40,000 Germany 40 60 NA Iran 80 80 3,400 Kazakhstan 110 110 NA Kenya 63 20 5,000 Mexico 1,030 1,000 32,000 Mongolia 231 230 22,000 Morocco 79 75 580 South Africa 135 180 41,000 Spain 98 95 6,000 Thailand 50 50 NA United Kingdom 81 40 NA Vietnam 168 170 NA Other countries 109 89 110,000 World total (rounded) 6,670 6,400 260,000 World Resources: Identified world fluorspar resources were approximately 500 million tons of contained fluorspar. Additionally, enormous quantities of fluorine are present in phosphate rock. Current U.S. reserves of phosphate rock are estimated to be 1.1 billion tons, containing about 79 million tons of 100% fluorspar equivalent. World reserves of phosphate rock are estimated to be 68 billion tons, equivalent to about 4.9 billion tons of 100% fluorspar equivalent. Substitutes: FSA is used to produce aluminum fluoride (AlF3), but because of differing physical properties, AlF3 produced from FSA is not readily substituted for AlF3 produced from fluorspar. FSA has been used to produce HF, but this practice has not been widely adopted. Aluminum smelting dross, borax, calcium chloride, iron oxides, manganese ore, silica sand, and titanium dioxide have been used as substitutes for fluorspar fluxes. eEstimated. NA Not available. W Withheld to avoid disclosing company proprietary data. 1Excludes fluorspar production withheld to avoid disclosing company proprietary data and fluorspar equivalent of fluorosilicic acid, HF, and cryolite. 2Free on board, Tampico, Mexico. Source: Industrial Minerals. 3Industry stocks for leading consumers and fluorspar distributors. 4Defined as imports – exports + adjustments for industry stock changes. 5See Appendix C for resource and reserve definitions and information concerning data sources. 6Measured as 100% calcium fluoride.
U.S. Geological Survey, Mineral Commodity Summaries, January 2017
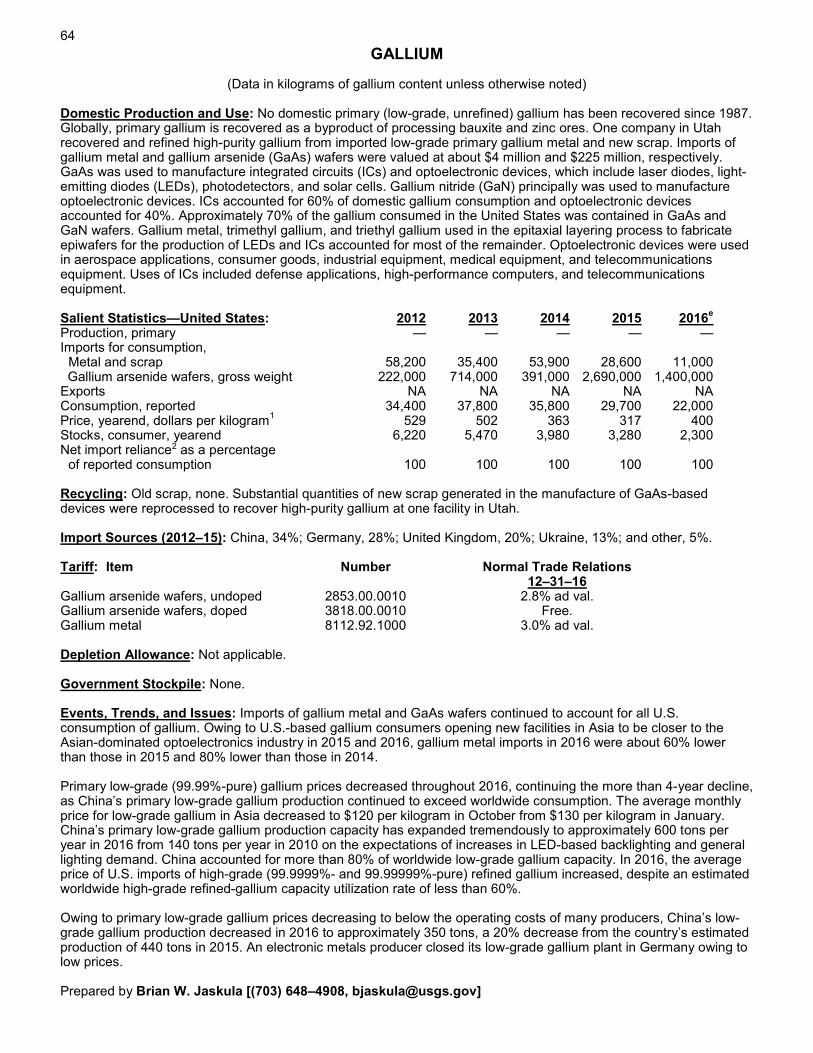
64
GALLIUM
(Data in kilograms of gallium content unless otherwise noted) Domestic Production and Use: No domestic primary (low-grade, unrefined) gallium has been recovered since 1987. Globally, primary gallium is recovered as a byproduct of processing bauxite and zinc ores. One company in Utah recovered and refined high-purity gallium from imported low-grade primary gallium metal and new scrap. Imports of gallium metal and gallium arsenide (GaAs) wafers were valued at about $4 million and $225 million, respectively. GaAs was used to manufacture integrated circuits (ICs) and optoelectronic devices, which include laser diodes, light-emitting diodes (LEDs), photodetectors, and solar cells. Gallium nitride (GaN) principally was used to manufacture optoelectronic devices. ICs accounted for 60% of domestic gallium consumption and optoelectronic devices accounted for 40%. Approximately 70% of the gallium consumed in the United States was contained in GaAs and GaN wafers. Gallium metal, trimethyl gallium, and triethyl gallium used in the epitaxial layering process to fabricate epiwafers for the production of LEDs and ICs accounted for most of the remainder. Optoelectronic devices were used in aerospace applications, consumer goods, industrial equipment, medical equipment, and telecommunications equipment. Uses of ICs included defense applications, high-performance computers, and telecommunications equipment. Salient Statistics—United States: 2012 2013 2014 2015 2016e Production, primary — — — — — Imports for consumption, Metal and scrap 58,200 35,400 53,900 28,600 11,000 Gallium arsenide wafers, gross weight 222,000 714,000 391,000 2,690,000 1,400,000 Exports NA NA NA NA NA Consumption, reported 34,400 37,800 35,800 29,700 22,000 Price, yearend, dollars per kilogram1 529 502 363 317 400 Stocks, consumer, yearend 6,220 5,470 3,980 3,280 2,300 Net import reliance2 as a percentage of reported consumption 100 100 100 100 100 Recycling: Old scrap, none. Substantial quantities of new scrap generated in the manufacture of GaAs-based devices were reprocessed to recover high-purity gallium at one facility in Utah. Import Sources (2012–15): China, 34%; Germany, 28%; United Kingdom, 20%; Ukraine, 13%; and other, 5%. Tariff: Item Number Normal Trade Relations 12–31–16 Gallium arsenide wafers, undoped 2853.00.0010 2.8% ad val. Gallium arsenide wafers, doped 3818.00.0010 Free. Gallium metal 8112.92.1000 3.0% ad val. Depletion Allowance: Not applicable. Government Stockpile: None. Events, Trends, and Issues: Imports of gallium metal and GaAs wafers continued to account for all U.S. consumption of gallium. Owing to U.S.-based gallium consumers opening new facilities in Asia to be closer to the Asian-dominated optoelectronics industry in 2015 and 2016, gallium metal imports in 2016 were about 60% lower than those in 2015 and 80% lower than those in 2014. Primary low-grade (99.99%-pure) gallium prices decreased throughout 2016, continuing the more than 4-year decline, as China’s primary low-grade gallium production continued to exceed worldwide consumption. The average monthly price for low-grade gallium in Asia decreased to $120 per kilogram in October from $130 per kilogram in January. China’s primary low-grade gallium production capacity has expanded tremendously to approximately 600 tons per year in 2016 from 140 tons per year in 2010 on the expectations of increases in LED-based backlighting and general lighting demand. China accounted for more than 80% of worldwide low-grade gallium capacity. In 2016, the average price of U.S. imports of high-grade (99.9999%- and 99.99999%-pure) refined gallium increased, despite an estimated worldwide high-grade refined-gallium capacity utilization rate of less than 60%. Owing to primary low-grade gallium prices decreasing to below the operating costs of many producers, China’s low-grade gallium production decreased in 2016 to approximately 350 tons, a 20% decrease from the country’s estimated production of 440 tons in 2015. An electronic metals producer closed its low-grade gallium plant in Germany owing to low prices. Prepared by Brian W. Jaskula [(703) 648–4908, [email protected]]

65 GALLIUM
The value of worldwide GaAs device consumption increased by about 7% to $7.5 billion in 2015 owing to a growing wireless telecommunications infrastructure in Asia; growth of feature-rich, application-intensive, third- and fourth-generation (3G, 4G) “smartphones,” which employ up to 10 times the amount of GaAs as standard cellular handsets; and robust use in military radar and communications applications. Cellular applications accounted for approximately 53% of total GaAs device revenue and wireless communications accounted for 27%. Various automotive, consumer, fiber-optic, and military applications accounted for the remaining revenue. Owing to their large power-handling capabilities, high-switching frequencies, and higher voltage capabilities, GaN-based products, which historically have been used in defense applications, have begun to be used in cable television transmission, commercial wireless infrastructure, power electronics, and satellite markets. By yearend 2016, the GaN radio frequency device market was expected to reach $340 million, a 13% increase from that of 2015, and was forecast to increase at an average annual rate of 17% to reach $630 million in 2020. General lighting was the leading sector among LED applications and was expected to be the major share of the LED market for the rest of the decade. The other main LED sectors include backlighting and automotive lighting, in decreasing order of sales. During 2015, significant expansion of LED manufacturing capacity in Asia took place, much of it owing to China’s Government-instituted incentives to increase LED production. Owing to increased LED production and lower than expected consumption from the general lighting and backlighting sectors in 2015, LED prices decreased by up to 40%, causing many LED manufacturers to exit the market. The LED market was valued at $14.3 billion in 2015, a decrease of 8% from $15.6 billion in 2014. Owing to overproduction, only 22% of the LED chips produced in 2015 were consumed. Prices were expected to stabilize by yearend 2016 owing to limited room for further price cuts given the high cost of materials. World Production and Reserves:3 In 2016, world low-grade primary gallium production was estimated to be 375 tons—a decrease of 20% from 470 tons in 2015. Low-grade primary gallium producers outside of China most likely restricted output owing to a large surplus of primary gallium. China, Germany, Japan, and Ukraine were the leading producers; countries with lesser output were Hungary, the Republic of Korea, and Russia. Kazakhstan, which was a leading producer in 2012, has not reported any production since then. Primary refined high-purity gallium production in 2016 was estimated to be about 180 tons. China, Japan, the United Kingdom, and the United States were the known principal producers of high-purity refined gallium. Gallium was recovered from new scrap in Canada, China, Germany, Japan, the United Kingdom, and the United States. World primary low-grade gallium production capacity in 2016 was estimated to be 730 tons per year; high-purity refinery capacity, 320 tons per year; and secondary capacity, 270 tons per year. Gallium occurs in very small concentrations in ores of other metals. Most gallium is produced as a byproduct of processing bauxite, and the remainder is produced from zinc-processing residues. Only a portion of the gallium present in bauxite and zinc ores is recoverable, and the factors controlling the recovery are proprietary. Therefore, an estimate of reserves is not possible. World Resources: The average gallium content of bauxite is 50 parts per million (ppm). U.S. bauxite deposits consist mainly of subeconomic resources that are not generally suitable for alumina production owing to their high silica content. Recovery of gallium from these deposits is therefore unlikely. Some domestic zinc ores contain up to 50 ppm gallium and could be a significant resource, although no gallium is currently recovered from domestic ores. Gallium contained in world resources of bauxite is estimated to exceed 1 million tons, and a considerable quantity could be contained in world zinc resources. However, only a small percentage of the gallium in bauxite and zinc resources is potentially recoverable. Substitutes: Liquid crystals made from organic compounds are used in visual displays as substitutes for LEDs. Silicon-based complementary metal-oxide semiconductor power amplifiers compete with GaAs power amplifiers in midtier 3G cellular handsets. Indium phosphide components can be substituted for GaAs-based infrared laser diodes in some specific-wavelength applications, and helium-neon lasers compete with GaAs in visible laser diode applications. Silicon is the principal competitor with GaAs in solar-cell applications. GaAs-based ICs are used in many defense-related applications because of their unique properties, and no effective substitutes exist for GaAs in these applications. GaAs in heterojunction bipolar transistors is being replaced in some applications by silicon-germanium. eEstimated. NA Not available. — Zero. 1Estimated based on the average values of U.S. imports for 99.9999%- and 99.99999%-pure gallium. 2The United States has not produced gallium since 1987 and recovers no gallium from old scrap. All domestic consumption is assumed to originate from imported gallium. 3See Appendix C for resource and reserve definitions and information concerning data sources.
U.S. Geological Survey, Mineral Commodity Summaries, January 2017
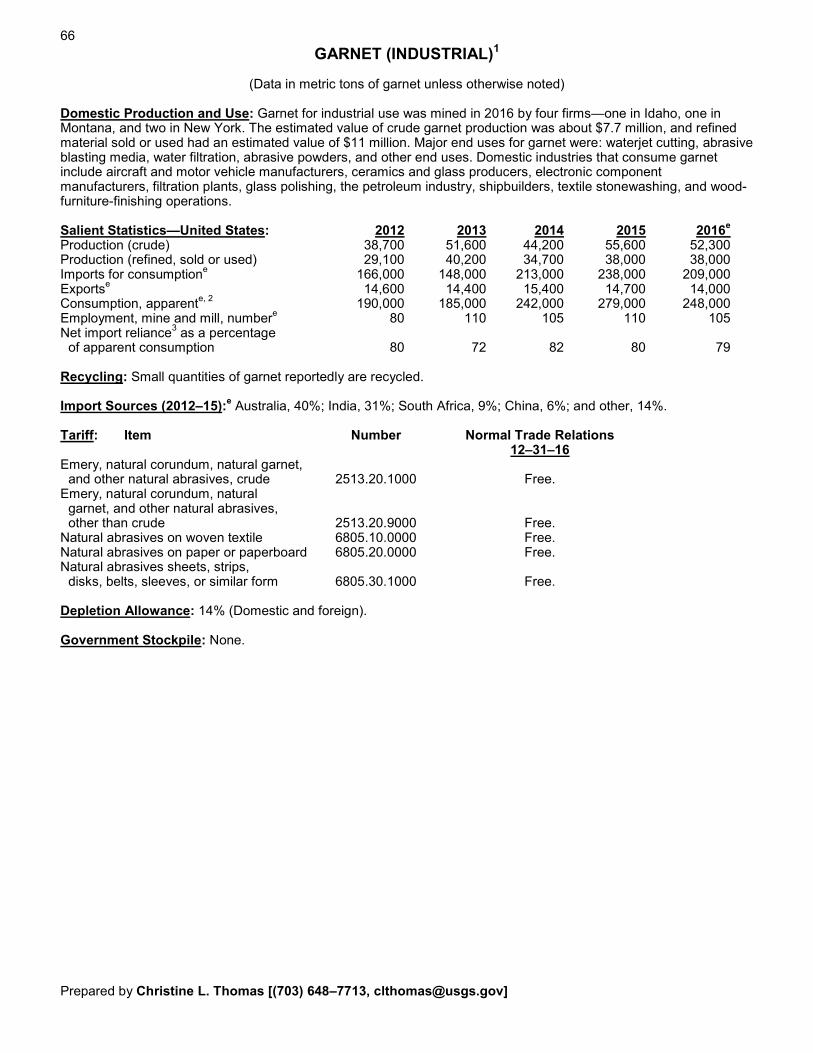
66
GARNET (INDUSTRIAL)1
(Data in metric tons of garnet unless otherwise noted) Domestic Production and Use: Garnet for industrial use was mined in 2016 by four firms—one in Idaho, one in Montana, and two in New York. The estimated value of crude garnet production was about $7.7 million, and refined material sold or used had an estimated value of $11 million. Major end uses for garnet were: waterjet cutting, abrasive blasting media, water filtration, abrasive powders, and other end uses. Domestic industries that consume garnet include aircraft and motor vehicle manufacturers, ceramics and glass producers, electronic component manufacturers, filtration plants, glass polishing, the petroleum industry, shipbuilders, textile stonewashing, and wood-furniture-finishing operations. Salient Statistics—United States: 2012 2013 2014 2015 2016e Production (crude) 38,700 51,600 44,200 55,600 52,300 Production (refined, sold or used) 29,100 40,200 34,700 38,000 38,000 Imports for consumptione 166,000 148,000 213,000 238,000 209,000 Exportse 14,600 14,400 15,400 14,700 14,000 Consumption, apparente, 2 190,000 185,000 242,000 279,000 248,000 Employment, mine and mill, numbere 80 110 105 110 105 Net import reliance3 as a percentage of apparent consumption 80 72 82 80 79 Recycling: Small quantities of garnet reportedly are recycled. Import Sources (2012–15):e Australia, 40%; India, 31%; South Africa, 9%; China, 6%; and other, 14%. Tariff: Item Number Normal Trade Relations 12–31–16 Emery, natural corundum, natural garnet, and other natural abrasives, crude 2513.20.1000 Free. Emery, natural corundum, natural garnet, and other natural abrasives, other than crude 2513.20.9000 Free. Natural abrasives on woven textile 6805.10.0000 Free. Natural abrasives on paper or paperboard 6805.20.0000 Free. Natural abrasives sheets, strips, disks, belts, sleeves, or similar form 6805.30.1000 Free. Depletion Allowance: 14% (Domestic and foreign). Government Stockpile: None. Prepared by Christine L. Thomas [(703) 648–7713, [email protected]]

67 GARNET (INDUSTRIAL)
Events, Trends, and Issues: During 2016, estimated domestic production of crude garnet concentrates decreased by 6% compared with production of 2015. U.S. garnet production was 3% of total global garnet production. Estimated 2016 U.S. garnet consumption decreased by 11% compared with that of 2015. The United States consumed about 15% of global garnet production. In 2016, imports were estimated to have decreased by 12% compared with those of 2015, and exports were estimated to have decreased slightly from those of 2015. The 2016 estimated domestic sales or use of refined garnet remained stable compared with sales in 2015. In 2016, the United States remained a net importer. Garnet imports have supplemented U.S. production in the domestic market; Australia, India, South Africa, and China, in decreasing order of tonnage, were major garnet suppliers. Garnet prices during 2016 varied over a wide range per ton, depending on the amount of processing and refining, degree of fracturing, garnet mineral type, quality, and quantity purchased. Most crude garnet concentrate was priced from $100 to $225 per ton, and most refined material was $100 to $400 per ton. The average value of garnet imports was $204 per ton, which was a slight decrease compared to the average value in 2015. The garnet market is very competitive. To increase profitability and remain competitive with foreign imported material, production may be restricted to only high-grade garnet ores or other salable mineral products that occur with garnet, such as kyanite, marble, metallic ores, mica minerals, sillimanite, staurolite, or wollastonite. World Mine Production and Reserves: Mine production Reserves4 2015 2016e United States 55,600 52,300 5,000,000 Australia 260,000 260,000 Moderate to Large China 520,000 520,000 Moderate to Large India 800,000 800,000 19,000,000 Other countries 50,000 50,000 6,500,000 World total (rounded) 1,690,000 1,700,000 Moderate to Large World Resources: World resources of garnet are large and occur in a wide variety of rocks, particularly gneisses and schists. Garnet also occurs in contact-metamorphic deposits in crystalline limestones, pegmatites, serpentinites, and vein deposits. In addition, alluvial garnet is present in many heavy-mineral sand and gravel deposits throughout the world. Large domestic resources of garnet also are concentrated in coarsely crystalline gneiss near North Creek, NY; other significant domestic resources of garnet occur in Idaho, Maine, Montana, New Hampshire, North Carolina, and Oregon. In addition to those in the United States, major garnet deposits exist in Australia, Canada, China, and India, where they are mined for foreign and domestic markets; deposits in Russia and Turkey also have been mined in recent years, primarily for internal markets. Additional garnet resources are in Chile, the Czech Republic, Pakistan, South Africa, Spain, Thailand, and Ukraine; small mining operations have been reported in most of these countries. Substitutes: Other natural and manufactured abrasives can substitute to some extent for all major end uses of garnet. In many cases, however, using the substitutes would entail sacrifices in quality or cost. Fused aluminum oxide and staurolite compete with garnet as a sandblasting material. Ilmenite, magnetite, and plastics compete as filtration media. Corundum, diamond, and fused aluminum oxide compete for lens grinding and for many lapping operations. Emery is a substitute in nonskid surfaces. Fused aluminum oxide, quartz sand, and silicon carbide compete for the finishing of plastics, wood furniture, and other products. eEstimated. 1Excludes gem and synthetic garnet. 2Defined as crude production + imports – exports. 3Defined as imports – exports. 4See Appendix C for resource and reserve definitions and information concerning data sources.
U.S. Geological Survey, Mineral Commodity Summaries, January 2017

68
GEMSTONES1
(Data in million dollars unless otherwise noted) Domestic Production and Use: The combined value of U.S. natural and synthetic gemstone output in 2016 was an estimated $65.9 billion, a 4% increase compared with that of 2015. Domestic gemstone production included agate, beryl, coral, diamond, garnet, jade, jasper, opal, pearl, quartz, sapphire, shell, topaz, tourmaline, turquoise, and many other gem materials. In decreasing order of production value, Idaho, Arizona, Oregon, California, Montana, Arkansas, Maine, Colorado, North Carolina, Nevada, Texas, and Utah produced 90% of U.S. natural gemstones. Synthetic gemstones were manufactured by six firms in North Carolina, New York, Michigan, South Carolina, California, and Arizona, in decreasing order of production value. Major gemstone uses were carvings, gem and mineral collections, and jewelry. The apparent consumption in the table below is much lower than the actual consumption because the value of exports includes the value of reexports. Salient Statistics—United States: 2012 2013 2014 2015 2016e Production:2 Natural3 11.3 9.6 9.5 8.5 8.5 Laboratory-created (synthetic) 31.2 56.9 51.0 55.1 57.3 Imports for consumption 21,500 24,700 26,400 25,100 25,600 Exports, including reexports4 16,900 19,400 21,300 18,500 19,500 Consumption, apparent 4,640 5,400 5,160 6,660 6,170 Price Variable, depending on size, type, and quality Employment, mine, numbere 1,100 1,100 1,100 1,100 1,100 Net import reliance5 as a percentage of apparent consumption 99 99 99 99 99 Recycling: Gemstones are often recycled by being resold as estate jewelry, reset, or recut, but this report does not account for those stones. Import Sources (2012–15 by value): Israel, 37%; India, 29%; Belgium, 19%; South Africa, 4%; and other, 11%. Diamond imports accounted for 92% of the total value of gem imports. Tariff: Item Number Normal Trade Relations 12–31–16 Coral and similar materials, unworked 0508.00.0000 Free. Imitation gemstones 3926.90.4000 2.8% ad val. Pearls, imitation, not strung 7018.10.1000 4.0% ad val. Pearls, Imitation, glass beads 7018.10.2000 Free. Pearls, natural, graded, temporarily strung 7101.10.3000 Free. Pearls, natural, not elsewhere specified or included 7101.10.6000 Free. Pearls, cultured 7101.21.0000 Free. Diamond, unworked or sawn 7102.31.0000 Free. Diamond, ½ carat or less 7102.39.0010 Free. Diamond, cut, more than ½ carat 7102.39.0050 Free. Jadeite, unworked 7103.10.2020 Free. Other gemstones, unworked 7103.10.2080 Free. Other gemstones, other 7103.10.4080 10.5% ad val. Rubies, cut 7103.91.0010 Free. Sapphires, cut 7103.91.0020 Free. Emeralds, cut 7103.91.0030 Free. Jadeite, cut but not set 7103.99.1020 Free. Other gemstones, cut but not set 7103.99.1080 Free. Jadeite, otherwise worked 7103.99.5020 10.5% ad val. Other gemstones, otherwise worked 7103.99.5080 10.5% ad val. Synthetic gemstones, cut but not set 7104.90.1000 Free. Synthetic gemstones, other 7104.90.5000 6.4% ad val. Depletion Allowance: 14% (Domestic and foreign). Government Stockpile: None. Prepared by Donald W. Olson [(703) 648–7721, [email protected]]

69 GEMSTONES
Events, Trends, and Issues: In 2016, the U.S. market for gem-quality diamonds was estimated to be about $23.5 billion, which was a slight increase compared with $23.2 billion in 2015. The domestic market for natural, nondiamond gemstones was estimated to be about $2.18 billion, which was an 11% increase compared with $1.97 billion in 2015. The United States accounted for more than 35% of the world’s diamond consumption and is expected to continue to dominate global gemstone demand. Increases in U.S. synthetic gemstone production are the result of the addition of a new synthetic diamond manufacturing firm and the reopening of a synthetic gemstone manufacturing firm in California. A South Carolina synthetic diamond manufacturing firm added new manufacturing equipment that greatly increased its capacity. The synthetic diamond manufacturing firm that was in Florida moved its production facilities offshore to Singapore and its offices to New Jersey. During 2016, several new diamond mines opened globally. Among them were two in Canada, the Gahcho Kué Mine in the Northwest Territories, which is expected to be one of the world’s largest diamond mines, and the Renard Mine in Quebec. Four new mines opened in Lesotho—the Liqhobong, Mothae, Kolo, and Lemphane Mines. World Gem Diamond Mine Production and Reserves: Mine production6 Reserves7 2015 2016e United States (8) (8) World reserves of diamond-bearing Angola 8,110 8,100 deposits are substantial. No reserve Australia 271 270 data are available for other gemstones. Botswana 14,500 15,000 Brazil 32 32 Canada 11,700 13,000 Congo (Brazzaville) 40 40 Congo (Kinshasa) 3,200 2,800 Ghana 174 170 Guinea 134 134 Guyana 118 118 Lesotho 304 304 Namibia 2,050 2,050 Russia 23,500 23,500 Sierra Leone 400 400 South Africa 5,770 2,800 Tanzania 163 163 Zimbabwe 349 350 Other countries 75 540 World total (rounded) 70,900 70,000 World Resources: Most diamond-bearing ore bodies have a diamond content that ranges from less than 1 carat per ton to about 6 carats per ton of ore. The major gem diamond reserves are in southern Africa, Australia, Canada, and Russia. Substitutes: Plastics, glass, and other materials are substituted for natural gemstones. Synthetic gemstones (manufactured materials that have the same chemical and physical properties as gemstones) are common substitutes. Simulants (materials that appear to be gems, but differ in chemical and physical characteristics) also are frequently substituted for natural gemstones. eEstimated. 1Excludes industrial diamond and garnet. See Diamond (Industrial) and Garnet (Industrial). 2Estimated minimum production. 3Includes production of freshwater shell. 4Reexports account for between 67% and 92% of the totals. 5Defined as imports – exports and reexports. 6Data in thousands of carats of gem diamond. 7See Appendix C for resource and reserve definitions and information concerning data sources. 8Less than ½ unit.
U.S. Geological Survey, Mineral Commodity Summaries, January 2017

70
GERMANIUM
(Data in kilograms of germanium content unless otherwise noted) Domestic Production and Use: In 2016, primary zinc concentrates containing germanium were produced at mines in Alaska and Washington and exported to Canada for processing and germanium recovery. A zinc smelter in Clarksville, TN, produced and exported germanium leach concentrates recovered from processing zinc concentrates from its mines in Tennessee, but the mines were closed temporarily during 2016 and were expected to be restarted in mid-2017. Germanium in the form of compounds and metal were imported into the United States for further processing by industry. A company in Utah produced germanium wafers for solar cells used in satellites from imported and recycled germanium. A refinery in Oklahoma recovered germanium from industry-generated scrap and produced germanium tetrachloride for the production of fiber optics. The domestic end-use distribution for germanium was estimated to be: fiber optics, 40%; infrared optics, 30%; electronics and solar applications, 20%; and other uses, 10%. The estimated value of germanium metal consumed in 2016, based on the annual average producer price, was about $33 million, 45% less than that in 2015. Salient Statistics—United States: 2012 2013 2014 2015 2016e Production, refinery W W W W W Total imports1 48,500 45,700 36,200 34,400 30,000 Total exports1 15,300 12,500 12,000 5,000 5,500 Shipments from Government stockpile excesses — — 23,000 — — Consumption, estimated 38,000 38,000 32,000 34,000 30,000 Price, producer, yearend, dollars per kilogram: Zone refined 1,640 1,900 1,900 1,250 950 Dioxide, electronic grade 1,360 1,230 1,300 1,000 625 Stocks, producer, yearend NA NA NA NA NA Net import reliance3 as a percentage of estimated consumption 85 85 84 85 85 Recycling: Worldwide, about 30% of the total germanium consumed is produced from recycled materials. During the manufacture of most optical devices, more than 60% of the germanium metal used is routinely recycled as new scrap. Germanium scrap is also recovered from the windows in decommissioned tanks and other military vehicles. Import Sources (2012–15):4 China, 62%; Belgium, 22%; Russia, 7%; Canada, 5%; and other, 4%. Tariff: Item Number Normal Trade Relations 12–31–16 Germanium oxides and zirconium dioxide 2825.60.0000 3.7% ad val. Metal, unwrought 8112.92.6000 2.6% ad val. Metal, powder 8112.92.6500 4.4% ad val. Metal, wrought 8112.99.1000 4.4% ad val. Depletion Allowance: 14% (Domestic and foreign). Government Stockpile: The Defense Logistics Agency (DLA) Strategic Materials did not allocate any germanium for sale in the fiscal year 2017 Annual Materials Plan, and it was possible that the DLA could acquire up to 1,000 kilograms of germanium metal. In fiscal year 2015, the DLA started a program to recover germanium scrap from end-of-life U.S. Army components and had recovered 834 kilograms of germanium scrap by the end of October 2016. As of October 2016, 101,899 germanium epitaxial wafers (upgraded from germanium metal from the stockpile in 2014) were held for the stockpile at private warehouses.
Stockpile Status—9–30–165 Disposal Plan Disposals Material Inventory FY 2016 FY 2016 Germanium 13,364 — — Prepared by David E. Guberman [Contact Christine L. Thomas, (703) 648–7713, [email protected]]
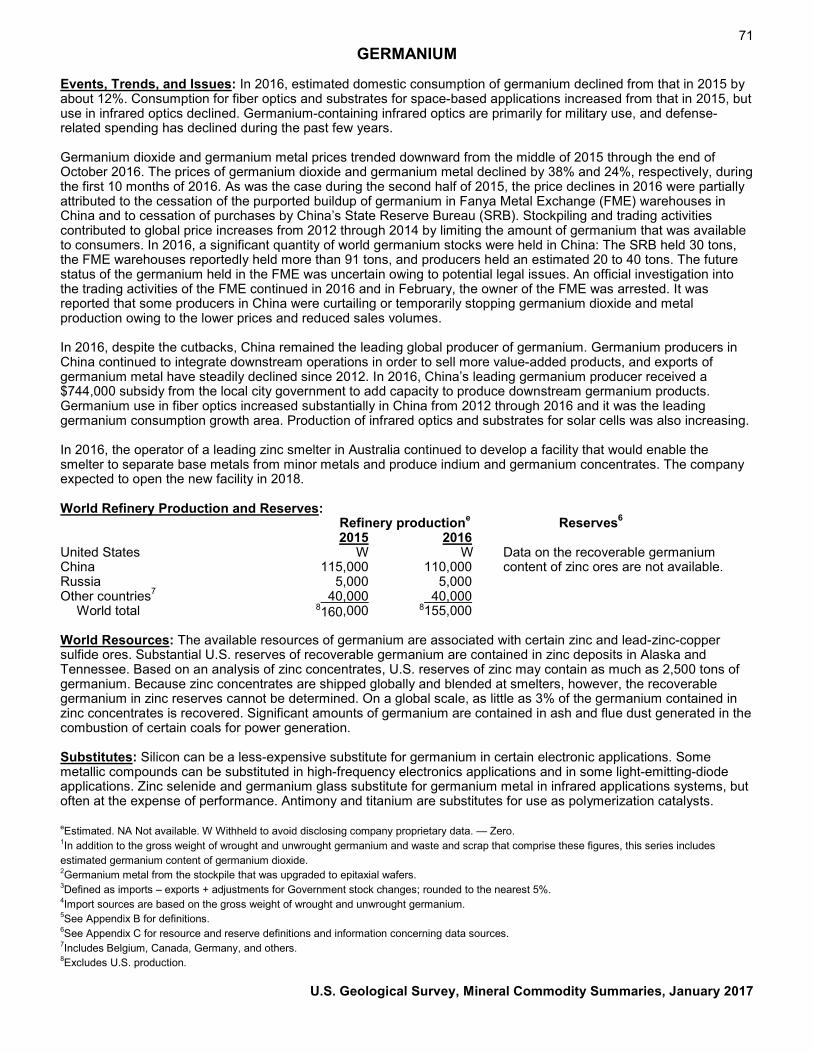
71 GERMANIUM
Events, Trends, and Issues: In 2016, estimated domestic consumption of germanium declined from that in 2015 by about 12%. Consumption for fiber optics and substrates for space-based applications increased from that in 2015, but use in infrared optics declined. Germanium-containing infrared optics are primarily for military use, and defense-related spending has declined during the past few years. Germanium dioxide and germanium metal prices trended downward from the middle of 2015 through the end of October 2016. The prices of germanium dioxide and germanium metal declined by 38% and 24%, respectively, during the first 10 months of 2016. As was the case during the second half of 2015, the price declines in 2016 were partially attributed to the cessation of the purported buildup of germanium in Fanya Metal Exchange (FME) warehouses in China and to cessation of purchases by China’s State Reserve Bureau (SRB). Stockpiling and trading activities contributed to global price increases from 2012 through 2014 by limiting the amount of germanium that was available to consumers. In 2016, a significant quantity of world germanium stocks were held in China: The SRB held 30 tons, the FME warehouses reportedly held more than 91 tons, and producers held an estimated 20 to 40 tons. The future status of the germanium held in the FME was uncertain owing to potential legal issues. An official investigation into the trading activities of the FME continued in 2016 and in February, the owner of the FME was arrested. It was reported that some producers in China were curtailing or temporarily stopping germanium dioxide and metal production owing to the lower prices and reduced sales volumes. In 2016, despite the cutbacks, China remained the leading global producer of germanium. Germanium producers in China continued to integrate downstream operations in order to sell more value-added products, and exports of germanium metal have steadily declined since 2012. In 2016, China’s leading germanium producer received a $744,000 subsidy from the local city government to add capacity to produce downstream germanium products. Germanium use in fiber optics increased substantially in China from 2012 through 2016 and it was the leading germanium consumption growth area. Production of infrared optics and substrates for solar cells was also increasing. In 2016, the operator of a leading zinc smelter in Australia continued to develop a facility that would enable the smelter to separate base metals from minor metals and produce indium and germanium concentrates. The company expected to open the new facility in 2018. World Refinery Production and Reserves: Refinery productione Reserves6 2015 2016 United States W W Data on the recoverable germanium China 115,000 110,000 content of zinc ores are not available. Russia 5,000 5,000 Other countries7 40,000 40,000 World total 8160,000 8155,000 World Resources: The available resources of germanium are associated with certain zinc and lead-zinc-copper sulfide ores. Substantial U.S. reserves of recoverable germanium are contained in zinc deposits in Alaska and Tennessee. Based on an analysis of zinc concentrates, U.S. reserves of zinc may contain as much as 2,500 tons of germanium. Because zinc concentrates are shipped globally and blended at smelters, however, the recoverable germanium in zinc reserves cannot be determined. On a global scale, as little as 3% of the germanium contained in zinc concentrates is recovered. Significant amounts of germanium are contained in ash and flue dust generated in the combustion of certain coals for power generation. Substitutes: Silicon can be a less-expensive substitute for germanium in certain electronic applications. Some metallic compounds can be substituted in high-frequency electronics applications and in some light-emitting-diode applications. Zinc selenide and germanium glass substitute for germanium metal in infrared applications systems, but often at the expense of performance. Antimony and titanium are substitutes for use as polymerization catalysts.
eEstimated. NA Not available. W Withheld to avoid disclosing company proprietary data. — Zero. 1In addition to the gross weight of wrought and unwrought germanium and waste and scrap that comprise these figures, this series includes estimated germanium content of germanium dioxide. 2Germanium metal from the stockpile that was upgraded to epitaxial wafers. 3Defined as imports – exports + adjustments for Government stock changes; rounded to the nearest 5%. 4Import sources are based on the gross weight of wrought and unwrought germanium. 5See Appendix B for definitions. 6See Appendix C for resource and reserve definitions and information concerning data sources. 7Includes Belgium, Canada, Germany, and others. 8Excludes U.S. production.
U.S. Geological Survey, Mineral Commodity Summaries, January 2017

72
GOLD
(Data in metric tons1 of gold content unless otherwise noted) Domestic Production and Use: In 2016, domestic gold mine production was estimated to be about 209 tons, slightly less than that in 2015, and the value was estimated to be about $8.5 billion. Gold was produced at more than 40 lode mines, at several large placer mines in Alaska, and numerous smaller placer mines (mostly in Alaska and in the Western States). About 6% of domestic gold was recovered as a byproduct of processing domestic base-metal ores, chiefly copper. The top 26 operations yielded more than 99% of the mined gold produced in the United States. Commercial-grade gold was produced at about 15 refineries. A few dozen companies, out of several thousand companies and artisans, dominated the fabrication of gold into commercial products. U.S. jewelry manufacturing was heavily concentrated in the New York, NY, and Providence, RI, areas, with lesser concentrations in California, Florida, and Texas. Estimated domestic uses were jewelry; 40%; electrical and electronics, 35%; official coins, 20%; and other, 5%. Salient Statistics—United States: 2012 2013 2014 2015 2016e Production: Mine 235 230 210 214 209 Refinery: Primary 218 223 253 248 240 Secondary (new and old scrap) 215 210 135 124 130 Imports for consumption2 326 315 308 265 400 Exports2 699 693 511 494 350 Consumption, reported 147 160 152 164 165 Stocks, yearend, Treasury3 8,140 8,140 8,140 8,140 8,140 Price, dollars per troy ounce4 1,673 1,415 1,269 1,163 1,270 Employment, mine and mill, number5 12,700 12,500 12,000 11,900 12,000 Net import reliance6 as a percentage of apparent consumption (7) (7) (7) (7) (7) Recycling: In 2016, an estimated 130 tons of new and old scrap was recycled, almost 80% of reported industrial consumption. Following the increase in the price of gold, the domestic supply of gold from recycling increased by 5% compared to 2015 scrap production but was one-half of the alltime high level in 2011. Import Sources (2012–15):2 Mexico, 28%; Canada, 22%; Colombia, 14%; Peru, 10%; and other, 26%. Tariff: Most imports of unwrought gold, including bullion and dore, enter the United States duty free. Depletion Allowance: 15% (Domestic), 14% (Foreign). Government Stockpile: The U.S. Department of the Treasury maintains stocks of gold (see salient statistics above), and the U.S. Department of Defense administers a Governmentwide secondary precious-metals recovery program. Events, Trends, and Issues: The estimated gold price in 2016 was 9% more than the price in 2015 and was 24% lower than the record-high annual price in 2012. The Engelhard daily price of gold in 2016 fluctuated through several cycles. The gold price began the year at the lowest level of the year and trended upward through July, with significant increases in the average monthly prices in January through March. Following the United Kingdom’s referendum vote to leave the European Union, the price increased to the year-to-date high (and projected annual high) of $1,372.98 per troy ounce on July 6. In October, the price dropped significantly, with an investor selloff coinciding with improved economic data in the United States. The slight decrease in domestic mine production was attributed to lower production from mines that changed ownership and closure of some smaller scale mines in Nevada. Gold production from the Cortez Mine in Nevada, the second leading U.S. producer, increased in 2016 owing to increased ore throughput. In 2016, worldwide gold production was unchanged from that in 2015, because increased production in Canada was offset by a decrease in production in Mexico. Prepared by Micheal W. George [(703) 648–4962, [email protected]]

73 GOLD
In 2016, domestic consumption of gold used in the production of coins and bars increased slightly owing to increased investor interest reportedly tied to uncertainty over the U.S. Presidential election. In addition to the U.S. election, political uncertainties in Europe, including the United Kingdom’s referendum on leaving the European Union, reportedly spurred a slight increase in global investment consumption of gold. Consumption from industrial and jewelry end uses deceased, primarily owing to the increases in the price of gold. World Mine Production and Reserves: Reserves for Australia, Canada, China, Ghana, Papua New Guinea, and Peru were revised based on Government or industry reports. Mine production Reserves8 2015 2016e United States 214 209 3,000 Australia 278 270 9,500 Brazil 81 80 2,400 Canada 153 170 2,400 China 450 455 2,000 Ghana 88 90 990 Indonesia 97 100 3,000 Mexico 135 125 1,400 Papua New Guinea 60 65 1,500 Peru 145 150 2,400 Russia 252 250 8,000 South Africa 145 140 6,000 Uzbekistan 102 100 1,700 Other countries 897 900 13,000 World total (rounded) 3,100 3,100 57,000 World Resources: An assessment of U.S. gold resources indicated 33,000 tons of gold in identified (15,000 tons) and undiscovered (18,000 tons) resources.9 Nearly one-quarter of the gold in undiscovered resources was estimated to be contained in porphyry copper deposits. The gold resources in the United States, however, are only a small portion of global gold resources. Substitutes: Base metals clad with gold alloys are widely used in electrical and electronic products, and in jewelry to economize on gold; many of these products are continually redesigned to maintain high-utility standards with lower gold content. Generally, palladium, platinum, and silver may substitute for gold. eEstimated. 1One metric ton (1,000 kilograms) = 32,150.7 troy ounces. 2Refined bullion, dore, ores, concentrates, and precipitates. Excludes: Waste and scrap, official monetary gold, gold in fabricated items, gold in coins, and net bullion flow (in tons) to market from foreign stocks at the New York Federal Reserve Bank. 3Includes gold in Exchange Stabilization Fund. Stocks were valued at the official price of $42.22 per troy ounce. 4Engelhard’s average gold price quotation for the year. In 2016, the price was estimated by the U.S. Geological Survey based on monthly data from January through October. 5Data from Mine Safety and Health Administration. 6Defined as imports – exports + adjustments for Government and industry stock changes. 7In recent years, the United States has been a net exporter; however, large unreported investor stock changes preclude calculation of a meaningful net import reliance. 8See Appendix C for resource and reserve definitions and information concerning data sources. 9U.S. Geological Survey National Mineral Resource Assessment Team, 2000, 1998 assessment of undiscovered deposits of gold, silver, copper, lead, and zinc in the United States: U.S. Geological Survey Circular 1178, 21 p.
U.S. Geological Survey, Mineral Commodity Summaries, January 2017

74
GRAPHITE (NATURAL)
(Data in thousand metric tons unless otherwise noted) Domestic Production and Use: Although natural graphite was not produced in the United States in 2016, approximately 98 U.S. firms, primarily in the Northeastern and Great Lakes regions, consumed 24,200 tons valued at $25.6 million. The major uses of natural graphite in 2016 were brake linings, foundry operations, lubricants, refractory applications, and steelmaking. During 2016, U.S. natural graphite imports were 39,500 tons, which were 70% flake and high-purity, 29% amorphous, and 1% lump and chip graphite. Salient Statistics—United States: 2012 2013 2014 2015 2016e Production, mine — — — — — Imports for consumption 57 61 70 47 39 Exports 8 10 12 12 15 Consumption, apparent1 49 51 57 35 24 Price, imports (average dollars per ton at foreign ports): Flake 1,370 1,330 1,270 1,480 1,360 Lump and chip (Sri Lankan) 1,960 1,720 1,870 1,800 1,820 Amorphous 339 375 360 394 364 Net import reliance1 as a percentage of apparent consumption 100 100 100 100 100 Recycling: Refractory brick and linings, alumina-graphite refractories for continuous metal castings, magnesia-graphite refractory brick for basic oxygen and electric arc furnaces, and insulation brick led the way in recycling of graphite products. The market for recycled refractory graphite material is expanding, with material being recycled into products such as brake linings and thermal insulation. Recovering high-quality flake graphite from steelmaking kish is technically feasible, but not practiced at the present time. The abundance of graphite in the world market inhibits increased recycling efforts. Information on the quantity and value of recycled graphite is not available. Import Sources (2012–15): China, 34%; Mexico, 33%; Canada, 18%; Brazil, 7%; and other, 8%. Tariff: Item Number Normal Trade Relations 12–31–16 Crystalline flake (not including flake dust) 2504.10.1000 Free. Powder 2504.10.5000 Free. Other 2504.90.0000 Free. Depletion Allowance: 22% (Domestic lump and amorphous), 14% (Domestic flake), and 14% (Foreign). Government Stockpile: None. Events, Trends, and Issues: Worldwide consumption of graphite steadily increased since 2012 and into 2016. This increase resulted from the improvement of global economic conditions and its impact on industries that use graphite; however, U.S. consumption of natural graphite has declined from 2014 to 2016. In 2016, principal U.S. import sources of natural graphite were, in descending order of tonnage, China, Canada, Brazil, Japan, Mexico, and Madagascar, which combined accounted for 96% of the tonnage and 98% of the value of total imports. Mexico provided all the amorphous graphite, and Sri Lanka provided all the lump and chippy dust variety. China, Canada, Brazil, and Madagascar were, in descending order of tonnage, the major suppliers of crystalline flake and flake dust graphite. During 2016, China produced 66% of the world’s graphite and consumed 35%. Graphite production decreased in Canada and increased in Madagascar from that of 2015. New deposits are being developed, and mines will begin production in the near future in Madagascar, Mozambique, Namibia, and Tanzania. Prepared by Donald W. Olson [(703) 648–7721, [email protected]]

75 GRAPHITE (NATURAL)
North America produced only 4% of the world’s graphite supply with production in Canada and Mexico. No production of natural graphite was reported in the United States, but two companies recently have been developing graphite projects in the United States. Alabama Graphite Corp. was developing the Coosa Graphite Project in Alabama, and Graphite One Resources Inc. was developing the Graphite Creek Project in Alaska. One U.S. automaker was building a large plant to manufacture lithium-ion electric vehicle batteries. The plant’s completion was originally projected for 2020, but the project is about 2 years ahead of schedule. During July 2016, one-sixth of the plant was completed, and the first batteries were expected to be produced by the end of 2016. When the plant is complete, it will require 93,000 tons of flake graphite to produce 35,200 tons of spherical graphite for use as anode material for lithium-ion batteries. Advances in thermal technology and acid-leaching techniques that enable the production of higher purity graphite powders are likely to lead to development of new applications for graphite in high-technology fields. Such innovative refining techniques have enabled the use of improved graphite in carbon-graphite composites, electronics, foils, friction materials, and specialty lubricant applications. Flexible graphite product lines, such as graphoil (a thin graphite cloth), are likely to be the fastest growing market. Large-scale fuel-cell applications are being developed that could consume as much graphite as all other uses combined. World Mine Production and Reserves: The reserves data for Madagascar, Mozambique, and Tanzania were revised based on information reported by graphite-producing companies and the Governments of those countries. Mine production Reserves2 2015 2016e United States — — — Brazil 80 80 72,000 Canada 30 21 (3) China 780 780 55,000 India 170 170 8,000 Korea, North 30 30 (3) Madagascar 5 8 1,600 Mexico 22 22 3,100 Mozambique — — 13,000 Norway 8 8 (3) Russia 15 15 (3) Sri Lanka 4 4 (3) Tanzania — — 5,100 Turkey 32 32 90,000 Ukraine 5 5 (3) Zimbabwe 7 7 (3) World total (rounded) 1,190 1,200 250,000 World Resources: Domestic resources of graphite are relatively small, but the rest of the world’s inferred resources exceed 800 million tons of recoverable graphite. Substitutes: Synthetic graphite powder, scrap from discarded machined shapes, and calcined petroleum coke compete for use in iron and steel production. Synthetic graphite powder and secondary synthetic graphite from machining graphite shapes compete for use in battery applications. Finely ground coke with olivine is a potential competitor in foundry-facing applications. Molybdenum disulfide competes as a dry lubricant but is more sensitive to oxidizing conditions. eEstimated. — Zero. 1Defined as imports – exports. 2See Appendix C for resource and reserve definitions and information concerning data sources. 3Included with “World total.”
U.S. Geological Survey, Mineral Commodity Summaries, January 2017

76
GYPSUM
(Data in thousand metric tons unless otherwise noted) Domestic Production and Use: In 2016, domestic production of crude gypsum was estimated to be 15.5 million tons with a value of about $140 million. The leading crude gypsum-producing States were, in descending order, Oklahoma, Nevada, Texas, Kansas, Arkansas, and Iowa, which together accounted for 76% of total output. Overall, 47 companies produced or processed gypsum in the United States at 50 mines in 16 States. The vast majority of domestic consumption, which totaled approximately 37.1 million tons, was accounted for by manufacturers of wallboard and plaster products. Approximately 7.2 million tons of gypsum was used in cement production and in agricultural applications, and small quantities of high-purity gypsum, used in a wide range of industrial processes, accounted for the remaining tonnage. At the beginning of 2016, the production capacity of operating wallboard plants in the United States was about 33 billion square feet1 per year. Total production was 22.5 billion square feet. Salient Statistics—United States: 2012 2013 2014 2015 2016e Production: Crude 12,800 14,400 14,900 15,200 15,500 Synthetic2 12,100 10,800 15,200 16,000 17,000 Calcined3 12,800 14,600 14,700 15,000 15,500 Wallboard products sold (million square feet1) 18,900 21,800 21,500 22,100 22,500 Imports, crude, including anhydrite 3,250 3,290 3,720 4,030 4,640 Exports, crude, not ground or calcined 408 142 67 63 46 Consumption, apparent4 27,800 28,400 33,700 35,200 37,100 Price: Average crude, f.o.b. mine, dollars per metric ton 8.16 7.60 8.90 8.90 9.00 Average calcined, f.o.b. plant, dollars per metric ton 28.70 27.60 29.80 30.86 31.00 Employment, mine and calcining plant, numbere 4,500 4,500 4,500 4,500 4,500 Net import reliance5 as a percentage of apparent consumption 12 12 11 11 12 Recycling: Some of the more than 4 million tons of gypsum scrap that was generated by wallboard manufacturing, wallboard installation, and building demolition was recycled. The recycled gypsum was used primarily for agricultural purposes and feedstock for the manufacture of new wallboard. Other potential markets for recycled gypsum include athletic field marking, cement production as a stucco additive, grease absorption, sludge drying, and water treatment. Import Sources (2012–15): Mexico, 43%; Canada, 32%; Spain, 25%; and other, less than 1%. Tariff: Item Number Normal Trade Relations 12–31–16 Gypsum; anhydrite 2520.10.0000 Free. Depletion Allowance: 14% (Domestic and foreign). Government Stockpile: None. Events, Trends, and Issues: U.S. gypsum production increased slightly compared with that of 2015. Apparent consumption also increased by 5% compared with that of 2015. The world’s leading gypsum producer, China, produced more than eight times the amount produced in the United States. Iran, ranked second in world production, supplied much of the gypsum needed for construction in the Middle East. Spain, the leading European producer, ranked seventh in the world and supplied crude gypsum and gypsum products to much of Western Europe. Increased use of wallboard in Asia, coupled with new gypsum product plants, spurred increased production in that region. As wallboard becomes more widely used in other regions, worldwide production of gypsum is expected to increase. Demand for gypsum depends principally on the strength of the construction industry, particularly in the United States where the majority of gypsum consumed is used for building plasters, the manufacture of portland cement, and wallboard products. If the construction of wallboard manufacturing plants designed to use synthetic gypsum from coal flue gas desulfurization (FGD) units as feedstock continues, this could result in less mining of natural gypsum. The availability of inexpensive natural gas, however, may limit the additional construction of FGD units and, therefore, the use of synthetic gypsum in wallboard. Gypsum imports increased by 15% compared with those of 2015. Exports, although very low compared with imports and often subject to wide fluctuations, decreased by 27%. Prepared by Robert D. Crangle, Jr. [(703) 648–6410, [email protected]]

77 GYPSUM
World Mine Production and Reserves: Mine production Reserves6 2015 2016e United States 15,200 15,500 700,000 Algeria 2,130 2,300 NA Argentina 1,500 1,500 NA Australia 2,580 2,600 NA Brazil 3,300 3,300 290,000 Canada 1,630 1,600 450,000 China 130,000 130,000 NA France 3,280 3,300 NA Germany 1,800 1,800 NA India 3,500 3,500 39,000 Iran 16,000 16,000 1,600 Italy 8,550 8,600 NA Japan 4,670 4,700 NA Mexico 5,380 5,400 NA Oman 6,050 6,500 4,900 Pakistan 1,660 1,700 NA Russia 4,400 4,000 NA Saudi Arabia 1,860 1,900 NA Spain 7,000 7,000 NA Thailand 11,200 12,000 NA Turkey 12,600 13,000 NA United Kingdom 1,200 1,200 NA Other countries 15,800 16,000 NA World total (rounded) 261,000 263,000 Large World Resources: Reserves are large in major producing countries, but data for most are not available. Domestic gypsum resources are adequate but unevenly distributed. Large imports from Canada augment domestic supplies for wallboard manufacturing in the United States, particularly in the eastern and southern coastal regions. Imports from Mexico supplement domestic supplies for wallboard manufacturing along portions of the U.S. western seaboard. Large gypsum deposits occur in the Great Lakes region, the midcontinent region, and several Western States. Foreign resources are large and widely distributed; 81 countries produced gypsum in 2016. Substitutes: In such applications as stucco and plaster, cement and lime may be substituted for gypsum; brick, glass, metallic or plastic panels, and wood may be substituted for wallboard. Gypsum has no practical substitute in the manufacturing of portland cement. Synthetic gypsum generated by various industrial processes, including FGD of smokestack emissions, is very important as a substitute for mined gypsum in wallboard manufacturing, cement production, and agricultural applications (in descending order by tonnage). In 2016, synthetic gypsum accounted for approximately 50% of the total domestic gypsum supply. eEstimated. NA Not available. 1The standard unit used in the U.S. wallboard industry is square feet; multiply square feet by 9.29 x 10⁻² to convert to square meters. Source: The Gypsum Association. 2Data refer to the amount sold or used, not produced. 3From domestic crude and synthetic. 4Defined as crude production + total synthetic reported used + imports – exports. 5Defined as imports – exports. 6See Appendix C for resource and reserve definitions and information concerning data sources.
U.S. Geological Survey, Mineral Commodity Summaries, January 2017

78
HELIUM
(Data in million cubic meters of contained helium gas1 unless otherwise noted) Domestic Production and Use: The estimated value of Grade-A helium (99.997% or better) extracted during 2016 by private industry was about $650 million. Thirteen plants (two in Colorado, five in Kansas, one in Oklahoma, four in Texas, and one in Utah) extracted helium from natural gas and produced crude helium that varied from 50% to 99% helium. One plant in Colorado and another in Wyoming extracted helium from natural gas and produced Grade-A helium. Three plants in Kansas and one in Oklahoma accepted crude helium from other producers and the Bureau of Land Management (BLM) pipeline and purified it to Grade-A helium. In 2016, estimated domestic consumption of Grade-A helium was 47 million cubic meters (1.7 billion cubic feet), and it was used for magnetic resonance imaging, 30%; lifting gas, 17%; analytical and laboratory applications, 14%; welding, 9%; engineering and scientific applications, 6%; leak detection and semiconductor manufacturing, 5% each; and various other minor applications, 14%. Salient Statistics—United States: 2012 2013 2014 2015 2016e Helium extracted from natural gas2 73 69 75 66 63 Withdrawn from storage3 60 49 27 22 22 Grade-A helium sales 133 118 102 88 85 Imports for consumption — 2 7 16 23 Exports4 85 81 67 65 61 Consumption, apparent4 48 39 42 39 47 Net import reliance5 as a percentage of apparent consumption E E E E E In fiscal year (FY) 2016, the price for crude helium to Government users was $3.04 per cubic meter ($84.40 per thousand cubic feet) and to nongovernment users was $3.75 per cubic meter ($104.00 per thousand cubic feet). The price for the Government-owned helium is mandated by the Helium Stewardship Act of 2013 (Public Law 113–40) and determined through public auctions and industry surveys. The estimated price for private industry’s Grade-A helium was about $7.21 per cubic meter ($200 per thousand cubic feet), with some producers posting surcharges to this price. Recycling: In the United States, helium used in large-volume applications is seldom recycled. Some low-volume or liquid boil-off recovery systems are used. In the rest of the world, helium recycling is practiced more often. Import Sources (2012–15): Qatar, 95%; and other, 5%. Tariff: Item Number Normal Trade Relations 12–31–16 Helium 2804.29.0010 3.7% ad val. Depletion Allowance: Allowances are applicable to natural gas from which helium is extracted, but no allowance is granted directly to helium. Government Stockpile: Under the Helium Stewardship Act of 2013, the BLM manages the Federal Helium Program, which includes all operations of the Cliffside Field helium storage reservoir, in Potter County, TX, and the Government’s crude helium pipeline system. Private firms that sell Grade-A helium to Federal agencies are required to purchase a like amount of (in-kind) crude helium from the BLM. The law mandated that the BLM annually sell at auction Federal Conservation helium stored in Bush Dome at the Cliffside Field. The amounts sold are approximately equal to the amount that the Federal helium system can produce each year. The BLM will dispose of all helium- related assets when the remaining conservation helium falls below 83 million cubic meters or no later than 2021. In FY 2016, privately owned companies purchased about 3.4 million cubic meters (124 million cubic feet) of in-kind crude helium. Privately owned companies also purchased 29.9 million cubic meters (1.1 billion cubic feet) of open market sales helium. During FY 2016, the BLM’s Amarillo Field Office, Helium Operations, accepted about 12.9 million cubic meters (464 million cubic feet) of private helium for storage and redelivered nearly 32.2 million cubic meters (1.16 billion cubic feet). As of September 30, 2016, about 77.4 million cubic meters (2.79 billion cubic feet) of privately owned helium remained in storage at Cliffside Field.
Stockpile Status—9–30–166
Uncommitted Authorized Disposal plan Disposals Material inventory for disposal FY 2016 FY 2016 Helium 209.7 209.7 29.0 22.6 Prepared by John E. Hamak7 [(806) 356–1031, [email protected]]

79 HELIUM
Events, Trends, and Issues: In 2016, the BLM continued implementation of the Helium Stewardship Act of 2013 by conducting its third auction of helium from Federal helium storage at the Cliffside Field near Amarillo. The average price of helium sold to private buyers as a result of this process was $3.75 per cubic meter ($104 per thousand cubic feet). By the end of the decade, international helium extraction facilities are likely to become the main source of supply for world helium users. Seven international helium plants are in operation and more are planned during the next 3 to 5 years. Expansions to facilities have been completed in Algeria and Qatar. In 2016, domestic consumption of helium increased while worldwide consumption remained unchanged. World Production and Reserves: Production Reserves8 2015 2016e United States (extracted from natural gas) 66 63 3,900 United States (from Cliffside Field) 22 22 (9) Algeria 10 10 1,800 Australia 4 4 NA Canada <1 <1 NA China NA NA NA Poland 2 2 25 Qatar 49 50 NA Russia 3 3 1,700 Other countries NA NA NA World total (rounded) 156 154 NA World Resources: Section 16 of Public Law 113-40 requires the U.S. Geological Survey (USGS) to complete a national helium gas assessment along with a global helium gas assessment. The USGS and the BLM have been coordinating efforts to complete this assessment. However, it may be several years before a project of this magnitude will be completed. The BLM plans to update the report of Helium Resources of the United States by yearend 2017. Until then, the following estimates are still the best available. As of December 31, 2006, the total helium reserves and resources of the United States were estimated to be 20.6 billion cubic meters (744 billion cubic feet). This includes 4.25 billion cubic meters (153 billion cubic feet) of measured reserves, 5.33 billion cubic meters (192 billion cubic feet) of probable resources, 5.93 billion cubic meters (214 billion cubic feet) of possible resources, and 5.11 billion cubic meters (184 billion cubic feet) of speculative resources. Included in the measured reserves are 670 million cubic meters (24.2 billion cubic feet) of helium stored in the Cliffside Field Government Reserve, and 65 million cubic meters (2.3 billion cubic feet) of helium contained in Cliffside Field native gas. The Hugoton (Kansas, Oklahoma, and Texas), Panhandle West, Panoma, Riley Ridge in Wyoming, and Cliffside Fields are the depleting fields from which most U.S.-produced helium is extracted. These fields contained an estimated 3.9 billion cubic meters (140 billion cubic feet) of helium. Helium resources of the world, exclusive of the United States, were estimated to be about 31.3 billion cubic meters (1.13 trillion cubic feet). The locations and volumes of the major deposits, in billion cubic meters, are Qatar, 10.1; Algeria, 8.2; Russia, 6.8; Canada, 2.0; and China, 1.1. As of December 31, 2010, the BLM had analyzed about 22,000 gas samples from 26 countries and the United States, in a program to identify world helium resources. Substitutes: There is no substitute for helium in cryogenic applications if temperatures below –429 °F are required. Argon can be substituted for helium in welding, and hydrogen can be substituted for helium in some lighter-than-air applications in which the flammable nature of hydrogen is not objectionable. Hydrogen is also being investigated as a substitute for helium in deep-sea diving applications below 1,000 feet. eEstimated. E Net exporter. NA Not available. — Zero. 1Measured at 101.325 kilopascals absolute (14.696 psia) and 15 °C; 27.737 cubic meters of helium = 1,000 cubic feet of helium at 70 °F and 14.7 psia. 2Both Grade-A and crude helium. 3Extracted from natural gas in prior years. 4Grade-A helium. 5Defined as imports – exports + adjustments for Government and industry stock changes. 6See Appendix B for definitions. 7Team Leader, Resources and Evaluation Group, Bureau of Land Management, Amarillo Field Office, Helium Operations, Amarillo, TX. 8See Appendix C for resource and reserve definitions and information concerning data sources. 9Included in United States (extracted from natural gas) reserves.
U.S. Geological Survey, Mineral Commodity Summaries, January 2017

80
INDIUM
(Data in metric tons of indium content unless otherwise noted) Domestic Production and Use: Indium was not recovered from ores in the United States in 2016. Several companies produced indium products—including alloys, compounds, high-purity metal, and solders—from imported indium metal. Production of indium tin oxide (ITO) continued to account for most of global indium consumption. ITO thin-film coatings were primarily used for electrical conductive purposes in a variety of flat-panel displays—most commonly liquid crystal displays (LCDs). Other indium end uses included alloys and solders, compounds, electrical components and semiconductors, and research. Based on an average of recent annual import levels, estimated domestic consumption of refined indium was 128 tons in 2016. The estimated value of refined indium consumed domestically in 2016, based on the average New York dealer price, was about $44 million. Salient Statistics—United States: 2012 2013 2014 2015 2016e Production, refinery — — — — — Imports for consumption 109 97 123 140 170 Exports NA NA NA NA NA Price, annual average, dollars per kilogram: New York dealer1 540 570 705 520 340 Free market2 NA NA NA 410 240 Net import reliance3 as a percentage of estimated consumption 100 100 100 100 100 Recycling: Indium is most commonly recovered from ITO scrap in Japan and the Republic of Korea. A significant quantity of scrap was recycled domestically; however, data on the quantity of secondary indium recovered from scrap were not available. Import Sources (2012–15): Canada, 25%; China, 14%; France, 13%; Belgium, 12%; and other, 36%. Tariff: Item Number Normal Trade Relations 12–31–16 Unwrought indium, including powders 8112.92.3000 Free. Depletion Allowance: 14% (Domestic and foreign). Government Stockpile: None. Events, Trends, and Issues: The 2016 estimated average free market price of indium was $240 per kilogram. The average monthly price began the year at $255 per kilogram in January and increased slightly during the first 4 months of the year reaching $262 per kilogram in April, after which the price decreased through September, falling to $218 per kilogram. News sources attributed low prices to an oversupply of indium and depressed demand after the collapse of the Fanya Metal Exchange Co. Ltd. in 2015. As of August 2016, Fanya’s warehouses reportedly held 3,600 metric tons of indium, and no information was available as to when the inventory would be released into the market. Recent cuts in zinc mine production were not thought to have led to similar decreases in indium production because most of the zinc mines that have closed within the past 1 to 2 years were reported to have produced clean concentrates, or concentrates with relatively low levels of minor metals. Prepared by Amy C. Tolcin [(703) 648–4940, [email protected]]

81 INDIUM
According to market reports, indium production in China continued to decrease in the first half of 2016 after falling by about 30% in 2015, owing to a continued decrease in production by small-scale indium producers. Indium production at large lead and zinc smelters was reported to have remained level. Although production continued to decline, China’s net exports of indium (including unwrought, scrap, and powder) increased by 30% to 49 metric tons from January to July 2016 from that of the same period of 2015. The Government of China was expected to increase policy support during the next 5 years (2016 to 2020) for the development of its minor metals industry and related downstream, value-added products, potentially leading to a notable increase in indium consumption. During this time, China also planned to reform its national stockpiling strategy, although details, including which metals would be affected by the reform, have not been confirmed. No indium was produced in France in 2016, owing to a fire that damaged the indium production plant at the Auby zinc smelter in November 2015. Production was projected to resume in the first quarter of 2017. World Refinery Production and Reserves: Refinery productione Reserves4 2015 2016 United States — — Quantitative estimates of reserves are not Belgium 20 25 available. Canada 70 65 China 350 290 France 41 — Japan 70 70 Korea, Republic of 195 195 Peru 9 5 Russia 4 5 World total (rounded) 759 655 World Resources: Indium is most commonly recovered from the zinc-sulfide ore mineral sphalerite. The indium content of zinc deposits from which it is recovered ranges from less than 1 part per million to 100 parts per million. Although the geochemical properties of indium are such that it occurs in trace amounts in other base-metal sulfides—particularly chalcopyrite and stannite—most deposits of these metals are subeconomic for indium. Substitutes: Antimony tin oxide coatings have been developed as an alternative to ITO coatings in LCDs and have been successfully annealed to LCD glass; carbon nanotube coatings have been developed as an alternative to ITO coatings in flexible displays, solar cells, and touch screens; PEDOT [poly(3,4-ethylene dioxythiophene)] has also been developed as a substitute for ITO in flexible displays and organic light-emitting diodes; and silver nanowires have been explored as a substitute for ITO in touch screens. Graphene has been developed to replace ITO electrodes in solar cells and also has been explored as a replacement for ITO in flexible touch screens. Researchers have developed a more adhesive zinc oxide nanopowder to replace ITO in LCDs. Gallium arsenide can substitute for indium phosphide in solar cells and in many semiconductor applications. Hafnium can replace indium in nuclear reactor control rod alloys. eEstimated. NA Not available. — Zero. 1Price is based on 99.99%-minimum-purity indium; delivered duty paid U.S. buyers; in minimum lots of 50 kilograms. Source: Platts Metals Week. 2Price is based on 99.99%-minimum-purity indium at warehouse (Rotterdam). Source: Metal Bulletin. 3Defined as imports – exports. 4See Appendix C for resource and reserve definitions and information concerning data sources.
U.S. Geological Survey, Mineral Commodity Summaries, January 2017
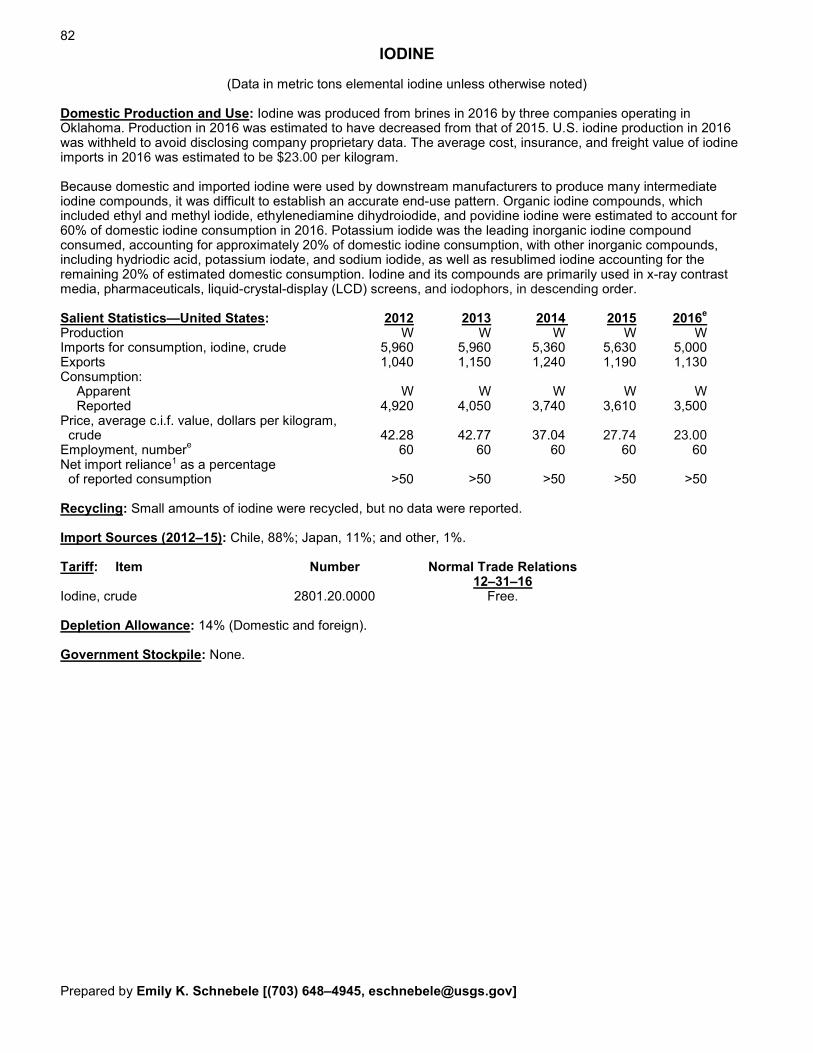
82
IODINE
(Data in metric tons elemental iodine unless otherwise noted) Domestic Production and Use: Iodine was produced from brines in 2016 by three companies operating in Oklahoma. Production in 2016 was estimated to have decreased from that of 2015. U.S. iodine production in 2016 was withheld to avoid disclosing company proprietary data. The average cost, insurance, and freight value of iodine imports in 2016 was estimated to be $23.00 per kilogram. Because domestic and imported iodine were used by downstream manufacturers to produce many intermediate iodine compounds, it was difficult to establish an accurate end-use pattern. Organic iodine compounds, which included ethyl and methyl iodide, ethylenediamine dihydroiodide, and povidine iodine were estimated to account for 60% of domestic iodine consumption in 2016. Potassium iodide was the leading inorganic iodine compound consumed, accounting for approximately 20% of domestic iodine consumption, with other inorganic compounds, including hydriodic acid, potassium iodate, and sodium iodide, as well as resublimed iodine accounting for the remaining 20% of estimated domestic consumption. Iodine and its compounds are primarily used in x-ray contrast media, pharmaceuticals, liquid-crystal-display (LCD) screens, and iodophors, in descending order. Salient Statistics—United States: 2012 2013 2014 2015 2016e Production W W W W W Imports for consumption, iodine, crude 5,960 5,960 5,360 5,630 5,000 Exports 1,040 1,150 1,240 1,190 1,130 Consumption: Apparent W W W W W Reported 4,920 4,050 3,740 3,610 3,500 Price, average c.i.f. value, dollars per kilogram, crude 42.28 42.77 37.04 27.74 23.00 Employment, numbere 60 60 60 60 60 Net import reliance1 as a percentage of reported consumption >50 >50 >50 >50 >50 Recycling: Small amounts of iodine were recycled, but no data were reported. Import Sources (2012–15): Chile, 88%; Japan, 11%; and other, 1%. Tariff: Item Number Normal Trade Relations 12–31–16 Iodine, crude 2801.20.0000 Free. Depletion Allowance: 14% (Domestic and foreign). Government Stockpile: None. Prepared by Emily K. Schnebele [(703) 648–4945, [email protected]]

83 IODINE
Events, Trends, and Issues: Global iodine prices declined over the course of the year. According to trade publications, spot prices of iodine crystal averaged about $30 per kilogram at the beginning of 2016 and decreased to an average of about $21 per kilogram in September 2016. The continuing decline in prices was attributed to a surplus of iodine in the market and competition among producers. Although prices continued to decline from their historically high levels of 2012 and 2013, global demand for iodine and its derivative compounds remained steady in 2016, owing to growth in demand for x-ray contrast media, especially in developing countries, along with continued growth in demand for LCD screens. As in recent years, Chile was the world’s leading producer of iodine, followed by Japan and the United States. Excluding U.S. production, Chile accounted for about 66% of world production in 2016, with two of the leading iodine producers in the world. Most of the world’s iodine supply comes from three areas: the Chilean desert nitrate mines and the oil and gas fields in Japan and northwestern Oklahoma. World Mine Production and Reserves: Mine production Reserves2 2015 2016e United States W W 250,000 Azerbaijan 247 247 170,000 Chile 20,000 21,000 1,800,000 China NA NA 4,000 Indonesia 45 45 100,000 Japan 9,800 9,800 5,000,000 Russia — — 120,000 Turkmenistan 510 510 70,000 World total (rounded) 330,600 331,600 7,500,000 World Resources: In addition to the reserves shown above, seawater contains 0.06 parts per million iodine, or approximately 90 billion tons. Seaweeds of the Laminaria family are able to extract and accumulate up to 0.45% iodine on a dry basis. Although not as economical as the production of iodine as a byproduct of gas, nitrates, and oil, the seaweed industry represented a major source of iodine prior to 1959 and remains a large resource. Substitutes: No comparable substitutes exist for iodine in many of its principal applications, such as in animal feed, catalytic, nutritional, pharmaceutical, and photographic uses. Bromine and chlorine could be substituted for iodine in biocide, colorant, and ink, although they are usually considered less desirable than iodine. Antibiotics can be used as a substitute for iodine biocides. eEstimated. NA Not available. W Withheld to avoid disclosing company proprietary data. — Zero. 1Defined as imports – exports. 2See Appendix C for resource and reserve definitions and information concerning data sources. 3Excludes U.S. production.
U.S. Geological Survey, Mineral Commodity Summaries, January 2017

84
IRON AND STEEL1
(Data in million metric tons of metal unless otherwise noted) Domestic Production and Use: The iron and steel industry and ferrous foundries produced goods in 2016 with an estimated value of about $130 billion, down from a revised $143 billion in 2015. Pig iron was produced by three companies operating integrated steel mills in 11 locations. About 55 companies produce raw steel at 108 minimills. Combined production capacity was about 111 million tons. Indiana accounted for 29% of total raw steel production, followed by Ohio, 11%; Michigan, 7%; and Pennsylvania, 6%, with no other State having more than 5% of total domestic raw steel production. The distribution of steel shipments was estimated to be warehouses and steel service centers, 29%; construction, 20%; transportation (predominantly automotive), 18%; cans and containers, 2%; and other, 31%. Salient Statistics—United States: 2012 2013 2014 2015 2016e
Pig iron production2 30.1 30.3 29.4 25.4 23 Raw steel production 88.7 86.9 88.2 78.8 80 Basic oxygen furnaces, percent 40.9 39.4 37.4 37 33 Electric arc furnaces, percent 59.1 60.6 62.6 63 67 Continuously cast steel, percent 98.6 98.8 98.5 99 99 Shipments: Steel mill products 87.0 86.6 89.1 78.5 78 Steel castingse, 3 0.4 0.4 0.4 0.4 0.4 Iron castingse, 3 4.0 4.0 4.0 4.0 4.0 Imports of steel mill products 30.4 29.2 40.2 35.2 30 Exports of steel mill products 12.5 11.5 10.9 9.0 9.0 Apparent steel consumption4 98 98 107 99 94 Producer price index for steel mill products (1982=100)5 208.0 195.0 200.2 177.1 168 Steel mill product stocks at service centers, yearend6 7.8 7.6 9.0 7.5 8.0 Total employment, average, number: Blast furnaces and steel mills5 92,600 90,900 91,000 87,000 87,000 Iron and steel foundries5 70,500 69,400 67,600 66,000 66,000 Net import reliance7 as a percentage of apparent consumption 11 12 30 22 16 Recycling: See Iron and Steel Scrap and Iron and Steel Slag. Import Sources (2012–15): Canada, 15%; Brazil, 14%; Republic of Korea, 13%; Taiwan, 7%; and other, 51%. Tariff: Item Number Normal Trade Relations 12–31–16 Carbon steel: Semifinished 7207.00.0000 Free. Sheets, hot-rolled 7208.10.0000 Free. Hot-rolled, pickled 7208.10.1500 Free. Cold-rolled 7209.00.0000 Free. Galvanized 7210.00.0000 Free. Bars, hot-rolled 7213.00.0000 Free. Structural shapes 7216.00.0000 Free. Stainless steel: Semifinished 7218.00.0000 Free. Cold-rolled sheets 7219.31.0000 Free. Bars, cold-finished 7222.20.0000 Free. Depletion Allowance: Not applicable. Government Stockpile: None. Events, Trends, and Issues: The expansion or contraction of gross domestic product (GDP) may be considered a predictor of the health of the steelmaking and steel manufacturing industries, worldwide and domestically. The World Bank’s forecast of global GDP growth rates for 2016, 2017, and 2018 was 2.4%, 2.8%, and 3.0%, respectively. The World Bank’s forecast for the U.S. 2016, 2017, and 2018 GDP growth rates was 1.9%, 2.2%, and 2.1%, respectively. Prepared by Michael D. Fenton [(703) 648–4972, [email protected]]

85 IRON AND STEEL
The U.S. Government’s Corporate Average Fuel Economy standards will nearly double by 2025 with the average mileage for light-duty vehicles increasing to more than 54 miles per gallon of fuel. About two-thirds, by weight, of every vehicle operating today contains steel in sheet metal structural components, deck lids, doors, fenders, and hoods. The U.S. steel industry will continue to introduce a wide variety of advanced automotive high-strength lightweight steels to replace mild steel to satisfy these new requirements.
The Organisation for Economic Co-operation and Development reported a massive global steel overcapacity estimated at nearly 544 million tons in 2015 and continuing into 2016, as a result of foreign government subsidies and other steel market-distorting policies. Overcapacity, along with depressed global steel demand and import barriers in other markets, had resulted in high levels of steel imports entering into the U.S. market in recent years; however, increased enforcement of duties and increased import tariffs placed on steel imports from select countries reduced imports in 2016. The increase in enforcement and duty rates followed allegations of illegal dumping from many countries in which steel production is thought to be heavily subsidized, including Brazil, China, India, the Republic of Korea, Turkey, and others. In China, the world’s leading producer and consumer of steel, significant overcapacity is expected to continue until 2020, while consumption is unlikely to exceed 700 million tons.
Near yearend 2016, the U.S. Department of Commerce was expected to begin a formal investigation to determine whether steel companies in China have been shipping steel through Vietnam to avoid U.S. import tariffs. Trade data show steel shipments from Vietnam to the United States have increased, while shipments from China to Vietnam also increased. In addition, Canada’s parliamentary trade committee held its first meeting to study dumping of foreign steel into Canada. The study began, in part, because a large steel producer in Canada was going through insolvency proceedings.
World Production: Pig iron Raw steel 2015 2016e 2015 2016e United States 26 23 79 80 Brazil 28 25 33 30 China 691 685 804 800 France 10 11 15 17 Germany 28 28 43 44 India 58 62 89 83 Japan 81 81 105 105 Korea, Republic of 48 45 70 67 Russia 53 52 71 70 Taiwan 14 14 21 21 Turkey 10 10 32 32 Ukraine 22 24 23 25 United Kingdom 9 9 11 10 Other countries 80 80 218 213 World total (rounded) 1,160 1,150 1,610 1,600 World Resources: Not applicable. See Iron Ore and Iron and Steel Scrap for steelmaking raw-material resources. Substitutes: Iron is the least expensive and most widely used metal. In most applications, iron and steel compete either with less expensive nonmetallic materials or with more expensive materials that have a performance advantage. Iron and steel compete with lighter materials, such as aluminum and plastics, in the motor vehicle industry; aluminum, concrete, and wood in construction; and aluminum, glass, paper, and plastics in containers. eEstimated. 1Production and shipments data source is the American Iron and Steel Institute; see also Iron Ore and Iron and Steel Scrap. 2More than 95% of iron made is transported in molten form to steelmaking furnaces located at the same site. 3Source: U.S. Census Bureau. North American Industry Classification System: 3311, 331511, 331512, and 331513. 4Defined as steel shipments + imports – exports + adjustments for industry stock changes – semifinished steel product imports. 5U.S. Department of Labor, Bureau of Labor Statistics. 6Metals Service Center Institute. 7Defined as imports – exports + adjustments for industry stock changes.
U.S. Geological Survey, Mineral Commodity Summaries, January 2017

86
IRON AND STEEL SCRAP1
(Data in million metric tons of metal unless otherwise noted) Domestic Production and Use: In 2016, the total value of domestic purchases (receipts of ferrous scrap by all domestic consumers from brokers, dealers, and other outside sources) and exports was estimated to be $14.2 billion, approximately 15% less than that of 2015. U.S. apparent steel consumption, an indicator of economic growth, increased to about 105 million tons in 2016. Manufacturers of pig iron, raw steel, and steel castings accounted for about 88% of scrap consumption by the domestic steel industry, using scrap together with pig iron and direct-reduced iron to produce steel products for the appliance, construction, container, machinery, oil and gas, transportation, and various other consumer industries. The ferrous castings industry consumed most of the remaining 12% to produce cast iron and steel products, such as machinery parts, motor blocks, and pipe. Relatively small quantities of steel scrap were used for producing ferroalloys, for the precipitation of copper, and by the chemical industry; these uses collectively totaled less than 1 million tons. During 2016, raw steel production was 80 million tons, up slightly from 78.8 million tons in 2015; annual steel mill capacity utilization was about 72% compared with 70% for 2015. Net shipments of steel mill products were 78 million tons, about the same as those in 2015. Salient Statistics—United States: 2012 2013 2014 2015 2016e Production: Home scrap 10 8.5 7.1 6.3 6 Purchased scrap2 70 77 62 67 65 Imports for consumption3 3.7 3.9 4.2 3.5 4.1 Exports3 21 18 15 13 12 Consumption, reported 63 59 59 53 47 Consumption, apparent 63 71 59 64 63 Price, average, dollars per metric ton delivered, No. 1 Heavy Melting composite price, Iron Age Average, Pittsburgh, Philadelphia, Chicago 367 365 351 213 192 Stocks, consumer, yearend 4.2 4.2 4.3 4.4 4.4 Employment, dealers, brokers, processors, number4 30,000 30,000 30,000 30,000 30,000 Net import reliance5 as a percentage of reported consumption E E E E E Recycling: Recycled iron and steel scrap is a vital raw material for the production of new steel and cast iron products. The steel and foundry industries in the United States have been structured to recycle scrap, and, as a result, are highly dependent upon scrap. In the United States, the primary source of old steel scrap was automobiles. The recycling rate for automobiles in 2013, the latest year for which statistics were available, was about 85%. In 2013, the last year that data were available, the automotive recycling industry recycled more than 14 million tons of steel from end-of-life vehicles through nearly 300 car shredders, the equivalent of nearly 12 million automobiles. More than 7,000 vehicle dismantlers throughout North America resell parts. The recycling rates for appliances and steel cans in 2014 were 89% and 70%, respectively; this was the latest year for which statistics were available. Recycling rates for construction materials in 2014 were about 98% for plates and beams and 71% for rebar and other materials. The recycling rates for appliance, can, and construction steel are expected to increase not only in the United States, but also in emerging industrial countries at an even greater rate. Public interest in recycling continues, and recycling is becoming more profitable and convenient as environmental regulations for primary production increase. Prepared by Michael D. Fenton [(703) 648–4972, [email protected]]

87 IRON AND STEEL SCRAP
Recycling of scrap plays an important role in the conservation of energy because the remelting of scrap requires much less energy than the production of iron or steel products from iron ore. Also, consumption of iron and steel scrap by remelting reduces the burden on landfill disposal facilities and prevents the accumulation of abandoned steel products in the environment. Recycled scrap consists of approximately 61% post-consumer (old, obsolete) scrap, 23% prompt scrap (produced in steel-product manufacturing plants), and 16% home scrap (recirculating scrap from current operations). Import Sources (2012–15): Canada, 70%; United Kingdom, 10%; Sweden, 7%; Netherlands, 6%; and other, 7%. Tariff: Item Number Normal Trade Relations 12–31–16 Iron and steel waste and scrap: No. 1 Bundles 7204.41.0020 Free. No. 1 Heavy Melting 7204.49.0020 Free. No. 2 Heavy Melting 7204.49.0040 Free. Shredded 7204.49.0070 Free. Depletion Allowance: Not applicable. Government Stockpile: None. Events, Trends, and Issues: Steel mill production capacity utilization peaked at 80.9% in April 2012 and reached 75.1% in June 2016. Scrap prices fluctuated during the first 8 months of 2016, between about $152 and $237 per ton. Composite prices published by Scrap Price Bulletin for No. 1 Heavy Melting steel scrap delivered to purchasers in Chicago, IL, Philadelphia, PA, and Pittsburgh, PA, averaged about $196 per ton during the first 8 months of 2016. Exports of ferrous scrap decreased in 2016 to an estimated 12 million tons from 13 million tons during 2015, primarily to Turkey, Mexico, and Taiwan, in descending order of export tonnage. The value of exported scrap decreased from $6.1 billion in 2015 to an estimated $3.3 billion in 2016. World steel consumption was expected to increase slightly from 1.48 billion tons in 2016 to 1.49 billion tons in 2017. World Mine Production and Reserves: Not applicable. World Resources: Not applicable. Substitutes: About 4.8 million tons of direct-reduced iron was used in the United States in 2016 as a substitute for iron and steel scrap, up from 4.1 million tons in 2015. eEstimated. E Net exporter. 1See also Iron and Steel and Iron Ore. 2Receipts – shipments by consumers + exports – imports. 3Excludes used rails for rerolling and other uses, and ships, boats, and other vessels for scrapping. 4Estimated, based on 2002 Census of Wholesale Trade for 2010 through 2014. 5Defined as imports – exports + adjustments for industry stock changes.
U.S. Geological Survey, Mineral Commodity Summaries, January 2017

88
IRON AND STEEL SLAG
(Data in million metric tons unless otherwise noted) Domestic Production and Use: Iron and steel (ferrous) slags are coproducts of iron and steel manufacturing. After cooling and processing, ferrous slags are sold primarily to the construction industry. Data are unavailable on actual U.S. ferrous slag production, but it is estimated to have been in the range of 15 to 20 million tons in 2016. Domestic slag sales1 in 2016 amounted to an estimated 18 million tons, valued at about $350 million (ex-plant). Iron (blast furnace) slag accounted for about 47% of the tonnage sold and had a value of about $300 million; about 85% of this value was from sales of granulated slag. Steel slag produced from basic oxygen and electric arc furnaces accounted for the remainder.2 Slag was processed by about 29 companies servicing active iron and steel facilities or reprocessing old slag piles at about 135 processing plants in 31 States; included in this tally are some facilities that grind and sell ground granulated blast furnace slag (GGBFS) based on imported unground feed. Prices listed in the table below are weighted averages (rounded) for iron and steel slags sold for a variety of applications. Actual prices per ton ranged widely in 2016, from a few cents for some steel slags at a few locations to about $110 for some GGBFS. Air-cooled iron slag and steel slag are used primarily as aggregates in concrete (air-cooled iron slag only), asphaltic paving, fill, and road bases; both slag types also can be used as a feed for cement kilns. Almost all GGBFS is used as a partial substitute for portland cement in concrete mixes or in blended cements. Pelletized slag is generally used for lightweight aggregate but can be ground into material similar to GGBFS. Owing to low unit values, most slag types can be shipped only short distances by truck, but rail and waterborne transportation allow for greater distances. Because of much higher unit values, GGBFS can be shipped longer distances, including from overseas. Salient Statistics—United States: 2012 2013 2014 2015 2016e Production (sales)1, 3 16.0 15.5 16.6 17.7 18.0 Imports for consumption4 1.2 1.7 1.8 1.4 2.0 Exports (5) (5) 0.1 (5) (5) Consumption, apparent4, 6 16.0 15.5 16.5 17.7 18.0 Price average value, dollars per ton, f.o.b. plant7 17.00 17.50 19.00 19.50 19.50 Employment, numbere 1,800 1,700 1,700 1,700 1,600 Net import reliance8 as a percentage of apparent consumption 7 11 10 8 11 Recycling: Following removal of metal, slag can be returned to the blast and steel furnaces as ferrous and flux feed, but data on these returns are incomplete. Entrained metal, particularly in steel slag, is routinely recovered during slag processing for return to the furnaces, and is an important revenue source for the slag processors, but data on metal returns are unavailable. Import Sources (2012–15): The dominant imported ferrous slag type is granulated blast furnace slag (mostly unground), but official import data in recent years have included significant tonnages of nonslag materials (such as cenospheres, fly ash, and silica fume) and slags or other residues of various metallurgical industries (such as copper slag) whose unit values are outside the range expected for granulated slag. The official data appear to have underreported the granulated slag imports in some recent years, but likely not in 2011–12. Based on official data, the principal country sources for 2012–15 were Japan, 33%; Canada, 31%; Spain, 16%; Germany, 5%; and other, 15%; however, much of the tonnage from Spain in 2013–14 may in fact have been from Italy, and slag from the Netherlands and Switzerland in 2015 may have been from Germany. Tariff: Item Number Normal Trade Relations 12–31–16 Granulated slag 2618.00.0000 Free. Slag, dross, scale, from manufacture of iron and steel 2619.00.0000 Free. Depletion Allowance: Not applicable. Government Stockpile: None. Prepared by Hendrik G. van Oss [(703) 648–7712, [email protected]]

89 IRON AND STEEL SLAG
Events, Trends, and Issues: The supply of blast furnace slag continues to be problematic in the United States because of the closure and (or) continued idling of a number of active U.S. blast furnaces in recent years, including one in 2015, the lack of construction of new furnaces, and the depletion of old slag piles. Only a limited quantity of locally produced granulated blast furnace slag was available. At yearend 2016, granulation cooling was available at only two active U.S. blast furnaces, down from three in 2014. Installation of granulation cooling was being evaluated at a few blast furnaces, but it was unclear if this would be economic. Pelletized blast furnace slag was in very limited supply (one site only), and it was uncertain if any additional pelletizing capacity was planned. Basic oxygen furnace steel slag from domestic furnaces has become less available recently because of the closure of several integrated iron and steel complexes; thus, the long-term supply of steel slag will be increasingly reliant on electric arc furnaces, which now contribute the majority of U.S. steel production. Where not in short supply, slag (as aggregate) sales to the construction sector tend to fluctuate less than those of natural aggregates. Domestic- and import-supply constraints appear to have limited domestic demand for GGBFS in recent years. Although prices have increased, sales volumes have failed to match the relative increases that have characterized the overall U.S. cement market since 2010. Long-term demand for GGBFS likely will increase because its use in concrete yields a superior product in many applications and reduces the unit carbon dioxide (CO2) emissions footprint of the concrete related to the portland cement (clinker) content. Recent regulations to restrict emissions of CO2 and mercury by coal-fired powerplants, together with some powerplant closures or conversion of others to natural gas, have led to a reduction in the supply of fly ash in some areas, including that of material for use as cementitious additive for concrete. This has the potential to increase future demand for GGBFS, but the availability of material to supply this demand will increasingly depend on imports, either of ground or unground material. Imported slag availability may be constrained by increasing international demand for the same material and because not all granulated slag produced overseas is of high quality. New restrictions on mercury emissions by cement plants may reduce demand for fly ash as a raw material for clinker manufacture, and this could lead to use of air-cooled and steel slags as replacement raw materials. World Mine Production and Reserves: Slag is not a mined material and thus the concept of reserves does not apply to this mineral commodity. Slag production data for the world are unavailable, but it is estimated that global iron slag output in 2016 was on the order of 300 to 360 million tons, and steel slag about 160 to 240 million tons, based on typical ratios of slag to crude iron and steel output. World Resources: Not applicable. Substitutes: In the construction sector, ferrous slags compete with crushed stone and sand and gravel as aggregates, but are far less widely available than the natural materials. As a cementitious additive in blended cements and concrete, GGBFS mainly competes with fly ash, metakaolin, and volcanic ash pozzolans, and to a lesser degree with silica fume. In this respect, GGBFS also competes with portland cement itself. Slags (especially steel slag) can be used as a partial substitute for limestone and some other natural raw materials for clinker (cement) manufacture. Some other metallurgical slags, such as copper slag, can compete with ferrous slags in some specialty markets but are generally in much more restricted supply than ferrous slags. eEstimated. 1Data are from an annual survey of slag processors and pertain to the quantities of processed slag sold rather than that processed or produced during the year. The data exclude any entrained metal that may be recovered during slag processing and then sold separately or returned to iron and, especially, steel furnaces. The data are incomplete regarding slag returns to the furnaces. 2There were very minor sales of open hearth furnace steel slag from stockpiles but no domestic production of this slag type in 2012–16. 3Data include sales of imported granulated blast furnace slag, either after domestic grinding or still unground, and exclude sales of pelletized slag (proprietary but very small). Overall, actual production of blast furnace slag may be estimated as equivalent to 25% to 30% of crude (pig) iron production and steel furnace slag as about 10% to 15% of crude steel output. 4Based on official (U.S. Census Bureau) data. In some years, the official data appear to have understated the true imports; the apparent discrepancy was small for 2012, but may have been nearly 0.4 million tons in 2013 and 2014, depending on whether imports from Italy were mischaracterized as being from Spain or not. The U.S. Geological Survey canvass captures only part of the imported slag. 5Less than 0.05 million tons. 6Although definable as total sales of slag (including those from imported feed) − exports, apparent consumption of slag does not significantly differ from total sales owing to the very small export tonnages. 7Rounded to the nearest $0.50 per ton. 8Defined as imports minus exports.
U.S. Geological Survey, Mineral Commodity Summaries, January 2017

90
IRON ORE1
(Data in million metric tons, usable ore, unless otherwise noted) Domestic Production and Use: In 2016, mines in Michigan and Minnesota shipped 98% of the usable iron ore products in the United—the remaining 2% of domestic iron ore was produced for nonsteel end uses—with an estimated value of $3.4 billion. Nine iron ore mines (seven open pits and two reclamation operations) and two iron metallic plants, including direct-reduced iron (DRI) and iron nugget producers, operated during the year to supply steelmaking raw materials. Each open pit mine site included a concentration plant and a pelletizing plant. A stand-alone pelletizing plant in Indiana used iron ore fines from reclamation plants in Minnesota. The United States was estimated to have produced and consumed 2.0% of the world’s iron ore output. Salient Statistics2—United States: 2012 2013 2014 2015 2016e Production Iron ore 54.7 52.8 56.1 46.1 40.8 Iron metallics 0.4 0.5 2.0 1.4 2.0 Shipments 53.9 53.4 55.0 43.5 43.5 Imports for consumption 5.2 3.2 5.1 4.6 5.2 Exports 11.2 11.0 12.1 7.5 6.6 Consumption: Reported (ore and total agglomerate) 46.9 44.2 44.4 38.5 41.0 Apparent3 46.5 47.1 47.0 39.7 42.8 Value, U.S. dollars per metric ton 116.48 87.42 84.43 81.19 82.41 Stocks, mine, dock, and consuming plant, yearend, excluding byproduct ore 4.44 2.35 4.46 7.86 4.50 Employment, mine, concentrating and pelletizing plant, number 5,420 5,644 6,273 4,802 3,589 Net import reliance4 as a percentage of apparent consumption (iron in ore) E E E E E Recycling: None. See Iron and Steel Scrap. Import Sources (2012–15): Canada, 60%; Brazil, 29%; and other, 11%. Tariff: Item Number Normal Trade Relations 12–31–16 Iron ores and concentrates: Concentrates 2601.11.0030 Free. Coarse ores 2601.11.0060 Free. Other ores 2601.11.0090 Free. Pellets 2601.12.0030 Free. Briquettes 2601.12.0060 Free. Sinter 2601.12.0090 Free. Roasted iron pyrites 2601.20.0000 Free. Depletion Allowance: 15% (Domestic), 14% (Foreign). Government Stockpile: None. Events, Trends, and Issues: U.S. iron ore production decreased in 2016 owing to decreases in steel produced from basic oxygen furnaces, which consume iron ore, and an overall decrease in U.S. steel production from 88.2 million tons in 2014 to 78.9 million tons in 2015 to an estimated 80 million tons in 2016. Continued increases in the share of steel produced from electric arc furnaces, which use steel scrap and DRI, offset steel production requiring iron ore. Despite modest increases in the price of seaborne iron ore during the year, major price declines in recent years have not been offset. In October 2016, the spot price for iron ore fines (62% iron content) imported into China (cost and freight into Tianjin port) was $58.02 per ton, an increase from $52.74 in October 2015, but still well below $80.09 and $132.57, prices seen in October 2014 and 2013, respectively. During the year, six iron ore mines in the United States had either been idled, reduced production, or closed permanently. As of November, one open pit mine and its associated facilities in Minnesota remained indefinitely idled with no plans to reopen. In Michigan, an open pit mine and its associated facilities were permanently shut down at the end of August 2016. Two iron ore pellet operations and associated mines resumed operations in Minnesota during the year after being idled since the third quarter of 2015. One company, whose subsidiary operated four iron ore Prepared by Christopher A. Tuck [(703) 648–4912, [email protected]]

91 IRON ORE
tailings reclamation facilities in Minnesota and one pellet plant in Indiana, was released from its contract with the subsidiary in bankruptcy court in October 2016. The ruling effectively shut down the remaining operations for the company, which had already idled three of its facilities in mid-year 2015 and early 2016, with no plans to reopen any facilities. A 2.5-million-ton-per-year DRI plant was temporarily idled in January 2016; the plant underwent maintenance during the shutdown and was expected to reopen at a higher production rate. A 2-million-ton-per-year hot-briquetted iron facility in Texas commenced operations in late October 2016. Construction on a 7-million-ton-per-year iron ore project in Minnesota ceased after the operating company filed for bankruptcy. The company was estimated to owe $140 million to the State of Minnesota and vendors, prompting the State to rescind mineral rights for the project; however, the bankruptcy court temporarily blocked the order, allowing the company until February 2017 to develop a financial plan to finish the project and pay its creditors. Projects aimed at increasing production continued among the leading iron ore companies in Australia and Brazil, although production guidance for 2016 was reduced in the third quarter of 2016. In India, mining bans were lifted, prompting an increase in iron ore production. Imports of iron ore into China, the world’s leading consumer, were forecast to decrease by 33 million tons in 2016. Following a 3% decrease in 2015, global steel consumption was forecast to increase slightly to 1,500 million tons in 2016 and 1,510 million tons in 2017. World Mine Production and Reserves: Reserves for the United States, Australia, Canada, China, and South Africa were revised based on Government and industry information. In the United States, reserves were adjusted to reflect the closure of mines. Mine production Usable ore Iron content Reserves5 2015 2016e 2015 2016e Crude ore Iron content United States 46 41 29 26 3,000 790 Australia 817 825 486 491 52,000 23,000 Brazil 397 391 257 254 23,000 12,000 Canada 46 48 28 29 6,000 2,300 China6 375 353 232 219 21,000 7,200 India 156 160 96 98 8,100 5,200 Iran 27 26 13 11 2,700 1,500 Kazakhstan 21 21 12 12 2,500 900 Russia 101 100 61 60 25,000 14,000 South Africa 73 60 46 38 1,200 770 Sweden 25 25 15 15 3,500 2,200 Ukraine 67 58 40 35 76,500 72,300 Other countries 132 120 82 75 18,000 9,500 World total (rounded) 2,280 2,230 1,400 1,360 170,000 82,000 World Resources: U.S. resources are estimated to be 110 billion tons of iron ore containing about 27 billion tons of iron. U.S. resources are mainly low-grade taconite-type ores from the Lake Superior district that require beneficiation and agglomeration prior to commercial use. World resources are estimated to be greater than 800 billion tons of crude ore containing more than 230 billion tons of iron. Substitutes: The only source of primary iron is iron ore, used directly as direct-shipping ore or converted to briquettes, concentrates, DRI, iron nuggets, pellets, or sinter. DRI, iron nuggets, and scrap are extensively used for steelmaking in electric arc furnaces and in iron and steel foundries. Technological advancements have been made, which allow hematite to be recovered from tailings basins and pelletized. eEstimated. E Net exporter. 1Data are for iron ore used as a raw material in steelmaking unless otherwise noted. See also Iron and Steel and Iron and Steel Scrap. 2Salient statistics are for all forms of iron ore used in steelmaking, except iron metallics, which include direct-reduced iron, hot-briquetted iron, and iron nuggets. Iron metallics production is listed separately and based on nondomestic iron ore consumption. 3Defined as production + imports – exports + adjustments for industry stock changes. 4Defined as imports – exports + adjustments for industry stock changes. 5See Appendix C for resource and reserve definitions and information concerning data sources. 6Production reported for China in 2015 and 2016 were on a usable ore basis, with iron content calculated from the useable ore. Previously, crude ore production for China had been reported and footnoted as such. 7For Ukraine, reserves consist of the A+B categories of the former Soviet Union’s reserves classification system.
U.S. Geological Survey, Mineral Commodity Summaries, January 2017

92
IRON OXIDE PIGMENTS
(Data in metric tons unless otherwise noted) Domestic Production and Use: Iron oxide pigments (IOPs) were mined by three companies in three States in the United States. Production, which was withheld to avoid disclosing company proprietary data, increased in 2016 from that of 2015. Six companies, including the three producers of natural IOPs, processed and sold about 55,000 tons of finished natural and synthetic IOPs with an estimated value of $78 million, significantly below the sales peak of 88,100 tons in 2007. About 36% of natural and synthetic finished IOPs were used in concrete and other construction materials, 29% in coatings and paints, 14% in foundry uses, 5% in animal food, 4% in industrial chemicals, 2% in glass and ceramics, 1% in fertilizer, and 9% in other uses. Salient Statistics—United States: 2012 2013 2014 2015 2016e Mine production, crude W W W W W Sold or used, finished natural and synthetic IOP 48,400 47,200 45,300 53,500 55,000 Imports for consumption 151,000 165,000 175,000 176,000 175,000 Exports, pigment grade 8,950 8,170 8,790 8,930 12,000 Consumption, apparent1 190,000 204,000 212,000 221,000 218,000 Price, average value, dollars per kilogram2 1.61 1.60 1. 58 1.46 1.46 Employment, mine and mill 55 50 40 40 50 Net import reliance3 as a percentage of apparent consumption >50 >50 >70 >70 >70 Recycling: None. Import Sources (2012–15): Natural: Cyprus, 63%; France, 16%; Austria, 11%; Spain 6%; and other, 4%. Synthetic: China, 52%; Germany, 26%; Canada, 7%; Brazil, 7%; and other, 8%. Tariff: Item Number Normal Trade Relations 12–31–16 Natural: Micaceous iron oxides 2530.90.2000 2.9% ad val. Earth colors 2530.90.8015 Free. Iron oxides and hydroxides containing 70% or more by weight Fe2O3: Synthetic: Black 2821.10.0010 3.7% ad val. Red 2821.10.0020 3.7% ad val. Yellow 2821.10.0030 3.7% ad val. Other 2821.10.0040 3.7% ad val. Earth colors 2821.20.0000 5.5% ad val. Depletion Allowance: 14% (Domestic and foreign). Government Stockpile: None. Events, Trends, and Issues: In 2016, domestic production of crude natural IOPs increased significantly and production and sales of finished natural and synthetic IOPs rose by 3%. In Europe, consumption of IOPs likely declined, mostly owing to continued sluggishness in the region’s construction industry. In Asia, growth continued and consumption of IOPs increased. In the United States, residential construction, in which IOPs are commonly used to color concrete block and brick, ready-mixed concrete, and roofing tiles, increased in the first half of 2016. Housing starts and completions rose by about 13% and 14%, respectively, compared with those of the same period in 2015. Spending on residential construction increased by more than 6% during the first 8 months of 2016 compared with the same period in 2015. Spending on nonresidential construction, which accounted for about 60% of construction expenditures, increased by about 4% in the first 8 months of 2016 compared with the same period in 2015. Increased residential and nonresidential construction could lead to an increase in IOP consumption in this sector. Prepared by Arnold O. Tanner [(703) 648–4791, [email protected]]

93 IRON OXIDE PIGMENTS
Exports of pigment-grade IOPs increased by about 90% during the first 8 months of 2016 compared with the same period in 2015, mostly owing to a significant increase in exports to Belgium; more than 80% of pigment-grade IOPs went to Belgium, Mexico, China, and the United Kingdom, in descending order of quantity. Exports of other grades of iron oxides and hydroxides, more than three times those of pigment grade, were virtually unchanged during the first 8 months of 2016 compared with the same period in 2015. About 90% of exports of other grades of iron oxides and hydroxides went to China, Spain, Canada, and Mexico, in descending order of quantity. Total imports of natural and synthetic IOPs were virtually unchanged during 2016 compared with those in 2015. A company in Utah produced a high-purity “advanced natural” iron oxide, mostly composed of goethite and hematite, and promoted its transparent iron oxide products to the wood stain market and other natural IOP products to the paints and coatings industries. The company also marketed iron oxide products to the energy and biogas industries as desulfurization catalysts to compete with costly synthetic iron oxide catalysts commonly used in scavenging the highly corrosive hydrogen sulfide gas produced in the anaerobic conversion of biomass. In May, a leading Texas-based specialty chemical company began production at its new synthetic IOP production plant in Augusta, GA. The plant has the capacity to produce 30,000 tons per year of yellow, red, and black IOPs and is the first new IOP plant built in the United States in about 35 years. Globally, two other leading producers of finished natural and synthetic IOPs completed construction of synthetic IOP production plants in Tongling, Anhui Province, and Ningbo, Zhejiang Province, China. One began production in the latter half of 2015 with an additional 20,000 tons per year of high-performance IOPs capacity added in 2016. Both plants employ advanced processing techniques that use enhanced water and waste gas treatment. World Mine Production and Reserves: Mine production Reserves4 2015 2016e United States W W Moderate Austria (micaceous IOP) 3,500 3,500 NA Cyprus (umber) 4,000 3,500 Moderate France 1,000 1,000 NA Germany5 200,000 200,000 Moderate India (ochre) 2,200,000 2,200,000 55,000,000 Pakistan (ocher) 30,000 35,000 Moderate Spain (ocher and red iron oxide) 16,000 16,000 Large World total 6NA 6NA Large World Resources: Domestic and world resources for production of IOPs are adequate. Adequate resources are available worldwide for the manufacture of synthetic IOPs. Substitutes: Milled IOPs are probably the most commonly used natural minerals for pigments. Because IOPs are color stable, low cost, and nontoxic, they can be economically used for imparting black, brown, red, and yellow coloring in large and relatively low-value applications. Other minerals may be used as colorants, but they generally cannot compete with IOPs because of their higher costs and more limited availability. Synthetic IOPs are widely used as colorants and compete with natural IOPs in many color applications. Organic colorants are used for some colorant applications, but many of the organic compounds fade over time from exposure to sunlight. eEstimated. NA Not available. W Withheld to avoid disclosing company proprietary data. 1Defined as sold or used finished natural and synthetic IOPs + imports – exports. 2Unit value for finished iron oxide pigments sold or used by U.S. producers. 3Defined as imports – exports. 4See Appendix C for resource and reserve definitions and information concerning data sources. 5Includes natural and synthetic iron oxide pigment. 6A significant number of other countries, including Azerbaijan, China, Honduras, Italy, Kazakhstan, Russia, South Africa, Turkey, and Ukraine, are thought to produce IOPs, but output is not reported and no basis is available to make reliable estimates of production.
U.S. Geological Survey, Mineral Commodity Summaries, January 2017

94
KYANITE AND RELATED MINERALS
(Data in thousand metric tons unless otherwise noted) Domestic Production and Use: In Virginia, one firm with integrated mining and processing operations produced kyanite from two hard-rock open pit mines and mullite by calcining kyanite. Two other companies, one in Alabama and another in Georgia, produced synthetic mullite from materials mined from four sites. Each company sourced materials from one site in Alabama and one site in Georgia; these data are withheld to avoid disclosing company proprietary data. Commercially produced synthetic mullite is made by sintering or fusing such feedstock materials as kyanite or bauxitic kaolin. Natural mullite occurrences typically are rare and uneconomic to mine. Of the kyanite-mullite output, 90% was estimated to have been used in refractories and 10% in other uses, including abrasive products such as motor vehicle brake shoes and pads and grinding and cutting wheels; ceramic products, such as electrical insulating porcelains, sanitaryware, and whiteware; foundry products and precision casting molds; and other products. An estimated 60% to 65% of the refractory usage was consumed by the iron and steel industries, and the remainder was used by industries that manufacture chemicals, glass, nonferrous metals, and other materials. Andalusite was commercially mined from an andalusite-pyrophyllite-sericite deposit in North Carolina and processed as a blend of primarily andalusite for use by producers of refractories in making firebrick. Salient Statistics—United States: 2012 2013 2014 2015 2016e Production: Mine 199 1110 189 1108 100 Synthetic mullite W W W W W Imports for consumption (andalusite) 3 4 4 12 2 Exports (kyanite) 36 42 40 40 35 Consumption, apparent W W W W W Price, average, dollars per metric ton:2 U.S. kyanite, raw concentrate 340 300 260 270 300 U.S. kyanite, calcined 510 450 370 410 450 Andalusite, Transvaal, South Africa 300 350 340 290 300 Employment, kyanite mine, office, and plant, numbere 125 135 140 155 150 Employment, mullite plant, office, and plant, numbere 230 240 260 250 240 Net import reliance3 as a percentage of apparent consumption E E E E E Recycling: Insignificant. Import Sources (2012–15): South Africa, 75%; Peru, 19%; France, 4%; and other, 2%. Tariff: Item Number Normal Trade Relations 12–31–16 Andalusite, kyanite, and sillimanite 2508.50.0000 Free. Mullite 2508.60.0000 Free. Depletion Allowance: 22% (Domestic), 14% (Foreign). Government Stockpile: None. Events, Trends, and Issues: Crude steel production in the United States, which ranked fourth in the world, decreased slightly in the first 7 months of 2016 compared with that of the same period in 2015, indicating a minimal to no change in consumption of kyanite-mullite refractories if this trend continues. Total world steel production decreased slightly during the first 8 months of 2015 compared with a 2.3% decrease in the same period in 2015 from that of 2014. Of the total world refractories market, which was estimated to be approximately 40 million metric tons, crude steel manufacturing consumed more than 70% of refractories production. Prepared by Arnold O. Tanner [(703) 648–4791, [email protected]]

95 KYANITE AND RELATED MINERALS
The decrease in world steel production during the first 7 months of 2016 was, in part, the result of a deceleration in growth in China from a slowing of its construction activities and in its manufacturing and automotive sectors, a continued sluggish economy in Europe, and slightly lower steel demand in the United States. Although steel production and consumption was expected to be slightly lower in 2016, gradual increases were expected in 2017. Andalusite and mullite could receive increasing consideration as alternative aluminosilicate refractory minerals to refractory bauxite; a decreasing availability of inexpensive refractory-grade bauxite from China, which accounted for about three-quarters of market share worldwide, has continued. Although experiencing an economic slowdown, China is expected to continue to have an economic growth rate of 6% and to be the largest market for refractories, accounting for the majority of global demand. Slowing, but still above-average, growth is expected in India and other portions of Asia. Eastern Europe, North America, and Western Europe are expected to have sluggish but continuing refractory demand because of their large industrial bases. The economies of North America and Europe are expected to increase in 2017 with recovery in manufacturing and steel production, but may lag behind the worldwide average in the longer term with steel production increasing in India and shifting to less-developed countries, such as Indonesia and Vietnam. Demand for refractories in iron and steel production is expected to have greater increases in countries with higher rates of growth in steel production. Increased demand also is anticipated for refractories used to produce other metals and in the industrial mineral market because of increasing production of cement, ceramics, glass, and other mineral products. Andalusite projects in Peru continued to progress. One facility increased production capacity by 10% and planned to increase by about 10% more in 2017. At another andalusite project in Peru, the company continued exploration and worked on construction of the processing operation as it sought a joint-venture investment partner. Production was anticipated to begin by 2017. Large resources of kyanite were discovered in 2015 in Murmansk in the Kola Peninsula region of Russia, but currently are considered uneconomic, owing to their distance from market. World Mine Production and Reserves: Mine production Reserves4 2015 2016e United States (kyanite) 108 100 Large India (kyanite and sillimanite) 65 65 1,600 Peru (andalusite) 35 35 NA South Africa (andalusite) 200 190 NA Other countries — — NA World total (rounded) 5408 5390 NA World Resources: Large resources of kyanite and related minerals are known to exist in the United States. The chief resources are in deposits of micaceous schist and gneiss, mostly in the Appalachian Mountains and in Idaho. Other resources are in aluminous gneiss in southern California. These resources are not economic to mine at present. The characteristics of kyanite resources in the rest of the world are thought to be similar to those in the United States. Significant resources of andalusite are known to exist in China, France, Peru, and South Africa; kyanite resources have been identified in Brazil, India, and Russia; and sillimanite has been found in India. Substitutes: Two types of synthetic mullite (fused and sintered), superduty fire clays, and high-alumina materials are substitutes for kyanite in refractories. Principal raw materials for synthetic mullite are bauxite, kaolin and other clays, and silica sand. eEstimated. E Net exporter. NA Not available. W Withheld to avoid disclosing company proprietary data. — Zero. 1Source: Virginia Department of Mines, Minerals and Energy. 2Source: Average of prices reported in Industrial Minerals. 3Defined as imports – exports. 4See Appendix C for resource and reserve definitions and information concerning data sources. 5In addition to the countries listed, France continued production of andalusite and Brazil and China produced kyanite and related minerals. Output is not reported quantitatively, and no reliable basis is available for estimation of output levels.
U.S. Geological Survey, Mineral Commodity Summaries, January 2017

96
LEAD
(Data in thousand metric tons of lead content unless otherwise noted) Domestic Production and Use: Six lead mines in Missouri, plus five mines in Alaska, Idaho, and Washington that produced lead as a coproduct, accounted for all domestic lead mine production. The value of the lead in concentrates mined in 2016, based on the average North American Market price for refined lead, was about $665 million. Nearly all lead mine production was exported since the last primary refinery closed in 2013. The 11 secondary refineries in nine States that had capacities of at least 30,000 tons per year of refined lead accounted for more than 95% of the secondary lead produced in 2016. It was estimated that the lead-acid battery industry accounted for more than 85% of reported U.S. lead consumption during 2016. Lead-acid batteries were primarily used as starting-lighting-ignition (SLI) batteries for automobiles, as industrial-type batteries for standby power for computer and telecommunications networks, and for motive power. During the first 8 months of 2016, 83.6 million lead-acid automotive batteries were shipped by North American producers, a slight increase from those shipped in the same period of 2015. Salient Statistics—United States: 2012 2013 2014 2015 2016e Production: Mine, lead in concentrates 345 340 379 367 335 Primary refinery 111 114 — — — Secondary refinery, old scrap 1,110 1,150 1,020 1,050 1,070 Imports for consumption: Lead in concentrates (1) (1) (1) (1) (1) Refined metal, wrought and unwrought 349 485 593 521 525 Exports: Lead in concentrates 211 210 357 349 320 Refined metal, wrought and unwrought 47 42 56 56 50 Consumption: Reported 1,350 1,390 1,510 1,560 1,580 Apparent2 1,500 1,710 1,560 1,540 1,540 Price, average, cents per pound: North American producer 114 NA NA NA NA North American market NA 110 106 91.2 90.0 London Metal Exchange 93.5 97.2 95.0 81.0 81.0 Stocks, metal, producers, consumers, yearend 72 70 66 49 55 Employment: Mine and mill (average), number3 1,490 1,690 1,760 1,840 1,800 Primary smelter, refineries 290 290 — — — Secondary smelters, refineries 2,000 2,000 1,800 1,800 1,850 Net import reliance4 as a percentage of apparent consumption, refined lead 19 26 35 31 30 Recycling: In 2016, about 1.07 million tons of secondary lead was produced, an amount equivalent to 69% of apparent domestic consumption. Nearly all secondary lead was recovered from old scrap, mostly lead-acid batteries. Import Sources (2012–15): Metal, wrought and unwrought: Canada, 51%; Mexico, 20%; Republic of Korea and Peru, 5% each; and other, 19%. Tariff: Item Number Normal Trade Relations5 12–31–16 Lead ores and concentrates 2607.00.0020 1.1¢/kg on lead content. Refined lead 7801.10.0000 2.5% ad val. Antimonial lead 7801.91.0000 2.5% ad val. Alloys of lead 7801.99.9030 2.5% ad val. Depletion Allowance: 22% (Domestic), 14% (Foreign). Government Stockpile: None. Events, Trends, and Issues: During the first 9 months of 2016, the average London Metal Exchange (LME) cash price for lead was $0.81 per pound, slightly less than that in the same period of 2015. The average monthly LME price ranged between $0.75 and $0.82 per pound during the first half of 2016 and increased through the third quarter of the year to $0.88 per pound in September. Global LME lead warehouse stocks were 190,250 tons at the end of September, slightly less than those at yearend 2015. Prepared by David E. Guberman [Contact Amy C. Tolcin, (703) 648–4940, [email protected]]
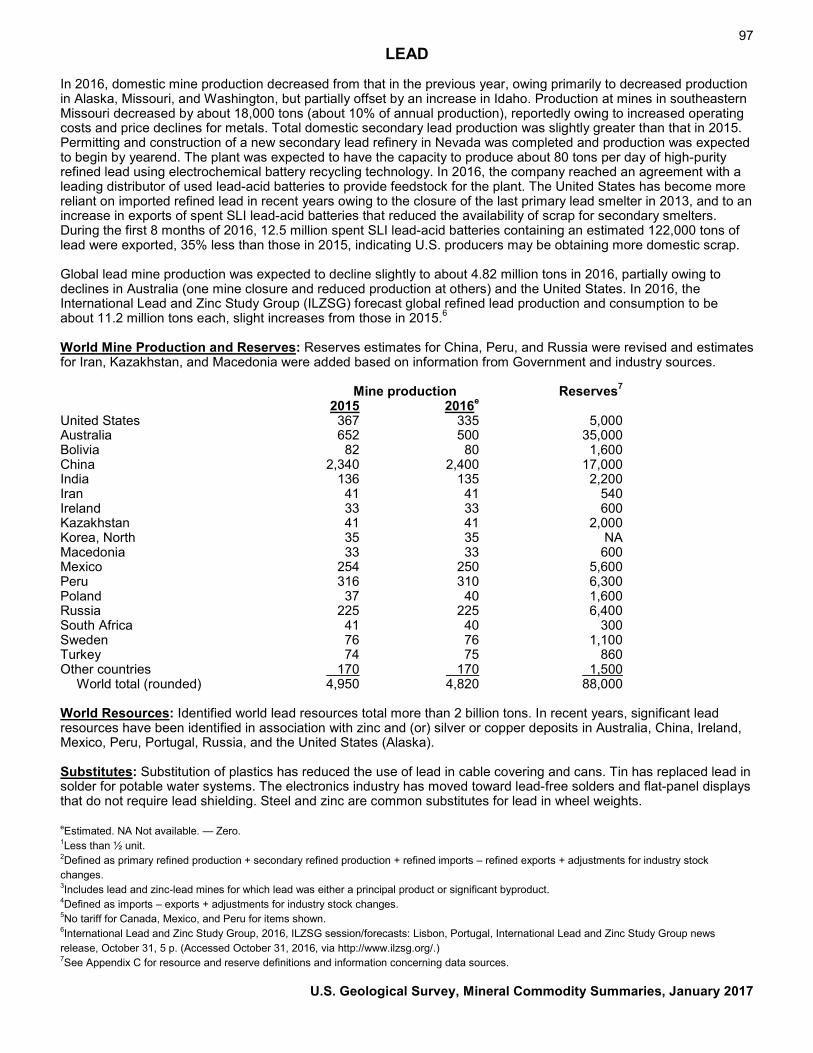
97 LEAD
In 2016, domestic mine production decreased from that in the previous year, owing primarily to decreased production in Alaska, Missouri, and Washington, but partially offset by an increase in Idaho. Production at mines in southeastern Missouri decreased by about 18,000 tons (about 10% of annual production), reportedly owing to increased operating costs and price declines for metals. Total domestic secondary lead production was slightly greater than that in 2015. Permitting and construction of a new secondary lead refinery in Nevada was completed and production was expected to begin by yearend. The plant was expected to have the capacity to produce about 80 tons per day of high-purity refined lead using electrochemical battery recycling technology. In 2016, the company reached an agreement with a leading distributor of used lead-acid batteries to provide feedstock for the plant. The United States has become more reliant on imported refined lead in recent years owing to the closure of the last primary lead smelter in 2013, and to an increase in exports of spent SLI lead-acid batteries that reduced the availability of scrap for secondary smelters. During the first 8 months of 2016, 12.5 million spent SLI lead-acid batteries containing an estimated 122,000 tons of lead were exported, 35% less than those in 2015, indicating U.S. producers may be obtaining more domestic scrap. Global lead mine production was expected to decline slightly to about 4.82 million tons in 2016, partially owing to declines in Australia (one mine closure and reduced production at others) and the United States. In 2016, the International Lead and Zinc Study Group (ILZSG) forecast global refined lead production and consumption to be about 11.2 million tons each, slight increases from those in 2015.6
World Mine Production and Reserves: Reserves estimates for China, Peru, and Russia were revised and estimates for Iran, Kazakhstan, and Macedonia were added based on information from Government and industry sources. Mine production Reserves7 2015 2016e United States 367 335 5,000 Australia 652 500 35,000 Bolivia 82 80 1,600 China 2,340 2,400 17,000 India 136 135 2,200 Iran 41 41 540 Ireland 33 33 600 Kazakhstan 41 41 2,000 Korea, North 35 35 NA Macedonia 33 33 600 Mexico 254 250 5,600 Peru 316 310 6,300 Poland 37 40 1,600 Russia 225 225 6,400 South Africa 41 40 300 Sweden 76 76 1,100 Turkey 74 75 860 Other countries 170 170 1,500 World total (rounded) 4,950 4,820 88,000 World Resources: Identified world lead resources total more than 2 billion tons. In recent years, significant lead resources have been identified in association with zinc and (or) silver or copper deposits in Australia, China, Ireland, Mexico, Peru, Portugal, Russia, and the United States (Alaska). Substitutes: Substitution of plastics has reduced the use of lead in cable covering and cans. Tin has replaced lead in solder for potable water systems. The electronics industry has moved toward lead-free solders and flat-panel displays that do not require lead shielding. Steel and zinc are common substitutes for lead in wheel weights.
eEstimated. NA Not available. — Zero. 1Less than ½ unit. 2Defined as primary refined production + secondary refined production + refined imports – refined exports + adjustments for industry stock changes. 3Includes lead and zinc-lead mines for which lead was either a principal product or significant byproduct. 4Defined as imports – exports + adjustments for industry stock changes. 5No tariff for Canada, Mexico, and Peru for items shown. 6International Lead and Zinc Study Group, 2016, ILZSG session/forecasts: Lisbon, Portugal, International Lead and Zinc Study Group news release, October 31, 5 p. (Accessed October 31, 2016, via http://www.ilzsg.org/.) 7See Appendix C for resource and reserve definitions and information concerning data sources.
U.S. Geological Survey, Mineral Commodity Summaries, January 2017

98
LIME1
(Data in thousand metric tons unless otherwise noted) Domestic Production and Use: In 2016, an estimated 17 million tons (19 million short tons) of quicklime and hydrate was produced (excluding independent commercial hydrators2), valued at about $2.1 billion. At yearend, 29 companies were producing lime, which included 19 companies with commercial sales and 10 companies that produced lime strictly for internal use (for example, sugar companies). These companies had 77 primary lime plants (plants operating lime kilns) in 29 States and Puerto Rico. The five leading U.S. lime companies produced quicklime or hydrate in 24 States and accounted for 76% of U.S. lime production. Principal producing States were, in descending order of production, Missouri, Alabama, Kentucky, Ohio, and Texas. Major markets for lime were, in descending order of consumption, steelmaking, flue gas desulfurization, construction, water treatment, mining, paper and pulp, and precipitated calcium carbonate (PCC). Salient Statistics—United States: 2012 2013 2014 2015 2016e Production3 18,800 19,200 19,500 18,300 17,000 Imports for consumption 468 394 414 391 350 Exports 212 270 320 346 260 Consumption, apparent4 19,100 19,300 19,600 18,300 17,000 Quicklime average value, dollars per ton at plant 115.40 117.80 119.10 120.00 120.00 Hydrate average value, dollars per ton at plant 136.90 140.60 142.20 146.40 144.00 Employment, mine and plant, number 5,100 5,100 5,100 NA NA Net import reliance5 as a percentage of apparent consumption 1 1 1 <1 <1 Recycling: Large quantities of lime are regenerated by paper mills. Some municipal water-treatment plants regenerate lime from softening sludge. Quicklime is regenerated from waste hydrated lime in the carbide industry. Data for these sources were not included as production in order to avoid duplication. Import Sources (2012–15): Canada, 95%; Mexico, 4%; and other, 1%. Tariff: Item Number Normal Trade Relations 12–31–16 Calcined dolomite 2518.20.0000 3% ad val. Quicklime 2522.10.0000 Free. Slaked lime 2522.20.0000 Free. Hydraulic lime 2522.30.0000 Free. Depletion Allowance: Limestone produced and used for lime production, 14% (Domestic and foreign). Government Stockpile: None. Events, Trends, and Issues: In 2016, domestic lime production was expected to decrease by about 5%, owing primarily to lesser amounts of lime needed for the desulfurization of flue gases in coal-fired utility powerplants. During the first 9 months of 2016, the amount of coal used to fuel utility powerplants was 16% less than that consumed during the same period in 2015. One existing lime plant was refurbished in Winchester, VA, and reopened in May of 2016. The work comprised the installation of two new natural-gas-fired vertical-shaft kilns. Another company continued with its construction project in Pennsylvania to install a new natural-gas-fired vertical-shaft kiln. Low interest rates and low energy prices have provided opportunities for lime companies to add new capacity or replace existing old capacity with natural-gas-fired kilns. In June 2016, one company decided to shut down its quicklime and PCC processes at its plant in Tacoma, WA; the remainder of the plant was converted to a bulk hydrate, pulverized limestone, and terminal operation. PCC is used in many industrial applications, including the following: as filler and coating pigment for premium-quality paper products; to manufacture vinyl siding and fencing; and to make calcium-based antacid tablets and liquids. One sugar cooperative closed its sugar beet processing facility in Torrington, WY, towards yearend 2016; sugar production was shifted to the company’s existing plants in Colorado and Nebraska. In sugar refining, milk-of-lime is used to raise the pH of the product stream to precipitate out colloidal impurities. The lime itself is then removed by reaction with carbon dioxide to precipitate calcium carbonate. Prepared by Lisa A. Corathers [(703) 648–4973, [email protected]]

99 LIME
World Lime Production and Limestone Reserves: Production6 Reserves7 2015 2016e United States 18,300 17,000 Adequate for all Australia 1,990 2,000 countries listed. Belgium 1,400 1,400 Brazil 8,300 8,300 Bulgaria 1,500 1,500 Canada (shipments) 1,850 1,800 China 230,000 230,000 Czech Republic 1,000 1,000 France 3,800 3,700 Germany 6,400 6,400 India 16,000 16,000 Iran 2,800 2,800 Italy8 3,500 3,500 Japan (quicklime only) 7,340 7,300 Korea, Republic of 5,100 5,100 Malaysia (sales) 1,500 1,500 Poland 1,940 1,900 Romania 1,910 1,700 Russia (industrial and construction) 11,000 11,000 South Africa (sales) 1,120 1,100 Spain (sales) 1,800 1,900 Turkey (sales) 4,200 4,300 Ukraine 2,720 2,800 United Kingdom 1,600 1,400 Other countries 13,700 13,600 World total (rounded)9 350,000 350,000 World Resources: Domestic and world resources of limestone and dolomite suitable for lime manufacture are very large. Substitutes: Limestone is a substitute for lime in many applications, such as agriculture, fluxing, and sulfur removal. Limestone, which contains less reactive material, is slower to react and may have other disadvantages compared with lime, depending on the application; however, limestone is considerably less expensive than lime. Calcined gypsum is an alternative material in industrial plasters and mortars. Cement, cement kiln dust, fly ash, and lime kiln dust are potential substitutes for some construction uses of lime. Magnesium hydroxide is a substitute for lime in pH control, and magnesium oxide is a substitute for dolomitic lime as a flux in steelmaking. eEstimated. NA Not available. 1Data are for quicklime, hydrated lime, and refractory dead-burned dolomite. Includes Puerto Rico. 2Excludes independent commercial hydrators that purchase quicklime for hydration to avoid double counting quicklime production. 3Sold or used by producers. 4Includes some double counting based on nominal, undifferentiated reporting of company export sales as U.S. production. 5Defined as imports – exports. 6Only countries that produced 1 million tons of lime or more are listed separately. 7See Appendix C for resource and reserve definitions and information concerning data sources. 8Includes hydraulic lime. 9World production data are rounded to no more than two significant digits when estimated. Data reported by countries such as Canada, Japan, and the United States are rounded to three significant digits. Data may not add to totals shown.
U.S. Geological Survey, Mineral Commodity Summaries, January 2017

100
LITHIUM
(Data in metric tons of lithium content unless otherwise noted) Domestic Production and Use: The only lithium production in the United States was from a brine operation in Nevada. Two companies produced a wide range of downstream lithium compounds in the United States from domestic or imported lithium carbonate, lithium chloride, and lithium hydroxide. Domestic production was not published to avoid disclosing company proprietary data. Although lithium markets vary by location, global end-use markets are estimated as follows: batteries, 39%; ceramics and glass, 30%; lubricating greases, 8%; continuous casting mold flux powders and polymer production, 5% each; air treatment, 3%; and other uses, 10%. Lithium consumption for batteries has increased significantly in recent years because rechargeable lithium batteries are used extensively in the growing market for portable electronic devices and increasingly are used in electric tools, electric vehicles, and grid storage applications. Lithium minerals were used directly as ore concentrates in ceramics and glass applications. Salient Statistics—United States: 2012 2013 2014 2015 2016e Production W 1870 W W W Imports for consumption 2,760 2,210 2,120 2,750 3,280 Exports 1,300 1,230 1,420 1,790 1,550 Consumption, apparent W 1,800 W W W Price, annual average, battery-grade lithium carbonate, dollars per metric ton2 6,060 6,800 6,690 6,500 7,400 Employment, mine and mill, number 70 70 70 70 70 Net import reliance3 as a percentage of apparent consumption >50 >50 >50 >25 >50 Recycling: Historically, lithium recycling has been insignificant but has increased steadily owing to the growth in consumption of lithium batteries. One domestic company has recycled lithium metal and lithium-ion batteries since 1992 at its facility in British Columbia, Canada. In 2009, the U.S. Department of Energy awarded $9.5 million to the company to construct the first U.S. recycling facility for lithium-ion vehicle batteries and, in 2015, the facility in Lancaster, OH, began operation. Import Sources (2012–15): Chile, 57%; Argentina, 40%; China, 2%; and other, 1%. Tariff: Item Number Normal Trade Relations 12–31–16 Other alkali metals 2805.19.9000 5.5% ad val. Lithium oxide and hydroxide 2825.20.0000 3.7% ad val. Lithium carbonate: U.S.P. grade 2836.91.0010 3.7% ad val. Other 2836.91.0050 3.7% ad val. Depletion Allowance: 22% (Domestic), 14% (Foreign). Government Stockpile: The Defense Logistics Agency Strategic Materials planned to acquire 300 kilograms of lithium cobalt oxide and 1,080 kilograms of lithium nickel cobalt aluminum oxide in FY 2016.
Stockpile Status—9–30–164 Disposal Plan Disposals Material Inventory FY 2016 FY 2016 Lithium cobalt oxide (kilograms, gross weight) 241 — — Lithium nickel cobalt aluminum oxide (kilograms, gross weight) 990 — — Events, Trends, and Issues: Worldwide lithium production increased by an estimated 12% in 2016 in response to increased lithium demand for battery applications. Production in Argentina increased almost 60%, primarily owing to a new brine operation; the leading Argentine producer also increased production. A producer in Chile reported that its production increased by 20%. Two small Australian spodumene operations, one new and one inactive since 2013, planned to begin commercial concentrate production by yearend. Worldwide lithium production capacity was reported to be 49,400 tons in 2015; capacity utilization was estimated to be 64% in 2015 and 71% in 2016. Based on average projections by producers and industry analysists of about 14% growth worldwide, consumption of lithium in 2016 is Prepared by Brian W. Jaskula [(703) 648–4908, [email protected]]

101 LITHIUM
projected to be about 37,800 tons, up from 33,300 tons in 2015. Despite available capacity, spot lithium carbonate prices in China increased up to 300%, briefly exceeding $20,000 per ton, based on an acute, but likely temporary, shortage of imported spodumene from Australia. The rest of the world experienced spot price increases of approximately 40% to 60% from those of 2015, owing to lithium demand moderately exceeding supply. For large fixed contracts, Industrial Minerals reported a 14% increase in average U.S. lithium carbonate prices. Two brine operations in Chile and a spodumene operation in Australia accounted for the majority of world lithium production. One of the producers in Chile received Government approval to increase its brine extraction from the Salar de Atacama. The two lithium producers in Chile and the leading lithium producer in Argentina each announced plans to further expand lithium hydroxide production capacity to meet increasing demand from the electric vehicle industry. The joint owners of the leading spodumene operation in Australia announced plans to increase capacity and one owner began construction of a lithium hydroxide plant in Australia. To diversify supply, Chile’s two lithium producers each announced planned joint ventures with companies in Argentina. Lithium supply security has become a top priority for technology companies in the United States and Asia. Strategic alliances and joint ventures between technology companies and exploration companies continue to be established to ensure a reliable, diversified supply of lithium for battery suppliers and vehicle manufacturers. Brine operations were under development in Argentina, Bolivia, Chile, China, and the United States; spodumene mining operations were under development in Australia, Canada, China, and Finland; a jadarite mining operation was under development in Serbia; and a lithium-clay mining operation was under development in Mexico. Additional exploration for lithium continued, with numerous claims having been leased or staked worldwide. A leading electric car manufacturer was constructing a lithium-ion battery plant in Nevada capable of producing up to 500,000 lithium-ion vehicle batteries per year. The plant was expected to be vertically integrated, capable of producing finished battery packs directly from raw materials by 2018. World Mine Production and Reserves: The reserves estimate for Australia has been revised based on new information from a Government source. Mine production Reserves5 2015 2016e United States W W 38,000 Argentina 3,600 5,700 2,000,000 Australia 14,100 14,300 1,600,000 Brazil 200 200 48,000 Chile 10,500 12,000 7,500,000 China 2,000 2,000 3,200,000 Portugal 200 200 60,000 Zimbabwe 900 900 23,000 World total (rounded) 631,500 635,000 14,000,000 World Resources: Owing to continuing exploration, lithium resources have increased substantially worldwide. Identified lithium resources in the United States, from continental brines, geothermal brines, hectorite, oilfield brines, and pegmatites, have been revised to 6.9 million tons. Identified lithium resources in other countries have been revised to approximately 40 million tons. Identified lithium resources in Argentina and Bolivia are approximately 9 million tons each and in major producing countries are: Australia, more than 2 million tons; Chile, more than 7.5 million tons; and China, approximately 7 million tons. Canada’s lithium resources are about 2 million tons. Congo (Kinshasa), Russia, and Serbia have resources of approximately 1 million tons each. Lithium resources in Brazil and Mexico are approximately 200,000 tons each and Austria and Zimbabwe have more than 100,000 tons each. Substitutes: Substitution for lithium compounds is possible in batteries, ceramics, greases, and manufactured glass. Examples are calcium, magnesium, mercury, and zinc as anode material in primary batteries; calcium and aluminum soaps as substitutes for stearates in greases; and sodic and potassic fluxes in ceramics and glass manufacture. eEstimated. W Withheld to avoid disclosing company proprietary data. — Zero.1Source: Rockwood Holdings, Inc., 2014, 2013 annual report: Princeton, NJ, Rockwood Holdings, Inc., p. 16. 2Source: Industrial Minerals, IM prices: Lithium carbonate, large contracts, delivered continental United States. 3Defined as imports – exports + adjustments for Government and industry stock changes. 4See Appendix B for definitions. 5See Appendix C for resource and reserve definitions and information concerning data sources. 6Excludes U.S. production.
U.S. Geological Survey, Mineral Commodity Summaries, January 2017

102
MAGNESIUM COMPOUNDS1
(Data in thousand metric tons of magnesium oxide (MgO) content unless otherwise noted)2 Domestic Production and Use: Seawater and natural brines accounted for about 67% of U.S. magnesium compound production in 2016. The value of production of magnesium compounds was $195 million. Magnesium oxide and other compounds were recovered from seawater by one company in California and another company in Delaware; from well brines by one company in Michigan; and from lake brines by two companies in Utah. Magnesite was mined by one company in Nevada. One company in Washington processed stockpiled olivine that was previously mined. About 60% of the magnesium compounds consumed in the United States were used in agricultural, chemical, construction, environmental, and industrial applications in the form of caustic-calcined magnesia, magnesium chloride, magnesium hydroxide, and magnesium sulfates. The remaining 40% was used for refractories in the form of dead-burned magnesia, fused magnesia, and olivine. Salient Statistics—United States: 2012 2013 2014 2015 2016e Production 341 324 342 380 390 Imports for consumption 461 407 498 581 500 Exports 56 56 64 70 60 Consumption, apparent 746 675 776 891 830 Employment, plant, numbere 275 250 250 260 260 Net import reliance3 as a percentage of apparent consumption 54 52 56 57 53 Recycling: Some magnesia-based refractories are recycled, either for reuse as refractory material or for use as construction aggregate. Import Sources (2012–15): China, 52%; Brazil, 17%; Canada, 9%; Australia, 6%; and other, 16%. Tariff:4 Item Number Normal Trade Relations 12–31–16 Crude magnesite 2519.10.0000 Free. Dead-burned and fused magnesia 2519.90.1000 Free. Caustic-calcined magnesia 2519.90.2000 Free. Kieserite 2530.20.1000 Free. Epsom salts 2530.20.2000 Free. Magnesium hydroxide 2816.10.0000 3.1% ad val. Magnesium chloride 2827.31.0000 1.5% ad val. Magnesium sulfate (synthetic) 2833.21.0000 3.7% ad val. Depletion Allowance: Brucite, 10% (Domestic and foreign); dolomite, magnesite, and magnesium carbonate, 14% (Domestic and foreign); magnesium chloride (from brine wells), 5% (Domestic and foreign); and olivine, 22% (Domestic) and 14% (Foreign). Government Stockpile: None. Events, Trends, and Issues: Global consumption of dead-burned and fused magnesia declined slightly during the first 8 months of 2016 compared with that in the same period of 2015, as world steel production stabilized after declining in 2015. Consumption of magnesia refractory products for glass and nonferrous metals declined significantly during the first 8 months of 2016 compared with that during the same period of 2015, but had little impact on the overall decrease in magnesia consumption because these consumers account for a small share of magnesia consumption. Low prices for magnesium compounds for dead-burned magnesia and caustic-calcined magnesia persisted as steel production decreased slightly from that in 2015 and supplies from China were abundantly available. As a result, prices for magnesia declined throughout the first half of 2016; caustic-calcined magnesia prices did not decrease as much as those of dead-burned magnesia and fused magnesia. In recent years, fused magnesia has replaced dead-burned magnesia in some steel furnaces, and this trend is expected to continue as more fused magnesia capacity comes on line. Fused magnesia has superior properties to dead-burned magnesia in some refractory applications, owing to higher magnesia content, higher density, and larger crystal size. Although fused magnesia costs more than dead-burned magnesia, its longer campaign life reduces downtime, lowering the overall cost of production. The steel industry in China was expected to continue to become more efficient in its use of refractories, which would result in less magnesia consumed per unit of steel produced. Prepared by E. Lee Bray [(703) 648–4979, [email protected]]

103 MAGNESIUM COMPOUNDS
Domestic consumption of dead-burned magnesia decreased as the use of higher quality fused-magnesia refractories increased and crude steel production in the United States decreased slightly in 2016. Consumption of caustic-calcined magnesia continued to increase for animal feed supplements and fertilizer as the importance of magnesium as a nutrient gained recognition. Environmental applications, such as wastewater treatment, also accounted for increasing consumption of magnesium compounds, including caustic-calcined magnesia and magnesium hydroxide. Increased use in deicing and dust control applications has resulted in increased consumption of magnesium chloride in recent years. New capacity in China was expected to be limited because concerns about overcapacity deter further investment in the magnesia industry. New capacity currently under construction in other countries, such as Russia and Turkey, was expected to be completed as planned, but further expansions were less likely, especially for dead-burned magnesia. World Magnesite Mine Production and Reserves:5 Mine production Reserves6 2015 2016e United States W W 35,000 Australia 420 440 330,000 Austria 760 750 50,000 Brazil 550 500 300,000 China 19,000 19,000 1,700,000 Greece 400 410 270,000 India 230 240 90,000 Korea, North 250 250 1,500,000 Russia 1,300 1,350 2,300,000 Slovakia 650 620 120,000 Spain 640 620 35,000 Turkey 2,800 2,800 390,000 Other countries 670 680 1,400,000 World total (rounded) 727,700 727,700 8,500,000 In addition to magnesite, vast reserves exist of well and lake brines and seawater from which magnesium compounds can be recovered. World Resources: Resources from which magnesium compounds can be recovered range from large to virtually unlimited and are globally widespread. Identified world magnesite and brucite resources total 12 billion tons and several million tons, respectively. Resources of dolomite, forsterite, magnesium-bearing evaporite minerals, and magnesia-bearing brines are estimated to constitute a resource of billions of tons. Magnesium hydroxide can be recovered from seawater. Substitutes: Alumina, chromite, and silica substitute for magnesia in some refractory applications. eEstimated. W Withheld to avoid disclosing company proprietary data. 1See also Magnesium Metal. 2Previously reported as magnesium content. Based on input from consumers, producers, and others involved in the industry, it was determined that reporting magnesium compound data in terms of contained magnesia was more useful than reporting in terms of magnesium content. Conversion factors used: MgCO3, 47.8% MgO; Mg(OH)2, 42.3% MgO; and MgSO4, 18.6% MgO. 3Defined as imports – exports + adjustments for industry stock changes. 4Tariffs are based on gross weight. 5Gross weight of magnesite (magnesium carbonate). 6See Appendix C for resource and reserve definitions and information concerning data sources. 7Excludes U.S. production.
U.S. Geological Survey, Mineral Commodity Summaries, January 2017

104
MAGNESIUM METAL1
(Data in thousand metric tons unless otherwise noted) Domestic Production and Use: In 2016, primary magnesium was produced by one company in Utah at an electrolytic process plant that recovered magnesium from brines from the Great Salt Lake. Production in 2016 was estimated to have increased from that of 2015. Information regarding U.S. magnesium metal production was withheld to avoid disclosing company proprietary data. The leading use for primary magnesium metal, which accounted for 33% of reported primary consumption, was as a reducing agent for the production of titanium and other metals. Use in aluminum-base alloys that were used for packaging, transportation, and other applications accounted for 30% of primary magnesium metal consumption. Structural uses of magnesium (castings and wrought products) accounted for 18% of primary metal consumption, desulfurization of iron and steel, 14%, and other uses, 5%. About 70% of the secondary magnesium consumed was used in aluminum alloys and about 30% of the secondary magnesium was consumed for structural uses. Salient Statistics—United States: 2012 2013 2014 2015 2016e Production: Primary W W W W W Secondary (new and old scrap) 77 79 80 80 91 Imports for consumption 51 46 55 54 50 Exports 18 16 17 15 15 Consumption: Reported, primary 72 69 66 65 74 Apparent W W W W W Price, yearend: U.S. spot Western, dollars per pound, average 2.20 2.13 2.15 2.15 2.15 China free market, dollars per metric ton, average 3,170 2,615 2,325 1,825 2,400 Stocks, producer and consumer, yearend W W W W W Employment, numbere 420 420 420 420 420 Net import reliance2 as a percentage of apparent consumption <30 <30 <40 <40 <30 Recycling: In 2016, about 27,000 tons of secondary magnesium was recovered from old scrap and 64,000 tons were recovered from new scrap. Aluminum-base alloys accounted for 68% of the secondary magnesium recovered, and magnesium-based castings, ingot, and other materials accounted for about 32%. Magnesium chloride produced as a waste product of titanium sponge production at a plant in Utah is returned to the primary magnesium supplier where it is reduced to produce metallic magnesium; however, this metal is not included in the secondary magnesium statistics. Import Sources (2012–15): Israel, 30%; Canada, 22%; China, 10%; Mexico, 7%; and others, 31%. Tariff: Item Number Normal Trade Relations 12–31–16 Unwrought metal 8104.11.0000 8.0% ad val. Unwrought alloys 8104.19.0000 6.5% ad val. Scrap 8104.20.0000 Free. Powders and granules 8104.30.0000 4.4% ad val. Wrought metal 8104.90.0000 14.8¢/kg on Mg content + 3.5% ad val. Depletion Allowance: Dolomite, 14% (Domestic and foreign); magnesium chloride (from brine wells), 5% (Domestic and foreign). Government Stockpile: None. Events, Trends, and Issues: A plant in Mexico, MO, which manufactures die-cast magnesium parts for the automotive industry, was expanded by about 30% and rampup was completed in early 2016. In October, citing increased demand from diecasters and secondary aluminum smelters, a secondary magnesium plant in Andersonville, IN, restarted 25,000 tons per year of capacity, doubling its active capacity. Rampup was expected to be completed by yearend 2016. In China, production increased during the year after decreasing in 2015 for the first time since 2009. A new plant in Qinghai Province that would produce magnesium from lake brines was expected to ramp up to its full 100,000-ton-per-year capacity in 2017. Some plants producing magnesium using the Pidgeon (silicothermic reduction) process were expected to shut down, owing to energy cost increases and to comply with environmental regulations. Prepared by E. Lee Bray [(703) 648–4979, [email protected]]

105 MAGNESIUM METAL
Because many magnesium consumers were concerned about diversity of supply, several projects were under development to increase primary magnesium metal capacity. The sole U.S. primary magnesium producer was expanding its capacity by 20%. Another company was seeking financing for a proposed plant to produce magnesium from dolomite in Nevada and was awaiting permits to operate a bench-scale pilot plant that had been completed at the beginning of the year to test recovery of magnesium from its deposit. Two companies were testing processes to produce magnesium and magnesium compounds from asbestos tailings in Quebec, Canada. One of the companies proposed to build a 50,000-ton-per-year plant if its pilot-plant tests proved economically feasible. A company in Australia was conducting a feasibility study for a 5,000-ton-per-year plant to recover magnesium from coal fly ash. The use of magnesium in automobile parts continues to increase as automobile manufacturers seek to decrease vehicle weight in order to comply with fuel-efficiency standards. However, some foundries switched to aluminum from magnesium because lower aluminum prices in 2016 provided a cost advantage. The substitution of aluminum for steel in automobile sheet was expected to increase consumption of magnesium in aluminum alloy sheet. Although some magnesium sheet applications have been developed for automobiles, these were generally limited to expensive sports cars and luxury vehicles, automobiles where the higher price of magnesium is not a deterrent to its use. Consumption of magnesium in the production of titanium metal by the Kroll process increased during the early part of 2016 as a titanium sponge plant in Utah increased production. However, in August, the owner of the titanium sponge plant announced that it would shut down the plant by yearend, citing the availability of titanium sponge at lower prices from suppliers outside the United States. In October, the owner of the magnesium plant in Utah announced that it would delay the completion of its expansion project from 2017 until at least 2018 because of the shutdown of the adjacent titanium sponge plant. World Primary Production and Reserves: Primary production Reserves3 2015 2016e United States W W Magnesium metal is derived from seawater, natural Brazil 15 15 brines, dolomite, and other minerals. The reserves China 852 880 for this metal are sufficient to supply current and Israel 19 25 future requirements. Kazakhstan 8 10 Korea, Republic of 10 10 Russia 60 60 Turkey (4) 6 Ukraine 8 8 World total5 (rounded) 972 1,010 World Resources: Resources from which magnesium may be recovered range from large to virtually unlimited and are globally widespread. Resources of dolomite and magnesium-bearing evaporite minerals are enormous. Magnesium-bearing brines are estimated to constitute a resource in the billions of tons, and magnesium could be recovered from seawater along world coastlines. Substitutes: Aluminum and zinc may substitute for magnesium in castings and wrought products. For iron and steel desulfurization, calcium carbide may be used instead of magnesium. The relatively light weight of magnesium is an advantage over aluminum and zinc in castings and wrought products in most applications; however, its high cost is a disadvantage relative to these substitutes. Magnesium is preferred to calcium carbide for desulfurization of iron and steel because calcium carbide produces acetylene in the presence of water. eEstimated. W Withheld to avoid disclosing company proprietary data. 1See also Magnesium Compounds. 2Defined as imports – exports. 3See Appendix C for resource and reserve definitions and information concerning data sources. 4Less than 500 metric tons. 5Excludes U.S. production.
U.S. Geological Survey, Mineral Commodity Summaries, January 2017

106
MANGANESE
(Data in thousand metric tons gross weight unless otherwise noted) Domestic Production and Use: Manganese ore containing 20% or more manganese has not been produced domestically since 1970. Manganese ore was consumed mainly by eight firms with plants principally in the East and Midwest. Most ore consumption was related to steel production, either directly in pig iron manufacture or indirectly through upgrading the ore to ferroalloys. Additional quantities of ore were used for such nonmetallurgical purposes as production of dry cell batteries, in plant fertilizers and animal feed, and as a brick colorant. Manganese ferroalloys were produced at two smelters. Construction, transportation, and machinery end uses accounted for about 28%, 14%, and 11%, respectively, of manganese consumption. Most of the rest went to a variety of other iron and steel applications. In 2016, the value of domestic consumption, estimated from foreign trade data, was about $560 million. Salient Statistics—United States:1 2012 2013 2014 2015 2016e Production, mine2 — — — — — Imports for consumption: Manganese ore 506 549 387 441 300 Ferromanganese 401 331 365 292 230 Silicomanganese3 348 329 463 319 320 Exports: Manganese ore 2 1 1 1 1 Ferromanganese 5 2 6 5 9 Silicomanganese 6 6 3 1 2 Shipments from Government stockpile excesses:4 Manganese ore — — — — — Ferromanganese 6 1 24 29 41 Consumption, reported:5 Manganese ore 538 523 508 451 360 Ferromanganese 382 368 360 344 320 Silicomanganese 150 152 146 138 130 Consumption, apparent, manganese6 843 794 838 707 630 Price, average, 46% to 48% Mn metallurgical ore, dollars per metric ton unit, contained Mn:7 Cost, insurance, and freight (c.i.f.), U.S. portse 4.97 4.61 4.49 3.53 3.10 C.i.f, China, CRU Ryan’s Notes 4.84 5.29 4.72 3.22 73.38 Stocks, producer and consumer, yearend: Manganese ore5 203 217 189 187 110 Ferromanganese 31 27 23 21 19 Silicomanganese 19 6 10 21 19 Net import reliance8 as a percentage of apparent consumption 100 100 100 100 100 Recycling: Manganese was recycled incidentally as a constituent of ferrous and nonferrous scrap; however, scrap recovery specifically for manganese was negligible. Manganese is recovered along with iron from steel slag. Import Sources (2012–15): Manganese ore: Gabon, 69%; South Africa, 15%; Australia, 9%; Ghana, 2%; and other, 5%. Ferromanganese: South Africa, 57%; Australia, 11%; Norway, 10%; Republic of Korea, 9%; and other, 13%. Manganese contained in principal manganese imports:9 South Africa, 33%; Gabon, 21%; Australia, 11%; Georgia, 10%; and other, 25%. Tariff: Item Number Normal Trade Relations 12–31–16 Ores and concentrates 2602.00.0040/60 Free. Manganese dioxide 2820.10.0000 4.7% ad val. High-carbon ferromanganese 7202.11.5000 1.5% ad val. Silicomanganese 7202.30.0000 3.9% ad val. Metal, unwrought 8111.00.4700/4990 14% ad val. Depletion Allowance: 22% (Domestic), 14% (Foreign). Prepared by Lisa A. Corathers [(703) 648–4973, [email protected]]

107 MANGANESE
Government Stockpile:
Stockpile Status—9–30–1610
Authorized Disposals Material Inventory for disposal FY 2016 Manganese ore, metallurgical grade 292 292 — Ferromanganese, high-carbon 239 45 45 Events, Trends, and Issues: U.S. manganese apparent consumption was projected to decrease by 11% to 630,000 tons in 2016 compared with that in 2015. This was primarily a result of the significant decrease in manganese ore imports and, to a lesser extent, a decrease in ferromanganese imports in response to declining domestic manganese alloys production; specific alloy production data was withheld to avoid disclosing company proprietary data. The annual average domestic manganese ore contract price followed the 18% decrease in the average Australian export unit value for metallurgical-grade ore during the first 6 months of 2016. The Australian export unit value was used as a surrogate for the recently discontinued use of an international benchmark price for manganese ore. Historically, the international benchmark price represented the annual average contract price negotiated between producers in Australia and consumers in Japan. World Mine Production and Reserves (metal content): Reserves for Brazil and China have been revised based on data reported by the Governments of those countries. Mine production Reserves11 2015 2016e United States — — — Australia 2,450 2,500 91,000 Brazil 1,090 1,100 116,000 China 3,000 3,000 43,000 Gabon 2,020 2,000 22,000 Ghana 416 480 12,000 India 900 950 52,000 Kazakhstan 222 160 5,000 Malaysia 201 200 NA Mexico 220 220 5,000 South Africa 5,900 4,700 200,000 Ukraine 410 320 140,000 Other countries 678 680 Small World total (rounded) 17,500 16,000 690,000 World Resources: Land-based manganese resources are large but irregularly distributed; those in the United States are very low grade and have potentially high extraction costs. South Africa accounts for about 78% of the world’s identified manganese resources, and Ukraine accounts for about 10%. Substitutes: Manganese has no satisfactory substitute in its major applications. eEstimated. NA Not available. — Zero. 1Manganese content typically ranges from 35% to 54% for manganese ore and from 74% to 95% for ferromanganese. 2Excludes insignificant quantities of low-grade manganiferous ore. 3Imports more nearly represent amount consumed than does reported consumption. 4Net quantity, in manganese content, defined as stockpile shipments – receipts. If receipts, a negative quantity is shown. 5Consumers only, exclusive of ore consumed and stocks at iron and steel plants. 6Thousand tons, manganese content; based on estimated average content for all components, except imports, for which content is reported. Manganese consumption is not calculated as the sum of manganese ore and ferromanganese consumption because manganese in ore used to produce ferromanganese would be counted twice. 7Average weekly price through September 2016. 8Defined as imports – exports + adjustments for Government and industry stock changes. 9Includes imports of ferromanganese, manganese ore, silicomanganese, synthetic manganese dioxide, and unwrought manganese metal. 10See Appendix B for definitions. 11See Appendix C for resource and reserve definitions and information concerning data sources.
U.S. Geological Survey, Mineral Commodity Summaries, January 2017

108
MERCURY
(Data in metric tons of mercury content unless otherwise noted) Domestic Production and Use: Mercury has not been produced as a principal mineral commodity in the United States since 1992. In 2016, mercury was recovered as a byproduct from processing gold-silver ore at several mines in Nevada; however, production data were not reported. Secondary, or recycled, mercury was recovered from batteries, compact and traditional fluorescent lamps, dental amalgam, medical devices, and thermostats, as well as mercury-contaminated soils. It was estimated that less than 40 tons per year of mercury was consumed domestically. The leading domestic end users of mercury were the chlorine-caustic soda (chloralkali), electronics, and fluorescent-lighting manufacturing industries. Only two mercury cell chloralkali plants operated in the United States in 2016. Until December 31, 2012, domestic- and foreign-sourced mercury was refined and then exported for global use, primarily for small-scale gold mining in many parts of the world. Beginning January 1, 2013, export of elemental mercury from the United States was banned, with some exceptions, under the Mercury Export Ban Act of 2008. Salient Statistics—United States: 2012 2013 2014 2015 2016e Production: Mine (byproduct) NA NA NA NA NA Secondary NA NA NA NA NA Imports for consumption (gross weight), metal 249 38 49 26 20 Exports (gross weight), metal 28 (1) — (1) — Price, average value, dollars per flask 99.99%2 Domestic, free market3 1,850 1,850 1,850 1,850 NA European Union4 2,578 3,412 3,037 1,954 1,400 Net import reliance5 as a percentage of apparent consumption E E NA NA NA Recycling: In 2016, eight facilities operated by six companies in the United States accounted for the majority of secondary mercury produced and were authorized by the U.S Department of Energy to temporarily store mercury. Mercury-containing automobile convenience switches, barometers, compact and traditional fluorescent lamps, computers, dental amalgam, medical devices, and thermostats were collected by smaller companies and shipped to the refining companies for retorting to reclaim the mercury. In addition, many collection companies recovered mercury when retorting was not required. The increased use of mercury substitutes has resulted in a shrinking reservoir of mercury-containing products for recycling. Minimizing the use of mercury in products that still require mercury has further reduced the amount of secondary mercury available for recovery. Import Sources (2012–15): Argentina, 36%; Canada, 24%; Germany, 17%; Chile, 14%; and other, 9%. Tariff: Item Number Normal Trade Relations 12–31–16 Mercury 2805.40.0000 1.7% ad val. Depletion Allowance: 22% (Domestic), 14% (Foreign). Government Stockpile: An inventory of 4,436 tons of mercury was held in storage at the Hawthorne Army Depot, in Hawthorne, NV. The Mercury Export Ban Act of 2008 required the U.S. Department of Energy to establish long-term management and storage capabilities for domestically produced elemental mercury. Sales of mercury from the stockpiles remained suspended.
Stockpile Status—9–30–166 Disposal Plan Disposals Material Inventory FY 2016 FY 2016 Mercury 4,436 — — Events, Trends, and Issues: Owing to mercury toxicity and concerns for the environment and human health, overall mercury use has declined in the United States. Mercury continues to be released to the environment from numerous sources, including mercury-containing car switches when automobiles are scrapped without recovering them for recycling, coal-fired powerplant emissions, and incineration of mercury-containing medical devices. Mercury is no longer used in batteries and paints manufactured in the United States. Some button-type batteries, cleansers, Prepared by Micheal W. George [(703) 648–4962, [email protected]]

109 MERCURY
fireworks, folk medicines, grandfather clocks, pesticides, and skin-lightening creams and soaps may still contain mercury. Mercury compounds were used as catalysts in the coal-based manufacture of vinyl chloride monomer in China. Conversion to nonmercury technology for chloralkali production and the ultimate closure of the world’s mercury-cell chloralkali plants may release a large quantity of mercury to the global market for recycling, sale, or, owing to export bans in Europe and the United States, storage. Globally, the number of operating primary mercury mines was uncertain; however, most were located in China, Kyrgyzstan, or Russia. Reported mercury production in China, which had averaged about 1,400 tons per year from 2008 through 2012, trended sharply upward beginning in 2013 to 2,800 tons in 2015. Production in the first 8 months of 2016 was reported to have increased by 40% from that of the same period in 2015. Byproduct mercury production is expected to continue from large-scale domestic and foreign gold-silver mining and processing, as is secondary production of mercury from an ever-diminishing supply of mercury-containing products. The quantity of byproduct mercury entering the global supply from foreign gold-silver processing may fluctuate dramatically from year to year because mercury is frequently stockpiled in producing countries. Domestic mercury consumption will continue to decline owing to increased use of light-emitting-diode (LED) lighting and consequent reduced use of conventional fluorescent tubes and compact fluorescent bulbs, and continued substitution of nonmercury-containing products, such as digital thermometers, and in measuring, control, and dental applications. World Mine Production and Reserves: Mine production Reserves7 2015 2016e United States NA NA Quantitative estimates China 2,800 4,000 of reserves are not available. Kyrgyzstan 40 40 China, Kyrgyzstan, and Peru are Mexico (exports) 300 300 thought to contain the largest Peru (exports) 35 40 reserves. Tajikistan 30 30 Other countries 60 50 World total (rounded) 3,270 4,500 World Resources: China, Kyrgyzstan, Mexico, Peru, Russia, Slovenia, Spain, and Ukraine have most of the world’s estimated 600,000 tons of mercury resources. Mexico reclaims mercury from Spanish Colonial silver-mining waste. In Peru, mercury production from the Santa Barbara Mine (Huancavelica) stopped in the 1990s; however, Peru continues to be an important source of byproduct mercury imported into the United States. In Spain, once a leading producer of mercury, mining at its centuries-old Almaden Mine stopped in 2003. In the United States, there are mercury occurrences in Alaska, Arkansas, California, Nevada, and Texas; however, mercury has not been mined as a principal mineral commodity since 1992. The declining consumption of mercury, except for small-scale gold mining, indicates that these resources are sufficient for centuries of use. Substitutes: Ceramic composites substitute for the dark-gray mercury-containing dental amalgam. “Galistan,” an alloy of gallium, indium, and tin, replaces the mercury used in traditional mercury thermometers, and digital thermometers have replaced traditional thermometers. At chloralkali plants around the world, mercury-cell technology is being replaced by newer diaphragm and membrane cell technology. LEDs that contain indium substitute for mercury-containing fluorescent lamps. Lithium, nickel-cadmium, and zinc-air batteries replace mercury-zinc batteries in the United States; indium compounds substitute for mercury in alkaline batteries; and organic compounds have been substituted for mercury fungicides in latex paint.
eEstimated. E Net exporter. NA Not available. — Zero. 1Less than ½ unit. 2Some international data and dealer prices are reported in flasks. One metric ton (1,000 kilograms) = 29.0082 flasks, and 1 flask = 76 pounds, or 34.5 kilograms, or 0.035 ton. 3Platts Metals Week average annual mercury price quotation. Actual prices may vary significantly from quoted prices. Price discontinued December 2015. 4Average annual price published by Metal-Pages . 5Defined as imports – exports + adjustments for Government stock changes. 6See Appendix B for definitions. 7See Appendix C for resource and reserve definitions and information concerning data sources.
U.S. Geological Survey, Mineral Commodity Summaries, January 2017

110
MICA (NATURAL)
(Data in metric tons unless otherwise noted) Domestic Production and Use: Scrap and flake mica production, excluding low-quality sericite, was estimated to be 30,200 tons valued at $4 million. Mica was mined in Georgia, North Carolina, South Dakota, and Virginia. Scrap mica was recovered principally from mica and sericite schist and as a byproduct from feldspar, industrial sand beneficiation, and kaolin. Seven companies produced 49,900 tons of ground mica valued at about $15 million from domestic and imported scrap and flake mica. The majority of domestic production was processed into small particle-size mica by either wet or dry grinding. Primary uses were joint compound, oil-well-drilling additives, paint, roofing, and rubber products. A minor amount of sheet mica was produced as incidental production from feldspar mining in the Spruce Pine area of North Carolina. The domestic consuming industry was dependent on imports to meet demand for sheet mica. Most sheet mica was fabricated into parts for electrical and electronic equipment. Salient Statistics—United States: 2012 2013 2014 2015 2016e Scrap and flake: Production1, 2 Mine 47,500 48,100 48,200 32,600 30,200 Ground 78,500 79,200 79,400 53,700 49,900 Imports3 27,200 30,900 33,400 33,200 34,200 Exports4 5,950 6,380 7,910 7,380 6,120 Consumption, apparent5 68,600 72,600 73,600 58,400 58,300 Price, average, dollars per metric ton, reported: Scrap and flake 128 124 117 142 132 Ground: Dry 281 279 285 290 290 Wet 360 360 369 375 380 Employment, mine, number NA NA NA NA NA Net import reliance6 as a percentage of apparent consumption 31 34 35 44 48 Sheet: Production, minee (7) (7) (7) (7) (7) Imports8 2,380 1,910 2,470 2,130 2,090
Exports9 1,660 1,150 1,040 968 836
Consumption, apparent 826 760 1,500 1,100 1,250 Price, average value, dollars per kilogram, muscovite and phlogopite mica, reported: Block 145 129 148 133 130 Splittings 1.72 1.72 1.70 1.76 1.80 Stocks, fabricator and trader, yearend NA NA NA NA NA Net import reliance6 as a percentage of apparent consumption 100 100 100 100 100 Recycling: None. Import Sources (2012–15): Scrap and flake: Canada, 44%; China, 32%; India, 13%; Finland, 4%; and other, 7%. Sheet: China, 39%; Brazil, 28%; Belgium, 10%; Austria, 6%; and other, 17%. Tariff: Item Number Normal Trade Relations 12–31–16 Crude mica and mica rifted into sheets or splittings 2525.10.0000 Free. Split block mica 2525.10.0010 Free. Mica splittings 2525.10.0020 Free. Unworked, other 2525.10.0050 Free. Mica powder 2525.20.0000 Free. Mica waste 2525.30.0000 Free. Plates, sheets, and strips of agglomerated or reconstructed mica 6814.10.0000 2.7% ad val. Worked mica and articles of mica, other 6814.90.0000 2.6% ad val. Prepared by Christine L. Thomas [(703) 648–7713, [email protected]]

111 MICA (NATURAL)
Depletion Allowance: 22% (Domestic), 14% (Foreign). Government Stockpile: None. Events, Trends, and Issues: Domestic production and consumption of scrap and flake mica were estimated to have decreased in 2016. Apparent consumption of scrap and flake mica decreased slightly because the 7% decrease in production was offset by the 3% increase in imports. Apparent consumption of sheet mica increased by 13% in 2016. No environmental concerns are associated with the manufacture and use of mica products. Future supplies of mica for U.S. consumption were expected to come increasingly from imports, primarily from Brazil, Canada, China, India, and Finland. World Mine Production and Reserves: Scrap and flake Sheet Mine productione Reserves10 Mine productione Reserves10 2015 2016 2015 2016 All types: United States1 32,600 30,200 Large (7) (7) Very small Argentina 5,000 5,000 Large — — NA Brazil 10,000 10,000 Large NA NA NA Canada 22,000 23,000 Large NA NA NA China 785,000 785,000 Large NA NA NA Finland 54,000 54,000 Large NA NA NA France 20,000 20,000 Large NA NA NA India 12,300 12,900 Large 1,600 1,600 Very large Korea, Republic of 25,000 25,000 Large — — NA Madagascar 19,000 19,000 Large — — NA Russia 100,000 100,000 Large 1,500 1,500 Moderate Taiwan 5,020 6,200 Large — — NA Turkey 25,200 25,200 Large — — NA Other countries 16,300 16,300 Large 200 200 Moderate World total (rounded) 1,130,000 1,130,000 Large 3,300 3,300 Very large World Resources: Resources of scrap and flake mica are available in clay deposits, granite, pegmatite, and schist, and are considered more than adequate to meet anticipated world demand in the foreseeable future. World resources of sheet mica have not been formally evaluated because of the sporadic occurrence of this material. Large deposits of mica-bearing rock are known to exist in countries such as Brazil, India, and Madagascar. Limited resources of sheet mica are available in the United States. Domestic resources are uneconomic because of the high cost of the hand labor required to mine and process sheet mica from pegmatites. Substitutes: Some lightweight aggregates, such as diatomite, perlite, and vermiculite, may be substituted for ground mica when used as filler. Ground synthetic fluorophlogopite, a fluorine-rich mica, may replace natural ground mica for uses that require thermal and electrical properties of mica. Many materials can be substituted for mica in numerous electrical, electronic, and insulation uses. Substitutes include acrylic, cellulose acetate, fiberglass, fishpaper, nylatron, nylon, phenolics, polycarbonate, polyester, styrene, vinyl-PVC, and vulcanized fiber. Mica paper made from scrap mica can be substituted for sheet mica in electrical and insulation applications. eEstimated. NA Not available. — Zero. 1Sold or used by producing companies. 2Excludes low-quality sericite used primarily for brick manufacturing. 3Includes tariff numbers: 2525.10.0050, <$1.00/kg; 2525.20.0000; and 2525.30.0000. 4Includes tariff numbers: 2525.10.0000, <$1.00/kg; 2525.20.0000; and 2525.30.0000. 5Based on scrap and flake mica mine production. 6Defined as imports – exports. 7Less than ½ unit. 8Includes tariff numbers: 2525.10.0010; 2525.10.0020; 2525.10.0050, >$1.00/kg; 6814.10.0000; and 6814.90.0000. 9Includes tariff numbers: 2525.10.0000, >$1.00/kg; 6814.10.0000; and 6814.90.0000. 10See Appendix C for resource and reserve definitions and information concerning data sources.
U.S. Geological Survey, Mineral Commodity Summaries, January 2017

112
MOLYBDENUM
(Data in metric tons of molybdenum content unless otherwise noted) Domestic Production and Use: U.S. mine production of molybdenum in 2016 decreased by 33% to about 31,600 tons, and was valued at about $458 million (based on an average oxide price). Molybdenum ore was produced as a primary product at two mines—both in Colorado—whereas seven copper mines (four in Arizona and one each in Montana, Nevada, and Utah) recovered molybdenum as a byproduct. Three roasting plants converted molybdenite concentrate to molybdic oxide, from which intermediate products, such as ferromolybdenum, metal powder, and various chemicals, were produced. Iron and steel and superalloy producers accounted for about 76% of the molybdenum consumed. Salient Statistics—United States: 2012 2013 2014 2015 2016e Production, mine 60,400 61,000 68,200 47,400 31,600 Imports for consumption 19,800 20,300 25,300 18,100 20,800 Exports 48,900 53,100 65,200 41,400 35,000 Consumption: Reported1 19,400 18,600 19,500 17,600 16,500 Apparent2 33,100 29,800 27,900 24,400 17,800 Price, average value, dollars per kilogram3 28.09 22.85 25.84 15.01 14.50 Stocks, consumer materials 1,770 1,820 2,010 1,880 1,800 Employment, mine and plant, number 940 960 1,000 950 920 Net import reliance4 as a percentage of apparent consumption E E E E E Recycling: Molybdenum is recycled as a component of catalysts, ferrous scrap, and superalloy scrap. Ferrous scrap comprises revert scrap, and new and old scrap. Revert scrap refers to remnants manufactured in the steelmaking process. New scrap is generated by steel mill customers and recycled by scrap collectors and processors. Old scrap is largely molybdenum-bearing alloys recycled after serving their useful life. The amount of molybdenum recycled as part of new and old steel and other scrap may be as much as 30% of the apparent supply of molybdenum. There are no processes for the separate recovery and refining of secondary molybdenum from its alloys. Molybdenum is not recovered separately from recycled steel and superalloys, but the molybdenum content of the recycled alloys is significant, and the molybdenum content is reutilized. Recycling of molybdenum-bearing scrap will continue to be dependent on the markets for the principal alloy metals in which molybdenum is found, such as iron, nickel, and chromium. Import Sources (2012–15): Ferromolybdenum: Chile, 77%; Canada, 11%; Republic of Korea, 5%; and other, 7%. Molybdenum ores and concentrates: Canada, 28%; Peru, 27%; Chile, 22%; Mexico, 22%; and other, 1%. Tariff: Item Number Normal Trade Relations 12–31–16 Molybdenum ore and concentrates, roasted 2613.10.0000 12.8¢/kg + 1.8% ad val. Molybdenum ore and concentrates, other 2613.90.0000 17.8¢/kg. Molybdenum chemicals: Molybdenum oxides and hydroxides 2825.70.0000 3.2% ad val. Molybdates of ammonium 2841.70.1000 4.3% ad val. Molybdates, all others 2841.70.5000 3.7% ad val. Molybdenum pigments, molybdenum orange 3206.20.0020 3.7% ad val. Ferroalloys, ferromolybdenum 7202.70.0000 4.5% ad val. Molybdenum metals: Powders 8102.10.0000 9.1¢/kg + 1.2% ad val. Unwrought 8102.94.0000 13.9¢/kg + 1.9% ad val. Wrought bars and rods 8102.95.3000 6.6% ad val. Wrought plates, sheets, strips, etc. 8102.95.6000 6.6% ad val. Wire 8102.96.0000 4.4% ad val. Waste and scrap 8102.97.0000 Free. Other 8102.99.0000 3.7% ad val. Depletion Allowance: 22% (Domestic); 14% (Foreign). Government Stockpile: None. Prepared by Désirée E. Polyak [(703) 648–4909, [email protected]]

113 MOLYBDENUM
Events, Trends, and Issues: U.S. estimated mine output of molybdenum in 2016 decreased by 33% from that of 2015. U.S. imports for consumption increased by 15% from those of 2015, and U.S. exports decreased by 15% from those of 2015. Reported U.S. consumption of primary molybdenum products decreased by 6% from that of 2015. Apparent consumption of molybdenum concentrates decreased by 27% from that of 2015. The average molybdenum price for 2016 was lower than that of 2015; however, molybdenum prices continued to increase from the low in November 2015 throughout October 2016. Primary molybdenum production continued at the Climax Mine in Lake County and Summit County, CO, and at the Henderson Mine in Clear Creek County, CO, but primary production at the Ashdown Mine in Humboldt County, NV, and at the Questa Mine in Taos County, NM, continued to be suspended. The Thompson Creek Mine in Custer County, ID, and the Mineral Park Mine in Mohave County, AZ, continued to be on care-and-maintenance status in 2016, owing to continued weak molybdenum prices. The Mission Mine in Pima County, AZ, did produce molybdenum in 2015, but did not produce any molybdenum in 2016. The decline in U.S. molybdenum production was attributed mainly to the closure of the Thompson Creek Mine, as well as a major decrease in production at the Bingham Canyon Mine in Salt Lake County, UT. Global molybdenum production in 2016 decreased by 4% compared with 2015. The Chinese Government was expected to launch a new round of environmental inspections in 2016. Many Chinese producers will be forced to either shut down their molybdenum facilities permanently or upgrade their facilities to comply with tougher environmental standards. Most new molybdenum production that was expected in 2015–16 has not taken place and many of the expected new projects, except for Chile’s Molyb plant, which shipped its first molybdenum concentrate in September 2016, have been delayed. World Mine Production and Reserves: The reserves estimate for China was revised based on new information from the National Bureau of Statistics of China. Mine production Reserves5 2015 2016e (thousand tons) United States 47,400 31,600 2,700 Armenia 7,200 7,000 150 Australia — — 190 Canada 2,300 1,700 260 Chile 52,600 52,000 1,800 Chinae 83,000 90,000 8,400 Iran 3,500 3,500 43 Kazakhstan — — 130 Kyrgyzstan NA NA 100 Mexico 11,300 12,300 130 Mongolia 2,000 2,500 160 Peru 20,200 20,000 450 Russiae 4,500 4,500 250 Turkey 900 1,000 100 Uzbekistane 450 450 60 World total (rounded) 235,000 227,000 15,000 World Resources: Identified resources of molybdenum in the United States are about 5.4 million tons, and in the rest of the world, about 14 million tons. Molybdenum occurs as the principal metal sulfide in large low-grade porphyry molybdenum deposits and as an associated metal sulfide in low-grade porphyry copper deposits. Resources of molybdenum are adequate to supply world needs for the foreseeable future. Substitutes: There is little substitution for molybdenum in its major application in steels and cast irons. In fact, because of the availability and versatility of molybdenum, industry has sought to develop new materials that benefit from its alloying properties. Potential substitutes include boron, chromium, niobium (columbium), and vanadium in alloy steels; tungsten in tool steels; graphite, tantalum, and tungsten for refractory materials in high-temperature electric furnaces; and cadmium-red, chrome-orange, and organic-orange pigments for molybdenum orange. Estimated. E Net exporter. NA Not available. — Zero. 1Reported consumption of primary molybdenum products. 2Apparent consumption of molybdenum concentrates roasted to make molybdenum oxide. 3Time-weighted average price per kilogram of molybdenum contained in technical-grade molybdic oxide, as reported by CRU Group. 4Defined as imports – exports + adjustments for industry stock changes. 5See Appendix C for resource and reserve definitions and information concerning data sources.
U.S. Geological Survey, Mineral Commodity Summaries, January 2017

114
NICKEL
(Data in metric tons of nickel content unless otherwise noted) Domestic Production and Use: The United States had only one active nickel mine—the underground Eagle Mine in Michigan. The new mine has been producing separate concentrates of chalcopyrite and pentlandite for export to smelters in Canada and overseas since April 2014. The principal nickel-consuming State was Pennsylvania, followed by Kentucky, Illinois, New York, and North Carolina. Approximately 45% of the primary nickel consumed went into stainless and alloy steel products, 36% into nonferrous alloys and superalloys, 7% into electroplating, and 12% into other uses. Salient Statistics—United States: 2012 2013 2014 2015 2016e Production: Mine — — 4,300 27,200 25,000 Refinery, byproduct W W W W W Shipments of purchased scrap1 127,000 123,000 108,000 115,000 118,000 Imports: Primary 133,000 126,000 156,000 130,000 111,000 Secondary 22,300 26,300 39,000 27,100 31,100 Exports: Primary 9,130 10,600 10,400 9,580 10,300 Secondary 59,600 61,100 56,300 51,900 69,200 Consumption: Reported, primary metal 110,000 110,000 115,000 109,000 108,000 Reported, secondary 89,800 88,600 90,900 90,000 90,000 Apparent, primary metal 125,000 111,000 147,000 120,000 120,000 Total2 215,000 199,000 238,000 210,000 210,000 Price, average annual, London Metal Exchange (LME): Cash, dollars per metric ton 17,533 15,018 16,865 11,831 9,298 Cash, dollars per pound 7.953 6.812 7.650 5.367 4.218 Stocks: Consumer, yearend 16,800 18,400 23,400 19,200 19,500 Producer, yearend3 6,380 10,020 9,030 10,300 10,500 Net import reliance4 as a percentage of apparent consumption 49 46 56 38 25 Recycling: In 2016, approximately 90,000 tons of nickel was recovered from purchased scrap. This represented about 43% of consumption for the year. Import Sources (2012–15): Canada, 41%; Australia, 9%; Norway, 8%; Russia, 8%; and other, 34%. Tariff: Item Number Normal Trade Relations 12–31–16 Nickel ores and concentrates 2604.00.0040 Free. Nickel oxides, chemical grade 2825.40.0000 Free. Ferronickel 7202.60.0000 Free. Unwrought nickel, not alloyed 7502.10.0000 Free. Depletion Allowance: 22% (Domestic), 14% (Foreign). Government Stockpile: The U.S. Government sold the last of the nickel in the National Defense Stockpile in 1999. The U.S. Department of Energy is holding 8,800 tons of nickel ingot contaminated by low-level radioactivity at Paducah, KY, plus 5,080 tons of contaminated shredded nickel scrap at Oak Ridge, TN. Ongoing decommissioning activities at former nuclear defense sites are expected to generate an additional 20,000 tons of nickel in scrap. Events, Trends, and Issues: The U.S. steel industry produced approximately 1.5 million tons of austenitic (nickel-bearing) stainless steel in 2016—down by 17% from that in 2015. However, this was still 25% greater than the output of 1.18 million tons in 2009, the last year of the recession. Stainless steel has traditionally accounted for two-thirds of primary nickel use worldwide, with more than one-half of the steel going into the construction, food processing, and transportation sectors. Prepared by Emily K. Schnebele [(703) 648–4945, [email protected]]

115 NICKEL
In January, the LME cash mean for 99.8%-pure nickel was $8,480 per ton, a 13-year low. Nickel prices increased during the second half of 2016 following the historic low levels of late 2015 and early 2016. By October, the price had risen to $10,262 per ton. Decreased prices early in the year were largely attributed to an oversupply of nickel in the market, in particular, from the rampup of nickel refineries in Madagascar and Canada and the resolution of production problems at new ferronickel smelters in Brazil and New Caledonia. By mid-December, stocks in LME warehouses were more than 370,000 tons of nickel metal, more than four times the ending stocks of almost 91,000 tons at the end of 2011. The demand for nickel in uses other than stainless steel also decreased in 2016 owing to reduced U.S. oil and natural gas activities, although strong growth in the battery market compensated for this to some extent. The Philippines, the world’s leading producer of nickel ore, suspended one-half of its mining operations in September for failing to meet environmental standards, triggering a 2% increase in LME nickel prices, helping the recovery of global nickel prices. In response to the Indonesian ban in 2014 on direct shipping ore, companies from China, Indonesia, and Ukraine began building mining and smelting complexes on several islands in Indonesia. Some of these facilities began production in 2016. World Mine Production and Reserves: Reserves data for Australia, China, New Caledonia,5 the Philippines, and Russia were revised based on new information from company or Government reports. Mine production Reserves6 2015 2016e United States 27,200 25,000 160,000 Australia 222,000 206,000 719,000,000 Brazil 160,000 142,000 10,000,000 Canada 235,000 255,000 2,900,000 China 92,900 90,000 2,500,000 Colombia 40,400 36,800 1,100,000 Cuba 56,400 56,000 5,500,000 Guatemala 52,400 58,600 1,800,000 Indonesia 130,000 168,500 4,500,000 Madagascar 45,500 48,000 1,600,000 New Caledonia 186,000 205,000 6,700,000 Philippines 554,000 500,000 4,800,000 Russia 269,000 256,000 7,600,000 South Africa 56,700 50,000 3,700,000 Other countries 157,000 150,000 6,500,000 World total (rounded) 2,280,000 2,250,000 78,000,000 World Resources: Identified land-based resources averaging 1% nickel or greater contain at least 130 million tons of nickel, with about 60% in laterites and 40% in sulfide deposits. Extensive nickel resources also are found in manganese crusts and nodules on the ocean floor. The decline in discovery of new sulfide deposits in traditional mining districts has led to exploration in more challenging locations such as east-central Africa and the subarctic. Substitutes: Low-nickel, duplex, or ultrahigh-chromium stainless steels are being substituted for austenitic grades in construction. Nickel-free specialty steels are sometimes used in place of stainless steel in the power-generating and petrochemical industries. Titanium alloys can substitute for nickel metal or nickel-base alloys in corrosive chemical environments. Lithium-ion batteries may be used instead of nickel-metal hydride in certain applications.
eEstimated. W Withheld to avoid disclosing company proprietary data. — Zero. 1Scrap receipts – shipments by consumers + exports – imports + adjustments for consumer stock changes. 2Apparent primary consumption + reported secondary consumption. 3Estimated stocks of producers, agents, and dealers held in the United States only. 4Defined as imports – exports + adjustments for industry stock changes. 5One company in New Caledonia reported zero reserves owing to recent weakness of nickel prices, although the company continued to produce from that deposit. 6See Appendix C for resource and reserve definitions and information concerning data sources. 7For Australia, Joint Ore Reserves Committee-compliant reserves were about 6.4 million tons.
U.S. Geological Survey, Mineral Commodity Summaries, January 2017

116
NIOBIUM (COLUMBIUM)
(Data in metric tons of niobium content unless otherwise noted) Domestic Production and Use: Significant U.S. niobium mine production has not been reported since 1959. Domestic niobium resources are of low grade, some are mineralogically complex, and most are not commercially recoverable. Companies in the United States produced niobium-containing materials from imported niobium minerals, oxides, and ferroniobium. Niobium was consumed mostly in the form of ferroniobium by the steel industry and as niobium alloys and metal by the aerospace industry. Major end-use distribution of reported niobium consumption was as follows: steels, about 80%; and superalloys, about 20%. In 2016, the estimated value of niobium consumption was $300 million, as measured by the value of imports. Salient Statistics—United States: 2012 2013 2014 2015 2016e Production, mine — — — — — Imports for consumptione, 1 10,100 8,580 11,100 8,520 9,150 Exportse, 1 385 435 1,110 1,430 5,220 Government stockpile releases2 — — — — — Consumption:e Apparent 9,730 8,140 10,000 7,080 3,930 Reported3 7,460 7,500 8,210 7,510 7,350 Unit value, ferroniobium, dollars per kilogram4 27 27 25 24 20 Net import reliance5 as a percentage of apparent consumption 100 100 100 100 100 Recycling: Niobium was recycled when niobium-bearing steels and superalloys were recycled; scrap recovery, specifically for niobium content, was negligible. The amount of niobium recycled is not available, but it may be as much as 20% of apparent consumption. Import Sources (2012–15): Niobium ore and concentrate: Brazil, 38%; Rwanda, 25%; Australia, 8%; Canada, 8%; and other, 21%. Niobium metal and oxide: Brazil, 80%; Canada, 14%; and other, 6%. Total imports: Brazil, 80%; Canada, 14%; and other, 6%. Of the U.S. niobium material imports, 94% (by gross quantity) was ferroniobium and niobium metal and oxide. Tariff: Item Number Normal Trade Relations 12–31–16 Synthetic tantalum-niobium concentrates 2615.90.3000 Free. Niobium ores and concentrates 2615.90.6030 Free. Niobium oxide 2825.90.1500 3.7% ad val. Ferroniobium: Less than 0.02% P or S, or less than 0.4% Si 7202.93.4000 5% ad val. Other 7202.93.8000 5% ad val. Niobium: Waste and scrap6 8112.92.0600 Free. Unwrought, powders 8112.92.4000 4.9% ad val. Niobium, other6 8112.99.9000 4% ad val. Depletion Allowance: 22% (Domestic), 14% (Foreign). Government Stockpile: In the annual materials plan for FY 2017, the Defense Logistics Agency (DLA) Strategic Materials announced the 2017 maximum acquisition limit of 209 tons for ferroniobium. No disposals were planned.
Stockpile Status—9–30–167
Disposal Plan Disposals Material Inventory FY 2016 FY 2016 Ferroniobium 39 — — Niobium metal 10 — — Prepared by John F. Papp [(703) 648–4963, [email protected]]

117 NIOBIUM (COLUMBIUM)
Events, Trends, and Issues: Niobium principally was imported in the form of ferroniobium. Based on data through July of 2016, U.S. niobium apparent consumption (measured in contained niobium) was estimated to be 3,930 tons, 40% less than that of 2015, owing to increased exports. Brazil was the world’s leading niobium producer with 90% of global production, followed by Canada with 9%. One domestic company was working toward development of the only primary niobium deposit in the United States at its Elk Creek project in Nebraska, where it planned to begin production in 2017. The DLA Strategic Materials acquired ferroniobium for the U.S. stockpile, substantially increasing the amount of niobium in the stockpile. World Mine Production and Reserves: Mine production Reserves8 2015 2016e United States — — — Brazil 58,000 58,000 4,100,000 Canada 5,750 5,800 200,000 Other countries 570 200 NA World total (rounded) 64,300 64,000 >4,300,000 World Resources: World resources of niobium are more than adequate to supply projected needs. Most of the world’s identified resources of niobium occur as pyrochlore in carbonatite (igneous rocks that contain more than 50%- by-volume carbonate minerals) deposits and are outside the United States. The United States has approximately 150,000 tons of niobium in identified resources, most of which were considered subeconomic at 2016 prices for niobium. Substitutes: The following materials can be substituted for niobium, but a performance loss or higher cost may ensue: molybdenum and vanadium, as alloying elements in high-strength low-alloy steels; tantalum and titanium, as alloying elements in stainless- and high-strength steels; and ceramics, molybdenum, tantalum, and tungsten in high-temperature applications. eEstimated. NA Not available. — Zero. 1Imports and exports include the estimated niobium content of niobium and tantalum ores and concentrates, niobium oxide, ferroniobium, niobium unwrought alloys, metal, and powder. 2Government stockpile inventory reported by DLA Strategic Materials is the basis for estimating Government stockpile releases. 3Includes ferroniobium and nickel niobium. 4Unit value is mass-weighted average unit value of gross quantity of U.S. ferroniobium trade. (Trade is imports plus exports.) 5Defined as imports – exports + adjustments for Government and industry stock changes. 6This category includes materials other than niobium-containing material. 7See Appendix B for definitions. 8See Appendix C for resource and reserve definitions and information concerning data sources.
U.S. Geological Survey, Mineral Commodity Summaries, January 2017

118
NITROGEN (FIXED)—AMMONIA
(Data in thousand metric tons of nitrogen unless otherwise noted) Domestic Production and Use: Ammonia was produced by 13 companies at 31 plants in 15 States in the United States during 2016; 2 additional plants were idle for the entire year. About 60% of total U.S. ammonia production capacity was located in Louisiana, Oklahoma, and Texas because of their large reserves of natural gas, the dominant domestic feedstock for ammonia. In 2016, U.S. producers operated at about 80% of rated capacity. The United States was one of the world’s leading producers and consumers of ammonia. Urea, ammonium nitrate, ammonium phosphates, nitric acid, and ammonium sulfate were, in descending order of importance, the major derivatives of ammonia produced in the United States. Approximately 88% of apparent domestic ammonia consumption was for fertilizer use, including anhydrous ammonia for direct application, urea, ammonium nitrates, ammonium phosphates, and other nitrogen compounds. Ammonia also was used to produce explosives, plastics, synthetic fibers and resins, and numerous other chemical compounds. Salient Statistics—United States: 2012 2013 2014 2015 2016e Production 18,730 19,170 19,330 9,590 9,800 Imports for consumption2 5,170 4,960 4,150 4,320 3,930 Exports2 31 196 111 93 160 Consumption, apparent 13,900 13,900 13,300 13,700 13,600 Stocks, producer, yearend 180 4240 280 420 440 Price, dollars per short ton, average, f.o.b. Gulf Coast3 579 541 531 481 270 Employment, plant, numbere 1,100 1,200 1,200 1,200 1,200 Net import reliance4 as a percentage of apparent consumption 37 34 30 30 28 Recycling: None. Import Sources (2012–15): Trinidad and Tobago, 61%; Canada, 19%; Russia, 7%; Ukraine, 5%; and other, 8%. Tariff: Item Number Normal Trade Relations 12–31–16 Ammonia, anhydrous 2814.10.0000 Free. Urea 3102.10.0000 Free. Ammonium sulfate 3102.21.0000 Free. Ammonium nitrate 3102.30.0000 Free. Depletion Allowance: Not applicable. Government Stockpile: None. Events, Trends, and Issues: The Henry Hub spot natural gas price ranged between about $1.54 and $3.29 per million British thermal units for most of the year, with an average of about $2.60 per million British thermal units. Natural gas prices in 2016 were relatively stable; slightly higher prices were a result of increased demand for natural gas owing to cold temperatures and associated increased demand for power generation. The weekly average Gulf Coast ammonia price was $420 per short ton at the beginning of 2016 and decreased to $208 per short ton in October. The average ammonia price for 2016 was estimated to be about $270 per short ton. Declining global raw material costs, such as low prices of domestic natural gas and coal in China, resulted in the lower fertilizer prices in 2016. The U.S. Department of Energy, Energy Information Administration, projected that Henry Hub natural gas spot prices would average $3.12 per million British thermal units in 2017. A long period of stable and low natural gas prices in the United States has made it economical for companies to upgrade existing ammonia plants and plan for the construction of new nitrogen projects. During the next 4 years, it is expected that about 3.0 million tons of annual production capacity will be added in the United States. The additional capacity will reduce, but likely not eliminate, ammonia imports. Global ammonia capacity is expected to increase by 10% during the next 4 years. Capacity additions are expected in Africa, Asia (except East Asia), and Eastern Europe. For the first time in a decade, capacity in East Asia will not see any increase, a result of China removing small- to medium-size nitrogen facilities and canceling planned nitrogen projects. Prepared by Lori E. Apodaca [(703) 648–7724, [email protected]]

119 NITROGEN (FIXED)—AMMONIA
Large corn plantings increase the demand for nitrogen fertilizers. According to the U.S. Department of Agriculture, U.S. corn growers planted 38 million hectares of corn in the 2016 crop year (July 1, 2015, through June 30, 2016), which was 6% more than the area planted in 2015. Corn acreage in the 2017 crop year is expected to increase or remain the same in most States because of anticipated higher returns for corn compared with other crops. The largest increases in corn acreage are expected in Illinois, Iowa, Kansas, and North Dakota. World Ammonia Production and Reserves: Plant production Reserves5 2015 2016e United States 9,590 9,800 Available atmospheric nitrogen and sources Algeria 1,000 1,000 of natural gas for production of ammonia Australia 1,300 1,300 are considered adequate for all listed Belarus 1,060 1,100 countries. Canada 4,000 4,000 China 46,000 46,000 Egypt 2,200 2,200 France 2,600 2,600 Germany 2,500 2,500 India 10,800 11,000 Indonesia 5,000 5,000 Iran 2,500 2,500 Malaysia 1,000 1,000 Mexico 1,100 1,100 Netherlands 1,800 1,800 Oman 1,700 1,700 Pakistan 2,700 2,700 Poland 2,100 2,100 Qatar 3,050 3,000 Russia 12,000 12,000 Saudi Arabia 4,100 4,100 Trinidad and Tobago 4,700 4,700 Ukraine 2,400 2,400 United Kingdom 1,100 1,100 Uzbekistan 1,200 1,200 Venezuela 1,000 1,000 Other countries 12,800 13,000 World total (rounded) 141,000 140,000 World Resources: The availability of nitrogen from the atmosphere for fixed nitrogen production is unlimited. Mineralized occurrences of sodium and potassium nitrates, found in the Atacama Desert of Chile, contribute minimally to the global nitrogen supply. Substitutes: Nitrogen is an essential plant nutrient that has no substitute. No practical substitutes for nitrogen explosives and blasting agents are known.
eEstimated. 1Source: The Fertilizer Institute; data adjusted by the U.S. Geological Survey. 2Source: U.S. Census Bureau. 3Source: Green Markets. 4Defined as imports – exports + adjustments for industry stock changes. 5See Appendix C for resource and reserve definitions and information concerning data sources.
U.S. Geological Survey, Mineral Commodity Summaries, January 2017

120
PEAT
(Data in thousand metric tons unless otherwise noted)1 Domestic Production and Use: The estimated f.o.b. plant value of marketable peat production in the conterminous United States was $12.4 million in 2016. Peat was harvested and processed by about 30 companies in 11 of the conterminous States. Production estimates were unavailable for Alaska for 2015 and 2016. Florida and Minnesota were the leading producing States, in order of quantity harvested. Reed-sedge peat accounted for approximately 85% of the total volume produced, followed by sphagnum moss with 12%. About 94% of domestic peat was sold for horticultural use, including general soil improvement, nurseries, and potting soils. Other applications included earthworm culture medium, golf course construction, mixed fertilizers, mushroom culture, packing for flowers and plants, seed inoculants, and vegetable cultivation. In the industrial sector, peat was used as an oil absorbent and as an efficient filtration medium for the removal of waterborne contaminants in mine waste streams, municipal storm drainage, and septic systems. Salient Statistics—United States: 2012 2013 2014 2015 2016e Production 488 465 468 455 460 Commercial sales 484 453 479 460 480 Imports for consumption 909 915 994 1,150 1,050 Exports 75 41 29 28 27 Consumption, apparent2 1,240 1,380 1,390 1,620 1,480 Price, average value, f.o.b. mine, dollars per ton 24.44 25.37 24.97 28.37 27.00 Stocks, producer, yearend 218 174 222 179 180 Employment, mine and plant, numbere 580 560 550 550 550 Net import reliance3 as a percentage of apparent consumption 61 66 66 72 69 Recycling: None. Import Sources (2012–15): Canada, 96%; and other, 4%. Tariff: Item Number Normal Trade Relations 12–31–16 Peat 2703.00.0000 Free. Depletion Allowance: 5% (Domestic and foreign). Government Stockpile: None. Prepared by Lori E. Apodaca [(703) 648–7724, [email protected]]

121 PEAT
Events, Trends, and Issues: Peat is an important component of plant-growing media, and the demand for peat generally follows that of horticultural applications. In the United States, the short-term outlook is for production to average about 500,000 tons per year and imported peat from Canada to account for more than 60% of domestic consumption. The 2016 peat harvest season resulted in below expected harvest volumes for most of Canada’s production regions. Eastern Canada, the leading producing region, had a wet cool summer, which resulted in a slightly below average peat harvest. The Prairie Provinces experienced about a 20% decrease in the expected peat harvest as a result of poor weather conditions. The peat harvest in Quebec’s South Shore was mixed with only some of the peat producers achieving their expected peat harvest. In Quebec’s North Shore, which had unfavorable weather conditions throughout most of the harvest period, had a 25% decrease in the expected peat harvest. World Mine Production and Reserves: Countries that reported by volume only and had insufficient data for conversion to tons were combined and included with “Other countries.” Mine production Reserves4 2015 2016e United States 455 460 150,000 Belarus 1,620 1,800 2,600,000 Canada 1,190 1,200 720,000 Estonia 970 800 60,000 Finland 7,470 6,500 6,000,000 Germany 3,000 3,000 (5) Ireland 4,100 4,100 (5) Latvia 1,210 1,200 190,000 Lithuania 553 550 190,000 Moldova 480 480 (5) Norway 500 500 (5) Poland 600 900 (5) Russia 1,300 1,300 1,000,000 Sweden 3,600 3,600 (5) Ukraine 580 600 (5) Other countriese 690 690 1,400,000 World total (rounded) 28,300 28,000 12,000,000 World Resources: Peat is a renewable resource, continuing to accumulate on 60% of global peatlands. However, the volume of global peatlands has been decreasing at a rate of 0.05% annually owing to harvesting and land development. Many countries evaluate peat resources based on volume or area because the variations in densities and thickness of peat deposits make it difficult to estimate tonnage. Volume data have been converted using the average bulk density of peat produced in that country. Reserves data were estimated based on data from International Peat Society publications and the percentage of peat resources available for peat extraction. More than 50% of the U.S. peatlands are located in undisturbed areas of Alaska. Total world resources of peat were estimated to be between 5 trillion and 6 trillion tons, covering about 400 million hectares.6 Substitutes: Natural organic materials, such as composted yard waste and coir (coconut fiber), compete with peat in horticultural applications. Shredded paper and straw are used to hold moisture for some grass-seeding applications. The superior water-holding capacity and physiochemical properties of peat limit substitution alternatives.
eEstimated. 1See Appendix A for conversion to short tons. 2Defined as production + imports – exports + adjustments for industry stock changes. 3Defined as imports – exports + adjustments for industry stock changes. 4See Appendix C for resource and reserve definitions and information concerning data sources. 5Included with “Other countries.” 6Lappalainen, Eino, 1996, Global peat resources: Jyvaskyla, Finland, International Peat Society, p. 55.
U.S. Geological Survey, Mineral Commodity Summaries, January 2017

122
PERLITE
(Data in thousand metric tons unless otherwise noted)
Domestic Production and Use: In 2016, domestic production of processed crude perlite was estimated to be 473,000 tons with a value of $28.9 million. Crude ore production was from seven mines operated by six companies in five Western States. New Mexico continued to be the leading producing State. Processed crude perlite was expanded at 46 plants in 28 States. Domestic apparent consumption was 585,000 tons. The applications for expanded perlite were building construction products, 53%; horticultural aggregate, 15%; fillers, 15%; filter aid, 9%; and other, 8%. Other applications included specialty insulation and miscellaneous uses. Salient Statistics—United States: 2012 2013 2014 2015 2016e Production, processed crude perlite 393 419 462 459 473 Imports for consumption1 150 187 166 155 160 Exports1 38 51 46 40 48 Consumption, apparent 505 555 582 574 585 Price, average value, dollars per ton, f.o.b. mine 52 55 55 60 61 Employment, mine and mill 95 117 119 142 135 Net import reliance2 as a percentage of apparent consumption 22 25 21 20 19 Recycling: Not available. Import Sources (2012–15): Greece, 95%; Mexico, 2%; Turkey, 2%; and other, 1%. Tariff: Item Number Normal Trade Relations 12–31–16 Vermiculite, perlite and chlorites, unexpanded 2530.10.0000 Free. Depletion Allowance: 10% (Domestic and foreign). Government Stockpile: None. Prepared by Shawnna M. Bennett [(703) 648–7715, [email protected]]

123 PERLITE
Events, Trends, and Issues: Perlite is a siliceous volcanic glass that expands up to 20 times its original volume when rapidly heated. Expanded perlite is used to provide moisture retention and aeration when added to soil. Construction applications for expanded perlite are numerous because it is lightweight, fire resistant, and an excellent insulator. In 2016, the quantity of processed crude perlite sold or used by U.S. mines increased to the highest level since 2005, and estimated apparent consumption increased to its highest level since 2011. Increased demand for perlite-based construction products, fillers, and filter aids in 2014 through 2016 was supplied by increased domestic production. Net import reliance, as a percent of apparent consumption, decreased to its lowest level since 2001. Novel and small markets for perlite have increased during the past 10 years, one of the applications being the use of perlite as an alternative to microbeads in bath products and makeup. Domestic perlite mining generally takes place in remote areas, and its environmental impact is not severe. The mineral fines, overburden, and reject ore produced during ore mining and processing are used to reclaim the mined-out areas, and, therefore, little waste remains. Airborne dust is captured by baghouses, and virtually no runoff contributes to water pollution. New information for China’s perlite production for 2011–15 was received from industry sources. Inclusion of this data in world totals results in a significant increase in tabulated world production compared with previous tabulations. Exclusive of China, world perlite production was estimated to be approximately 2.8 million tons in 2016; however, with production in China included, world production was estimated to be about 4.6 million tons. Based on the newly included estimates for China’s production, the world’s leading producers were, in descending order of production, China, Greece, Turkey, and the United States, with 40%, 20%, 20%, and 10%, respectively, of world production. It was noted in prior publications that China was the source country for nearly 15% of the world’s processed crude perlite exports, but insufficient production data for China and several other countries were available to make reliable estimates of their production. Although China was the leading producer, most was believed to be consumed internally. Greece and Turkey remained the leading exporters of perlite. World Processed Perlite Production and Reserves: The estimates of reserves were revised for Hungary and Turkey based on new information from official Government sources. Production Reserves3 2015 2016e United States 459 473 50,000 China 1,800 1,800 NA Greece 1,000 1,100 50,000 Hungary 40 40 28,000 Iran 60 60 NA Mexico 26 30 NA Turkey 925 1,000 57,000 Other countries 70 70 NA World total (rounded) 4,380 4,600 NA World Resources: Insufficient information is available to make reliable estimates of resources in perlite-producing countries. Substitutes: In construction applications, diatomite, expanded clay and shale, pumice, and slag can be substituted for perlite. For horticultural uses, vermiculite, coco coir, and pumice are alternative soil additives and are sometimes used in conjunction with perlite. eEstimated. NA Not available. 1Exports and imports were estimated by the U.S. Geological Survey from U.S. Census Bureau combined data for vermiculite, and perlite and chlorites. 2Defined as imports − exports. 3See Appendix C for resource and reserve definitions and information concerning data sources.
U.S. Geological Survey, Mineral Commodity Summaries, January 2017

124
PHOSPHATE ROCK
(Data in thousand metric tons unless otherwise noted) Domestic Production and Use: Phosphate rock ore was mined by five firms at 10 mines in four States and processed into an estimated 27.8 million tons of marketable product, valued at $2.1 billion, f.o.b. mine. Florida and North Carolina accounted for more than 75% of total domestic output; the remainder was produced in Idaho and Utah. Marketable product refers to beneficiated phosphate rock with phosphorus pentoxide (P2O5) content suitable for phosphoric acid or elemental phosphorus production. More than 95% of the phosphate rock mined in the United States was used to manufacture wet-process phosphoric acid and superphosphoric acid, which were used as intermediate feedstocks in the manufacture of granular and liquid ammonium phosphate fertilizers and animal feed supplements. Approximately 50% of the wet-process phosphoric acid produced was exported in the form of upgraded granular diammonium and monoammonium phosphate fertilizer, and merchant-grade phosphoric acid. The balance of the phosphate rock mined was for the manufacture of elemental phosphorus, which was used to produce phosphorus compounds for industrial applications. Salient Statistics—United States: 2012 2013 2014 2015 2016e Production, marketable 30,100 31,200 25,300 27,400 27,800 Used by producers 27,300 28,800 26,700 26,200 26,500 Imports for consumption 3,570 3,170 2,390 1,960 1,600 Consumption, apparent1 30,900 31,900 29,100 28,100 28,100 Price, average value, dollars per ton, f.o.b. mine2 102.54 91.11 78.59 72.41 77.00 Stocks, producer, yearend 6,700 9,000 5,880 6,730 7,400 Employment, mine and beneficiation plant, numbere 2,230 2,170 2,100 2,000 2,000 Net import reliance3 as a percentage of apparent consumption 5 3 18 4 3 Recycling: None. Import Sources (2012–15): Peru, 58%; and Morocco, 42%. Tariff: Item Number Normal Trade Relations 12–31–16 Natural calcium phosphates: Unground 2510.10.0000 Free. Ground 2510.20.0000 Free. Depletion Allowance: 14% (Domestic and foreign). Government Stockpile: None. Events, Trends, and Issues: In 2016, estimated U.S. phosphate rock production was slightly higher than that in 2015, but consumption was unchanged and stocks increased. In the first half of 2016, some producers reduced production of phosphoric acid and fertilizers in response to reduced world demand and lower fertilizer prices. Domestic phosphate rock production capacity was 32.8 million tons in 2016. Two new mines remained in the permitting phase in Florida. The mines will be replacements for existing mines that were planned to be exhausted in the next decade. In Idaho, one existing producer planned to open a new mine in late 2017 to replace its current mine, which was expected to be depleted in late 2017. A Canadian firm continued permitting activities and soliciting investment for a new underground phosphate rock mine in southeastern Idaho. The mine was not expected to begin production until after 2018. World production of phosphate rock was estimated to have increased in 2016, mainly because of growth in China and Tunisia. However, fertilizer industry associations and analysts have estimated that, based on reported fertilizer production and trade data, official Chinese production data have been overstated and may have been 85 million tons of marketable rock in 2015. Estimated production for China in 2016 was based on official statistics from the National Bureau of Statistics of China. Prepared by Stephen M. Jasinski [(703) 648–7711, [email protected]]

125 PHOSPHATE ROCK
World phosphate rock production capacity was expected to increase by 2% per year through 2020, based on lower estimated production from China. The largest areas of growth were planned for Africa and the Middle East. In Morocco, work continued on the expansion of phosphate rock mines and processing facilities, which was expected to double phosphate rock production capacity by 2020. A new 5.3-million-ton-per-year phosphate mining and processing complex remained on schedule to open in 2017 in Saudi Arabia. The major U.S. phosphate rock producer is part of a joint venture in the project. Other significant phosphate rock projects were expected to begin by 2020 in Algeria, Brazil, Egypt, Jordan, Kazakhstan, Peru, Russia, and Senegal. Continued population growth will require a growing supply of phosphate rock to produce fertilizers for crops, animal feed supplements, and industrial applications (in order of importance). World consumption of P2O5 contained in all uses was expected to increase incrementally to 48.9 million tons in 2020 from 44.5 million tons in 2016. World Mine Production and Reserves: Reserves for China were updated with information from official sources. Reserves for Saudi Arabia were updated with information from company reports. The phosphate rock mines in Iraq and Syria were reported to be closed in late 2015 because of ongoing conflicts in that region. Iraq only reported a small quantity of production in 2015; therefore, it was placed in the “Other countries” category. Mine production Reserves4 2015 2016e United States 27,400 27,800 1,100,000 Algeria 1,400 1,500 2,200,000 Australia 2,500 2,500 1,100,000 Brazil 6,100 6,500 320,000 China5 120,000 138,000 3,100,000 Egypt 5,500 5,500 1,200,000 India 1,500 1,500 65,000 Israel 3,540 3,500 130,000 Jordan 8,340 8,300 1,200,000 Kazakhstan 1,840 1,800 260,000 Mexico 1,680 1,700 30,000 Morocco and Western Sahara 29,000 30,000 50,000,000 Peru 3,880 4,000 820,000 Russia 11,600 11,600 1,300,000 Saudi Arabia 4,000 4,000 680,000 Senegal 1,240 1,250 50,000 South Africa 1,980 1,700 1,500,000 Syria 750 — 1,800,000 Togo 1,100 900 30,000 Tunisia 2,800 3,500 100,000 Vietnam 2,500 2,800 30,000 Other countries 2,470 2,410 810,000 World total (rounded) 241,000 261,000 68,000,000 World Resources: Some world reserves were reported only in terms of ore and grade. Phosphate rock resources occur principally as sedimentary marine phosphorites. The largest sedimentary deposits are found in northern Africa, China, the Middle East, and the United States. Significant igneous occurrences are found in Brazil, Canada, Finland, Russia, and South Africa. Large phosphate resources have been identified on the continental shelves and on seamounts in the Atlantic Ocean and the Pacific Ocean. World resources of phosphate rock are more than 300 billion tons. There are no imminent shortages of phosphate rock. Substitutes: There are no substitutes for phosphorus in agriculture. eEstimated. — Zero. 1Defined as phosphate rock sold or used + imports. 2Marketable phosphate rock, weighted value, all grades. 3Defined as imports – exports + adjustments for industry stock changes. 4See Appendix C for resource and reserve definitions and information concerning data sources. 5Production data for large mines only, as reported by National Bureau of Statistics of China.
U.S. Geological Survey, Mineral Commodity Summaries, January 2017

126
PLATINUM-GROUP METALS
(Platinum, palladium, rhodium, ruthenium, iridium, and osmium) (Data in kilograms of metal content unless otherwise noted)
Domestic Production and Use: In 2016, one domestic company produced about 17,000 kilograms of platinum-group metals (PGMs) with an estimated value of about $390 million from its two mines in south-central Montana. Small quantities of primary PGMs were also recovered as byproducts of copper refining. The leading use for PGMs was in catalytic converters to decrease harmful emissions from automobiles. PGMs are also used in catalysts for bulk-chemical production and petroleum refining; in electronic applications, such as in computer hard disks, in multilayer ceramic capacitors, and in hybridized integrated circuits; in glass manufacturing; in jewelry; and in laboratory equipment. Platinum is used in the medical sector; platinum and palladium, along with gold-silver-copper-zinc alloys, are used as dental restorative materials. Platinum, palladium, and rhodium are used as investments as exchange-traded products, and individual holding of physical bars and coins. Salient Statistics—United States: 2012 2013 2014 2015 2016e Mine production:1 Platinum 3,670 3,720 3,660 3,670 3,900 Palladium 12,300 12,600 12,400 12,500 13,200 Imports for consumption: Platinum2, 3 44,700 38,600 45,800 42,700 47,000 Platinum waste and scrap 127,000 77,200 112,000 123,000 189,000 Palladium 80,100 83,100 92,400 82,500 70,000 Rhodium 12,800 11,100 11,100 10,600 11,000 Ruthenium 10,200 15,300 11,100 8,230 7,000 Iridium 1,230 1,720 1,990 1,010 1,000 Osmium 130 77 322 8 3 Exports: Platinum3 8,630 11,200 14,800 14,400 10,000 Platinum waste and scrap 84,800 364,000 254,000 246,000 287,000 Palladium 32,200 25,900 22,500 23,000 19,000 Rhodium 1,040 1,220 428 758 800 Other PGMs 1,640 1,320 901 782 600 Price,4 dollars per troy ounce: Platinum 1,555.39 1,489.57 1,387.89 1,056.09 1,000.00 Palladium 649.27 729.58 809.89 694.99 615.00 Rhodium 1,274.98 1,069.10 1,174.23 954.90 670.00 Ruthenium 112.26 75.63 65.13 47.63 42.00 Iridium 1,066.23 826.45 556.19 544.19 575.00 Employment, mine, number1 1,670 1,780 1,620 1,440 1,400 Net import reliance5 as a percentage of apparent consumption: Platinum2 73 67 67 69 73 Palladium 57 60 65 52 48 Recycling: About 125,000 kilograms of platinum, palladium, and rhodium was recovered globally from new and old scrap in 2016, including about 56,000 kilograms recovered from automobile catalytic converters in the United States. Import Sources (2012–15): Platinum: 2 South Africa, 39%; Germany and United Kingdom, 13% each; Italy, 7%; and other, 28%. Palladium: South Africa, 27%; Russia, 24%; Italy, 13%; United Kingdom, 8%; and other, 28%. Tariff: All unwrought and semimanufactured forms of PGMs are imported duty free. Depletion Allowance: 22% (Domestic), 14% (Foreign). Government Stockpile:
Stockpile Status—9–30–166 Disposal Plan Disposals Material Inventory FY 2016 FY 2016 Platinum 261 — — Iridium 15 — — Prepared by Patricia J. Loferski [(703) 648–7708, [email protected]]

127 PLATINUM-GROUP METALS
Events, Trends, and Issues: Metal prices remained low in 2016. With the exception of iridium, the annual average prices for all PGMs decreased from 2015. The annual average price for rhodium, which dropped by about 30% to its lowest level since 2003, was in response to weak industrial demand and selloff by investors. From July through September, the monthly average price for rhodium was below that for palladium for the first time ever. In January, the average monthly price for platinum was at its lowest level since 2008. The monthly average prices for platinum and palladium trended upward from January through August before decreasing in September. Daily prices for platinum remained below those for gold for the entire year. Monthly average iridium prices increased significantly from July through September, owing to increased buying by industrial consumers in Asia and a lack of iridium available from producers in South Africa. Production by the sole U.S. PGM-mining company increased by 6% from that in 2015. The company accelerated the schedule for expansion development adjacent to one of its mines, anticipating first production in late 2017 or early 2018. The company continued to increase recovery of PGMs from recycled catalytic converters. Low metal prices continued to adversely affect the mining industry in South Africa, the world’s leading producer of platinum. Faced with lower earnings, mining companies continued efforts to cut costs by lowering production, selling or closing mines, and reducing the workforce. Some mines were placed on care-and-maintenance status; one company placed all expansion plans on hold until 2017. Mines continued to face safety failures and labor unrest. The leading mining companies began wage negotiations with workers in July. In September, after wage negotiations with the two leading producers reached an impasse, workers at one of the companies went on strike. In 2014, a 5-month-long workers’ strike significantly reduced production. Introduction of more stringent emission standards for automobiles in some countries is expected to result in increased demand for palladium, platinum, and rhodium for use in catalytic converters. Automobile production increased in developing countries, which in turn is expected to increase demand for PGMs beyond 2016. World Mine Production and Reserves: Reserves estimates for Zimbabwe were included based on company data. Mine production PGMs Platinum Palladium Reserves7 2015 2016e 2015 2016e United States 3,670 3,900 12,500 13,200 900,000 Canada 7,600 9,000 21,000 23,000 310,000 Russia 22,000 23,000 81,000 82,000 1,100,000 South Africa 139,000 120,000 83,000 73,000 63,000,000 Zimbabwe 12,600 13,000 10,000 10,000 1,200,000 Other countries 4,000 3,400 8,300 6,600 NA World total (rounded) 189,000 172,000 216,000 208,000 67,000,000 World Resources: World resources of PGMs are estimated to total more than 100 million kilograms. The largest reserves are in the Bushveld Complex in South Africa. Substitutes: Less-expensive palladium has been substituted for platinum in most gasoline-engine catalytic converters. About 25% palladium can routinely be substituted for platinum in diesel catalytic converters; the proportion can be as much as 50% in some applications. For some industrial end uses, one PGM can substitute for another, but with losses in efficiency. eEstimated. NA Not available. — Zero. 1Estimates from published sources. 2Data series revised to exclude imports of waste and scrap. 3Includes data for the following HTS codes: 7110.11.0000, 7110.11.0010, 7110.11.0020, 7110.11.0050, 7110.19.0000, 7110.21.0000, 7110.29.0000, 7110.31.0000, 7110.39.0000, 7110.41.0000, 7110.41.0010, 7110.41.0020, 7110.41.0030, 7110.49.0000, 7110.49.0010, and 7118.90.0020. 4Engelhard Corp. unfabricated metal. 5Defined as imports – exports + adjustments for industry stock changes. 6See Appendix B for definitions. 7See Appendix C for resource and reserve definitions and information concerning data sources.
U.S. Geological Survey, Mineral Commodity Summaries, January 2017
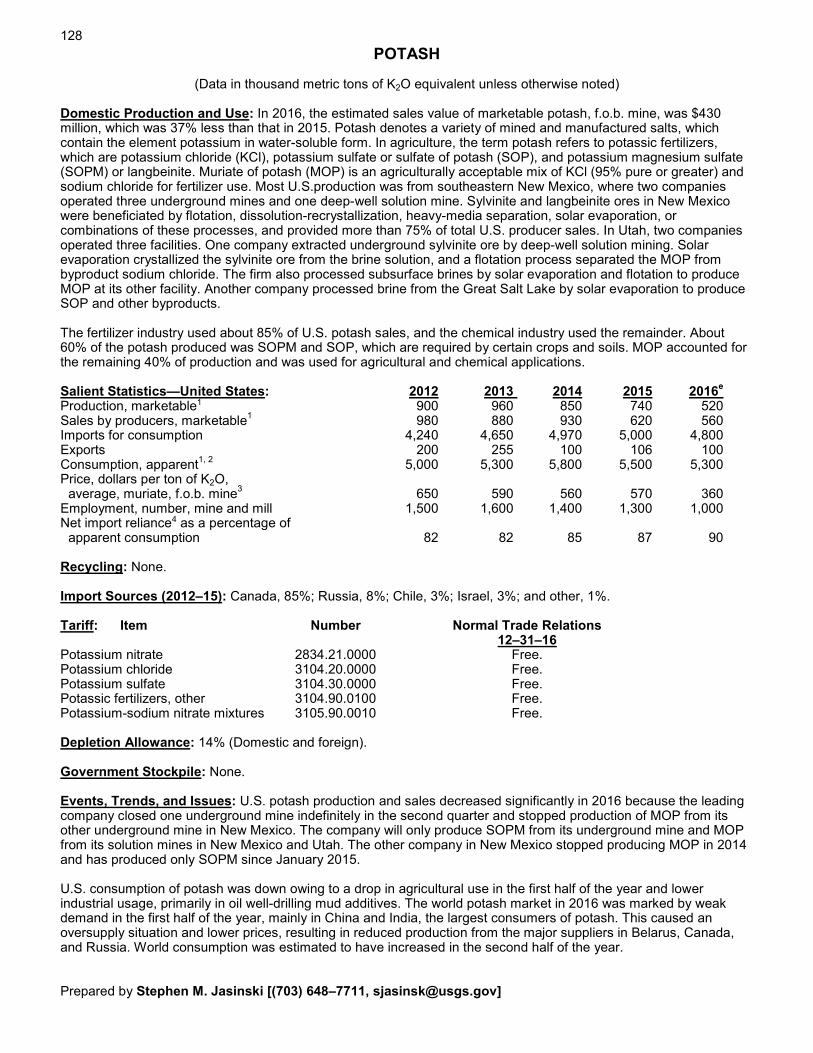
128
POTASH
(Data in thousand metric tons of K2O equivalent unless otherwise noted) Domestic Production and Use: In 2016, the estimated sales value of marketable potash, f.o.b. mine, was $430 million, which was 37% less than that in 2015. Potash denotes a variety of mined and manufactured salts, which contain the element potassium in water-soluble form. In agriculture, the term potash refers to potassic fertilizers, which are potassium chloride (KCl), potassium sulfate or sulfate of potash (SOP), and potassium magnesium sulfate (SOPM) or langbeinite. Muriate of potash (MOP) is an agriculturally acceptable mix of KCl (95% pure or greater) and sodium chloride for fertilizer use. Most U.S.production was from southeastern New Mexico, where two companies operated three underground mines and one deep-well solution mine. Sylvinite and langbeinite ores in New Mexico were beneficiated by flotation, dissolution-recrystallization, heavy-media separation, solar evaporation, or combinations of these processes, and provided more than 75% of total U.S. producer sales. In Utah, two companies operated three facilities. One company extracted underground sylvinite ore by deep-well solution mining. Solar evaporation crystallized the sylvinite ore from the brine solution, and a flotation process separated the MOP from byproduct sodium chloride. The firm also processed subsurface brines by solar evaporation and flotation to produce MOP at its other facility. Another company processed brine from the Great Salt Lake by solar evaporation to produce SOP and other byproducts. The fertilizer industry used about 85% of U.S. potash sales, and the chemical industry used the remainder. About 60% of the potash produced was SOPM and SOP, which are required by certain crops and soils. MOP accounted for the remaining 40% of production and was used for agricultural and chemical applications. Salient Statistics—United States: 2012 2013 2014 2015 2016e Production, marketable1 900 960 850 740 520 Sales by producers, marketable1 980 880 930 620 560 Imports for consumption 4,240 4,650 4,970 5,000 4,800 Exports 200 255 100 106 100 Consumption, apparent1, 2 5,000 5,300 5,800 5,500 5,300 Price, dollars per ton of K2O, average, muriate, f.o.b. mine3 650 590 560 570 360 Employment, number, mine and mill 1,500 1,600 1,400 1,300 1,000 Net import reliance4 as a percentage of apparent consumption 82 82 85 87 90 Recycling: None. Import Sources (2012–15): Canada, 85%; Russia, 8%; Chile, 3%; Israel, 3%; and other, 1%. Tariff: Item Number Normal Trade Relations 12–31–16 Potassium nitrate 2834.21.0000 Free. Potassium chloride 3104.20.0000 Free. Potassium sulfate 3104.30.0000 Free. Potassic fertilizers, other 3104.90.0100 Free. Potassium-sodium nitrate mixtures 3105.90.0010 Free. Depletion Allowance: 14% (Domestic and foreign). Government Stockpile: None. Events, Trends, and Issues: U.S. potash production and sales decreased significantly in 2016 because the leading company closed one underground mine indefinitely in the second quarter and stopped production of MOP from its other underground mine in New Mexico. The company will only produce SOPM from its underground mine and MOP from its solution mines in New Mexico and Utah. The other company in New Mexico stopped producing MOP in 2014 and has produced only SOPM since January 2015. U.S. consumption of potash was down owing to a drop in agricultural use in the first half of the year and lower industrial usage, primarily in oil well-drilling mud additives. The world potash market in 2016 was marked by weak demand in the first half of the year, mainly in China and India, the largest consumers of potash. This caused an oversupply situation and lower prices, resulting in reduced production from the major suppliers in Belarus, Canada, and Russia. World consumption was estimated to have increased in the second half of the year. Prepared by Stephen M. Jasinski [(703) 648–7711, [email protected]]

129 POTASH
The U.S. producer of SOP from the Great Salt Lake was expected to complete an expansion to its facility in 2017 that will increase production capacity from 290,000 tons per year of SOP to 500,000 tons per year of SOP. The increase includes SOP produced from solar evaporation and purchased KCl. A Canadian company continued predevelopment activity on a new underground mine in southeastern New Mexico, which will produce SOP only. The company planned to begin production after 2018, with an annual production capacity of 650,000 tons of SOP. According to the industry producers association, world consumption for all uses of potash was projected to increase gradually from 39 million tons K2O in 2016 to 43 million tons of K2O in 2019. Asia and South America would account for most of the growth in consumption. Annual production capacity was projected to increase globally from 56 million tons in 2016 to 65 million tons in 2020. Potash exploration and development is expected to remain very active during the next decade. In 2016, about 30 potash-mining projects were in progress worldwide that were expected to be completed between 2016 and 2020. The majority of the new capacity would be from projects in Belarus, Canada, China, Russia, and Turkmenistan. Other projects in various stages of development in Argentina, Australia, Brazil, Canada, Congo (Brazzaville), Eritrea, Ethiopia, Kazakhstan, Laos, Peru, Thailand, and the United Kingdom were not expected to be completed until after 2021. World Mine Production and Reserves: Reserves for China and Russia were revised using official Government information. Reserves for the United States were revised to include updates by the existing producers and for a new mine planned in New Mexico. Mine production Reserves5 2015 2016e Recoverable ore K2O equivalent United States1 740 520 1,200,000 270,000 Belarus 6,470 6,400 3,300,000 750,000 Brazil 293 300 300,000 13,000 Canada 11,400 10,000 4,200,000 1,000,000 Chile 1,200 1,200 NA 150,000 China 6,200 6,200 NA 360,000 Germany 3,100 3,100 NA 150,000 Israel 1,260 1,300 NA 6270,000 Jordan 1,410 1,400 NA 6270,000 Russia 6,990 6,500 3,000,000 860,000 Spain 690 700 NA 20,000 United Kingdom 610 600 NA 70,000 Other countries 300 300 250,000 90,000 World total (rounded) 40,700 39,000 NA 4,300,000 World Resources: Estimated domestic potash resources total about 7 billion tons. Most of these lie at depths between 1,800 and 3,100 meters in a 3,110-square-kilometer area of Montana and North Dakota as an extension of the Williston Basin deposits in Manitoba and Saskatchewan, Canada. The Paradox Basin in Utah contains resources of about 2 billion tons, mostly at depths of more than 1,200 meters. The Holbrook Basin of Arizona contains resources of about 0.7 to 2.5 billion tons. A large potash resource lies about 2,100 meters under central Michigan and contains more than 75 million tons. Estimated world resources total about 250 billion tons. Substitutes: No substitutes exist for potassium as an essential plant nutrient and as an essential nutritional requirement for animals and humans. Manure and glauconite (greensand) are low-potassium-content sources that can be profitably transported only short distances to the crop fields. eEstimated. NA Not available. 1Data are rounded to no more than two significant digits to avoid disclosing company proprietary data. 2Defined as sales + imports – exports. 3Average prices based on actual sales; excludes soluble and chemical muriates. 4Defined as imports – exports. 5See Appendix C for resource and reserve definitions and information concerning data sources. 6Total reserves in the Dead Sea are divided equally between Israel and Jordan for inclusion in this tabulation.
U.S. Geological Survey, Mineral Commodity Summaries, January 2017

130
PUMICE AND PUMICITE
(Data in thousand metric tons unless otherwise noted) Domestic Production and Use: In 2016, 10 operations in five States produced pumice and pumicite. Estimated production1 was 310,000 tons with an estimated processed value of about $10.2 million, f.o.b. plant. Pumice and pumicite were mined in Oregon, Idaho, California, New Mexico, and Kansas, in descending order of production. About 50% of mined pumice was used in the production of construction building block and 20% was used for horticultural purposes. The remainder was consumed in abrasives, concrete admixtures and aggregates, and other uses, including absorbent, filtration, laundry stone washing, and road use. Salient Statistics—United States: 2012 2013 2014 2015 2016e Production, mine1 338 269 269 310 310 Imports for consumption 67 72 60 64 85 Exportse 13 13 14 11 8 Consumption, apparent 392 329 315 362 387 Price, average value, dollars per ton, f.o.b. mine or mill 31.85 34.65 38.52 32.68 33.00 Employment, mine and mill, number 140 140 140 140 140 Net import reliance2 as a percentage of apparent consumption 14 18 15 15 20 Recycling: Not available. Import Sources (2012–15): Greece, 92%; Iceland, 6%; and Mexico, 2%. Tariff: Item Number Normal Trade Relations 12–31–16 Pumice, crude or in irregular pieces, including crushed 2513.10.0010 Free. Pumice, other 2513.10.0080 Free. Depletion Allowance: 5% (Domestic and foreign). Government Stockpile: None. Prepared by Robert D. Crangle, Jr. [(703) 648–6410, [email protected]]

131 PUMICE AND PUMICITE
Events, Trends, and Issues: The amount of domestically produced pumice and pumicite sold or used in 2016 was essentially unchanged from that in 2015, but was 15% greater than that in 2014. Imports increased and exports decreased compared with those of 2015. Almost all imported pumice originated from Greece in 2016, and primarily supplied markets in the eastern and gulf coast regions of the United States. Turkey and Italy are the leading global producers of pumice and pumicite. Although pumice and pumicite are plentiful in the Western United States, legal challenges and public land designations could limit access to known deposits. Pumice and pumicite production is sensitive to mining and transportation costs. Although unlikely in the short term, an increase in fuel prices would likely lead to increases in production costs; imports and competing materials could become attractive substitutes for domestic products. All known domestic pumice and pumicite mining in 2016 was accomplished through open pit methods, generally in remote areas where land-use conflicts were not significant obstacles. Although the generation and disposal of reject fines in mining and milling resulted in local dust issues at some operations, the environmental impact was restricted to a relatively small geographic area. World Mine Production and Reserves: Mine production Reserves3 2015 2016e United States1 310 310 Large in the United States. Quantitative Algeria4 350 350 estimates of reserves for most countries Cameroon4 360 360 are not available. Chile4 830 830 Ecuador4 175 180 Ethiopia 600 600 France4 276 280 Greece4 720 720 Guadeloupe 200 200 Italy4 4,040 4,000 Saudi Arabia4 480 480 Spain 195 200 Syria4 257 260 Turkey 6,700 6,700 Uganda 742 740 Other countries4 711 710 World total (rounded) 16,900 16,900 World Resources: The identified U.S. resources of pumice and pumicite are concentrated in the Western States and estimated to be more than 25 million tons. The estimated total resources (identified and undiscovered) in the Western and Great Plains States are at least 250 million tons and may total more than 1 billion tons. Large resources of pumice and pumicite have been identified on all continents. Substitutes: The costs of transportation determine the maximum economic distance pumice and pumicite can be shipped and still remain competitive with alternative materials. Competitive materials that may be substituted for pumice and pumicite include crushed aggregates, diatomite, expanded shale and clay, and vermiculite. eEstimated. 1Quantity sold and used by producers. 2Defined as imports – exports. 3See Appendix C for resource and reserve definitions and information concerning data sources. 4Includes pozzolan and (or) volcanic tuff.
U.S. Geological Survey, Mineral Commodity Summaries, January 2017

132
QUARTZ CRYSTAL (INDUSTRIAL)
(Data in kilograms unless otherwise noted) Domestic Production and Use: Cultured quartz crystal is electronic-grade quartz crystal that is manufactured, not mined. In the past, cultured quartz was primarily produced using lascas1 as raw quartz feed material. Lascas mining and processing in Arkansas ended in 1997. Cultured quartz crystal is produced by two companies in the United States, but production statistics were not available. One of these companies uses cultured quartz crystal that has been rejected during the manufacturing process, owing to crystallographic imperfections, as feed material. The companies may use a mix of cultured quartz and imported lascas as feed material. In the past several years, cultured quartz crystal has been increasingly produced overseas, primarily in Asia. Electronic applications accounted for most industrial uses of quartz crystal; other uses included special optical applications. Virtually all quartz crystal used for electronics was cultured, rather than natural, crystal. Electronic-grade quartz crystal is essential for making frequency filters, frequency controls, and timers in electronic circuits employed for a wide range of products, such as communications equipment, computers, and many consumer goods, such as electronic games and television receivers. Salient Statistics—United States: The U.S. Census Bureau, which is the primary Government source of U.S. trade data, does not provide import or export statistics specific to lascas or electronic and optical-grade quartz crystal, but does report specifically on mounted piezoelectric crystals. The price of as-grown cultured quartz was estimated to be $280 per kilogram in 2016, unchanged from 2015. Lumbered quartz, which is as-grown cultured quartz that has been processed by sawing and grinding, was estimated to be $160 per kilogram in 2016, but the price can range from $20 per kilogram to more than $1,000 per kilogram, depending on the application. Other salient statistics were not available. Recycling: An unspecified amount of rejected cultured quartz crystal was used as feed material for the production of cultured quartz crystal. Import Sources (2012–15): Although no definitive data exist listing import sources for cultured quartz crystal, imported material is thought to be mostly from China, Japan, Romania, and the United Kingdom. Tariff: Item Number Normal Trade Relations 12–31–16 Quartz (including lascas) 2506.10.0050 Free. Piezoelectric quartz 7104.10.0000 3% ad val. Depletion Allowance: 22% (Domestic), 14% (Foreign). Government Stockpile: As of September 30, 2016, the National Defense Stockpile (NDS) contained 7,148 kilograms of natural quartz crystal. The stockpile has 11 weight classes for natural quartz crystal that range from 0.2 kilogram to more than 10 kilograms. The stockpiled crystals, however, are primarily in the larger weight classes. The larger pieces are suitable as seed crystals, which are very thin crystals cut to exact dimensions, to produce cultured quartz crystal. In addition, many of the stockpiled crystals could be of interest to the specimen and gemstone industry. Little, if any, of the stockpiled material is likely to be used in the same applications as cultured quartz crystal. No natural quartz crystal was sold from the NDS in 2016. Previously, only individual crystals in the stockpile that weighed 10 kilograms or more and that could be used as seed material were sold.
Stockpile Status—9–30–162 Disposal Plan Disposals Material Inventory FY 2016 FY 2016 Quartz crystal 7,148 — — Prepared by Thomas P. Dolley [(703) 648–7710, [email protected]]

133 QUARTZ CRYSTAL (INDUSTRIAL)
Events, Trends, and Issues: Demand for quartz crystal for frequency-control oscillators and frequency filters in a variety of electronic devices is expected to remain stable. However, silicon has replaced quartz crystal in two very important markets—cellular telephones and other mobile devices, and automotive stability control applications. Future capacity increases to grow quartz crystal may be negatively affected by this development. Growth of the consumer electronics market, for products such as personal computers, electronic games, and tablet computers, is likely to continue to sustain global production of quartz crystal. World Mine Production and Reserves:3 This information is unavailable, but the global reserves for lascas are thought to be large. World Resources: Limited resources of natural quartz crystal suitable for direct electronic or optical use are available throughout the world. World dependence on these resources will continue to decline because of the increased acceptance of cultured quartz crystal as an alternative material. Additionally, techniques using rejected cultured quartz crystal as feed material could mean a decreased dependence on lascas for growing cultured quartz. Substitutes: Quartz crystal is the best material for frequency-control oscillators and frequency filters in electronic circuits. Other materials, such as aluminum orthophosphate (the very rare mineral berlinite), langasite, lithium niobate, and lithium tantalate, which have larger piezoelectric coupling constants, have been studied and used. The cost competitiveness of these materials, as opposed to cultured quartz crystal, is dependent on the type of application that the material is used for and the processing required. — Zero. 1Lascas is a nonelectronic-grade quartz used as a feedstock for growing cultured quartz crystal and for production of fused quartz. 2See Appendix B for definitions. 3See Appendix C for resource and reserve definitions and information concerning data sources.
U.S. Geological Survey, Mineral Commodity Summaries, January 2017

134
RARE EARTHS1
[Data in metric tons of rare-earth oxide (REO) equivalent content unless otherwise noted]
Domestic Production and Use: Rare earths were not mined domestically in 2016. Bastnaesite, a rare-earth fluorocarbonate mineral, was previously mined as a primary product at Mountain Pass, CA, which was put on care and maintenance in the fourth quarter of 2015. The estimated value of rare-earth compounds and metals imported by the United States in 2016 was $120 million, a decrease from $160 million imported in 2015. The estimated distribution of rare earths by end use was as follows: catalysts, 55%; metallurgical applications and alloys, 15%; ceramics and glass, 10%; polishing, 10%; and other, 10%. Salient Statistics—United States: 2012 2013 2014 2015 2016e Production, bastnaesite concentrates 3,000 5,500 5,400 5,900 — Imports:2
Compounds: Cerium compounds 1,390 1,110 1,440 1,560 1,900 Other rare-earth compounds 3,400 7,330 9,110 7,640 10,000 Metals: Ferrocerium, alloys 276 313 378 356 290 Rare-earth metals, scandium, and yttrium 240 393 348 383 470 Exports:2
Compounds: Cerium compounds 996 734 608 441 310 Other rare-earth compounds 1,830 5,570 3,800 4,530 350 Metals: Ferrocerium, alloys 960 1,420 1,640 1,220 220 Rare-earth metals, scandium, and yttrium 2,080 1,050 140 57 131 Consumption, estimated 15,000 15,000 17,000 17,000 16,000 Price, dollars per kilogram, yearend:3 Cerium oxide, 99.5% minimum 10–12 5–6 4–5 2 2 Dysprosium oxide, 99.5% minimum 600–630 440–490 320–360 215–240 183–186 Europium oxide, 99.9% minimum 1,500–1,600 950–1,000 680–730 90–110 62–70 Lanthanum oxide, 99.5% minimum 9–11 6 5 2 2 Mischmetal, 65% cerium, 35% lanthanum 14–16 9–10 9–10 5–6 5–6 Neodymium oxide, 99.5% minimum 75–80 65–70 56–60 39–42 38–40 Terbium oxide, 99.99% minimum 1,200–1,300 800–850 590–640 410–470 410–425 Employment, mine and mill, annual average 275 380 391 351 — Net import reliance4 as a percentage of estimated consumption 80 63 68 65 100 Recycling: Limited quantities, from batteries, permanent magnets, and fluorescent lamps. Import Sources (2012–15): Rare-earth compounds and metals: China, 72%; Estonia, 7%; France, 5%; Japan, 5%; and other, 11%. Imports of compounds and metal from Estonia, France, and Japan were derived from mineral concentrates produced in China and elsewhere. Tariff: Item Number Normal Trade Relations 12–31–16 Rare-earth metals, scandium and yttrium whether or not intermixed or interalloyed 2805.30.000 5.0% ad val. Cerium compounds Oxides 2846.10.0010 5.5% ad val. Other 2846.10.0050 5.5% ad val. Other rare-earth compounds Lanthanum oxides 2846.90.2005 Free. Other oxides 2846.90.2040 Free. Lanthanum carbonates 2846.90.8070 3.7% ad val. Other carbonates 2846.90.8075 3.7% ad val. Other rare-earth compounds 2846.90.8090 3.7% ad val. Ferrocerium and other pyrophoric alloys 3606.90.3000 5.9% ad val. Depletion Allowance: Monazite, 22% on thorium content and 14% on rare-earth content (Domestic), 14% (Foreign); bastnaesite and xenotime, 14% (Domestic and foreign). Prepared by Joseph Gambogi [(703) 648–7718, [email protected]]

135 RARE EARTHS
Government Stockpile: The Defense Logistics Agency’s Annual Materials Plan for fiscal year 2016 included a ceiling acquisition of 0.5 tons of dysprosium metal and 10 tons of yttrium oxide. In fiscal year 2016, the Defense Logistics Agency acquired 8.8 tons of yttrium oxide. Events, Trends, and Issues: The suspension of U.S. mining in 2015 resulted in a significant decline in exports of rare-earth compounds in 2016. U.S. imports of rare-earth compounds and metals increased by 6% compared with those in 2015. In 2016, excess global supply caused prices for many rare-earth compounds and metals to decline, and China continued to dominate the global supply. In China, the rare-earth mining production quota for 2016 was set at 105,000 tons, unchanged from 2015. China’s rare-earths industry continued its consolidation into six major industrial entities. Through September 2016, China had exported 35,200 tons of rare-earth materials, a 50% increase compared with exports for the same period in 2015. Production of rare-earth oxide equivalent in Malaysia, derived from concentrates mined in Australia, was 6,290 tons through June 2016, a 37% increase compared with the same period in 2015. Exploration efforts to develop rare-earth projects continued in 2016. Exploration and development assessments in the United States included Bear Lodge, WY; Bokan Mountain, AK; Diamond Creek, ID; Elk Creek, NE; La Paz, AZ; Lemhi Pass, ID-MT; Pea Ridge, MO; Round Top, TX; and Thor, NV. Additional projects were underway in Australia, Brazil, Canada, China, Finland, Greenland, India, Kyrgyzstan, Madagascar, Malawi, Mozambique, Namibia, South Africa, Sweden, Tanzania, Turkey, and Vietnam. World Mine Production and Reserves: The reserves estimates for Canada, China, India, Malawi, Russia, South Africa, Vietnam, and the United States have been added or revised based on new information from Government and industry sources. Mine productione Reserves5 2015 2016 United States 5,900 — 1,400,000 Australia 12,000 14,000 63,400,000 Brazil 880 1,100 22,000,000 Canada — — 830,000 China 7105,000 7105,000 44,000,000 Greenland — — 1,500,000 India 1,700 1,700 6,900,000 Malaysia 500 300 30,000 Malawi — — 136,000 Russia 2,800 3,000 18,000,000 South Africa — — 860,000 Thailand8 760 800 NA
Vietnam8 250 300 22,000,000 World total (rounded) 130,000 126,000 120,000,000 World Resources: Rare earths are relatively abundant in the Earth’s crust, but discovered minable concentrations are less common than for most other ores. U.S. and world resources are contained primarily in bastnäsite and monazite. Bastnäsite deposits in China and the United States constitute the largest percentage of the world’s rare-earth economic resources, and monazite deposits constitute the second largest segment. Substitutes: Substitutes are available for many applications but generally are less effective. eEstimated. NA Not available. — Zero. 1Data include lanthanides and yttrium but exclude most scandium. See also Scandium and Yttrium. 2REO equivalent or content of various materials were estimated. Source: U.S. Census Bureau. 3Price range from Argus Media group - Metal-Pages Ltd. 4Defined as estimated consumption ‒ production. Insufficient data were available to determine stock changes and unattributed imports and exports of rare-earth materials. 5See Appendix C for resource and reserve definitions and information concerning data sources. 6For Australia, Joint Ore Reserves Committee-compliant reserves were about 2.1 million tons. 7Production quota does not include undocumented production. 8Production estimate based on Chinese imports.
U.S. Geological Survey, Mineral Commodity Summaries, January 2017

136
RHENIUM
(Data in kilograms of rhenium content unless otherwise noted) Domestic Production and Use: During 2016, ores containing 7,600 kilograms of rhenium were mined at six operations (four in Arizona, and one each in Montana and Utah). Rhenium compounds are included in molybdenum concentrates derived from porphyry copper deposits, and rhenium is recovered as a byproduct from roasting such molybdenum concentrates. Rhenium-containing products included ammonium perrhenate (APR), metal powder, and perrhenic acid. The major uses of rhenium were in superalloys used in high-temperature turbine engine components and in petroleum-reforming catalysts, representing an estimated 70% and 20%, respectively, of end uses. Bimetallic platinum-rhenium catalysts were used in petroleum reforming for the production of high-octane hydrocarbons, which are used in the production of lead-free gasoline. Rhenium improves the high-temperature (1,000° C) strength properties of some nickel-based superalloys. Rhenium alloys were used in crucibles, electrical contacts, electromagnets, electron tubes and targets, heating elements, ionization gauges, mass spectrographs, metallic coatings, semiconductors, temperature controls, thermocouples, vacuum tubes, and other applications. The estimated value of rhenium consumed in 2016 was about $69 million. Salient Statistics—United States: 2012 2013 2014 2015 2016e Production1 7,910 7,110 8,510 7,900 7,600 Imports for consumption2 40,800 27,600 25,000 31,800 31,800 Exports NA NA NA NA NA Consumption, apparent 48,700 34,700 33,500 39,700 39,400 Price,3 average value, dollars per kilogram, gross weight: Metal pellets, 99.99% pure 4,040 3,160 3,000 2,700 2,000 Ammonium perrhenate 3,990 3,400 3,100 2,800 2,600 Employment, number Small Small Small Small Small Net import reliance4 as a percentage of apparent consumption 84 80 75 80 81 Recycling: Nickel-base superalloy scrap and scrapped turbine blades and vanes continued to be recycled hydrometallurgically to produce rhenium metal for use in new superalloy melts. The scrapped parts were also processed to generate engine revert—a high-quality, lower cost superalloy meltstock—by a growing number of companies, mainly in the United States, Canada, Estonia, Germany, and Russia. Rhenium-containing catalysts were also recycled. Import Sources (2012–15): Ammonium perrhenate: Kazakhstan, 47%; Republic of Korea, 27%; Canada, 7%; Germany, 7%; and other, 12%. Rhenium metal powder: Chile, 86%; Poland, 6%; Germany, 3%; and other, 5%. Tariff: Item Number Normal Trade Relations 12–31–16 Salts of peroxometallic acids, other, ammonium perrhenate 2841.90.2000 3.1% ad val. Rhenium (and other metals), waste and scrap 8112.92.0600 Free. Rhenium (and other metals), unwrought and powders 8112.92.5000 3% ad val. Rhenium (and other metals), wrought 8112.99.9000 4% ad val. Depletion Allowance: 14% (Domestic and foreign). Government Stockpile: None. Prepared by Désirée E. Polyak [(703) 648–4909, [email protected]]

137 RHENIUM
Events, Trends, and Issues: During 2016, the United States continued to rely on imports for much of its supply of rhenium. Chile, Germany, Kazakhstan, Poland, and the Republic of Korea supplied most of the imported rhenium. Rhenium imports for consumption remained the same as those of 2015. Primary rhenium production in the United States decreased by 4% compared with that in 2015. A new molybdenum processing plant in Chile shipped its first molybdenum concentrate in the fourth quarter of 2016. A plant in Chile also was expected to have the capability to process up to as much as 6,000 to 8,000 kilograms of rhenium per year; however, a start date for rhenium production was unavailable. For the fifth year in a row, rhenium metal and catalytic-grade APR prices declined. In 2016, catalytic-grade APR prices averaged $2,600 per kilogram, 7% less than 2015 and 75% less than peak price in 2008. Rhenium metal pellet prices averaged $2,000 per kilogram in 2016, 26% less than 2015 and 81% less than the peak price in 2008. Consumption of catalyst-grade APR by the petroleum industry was expected to remain at high levels. Demand for rhenium in the aerospace industry, although more unpredictable, was expected to continue to increase. The major aerospace companies, however, were expected to continue testing superalloys that contain one-half the rhenium used in engine blades as currently designed, as well as testing rhenium-free alloys for other engine components. New technology continued to be developed to allow recycling of nickel-based superalloy scrap more efficiently. The processing of scrapped engine parts to generate engine revert increased worldwide and this increase in engine revert supply was expected to continue to have a significant impact on the rhenium market. World Mine Production and Reserves: Mine production5 Reserves6 2015 2016e United States 7,900 7,600 390,000 Armenia 350 350 95,000 Canada — — 32,000 Chile7 26,000 26,000 1,300,000 China 2,400 2,400 NA Kazakhstan 1,000 1,000 190,000 Peru — — 45,000 Poland 8,900 7,000 NA Russia NA NA 310,000 Uzbekistan 1,000 1,000 NA Other countries 1,800 1,800 91,000 World total (rounded) 49,400 47,200 2,500,000 World Resources: Most rhenium occurs with molybdenum in porphyry copper deposits. Identified U.S. resources are estimated to be about 5 million kilograms, and the identified resources of the rest of the world are approximately 6 million kilograms. Rhenium also is associated with copper minerals in sedimentary deposits in Armenia, Kazakhstan, Poland, Russia, and Uzbekistan, where ore is processed for copper recovery and the rhenium-bearing residues are recovered at copper smelters. Substitutes: Substitutes for rhenium in platinum-rhenium catalysts are being evaluated continually. Iridium and tin have achieved commercial success in one such application. Other metals being evaluated for catalytic use include gallium, germanium, indium, selenium, silicon, tungsten, and vanadium. The use of these and other metals in bimetallic catalysts might decrease rhenium’s share of the existing catalyst market; however, this would likely be offset by rhenium-bearing catalysts being considered for use in several proposed gas-to-liquid projects. Materials that can substitute for rhenium in various end uses are as follows: cobalt and tungsten for coatings on copper x-ray targets, rhodium and rhodium-iridium for high-temperature thermocouples, tungsten and platinum-ruthenium for coatings on electrical contacts, and tungsten and tantalum for electron emitters. eEstimated. NA Not available. — Zero. 1Based on 80% recovery of estimated rhenium contained in molybdenum disulfide concentrates. Secondary rhenium production not included. 2Does not include unwrought and powder forms or waste and scrap. 3Average price per kilogram of rhenium in pellets or catalytic-grade ammonium perrhenate, from Metal Bulletin. 4Defined as imports – exports + adjustments for industry stock changes. 5Estimated amount of rhenium recovered in association with copper and molybdenum production. Secondary rhenium production not included. 6See Appendix C for resource and reserve definitions and information concerning data sources. 7Estimated rhenium recovered from roaster residues from Belgium, Chile, and Mexico.
U.S. Geological Survey, Mineral Commodity Summaries, January 2017

138
RUBIDIUM
(Data in metric tons of rubidium oxide unless otherwise noted) Domestic Production and Use: Rubidium is not actively mined in the United States; however, occurrences are known in Alaska, Arizona, Idaho, Maine, South Dakota, and Utah. Rubidium is also associated with some evaporate mineral occurrences in other States. Rubidium is not a major constituent of any mineral; it is produced in small quantities as a byproduct of cesium, lithium, and strontium mining. Rubidium concentrate is produced as a byproduct of pollucite (cesium) and lepidolite (lithium) mining and is imported from other countries for processing in the United States. The source of the majority of U.S. pollucite imports is the largest known deposit in North America at Bernic Lake, Manitoba, Canada; however, mining ceased at that operation at the end of 2015. Applications for rubidium and its compounds include biomedical research, electronics, specialty glass, and pyrotechnics. Specialty glasses are the leading market for rubidium; rubidium carbonate is used to reduce electrical conductivity, which improves stability and durability in fiber optic telecommunications networks. Biomedical applications include rubidium salts used in antishock agents and the treatment of epilepsy and thyroid disorder; rubidium-82, a radioactive isotope used as a blood-flow tracer in positron emission tomographic imaging; and rubidium chloride, used as an antidepressant. Rubidium atoms are used in academic research, including the development of quantum-mechanics-based computing devices, a future application with potential for relatively high consumption of rubidium. Quantum computing research uses ultracold rubidium atoms in a variety of applications. Quantum computers, which have the ability to perform more complex computational tasks than traditional computers by calculating in two quantum states simultaneously, were expected to be in prototype phase by 2025. Rubidium’s photoemissive properties make it ideal for electrical-signal generators in motion-sensor devices, night-vision devices, photoelectric cells (solar panels), and photomultiplier tubes. Rubidium is used as an atomic resonance-frequency-reference oscillator for telecommunications network synchronization, playing a vital role in global positioning systems. Rubidium-rich feldspars are used in ceramic applications for spark plugs and electrical insulators because of their high dielectric constant. Rubidium hydroxide is used in fireworks to oxidize mixtures of other elements and produce violet hues. The U.S. military frequency standard, the United States Naval Observatory (USNO) timescale, is based on 48 weighted atomic clocks, including 4 USNO rubidium fountain clocks. Salient Statistics—United States: U.S. salient statistics, such as consumption, exports, and imports, are not available. Some concentrate, which was primarily from Canada, was exported to the United States for further processing. Industry information during the past decade suggests a domestic consumption rate of approximately 2,000 kilograms per year. In 2016, one company offered 1-gram ampoules of 99.75%-grade rubidium (metals basis) for $83.13, a 4% increase from $80.30 in 2015, and 100 grams ampoules of the same material for $1,177.60, a 20% decrease from $1,472.00 in 2015. The price for 10-gram ampoules of 99.8% rubidium formate hydrate (metals basis) was $44.96, a 20% decrease from $56.20 in 2015. In 2016, the prices for 10 grams of 99.8% (metals basis) rubidium acetate, rubidium bromide, rubidium carbonate, rubidium chloride, and rubidium nitrate were $48.41, $63.86, $61.08, $57.23, and $47.28, respectively. In 2015, the prices for 10 grams of the same materials were $47.00, $62.00, $59.30, $55.10, and $45.90, respectively. The price for a rubidium-plasma standard solution (10,000 µg/ml) was $56.50 for 50 milliliters, the same as in 2015, and $67.49 for 100 milliliters, a 20% decrease from $84.20 in 2015. Recycling: None. Import Sources (2012–15): The United States is 100% import reliant on byproduct rubidium-concentrate imports, most of which were thought to be imported from Canada. Tariff: Item Number Normal Trade Relations 12–31–16 Alkali metals, other 2805.19.9000 5.5% ad val. Chlorides, other 2827.39.9000 3.7% ad val. Bromides, other 2827.59.5100 3.6% ad val. Nitrates, other 2834.29.5100 3.5% ad val. Carbonates, other 2836.99.5000 3.7% ad val. Prepared by Christopher A. Tuck [(703) 648–4912, [email protected]]

139 RUBIDIUM
Depletion Allowance: 14% (Domestic and foreign). Government Stockpile: None. Events, Trends, and Issues: Domestic rubidium occurrences will remain uneconomic unless market conditions change, such as the development of new end uses or increased consumption for existing end uses, which in turn could lead to increased prices. No known human health issues are associated with exposure to naturally occurring rubidium, and its use has minimal environmental impact. During 2016, several projects that were primarily aimed at developing lithium resources were at various stages of development in Manitoba, Canada. The projects were focused on pollucite and spodumene deposits, which primarily contain tantalum, lithium, or both, and possibly cesium and rubidium resources in minor quantities. One company updated its National Instrument 43-101 resource estimate in March 2016 to reflect more than 24,000 tons of measured and indicated rubidium oxide resources. One pollucite operation at Bernic Lake, Manitoba, Canada, completed a development project in November 2015 after mine collapses in 2010 and 2013; however, the company ceased mining at the site. The company indicated that it had sufficient stocks of raw materials to supply cesium for its products for the foreseeable future. Rubidium concentrate is a byproduct from the processing of cesium ore from the mine; therefore, it is likely that as the company continues to process cesium for formate it will also continue to produce rubidium concentrate. The company also planned to continue exploring possibilities for accessing the mine’s resources, as well as possibilities for alternative sources of supply for cesium as needed. The company report did not state whether it had or was considering options for a similar rubidium supply. World Mine Production and Reserves: Production of pollucite ceased at the Bernic Lake operation in Manitoba, Canada; however, it was expected that rubidium concentrate would continue to be produced as a byproduct of processing from pollucite stocks. Lepidolite and pollucite, the principal rubidium-containing minerals in global rubidium reserves, can contain up to 3.5% and 1.5% rubidium oxide, respectively. Rubidium-bearing mineral resources are found in zoned pegmatites, which are exceptionally coarse-grained plutonic rocks that formed late in the crystallization of a silicic magma. Mineral resources exist globally, but extraction and concentration are cost prohibitive. Production is known to take place periodically in Canada, Namibia, and Zimbabwe, but production data are not available. Rubidium is thought to be mined in China, but information regarding reserves and production is unavailable. Reserves for Zimbabwe were revised based on updated information on the Bikita pegmatite deposit. Reserves for Canada were removed as mining operations ceased in 2015. Reserves1 Namibia 50,000 Zimbabwe 30,000 Other countries 10,000 World total 90,000 World Resources: In addition to several significant rubidium-bearing zoned pegmatites in Canada, similar pegmatite occurrences have been identified in Afghanistan, China, Denmark, Germany, Japan, Kazakhstan, Namibia, Peru, Russia, the United Kingdom, the United States, and Zambia. Minor amounts of rubidium are reported in brines in northern Chile and China and in evaporites in France, Germany, and the United States (New Mexico and Utah). Substitutes: Rubidium and cesium can be used interchangeably in many applications because they have similar physical properties and atomic radii. Cesium, however, is more electropositive than rubidium, making it a preferred material for some applications. 1See Appendix C for resource and reserve definitions and information concerning data sources.
U.S. Geological Survey, Mineral Commodity Summaries, January 2017

140
SALT
(Data in thousand metric tons unless otherwise noted) Domestic Production and Use: Domestic production of salt was estimated to have decreased by 7% in 2016 to 42 million tons. The total value of salt sold or used was estimated to be about $2.0 billion. Twenty-nine companies operated 64 plants in 16 States. The top producing States, in alphabetical order, were Kansas, Louisiana, Michigan, New York, Ohio, Texas, and Utah. These seven States produced about 95% of the salt in the United States in 2016. The estimated percentage of salt sold or used was, by type, rock salt, 44%; salt in brine, 38%; solar salt, 9%; and vacuum pan salt, 9%. Highway deicing accounted for about 44% of total salt consumed. The chemical industry accounted for about 36% of total salt sales, with salt in brine accounting for 88% of the salt used for chemical feedstock. Chlorine and caustic soda manufacturers were the main consumers within the chemical industry. The remaining markets for salt were, in declining order of use, distributors, 8%; agricultural, 3%; food processing, 3%; other uses combined with exports, 3%; general industrial, 2%; and primary water treatment, 1%. Salient Statistics—United States:1 2012 2013 2014 2015 2016e Production 37,200 39,900 45,300 e45,000 42,000 Sold or used by producers 34,900 43,100 46,000 e42,000 39,000 Imports for consumption 9,880 11,900 20,100 21,600 12,500 Exports 809 525 940 839 650 Consumption: Apparent2 44,000 54,500 65,200 e62,800 50,900 Reported 36,900 47,600 55,000 e53,000 50,000 Price, average value of bulk, pellets and packaged salt, dollars per ton, f.o.b. mine and plant: Vacuum and open pan salt 169.93 172.09 180.61 e185.00 190.00 Solar salt 71.87 78.04 83.90 e89.00 90.00 Rock salt 36.89 47.22 48.11 e47.00 45.00 Salt in brine 8.44 8.49 9.08 e9.25 9.40 Employment, mine and plant, numbere 4,100 4,100 4,200 4,200 4,100 Net import reliance3 as a percentage of apparent consumption 22 22 29 33 23 Recycling: None. Import Sources (2012–15): Chile, 38%; Canada, 33%; Mexico, 11%; The Bahamas, 4%; and other, 14%. Tariff: Item Number Normal Trade Relations 12–31–16 Salt (sodium chloride) 2501.00.0000 Free. Depletion Allowance: 10% (Domestic and foreign). Government Stockpile: None. Events, Trends, and Issues: In 2015–16, winter was warmer than average for the first time in several years, and the amount of frozen precipitation and the number of winter weather events was below average in many parts of the United States, requiring less salt for highway deicing. Rock salt production and imports in 2016 decreased significantly from the levels in 2014 and 2015 because of decreased demand from many local and State transportation departments. The majority of local and State governments in cold regions reportedly had rebuilt their stockpiles and had large supplies of rock salt available for the winter of 2015–16. As winter ended, many rock salt users had substantial stockpiles of salt remaining as they considered purchasing less salt for the next winter season. Owing to the greatly decreased demand for deicing salt, rock salt unit prices decreased. Prepared by Wallace P. Bolen [(703) 648–7727, [email protected]]

141 SALT
For the winter of 2016–17, the National Oceanic and Atmospheric Administration predicted a La Niña weather pattern of cooler and snowier weather for the traditional snowbelt in the northern tier of the United States, with average or above-average winter precipitation and average to cooler temperatures. The southern part of the United States was expected to be warmer and dryer than average. This would likely increase consumption of salt slightly for deicing compared to the past winter season because only part of the country was expected to be cooler. It was anticipated that the salt industry would be able to provide adequate salt supplies from domestic and foreign sources for emergency use in the event of harsher than anticipated winter weather. Demand for salt brine used in the chloralkali industry was expected to increase as demand and prices for caustic soda experienced global growth, especially in Asia. Exports from India increased to satisfy the growing demand for caustic soda in China. World Production and Reserves: Production Reserves4 2015 e 2016e United States1 45,000 42,000 Large. Economic (as well as Australia 11,000 12,000 subeconomic) deposits of salt are Brazil 7,500 7,500 substantial in principal salt-producing Canada 12,500 10,000 countries. The oceans contain a Chile 11,800 11,000 virtually inexhaustible supply of salt. China 70,000 58,000 France 6,000 6,000 Germany 12,500 12,500 India 17,000 19,000 Mexico 10,500 10,500 Poland 4,200 4,200 Spain 4,300 4,300 Turkey 6,000 6,000 Ukraine 6,100 6,100 United Kingdom 5,000 5,000 Other countries 42,000 41,000 World total (rounded) 271,000 255,000 World Resources: World continental resources of salt are vast, and the salt content in the oceans is nearly unlimited. Domestic resources of rock salt and salt from brine are primarily in Kansas, Louisiana, Michigan, New York, Ohio, and Texas. Saline lakes and solar evaporation salt facilities are in Arizona, California, Nevada, New Mexico, Oklahoma, and Utah. Almost every country in the world has salt deposits or solar evaporation operations of various sizes. Substitutes: No economic substitutes or alternatives for salt exist in most applications. Calcium chloride and calcium magnesium acetate, hydrochloric acid, and potassium chloride can be substituted for salt in deicing, certain chemical processes, and food flavoring, but at a higher cost. eEstimated. 1Excludes production from Puerto Rico. 2 Defined as sold or used by producers + imports – exports. 3Defined as imports – exports. 4See Appendix C for resource and reserve definitions and information concerning data sources.
U.S. Geological Survey, Mineral Commodity Summaries, January 2017

142
SAND AND GRAVEL (CONSTRUCTION)1
(Data in million metric tons unless otherwise noted)2
Domestic Production and Use: Construction sand and gravel valued at $8.9 billion was produced by an estimated 4,100 companies and government agencies from about 6,300 operations in 50 States. Leading producing States were, in order of decreasing tonnage, Texas, California, Michigan, Minnesota, Utah, Washington, New York, Arizona, Ohio, and Colorado, which together accounted for about 55% of total output. It is estimated that about 44% of construction sand and gravel was used as concrete aggregates; 25% for road base and coverings and road stabilization; 13% as asphaltic concrete aggregates and other bituminous mixtures; 12% as construction fill; 1% each for concrete products, such as blocks, bricks, and pipes; plaster and gunite sands; and snow and ice control; and the remaining 3% for filtration, golf courses, railroad ballast, roofing granules, and other miscellaneous uses. The estimated output of construction sand and gravel in the United States, 443 million tons shipped for consumption in the first 6 months of 2016, was 8% higher than the 410 million tons estimated for the same period in 2015. Additional production information by quarter for each State, geographic region, and the United States is reported in the U.S. Geological Survey quarterly Mineral Industry Surveys for Crushed Stone and Sand and Gravel. Salient Statistics—United States: 2012 2013 2014 2015 2016e Production 812 847 897 937 1,010 Imports for consumption 4 4 4 4 3 Exports (3) (3) (3) (3) (3) Consumption, apparent 815 851 901 941 1,010 Price, average value, dollars per metric ton 7.65 7.89 8.09 8.58 8.80 Employment, mine and mill, number4 37,100 36,400 34,600 34,700 34,700 Net import reliance5 as a percentage of apparent consumption (3) (3) (3) (3) (3) Import Sources (2012–15): Canada, 90%; Mexico, 5%; and other, 5%. Tariff: Item Number Normal Trade Relations 12–31–16 Sand, silica and quartz, less than 95% silica 2505.10.5000 Free. Sand, other 2505.90.0000 Free. Pebbles and gravel 2517.10.0015 Free. Depletion Allowance: Common varieties, 5% (Domestic and foreign). Government Stockpile: None. Prepared by Jason Christopher Willett [(703) 648–6473, [email protected]]

143 SAND AND GRAVEL (CONSTRUCTION)
Events, Trends, and Issues: Construction sand and gravel production was about 1.01 billion tons in 2016, an increase of 7% compared with that of 2015. Apparent consumption also increased to about 1.01 billion tons. Consumption of construction sand and gravel was higher in 2016 because of increased consumption during every quarter since the second quarter of 2013, with an average increase of 6% over the same period of the previous year. With significantly stronger construction activity across the country in 2016, and recovery in the private sector and residential construction experiencing a level of growth not seen since late 2005, consumption of construction aggregates is likely to continue to increase. It is expected that the increased consumption in 2016 from that in 2015 will reach or exceed the historical annual average of the past 50 years, which was a 2% to 4% increase per year. The construction sand and gravel industry remained concerned with environmental, health, permitting, safety, and zoning regulations. Movement of sand and gravel operations away from densely populated regions was expected to continue where regulations and local sentiment discouraged them. Resultant regional shortages of construction sand and gravel would likely result in higher-than-average price increases in industrialized and urban areas. World Mine Production and Reserves: Mine productione Reserves6 2015 2016 United States 937 1,010 Reserves are controlled largely by land Other countries7 NA NA use and (or) environmental concerns. World total NA NA World Resources: Sand and gravel resources of the world are plentiful. However, because of environmental restrictions, geographic distribution, and quality requirements for some uses, sand and gravel extraction is uneconomic in some cases. The most important commercial sources of sand and gravel have been glacial deposits, river channels, and river flood plains. Use of offshore deposits in the United States is mostly restricted to beach erosion control and replenishment. Other countries routinely mine offshore deposits of aggregates for onshore construction projects. Substitutes: Crushed stone, the other major construction aggregate, is often substituted for natural sand and gravel, especially in more densely populated areas of the Eastern United States. Crushed stone remains the dominant choice for construction aggregate use. Increasingly, recycled asphalt and portland cement concretes are being substituted for virgin aggregate, although the percentage of total aggregate supplied by recycled materials remained very small in 2016. eEstimated. NA Not available. 1See also Sand and Gravel (Industrial) and Stone (Crushed). 2See Appendix A for conversion to short tons. 3Less than ½ unit. 4Including office staff. Source: Mine Safety and Health Administration. 5Defined as imports – exports. 6See Appendix C for resource and reserve definitions and information concerning data sources. 7No reliable production information is available for most countries owing to the wide variety of ways in which countries report their sand and gravel production. Some countries do not report production for this mineral commodity. Production information for some countries is available in the country chapters of the USGS Minerals Yearbook.
U.S. Geological Survey, Mineral Commodity Summaries, January 2017

144
SAND AND GRAVEL (INDUSTRIAL)1
(Data in thousand metric tons unless otherwise noted) Domestic Production and Use: In 2016, industrial sand and gravel valued at about $4.3 billion was produced by 254 companies from 347 operations in 35 States. The value of production of industrial sand and gravel in 2016 decreased by 12% compared to the previous year. Leading States were, in order of tonnage produced, Wisconsin, Illinois, Texas, Missouri, Minnesota, North Carolina, Michigan, Oklahoma, Louisiana, and Arkansas. Combined production from these States accounted for 82% of the domestic total. About 72% of the U.S. tonnage was used as hydraulic-fracturing sand and well-packing and cementing sand; 8% as other whole-grain silica; 7% as glassmaking sand; 4% as foundry sand; 1%, each, as whole-grain fillers and building products, other ground silica, and ground and unground sand for chemicals; and 6% for other uses. Salient Statistics—United States: 2012 2013 2014 2015 2016e Production 50,600 62,100 110,000 103,000 91,700 Imports for consumption 306 160 244 290 280 Exports 4,360 2,960 4,450 3,890 2,630 Consumption, apparent 46,600 59,300 106,000 99,400 89,400 Price, average value, dollars per ton 52.80 55.80 74.90 47.10 46.62 Employment, quarry and mill, numbere 3,500 3,800 4,000 3,500 3,500 Net import reliance2 as a percentage of apparent consumption E E E E E Recycling: Some foundry sand is recycled, and recycled cullet (pieces of glass) represents a significant proportion of reused silica. About 34% of glass containers are recycled. Import Sources (2012–15): Canada, 86%; Mexico, 6%; and other, 8%. Tariff: Item Number Normal Trade Relations 12–31–16 Sand containing 95% or more silica and not more than 0.6% iron oxide 2505.10.1000 Free. Depletion Allowance: Industrial sand or pebbles, 14% (Domestic and foreign). Government Stockpile: None. Events, Trends, and Issues: U.S. apparent consumption of industrial sand and gravel was 89.4 million tons in 2016, a 10% decrease from that of the previous year. Mine output was sufficient to accommodate many uses, which included ceramics, chemicals, container, fillers (ground and whole grain), filtration, flat and specialty glass, foundry, hydraulic fracturing, and recreational uses. Production of hydraulic-fracturing sand to support extraction of natural gas and petroleum from shale deposits continued to decline in 2016, but remained at historically high levels. New and more efficient hydraulic-fracturing techniques, which require more silica sand use per well (mostly for secondary recovery at mature wells) could stabilize demand for hydraulic-fracturing sand. Imports of industrial sand and gravel in 2016 decreased by 3% to about 280,000 tons from 290,000 tons in 2015. Imports of silica are generally of two types—small shipments of very high-purity silica or a few large shipments of lower grade silica shipped only under special circumstances (for example, very low freight rates). Although the United States remains a net exporter of industrial sand and gravel, exports of industrial sand and gravel decreased by 32% in 2016 compared with those of 2015. The United States was the world’s leading producer and consumer of industrial sand and gravel based on estimated world production figures. It is difficult to collect definitive data on silica sand and gravel production in most nations because of the wide range of terminology and specifications found among different countries. The United States remained a major exporter of silica sand and gravel, shipping it to almost every region of the world. The high level of exports was attributed to the high-quality and advanced processing techniques used in the United States for many grades of silica sand and gravel, meeting virtually every specification. Prepared by Thomas P. Dolley [(703) 648–7710, [email protected]]

145 SAND AND GRAVEL (INDUSTRIAL)
The industrial sand and gravel industry continued to be concerned with safety and health regulations and environmental restrictions in 2016, especially those concerning crystalline silica exposure. In 2016, the Occupational Safety and Health Administration finalized new regulations to further restrict exposure to crystalline silica at mine sites and other industries that use it. Phased implementation of the new regulations are scheduled to take effect from 2017 through 2021. Local shortages of industrial sand and gravel were expected to continue to increase owing to local zoning regulations and land development alternatives, including ongoing development and permitting of operations producing hydraulic-fracturing sand. Natural gas and petroleum operations that use hydraulic fracturing may also undergo increased scrutiny. These situations are expected to cause future sand and gravel operations to be located farther from high-population centers. World Mine Production and Reserves: Mine productione Reserves3 2015 2016 United States 103,000 91,700 Australia 6,000 6,000 Large. Industrial sand and gravel deposits Canada 1,700 1,700 are widespread. Chile 1,250 1,300 Czech Republic 1,270 1,350 Finland 2,400 2,400 France 8,750 8,750 Germany 7,500 7,500 India 3,400 3,400 Italy 13,900 13,900 Japan 3,000 2,800 Malaysia 1,200 2,000 Mexico 3,600 3,600 Moldova 3,800 3,800 Norway 1,000 1,000 Poland 2,300 2,700 Saudi Arabia 1,260 1,300 South Africa 2,300 2,100 Spain 3,400 3,400 Turkey 8,000 8,000 United Kingdom 4,000 4,000 Other countries 6,000 6,000 World total (rounded) 189,000 179,000 World Resources: Sand and gravel resources of the world are large. However, because of their geographic distribution, environmental restrictions, and quality requirements for some uses, extraction of these resources is sometimes uneconomic. Quartz-rich sand and sandstone, the main sources of industrial silica sand, occur throughout the world. Substitutes: Alternative materials that can be used for glassmaking and for foundry and molding sands are chromite, olivine, staurolite, and zircon sands. Although more costly and mostly used in deeper wells, alternative materials that can be used as proppants are sintered bauxite and kaolin-based ceramic proppants. eEstimated. E Net exporter. 1See also Sand and Gravel (Construction). 2Defined as imports – exports. 3See Appendix C for resource and reserve definitions and information concerning data sources.
U.S. Geological Survey, Mineral Commodity Summaries, January 2017

146
SCANDIUM1
(Data in metric tons of scandium oxide content unless otherwise noted)
Domestic Production and Use: Domestically, scandium-bearing minerals were neither mined nor recovered from mine tailings in 2016. Scandium that was previously produced domestically was primarily from the scandium-yttrium silicate mineral thortveitite and from byproduct leach solutions from uranium operations. Limited capacity to produce ingot and distilled scandium metal existed at facilities in Ames, IA; Tolleson, AZ; and Urbana, IL. The principal source for scandium metal and scandium compounds was imports from China. The principal uses for scandium in 2016 were in aluminum-scandium alloys and solid oxide fuel cells (SOFCs). Other uses for scandium included ceramics, electronics, lasers, lighting, and radioactive isotopes. In SOFCs, electricity is generated directly from oxidizing a fuel. Scandium is added to a zirconia-base electrolyte to improve the power density and lower the reaction temperature of the cell. For metal applications, scandium metal is typically produced by reducing scandium fluoride with calcium metal. Aluminum-scandium alloys are produced for sporting goods, aerospace, and other high-performance applications. Scandium is used in small quantities in a number of electronic applications. Some lasers that contain scandium are used in defense applications and in dental treatments. In lighting, scandium iodide is used in mercury-vapor high-intensity lights to simulate natural light. Scandium isotopes are used as a tracing agent in oil refining. Salient Statistics—United States: 2012 2013 2014 2015 2016e Price, yearend, dollars: Compounds, per gram: Acetate, 99.9% purity, 5-gram sample size2 50.10 51.90 43.00 43.00 44.00 Chloride, 99.9% purity, 5-gram sample size2 143.00 148.00 123.00 123.00 126.00 Fluoride, 99.9% purity, 1-to-5-gram sample size 2244.00 2253.00 2263.00 2263.00 3270.00 Iodide, 99.999% purity, 5-gram sample size2 220.00 228.00 187.00 187.00 149.00 Oxide, 99.99% purity, 5-kilogram lot size4 4.70 5.00 5.00 5.10 4.60 Metal: Scandium, distilled dendritic, per gram, 2-gram sample size2 206.00 213.00 221.00 221.00 228.00 Scandium, ingot, per gram, 5-gram sample size2 169.00 175.00 134.00 134.00 107.00 Scandium-aluminum alloy, per kilogram, metric-ton lot size4 220.00 155.00 386.00 220.00 340.00 Net import reliance5 as a percentage of apparent consumption 100 100 100 100 100 Recycling: None. Import Sources (2012–15): Although no definitive data exist listing import sources, imported material is mostly from China. Tariff: Item Number Normal Trade Relations 12–31–16 Rare-earth metals, scandium and yttrium, whether or not intermixed or interalloyed 2805.30.0000 5.0% ad val. Compounds of rare-earth metals: Mixtures of oxides of yttrium or scandium as the predominant metal 2846.90.2015 Free. Mixtures of rare-earth oxides, including scandium 2846.90.2040 Free. Mixtures of chlorides of yttrium or scandium as the predominant metal 2846.90.2082 Free. Mixtures of rare-earth carbonates, other, including scandium 2846.90.8075 3.7% ad val. Other rare-earth compounds, including scandium 2846.90.8090 3.7% ad val. Depletion Allowance: 14% (Domestic and foreign). Government Stockpile: None. Prepared by Joseph Gambogi [(703) 648–7718, [email protected]]

147 SCANDIUM
Events, Trends, and Issues: The global supply and consumption of scandium was estimated to be about 10 tons to 15 tons per year. Consumption of scandium contained in SOFCs and nonferrous alloys was reported to be increasing. The global scandium market remained small relative to most other metals, but the number of supply sources was increasing. In the United States, developers of multimetallic deposits, including the Round Top project in Texas and the Elk Creek project in Nebraska, were planning to include scandium recovery in their project plans. The Department of Energy was partnering with industry and academia to study the recovery of scandium and other rare-earth elements from coal and coal byproducts. In New South Wales, Australia, a definitive feasibility study was completed on the Nyngan scandium project. With an effective cutoff grade of 155 parts per million scandium, reserves were estimated to be 1.44 million tons containing about 590 tons of scandium. The developer expected to begin production in 2018. The project was expected to produce as much as 38.5 tons per year of scandium oxide. Also in New South Wales, developers of the Syerston project were conducting pilot plant studies that produced scandium-rich liquor and scandium oxide. In August, a feasibility study of the Syerston project estimated reserves of 1.2 million tons containing about 700 tons of scandium using a 600-parts-per-million-scandium cutoff grade. In northern Queensland, Australia, the developers of the Scandium-Cobalt-Nickel (SCONI) Project were seeking joint-venture partners. The measured and indicated resources of the SCONI Project were about 11 million tons containing 2,700 tons of scandium oxide using a 100-parts-per-million-scandium cutoff grade. In Quebec, Canada, one company was developing technology to recover scandium and high-purity alumina from red mud (a residue generated during the production of alumina), fly ash, and mine tailings. In 2016, the company continued to commission a high-purity alumina plant and planned to decide on the timing for the addition of a scandium extraction unit by yearend. In China, Guangxi Metallurgy Research Institute was commissioning production capacity of up to 1.5 tons per year of scandium oxide. In India, the Odisha government approved a proposal to set up a 2.4-ton-per-year scandium oxide plant in the State of Orissa. Scandium production was expected to be a byproduct of titanium production and was scheduled to begin in 2018. In Japan, pilot studies to recover scandium and other metals from a titanium dioxide pigment plant at Yokkaichi were technically successful; however, further development of the project was suspended. In the Philippines, plans were underway to recover 7.5 tons per year of scandium oxide equivalent from the leaching of nickel laterite for nickel-cobalt sulfide. A scandium recovery plant was expected to be in production by 2018 at the Taganito high-pressure-acid leach facility. In Russia, pilot-plant studies at an aluminum smelter in the Ural Mountains successfully produced scandium oxide from a red-mud concentrate. In 2016, a pilot plant was reported to have produced scandium oxide with purity greater than 99% and achieved a 98-kilogram-per-year production rate. In 2015, a separate study produced a scandium concentrate from red mud. In Lermontov, Kurgan region, a pilot study was underway to recover scandium as a byproduct of uranium production. Pilot studies to extract up to 400 kilograms per year of scandium were expected to begin by yearend 2016. Extraction methods were being developed for the separation and purification of scandium as part of a European Commission-funded project. World Mine Production and Reserves:6 No scandium was mined in the United States. As a result of its low concentration, scandium is produced exclusively as a byproduct during processing of various ores or recovered from previously processed tailings or residues. In recent years, scandium was produced as byproduct material in China (titanium and rare earths), Kazakhstan (uranium), Russia (apatite), and Ukraine (uranium). Foreign mine production data for 2016 were not available. World Resources: Resources of scandium are abundant. Scandium’s crustal abundance is greater than that of lead. Scandium lacks affinity for the common ore-forming anions; therefore, it is widely dispersed in the lithosphere and forms solid solutions with low concentrations in more than 100 minerals. There are identified scandium resources in Australia, Canada, China, Kazakhstan, Madagascar, Norway, the Philippines, Russia, Ukraine, and the United States. Substitutes: Titanium and aluminum high-strength alloys, as well as carbon-fiber materials, may substitute in high-performance scandium-alloy applications. Light-emitting diodes displace mercury-vapor high-intensity lights in some industrial and residential applications. In some applications that rely on scandium’s unique properties, substitution is not possible.
eEstimated. 1See also Rare Earths. 2Prices from Alfa Aesar, a Johnson Matthey company. 3Prices from Sigma-Aldrich, a part of Millipore Sigma. 4Prices from Stanford Materials Corp. 5Defined as imports – exports + adjustments for stock changes. 6See Appendix C for resource and reserve definitions and information concerning data sources.
U.S. Geological Survey, Mineral Commodity Summaries, January 2017

148
SELENIUM
(Data in metric tons of selenium content unless otherwise noted) Domestic Production and Use: Primary selenium was refined from anode slimes recovered from the electrolytic refining of copper. Of the two electrolytic copper refineries operating in the United States, one in Texas reported production of primary selenium, and one exported semirefined selenium for toll refining in Asia. In glass manufacturing, selenium is used to decolorize the green tint caused by iron impurities in container glass and other soda-lime silica glass and is used in architectural plate glass to reduce solar heat transmission. Cadmium sulfoselenide pigments are used in plastics, ceramics, and glass to produce a ruby-red color. Selenium is used in catalysts to enhance selective oxidation; in plating solutions, where it improves appearance and durability; in blasting caps; in gun bluing to improve cosmetic appearance and provide corrosion resistance; in rubber compounding chemicals to act as a vulcanizing agent; in the electrolytic production of manganese to increase yields; and in copper, lead, and steel alloys to improve machinability. It is used in thin-film photovoltaic copper-indium-gallium-diselenide (CIGS) solar cells. Selenium is an essential micronutrient and is used as a human dietary supplement, a dietary supplement for livestock, and as a fertilizer additive to enrich selenium-poor soils. Selenium is also used as an active ingredient in antidandruff shampoos. Estimates for world consumption are as follows: metallurgy (including manganese production), 40%; glass manufacturing, 25%; agriculture, 10%; chemicals and pigments, 10%; electronics, 10%; and other uses, 5%. Salient Statistics—United States: 2012 2013 2014 2015 2016e Production, refinery W W W W W Imports for consumption, metal and dioxide 460 439 475 463 478 Exports, metal and dioxide 952 648 521 468 495 Consumption, apparent W W W W W Price, dealers, average, dollars per pound, 100-pound lots, refined 54.47 36.17 26.78 22.09 26.00 Stocks, producer, refined, yearend W W W W W Net import reliance1 as a percentage of apparent consumption E E E E E Recycling: Domestic production of secondary selenium was estimated to be very small because most scrap from older plain paper photocopiers and electronic materials was exported for recovery of the contained selenium. Import Sources (2012–15): Japan, 20%; China, 17%; Belgium, 12%; Germany, 12%; and other, 39%. Tariff: Item Number Normal Trade Relations 12–31–16 Selenium metal 2804.90.0000 Free. Selenium dioxide 2811.29.2000 Free. Depletion Allowance: 14% (Domestic and foreign). Government Stockpile: None. Events, Trends, and Issues: The supply of selenium is directly affected by the supply of the materials from which it is a byproduct—copper and, to a lesser extent, nickel. The estimated Platts Metals Week annual average New York dealer price for selenium was $26 per pound in 2016, about 18% more than the annual average price in 2015. The average price in January 2016 was $19.00 per pound and increased to an average of $34.00 per pound in September. In China, the Yunnan Provincial government instructed the municipal government of Kunming to launch an official investigation into the trading activities of the Fanya Metal Exchange Co. Ltd. (FME), which began trading selenium in April 2014. The municipal government was instructed to determine if the FME had any physical assets in warehouses, concealed facts, created a capital pool and taken control of the funds within, and illegally possessed and used the funds that it had raised. In February, the owner of the FME was arrested and, in March, the Public Security Bureau announced that it was expanding its investigation into FME activities. The 338 tons of selenium that was reported to be in FME warehouses has not been verified by the Government or a third party. Prepared by C. Schuyler Anderson [(703) 648–4985, [email protected]]

149 SELENIUM
The natural gas in the Bowland Shale in northern England was found to contain high levels of selenium. These levels of selenium are of concern because, with planned drilling and fracking operations, selenium may be released into local groundwater supplies. Selenium poisoning has initial symptoms of a garlic odor and a metallic taste in the mouth, and more severe symptoms include gastrointestinal distress, fatigue, irritability, and joint pain. Although selenium is an essential micronutrient, the U.S. Food and Drug Administration recommends an upper adult limit of 400 micrograms per day of selenium. In China, electrolytic manganese is the main metallurgical end use for selenium, where selenium dioxide is a substitute for sulfur dioxide to reduce the power required to operate the electrolytic cells. Fewer manganese producers have been operating, with 78 operating in 2014, and only 26 reported in June 2015. World Refinery Production and Reserves: Selenium reserves in China were estimated based on selenium content of copper reserves; however, selenium production estimates for China were not available. Refinery production2 Reserves3 2015 2016e United States W W 10,000 Belgium 200 200 — Canada 154 150 6,000 China NA NA 26,000 Finland 94 94 — Germany 660 660 — Japan 773 750 — Peru 40 40 13,000 Poland 90 90 3,000 Russia 135 135 20,000 Other countries 450 450 21,000 World total (rounded) 52,200 52,200 100,000 World Resources: Reserves for selenium are based on identified copper deposits and average selenium content. Coal generally contains between 0.5 and 12 parts per million of selenium, or about 80 to 90 times the average for copper deposits. The recovery of selenium from coal fly ash, although technically feasible, does not appear likely to be economical in the foreseeable future. Substitutes: Silicon is the major substitute for selenium in low- and medium-voltage rectifiers and solar photovoltaic cells. Organic pigments have been developed as substitutes for cadmium sulfoselenide pigments. Other substitutes include cerium oxide as either a colorant or decolorant in glass; tellurium in pigments and rubber; bismuth, lead, and tellurium in free-machining alloys; and bismuth and tellurium in lead-free brasses. Sulfur dioxide can be used as a replacement for selenium dioxide in the production of electrolytic manganese metal but it is not as energy efficient. The selenium-tellurium photoreceptors used in some plain paper copiers and laser printers have been replaced by organic photoreceptors in newer machines. Amorphous silicon and cadmium telluride are the two principal competitors with CIGS in thin-film photovoltaic power cells. eEstimated. E Net exporter. NA Not available. W Withheld to avoid disclosing company proprietary data. — Zero. 1Defined as imports – exports + adjustments for industry stock changes. 2Insofar as possible, data are refinery output only; thus, countries that produced selenium contained in copper ores, copper concentrates, blister copper, and (or) refinery residues but did not recover refined selenium from these materials indigenously were excluded to avoid double counting. 3See Appendix C for resource and reserve definitions and information concerning data sources. 4Includes India, Serbia, and Sweden. 5Excludes U.S. production. Australia, China, Iran, Kazakhstan, Mexico, the Philippines, and Uzbekistan are known to produce refined selenium, but output is not reported, and information is inadequate for making reliable production estimates.
U.S. Geological Survey, Mineral Commodity Summaries, January 2017

150
SILICON
(Data in thousand metric tons of silicon content unless otherwise noted) Domestic Production and Use: Five companies produced silicon materials at eight plants, all east of the Mississippi River. Most ferrosilicon was consumed in the ferrous foundry and steel industries, predominantly in the Eastern United States, and was sourced primarily from domestic quartzite (silica). The main consumers of silicon metal were producers of aluminum and aluminum alloys and the chemical industry. The semiconductor and solar energy industries, which manufacture chips for computers and photovoltaic cells from high-purity silicon, respectively, accounted for only a small percentage of silicon demand. Salient Statistics—United States: 2012 2013 2014 2015 2016e Production: Ferrosilicon and silicon metal1 390 392 401 411 396 Imports for consumption: Ferrosilicon, all grades2 173 159 186 162 170 Silicon metal 136 118 139 139 128 Exports: Ferrosilicon, all grades2 12 10 9 9 7 Silicon metal 75 38 45 37 46 Consumption, apparent:3 Ferrosilicon, all grades2 W W W W W Silicon metal4 W W W W W Total 607 631 670 661 634 Price,5 average, cents per pound Si: Ferrosilicon, 50% Si 100 103 108 101 82 Ferrosilicon, 75% Si 92 94 98 88 69 Silicon metal4 127 122 140 127 91 Stocks, producer, yearend: Silicon alloys and metal 35 25 27 33 39 Net import reliance6 as a percentage of apparent consumption: Ferrosilicon, all grades1 <50 <50 <50 >50 >50 Silicon metal4 <50 <50 <50 <50 <50 Total 36 39 42 38 38 Recycling: Insignificant. Import Sources (2012–15): Ferrosilicon: Russia, 41%; China, 25%; Canada, 11%; Venezuela, 10%; and other, 13%. Silicon metal: South Africa, 26%; Brazil, 25%; Canada, 15%; Australia, 13%; and other, 21%. Total: Russia, 23%; China, 14%; Canada, 13%; Brazil, 12%; South Africa, 12%; and other, 26%. Tariff: Item Number Normal Trade Relations 12–31–16 Silicon, more than 99.99% Si 2804.61.0000 Free. Silicon, 99.00%−99.99% Si 2804.69.1000 5.3% ad val. Silicon, other 2804.69.5000 5.5% ad val. Ferrosilicon, 55%−80% Si: More than 3% Ca 7202.21.1000 1.1% ad val. Other 7202.21.5000 1.5% ad val. Ferrosilicon, 80%−90% Si 7202.21.7500 1.9% ad val. Ferrosilicon, more than 90% Si 7202.21.9000 5.8% ad val. Ferrosilicon, other: More than 2% Mg 7202.29.0010 Free. Other 7202.29.0050 Free. Depletion Allowance: Quartzite, 14% (Domestic and foreign); gravel, 5% (Domestic and foreign). Prepared by Emily K. Schnebele [(703) 648–4945, [email protected]]

151 SILICON
Government Stockpile: None. Events, Trends, and Issues: Combined domestic ferrosilicon and silicon metal production in 2016, expressed in terms of contained silicon, was expected to decrease from that of 2015. Domestic production during the first 8 months of 2016 was 7% less than during the first 8 months in 2015. By August 2016, annual average U.S. ferrosilicon spot market prices had decreased by 16% and 25%, for 50%-grade and 75%-grade ferrosilicon, respectively, and the annual average silicon metal spot market price had decreased by 32% compared with that of the same period in 2015. Globally, oversupply in the market combined with decreased steel production and weak aluminum alloy demand contributed to decreased silicon prices. Domestic production was also affected by lower priced imports. Decreases in production and destocking of inventory were expected to stabilize prices by the end of 2016. World Production and Reserves: Productione, 7 Reserves8 2015 2016 United States 411 396 The reserves in most major producing Bhutan9 78 78 countries are ample in relation to Brazil 117 100 demand. Quantitative estimates are Canada 54 54 not available. China 5,000 4,600 France 121 121 Iceland9 75 75 India9 60 60 Malaysia9 68 68 Norway 375 380 Russia 747 747 South Africa 84 84 Spain 81 81 Ukraine9 59 64 Other countries 300 300 World total (rounded) 7,630 7,200 Excluding the United States, ferrosilicon accounts for about 65% of world silicon production on a silicon-content basis. The leading countries for ferrosilicon production were, in descending order and on a contained-weight basis, China, Russia, and Norway, and, for silicon metal, the leading producers were China, Norway, and France. China contributed approximately 65% to the total global estimated production of silicon materials in 2016. World Resources: World and domestic resources for making silicon metal and alloys are abundant and, in most producing countries, adequate to supply world requirements for many decades. The source of the silicon is silica in various natural forms, such as quartzite. Substitutes: Aluminum, silicon carbide, and silicomanganese can be substituted for ferrosilicon in some applications. Gallium arsenide and germanium are the principal substitutes for silicon in semiconductor and infrared applications. eEstimated. W Withheld to avoid disclosing company proprietary data. 1Includes statistics for ferrosilicon and silicon metal containing less than 99.9% silicon. 2Ferrosilicon grades include the two standard grades of ferrosilicon50% and 75% siliconplus miscellaneous silicon alloys. 3Defined as production + imports – exports + adjustments for industry stock changes. 4Metallurgical-grade silicon metal. 5Based on U.S. dealer import price. 6Defined as imports – exports + adjustments for industry stock changes. 7Production quantities are combined totals of estimated silicon content for ferrosilicon and silicon metal, as applicable, except as noted. 8See Appendix C for resource and reserve definitions and information concerning data sources. 9Ferrosilicon only.
U.S. Geological Survey, Mineral Commodity Summaries, January 2017

152
SILVER
(Data in metric tons1 of silver content unless otherwise noted) Domestic Production and Use: In 2016, U.S. mines produced approximately 1,100 tons of silver with an estimated value of $570 million. Silver was produced at 3 silver mines and as a byproduct or coproduct from 37 domestic base- and precious-metal mines. Alaska continued as the country’s leading silver-producing State, followed by Nevada. There were 24 U.S. refiners that reported production of commercial-grade silver with an estimated total output of 2,100 tons from domestic and foreign ores and concentrates and from old and new scrap. The physical properties of silver include high ductility, electrical conductivity, malleability, and reflectivity. In 2016, the estimated domestic uses for silver were electrical and electronics, 30%; coins and medals, 27%; jewelry and silverware, 7%; photography, 6%; and other, 30%. Other applications for silver include use in antimicrobial bandages, clothing, pharmaceuticals, and plastics; batteries; bearings; brazing and soldering; catalytic converters in automobiles; electroplating; inks; mirrors; photovoltaic solar cells; water purification; and wood treatment. Mercury and silver, the main components of dental amalgam, are biocides, and their use in amalgam inhibits recurrent decay. Salient Statistics—United States: 2012 2013 2014 2015 2016e Production: Mine 1,060 1,040 1,180 1,090 1,100 Refinery: Primary 796 800 800 800 800 Secondary (new and old scrap) 1,660 1,700 1,400 1,200 1,300 Imports for consumption2 5,070 5,080 4,960 5,930 6,300 Exports2 946 409 380 818 850 Consumption, apparent3 5,910 6,670 6,890 8,000 7,230 Price, average, dollars per troy ounce4 31.22 23.87 19.37 15.72 19.62 Stocks, yearend: Industry 109 110 120 130 150 Treasury Department5 498 498 498 498 498 New York Commodities Exchange—COMEX 4,610 5,350 5,610 5,000 5,600 Employment, mine and mill,6 number 709 819 792 750 785 Net import reliance7 as a percentage of apparent consumption 54 59 63 71 67 Recycling: In 2016, approximately 1,300 tons of silver was recovered from new and old scrap, about 18% of apparent consumption. Import Sources (2012–15):2 Mexico, 48%; Canada, 32%; Peru, 5%; Poland, 4%; and other, 11%. Tariff: Item Number Normal Trade Relations 12–31–16 Silver ores and concentrates 2616.10.0040 Free. Bullion 7106.91.1010 Free. Dore 7106.91.1020 Free. Depletion Allowance: 15% (Domestic), 14% (Foreign). Government Stockpile: The U.S. Department of the Treasury maintains stocks of silver (see salient statistics above). Events, Trends, and Issues: The estimated average silver price in 2016 was 25% higher than the average price in 2015. The price began the year at $14.15 per troy ounce, the lowest since August 2009, and decreased to $13.80 on January 14, before increasing to a high of $24.84 per troy ounce on August 2, 2016. Multiple factors contributed to the increase in silver prices, including strong industrial demand, uncertain world economic and political climates that spurred investment demand, and increasing gold prices. Prepared by Shawnna M. Bennett [(703) 648–7715, [email protected]]

153 SILVER
In 2016, global physical demand for silver was projected to decrease in most sectors, including electrical and electronics, brazing solders and alloys, and photography. Consumption of silver in ethylene oxide production was projected to remain unchanged and use in photovoltaics was projected to increase by about 8%. Although global silver coin sales increased by 29% in the first quarter of 2016 compared with that in the first quarter of 2015, continuing the upward trend in sales from that in the second half of 2015, consumption of silver for coins and bars for full-year 2016 was projected to decrease by more than 20% from that in 2015.8 Global yearend stocks of refined silver were projected to be at a 10-year high. World silver mine production increased slightly in 2016 to 26,800 tons, principally as a result of increased production from mines in China, Mexico, Peru, and Poland. Domestic silver mine production increased slightly in 2016 compared with that in 2015. Reported production at the top two domestic silver mines increased by 19% and 3%, respectively, through the third quarter of 2016 compared with production during the same period in 2015. World Mine Production and Reserves: Reserves for Australia and China were revised based on new information from Government sources. Mine production Reserves9 2015 2016e United States 1,090 1,100 25,000 Australia 1,430 1,400 89,000 Bolivia 1,190 1,300 22,000 Chile 1,370 1,500 77,000 China 3,100 3,600 39,000 Mexico 5,370 5,600 37,000 Peru 3,850 4,100 120,000 Poland 1,180 1,400 85,000 Russia 1,430 1,400 20,000 Other countries 5,000 5,400 57,000 World total (rounded) 25,100 27,000 570,000 World Resources: Although silver was a principal product at several mines, silver was primarily obtained as a byproduct from lead-zinc mines, copper mines, and gold mines, in descending order of production. The polymetallic ore deposits from which silver was recovered account for more than two-thirds of U.S. and world resources of silver. Most recent silver discoveries have been associated with gold occurrences; however, copper and lead-zinc occurrences that contain byproduct silver will continue to account for a significant share of reserves and resources in the future. Substitutes: Digital imaging, film with reduced silver content, silverless black-and-white film, and xerography substitute for traditional photographic applications for silver. Surgical pins and plates may be made with stainless steel, tantalum, and titanium in place of silver. Stainless steel may be substituted for silver flatware. Nonsilver batteries may replace silver batteries in some applications. Aluminum and rhodium may be used to replace silver that was traditionally used in mirrors and other reflecting surfaces. Silver may be used to replace more costly metals in catalytic converters for off-road vehicles. eEstimated. 1One metric ton (1,000 kilograms) = 32,150.7 troy ounces. 2Silver content of base metal ores and concentrates, refined bullion, and dore; excludes coinage, and waste and scrap material. 3Defined as mine production + secondary production + imports – exports + adjustments for Government and industry stock changes. Series has been updated to include changes in COMEX stocks. 4Engelhard quotations. 5Balance in U.S. Mint only; includes deep storage and working stocks. 6Source: U.S. Department of Labor, Mine Safety and Health Administration. Only includes mines where silver is the primary product; Greens Creek Mine is included under zinc. 7Defined as imports – exports + adjustments for Government and industry stock changes. 8 Wiebe, Johann, 2016, The silver market in 2016—The Silver Institute—2016 interim report: GFMS,Thompson Reuters, November 16, 32 p. 9See Appendix C for resource and reserve definitions and information concerning data sources.
U.S. Geological Survey, Mineral Commodity Summaries, January 2017

154
SODA ASH
(Data in thousand metric tons unless otherwise noted) Domestic Production and Use: The total value of domestic natural soda ash (sodium carbonate) produced in 2016 was estimated to be about $1.8 billion.1 U.S. production of 11.7 million tons was about equal to that of the previous 2 years but about 600,000 tons higher than production in 2012. The U.S. soda ash industry comprised four companies in Wyoming operating five plants and one company in California with one plant. The five producing companies have a combined annual nameplate capacity of 13.7 million tons (15.2 million short tons). Borax, salt, and sodium sulfate were produced as coproducts of sodium carbonate production in California. Chemical caustic soda, sodium bicarbonate, and sodium sulfite were manufactured as coproducts at several of the Wyoming soda ash plants. Sodium bicarbonate was produced at an operation in Colorado using soda ash feedstock shipped from the company’s Wyoming facility. Based on 2016 quarterly reports, the estimated distribution of soda ash by end use was glass, 50%; chemicals, 28%; distributors, 6%; soap and detergents, 6%; flue gas desulfurization, 4%; miscellaneous uses, 3%; water treatment, 2%; and pulp and paper, 1%. Salient Statistics—United States: 2012 2013 2014 2015 2016e Production2 11,100 11,500 11,700 11,600 11,700 Imports for consumption 13 13 39 40 40 Exports 6,150 6,460 6,670 6,390 6,600 Consumption: Apparent 5,000 5,010 5,020 5,220 5,100 Reported 5,060 5,120 5,170 4,990 5,200 Price: Average sales value (natural source), f.o.b. mine or plant, dollars per short ton 141.90 131.71 134.87 140.88 141.00 Stocks, producer, yearend 338 348 271 285 300 Employment, mine and plant, number 2,400 2,500 2,500 2,500 2,500 Net import reliance3 as a percentage of apparent consumption E E E E E Recycling: No soda ash was recycled by producers; however, glass container producers are using cullet glass, thereby reducing soda ash consumption. Import Sources (2012–15): Germany, 47%; Italy, 18%; United Kingdom, 12%; Mexico, 8%; and other, 15%. Tariff: Item Number Normal Trade Relations 12–31–16 Disodium carbonate 2836.20.0000 1.2% ad val. Depletion Allowance: Natural, 14% (Domestic and foreign). Government Stockpile: None. Events, Trends, and Issues: Relatively low production costs and lower environmental impacts provide natural soda ash producers some advantage over producers of synthetic soda ash. The production of synthetic soda ash normally consumes more energy and releases more carbon dioxide than that of natural soda ash. In recent years, U.S. producers of natural soda ash were able to expand their markets when several synthetic soda ash plants were closed or idled around the world. During 2016, identical legislation was introduced in the U.S. House of Representatives and the U.S. Senate that aimed to reduce the royalty rate on sodium compounds produced on Federal land for 5 years from 6% to 2%. The bills had not been passed by yearend. Congressional representatives also urged Executive Branch negotiators to address capacity issues related to Chinese soda ash production at the 27th annual United States-China Joint Commission on Commerce and Trade meeting. Prepared by Wallace P. Bolen [(703) 648–7727, [email protected]]
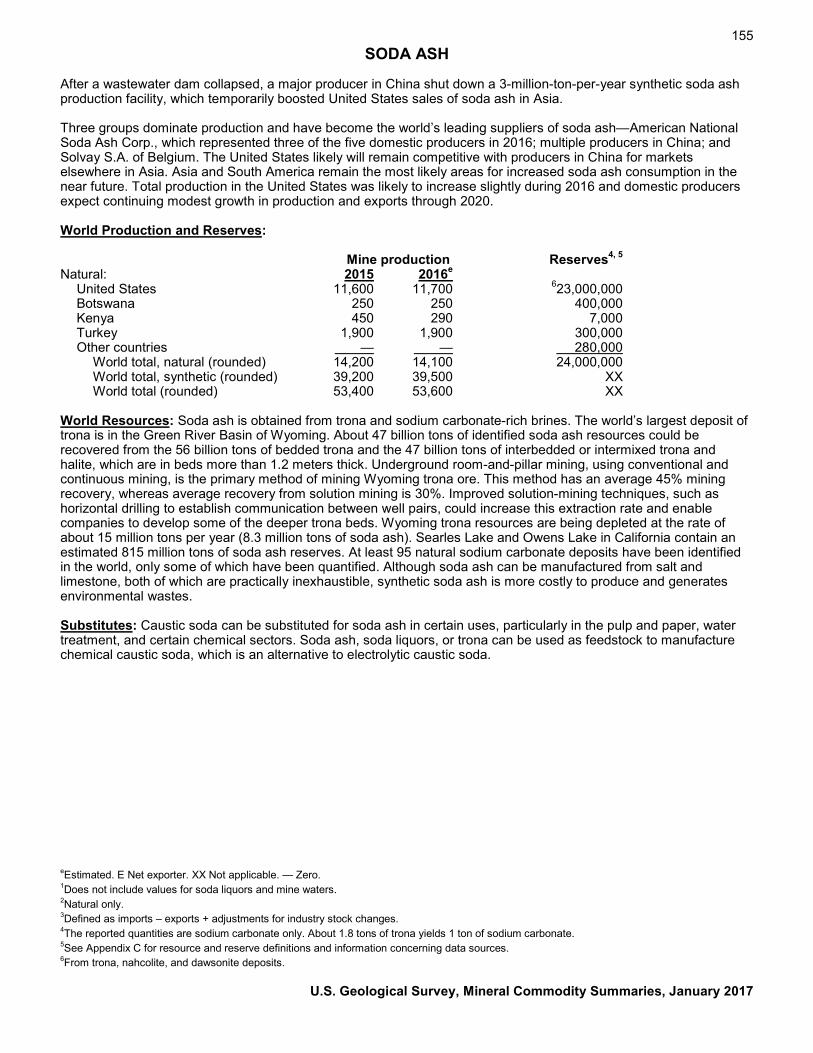
155 SODA ASH
After a wastewater dam collapsed, a major producer in China shut down a 3-million-ton-per-year synthetic soda ash production facility, which temporarily boosted United States sales of soda ash in Asia. Three groups dominate production and have become the world’s leading suppliers of soda ash—American National Soda Ash Corp., which represented three of the five domestic producers in 2016; multiple producers in China; and Solvay S.A. of Belgium. The United States likely will remain competitive with producers in China for markets elsewhere in Asia. Asia and South America remain the most likely areas for increased soda ash consumption in the near future. Total production in the United States was likely to increase slightly during 2016 and domestic producers expect continuing modest growth in production and exports through 2020. World Production and Reserves: Mine production Reserves4, 5 Natural: 2015 2016e United States 11,600 11,700 623,000,000 Botswana 250 250 400,000 Kenya 450 290 7,000 Turkey 1,900 1,900 300,000 Other countries — — 280,000 World total, natural (rounded) 14,200 14,100 24,000,000 World total, synthetic (rounded) 39,200 39,500 XX World total (rounded) 53,400 53,600 XX World Resources: Soda ash is obtained from trona and sodium carbonate-rich brines. The world’s largest deposit of trona is in the Green River Basin of Wyoming. About 47 billion tons of identified soda ash resources could be recovered from the 56 billion tons of bedded trona and the 47 billion tons of interbedded or intermixed trona and halite, which are in beds more than 1.2 meters thick. Underground room-and-pillar mining, using conventional and continuous mining, is the primary method of mining Wyoming trona ore. This method has an average 45% mining recovery, whereas average recovery from solution mining is 30%. Improved solution-mining techniques, such as horizontal drilling to establish communication between well pairs, could increase this extraction rate and enable companies to develop some of the deeper trona beds. Wyoming trona resources are being depleted at the rate of about 15 million tons per year (8.3 million tons of soda ash). Searles Lake and Owens Lake in California contain an estimated 815 million tons of soda ash reserves. At least 95 natural sodium carbonate deposits have been identified in the world, only some of which have been quantified. Although soda ash can be manufactured from salt and limestone, both of which are practically inexhaustible, synthetic soda ash is more costly to produce and generates environmental wastes. Substitutes: Caustic soda can be substituted for soda ash in certain uses, particularly in the pulp and paper, water treatment, and certain chemical sectors. Soda ash, soda liquors, or trona can be used as feedstock to manufacture chemical caustic soda, which is an alternative to electrolytic caustic soda. eEstimated. E Net exporter. XX Not applicable. — Zero. 1Does not include values for soda liquors and mine waters. 2Natural only. 3Defined as imports – exports + adjustments for industry stock changes. 4The reported quantities are sodium carbonate only. About 1.8 tons of trona yields 1 ton of sodium carbonate. 5See Appendix C for resource and reserve definitions and information concerning data sources. 6From trona, nahcolite, and dawsonite deposits.
U.S. Geological Survey, Mineral Commodity Summaries, January 2017

156
STONE (CRUSHED)1
(Data in million metric tons unless otherwise noted)2 Domestic Production and Use: In 2016, 1.48 billion tons of crushed stone valued at more than $16.2 billion was produced by 1,430 companies operating 3,700 quarries, 82 underground mines, and 187 sales and distribution yards in 50 States. Leading States were, in descending order of production, Texas, Pennsylvania, Florida, Missouri, Ohio, North Carolina, Georgia, Indiana, Illinois, and New York, which together accounted for more than one-half of the total crushed stone output. Of the total domestic crushed stone produced in 2016, about 70% was limestone and dolomite; 13%, granite; 6%, traprock; 5%, miscellaneous stone; 4%, sandstone and quartzite; and the remaining 2% was divided, in descending order of tonnage, among marble, volcanic cinder and scoria, calcareous marl, slate, and shell. It is estimated that, of the 1.54 billion tons of crushed stone consumed in the United States in 2016, 76% was used as construction material, mostly for road construction and maintenance; 11% for cement manufacturing; 7% for lime manufacturing; 4% for other chemical, special, and miscellaneous uses and products; and 2% for agricultural uses. The estimated output of crushed stone in the 48 conterminous States shipped for consumption in the first 6 months of 2016 was 648 million tons, an increase of 11% compared with that of the same period of 2015. Second quarter shipments for consumption increased by 6% compared with those of the same period of 2015. Additional production information by quarter for each State, geographic division, and the United States is reported in the U.S. Geological Survey quarterly Mineral Industry Surveys for Crushed Stone and Sand and Gravel (Construction). Salient Statistics—United States: 2012 2013 2014 2015 2016e Production 1,180 1,180 1,250 1,330 1,480 Recycled material 31 41 42 42 44 Imports for consumption 15 18 20 22 21 Exports 1 (3) (3) (3) (3) Consumption, apparent 1,200 1,240 1,310 1,400 1,540 Price, average value, dollars per metric ton 9.73 9.89 10.15 10.57 10.98 Employment, quarry and mill, number4 66,200 65,900 65,600 67,100 67,300 Net import reliance5 as a percentage of apparent consumption 1 1 2 2 1 Recycling: Road surfaces made of asphalt and crushed stone and portland cement concrete surface layers and structures were recycled on a limited but increasing basis in most States. Asphalt road surfaces and concrete were recycled in all 50 States. The amount of material reported to be recycled increased by almost 4% in 2016 compared with that of the previous year. Import Sources (2012–2015): Mexico, 73%; The Bahamas, 15%; Canada, 6%; Honduras, 5%; and other, 1%. Tariff: Item Number Normal Trade Relations 12–31–16 Crushed stone 2517.10.0000 Free. Depletion Allowance: (Domestic) 14% for some special uses; 5%, if used as ballast, concrete aggregate, riprap, or road material, or for similar purposes. Government Stockpile: None. Prepared by Jason Christopher Willett [(703) 648-6473, [email protected]]

157 STONE (CRUSHED)
Events, Trends, and Issues: Crushed stone production was about 1.48 billion tons in 2016, an increase of 11% compared with that of 2015. Apparent consumption also increased, to about 1.54 billion tons. Consumption of crushed stone was higher in 2016 because of increased consumption during every quarter since the second quarter of 2013, with an average increase of 7% over the same period of the previous year. With significantly stronger construction activity across the country in 2016 and recovery in the private sector and residential construction experiencing a level of growth not seen since late 2005, consumption of construction aggregates is likely to continue to increase. It is expected that the increased consumption in 2016 from that in 2015 will again reach or exceed the historical annual average of the past 50 years, which was a 2% to 4% increase per year. World Mine Production and Reserves: Mine production Reserves6 2015 2016e United States 1,330 1,480 Adequate, except where special Other countries7 NA NA types are needed or where World total NA NA local shortages exist. World Resources: Stone resources of the world are very large. Supply of high-purity limestone and dolomite suitable for specialty uses is limited in many geographic areas. The largest resources of high-purity limestone and dolomite in the United States are in the central and eastern parts of the country. Substitutes: Crushed stone substitutes for roadbuilding include sand and gravel, and iron and steel slag. Substitutes for crushed stone used as construction aggregates include construction sand and gravel, iron and steel slag, sintered or expanded clay or shale, perlite, or vermiculite. eEstimated. NA Not available. 1See also Stone (Dimension). 2See Appendix A for conversion to short tons. 3Less than ½ unit. 4Including office staff. Source: Mine Safety and Health Administration. 5Defined as imports – exports. 6See Appendix C for resource and reserve definitions and information concerning data sources. 7Consistent production information is not available for other countries owing to a wide variety of ways in which countries report their crushed stone production. Some countries do not report production for this mineral commodity.
U.S. Geological Survey, Mineral Commodity Summaries, January 2017

158
STONE (DIMENSION)1
(Data in thousand metric tons unless otherwise noted) Domestic Production and Use: Approximately 2.46 million tons of dimension stone, valued at $468 million, was sold or used by U.S. producers in 2016. Dimension stone was produced by 236 companies, operating 276 quarries, in 34 States. Leading producer States were, in descending order by tonnage, Texas, Indiana, Massachusetts, Wisconsin, and Georgia. These five States accounted for about 64% of the production and contributed about 60% of the value of domestic production. Approximately 43%, by tonnage, of dimension stone sold or used was limestone, followed by granite (22%), sandstone (18%), miscellaneous stone (13%), and marble and slate (2% each). By value, the leading sales or uses were for limestone (36%), followed by granite (28%), miscellaneous stone (15%), sandstone (13%), and marble and slate (4% each). Rough stone represented 59% of the tonnage and 48% of the value of all the dimension stone sold or used by domestic producers, including exports. The leading uses and distribution of rough stone, by tonnage, were in building and construction (58%), and in irregular-shaped stone (31%). Dressed stone mainly was sold for ashlars and partially squared pieces (43%), curbing (19%), and flagging (11%), by tonnage. Salient Statistics—United States:2 2012 2013 2014 2015 2016e Sold or used by producers3 Tonnage 2,150 2,280 2,470 2,630 2,460 Value, million dollars 452 459 470 461 468 Imports for consumption, value, million dollars 1,740 2,100 2,240 2,350 2,600 Exports, value, million dollars 65 61 70 75 63 Consumption, apparent, value, million dollars 2,130 2,500 2,640 2,740 3,000 Price Variable, depending on type of product Employment, quarry and mill, number4 3,200 4,000 4,000 4,000 4,000 Net import reliance5 as a percentage of apparent consumption (based on value) 79 82 82 83 84 Granite only, sold or used by producers: Tonnage 499 496 519 585 580 Value, million dollars 118 132 117 130 130 Imports, value, million dollars 1,080 1,290 1,330 1,340 1,340 Exports (rough and finished) 77 85 88 73 51 Consumption, apparent, value, million dollars 1,170 1,390 1,420 1,440 1,450 Price Variable, depending on type of product Employment, quarry and mill, number4 700 880 880 880 880 Net import reliance5 as a percentage of apparent consumption (based on value) 90 91 92 91 91 Recycling: Small amounts of dimension stone were recycled, principally by restorers of old stone work. Import Sources (2012–15 by value): All dimension stone: China, 27%; Brazil, 26%; Italy, 23%; Turkey, 16%; and other, 8%. Granite only: Brazil, 47%; China, 22%; India, 15%; Italy, 11%; and other, 5%. Tariff: Dimension stone tariffs ranged from free to 6.5% ad valorem, according to type, degree of preparation, shape, and size, for countries with normal trade relations in 2016. Most crude or rough-trimmed stone was imported at 3.0% ad valorem or less. Depletion Allowance: 14% (Domestic and foreign); slate used or sold as sintered or burned lightweight aggregate, 7.5% (Domestic and foreign); dimension stone used for rubble and other nonbuilding purposes, 5% (Domestic and foreign). Government Stockpile: None. Prepared by Thomas P. Dolley [(703) 648–7710, [email protected]]

159 STONE (DIMENSION)
Events, Trends, and Issues: The United States is one of the world’s leading markets for dimension stone. Total imports of dimension stone increased in value to about $2.6 billion compared with $2.35 billion in 2015. Slow growth in the U.S. economy in 2016, coupled with mixed to moderate growth in new residential construction, resulted in lower domestic production of dimension stone compared with the previous year. Dimension stone for construction and refurbishment was used in commercial and residential markets; in 2016, the refurbishment and remodeling market of existing homes was healthy and robust compared with those of 2015. These factors contributed to a steady rise in dimension stone imports. Dimension stone exports decreased to about $63 million. Apparent consumption, by value, was estimated to be $3 billion in 2016—a 9% increase from that of 2015. The dimension stone industry continued to be concerned with safety and health regulations and environmental restrictions in 2016, especially those concerning crystalline silica exposure. In 2016, the Occupational Safety and Health Administration finalized new regulations to further restrict exposure to crystalline silica at quarry sites and other industries that use materials containing it. Phased implementation of the new regulations are scheduled to take effect from 2017 through 2021. According to Italy’s Internazionale Marmi e Macchine Carrara S.p.A., world dimension granite and marble production, including the United States, was estimated to be approximately 155 million tons in 2014, the last year for which data were available. Although some small-scale production was likely in many nations, dimension granite and marble was produced and officially reported in 27 countries. The top five producing countries in 2014 were, in descending order by tonnage, China, India, Turkey, Iran, and Italy, and these countries accounted for about 74% of the world’s dimension granite and marble production. Global production of dimension granite and marble increased by 12% in 2014 compared with that of 2013. The United States ranked 18th in world production of dimension granite and marble in 2014. World Mine Production and Reserves: Mine production Reserves6 2015 2016e United States 2,630 2,460 Adequate except for certain Other countries NA NA special types and local World total NA NA shortages. World Resources: Dimension stone resources of the world are sufficient. Resources can be limited on a local level or occasionally on a regional level by the lack of a particular kind of stone that is suitable for dimension purposes. Substitutes: Substitutes for dimension stone include aluminum, brick, ceramic tile, concrete, glass, plastics, resin-agglomerated stone, and steel. eEstimated. NA Not available. 1See also Stone (Crushed). 2Includes Puerto Rico. 3Includes granite and other types of dimension stone. 4Excluding office staff. 5Defined as imports – exports. 6See Appendix C for resource and reserve definitions and information concerning data sources.
U.S. Geological Survey, Mineral Commodity Summaries, January 2017

160
STRONTIUM
(Data in metric tons of strontium content unless otherwise noted) Domestic Production and Use: Although deposits of strontium minerals occur widely throughout the United States, none have been mined in the United States since 1959. Domestic production of strontium carbonate, the principal strontium compound, ceased in 2006. A few domestic companies produce small quantities of downstream strontium chemicals from imported strontium carbonate. The estimated end-use distribution for strontium compounds in the United States was pyrotechnics and signals, 30%; ceramic ferrite magnets, 30%; master alloys, 10%; pigments and fillers, 10%; electrolytic production of zinc, 10%; and other applications, including glass, 10%. It is thought that virtually all of the strontium mineral celestite consumed in the United States since 2006 has been used as an additive in drilling fluids for oil and natural gas wells. Salient Statistics—United States: 2012 2013 2014 2015 2016e Production — — — — — Imports for consumption: Celestite1 8,660 21,900 24,200 24,500 3,160 Strontium compounds2 8,150 7,190 7,600 7,100 7,760 Exports, strontium compounds 71 37 104 86 130 Consumption, apparent: Celestite 8,660 21,900 24,200 24,500 3,160 Strontium compounds 8,070 7,160 7,500 7,020 7,630 Total 16,700 29,000 31,700 31,500 10,800 Price, average value of celestite imports at port of exportation, dollars per ton 50 50 50 51 70 Net import reliance3 as a percentage of apparent consumption 100 100 100 100 100 Recycling: None. Import Sources (2012–15): Celestite: Mexico, 100%. Strontium compounds: Mexico, 55%; Germany, 28%; China, 14%; and other, 3%. Total imports: Mexico, 62%; Germany, 24%; China, 12%; and other, 2%. Tariff: Item Number Normal Trade Relations 12–31–16 Celestite 2530.90.8010 Free. Strontium compounds: Strontium metal 2805.19.1000 3.7% ad val. Strontium oxide, hydroxide, peroxide 2816.40.1000 4.2% ad val. Strontium nitrate 2834.29.2000 4.2% ad val. Strontium carbonate 2836.92.0000 4.2% ad val. Depletion Allowance: 22% (Domestic), 14% (Foreign). Government Stockpile: None. Prepared by Sheryl A. Singerling [(703) 648–4954, [email protected]]

161 STRONTIUM
Events, Trends, and Issues: After increasing for 6 consecutive years, imports of celestite, the most commonly used strontium mineral, decreased by about 87% in 2016. The decrease was likely the result of decreased natural gas and oil drilling activity owing to low gas and oil prices. All of the material came from Mexico and is thought to be used exclusively as an additive in drilling fluids for oil and natural gas exploration and production. For these applications, celestite is ground but undergoes no chemical processing. Outside the United States, celestite is the raw material used for production of strontium compounds. Strontium carbonate is sintered with iron oxide to produce permanent ceramic ferrite magnets. Strontium nitrate contributes a brilliant red color to fireworks and signal flares. Approximately equal quantities of strontium compounds were thought to be used in these end uses. Smaller quantities of strontium compounds were consumed in several other applications, including glass production, electrolytic production of zinc, master alloys, and pigments and fillers. Strontium may be ingested by humans as a dietary supplement, as an active ingredient in toothpastes, and as a pain reliever for some types of cancer. Although specific information is not available, these uses likely consume very small quantities of strontium compounds, but the compounds must be extremely pure and, thus, are of high unit value. With improvements to global economic conditions, consumption of strontium compounds and, thus, celestite would be expected to increase. Little information is available about the potential for celestite consumption in drilling fluids, but if oil and gas drilling increases, celestite consumption in that end use may increase as well. The current state of oil prices internationally, however, implies that oil and gas drilling will not increase in the immediate future. In descending order of production, China, Spain, and Mexico are the world’s leading producers of celestite. China also is a major importer of celestite. World Mine Production and Reserves:4 Mine production Reserves5 2015 2016e United States — — — Argentina 5,000 5,000 All other: China 180,000 180,000 6,800,000 Mexico 79,000 77,000 Spain 90,000 90,000 1 World total (rounded) 354,000 350,000 6,800,000 World Resources: World resources of strontium are thought to exceed 1 billion tons. Substitutes: Barium can be substituted for strontium in ferrite ceramic magnets; however, the resulting barium composite will have reduced maximum operating temperature when compared with that of strontium composites. Substituting for strontium in pyrotechnics is hindered by difficulty in obtaining the desired brilliance and visibility imparted by strontium and its compounds. In drilling mud, barite is the preferred material, but celestite may substitute for some barite, especially when barite prices are high. eEstimated. — Zero. 1The strontium content of celestite is 43.88%, assuming an ore grade of 92%, which was used to convert units of celestite to strontium content. 2Strontium compounds, with their respective strontium contents, include strontium metal (100.00%); oxide, hydroxide, and peroxide (70.00%); carbonate (59.35%); and nitrate (41.40%). These factors were used to convert units of strontium compounds to strontium content. 3Defined as imports – exports. 4Gross weight of celestite in tons. 5See Appendix C for resource and reserve definitions and information concerning data sources.
U.S. Geological Survey, Mineral Commodity Summaries, January 2017

162
SULFUR
(Data in thousand metric tons of sulfur unless otherwise noted) Domestic Production and Use: In 2016, recovered elemental sulfur and byproduct sulfuric acid were produced at 101 operations in 27 States. Total shipments were valued at about $765 million. Elemental sulfur production was 9.11 million tons; Louisiana and Texas accounted for about 52% of domestic production. Elemental sulfur was recovered, in descending order of tonnage, at petroleum refineries, natural-gas-processing plants, and coking plants by 38 companies at 95 plants in 26 States. Byproduct sulfuric acid, representing about 7% of production of sulfur in all forms, was recovered at six nonferrous smelters in five States by four companies. Domestic elemental sulfur provided 66% of domestic consumption, and byproduct acid accounted for about 6%. The remaining 28% of sulfur consumed was provided by imported sulfur and sulfuric acid. About 90% of sulfur consumed was in the form of sulfuric acid. Salient Statistics—United States: 2012 2013 2014 2015 2016e Production: Recovered elemental 8,410 8,590 9,050 8,890 9,110 Other forms 586 616 587 646 670 Total (rounded) 9,000 9,210 9,630 9,540 9,780 Shipments, all forms 9,030 9,200 9,670 9,560 9,810 Imports for consumption: Recovered, elementale 2,930 2,990 2,370 2,240 1,960 Sulfuric acid, sulfur content 933 972 1,000 1,160 1,070 Exports: Recovered, elemental 1,860 1,770 2,010 1,850 2,040 Sulfuric acid, sulfur content 53 54 52 56 52 Consumption, apparent, all forms 11,000 11,300 11,000 11,100 10,700 Price, reported average value, dollars per ton of elemental sulfur, f.o.b., mine and (or) plant 123.54 68.71 80.07 87.62 78.00 Stocks, producer, yearend 132 160 141 138 135 Employment, mine and/or plant, number 2,600 2,600 2,600 2,600 2,500 Net import reliance1 as a percentage of apparent consumption 18 19 12 14 9 Recycling: Typically, between 2.5 million and 5 million tons of spent sulfuric acid is reclaimed from petroleum refining and chemical processes during any given year. Import Sources (2012–15): Elemental: Canada, 82%; Mexico, 13%; Venezuela, 3%; and other, 2%. Sulfuric acid: Canada, 64%; Mexico, 20%; and other, 16%. Total sulfur imports: Canada, 77%; Mexico 15%; Venezuela, 2%; and other, 6%. Tariff: Item Number Normal Trade Relations 12–31–16 Sulfur, crude or unrefined 2503.00.0010 Free. Sulfur, all kinds, other 2503.00.0090 Free. Sulfur, sublimed or precipitated 2802.00.0000 Free. Sulfuric acid 2807.00.0000 Free. Depletion Allowance: 22% (Domestic and foreign). Government Stockpile: None. Events, Trends, and Issues: Total U.S. sulfur production and shipments each increased by about 3% compared with those of 2015. Domestic production of elemental sulfur from petroleum refineries and recovery from natural gas operations increased slightly. Domestically, refinery sulfur production is expected to remain relatively constant as well as byproduct sulfuric acid, unless one or more of the remaining nonferrous-metal smelters close. Domestic phosphate rock consumption was lower in 2016 than in 2015, which resulted in decreased demand for sulfur to process the phosphate rock into phosphate fertilizers. Prepared by Lori E. Apodaca [(703) 648–7724, [email protected]]

163 SULFUR
World sulfur production decreased slightly; however, it is likely to steadily increase for the foreseeable future. The largest increases in sulfur production during the next 5 years are expected to take place in Iran, Kazakhstan, Qatar, Russia, Saudi Arabia, Turkmenistan, and the United Arab Emirates. During May 2016, wildfires in northeastern Alberta, Canada, had a negative effect on oil sand operations and sulfur production. Most of these operations were offline for the entire month. New sulfur demand associated with phosphate/fertilizer projects is expected in Algeria, Brazil, Egypt, Morocco, and Saudi Arabia. Contract sulfur prices in Tampa, FL, began 2016 at around $110 per ton. The price decreased to $65 per ton at the end of July but increased to about $69 in mid-October. Export prices were higher than domestic prices. In the past few years, sulfur prices have been variable, a result of the volatility of the demand for sulfur. The slight price increase seen in the fourth quarter of 2016 was a result of tightness in sulfur supply. World Production and Reserves: Production—All forms Reserves2 2015 2016e United States 9,540 9,780 Reserves of sulfur in crude oil, natural gas, Australia 900 900 and sulfide ores are large. Because most Brazil 530 530 sulfur production is a result of the processing Canada 5,780 5,500 of fossil fuels, supplies should be adequate Chile 1,700 1,700 for the foreseeable future. Because China 8,800 8,800 petroleum and sulfide ores can be processed Finland 740 740 long distances from where they are Germany 3,800 3,800 produced, sulfur production may not be in the India 2,730 2,700 country to which the reserves were Iran 2,200 2,200 attributed. For instance, sulfur from Saudi Italy 740 740 Arabian oil may be recovered at refineries in Japan 3,250 3,300 the United States. Kazakhstan 2,820 2,800 Korea, Republic of 1,400 1,400 Kuwait 850 850 Mexico 1,410 1,400 Netherlands 515 510 Poland 1,130 980 Qatar 850 850 Russia 6,720 6,700 Saudi Arabia 4,900 4,900 United Arab Emirates 2,400 2,400 Uzbekistan 540 540 Venezuela 700 700 Other countries 4,500 4,500 World total (rounded) 69,400 69,300 World Resources: Resources of elemental sulfur in evaporite and volcanic deposits and sulfur associated with natural gas, petroleum, tar sands, and metal sulfides amount to about 5 billion tons. The sulfur in gypsum and anhydrite is almost limitless, and 600 billion tons of sulfur is contained in coal, oil shale, and shale rich in organic matter. Production from these sources would require development of low-cost methods of extraction. The domestic sulfur resource is about one-fifth of the world total. Substitutes: Substitutes for sulfur at present or anticipated price levels are not satisfactory; some acids, in certain applications, may be substituted for sulfuric acid.
eEstimated. 1Defined as imports – exports + adjustments for industry stock changes. 2See Appendix C for resource and reserve definitions and information concerning data sources.
U.S. Geological Survey, Mineral Commodity Summaries, January 2017

164
TALC AND PYROPHYLLITE1
(Data in thousand metric tons unless otherwise noted) Domestic Production and Use: Three companies operated five talc-producing mines in three States during 2016, and domestic production of crude talc was estimated to have decreased by 4% to 660,000 tons valued at $19.1 million. Montana was the leading producer State, followed by Texas and Vermont. One company in Virginia that mines soapstone for dimension stone purposes had previously been included in the domestic talc data but was removed beginning in 2014. Total sales (domestic and export) of talc by U.S. producers were estimated to be 545,000 tons valued at $97.5 million, a slight decline from those in 2015. Talc produced and sold in the United States was used in ceramics (including automotive catalytic converters) (26%), paper (18%), paint (17%), unclassified end uses (13%), plastics (12%), roofing (7%), rubber (4%), and cosmetics (3%). Of the estimated 385,000 tons of talc that was imported in 2016, it is likely that more than 75% was used in cosmetics, paint, and plastics applications. Including imported talc, the U.S. end-use rankings were thought to be, in decreasing order by tonnage, plastics, ceramics, paint, paper, roofing, rubber, cosmetics, and other. One company in North Carolina mined and processed pyrophyllite in 2016. Domestic production was withheld in order to avoid disclosing company proprietary data and was estimated to have increased from that in 2015. Pyrophyllite was sold for refractory, paint, and ceramic products. Salient Statistics—United States: 2012 2013 2014 2015 2016e Production, mine 515 542 608 687 660 Sold by producers 575 560 551 552 545 Imports for consumption 350 275 308 322 385 Exports 270 196 190 206 215 Consumption, apparent2 595 621 726 803 830 Price, average, milled, dollars per metric ton3 152 163 171 e169 180 Employment, mine and mill, talc4 260 250 230 240 225 Employment, mine and mill, pyrophyllite4 23 23 26 29 30 Net import reliance5 as a percentage of apparent consumption 13 13 14 14 20 Recycling: Insignificant. Import Sources (2012–15): Pakistan, 37%; Canada, 27%; China, 20%; Japan, 5% (includes pyrophyllite); and other, 11%. Large quantities of crude talc are mined in Afghanistan before being milled in and exported from Pakistan. Tariff: Item Number Normal Trade Relations 12–31–16 Natural steatite and talc: Not crushed, not powdered 2526.10.0000 Free. Crushed or powdered 2526.20.0000 Free. Talc, steatite, and soapstone; cut or sawed 6815.99.2000 Free. Depletion Allowance: Block steatite talc: 22% (Domestic), 14% (Foreign). Other talc and pyrophyllite: 14% (Domestic and foreign). Government Stockpile: None. Events, Trends, and Issues: Through September 2016, trends in U.S. economic sectors that use talc were mixed but primarily positive compared with the same time period in 2015. Industrial output of paint, coatings, and adhesives increased by 7%; production of motor vehicles and parts grew by 5%; housing starts rose by 4%; manufacture of rubber products increased slightly; and output of paper and plastics each declined slightly. If sustained, this overall trend could lead to increased consumption of talc owing to its use in manufacturing catalytic converter bodies for automobiles (ceramics), automotive body and underhood components (plastics), and such construction products as adhesives, caulk, coatings, joint compounds, paint, and roofing products. Prepared by Daniel M. Flanagan [(703) 648–7726, [email protected]]

165 TALC AND PYROPHYLLITE
China (35%), Pakistan (34%), and Canada (26%) were the principal import sources for talc during 2016, based on data reported by the U.S. Census Bureau. Imports from China and Pakistan increased by 42% and 15%, respectively, relative to 2015, and imports originating in China were nearly 250% higher than those in 2014. Canada and Mexico continued to be the primary destinations for U.S. talc shipments, collectively receiving nearly 70% of exports. U.S. talc production increased for 3 consecutive years prior to 2016, and apparent consumption has increased for 4 consecutive years, but production and apparent consumption in 2016 were still about 38% and 19% lower, respectively, than in 1995. Several domestic talc markets have declined over this roughly 20-year period, with the largest decreases taking place in the ceramics (talc use fell by an estimated 55%), paint (44%), cosmetics (43%), and paper (39%) industries. Ceramic tile and sanitaryware formulations and the technology for firing ceramic tile changed, reducing the amount of talc required for the manufacture of some ceramic products. Many domestic ceramic tile manufacturing plants also closed as tile imports increased, leading a major domestic producer to stop mining talc in 2008. For paint, the industry shifted its focus to production of water-based paint, a product for which talc is not well suited because it is hydrophobic, from oil-based paint in order to reduce volatile emissions. Paper manufacturing decreased beginning in the 1990s, and some talc used for pitch control was replaced by chemical agents. For cosmetics, manufacturers of body dusting powders shifted some of their production from talc-based to corn-starch-based products. In contrast, sales of domestic talc for plastics rose by an estimated 85% from 1995 to 2016, primarily the result of increased use in automotive plastics, but a significant share of the increased demand has been met with imported talc. The paper industry has traditionally been the largest consumer of talc worldwide, although plastics are expected to overtake paper as the predominant end use within the next several years as Asian papermakers make greater use of talc substitutes and use of talc in automobile plastics increases. World Mine Production and Reserves: Mine productione Reserves6 2015 2016 United States (crude) 7687 660 140,000 Brazil (crude and beneficiated)8 845 850 52,000 China (unspecified minerals) 2,200 2,200 Large France (crude) 450 450 Large India8 7922 925 110,000 Japan8 365 370 100,000 Korea, Republic of8 605 610 11,000 Mexico 750 750 Large Other countries (includes crude) 81,590 81,600 Large World total (rounded) 88,400 88,400 Large World Resources: The United States is self-sufficient in most grades of talc and related minerals. Domestic and world resources are estimated to be approximately five times the quantity of reserves. Substitutes: Substitutes for talc include bentonite, chlorite, feldspar, kaolin, and pyrophyllite in ceramics; chlorite, kaolin, and mica in paint; calcium carbonate and kaolin in paper; bentonite, kaolin, mica, and wollastonite in plastics; and kaolin and mica in rubber. eEstimated. 1All statistics exclude pyrophyllite unless otherwise noted. 2Defined as mine production + imports – exports. 3Average ex-works unit value of milled talc sold by U.S. producers, based on data reported by companies. 4Includes only companies that mine talc or pyrophyllite. Excludes office workers and mills that process imported or domestically purchased material. 5Defined as imports – exports. 6See Appendix C for resource and reserve definitions and information concerning data sources. 7Reported figure. 8Includes pyrophyllite.
U.S. Geological Survey, Mineral Commodity Summaries, January 2017
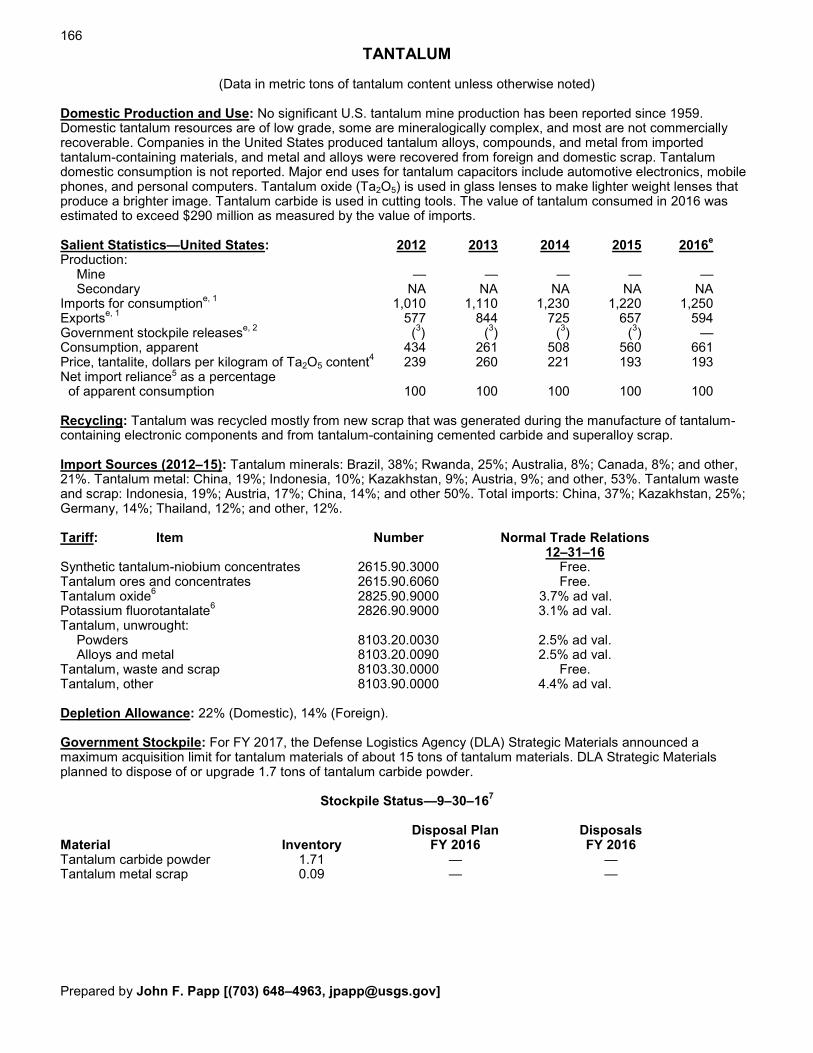
166
TANTALUM
(Data in metric tons of tantalum content unless otherwise noted) Domestic Production and Use: No significant U.S. tantalum mine production has been reported since 1959. Domestic tantalum resources are of low grade, some are mineralogically complex, and most are not commercially recoverable. Companies in the United States produced tantalum alloys, compounds, and metal from imported tantalum-containing materials, and metal and alloys were recovered from foreign and domestic scrap. Tantalum domestic consumption is not reported. Major end uses for tantalum capacitors include automotive electronics, mobile phones, and personal computers. Tantalum oxide (Ta2O5) is used in glass lenses to make lighter weight lenses that produce a brighter image. Tantalum carbide is used in cutting tools. The value of tantalum consumed in 2016 was estimated to exceed $290 million as measured by the value of imports. Salient Statistics—United States: 2012 2013 2014 2015 2016e Production: Mine — — — — — Secondary NA NA NA NA NA Imports for consumptione, 1 1,010 1,110 1,230 1,220 1,250 Exportse, 1 577 844 725 657 594 Government stockpile releasese, 2 (3) (3) (3) (3) — Consumption, apparent 434 261 508 560 661 Price, tantalite, dollars per kilogram of Ta2O5 content4 239 260 221 193 193 Net import reliance5 as a percentage of apparent consumption 100 100 100 100 100 Recycling: Tantalum was recycled mostly from new scrap that was generated during the manufacture of tantalum-containing electronic components and from tantalum-containing cemented carbide and superalloy scrap. Import Sources (2012–15): Tantalum minerals: Brazil, 38%; Rwanda, 25%; Australia, 8%; Canada, 8%; and other, 21%. Tantalum metal: China, 19%; Indonesia, 10%; Kazakhstan, 9%; Austria, 9%; and other, 53%. Tantalum waste and scrap: Indonesia, 19%; Austria, 17%; China, 14%; and other 50%. Total imports: China, 37%; Kazakhstan, 25%; Germany, 14%; Thailand, 12%; and other, 12%. Tariff: Item Number Normal Trade Relations 12–31–16 Synthetic tantalum-niobium concentrates 2615.90.3000 Free. Tantalum ores and concentrates 2615.90.6060 Free. Tantalum oxide6 2825.90.9000 3.7% ad val. Potassium fluorotantalate6 2826.90.9000 3.1% ad val. Tantalum, unwrought: Powders 8103.20.0030 2.5% ad val. Alloys and metal 8103.20.0090 2.5% ad val. Tantalum, waste and scrap 8103.30.0000 Free. Tantalum, other 8103.90.0000 4.4% ad val. Depletion Allowance: 22% (Domestic), 14% (Foreign). Government Stockpile: For FY 2017, the Defense Logistics Agency (DLA) Strategic Materials announced a maximum acquisition limit for tantalum materials of about 15 tons of tantalum materials. DLA Strategic Materials planned to dispose of or upgrade 1.7 tons of tantalum carbide powder.
Stockpile Status—9–30–167
Disposal Plan Disposals Material Inventory FY 2016 FY 2016 Tantalum carbide powder 1.71 — — Tantalum metal scrap 0.09 — — Prepared by John F. Papp [(703) 648–4963, [email protected]]

167 TANTALUM
Events, Trends, and Issues: U.S. tantalum apparent consumption in 2016 was estimated to have increased by 40% from that of 2015. Decreased exports were the leading cause of this increase; slightly increased imports also contributed. Tantalum waste and scrap was the leading imported tantalum material, accounting for about 47% of tantalum imports. In 2016, the average monthly price of tantalum ore remained at about $193 per kilogram of Ta2O5 content from January through September. This was unchanged from the average price in 2015. Rwanda accounted for about 37% of global tantalum production and Congo (Kinshasa) accounted for about 32% in 2015. Based on estimated production for 2016, it appears that the production portions have reversed. The United States, through the enactment of Section 1502 of the Dodd-Frank Wall Street Reform and Consumer Protection Act (Dodd-Frank Act) in 2010, made it a statutory obligation for all companies registered with the U.S. Securities and Exchange Commission (SEC) to perform due diligence to determine whether the products they manufacture, or the components of the products they manufacture, contain tantalum, tin, tungsten, and (or) gold (3TG) minerals and, if so, to determine whether these minerals were sourced from Congo (Kinshasa) and (or) its bordering countries. Under rules issued by the SEC, publicly traded companies were required to report the sources of 3TG materials used annually. A Brazilian company’s subsidiary produced niobium-tantalum alloy from its Pitinga Mine ore. Niobium and tantalum production declined and used costly electricity from diesel generators. The mine's hydroelectric plant's dike reconstruction was targeted for completion in 2016. A flotation plant expansion, designed to increase production capacity of niobium and tantalum alloy at Pitinga to 4,400 tons per year, was also expected to be in operation by the end of 2016. World Mine Production and Reserves: Mine production Reserves8 2015 2016e United States — — — Australia NA NA 969,000 Brazil 115 115 36,000 China 60 60 NA Congo (Kinshasa) 350 450 NA Rwanda 410 300 NA Other 117 140 NA World total (rounded) 1,100 1,100 >100,000 World Resources: Identified resources of tantalum, most of which are in Australia, Brazil, and Canada, are considered adequate to meet projected needs. The United States has about 1,500 tons of tantalum resources in identified deposits, most of which are considered uneconomic at 2016 prices. Substitutes: The following materials can be substituted for tantalum, but usually with less effectiveness: niobium in carbides; aluminum and ceramics in electronic capacitors; glass, niobium, platinum, titanium, and zirconium in corrosion-resistant applications; and hafnium, iridium, molybdenum, niobium, rhenium, and tungsten in high-temperature applications. eEstimated. NA Not available. — Zero. 1Imports and exports include the estimated tantalum content of niobium and tantalum ores and concentrates, unwrought tantalum alloys and powder, tantalum waste and scrap, and other tantalum articles. Synthetic ore and concentrate was assumed to contain 32% Ta2O5. Niobium ore and concentrate was assumed to contain 32% Ta2O5. Tantalum ore and concentrate was assumed to contain 37% Ta2O5. Ta2O5 is about 81.9% Ta. 2Government stockpile inventory reported by DLA Strategic Materials is the basis for estimating Government stockpile releases. 3Less than one-half unit. 4Price is annual average price reported in Consumer Research Unit Prices. 5Defined as imports – exports + adjustments for Government and industry stock changes. 6This category includes other than tantalum-containing material. 7See Appendix B for definitions. 8See Appendix C for resource and reserve definitions and information concerning data sources. 9For Australia, Joint Ore Reserves Committee-compliant reserves were 29,100 tons.
U.S. Geological Survey, Mineral Commodity Summaries, January 2017

168
TELLURIUM
(Data in metric tons of tellurium content unless otherwise noted) Domestic Production and Use: In 2016, one firm in Texas produced commercial-grade tellurium as a byproduct from domestic copper anode slimes and lead refinery skimmings. The primary producer and downstream producers further refined domestic and imported commercial-grade metal to produce tellurium dioxide, high-purity tellurium, and tellurium compounds for specialty applications. To avoid disclosing company proprietary data, U.S. tellurium production in 2016 was withheld. Tellurium was used in the production of cadmium telluride (CdTe) solar cells, which was the major end use for tellurium in the United States. Other uses were as an alloying additive in steel to improve machining characteristics, as a minor additive in copper alloys to improve machinability without reducing conductivity, in lead alloys to improve resistance to vibration and fatigue, in cast iron to help control the depth of chill, and in malleable iron as a carbide stabilizer. It was used in the chemical industry as a vulcanizing agent and accelerator in the processing of rubber and as a component of catalysts for synthetic fiber production. Other uses included those in photoreceptor devices and as a pigment to produce various colors in glass and ceramics. Global consumption estimates of tellurium by end use are: solar, 40%; thermoelectric production, 30%; metallurgy, 15%; rubber applications, 5%; and other, 10%. Salient Statistics—United States: 2012 2013 2014 2015 2016e Production, refinery W W W W W Imports for consumption 36 65 109 76 70 Exports 47 42 28 41 40 Consumption, apparent W W W W W Price, dollars per kilogram, 99.95% minimum1 150 112 119 77 34 Stocks, producer, refined, yearend W W W W W Net import reliance2 as a percentage of apparent consumption <50 >50 >75 >75 >75 Recycling: For traditional metallurgical and chemical uses, there was little or no old scrap from which to extract secondary tellurium because these uses of tellurium are highly dispersive or dissipative. A very small amount of tellurium was recovered from scrapped selenium-tellurium photoreceptors employed in older plain paper copiers in Europe. A plant in the United States recycled tellurium from CdTe solar cells; however, the amount recycled was limited because most CdTe solar cells were relatively new and had not reached the end of their useful life. Import Sources (2012–15): Canada, 59%; China, 24%; Belgium, 8%; Philippines, 7%; and other, 2%. Tariff: Item Number Normal Trade Relations 12–31–16 Tellurium 2804.50.0020 Free. Depletion Allowance: 14% (Domestic and foreign). Government Stockpile: None. Events, Trends, and Issues: In 2016, reported domestic tellurium production decreased from that in 2015. The sole domestic producer shipped at least a portion of its anode slimes to Mexico for treatment and refining. World production of tellurium in 2016 was estimated to be about 400 tons. In 2016, the price of tellurium continued its downward trend, decreasing from $77 per kilogram ($35 per pound) in 2015 to an estimated $34 per kilogram ($15 per pound) in 2016. In China, the Yunnan Provincial government instructed the municipal government of Kunming to launch an official investigation into the trading activities of the Fanya Metal Exchange Co. Ltd. (FME), which began trading tellurium in April 2014. The municipal government was instructed to determine if the FME had any physical assets in warehouses, concealed facts, created a capital pool and taken control of the funds within, and illegally possessed and used the funds that it had raised. In February, the owner of the FME was arrested, and in March, the Public Security Bureau announced that it was expanding its investigation into FME activities. The 170 tons of tellurium that was reported to be in FME warehouses has not been verified by the Government or a third party. Prepared by C. Schuyler Anderson [(703) 648–4985, [email protected]]

169 TELLURIUM
Although imports of tellurium from Canada decreased by 35% to less than 51 tons, Canada remained the leading source of domestic imports of tellurium and supplied about twice as much as China, the next leading supplier. In Sweden, new mine operations that started to produce tellurium concentrate in 2012 reportedly produced 33 tons in 2015. The Government of the United States extended subsidies and tax credits for new solar construction that were aimed at encouraging domestic solar projects. The subsidies were to expire at the end of 2016, but legislation passed by the U.S. Congress in December 2015 extended the 30% Solar Energy Credit until January 1, 2019. After this date, the credit begins to decrease incrementally, until it reaches 10% on January 1, 2022, and that is where it will remain for any new commercial construction that begins after 2022. World Refinery Production and Reserves: The figures shown for reserves include only tellurium contained in copper reserves. These estimates assume that more than one-half of the tellurium contained in unrefined copper anodes is recoverable. Refinery production Reserves3 2015 2016e United States W W 3,500 Canada 9 10 800 Japan 37 30 — Peru — — 3,600 Russia 35 35 NA Sweden 33 33 670 Other countries4 NA NA 16,000 World total (rounded) NA NA 25,000 World Resources: Data on tellurium resources were not available. More than 90% of tellurium has been produced from anode slimes collected from electrolytic copper refining, and the remainder was derived from skimmings at lead refineries and from flue dusts and gases generated during the smelting of bismuth, copper, and lead-zinc ores. Other potential sources of tellurium include bismuth telluride and gold telluride ores. Substitutes: Several materials can replace tellurium in most of its uses, but usually with losses in efficiency or product characteristics. Bismuth, calcium, lead, phosphorus, selenium, and sulfur can be used in place of tellurium in many free-machining steels. Several of the chemical process reactions catalyzed by tellurium can be carried out with other catalysts or by means of noncatalyzed processes. In rubber compounding, sulfur and (or) selenium can act as vulcanization agents in place of tellurium. The selenides and sulfides of niobium and tantalum can serve as electrical-conducting solid lubricants in place of tellurides of those metals. The selenium-tellurium photoreceptors used in some plain paper photocopiers and laser printers have been replaced by organic photoreceptors in newer devices. Amorphous silicon and copper indium gallium selenide were the two principal competitors of CdTe in thin-film photovoltaic solar cells.
eEstimated. NA Not available. W Withheld to avoid disclosing company proprietary data. — Zero. 1Average price published by Metal-Pages for 99.95% tellurium. 2Defined as imports – exports + adjustments industry stock changes. 3See Appendix C for resource and reserve definitions and information concerning data sources. 4In addition to the countries listed, Australia, Belgium, Chile, China, Colombia, Germany, India, Kazakhstan, Mexico, the Philippines, and Poland produce refined tellurium, but output was not reported and available information was inadequate to make reliable production and reserves estimates.
U.S. Geological Survey, Mineral Commodity Summaries, January 2017

170
THALLIUM
(Data in kilograms of thallium content unless otherwise noted) Domestic Production and Use: Thallium has not been recovered in the United States since 1981. Consumption of thallium metal and thallium compounds was valued at $2.4 million. The primary end uses included the following: radioactive thallium-201 used for medical purposes in cardiovascular imaging; thallium as an activator (sodium iodide crystal doped with thallium) in gamma radiation detection equipment (scintillometer); thallium-barium-calcium-copper oxide high-temperature superconductor used in filters for wireless communications; thallium in lenses, prisms, and windows for infrared detection and transmission equipment; thallium-arsenic-selenium crystal filters for light diffraction in acousto-optical measuring devices; and thallium in mercury alloys for low-temperature measurements. Other uses include: as an additive in glass to increase its refractive index and density, a catalyst for organic compound synthesis, and a component in high-density liquids for gravity separation of minerals. Salient Statistics—United States: 2012 2013 2014 2015 2016e Production, refinery — — — — — Imports for consumption:1 Unwrought and powders — — 44 — — Other 685 209 53 334 325 Total 685 209 97 334 325 Exports:1 Unwrought and powders 21 3 51 50 45 Waste and scrap 26 11 103 107 115 Other 31 8 — — — Total 78 22 154 157 160 Consumption, estimated 633 198 46 177 165 Price, metal, dollars per kilogram2 6,800 6,990 7,200 7,400 7,500 Net import reliance3 as a percentage of estimated consumption 100 100 100 100 100 Recycling: None. Import Sources (2012–15): Germany, 85%; Russia, 13%; and other, 2%. Tariff: Item Number Normal Trade Relations 12–31–16 Unwrought and powders 8112.51.0000 4.0% ad val. Waste and scrap 8112.52.0000 Free. Other 8112.59.0000 4.0% ad val. Depletion Allowance: 14% (Domestic and foreign). Government Stockpile: None. Events, Trends, and Issues: In 2016, the price for thallium metal increased for the seventh consecutive year, reportedly owing to the limited availability of thallium produced in China and the constraint it placed on global supply. In 2016, China maintained its policy of eliminating toll-trading tax benefits on exports of thallium that began in 2006, thus contributing to the reduced supply to markets outside of China. In July 2010, China canceled a 5% value-added-tax rebate on exports of many minor metals, including fabricated thallium products. Demand for thallium for use in cardiovascular-imaging applications has declined, owing to price increases and superior performance and availability of alternatives, such as the medical isotope technetium-99. A global shortage of technetium-99 from 2009 to 2011 had contributed to an increase in thallium consumption during that time period. Since 2011, consumption of thallium has declined significantly. Small quantities of thallium are used for research. Prepared by Shawnna M. Bennett [(703) 648–7715, [email protected]]

171 THALLIUM
In late 2011, an exploration company in Brazil discovered a substantial thallium deposit in northwest Bahia. According to the company, the deposit was unique because it was the only known occurrence in the world in which thallium had been found with cobalt and manganese. Exploration of the site concluded by yearend 2015 and the company finished testing a hydrometallurgical process that could be used to extract thallium from the ore. Construction of a plant to produce thallium was dependent on obtaining licenses for operation and finding investment partners. Two of the leading global markets for thallium were glass lenses, prisms, and windows for fiber optics, and optics for digital cameras. The majority of producers of these products were in China, Japan, and the Republic of Korea. Thallium metal and its compounds are highly toxic materials and are strictly controlled to prevent harm to humans and the environment. Thallium and its compounds can be absorbed into the human body by skin contact, ingestion, or inhalation of dust or fumes. The leading sources of thallium released into the environment are coal-burning powerplants and smelters of copper, lead, and zinc ores. The major sources of thallium in drinking water are ore-processing sites and discharges from electronics, drugs, and glass factories. Under its national primary drinking water regulations for public water supplies, the U.S. Environmental Protection Agency has set an enforceable Maximum Contaminant Level of 2 parts per billion of thallium in drinking water. World Refinery Production and Reserves:4 Thallium is produced commercially in only a few countries as a byproduct in the roasting of copper, lead, and zinc ores and is recovered from flue dust. Because most producers withhold thallium production data, global production data are limited. In 2016, global production of thallium was estimated to be less than 10,000 kilograms. China, Kazakhstan, and Russia were believed to be leading producers of primary thallium. Since 2005, substantial thallium-rich deposits have been identified in Brazil, China, Macedonia, and Russia. World Resources: Although thallium is reasonably abundant in the Earth's crust, estimated at about 0.7 part per million, it exists mostly in association with potassium minerals in clays, granites, and soils, and it is not generally considered to be commercially recoverable from those materials. The major source of recoverable thallium is the trace amounts found in copper, lead, zinc, and other sulfide ores. Quantitative estimates of reserves are not available, owing to the difficulty in identifying deposits where thallium can be extracted economically. Previous estimates of reserves were based on the thallium content of zinc ores. World resources of thallium contained in zinc resources could be as much as 17 million kilograms; most are in Canada, Europe, and the United States. Global resources of coal contain an estimated 630 million kilograms of thallium. Substitutes: Although other materials and formulations can substitute for thallium in gamma radiation detection equipment and optics used for infrared detection and transmission, thallium materials are presently superior and more cost effective for these very specialized uses. The medical isotope technetium-99 can be used in cardiovascular-imaging applications instead of thallium. Nonpoisonous substitutes, such as tungsten compounds, are being marketed as substitutes for thallium in high-density liquids for gravity separation of minerals.
eEstimated. — Zero. 1Thallium content was estimated by the U.S. Geological Survey using official (U.S. Census Bureau) data and unit values for thallium content. 2Estimated price of 99.99%-pure granules or rods in 100- to 250-gram or larger lots. 3Defined as imports – exports. Consumption and exports of unwrought thallium were from imported material or from a drawdown in unreported inventories. 4See Appendix C for resource and reserve definitions and information concerning data sources.
U.S. Geological Survey, Mineral Commodity Summaries, January 2017

172
THORIUM
(Data in metric tons of thorium oxide (ThO2) equivalent unless otherwise noted) Domestic Production and Use: The world’s primary source of thorium is the rare-earth and thorium phosphate mineral monazite. In 2016, monazite was not recovered domestically as a salable product. As recent as 1994, monazite was produced as a salable byproduct during processing for titanium and zirconium minerals in Florida. Essentially, all thorium compounds and alloys consumed by the domestic industry were derived from imports. The number of companies that processed or fabricated various forms of thorium for commercial use was not available. Thorium’s use in most products was generally limited because of concerns over its naturally occurring radioactivity. Imports of thorium compounds are sporadic owing to changes in consumption and fluctuations in consumer inventory levels. The estimated value of thorium compounds imported for consumption by the domestic industry in 2016 was about $200,000, compared with $216,000 in 2015. Salient Statistics—United States: 2012 2013 2014 2015 2016e Production, mine and refinery1 — — — — — Imports for consumption: Thorium ore and concentrates (monazite), gross weight 43 — — — — Thorium compounds (oxide, nitrate, etc.), gross weight 4.40 2.83 11.00 2.74 1.70 Thorium compounds (oxide, nitrate, etc.), ThO2 contente 2.07 1.33 5.18 1.29 0.80 Exports: Thorium ore and concentrates (monazite), gross weight — — — — — Thorium compounds (oxide, nitrate, etc.), gross weight 3.16 1.01 214.80 2.16 226.00 Thorium compounds (oxide, nitrate, etc.), ThO2 contente 2.34 0.74 10.90 1.60 19.00 Consumption, apparent3 (2) 0.59 (2) (2) (2) Price, thorium compounds, gross weight, dollars per kilogram:4 India 60 65 65 63 65 Net import reliance5 as a percentage of apparent consumption 100 100 100 100 100 Recycling: None. Import Sources (2012–15): Monazite: United Kingdom, 100%. Thorium compounds: India, 96%; France, 3%; and the United Kingdom, 1%. U.S. imports of monazite from the United Kingdom in 2012 were from previously stockpiled imports that were mined elsewhere. Tariff: Item Number Normal Trade Relations 12–31–16 Thorium ores and concentrates (monazite) 2612.20.0000 Free. Thorium compounds 2844.30.1000 5.5% ad val. Depletion Allowance: Monazite, 22% on thorium content, and 14% on rare-earth and yttrium content (Domestic); 14% (Foreign). Government Stockpile: None. Prepared by Joseph Gambogi [(703) 648–7718, [email protected]]

173 THORIUM
Events, Trends, and Issues: Domestic demand for thorium alloys, compounds, and metals was limited and believed to be largely for research purposes. Imports and existing stocks supplied essentially all thorium consumed in the United States in 2016. Globally, thorium’s commercial uses included catalysts, high-temperature ceramics, and welding electrodes. On the basis of data through August 2016, exports of thorium compounds increased significantly in 2016; however, 19.7 tons of exports to Vietnam had a significantly lower-than-average unit value ($2.60 per kilogram) and may have been misclassified. Exports to Vietnam caused the average value of exported thorium compounds to decrease to $30 per kilogram, compared with $360 per kilogram in 2015. Imports of thorium compounds were estimated to contain about 0.8 tons of thorium oxide in 2016. The average value of imported thorium compounds increased to $116 per kilogram compared with the 2015 average of $79 per kilogram (gross weight). India maintained its position as the primary source of imported thorium compounds in 2016. Globally, monazite was produced primarily for its rare-earth-element content, and only a small fraction of the byproduct thorium produced was consumed. India was the leading producer of monazite. Thorium consumption worldwide is relatively small compared with that of most other mineral commodities. In regard to international trade, China was the leading importer of monazite, and Brazil and Thailand were the leading exporters. Several companies and countries were active in the pursuit of commercializing thorium as a fuel material for a new generation of nuclear reactors. Thorium-based nuclear research and development programs have been or are underway in Belgium, Brazil, Canada, China, the Czech Republic, France, Germany, India, Japan, Israel, the Netherlands, Norway, Russia, the United Kingdom, and the United States. In 2016, lower prices for rare-earth compounds slowed the development of rare-earth mining projects containing associated thorium. Nonetheless, projects were underway in Australia, Brazil, Canada, Greenland, India, Kazakhstan, Kenya, Madagascar, Malawi, Mozambique, Namibia, Sweden, Russia, South Africa, Tanzania, Turkey, the United States, and Vietnam. World Refinery Production and Reserves:6 Production and reserves are associated with the recovery of monazite in heavy-mineral sand deposits. Without demand for the rare earths, monazite would probably not be recovered for its thorium content under current market demand conditions. World Resources: The world’s leading thorium resources are found in placer, carbonatite, and vein-type deposits. Thorium is found in several minerals, including monazite, thorite, and thorianite. According to a 2014 report by the Organisation for Economic Co-operation and Development’s Nuclear Energy Agency and the International Atomic Energy Agency, worldwide thorium resources from major deposits are estimated to total more than 6 million tons of thorium. Thorium resources are found throughout the world, most notably in Australia, Brazil, and India. India’s Department of Atomic Energy estimated 12 million tons of monazite was contained in heavy-mineral sands. India’s monazite was reported to have an average thorium oxide content of 9% to 10%. Geoscience Australia estimated Australia’s inferred resources to be about 0.6 million tons of thorium. Most of the identified thorium resources in Australia a are within heavy-mineral sand deposits. None of Australia’s thorium resources were classified as economically recoverable. Brazil’s thorium resources were estimated to be 0.6 million tons. Substitutes: Nonradioactive substitutes have been developed for many applications of thorium. Yttrium compounds have replaced thorium compounds in incandescent lamp mantles. A magnesium alloy containing lanthanides, yttrium, and zirconium can substitute for magnesium-thorium alloys in aerospace applications. Cerium and lanthanum can substitute for thorium in welding electrodes. eEstimated. — Zero. 1All domestically consumed thorium was derived from imported materials. 2Includes material that may have been misclassified. 3Defined as imports – exports. Excludes ores and concentrates. Owing to sporadic shipments and unknown variations in the oxide content of exports, the apparent consumption calculation yields a negative value in 2012 and from 2014 through 2016. 4Based on U.S. Census Bureau customs value. 5Defined as imports – exports; however, all exports were derived from imported materials, and net import reliance is assumed to be 100%. 6See Appendix C for resource and reserve definitions and information concerning data sources.
U.S. Geological Survey, Mineral Commodity Summaries, January 2017

174
TIN
(Data in metric tons of tin content unless otherwise noted) Domestic Production and Use: Tin has not been mined or smelted in the United States since 1993 and 1989, respectively. Twenty-five firms accounted for about 90% of the primary tin consumed domestically in 2016. The major uses for tin in the United States were tinplate, 22%; chemicals, 20%; solder, 16%; alloys, 9%; babbitt, bronze/brass, and tinning, 9%; and other, 24%. Based on the average Platts Metals Week New York Dealer price for tin, the estimated value of imported refined tin was $560 million, and the estimated value of old scrap recovered domestically was $167 million. Salient Statistics—United States: 2012 2013 2014 2015 2016e Production, secondary: Old scrape 11,200 10,600 10,100 10,600 10,100 New scrap 2,440 2,150 1,900 1,900 2,000 Imports for consumption: Tin, refined 36,900 34,900 35,600 33,600 31,300 Tin, waste and scrap, gross weight 72,500 63,700 49,700 32,700 27,100 Exports: Tin, refined and tin alloys 5,560 5,870 5,700 3,350 1,900 Tin, waste and scrap, gross weight 10,300 5,020 7,480 2,530 3,930 Shipments from Government stockpile — — — — — Consumption, reported: Primary 24,500 25,700 24,200 23,900 23,600 Secondary 3,240 4,730 3,250 2,940 2,870 Consumption, apparent1 41,900 40,000 39,600 40,700 40,400 Price, average, cents per pound:2 New York dealer 990 1,041 1,023 756 770 Metals Week composite 1,283 1,352 NA NA NA London Metal Exchange, cash 957 1,012 994 729 745 Kuala Lumpur 958 1,012 993 NA NA Stocks, consumer and dealer, yearend 6,910 6,520 6,970 7,090 6,250 Net import reliance3 as a percentage of apparent consumption 72 73 74 74 75 Recycling: About 12,000 tons of tin from old and new scrap was recycled in 2015, accounting for about 30% of apparent consumption. Of this, about 10,000 tons was recovered from old scrap at 2 detinning plants and about 75 secondary nonferrous metal-processing plants. Import Sources (2012–15): Peru, 29%; Indonesia, 18%; Malaysia, 18%; Bolivia, 16%; and other, 19%. Tariff: Item Number Normal Trade Relations 12–31–16 Unwrought tin: Tin, not alloyed 8001.10.0000 Free. Tin alloys, containing, by weight:
5% or less lead 8001.20.0010 Free. More than 5% but not more than 25% lead 8001.20.0050 Free. More than 25% lead 8001.20.0090 Free.
Tin waste and scrap 8002.00.0000 Free. Depletion Allowance: 22% (Domestic), 14% (Foreign). Government Stockpile:
Stockpile Status—9–30–164 Disposal Plan Disposals Material Inventory FY 2016 FY 2016 Tin 4,041 — — Events, Trends, and Issues: Apparent consumption of tin in the United States increased slightly in 2016 compared with consumption in 2015. Peru remained the primary supplier of tin to the United States, and recycling rates of tin remained essentially unchanged from those in 2015. Tin prices, which had trended downward since April 2014, Prepared by C. Schuyler Anderson [(703) 648–4985, [email protected]]

175 TIN
increased significantly during 2016. The New York dealer price averaged 623 cents per pound in January and increased to an average of 912 cents per pound in September. The London Metal Exchange (LME) price averaged 649 cents per pound in January and increased to 888 cents per pound in September. The price increases are attributed to a reduction in tin smelting in China owing to decreased availability of tin concentrates, expectations that production would remain at lower levels in the near term, and the resulting overall supply tightness. In China, tin smelters were forced to shut down in July and August for environmental inspections; however, most restarted in September, encouraged by higher tin prices. In the first 8 months of 2016, Burma, China’s leading supplier of tin concentrate, exported 329,000 tons of tin concentrates containing an estimated 39,000 tons of tin. Industry analysts believe that in July and August, however, approximately one-third of the concentrate shipped was from government stock sales. Two of the three major mining sites were reportedly running at minimal production, and there was difficulty in finding new resources in the Man Maw mining area. In the first half of 2016, Indonesia exported 29,650 tons of tin, a 25% decrease from exports in the same period in 2015. This decrease was attributed to flooding in the first quarter of 2016, stricter regulations, and the closure of smelters during 2015. In August 2016, however, higher prices spurred producers in Indonesia to resume production of refined tin, and the State-owned producer announced plans to ramp up production and relist its brand on the LME. As an indication of increased interest in tin with higher prices, the Indonesia Commodity and Derivatives Exchange traded 7,515 tons of refined tin in September, the highest monthly total since June 2015. World Mine Production and Reserves: Reserves for Burma, China, Congo (Kinshasa), Peru, and Vietnam were revised based on new information from Government and Industry sources. Mine production Reserves5 2015 2016e United States — — — Australia 7,000 7,000 370,000 Bolivia 20,000 20,000 400,000 Brazil 25,000 26,000 700,000 Burma 34,300 33,000 110,000 China 110,000 100,000 1,100,000 Congo (Kinshasa) 6,400 5,200 110,000 Indonesia 52,000 55,000 800,000 Laos 900 900 NA Malaysia 3,800 4,000 250,000 Nigeria 2,500 2,200 NA Peru 19,500 18,000 100,000 Russia NA NA 350,000 Rwanda 2,000 1,800 NA Thailand 100 70 170,000 Vietnam 5,400 5,400 11,000 Other countries 100 100 180,000 World total (rounded) 289,000 280,000 4,700,000 World Resources: Identified resources of tin in the United States, primarily in Alaska, were insignificant compared with those of the rest of the world. World resources, principally in western Africa, southeastern Asia, Australia, Bolivia, Brazil, China, Indonesia, and Russia, are extensive and, if developed, could sustain recent annual production rates well into the future. Substitutes: Aluminum, glass, paper, plastic, or tin-free steel substitute for tin in cans and containers. Other materials that substitute for tin are epoxy resins for solder; aluminum alloys, alternative copper-base alloys, and plastics for bronze; plastics for bearing metals that contain tin; and compounds of lead and sodium for some tin chemicals. eEstimated. NA Not available. — Zero. 1Defined as old scrap + imports – exports + adjustments for Government and industry stock changes. 2Source: Platts Metals Week. 3Defined as imports – exports + adjustments for Government and industry stock changes, excluding imports and exports of waste and scrap. 4See Appendix B for definitions. 5See Appendix C for resource and reserve definitions and information concerning data sources.
U.S. Geological Survey, Mineral Commodity Summaries, January 2017
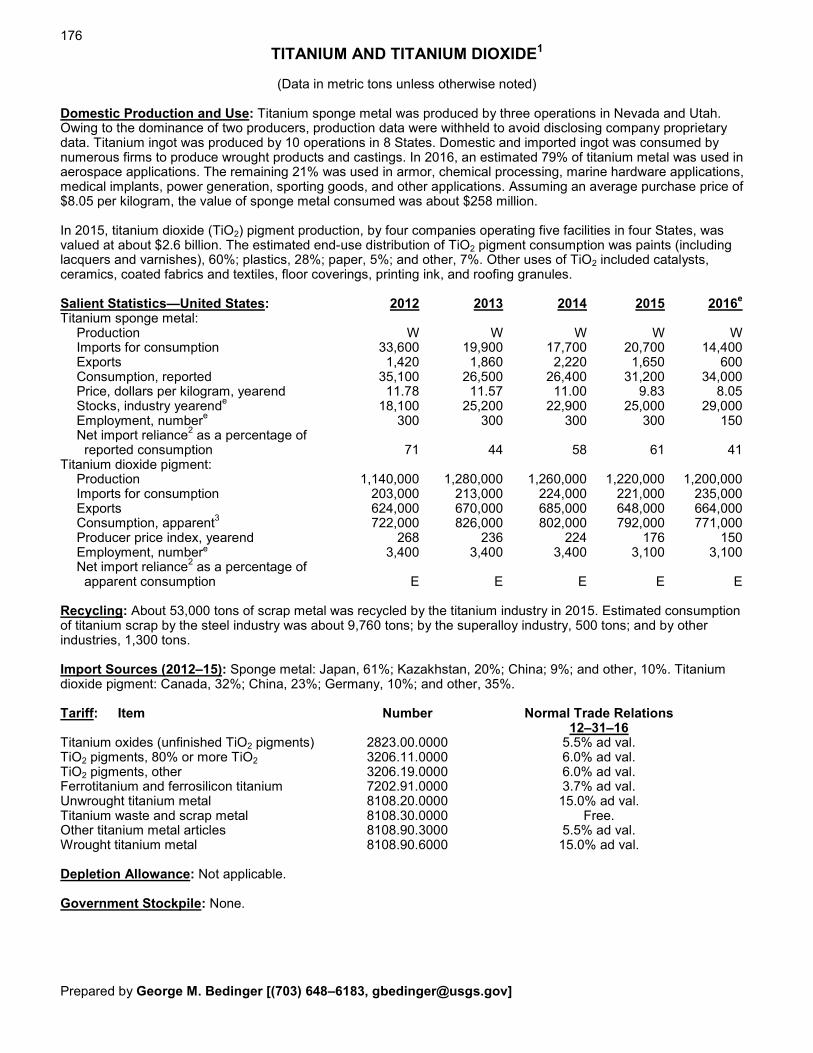
176
TITANIUM AND TITANIUM DIOXIDE1
(Data in metric tons unless otherwise noted) Domestic Production and Use: Titanium sponge metal was produced by three operations in Nevada and Utah. Owing to the dominance of two producers, production data were withheld to avoid disclosing company proprietary data. Titanium ingot was produced by 10 operations in 8 States. Domestic and imported ingot was consumed by numerous firms to produce wrought products and castings. In 2016, an estimated 79% of titanium metal was used in aerospace applications. The remaining 21% was used in armor, chemical processing, marine hardware applications, medical implants, power generation, sporting goods, and other applications. Assuming an average purchase price of $8.05 per kilogram, the value of sponge metal consumed was about $258 million. In 2015, titanium dioxide (TiO2) pigment production, by four companies operating five facilities in four States, was valued at about $2.6 billion. The estimated end-use distribution of TiO2 pigment consumption was paints (including lacquers and varnishes), 60%; plastics, 28%; paper, 5%; and other, 7%. Other uses of TiO2 included catalysts, ceramics, coated fabrics and textiles, floor coverings, printing ink, and roofing granules. Salient Statistics—United States: 2012 2013 2014 2015 2016e Titanium sponge metal: Production W W W W W Imports for consumption 33,600 19,900 17,700 20,700 14,400 Exports 1,420 1,860 2,220 1,650 600 Consumption, reported 35,100 26,500 26,400 31,200 34,000 Price, dollars per kilogram, yearend 11.78 11.57 11.00 9.83 8.05 Stocks, industry yearende 18,100 25,200 22,900 25,000 29,000 Employment, numbere 300 300 300 300 150 Net import reliance2 as a percentage of reported consumption 71 44 58 61 41 Titanium dioxide pigment: Production 1,140,000 1,280,000 1,260,000 1,220,000 1,200,000 Imports for consumption 203,000 213,000 224,000 221,000 235,000 Exports 624,000 670,000 685,000 648,000 664,000 Consumption, apparent3 722,000 826,000 802,000 792,000 771,000 Producer price index, yearend 268 236 224 176 150 Employment, numbere 3,400 3,400 3,400 3,100 3,100 Net import reliance2 as a percentage of apparent consumption E E E E E Recycling: About 53,000 tons of scrap metal was recycled by the titanium industry in 2015. Estimated consumption of titanium scrap by the steel industry was about 9,760 tons; by the superalloy industry, 500 tons; and by other industries, 1,300 tons. Import Sources (2012–15): Sponge metal: Japan, 61%; Kazakhstan, 20%; China; 9%; and other, 10%. Titanium dioxide pigment: Canada, 32%; China, 23%; Germany, 10%; and other, 35%. Tariff: Item Number Normal Trade Relations 12–31–16 Titanium oxides (unfinished TiO2 pigments) 2823.00.0000 5.5% ad val. TiO2 pigments, 80% or more TiO2 3206.11.0000 6.0% ad val. TiO2 pigments, other 3206.19.0000 6.0% ad val. Ferrotitanium and ferrosilicon titanium 7202.91.0000 3.7% ad val. Unwrought titanium metal 8108.20.0000 15.0% ad val. Titanium waste and scrap metal 8108.30.0000 Free. Other titanium metal articles 8108.90.3000 5.5% ad val. Wrought titanium metal 8108.90.6000 15.0% ad val. Depletion Allowance: Not applicable. Government Stockpile: None. Prepared by George M. Bedinger [(703) 648–6183, [email protected]]

177 TITANIUM AND TITANIUM DIOXIDE
Events, Trends, and Issues: Domestic consumption of titanium sponge in 2016 was estimated to have increased by about 10% from that of 2015 owing to increased demand by the aerospace industry. In August, the operator of the titanium sponge plant in Rowley, UT, announced that it would idle the facility by the end of 2016 owing to global overcapacity and its ability to secure aerospace quality sponge under long-term supply agreements at prices lower than production costs at Rowley. The facility was to be idled so that it could be restarted if supported by market conditions. An additive manufacturing (3D printing) metal powder plant optimized for the production of aerospace parts opened near Pittsburgh, PA, and a separate company announced plans to commission an additive manufacturing plant for manufacturing aerospace structural components from titanium powder in Plattsburgh, NY, by yearend 2017. Domestic production of TiO2 pigment in 2016 was estimated to be about 1.20 million tons, essentially unchanged from that of 2015. The leading global producer of TiO2 pigments started a new production line at its chloride-route plant in Altamira, Mexico, which was expected to increase capacity by 200,000 tons per year. In South Africa, a 25,000-ton-per-year pigment plant was closed owing to the age of the plant and low profit margins. The operator was preparing to spin off its other TiO2 pigment plant holdings into a separate company. World Sponge Metal Production and Sponge and Pigment Capacity: Sponge production Capacity 20164 2015 2016e Sponge Pigment United States W W 24,500 1,340,000 Australia — — — 260,000 Belgium — — — 87,000 Canada — — — 102,000 Chinae 62,000 60,000 110,000 2,940,000 Finland — — — 130,000 France — — — 33,000 Germany — — — 456,000 India 500 500 — 108,000 Italy — — — 80,000 Japane 42,000 54,000 68,800 314,000 Kazakhstane 9,000 9,000 26,000 1,000 Mexico — — — 300,000 Russiae 40,000 38,000 46,500 20,000 Ukrainee 7,700 7,500 12,000 120,000 United Kingdom — — — 300,000 Other countries — — — 822,000 World total (rounded) 5160,000 5170,000 290,000 7,400,000 World Resources:6 The commercial feedstocks for titanium and titanium dioxide are the titanium minerals, ilmenite, leucoxene, rutile, slag, and synthetic rutile. Resources and reserves of titanium minerals are discussed in the “Titanium Mineral Concentrates” chapter of this publication. Substitutes: Few materials possess titanium metal’s strength-to-weight ratio and corrosion resistance. In high-strength applications, titanium competes with aluminum, composites, intermetallics, steel, and superalloys. Aluminum, nickel, specialty steels, and zirconium alloys may be substituted for titanium for applications that require corrosion resistance. Ground calcium carbonate, precipitated calcium carbonate, kaolin, and talc compete with titanium dioxide as a white pigment. eEstimated. E Net exporter. W Withheld to avoid disclosing company proprietary data. — Zero. 1See also Titanium Mineral Concentrates. 2Defined as imports – exports. 3Defined as production + imports – exports. 4Yearend operating capacity. 5Excludes U.S. production. 6See Appendix C for resource and reserve definitions and information concerning data sources.
U.S. Geological Survey, Mineral Commodity Summaries, January 2017

178
TITANIUM MINERAL CONCENTRATES1
(Data in thousand metric tons of contained TiO2 unless otherwise noted) Domestic Production and Use: Two firms produced ilmenite and rutile concentrates from surface-mining operations in Florida and Georgia. Based on reported data through September 2016, the estimated value of titanium mineral concentrates consumed in the United States in 2016 was $560 million. Zircon was a coproduct of mining from ilmenite and rutile deposits. About 90% of titanium mineral concentrates were consumed by domestic titanium dioxide (TiO2) pigment producers. The remaining 10% was used in welding-rod coatings and for manufacturing carbides, chemicals, and metal. Salient Statistics—United States: 2012 2013 2014 2015 2016e Production2 (rounded) 200 200 100 200 100 Imports for consumption 1,110 1,190 1,110 1,010 970 Exportse, all forms 26 7 1 1 4 Consumption, estimated 1,390 1,390 1,190 1,210 1,070 Price, dollars per metric ton: Ilmenite, bulk, minimum 54% TiO2, f.o.b. Australia3 300 265 155 110 105 Rutile, bulk, minimum 95% TiO2, f.o.b. Australia3 2,200 1,250 950 840 725 Slag, 80%–95% TiO2
4 694–839 538–777 720–762 727–753 661–697 Employment, mine and mill, numbere 195 195 144 214 155 Net import reliance5 as a percentage of estimated consumption 78 86 92 83 91 Recycling: None. Import Sources (2012–15): South Africa, 34%; Australia, 32%; Canada, 16%; Mozambique, 12%; and other, 6%. Tariff: Item Number Normal Trade Relations 12–31–16 Synthetic rutile 2614.00.3000 Free. Ilmenite and ilmenite sand 2614.00.6020 Free. Rutile concentrate 2614.00.6040 Free. Titanium slag 2620.99.5000 Free. Depletion Allowance: Ilmenite and rutile; 22% (Domestic), 14% (Foreign). Government Stockpile: None. Events, Trends, and Issues: Consumption of titanium mineral concentrates is tied to production of TiO2 pigments that are primarily used in paint, paper, and plastics. Domestic consumption of titanium mineral concentrates in 2016 was estimated to have decreased by about 12% from that of 2015. Domestic mining and production of titanium concentrates took place at one mine near Starke, FL, and one mine near Nahunta, GA. Production decreased significantly because operations ceased at two mines in Virginia where reserves were exhausted during 2015. The operator of the mine near Nahunta, GA, announced a slowdown of production and curtailment of construction at a second mine site in Brantley County owing to a continued flat demand for zircon concentrates and a decrease in coproduct titanium mineral concentrates sales. Prices for titanium mineral concentrates decreased slightly throughout the year, remaining at about one-third the price of record-high values set in 2012. U.S. imports of ores and concentrates decreased by about 4% from those of 2015. At the end of 2016, the mine in Georgia was returning to full capacity in anticipation of an increase in demand. A major global producer of titanium concentrates was expecting increased demand owing to restocking by pigment producers and sustained price increases of titanium pigment. Several new offshore projects experienced their first full year of production. In late 2015, production began at the Fairbreeze Mine in South Africa where production was projected to be 25,000 and 220,000 tons per year of rutile and titanium slag, respectively. At the Keysbrook Mine in Western Australia, production was expected to be 67,000 tons per year of high-titanium leucoxene. Prepared by George M. Bedinger [(703) 648–6183, [email protected]]
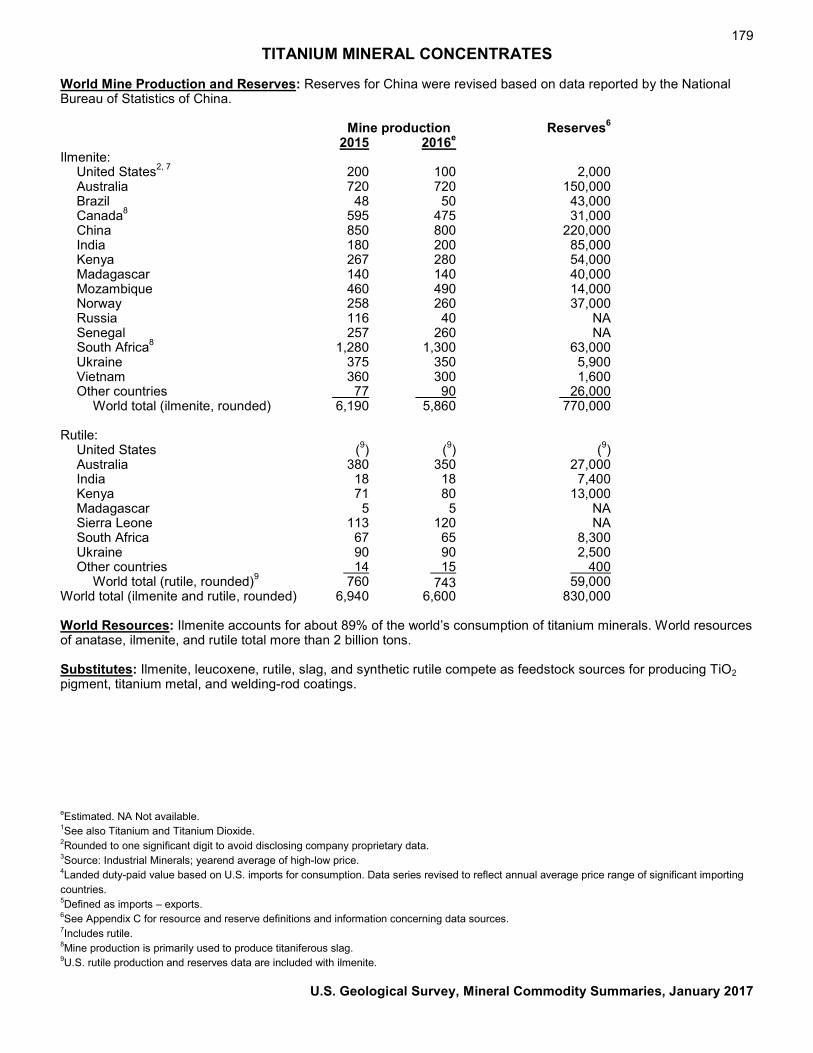
179 TITANIUM MINERAL CONCENTRATES
World Mine Production and Reserves: Reserves for China were revised based on data reported by the National Bureau of Statistics of China. Mine production Reserves6 2015 2016e Ilmenite: United States2, 7 200 100 2,000 Australia 720 720 150,000 Brazil 48 50 43,000 Canada8 595 475 31,000 China 850 800 220,000 India 180 200 85,000 Kenya 267 280 54,000 Madagascar 140 140 40,000 Mozambique 460 490 14,000 Norway 258 260 37,000 Russia 116 40 NA Senegal 257 260 NA South Africa8 1,280 1,300 63,000 Ukraine 375 350 5,900 Vietnam 360 300 1,600 Other countries 77 90 26,000 World total (ilmenite, rounded) 6,190 5,860 770,000 Rutile: United States (9) (9) (9) Australia 380 350 27,000 India 18 18 7,400 Kenya 71 80 13,000 Madagascar 5 5 NA Sierra Leone 113 120 NA South Africa 67 65 8,300 Ukraine 90 90 2,500 Other countries 14 15 400 World total (rutile, rounded)9 760 743 59,000 World total (ilmenite and rutile, rounded) 6,940 6,600 830,000 World Resources: Ilmenite accounts for about 89% of the world’s consumption of titanium minerals. World resources of anatase, ilmenite, and rutile total more than 2 billion tons. Substitutes: Ilmenite, leucoxene, rutile, slag, and synthetic rutile compete as feedstock sources for producing TiO2 pigment, titanium metal, and welding-rod coatings. eEstimated. NA Not available. 1See also Titanium and Titanium Dioxide. 2Rounded to one significant digit to avoid disclosing company proprietary data. 3Source: Industrial Minerals; yearend average of high-low price. 4Landed duty-paid value based on U.S. imports for consumption. Data series revised to reflect annual average price range of significant importing countries. 5Defined as imports – exports. 6See Appendix C for resource and reserve definitions and information concerning data sources. 7Includes rutile. 8Mine production is primarily used to produce titaniferous slag. 9U.S. rutile production and reserves data are included with ilmenite.
U.S. Geological Survey, Mineral Commodity Summaries, January 2017

180
TUNGSTEN
(Data in metric tons of tungsten content unless otherwise noted) Domestic Production and Use: A newly opened tungsten mine in northwest Utah produced concentrates in 2016; no tungsten concentrate was produced in California during the first 10 months of the year. Approximately seven companies in the United States processed tungsten concentrates, ammonium paratungstate, tungsten oxide, and (or) scrap to make tungsten metal powder, tungsten carbide powder, and (or) tungsten chemicals. Nearly 60% of the tungsten used in the United States was used in cemented carbide parts for cutting and wear-resistant applications, primarily in the construction, metalworking, mining, and oil and gas drilling industries. The remaining tungsten was used to make various alloys and specialty steels; electrodes, filaments, wires, and other components for electrical, electronic, heating, lighting, and welding applications; and chemicals for various applications. The estimated value of apparent consumption in 2016 was approximately $500 million. Salient Statistics—United States: 2012 2013 2014 2015 2016e Production: Mine NA NA NA NA NA Secondary 9,180 8,600 W W W Imports for consumption: Concentrate 3,610 3,690 4,080 3,970 3,600 Other forms 8,070 8,460 8,820 6,270 5,800 Exports: Concentrate 186 1,050 1,230 398 100 Other forms 6,590 6,660 5,490 3,360 2,800 Government stockpile shipments: Concentrate 1,780 2,100 282 — — Other forms (1) — (1) — — Consumption: Reported, concentrate W W W W W Apparent,2, 3 all forms 14,900 14,600 W W W Price, concentrate, dollars per mtu WO3,4 average, U.S. spot market, Platts Metals Week 358 358 348 302 142 Stocks, industry, yearend, concentrate and other forms W W W W W Net import reliance5 as a percentage of apparent consumption 39 41 >25 >25 >25 Recycling: The estimated quantity of tungsten consumed from secondary sources by processors and end users in 2016 was withheld to avoid disclosing company proprietary data. Import Sources (2012–15): Tungsten contained in ores and concentrates, intermediate and primary products, wrought and unwrought tungsten, and waste and scrap: China, 37%; Canada, 10%; Bolivia, 9%; Germany, 8%; and other, 36%. Tariff: Item Number Normal Trade Relations6 12–31–16 Ores 2611.00.3000 Free. Concentrates 2611.00.6000 37.5¢/kg tungsten content. Tungsten oxides 2825.90.3000 5.5% ad val. Ammonium tungstates 2841.80.0010 5.5% ad val. Tungsten carbides 2849.90.3000 5.5% ad val. Ferrotungsten 7202.80.0000 5.6% ad val. Tungsten powders 8101.10.0000 7.0% ad val. Tungsten waste and scrap 8101.97.0000 2.8% ad val. Depletion Allowance: 22% (Domestic), 14% (Foreign). Government Stockpile:
Stockpile Status—9–30–167 Disposal Plan Disposals Material Inventory FY 2016 FY 2016 Metal powder 125 35 — Ores and concentrates 11,600 1,360 — Prepared by Kim B. Shedd [(703) 648–4974, [email protected]]

181 TUNGSTEN
Events, Trends, and Issues: World tungsten supply was dominated by production in China and exports from China. China was also the world’s leading tungsten consumer. China’s Government regulated its tungsten industry by limiting the number of mining and export licenses, imposing quotas on concentrate production, and placing constraints on mining and processing. In terms of tonnage, mine production outside China has steadily increased since 2010. In 2014, Vietnam became the second leading global producer of tungsten concentrates, new mine production began in the United Kingdom and Zimbabwe in 2015, and a tungsten operation in Spain began producing tungsten concentrates from mined ore in 2016. An economic slowdown in China and weak economic conditions elsewhere ultimately led to tungsten supply (mine production plus recycled scrap) exceeding consumption. Global tungsten prices trended downward from mid-2013 through most of 2015. As a result of these and other factors, the sole tungsten mine in Canada in late 2015 suspended operations and was placed on care-and-maintenance status, eight large producers in China announced plans to reduce their output of tungsten concentrates, the China Tungsten Industry Association asked its members to cut their production of tungsten concentrates, and China’s State Reserve Bureau held tenders to purchase tungsten concentrates. Tungsten prices began to trend upward in late 2015 through early 2016. World Mine Production and Reserves: Reserves for Portugal, Russia, Vietnam, and “Other countries” were revised based on company or Government reports. Mine production Reserves8 2015 2016e United States NA NA NA Austria 861 860 10,000 Bolivia 1,460 1,400 NA Canada 1,680 — 290,000 China 73,000 71,000 1,900,000 Portugal 474 570 2,700 Russia 2,600 2,600 83,000 Rwanda 850 770 NA Spain 835 800 32,000 United Kingdom 150 700 51,000 Vietnam 5,600 6,000 95,000 Other countries 1,910 1,700 680,000 World total (rounded) 389,400 386,400 3,100,000 World Resources: World tungsten resources are geographically widespread. China ranks first in the world in terms of tungsten resources and reserves and has some of the largest deposits. Canada, Kazakhstan, Russia, and the United States also have significant tungsten resources. Substitutes: Potential substitutes for cemented tungsten carbides include cemented carbides based on molybdenum carbide and titanium carbide, ceramics, ceramic-metallic composites (cermets), and tool steels. Potential substitutes for other applications are as follows: molybdenum for certain tungsten mill products; molybdenum steels for tungsten steels; lighting based on carbon nanotube filaments, induction technology, and light-emitting diodes for lighting based on tungsten electrodes or filaments; depleted uranium or lead for tungsten or tungsten alloys in applications requiring high-density or the ability to shield radiation; and depleted uranium alloys or hardened steel for cemented tungsten carbides or tungsten alloys in armor-piercing projectiles. In some applications, substitution would result in increased cost or a loss in product performance. eEstimated. NA Not available. W Withheld to avoid disclosing company proprietary data. — Zero. 1Less than ½ unit. 2The sum of U.S. net import reliance (defined in footnote 5) and secondary production. 3Does not include U.S. mine production. 4A metric ton unit (mtu) of tungsten trioxide (WO3) contains 7.93 kilograms of tungsten. 5Defined as imports – exports + adjustments for Government and industry stock changes. 6No tariff for Canada. Tariffs for other countries for some items may be eliminated under special trade agreements. 7See Appendix B for definitions. 8See Appendix C for resource and reserve definitions and information concerning data sources.
U.S. Geological Survey, Mineral Commodity Summaries, January 2017

182
VANADIUM
(Data in metric tons of vanadium content unless otherwise noted) Domestic Production and Use: In 2016, six U.S. firms that compose most of the domestic vanadium industry produced ferrovanadium, vanadium pentoxide, vanadium metal, and vanadium-bearing chemicals or specialty alloys by processing materials such as petroleum residues, spent catalysts, utility ash, and vanadium-bearing pig iron slag. In 2009–13, small quantities of vanadium were produced as a byproduct from the mining of uraniferous sandstones on the Colorado Plateau. All byproduct vanadium production has been suspended since 2014. Metallurgical use, primarily as an alloying agent for iron and steel, accounted for about 94% of the domestic vanadium consumption in 2016. Of the other uses for vanadium, the major nonmetallurgical use was in catalysts for the production of maleic anhydride and sulfuric acid. Salient Statistics—United States: 2012 2013 2014 2015 2016e Production, mine, mill 106 591 — — — Imports for consumption: Ferrovanadium 4,190 3,710 3,230 2,010 2,300 Vanadium pentoxide, anhydride 1,640 2,040 3,410 2,870 2,400 Oxides and hydroxides, other 905 205 104 94 115 Aluminum-vanadium master alloys (gross weight) 115 169 431 204 260 Ash and residues 2,210 4,190 6,160 9,440 7,200 Sulfates 29 30 19 13 15 Vanadates 280 276 197 173 340 Vanadium metal1 (gross weight) 154 35 161 182 25 Exports: Ferrovanadium 337 299 253 122 665 Vanadium pentoxide, anhydride 62 90 201 356 180 Oxides and hydroxides, other 305 427 350 100 160 Aluminum-vanadium master alloys (gross weight) 432 347 443 229 140 Vanadium metal1 (gross weight) 26 58 32 5 5 Consumption: Apparent 8,530 10,100 12,300 14,100 11,400 Reported 3,960 3,980 4,070 3,930 4,000 Price, average, dollars per pound vanadium pentoxide 6.49 6.04 5.61 4.16 3.10 Stocks, consumer, yearend2 219 220 225 W W Net import reliance3 as a percentage of apparent consumption 99 94 100 100 100 Recycling: The quantity of vanadium recycled from spent chemical process catalysts was significant and may compose as much as 40% of total vanadium catalysts. Some tool steel scrap was recycled primarily for its vanadium content, but this only accounted for a small percentage of total vanadium used. Import Sources (2012–15): Ferrovanadium: Czech Republic, 41%; Canada, 21%; Republic of Korea, 19%; Austria, 14%; and other, 5%. Vanadium pentoxide: South Africa, 51%; Russia, 29%; China, 12%; and other, 8%. Tariff: Item Number Normal Trade Relations 12–31–16 Vanadium bearing ash and residues 2620.40.0030 Free. Vanadium bearing ash and residues, other 2620.99.1000 Free. Chemical compounds: Vanadium sulfates 2833.29.3000 Free. Vanadium vanadates 2841.90.1000 Free. Vanadium pentoxide anhydride 2825.30.0010 5.5% ad val. Vanadium oxides and hydroxides, other 2825.30.0050 5.5% ad val. Vanadates 2841.90.1000 5.5% ad val. Ferrovanadium 7202.92.0000 4.2% ad val. Vanadium and articles thereof4 8112.99.2000 2.0% ad val. Depletion Allowance: 22% (Domestic), 14% (Foreign). Government Stockpile: None. Prepared by Désirée E. Polyak [(703) 648–4909, [email protected]]

183 VANADIUM
Events, Trends, and Issues: U.S. reported consumption of vanadium in 2016 decreased slightly from that of 2015. Among the major uses for vanadium, production of carbon, full-alloy, and high-strength low-alloy steels accounted for 16%, 44%, and 36%, respectively, of domestic reported consumption. U.S. imports for consumption of vanadium in 2016 decreased by 16% from those of the previous year. The main decrease was in imports of vanadium-bearing ash and residues, a 24% decrease from those of 2015. U.S. exports increased by 28% from those of the previous year. The main increase was in exports of ferrovanadium. An iron and vanadium mine in South Africa closed in 2015, forcing the suspension of production by a major vanadium product producer because it was no longer receiving raw material from the closed mine. This has left South Africa with only two major producers of vanadium. A company in Austria, which also received raw material from the mine in South Africa, was also expected to decrease its vanadium product output in 2016. These vanadium products included aluminum-vanadium, ferrovanadium, vanadium chemicals, and vanadium oxides. Few new operations have been commissioned in recent years, with the exception of a producer in Brazil. The producer continued to optimize operations as part of its rampup to full production levels, creating new material for the market. Vanadium pentoxide and ferrovanadium prices slowly began to increase throughout 2016. However, prices were not expected to come anywhere near the high prices experienced in 2004 through 2008. In August 2016, vanadium pentoxide prices were $3.26 per pound compared with $15.40 per pound in August 2008. World Mine Production and Reserves: The reserves estimate for China was revised based on new information from the National Bureau of Statistics of China. Mine production Reserves5 2015 2016e (thousand metric tons) United States — — 45 Australia — — 1,800 Brazil 5,800 6,000 NA China 42,000 42,000 9,000 Russia 16,000 16,000 5,000 South Africa 14,000 12,000 3,500 World total (rounded) 77,800 76,000 19,000 World Resources: World resources of vanadium exceed 63 million tons. Vanadium occurs in deposits of phosphate rock, titaniferous magnetite, and uraniferous sandstone and siltstone, in which it constitutes less than 2% of the host rock. Significant quantities are also present in bauxite and carboniferous materials, such as coal, crude oil, oil shale, and tar sands. Because vanadium is typically recovered as a byproduct or coproduct, demonstrated world resources of the element are not fully indicative of available supplies. Although domestic resources and secondary recovery are adequate to supply a large portion of domestic needs, all of U.S. demand is currently met by foreign sources. Substitutes: Steels containing various combinations of other alloying elements can be substituted for steels containing vanadium. Certain metals, such as manganese, molybdenum, niobium (columbium), titanium, and tungsten, are to some degree interchangeable with vanadium as alloying elements in steel. Platinum and nickel can replace vanadium compounds as catalysts in some chemical processes. Currently, no acceptable substitute for vanadium is available for use in aerospace titanium alloys. eEstimated. NA Not available. W Withheld to avoid disclosing company proprietary data. — Zero. 1Vanadium metal includes waste and scrap. 2Does not include vanadium pentoxide. 3Defined as imports – exports + adjustments for industry stock changes. 4Aluminum-vanadium master alloy consisting of 35% aluminum and 64.5% vanadium. 5See Appendix C for resource and reserve definitions and information concerning data sources.
U.S. Geological Survey, Mineral Commodity Summaries, January 2017

184
VERMICULITE
(Data in thousand metric tons unless otherwise noted) Domestic Production and Use: Two companies with mining and processing facilities in South Carolina and Virginia produced vermiculite concentrate and reported production of approximately 100,000 tons. Flakes of raw vermiculite concentrate are micaceous in appearance and contain interlayer water in their structure. When the flakes are heated rapidly at a temperature above 870° C, the water flashes into steam, and the flakes expand into accordionlike particles. This process is called exfoliation, or expansion, and the resulting lightweight material is chemically inert, fire resistant, and odorless. Most of the vermiculite concentrate produced in the United States was shipped to 18 exfoliating plants in 11 States. The end uses for exfoliated vermiculite were estimated to be agriculture/horticulture, 50%; lightweight concrete aggregates (including cement premixes, concrete, and plaster), 10%; insulation, 5%; and other, 35%. Salient Statistics—United States: 2012 2013 2014 2015 2016e Productione, 1 100 100 100 100 100 Imports for consumptione, 2 57 36 43 21 40 Exportse 2 2 3 2 1 Consumption, apparent, concentrate3 160 130 140 120 140 Consumption, reported, exfoliated 59 64 63 65 70 Price, range of value, concentrate, dollars per ton, ex-plant4 115–460 145–525 145–565 140–575 140–575 Employment, numbere 75 65 68 68 70 Net import reliance5 as a percentage of apparent consumption 35 25 30 20 30 Recycling: Insignificant. Import Sources (2012–15): Brazil, 46%; South Africa, 31%; China, 19%; Zimbabwe, 2%; and other, 2%. Tariff: Item Number Normal Trade Relations 12–31–16 Vermiculite, perlite and chlorites, unexpanded 2530.10.0000 Free. Exfoliated vermiculite, expanded clays, foamed slag, and similar expanded materials 6806.20.0000 Free. Depletion Allowance: 14% (Domestic and foreign). Government Stockpile: None. Events, Trends, and Issues: U.S. exports and imports of vermiculite are not collected as a separate category by the U.S. Census Bureau. However, according to an independent industry trade information source, U.S. exports decreased by 45% in the first 8 months of 2016 compared with those of the same period in 2015. U.S. imports, excluding any material from Canada and Mexico, were estimated to be about 40,000 tons in 2016, significantly higher than those of 2015, mostly resulting from significantly increased imports from China and South Africa. Coarse-grade vermiculite remained in short supply, and prices were unchanged in 2016. Prepared by Arnold O. Tanner [(703) 648–4791, [email protected]]

185 VERMICULITE
An Australian company executed an agreement to purchase the East African Namekara vermiculite mine in Uganda. The mine had intermittent production and limited sales of vermiculite during the second half of 2015 through 2016. The Namekara deposit has sufficient resources for more than 50 years of production and is a portion of the larger East African vermiculite project, which has about 55 million tons of inferred resources and is considered to be one of the world’s largest deposits. A company in Turkey continued development of the country’s first vermiculite mine in Sivas in central Turkey. Sales of the vermiculite were to be processed through the sales network of a major company based in France that was a partner in the project. Although the date of full production was not yet determined, first year production is expected to be about 5,000 tons from a total reserve of 7 million tons, of which more than one-half was considered high quality. A company in Russia mined vermiculite in the Murmansk Region of northwest Russia and marketed its vermiculite concentrate and exfoliated vermiculite mostly in Russia, but also in Eastern Europe and Western Europe. A company in Brazil continued to expand production capacity at its vermiculite mine in central Brazil and to develop another deposit near Brasilia with the goal of bringing the company’s total production capacity to 200,000 tons per year. World Mine Production and Reserves: Mine production Reserves6 2015 2016e United Statese, 1 100 100 25,000 Brazil 68 70 6,300 Bulgaria 19 20 NA India 10 10 1,700 Russia 21 20 NA South Africa 158 170 14,000 Zimbabwe 29 10 NA Other countries 5 5 NA World total 410 405 NA World Resources: Marginal reserves of vermiculite in Colorado, Nevada, North Carolina, Texas, and Wyoming are estimated to be 2 million to 3 million tons. Reserves have been reported in Australia, China, Russia, Uganda, and some other countries, but reserves and resource information comes from many sources and, in most cases, it is not clear whether the numbers refer to vermiculite alone or vermiculite plus host rock and overburden. Substitutes: Expanded perlite is a substitute for vermiculite in lightweight concrete and plaster. Other denser but less costly substitutes in these applications are expanded clay, shale, slag, and slate. Alternate materials for loose-fill fireproofing insulation include fiberglass, perlite, and slag wool. In agriculture, substitutes include bark and other plant materials, peat, perlite, sawdust, and synthetic soil conditioners. eEstimated. NA Not available. 1Concentrate sold and used by producers. Data are rounded to one significant digit to avoid disclosing company proprietary data. 2Excludes Canada and Mexico. 3Rounded to two significant digits to avoid disclosing company proprietary data. 4Source: Mining Engineering. 5Defined as imports – exports. 6See Appendix C for resource and reserve definitions and information concerning data sources.
U.S. Geological Survey, Mineral Commodity Summaries, January 2017

186
WOLLASTONITE
(Data in metric tons unless otherwise noted) Domestic Production and Use: Wollastonite was mined by two companies in New York during 2016. U.S. production of wollastonite (sold or used by producers) was withheld to avoid disclosing company proprietary data but was estimated to have decreased from that of 2015. Economically valuable resources of wollastonite typically form as a result of thermal metamorphism of siliceous limestone during regional deformation or chemical alteration of limestone by siliceous hydrothermal fluids along faults or contacts with magmatic intrusions. Deposits of wollastonite have been identified in Arizona, California, Idaho, Nevada, New Mexico, New York, and Utah, but New York is the only State where long-term continuous mining has taken place. The U.S. Geological Survey does not collect consumption statistics for wollastonite, but consumption was estimated to have decreased in 2016 compared to the previous year. Plastics and rubber markets (thermoplastic and thermoset resins and elastomer compounds) were estimated to account for more than 25% of wollastonite sales in the United States, followed by ceramics (frits, sanitaryware, and tile), paint (architectural and industrial paints), metallurgical applications (flux and conditioner), friction products (primarily brake linings), and miscellaneous uses (including adhesives, concrete, glass, and sealants). Globally, ceramics were estimated to represent more than 30% of wollastonite sales, followed by polymers (such as plastics and rubber) and paint. Lesser global uses for wollastonite included miscellaneous construction products, friction materials, metallurgical applications, and paper. In ceramics, wollastonite decreases shrinkage and gas evolution during firing; increases green and fired strength; maintains brightness during firing; permits fast firing; and reduces crazing, cracking, and glaze defects. In metallurgical applications, wollastonite serves as a flux for welding, a source for calcium oxide, a slag conditioner, and protects the surface of molten metal during the continuous casting of steel. As an additive in paint, it improves the durability of the paint film, acts as a pH buffer, improves resistance to weathering, reduces gloss and pigment consumption, and acts as a flatting and suspending agent. In plastics, wollastonite improves tensile and flexural strength, reduces resin consumption, and improves thermal and dimensional stability at elevated temperatures. Surface treatments are used to improve the adhesion between wollastonite and the polymers to which it is added. As a substitute for asbestos in floor tiles, friction products, insulating board and panels, paint, plastics, and roofing products, wollastonite is resistant to chemical attack, stable at high temperatures, and improves flexural and tensile strength. Salient Statistics—United States: The United States was thought to be a net exporter of wollastonite in 2016. Exports were estimated to have decreased compared to those in 2015 and were probably less than 10,000 tons, whereas imports were estimated to have increased and were probably less than 4,000 tons. Comprehensive trade data were not available for wollastonite because it is imported and exported under a generic U.S. Census Bureau Harmonized Tariff Schedule code that includes multiple mineral commodities. Ex-works prices for domestic wollastonite were reported in trade literature to range from approximately $230 to $490 per ton, and free-on-board prices for wollastonite from China, which tends to be minimally refined, ranged from $80 to $105 per ton. Products with finer grain sizes and acicular (highly elongated) particles sold for higher prices. Surface treatment, when necessary, also increased the selling price. Approximately 90 people were employed at wollastonite mines and mills in 2016 (excluding office workers). Recycling: None. Import Sources (2012–15): Comprehensive trade data were not available, but wollastonite was primarily imported from China, Finland, India, and Mexico. Tariff: Item Number Normal Trade Relations 12–31–16 Mineral substances not elsewhere specified or included 2530.90.8050 Free. Depletion Allowance: 10% (Domestic and foreign). Government Stockpile: None. Prepared by Daniel M. Flanagan [(703) 648–7726, [email protected]]

187 WOLLASTONITE
Events, Trends, and Issues: U.S. housing starts in 2016 were 6% higher through August compared to the same time period during 2015, suggesting that sales of wollastonite to domestic construction-related markets, such as adhesives, caulks, cement board, ceramic tile, paints, stucco, and wallboard, might have increased. Trends in other domestic manufacturing sectors that use wollastonite were mixed; production of plastics and rubber and primary iron and steel products declined slightly, whereas output of motor vehicles and parts (which contain wollastonite in friction products and plastic and rubber components) rose by nearly 5%. In Western Europe and Asia, demand for wollastonite likely remained relatively unchanged owing to minimal growth in construction and manufacturing. The leading U.S. producer of wollastonite continued to pursue a potential new mine within the Adirondack Forest Preserve of New York. According to a company representative, the project was in the development stage as of late 2016. Previous estimates suggest that the 81-hectare property contains 1.2 million to 1.5 million tons of wollastonite reserves, sufficient to extend mining operations in the area by an additional 10 years. Records published by the Mine Safety and Health Administration indicated that one domestic wollastonite mine was temporarily idled in September. World Mine Production and Reserves: United States production of wollastonite ranks third globally. Many countries either do not publish wollastonite production or production is reported with a 2- to 3-year lag time. Mine productione Reserves1 2015 2016 United States W W Canada 25,600 6,000 China 450,000 425,000 World reserves of wollastonite exceed 100 million Finland 10,000 10,000 tons. Many deposits, however, have not been India 190,000 185,000 surveyed, precluding accurate reserves estimates. Mexico 257,500 67,000 Other countries 6,000 6,000 World total (rounded) 3720,000 3700,000 World Resources: Reliable estimates of wollastonite resources do not exist for most countries. Large deposits of wollastonite have been identified in China, Finland, India, Mexico, and the United States. Smaller, but significant, deposits have been identified in Canada, Chile, Kenya, Namibia, South Africa, Spain, Sudan, Tajikistan, Turkey, and Uzbekistan. Substitutes: The acicular nature of many wollastonite products allows it to compete with other acicular materials, such as ceramic fiber, glass fiber, steel fiber, and several organic fibers, such as aramid, polyethylene, polypropylene, and polytetrafluoroethylene, in products where improvements in dimensional stability, flexural modulus, and heat deflection are sought. Wollastonite also competes with several nonfibrous minerals or rocks, such as kaolin, mica, and talc, which are added to plastics to increase flexural strength, and such minerals as barite, calcium carbonate, gypsum, and talc, which impart dimensional stability to plastics. In ceramics, wollastonite competes with carbonates, feldspar, lime, and silica as a source of calcium and silica. Its use in ceramics depends on the formulation of the ceramic body and the firing method.
eEstimated. W Withheld to avoid disclosing company proprietary data. 1See Appendix C for resource and reserve definitions and information concerning data sources. 2Reported figure. 3Excludes U.S. production.
U.S. Geological Survey, Mineral Commodity Summaries, January 2017

188
YTTRIUM1
[Data in metric tons of yttrium oxide (Y2O3) equivalent content unless otherwise noted] Domestic Production and Use: Rare earths were not mined domestically in 2016. Bastnaesite, a rare-earth fluorocarbonate mineral, was previously mined as a primary product at Mountain Pass, CA, which was put on care and maintenance in the fourth quarter of 2015. Yttrium was estimated to represent about 0.12% of the rare-earth elements in the Mountain Pass bastnaesite ore. The leading end uses of yttrium were in ceramics, metallurgy, and phosphors. In ceramic applications, yttrium compounds were used in abrasives, bearings and seals, high-temperature refractories for continuous-casting nozzles, jet-engine coatings, oxygen sensors in automobile engines, and wear-resistant and corrosion-resistant cutting tools. In metallurgical applications, yttrium was used as a grain-refining additive and as a deoxidizer. Yttrium was used in heating-element alloys, high-temperature superconductors, and superalloys. In electronics, yttrium-iron garnets were components in microwave radar to control high-frequency signals. Yttrium was an important component in yttrium-aluminum-garnet laser crystals used in dental and medical surgical procedures, digital communications, distance and temperature sensing, industrial cutting and welding, nonlinear optics, photochemistry, and photoluminescence. Yttrium was used in phosphor compounds for flat-panel displays and various lighting applications. Salient Statistics—United States: 2012 2013 2014 2015 2016e Production, mine2 NA NA NA NA — Imports for consumption: Yttrium, alloys, compounds, and metale, 3 160 200 200 360 200 Exports, in ore and concentrate NA NA NA NA NA Consumption, estimated4 160 200 200 360 200 Price,e dollars: Yttrium oxide, per kilogram, minimum 99.999 purity5 86–91 23–27 15–17 7–8 4 Yttrium metal, per kilogram, minimum 99.9% purity5 141–151 60–70 55–65 45–51 34–36 Net import reliancee, 2, 6 as a percentage of apparent consumption >95 >95 >95 >95 100 Recycling: Insignificant. Import Sources (2012–15): Yttrium compounds: China, 67%; Estonia, 13%; Japan, 8%; Germany, 4%; and other, 8%. Nearly all imports of yttrium metal and compounds are derived from mineral concentrates produced in China. Import sources do not include yttrium contained in value-added intermediates and finished products. Tariff: Item Number Normal Trade Relations 12–31–16 Rare-earth metals, scandium and yttrium, whether or not intermixed or interalloyed 2805.30.0000 5.0% ad val. Mixtures of rare-earth oxides or of rare-earth chlorides 2846.90.2000 Free. Yttrium-bearing materials and compounds containing by weight >19% to <85% Y2O3 2846.90.4000 Free. Other rare-earth compounds, including yttrium and other compounds 2846.90.8000 3.7% ad val. Depletion Allowance: Monazite, thorium content, 22% (Domestic), 14% (Foreign); yttrium, rare-earth content, 14% (Domestic and foreign); and xenotime, 14% (Domestic and foreign). Government Stockpile: In FY 2016, the Defense Logistics Agency (DLA) acquired 8.8 tons of yttrium oxide.
Stockpile Status—9–30–167
Disposal Plan Disposals Material Inventory FY 2016 FY 2016 Yttrium oxide 8.8 — — Prepared by Joseph Gambogi [(703) 648–7718, [email protected]]

189 YTTRIUM
Events, Trends, and Issues: China produced most of the world’s supply of yttrium, from its weathered clay ion-adsorption ore deposits in the southern Provinces—primarily Fujian, Guangdong, and Jiangxi—and from a lesser number of deposits in Guangxi and Hunan Provinces. Processing was primarily at facilities in Guangdong, Jiangsu, and Jiangxi Provinces. In 2016, global consumption of yttrium oxide was estimated to be 3,000 to 6,000 tons. Globally, yttrium was mainly consumed in the form of high-purity oxide compounds for phosphors. Lesser amounts were consumed in ceramics, electronic devices, lasers, and metallurgical applications. Owing to shrinking demand in some markets and excess supply, prices for yttrium metal and oxide continued to decrease in 2016, reaching historic lows. According to industry reports, increasing popularity of light-emitting-diode lighting over traditional fluorescent lighting has reduced the consumption of yttrium-based phosphors. According to China’s preliminary export statistics, yttrium oxide exports increased in 2016. During the first 8 months of 2016, China exported 1,1 70 tons of yttrium oxide, primarily to Japan (58%), the United States (14%), and Italy (10%). China’s other year-to-date exports of yttrium included 10 kilograms of yttrium chloride, 1.05 tons of yttrium fluoride, 16.7 tons of unspecified yttrium compounds, and 20.4 tons of yttrium metal. China continued efforts to manage its rare-earth industry through industry consolidations, crackdowns on illegal production, and stockpiling. The DLA announced the Fiscal Year 2017 National Defense Stockpile Annual Materials Plan. The plan included a maximum acquisition of 10 tons of yttrium oxide. In fiscal year 2016, the DLA acquired about 9 tons of yttrium oxide and planned to acquire additional material. The U.S. Department of Energy was seeking information from industry and other stakeholders on yttrium and other materials used in energy technologies. World Mine Production and Reserves:8 World production of yttrium was almost entirely from China. In 2016, world production was estimated to be 5,000 to 7,000 tons. Programs to stem the undocumented production of rare earths in China were ongoing. Reserves of yttrium are associated with those of rare earths. Global reserves of yttrium oxide were estimated to be more than 500,000 tons. The leading countries for these reserves included Australia, Brazil, China, India, and the United States. World Resources: The world’s resources of yttrium are probably very large. Yttrium is associated with most rare-earth deposits. It occurs in various minerals in differing concentrations and occurs in a wide variety of geologic environments and deposits, including alkaline granites and other intrusives, carbonatites, hydrothermal deposits, laterites, placers, and vein-type deposits. Although reserves may be sufficient to satisfy near-term demand at current rates of production, economics, environmental issues, and permitting and trade restrictions could affect the mining or availability of many of the rare-earth elements, including yttrium. Large resources of yttrium in monazite and xenotime are available worldwide in placer deposits, carbonatites, uranium ores, and weathered clay deposits (ion-adsorption ore). Additional resources of yttrium occur in apatite-magnetite-bearing rocks, deposits of niobium-tantalum minerals, non-placer monazite-bearing deposits, sedimentary phosphate deposits, and uranium ores. Substitutes: Substitutes for yttrium are available for some applications but generally are much less effective. In most uses, especially in electronics, lasers, and phosphors, yttrium is generally not subject to substitution by other elements. As a stabilizer in zirconia ceramics, yttrium oxide may be substituted with calcium oxide or magnesium oxide, but the substitutes generally impart lower toughness. eEstimated. NA Not available. — Zero. 1See also Rare Earths; trade data for yttrium are included in the data shown for rare earths. 2Includes yttrium contained in rare-earth ores and mineral concentrates. 3Based on data from the U.S. Census Bureau and PIERS, JOC Group Inc. 4Essentially, all yttrium consumed domestically was imported or refined from imported materials. 5Free on board China. Source: Argus Media group-Metal Pages, London, United Kingdom. 6Defined as imports – exports. Insufficient data were available to determine exports and were excluded from the calculation. 7See Appendix B for definitions. 8See Appendix C for resource and reserve definitions and information concerning data sources.
U.S. Geological Survey, Mineral Commodity Summaries, January 2017

190
ZEOLITES (NATURAL)
(Data in metric tons unless otherwise noted) Domestic Production and Use: In 2016, seven companies in the United States operated 10 zeolite mines and produced an estimated 80,000 tons of natural zeolites, a 7% increase from that of 2015. Two other companies might have also mined zeolites as part of development projects, but specific information on the status of these operations was not available. Chabazite was mined in Arizona, and clinoptilolite was mined in California, Idaho, New Mexico, Oregon, and Texas. New Mexico was estimated to be the leading natural zeolite-producing State, followed by Idaho, California, Texas, Oregon, and Arizona. The top three U.S. companies accounted for approximately 90% of total domestic production. An estimated 78,900 tons of natural zeolites were consumed in the United States during 2016. Domestic uses were, in decreasing order by tonnage, animal feed, water purification, odor control, unclassified end uses, pet litter, fungicide or pesticide carrier, wastewater treatment, gas absorbent (and air filtration), oil and grease absorbent, fertilizer carrier, synthetic turf, soil amendment, and desiccant. Animal feed, water purification, odor control, pet litter, and fungicide or pesticide carrier applications accounted for 80% of the domestic sales tonnage. Salient Statistics—United States: 2012 2013 2014 2015 2016e Production, mine 74,000 69,500 62,800 75,100 80,000 Sales, mill 70,500 68,300 62,500 73,200 79,000 Imports for consumptione 5 5 25 50 25 Exportse 750 200 200 200 100 Consumption, apparente, 1 69,800 68,100 62,300 73,100 78,900 Price, range of value, dollars per metric ton2 50–800 50–800 110–440 110–950 110–950 Employment, mine and mille, 3 110 105 95 100 110 Net import reliance4 as a percentage of estimated consumption E E E E E Recycling: Zeolites used for desiccation, gas absorbance, wastewater cleanup, and water purification may be reused after reprocessing of the spent zeolites. Information about the quantity of recycled natural zeolites was unavailable. Import Sources (2012–15): Comprehensive trade data were not available for natural zeolite minerals because they were imported and exported under a generic U.S. Census Bureau Harmonized Tariff Schedule code that includes multiple mineral commodities. Nearly all imports and exports were synthetic zeolites. Tariff: Item Number Normal Trade Relations 12–31–16 Mineral substances not elsewhere specified or included 2530.90.8050 Free. Depletion Allowance: 14% (Domestic and foreign). Government Stockpile: None. Events, Trends, and Issues: During the past 20 years, the animal feed industry has seen the greatest increase in sales of natural zeolites. Sales for odor control, wastewater treatment, and water purification applications have also increased in the past 10 years, although expansion of these markets has not been as great as with animal feed. Sales for pet litter declined during the past 20 years as a result of competition from other products. In 2016, the Wyoming State Geological Survey released a report concluding that Wyoming contains minable resources of natural zeolites. The agency confirmed previously explored occurrences, identified additional deposits, and published geologic descriptions and geochemical data for the outcrops studied during the investigation. Globally, the only natural zeolites producer in New Zealand completed construction of a processing plant that will allow the company to increase production to at least 100,000 tons per year. In July, a Canadian company began to process and sell zeolites from a deposit in British Columbia; the mining permit allows for the extraction of 50,000 tons of zeolites per year and expansion of the quarry as needed. Prepared by Daniel M. Flanagan [(703) 648–7726, [email protected]]

191 ZEOLITES (NATURAL)
World Mine Production and Reserves: Most countries either do not report production of natural zeolites or production is reported with a 2- to 3-year lag time. Countries that mine large tonnages of zeolites typically use them in low-value, high-volume construction applications, such as dimension stone, lightweight aggregate, and pozzolanic cement. As a result, production data for some countries do not accurately indicate the quantities of natural zeolites used in the high-value applications that are reflected in the domestic production data. World reserves of natural zeolites have not been estimated. Deposits occur in many countries, but companies rarely, if ever, publish reserves data. Further complicating estimates of reserves is the fact that much of the reported world production includes altered volcanic tuffs with low to moderate concentrations of zeolites that are typically used in high-volume construction applications. Some deposits should, therefore, be excluded from reserves estimates because it is the rock itself and not its zeolite content that makes the deposit valuable. Mine productione Reserves5 2015 2016 United States 675,100 80,000 China 2,000,000 2,000,000 Cuba 43,000 51,000 World reserves are not Jordan 13,000 12,000 determined but are estimated Korea, Republic of 205,000 205,000 to be large. New Zealand 665,000 80,000 Turkey 70,000 60,000 Other countries 350,000 350,000 World total (rounded) 2,800,000 2,800,000 World Resources: World resources have not been estimated for natural zeolites. An estimated 120 million tons of chabazite, clinoptilolite, erionite, mordenite, and phillipsite is present in near-surface deposits in the Basin and Range province in the United States. Substitutes: For pet litter, zeolites compete with other mineral-based litters, such as those manufactured using bentonite, diatomite, fuller’s earth, and sepiolite; organic litters made from shredded corn stalks and paper, straw, and wood shavings; and litters made using silica gel. Diatomite, perlite, pumice, vermiculite, and volcanic tuff compete with natural zeolite as lightweight aggregate. Zeolite desiccants compete against such products as magnesium perchlorate and silica gel. Zeolites compete with bentonite, gypsum, montmorillonite, peat, perlite, silica sand, and vermiculite in various soil amendment applications. Activated carbon, diatomite, or silica sand may substitute for zeolites in water-purification applications. As an oil absorbent, zeolites compete mainly with bentonite, diatomite, fuller’s earth, sepiolite, and a variety of polymer and natural organic products. In animal feed, zeolites compete with bentonite, diatomite, fuller’s earth, kaolin, silica, and talc as anticaking and flow-control agents. eEstimated. E Net exporter. 1Defined as mill sales + imports – exports. 2Range of ex-works unit values for individual zeolite operations, based on data reported by U.S. producers. Unit values for most zeolite operations have varied from $110 to $220 per ton for the past 5 years. Prices vary with the percentage of zeolite present in the product, the chemical and physical properties of the zeolite mineral(s), particle size, surface modification and (or) activation, and end use. 3Excludes office workers and development projects. Estimate based on data from the Mine Safety and Health Administration. 4Defined as imports – exports. 5See Appendix C for resource and reserve definitions and information concerning data sources. 6Reported figure.
U.S. Geological Survey, Mineral Commodity Summaries, January 2017

192
ZINC
(Data in thousand metric tons of zinc content unless otherwise noted) Domestic Production and Use: The value of zinc mined in 2016, based on zinc contained in concentrate, was about $1.70 billion. Zinc was mined in 5 States at 12 mines operated by 4 companies. Three smelter facilities, one primary and two secondary, operated by two companies, produced commercial-grade zinc metal. Of the total reported zinc consumed, most was used in galvanizing, followed by brass and bronze, zinc-based alloys, and other uses. Salient Statistics—United States: 2012 2013 2014 2015 2016e
Production: Zinc in ore and concentrate 738 784 832 825 780 Refined zinc1 261 233 180 172 140 Imports for consumption: Zinc in ore and concentrate 6 3 (2) (2) (2) Refined zinc 655 713 805 771 710 Exports: Zinc in ore and concentrate 591 669 644 709 500 Refined zinc 14 12 20 13 70 Shipments from Government stockpile — — — — — Consumption, apparent, refined zinc3 902 935 965 931 780 Price, average, cents per pound: North American4 95.8 95.6 107.1 95.5 99.0 London Metal Exchange (LME), cash 88.3 86.6 98.1 87.6 92.0 Reported producer and consumer stocks, refined zinc, yearend 74 74 88 91 80 Employment: Mine and mill, number5 2,310 2,560 2,620 2,680 2,320 Smelter, primary, number 252 257 259 250 250 Net import reliance6 as a percentage of apparent consumption (refined zinc) 71 75 81 81 82 Recycling: In 2016, about 25% (35,000 tons) of the refined zinc produced in the United States was recovered from secondary materials at both primary and secondary smelters. Secondary materials included galvanizing residues and crude zinc oxide recovered from electric arc furnace dust. Import Sources (2012–15): Ore and concentrate: Canada, 69%; Mexico, 31%. Refined metal: Canada, 63%; Mexico, 13%; Australia, 10%; Peru, 7%; and other, 7%. Waste and scrap: Canada, 75%; Mexico, 23%; and other, 2%. Combined total: Canada, 64%; Mexico, 14%; Australia, 9%; Peru, 7%; and other, 6%. Tariff: Item Number Normal Trade Relations 12–31–16 Zinc ores and concentrates, Zn content 2608.00.0030 Free. Zinc oxide; zinc peroxide 2817.00.0000 Free. Unwrought zinc, not alloyed: Containing 99.99% or more zinc 7901.11.0000 1.5% ad val. Containing less than 99.99% zinc: Casting-grade 7901.12.1000 3% ad val. Other 7901.12.5000 1.5% ad val. Zinc alloys 7901.20.0000 3% ad val. Depletion Allowance: 22% (Domestic), 14% (Foreign). Government Stockpile:
Stockpile Status—9–30–167
Disposal Plan Disposals Material Inventory FY 2016 FY 2016 Zinc 7 7 — Prepared by Amy C. Tolcin [(703) 648–4940, [email protected]]
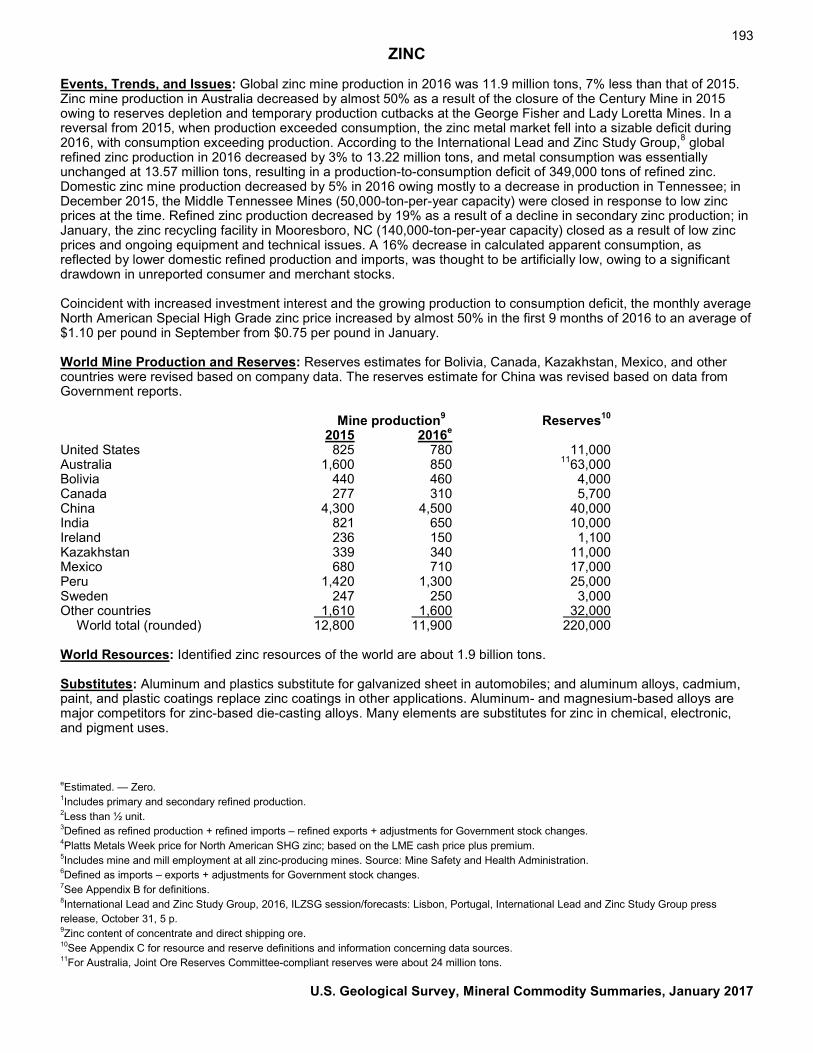
193 ZINC
Events, Trends, and Issues: Global zinc mine production in 2016 was 11.9 million tons, 7% less than that of 2015. Zinc mine production in Australia decreased by almost 50% as a result of the closure of the Century Mine in 2015 owing to reserves depletion and temporary production cutbacks at the George Fisher and Lady Loretta Mines. In a reversal from 2015, when production exceeded consumption, the zinc metal market fell into a sizable deficit during 2016, with consumption exceeding production. According to the International Lead and Zinc Study Group,8 global refined zinc production in 2016 decreased by 3% to 13.22 million tons, and metal consumption was essentially unchanged at 13.57 million tons, resulting in a production-to-consumption deficit of 349,000 tons of refined zinc. Domestic zinc mine production decreased by 5% in 2016 owing mostly to a decrease in production in Tennessee; in December 2015, the Middle Tennessee Mines (50,000-ton-per-year capacity) were closed in response to low zinc prices at the time. Refined zinc production decreased by 19% as a result of a decline in secondary zinc production; in January, the zinc recycling facility in Mooresboro, NC (140,000-ton-per-year capacity) closed as a result of low zinc prices and ongoing equipment and technical issues. A 16% decrease in calculated apparent consumption, as reflected by lower domestic refined production and imports, was thought to be artificially low, owing to a significant drawdown in unreported consumer and merchant stocks. Coincident with increased investment interest and the growing production to consumption deficit, the monthly average North American Special High Grade zinc price increased by almost 50% in the first 9 months of 2016 to an average of $1.10 per pound in September from $0.75 per pound in January. World Mine Production and Reserves: Reserves estimates for Bolivia, Canada, Kazakhstan, Mexico, and other countries were revised based on company data. The reserves estimate for China was revised based on data from Government reports. Mine production9 Reserves10 2015 2016e United States 825 780 11,000 Australia 1,600 850 1163,000 Bolivia 440 460 4,000 Canada 277 310 5,700 China 4,300 4,500 40,000 India 821 650 10,000 Ireland 236 150 1,100 Kazakhstan 339 340 11,000 Mexico 680 710 17,000 Peru 1,420 1,300 25,000 Sweden 247 250 3,000 Other countries 1,610 1,600 32,000 World total (rounded) 12,800 11,900 220,000 World Resources: Identified zinc resources of the world are about 1.9 billion tons. Substitutes: Aluminum and plastics substitute for galvanized sheet in automobiles; and aluminum alloys, cadmium, paint, and plastic coatings replace zinc coatings in other applications. Aluminum- and magnesium-based alloys are major competitors for zinc-based die-casting alloys. Many elements are substitutes for zinc in chemical, electronic, and pigment uses. eEstimated. — Zero. 1Includes primary and secondary refined production. 2Less than ½ unit. 3Defined as refined production + refined imports – refined exports + adjustments for Government stock changes. 4Platts Metals Week price for North American SHG zinc; based on the LME cash price plus premium. 5Includes mine and mill employment at all zinc-producing mines. Source: Mine Safety and Health Administration. 6Defined as imports – exports + adjustments for Government stock changes. 7See Appendix B for definitions. 8International Lead and Zinc Study Group, 2016, ILZSG session/forecasts: Lisbon, Portugal, International Lead and Zinc Study Group press release, October 31, 5 p. 9Zinc content of concentrate and direct shipping ore. 10See Appendix C for resource and reserve definitions and information concerning data sources. 11For Australia, Joint Ore Reserves Committee-compliant reserves were about 24 million tons.
U.S. Geological Survey, Mineral Commodity Summaries, January 2017

194
ZIRCONIUM AND HAFNIUM
(Data in metric tons unless otherwise noted) Domestic Production and Use: In 2016, two firms recovered zircon (zirconium silicate) from surface-mining operations in Florida and Georgia as a coproduct from the mining and processing of titanium and zirconium mineral concentrates. Zirconium metal and hafnium metal were produced from zirconium chemical intermediates by one domestic producer in Oregon and one in Utah. Typically, zirconium and hafnium are contained in zircon at a ratio of about 50 to 1. Zirconium chemicals were produced by the metal producer in Oregon and by at least 10 other companies. Ceramics, foundry sand, opacifiers, and refractories are the leading end uses for zircon. Other end uses of zircon include abrasives, chemicals (predominantly, zirconium oxychloride octohydrate and zirconium basic sulfate as intermediate chemicals), metal alloys, and welding rod coatings. The leading consumers of zirconium metal are the nuclear energy and chemical process industries. The leading use of hafnium metal is in superalloys. Salient Statistics—United States: 2012 2013 2014 2015 2016e Production, zircon (ZrO2 content)1 W W W 250,000 W Imports: Zirconium, ores and concentrates (ZrO2 content) 16,700 8,050 32,800 20,700 32,000 Zirconium, unwrought, powder, and waste and scrap 279 395 843 1,140 1,150 Zirconium, wrought 288 321 257 171 250 Hafnium, unwrought, powder, and waste and scrap 24 10 21 72 190 Exports: Zirconium ores and concentrates (ZrO2 content) 13,000 19,000 5,860 4,080 3,300 Zirconium, unwrought, powder, and waste and scrap 554 600 534 519 360 Zirconium, wrought 1,250 1,140 944 1,020 740 Consumption, zirconium ores and concentrates, apparent (ZrO2 content) W W W 270,000 W Prices: Zircon, dollars per metric ton (gross weight): Domestic3 2,650 1,050 1,050 1,050 1,000 Imported4 2,533 996 1,133 1,061 918 Zirconium, unwrought, import, France, dollars per kilogram5 91 75 59 50 50 Hafnium, unwrought, import, France, dollars per kilogram5 503 578 561 607 6NA Net import reliance7 as a percentage of apparent consumption: Zirconium <10 E <50 >25 >50 Hafnium NA NA NA NA NA Recycling: Companies in Oregon and Utah recycled zirconium from new scrap generated during metal production and fabrication and (or) from post-commercial old scrap. Zircon foundry mold cores and spent or rejected zirconia refractories are often recycled. Hafnium metal recycling was insignificant. Import Sources (2012–15): Zirconium ores and concentrates: South Africa, 70%; Australia, 19%; Senegal, 6%; and other, 5%. Zirconium, unwrought, including powder: China, 65%; Japan, 18%; Germany, 13%; and other, 4%. Hafnium, unwrought: Germany, 40%; France, 29%; United Kingdom, 21%; Australia, 9%; and other, 1%. Tariff: Item Number Normal Trade Relations 12–31–16 Zirconium ores and concentrates 2615.10.0000 Free. Ferrozirconium 7202.99.1000 4.2% ad val. Zirconium, unwrought and zirconium powder 8109.20.0000 4.2% ad val. Zirconium waste and scrap 8109.30.0000 Free. Other zirconium articles 8109.90.0000 3.7% ad val. Hafnium, unwrought, powder, and waste and scrap 8112.92.2000 Free. Depletion Allowance: 22% (Domestic), 14% (Foreign). Government Stockpile: None. Events, Trends, and Issues: Domestic mining and production of zircon concentrates took place at one mine near Starke, FL, and one mine near Nahunta, GA. Production decreased significantly because operations ceased at two mines in Virginia where reserves were exhausted during 2015. The operator of the mine near Nahunta, GA, announced a slowdown of production and curtailment of construction at a second mine site in Brantley County owing Prepared by George M. Bedinger [(703) 648–6183, [email protected]]

195 ZIRCONIUM AND HAFNIUM
to a continued flat demand for zircon concentrates and a decrease in coproduct titanium mineral sands sales. Prices for zircon concentrates decreased slightly during the year. U.S. net import volumes of zirconium ores and zircon concentrates increased by more than 60% as consumers adjusted to the decrease in the domestic production of zircon. At the end of 2016, the mine in Georgia was returning to full production capacity in anticipation of increased demand. Several new off-shore projects experienced their first full year of production. In late 2015, production began at the Fairbreeze Mine in South Africa and at the Keysbrook Mine in Western Australia, where production was projected to be 55,000 tons per year and 29,000 tons per year of zircon, respectively. In New South Wales, Australia, construction of the Dubbo Zirconia Project (DZP) was expected to start in late 2016, and production was expected to begin in 2018. The facility was projected to produce zirconium carbonate (equivalent to 16,300 tons per year of ZrO2) and more than 200 tons per year of hafnium oxide (HfO2), as well as niobium, rare-earth, and tantalum products. Refinement of HfO2 into hafnium metal at DZP would be independent of the nuclear industry where it is produced as a byproduct of zirconium metal refinement. Additional heavy-mineral exploration and mining projects were underway in Australia, Madagascar, Mozambique, Sri Lanka, and Tanzania. World Mine Production and Reserves: World primary hafnium production data were not available. Zirconium reserves for Australia were revised based on data from Geoscience Australia. Reserves for Mozambique were based on company reports. Although hafnium occurs with zirconium in the minerals zircon and baddeleyite, quantitative estimates of hafnium reserves were not available. Zirconium mineral concentrates, mine production Zirconium reserves8 (thousand metric tons, gross weight) (thousand metric tons, ZrO2) 2015 2016e United States 280 W 500 Australia 567 550 48,000 China 140 140 500 India 40 40 3,400 Indonesia 110 110 NA Mozambique 52 55 920 Senegal 45 50 NA South Africa 380 400 14,000 Other countries 105 110 7,200 World total (rounded) 1,520 91,460 75,000 World Resources: Zirconium resources in the United States included about 14 million tons of zircon associated with titanium resources in heavy-mineral sand deposits. Phosphate rock and sand and gravel deposits could potentially yield substantial amounts of zircon as a byproduct. World resources of hafnium are associated with those of zircon and baddeleyite. Quantitative estimates of hafnium resources are not available. Substitutes: Chromite and olivine can be used instead of zircon for some foundry applications. Dolomite and spinel refractories can also substitute for zircon in certain high-temperature applications. Niobium (columbium), stainless steel, and tantalum provide limited substitution in nuclear applications, and titanium and synthetic materials may substitute in some chemical processing plant applications. Silver-cadmium-indium control rods are used in lieu of hafnium at numerous nuclear powerplants. Zirconium can be used interchangeably with hafnium in certain superalloys.
eEstimated. E Net exporter. NA Not available. W Withheld to avoid disclosing company proprietary data. 1Contained ZrO2 content calculated at 65% of gross production. 2Rounded to one significant digit to avoid disclosing company proprietary data. 3Source: Industrial Minerals, yearend average of high-low price range. 4Unit value based on U.S. imports for consumption from Australia and South Africa. 5Unit value based on U.S. imports for consumption from France. 6Increased imports include unspecified hafnium-containing materials, alloys, and misclassified items. 7Defined as imports – exports. 8See Appendix C for resource and reserve definitions and information concerning data sources. 9Excludes U.S. production.
U.S. Geological Survey, Mineral Commodity Summaries, January 2017

196
APPENDIX A
Abbreviations and Units of Measure 1 carat (metric) (diamond) = 200 milligrams 1 flask (fl) = 76 pounds, avoirdupois 1 karat (gold) = one twenty-fourth part 1 kilogram (kg) = 2.2046 pounds, avoirdupois 1 long ton (lt) = 2,240 pounds, avoirdupois 1 long ton unit (ltu) = 1% of 1 long ton or 22.4 pounds, avoirdupois long calcined ton (lct) = excludes water of hydration long dry ton (ldt) = excludes excess free moisture 1 Mcf = 1,000 cubic feet 1 metric ton (t) = 2,204.6 pounds, avoirdupois, or 1,000 kilograms 1 metric ton (t) = 1.1023 short ton 1 metric ton unit (mtu) = 1% of 1 metric ton or 10 kilograms
metric dry ton (mdt) = excludes excess free moisture 1 pound (lb) = 453.6 grams 1 short ton (st) = 2,000 pounds, avoirdupois 1 short ton unit (stu) = 1% of 1 short ton or 20 pounds, avoirdupois short dry ton (sdt) = excludes excess free moisture 1 troy ounce (tr oz) = 1.09714 avoirdupois ounces or 31.103 grams 1 troy pound = 12 troy ounces
APPENDIX B
Definitions of Selected Terms Used in This Report Terms Used for Materials in the National Defense Stockpile and Helium Stockpile Inventory refers to the quantity of mineral materials held in the National Defense Stockpile or in the Federal Helium Reserve. Nonstockpile-grade materials may be included in the table; where significant, the quantities of these stockpiled materials will be specified in the text accompanying the table. Authorized for disposal refers to quantities that are in excess of the stockpile goal for a material, and for which Congress has authorized disposal over the long term at rates designed to maximize revenue but avoid undue disruption to the usual markets and financial loss to the United States. Disposal plan FY 2016 indicates the total amount of a material in the National Defense Stockpile that the U.S. Department of Defense is permitted to sell under the Annual Materials Plan approved by Congress for the fiscal year (FY). FY 2016 is the period October 1, 2015, through September 30, 2016. For mineral commodities that have a disposal plan greater than the inventory, the actual quantity will be limited to the remaining disposal authority or inventory. Note that, unlike the National Defense Stockpile, helium stockpile sales by the Bureau of Land Management under the Helium Privatization Act of 1996 are permitted to exceed disposal plans. Disposals FY 2016 refers to material sold or traded from the stockpile in FY 2016. Depletion Allowance The depletion allowance is a business tax deduction analogous to depreciation, but which applies to an ore reserve rather than to equipment or production facilities. Federal tax law allows this deduction from taxable corporate income, recognizing that an ore deposit is a depletable asset that must eventually be replaced.

197
APPENDIX C—Reserves and Resources Reserves data are dynamic. They may be reduced as ore is mined and (or) the feasibility of extraction diminishes, or more commonly, they may continue to increase as additional deposits (known or recently discovered) are developed, or currently exploited deposits are more thoroughly explored and (or) new technology or economic variables improve their economic feasibility. Reserves may be considered a working inventory of mining companies’ supplies of an economically extractable mineral commodity. As such, the magnitude of that inventory is necessarily limited by many considerations, including cost of drilling, taxes, price of the mineral commodity being mined, and the demand for it. Reserves will be developed to the point of business needs and geologic limitations of economic ore grade and tonnage. For example, in 1970, identified and undiscovered world copper resources were estimated to contain 1.6 billion metric tons of copper, with reserves of about 280 million tons of copper. Since then, more than 500 million tons of copper have been produced worldwide, but world copper reserves in 2016 were estimated to be 720 million tons of copper, more
than double those of 1970, despite the depletion by mining of almost double the original estimated reserves. Future supplies of minerals will come from reserves and other identified resources, currently undiscovered resources in deposits that will be discovered in the future, and material that will be recycled from current in-use stocks of minerals or from minerals in waste disposal sites. Undiscovered deposits of minerals constitute an important consideration in assessing future supplies. USGS reports provide estimates of undiscovered mineral resources using a three-part assessment methodology (Singer and Menzie, 2010). Mineral-resource assessments have been carried out for small parcels of land being evaluated for land reclassification, for the Nation, and for the world. Reference Cited Singer, D.A., and Menzie, W.D., 2010, Quantitative mineral resource
assessments—An integrated approach: Oxford, United Kingdom, Oxford University Press, 219 p.
Part A—Resource and Reserve Classification for Minerals1
INTRODUCTION Through the years, geologists, mining engineers, and others operating in the minerals field have used various terms to describe and classify mineral resources, which as defined herein include energy materials. Some of these terms have gained wide use and acceptance, although they are not always used with precisely the same meaning. The USGS collects information about the quantity and quality of all mineral resources. In 1976, the USGS and the U.S. Bureau of Mines developed a common classification and nomenclature, which was published as USGS Bulletin 1450–A—“Principles of the Mineral Resource Classification System of the U.S. Bureau of Mines and U.S. Geological Survey.” Experience with this resource classification system showed that some changes were necessary in order to make it more workable in practice and more useful in long-term planning. Therefore, representatives of the USGS and the U.S. Bureau of Mines collaborated to revise Bulletin 1450–A. Their work was published in 1980 as USGS Circular 831—“Principles of a Resource and reserve Classification for Minerals.” Long-term public and commercial planning must be based on the probability of discovering new deposits, on developing economic extraction processes for currently unworkable deposits, and on knowing which resources are immediately available. Thus, resources must be continuously reassessed in the light of new geologic knowledge, of progress in science and technology, and of shifts in economic and political conditions. To best serve these planning needs, known resources should be classified from two standpoints: (1) purely geologic or physical/chemical characteristics—such as grade, quality, tonnage, thickness, and depth—of the material in place; and (2) profitability analyses based on costs of extracting and marketing the material in a given
economy at a given time. The former constitutes important objective scientific information of the resource and a relatively unchanging foundation upon which the latter more valuable economic delineation can be based. The revised classification system, designed generally for all mineral materials, is shown graphically in figures 1 and 2; its components and their usage are described in the text. The classification of mineral and energy resources is necessarily arbitrary because definitional criteria do not always coincide with natural boundaries. The system can be used to report the status of mineral and energy-fuel resources for the Nation or for specific areas.1 RESOURCE AND RESERVE DEFINITIONS A dictionary definition of resource, “something in reserve or ready if needed,” has been adapted for mineral and energy resources to comprise all materials, including those only surmised to exist, that have present or anticipated future value. Resource.—A concentration of naturally occurring solid,
liquid, or gaseous material in or on the Earth’s crust in such form and amount that economic extraction of a commodity from the concentration is currently or potentially feasible.
Original Resource.—The amount of a resource before production.
Identified Resources.—Resources whose location, grade, quality, and quantity are known or estimated from specific geologic evidence. Identified resources include economic, marginally economic, and subeconomic components. To reflect varying degrees of geologic certainty, these economic divisions can be subdivided into measured, indicated, and inferred.
1Based on U.S. Geological Survey Circular 831, 1980.

198
Demonstrated.—A term for the sum of measured plus indicated.
Measured.—Quantity is computed from dimensions revealed in outcrops, trenches, workings, or drill holes; grade and (or) quality are computed from the results of detailed sampling. The sites for inspection, sampling, and measurements are spaced so closely and the geologic character is so well defined that size, shape, depth, and mineral content of the resource are well established.
Indicated.—Quantity and grade and (or) quality are computed from information similar to that used for measured resources, but the sites for inspection, sampling, and measurement are farther apart or are otherwise less adequately spaced. The degree of assurance, although lower than that for measured resources, is high enough to assume continuity between points of observation.
Inferred.—Estimates are based on an assumed continuity beyond measured and (or) indicated resources, for which there is geologic evidence. Inferred resources may or may not be supported by samples or measurements.
Reserve Base.—That part of an identified resource that meets specified minimum physical and chemical criteria related to current mining and production practices, including those for grade, quality, thickness, and depth. The reserve base is the in-place demonstrated (measured plus indicated) resource from which reserves are estimated. It may encompass those parts of the resources that have a reasonable potential for becoming economically available within planning horizons beyond those that assume proven technology and current economics. The reserve base includes those resources that are currently economic (reserves), marginally economic (marginal reserves), and some of those that are currently subeconomic (subeconomic resources). The term “geologic reserve” has been applied by others generally to the reserve-base category, but it also may include the inferred-reserve-base category; it is not a part of this classification system.
Inferred Reserve Base.—The in-place part of an identified resource from which inferred reserves are estimated. Quantitative estimates are based largely on knowledge of the geologic character of a deposit and for which there may be no samples or measurements. The estimates are based on an assumed continuity beyond the reserve base, for which there is geologic evidence.
Reserves.—That part of the reserve base which could be economically extracted or produced at the time of determination. The term reserves need not signify that extraction facilities are in place and operative. Reserves include only recoverable materials; thus, terms such as “extractable reserves” and “recoverable reserves” are redundant and are not a part of this classification system.
Marginal Reserves.—That part of the reserve base which, at the time of determination, borders on being economically producible. Its essential characteristic is economic uncertainty. Included are resources that would be producible, given postulated changes in economic or technological factors.
Economic.—This term implies that profitable extraction or production under defined investment assumptions has been established, analytically demonstrated, or assumed with reasonable certainty.
Subeconomic Resources.—The part of identified resources that does not meet the economic criteria of reserves and marginal reserves.
Undiscovered Resources.—Resources, the existence of which are only postulated, comprising deposits that are separate from identified resources. Undiscovered resources may be postulated in deposits of such grade and physical location as to render them economic, marginally economic, or subeconomic. To reflect varying degrees of geologic certainty, undiscovered resources may be divided into two parts, as follows:
Hypothetical Resources.—Undiscovered resources that are similar to known mineral bodies and that may be reasonably expected to exist in the same producing district or region under analogous geologic conditions. If exploration confirms their existence and reveals enough information about their quality, grade, and quantity, they will be reclassified as identified resources.
Speculative Resources.—Undiscovered resources that may occur either in known types of deposits in favorable geologic settings where mineral discoveries have not been made, or in types of deposits as yet unrecognized for their economic potential. If exploration confirms their existence and reveals enough information about their quantity, grade, and quality, they will be reclassified as identified resources.
Restricted Resources/Reserves.—That part of any resource and reserve category that is restricted from extraction by laws or regulations. For example, restricted reserves meet all the requirements of reserves except that they are restricted from extraction by laws or regulations.
Other Occurrences.—Materials that are too low grade or for other reasons are not considered potentially economic, in the same sense as the defined resource, may be recognized and their magnitude estimated, but they are not classified as resources. A separate category, labeled other occurrences, is included in figures 1 and 2. In figure 1, the boundary between subeconomic and other occurrences is limited by the concept of current or potential feasibility of economic production, which is required by the definition of a resource. The boundary is obviously uncertain, but limits may be specified in terms of grade, quality, thickness, depth, percent extractable, or other economic-feasibility variables.
Cumulative Production.—The amount of past cumulative production is not, by definition, a part of the resource. Nevertheless, a knowledge of what has been produced is important in order to understand current resources, in terms of both the amount of past production and the amount of residual or remaining in-place resource. A separate space for cumulative production is shown in figures 1 and 2. Residual material left in the ground during current or future extraction should be recorded in the resource category appropriate to its economic-recovery potential.

Figure 1.—Major Elements of Mineral-Resource Classification, Excluding Reserve Base and Inferred Reserve Base
Cumulative Production IDENTIFIED RESOURCES UNDISCOVERED RESOURCES
Demonstrated Measured Indicated Inferred
Probability Range (or) Speculative Hypothetical
SUBECONOMIC
MARGINALLY ECONOMIC
ECONOMIC Reserves
Marginal Reserves
Demonstrated Subeconomic Resources
Inferred Reserves
Inferred Marginal Reserves
Inferred Subeconomic
Resources
Other Occurrences Includes nonconventional and low-grade materials
Figure 2.—Reserve Base and Inferred Reserve Base Classification Categories
Cumulative Production IDENTIFIED RESOURCES UNDISCOVERED RESOURCES
Demonstrated Measured Indicated Inferred
Probability Range (or) Speculative Hypothetical
SUBECONOMIC
MARGINALLY ECONOMIC
ECONOMIC
Reserve Base
Inferred Reserve
Base
Other Occurrences Includes nonconventional and low-grade materials
199

200
Part B—Sources of Reserves Data National information on reserves for most mineral commodities found in this report, including those for the United States, is derived from a variety of sources. The ideal source of such information would be comprehensive evaluations that apply the same criteria to deposits in different geographic areas and report the results by country. In the absence of such evaluations, national reserves estimates compiled by countries for selected mineral commodities are a primary source of national reserves information. Lacking national assessment information by governments, sources such as academic articles, company reports, presentations by company representatives, and trade journal articles, or a combination of these, serve as the basis for national information on reserves reported in the mineral commodity sections of this publication. A national estimate may be assembled from the following: historically reported reserves information carried for years without alteration because no new information is available, historically reported reserves reduced by the amount of historical production, and company-reported reserves. International minerals availability studies conducted by the U.S. Bureau of Mines before 1996 and estimates of identified resources by an international collaborative effort (the International Strategic Minerals Inventory) are the bases for some reserves estimates. The USGS collects information about the quantity and quality of mineral resources but does not directly measure reserves, and companies or governments do not directly report reserves to the USGS. Reassessment of reserves is a continuing process, and the intensity of this process differs for mineral commodities, countries, and time period. Some countries have specific definitions for reserves data, and reserves for each country are assessed separately, based on reported data and definitions. An attempt is made to make reserves consistent among countries for a mineral commodity and its byproducts. For example, the Australasian Joint Ore Reserves Committee (JORC) established the Australasian Code for Reporting of Exploration Results, Mineral Resources and Ore Reserves (the JORC Code) that sets out minimum standards, recommendations, and guidelines for public reporting in Australasia of exploration results, mineral resources, and ore reserves. Companies listed on the Australian Securities Exchange and the New Zealand Stock Exchange are required to report publicly on ore reserves and mineral resources under their control, using the JORC Code (http://www.jorc.org/). Data reported for individual deposits by mining companies are compiled in Geoscience Australia’s national mineral resources database and used in the preparation of the annual national assessments of Australia’s mineral resources. Because of its specific use in the JORC Code, the term “reserves” is not used in the national inventory, where the highest category is “Economic Demonstrated Resources” (EDR). In essence, EDR combines the JORC Code categories
proved reserves and probable reserves, plus measured resources and indicated resources. This is considered to provide a reasonable and objective estimate of what is likely to be available for mining in the long term. Accessible Economic Demonstrated Resources represent the resources within the EDR category that are accessible for mining. Reserves for Australia in Mineral Commodity Summaries 2017 are Accessible EDR. For more information, see Australia’s Identified Mineral Resources 2015 (https://data.gov.au/dataset/australias-identified-mineral-resources-2015). In Canada, the Canadian Institute of Mining, Metallurgy and Petroleum (CIM) provides definition standards for the classification of mineral resources and mineral reserves estimates into various categories. The category to which a resource or reserves estimate is assigned depends on the level of confidence in the geologic information available on the mineral deposit, the quality and quantity of data available on the deposit, the level of detail of the technical and economic information that has been generated about the deposit, and the interpretation of the data and information. For more information on the CIM definition standards, see http://web.cim.org/standards/MenuPage.cfm?sections=177&menu=178. Russian reserves for most minerals, which had been withheld, have been released with increasing frequency within the past few years and can appear in a number of sources, although no systematic list of Russian reserves is published. Russian reserves data for various minerals appear at times in journal articles, such as those in the journal Mineral’nye Resursy Rossii (Mineral Resources of Russia), which is published by the Russian Ministry of Natural Resources. Russian reserves data are often published according to the Soviet reserves classification system, which is still used in many countries of the former Soviet Union, but also at times published according to the JORC system based on analyses made by Western firms. It is sometimes not clear if the reserves are being reported in ore or mineral content. It is also in many cases not clear which definition of reserves is being used, as the system inherited from the former Soviet Union has a number of ways in which the term “reserves” is defined, and these definitions qualify the percentage of reserves that are included. For example, the Soviet reserves classification system, besides the categories A, B, C1, and C2, which represent progressively detailed knowledge of a mineral deposit based on exploration data, has other subcategories cross imposed upon the system. Under the broad category reserves (zapasy), there are subcategories that include balance reserves (economic reserves or balansovye zapasy) and outside the balance reserves (uneconomic reserves or zabalansovye zapasy), as well as categories that include explored, industrial, and proven reserves, and the reserves totals can vary significantly, depending on the specific definition of reserves being reported.

201
APPENDIX D
Country Specialists Directory
Minerals information country specialists at the U.S. Geological Survey collect and analyze information on the mineral industries of more than 170 nations throughout the world. The specialists are available to answer minerals-related questions concerning individual countries. Africa and the Middle East Algeria Mowafa Taib Angola James J. Barry Bahrain Loyd M. Trimmer III Benin Alberto A. Perez Botswana Thomas R. Yager Burkina Faso Alberto A. Perez Burundi Thomas R. Yager Cameroon James J. Barry Cabo Verde Alberto A. Perez Central African Republic James J.Barry Chad Loyd M. Trimmer III Comoros James J. Barry Congo (Brazzaville) James J. Barry Congo (Kinshasa) Thomas R. Yager Côte d’Ivoire Alberto A. Perez Djibouti Thomas R. Yager Egypt Mowafa Taib Equatorial Guinea James J. Barry Eritrea Thomas R. Yager Ethiopia Thomas R. Yager Gabon James J. Barry The Gambia Alberto A. Perez Ghana Omayra Bermúdez-Lugo Guinea Alberto A. Perez Guinea-Bissau Alberto A. Perez Iran Loyd M. Trimmer III Iraq Loyd M. Trimmer III Israel Loyd M. Trimmer III Jordan Mowafa Taib Kenya Thomas R. Yager Kuwait Loyd M. Trimmer III Lebanon Mowafa Taib Lesotho James J. Barry Liberia Loyd M. Trimmer III Libya Mowafa Taib Madagascar Thomas R. Yager Malawi Thomas R. Yager Mali Philip Szczesniak Mauritania Mowafa Taib Mauritius James J. Barry Morocco & Western Sahara Mowafa Taib Mozambique Thomas R. Yager Namibia James J. Barry Niger Philip Szczesniak Nigeria Thomas R. Yager Oman Loyd M. Trimmer III Qatar Loyd M. Trimmer III Reunion James J. Barry Rwanda Thomas R. Yager São Tomé & Principe Alberto A. Perez Saudi Arabia Mowafa Taib Senegal Alberto A. Perez Seychelles James J. Barry Sierra Leone Loyd M. Trimmer III
Somalia Loyd M. Trimmer III South Africa Thomas R. Yager South Sudan Mowafa Taib Sudan Mowafa Taib Swaziland James J. Barry Syria Mowafa Taib Tanzania Thomas R. Yager Togo Alberto A. Perez Tunisia Mowafa Taib Uganda Thomas R. Yager United Arab Emirates Loyd M. Trimmer III Yemen Mowafa Taib Zambia James J. Barry Zimbabwe James J. Barry Asia and the Pacific Afghanistan Karine M. Renaud Australia Spencer D. Buteyn Bangladesh Yolanda Fong-Sam Bhutan Yolanda Fong-Sam Brunei Spencer D. Buteyn Burma (Myanmar) Yolanda Fong-Sam Cambodia Yolanda Fong-Sam China Sean Xun East Timor Meralis Plaza-Toledo Fiji Meralis Plaza-Toledo India Karine M. Renaud Indonesia Meralis Plaza-Toledo Japan Spencer D. Buteyn Korea, North Spencer D. Buteyn Korea, Republic of Spencer D. Buteyn Laos Yolanda Fong-Sam Malaysia Spencer D. Buteyn Mongolia Meralis Plaza-Toledo Nauru Spencer D. Buteyn Nepal Yolanda Fong-Sam New Caledonia Meralis Plaza-Toledo New Zealand Spencer D. Buteyn Pakistan Karine M. Renaud Papua New Guinea Meralis Plaza-Toledo Philippines Yolanda Fong-Sam Singapore Spencer D. Buteyn Solomon Islands Karine M. Renaud Sri Lanka Karine M. Renaud Taiwan Spencer D. Buteyn Thailand Yolanda Fong-Sam Vietnam Yolanda Fong-Sam Europe and Central Eurasia Albania Sinan Hastorun Armenia Elena Safirova Austria Sinan Hastorun Azerbaijan Elena Safirova Belarus Elena Safirova

202
Europe and Central Eurasia—continued Belgium Sinan Hastorun Bosnia and Herzegovina John R. Matzko Bulgaria Karine M. Renaud Croatia John R. Matzko Cyprus Sinan Hastorun Czech Republic John R. Matzko Denmark, Faroe Islands, and Greenland Meralis Plaza-Toledo Estonia John R. Matzko Finland Alberto A. Perez France Alberto A. Perez Georgia Elena Safirova Germany Alberto A. Perez Greece Sinan Hastorun Hungary Sinan Hastorun Iceland Meralis Plaza-Toledo Ireland Yolanda Fong-Sam Italy Elena Safirova Kazakhstan Elena Safirova Kosovo Sinan Hastorun Kyrgyzstan Karine M. Renaud Latvia John R. Matzko Lithuania John R. Matzko Luxembourg Meralis Plaza-Toledo Macedonia John R. Matzko Malta Sinan Hastorun Moldova Elena Safirova Montenegro Sinan Hastorun Netherlands Yolanda Fong-Sam Norway Meralis Plaza-Toledo Poland John R. Matzko Portugal John R. Matzko Romania John R. Matzko Russia Elena Safirova Serbia Karine M. Renaud Slovakia John R. Matzko Slovenia John R. Matzko Spain Meralis Plaza-Toledo Sweden Alberto A. Perez Switzerland Sinan Hastorun
Tajikistan Karine M. Renaud Turkey Sinan Hastorun Turkmenistan Karine M. Renaud Ukraine Elena Safirova United Kingdom John R. Matzko Uzbekistan Elena Safirova North America, Central America, and the Caribbean Aruba Yadira Soto-Viruet Belize Jesse J. Inestroza Bermuda Yadira Soto-Viruet Canada James J. Barry Costa Rica Jesse J. Inestroza Cuba Yadira Soto-Viruet Dominican Republic Yadira Soto-Viruet El Salvador Jesse J. Inestroza Guatemala Jesse J. Inestroza Haiti Yadira Soto-Viruet Honduras Jesse J. Inestroza Jamaica Yadira Soto-Viruet Mexico Alberto A. Perez Nicaragua Jesse J. Inestroza Panama Jesse J. Inestroza Trinidad and Tobago Yadira Soto-Viruet South America Argentina Yadira Soto-Viruet Bolivia Philip Szczesniak Brazil Philip Szczesniak Chile Jesse J. Inestroza Colombia Jesse J. Inestroza Ecuador Jesse J. Inestroza French Guiana Philip Szczesniak Guyana Philip Szczesniak Paraguay Yadira Soto-Viruet Peru Yadira Soto-Viruet Suriname Philip Szczesniak Uruguay Yadira Soto-Viruet Venezuela Philip Szczesniak
Country specialist Telephone Email James J. Barry (703) 648–7752 [email protected] Omayra Bermúdez-Lugo (703) 648–4946 [email protected] Spencer D. Buteyn (703) 648–7738 [email protected] Yolanda Fong-Sam (703) 648–7756 [email protected] Sinan Hastorun (703) 648–7744 [email protected] Jesse J. Inestroza (703) 648–7779 [email protected] John R. Matzko (703) 648–6738 [email protected] Alberto A. Perez (703) 648–7749 [email protected] Meralis Plaza-Toledo (703) 648–7759 [email protected] Karine M. Renaud (703) 648–7748 [email protected] Elena Safirova (703) 648–7731 [email protected] Yadira Soto-Viruet (703) 648–4957 [email protected] Philip Szczesniak (703) 648–7728 [email protected] Mowafa Taib (703) 648–4986 [email protected] Loyd M. Trimmer III (703) 648–4983 [email protected] Sean Xun (703) 648–7746 [email protected] Thomas R. Yager (703) 648–7739 [email protected]