millennium development goals (mdg) acceleration ... - youth...millennium development goals (mdg)...
TRANSCRIPT
Millennium Development Goals (MDG) Acceleration Framework:
YOUTH EMPLOYMENT IN BHUTAN
December 2013

Table of contents
Foreword 1
Acknowledgements 3
List of Abbreviations 4
CHAPTER 1: Introduction 6
1. 1. The MDG Acceleration Framework 7
CHAPTER 2: Unemployment in Bhutan 9
2. 1. Status and Trends: Unemployment Among Youth Is a Critical Concern 9
2. 1. 1. Urban unemployment levels are high 11
2. 1. 2. Underemployment in Bhutan 13
2. 1. 3. Section highlights 15
2. 2. Labour Supply Factors 15
2. 2. 1. Demography: Expected increase in the working-age population 15
2. 2. 2. Migration and labour mobility 16
2. 2. 3. High and increasing labour force participation 17
2. 2. 4. Limitations in general and non-formal education 18
2. 2. 5. Quality and skills mismatch for a changing economy in a dynamic region 22
2. 2. 6. Public policy effects on labour supply 23
2. 2. 7. Section highlights 24
2. 3. Labour Demand Factors 24
2. 3. 1. High but fluctuating economic growth influences labour demand 24
2. 3. 2. Changing structure of Bhutan’s economy 25
2. 3. 3. The relatively capital-intensive nature of growth 26
2. 3. 4. Changing skills requirements in times of economic transition 26
2. 3. 5. Exploring opportunities despite a narrow economic base 27
2. 3. 6. Little attention to opportunities in agriculture 27
2. 3. 7. Limited leveraging of employment potential in travel and tourism 28
2. 3. 8. Local employment low in the energy sector 29
2. 3. 9. Low but growing labour demand in the private sector vis-à-vis
the public sector 30
2. 3. 10. Section highlights 32
CHAPTER 3: Strategic Interventions 33
3. 1. Intervention 1: Enhance the education and training system in a way
that is cognizant of demands in the job market 33
3. 2. Intervention 2: Accelerate CSMI/MSME and private sector
development for job creation, especially for women and youth
employment 35
CHAPTER 4: Bottleneck Analysis 39
4.1 Bottlenecks to Intervention 1 40
4.2 Bottlenecks to Intervention 2 42
CHAPTER 5: Accelerating MDG Progress: Identifying Solutions 46
5.1 Solutions to Bottlenecks to Intervention 1 46
5.2 Solutions to Bottlenecks to Interventions 2 48
CHAPTER 6: MDG Acceleration Plan: Building a Compact 54
ANNEX 60
A.1 Data Sources 60
A.2: List of Workshops and Persons Consulted 60
References 67
1
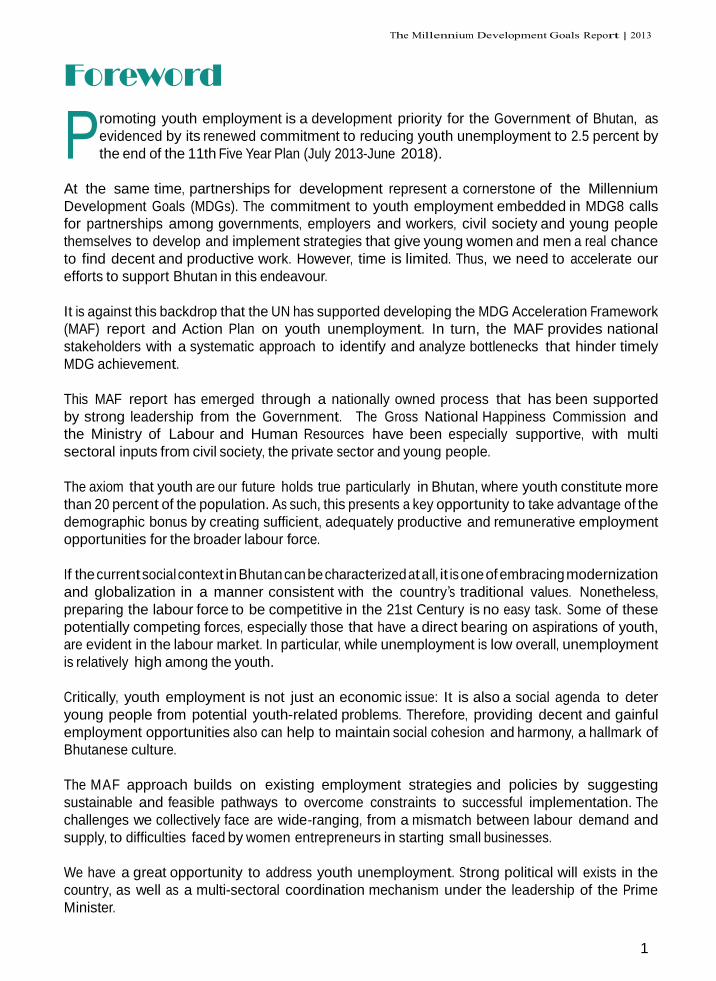
Foreword
romoting youth employment is a development priority for the Government of Bhutan, as
evidenced by its renewed commitment to reducing youth unemployment to 2.5 percent by
the end of the 11th Five Year Plan (July 2013-June 2018).
At the same time, partnerships for development represent a cornerstone of the Millennium
Development Goals (MDGs). The commitment to youth employment embedded in MDG8 calls
for partnerships among governments, employers and workers, civil society and young people
themselves to develop and implement strategies that give young women and men a real chance
to find decent and productive work. However, time is limited. Thus, we need to accelerate our
efforts to support Bhutan in this endeavour.
It is against this backdrop that the UN has supported developing the MDG Acceleration Framework
(MAF) report and Action Plan on youth unemployment. In turn, the MAF provides national
stakeholders with a systematic approach to identify and analyze bottlenecks that hinder timely
MDG achievement.
This MAF report has emerged through a nationally owned process that has been supported
by strong leadership from the Government. The Gross National Happiness Commission and
the Ministry of Labour and Human Resources have been especially supportive, with multi
sectoral inputs from civil society, the private sector and young people.
The axiom that youth are our future holds true particularly in Bhutan, where youth constitute more
than 20 percent of the population. As such, this presents a key opportunity to take advantage of the
demographic bonus by creating sufficient, adequately productive and remunerative employment
opportunities for the broader labour force.
If the current social context in Bhutan can be characterized at all, it is one of embracing modernization
and globalization in a manner consistent with the country‘s traditional values. Nonetheless,
preparing the labour force to be competitive in the 21st Century is no easy task. Some of these
potentially competing forces, especially those that have a direct bearing on aspirations of youth,
are evident in the labour market. In particular, while unemployment is low overall, unemployment
is relatively high among the youth.
Critically, youth employment is not just an economic issue: It is also a social agenda to deter
young people from potential youth-related problems. Therefore, providing decent and gainful
employment opportunities also can help to maintain social cohesion and harmony, a hallmark of
Bhutanese culture.
The MAF approach builds on existing employment strategies and policies by suggesting
sustainable and feasible pathways to overcome constraints to successful implementation. The
challenges we collectively face are wide-ranging, from a mismatch between labour demand and
supply, to difficulties faced by women entrepreneurs in starting small businesses.
We have a great opportunity to address youth unemployment. Strong political will exists in the
country, as well as a multi-sectoral coordination mechanism under the leadership of the Prime
Minister.
2
The UN stands ready to provide further technical and financial support to implement Bhutan‘s
MAF Action Plan in a spirit of partnership. Together, we can do more.
Pema Wangda Christina Carlson
Secretary, Ministry of Labour and Human UN Resident Coordinator/UNDP Resident
Resources Representative
3
Acknowledgements
he preparation of this report would not have been possible without the support and valuable
contribution of a large number of individuals and organizations.
The MDG Acceleration Framework (MAF) on youth employment was developed under the
leadership of the Royal Government of Bhutan, Ministry of Labour and Human Resources, Gross
National Happiness Commission, Ministry of Economic Affairs, Ministry of Education, Ministry of
Health, Ministry of Home and Cultural Affairs, Ministry of Agriculture and Forests, Ministry of Works
and Human Settlement, National Statistics Bureau, Royal University of Bhutan, Royal Institute of
Management and Tourism Council of Bhutan.
The Royal Government of Bhutan and UNDP wish to express our appreciation to colleagues and
all who worked in various ways to develop this MDG Acceleration Framework report and the
background papers that informed the report. Special credit goes to:
Pema Wangda, Secretary, Ministry of Labour and Human Resources; Jamyang Galey, Director,
Department of Employment; Rinchen Wangdi, Chief Programme Officer, GNHC; Tandin Wangmo,
Senior Program Coordinator; GNHC; Alessandra Casazza, Policy Advisor, UNDP; Chhewang Rinzin,
Consultant; Sanjeev Mehta, Consultant; Bishwa Nath Tiwari, Programme Specialist, UNDP;
Fumie Arimizu, Programme Officer, UNDP; Claudia Vinay, Policy Specialist, UNDP; Gonzalo Pizarro,
MDG Advisor, UNDP; Renata Rubian, Policy Specialist, UNDP; Flora Trouilloud, Intern, UNDP;
Hankyoreh Lee, Intern, UNDP; Tandin Wangchuk, Intern, UNDP; Karma Tsering, Child Protection
Officer, UNICEF; and Kinley Penjor, Programme Officer, UNICEF.
In addition, this report could not have been developed without inputs from civil society
organizations and the private sector, including the Youth Development Fund, Loden Foundation,
Tarayana Foundation, Royal Society for Protection of Nature, Bhutan Chamber of Commerce and
Industry, and Bhutan Innovation and Technology Centre.
We also would like to thank Kay Dorji for editing the report.
Finally, the team is grateful for the overall leadership and vision of Claire Van der Vaeren, former UN
Resident Coordinator/UNDP Resident Representative; Christina Carlson, UN Resident Coordinator/
UNDP Resident Representative; Hideko Hadzialic, Deputy Resident Representative, UNDP; Taimur
Khilji, Policy Specialist, UNDP; Lyonpo Dorji Choden, former Head of the Poverty and MDG Unit,
UNDP; Jigme Dorji, Programme Analyst, UNDP; and Shantanu Mukherjee, Team Leader, MDGs.
4
List of Abbreviations
1. Asian Development Bank (ADB)
2. Association of Bhutanese Tour Operators (ABTO)
3. Asia-Pacific Regional Center (APRC)
4. Agency for Promotion of Indigenous Crafts (APIC)
5. Bhutan Broadcasting Services (BBS)
6. Bhutan Association of Women Entrepreneurs (BAOWE)
7. Bhutan Development Bank Ltd. (BDBL)
8. Bhutan National Legal Institute (BNLI)
9. Bhutan Livings Standards Survey (BLSS)
10. Bhutan Chamber of Commerce and Industry (BCCI)
11. Bhutan Nuns Foundation (BNF)
12. Center for Bhutan Studies (CBS)
13. Construction Development Corporation Ltd. (CDCL)
14. Contraceptive Prevalence Rate (CPR)
15. Civil Society Organization (CSO)
16. Cottage, Small and Medium Industry (CSMI)
17. Country Action Plan (CAP)
18. Department of Adult and Higher Education (DAHE)
19. Druk Green Power Corporation (DGPC)
20. Druk Holding and Investments (DHI)
21. Department. of Cottage and Small Industries (DCSI)
22. Diagnostic Trade Integration Study (DTIS)
23. Department of Youth and Sports (DYS)
24. Department of Public Health (DoPH)
25. Election Commission of Bhutan (ECB)
26. Economic Development Policy (EDP)
27. Economist Intelligence Unit (EIU)
28. Foreign Direct Investments (FDIs)
29. Gross National Happiness Commission (GNHC)
30. Guide Association of Bhutan (GAB)
31. Gross Domestic Product (GDP)
32. Hotel Association of Bhutan (HAB)
33. Information and Communications Technology (ICT)
34. Japan International Cooperation Agency (JICA)
35. Labour Force Survey (LFS)
36. Motion Picture Association of Bhutan (MPAB)
37. Micro Finance Institutions (MFIs)
38. Micro, Small and Medium Enterprises (MSME)
39. Ministry of Economic Affairs (MoEA)
40. Ministry of Education (MoE)
5
41. Ministry of Agriculture and Forestry (MoAF)
42. Ministry of Health (MoH)
43. Ministry of Home and Culture Affairs (MoHCA)
44. Ministry of Labour and Human Resources (MoLHR)
45. Ministry of Information and Communication (MoIC)
46. Millennium Development Goals (MDGs)
47. MDG Acceleration Framework (MAF)
48. Micro, Small, and Medium-Sized Enterprise Sector
Development Programme (MSMESDP)
49. National Assembly of Bhutan (NAB)
50. National Commission for Women and Children (NCWC)
51. National Environment Commission (NEC)
52. National Land Commission (NLC)
53. National Employment Policy (NEP)
54. National Statistics Bureau (NSB)
55. Non-Formal Education (NFE)
56. Policy and Planning Division (PPD)
57. Private Sector Development Committee (PSDC)
58. Public-Private Partnership (PPP)
59. Royal Society for the Protection of Nature (RSPN)
60. Royal Civil Service Commission (RCSC)
61. Royal Monetary Authority (RMA)
62. Royal University of Bhutan (RUB)
63. Rigsum Institute of Management (RIM)
64. Royal Government of Bhutan (RGoB)
65. Special Economic Zones (SEZs)
66. South Asia Free Trade Agreement (SAFTA)
67. Training of Trainers (ToTs)
68. Technical Training Institutes (TTIs)
69. Tourism Council of Bhutan (TCB)
70. Technical and Vocational Education Training (TVET)
71. United Nations Country Team (UNCT)
72. United Nations Development Assistance Framework (UNDAF)
73. United Nations Development Programme (UNDP)
74. United Nations Population Fund (UNFPA)
75. United Nations Industrial Development Organization (UNIDO)
76. United Nations Conference on Trade and Development (UNCTAD)
77. United Nations Educational Scientific and Cultural
Organization (UNESCO)
78. United Nations Resident Coordinator Office. (UNRCO)
79. Vocational and Technical Training Institutes (VTTI)
80. Youth Development Fund (YDF)
6
CHAPTER 1:
Introduction
hutan has already achieved several of the global Millennium Development Goals (MDGs)
and is on track to achieving most targets by 2015. The country has (i) witnessed strong and 1
sustained growth, averaging more than 8 percent between 2008 and 2012; (ii) Reduced
Poverty significantly, from 36.3 percent in 2000 to 12 percent in 2012;2 and tempered the overall
level of official unemployment, from 4 percent in 2009 to 2.1 percent in 2012. Moreover, according
to the World Bank,3 Gross Domestic Product (GDP)per capita in Bhutan has tripled since 2000,
from US$780 in 2000 to US$2,400 in 2012. Between 2007 and 2012 alone, the Net Enrolment Ratio
in primary education increased from 84 percent to 91.5 percent while maintaining gender parity.
In addition, Bhutan‘s MDG health indicators reflect steady progress, unlike those of most countries
in the Asia-Pacific region. The Infant Mortality Rate (IMR) has almost halved, from 90 per 1,000 live
births in 1990 to 47 per 1,000 live births in 2010. Over the same period, the Under-5 Mortality
Rate (U5MR) has fallen 44 percent, from 123 per 1,000 live births to 69 per 1,000 live births. The
immunization of children has remained above 90 percent since 1990. In terms of the Maternal
Mortality Ratio (MMR), the decline also has been sharp, from 560 per 100,000 live births in 1990
to 155 per 100,000 live births in 2011.4 While the number of reported HIV cases has increased to
321 in 2013, after the first case was reported in 1993, these account for just 0.01 percent of the
total population. Lastly, the Contraceptive Prevalence Rate (CPR) has more than doubled, from 31
percent in 2000 to 65.6 percent in 2010. These national trends indicate Bhutan being well on track
to achieve several of the MDG health targets by 2015 as well.
However, progress continues to lag in some Goal areas, including employment, especially among
youth, and sanitation. Under MDG1b, in 2012 the employment-to-population ratio stood at 44.8
percent, while the proportion of workers living below the national poverty line, defined as Nu.
1,704.84 per month, was 14.5 percent.5 Moreover, the share of women in wage employment in
the non-agricultural sector is just 25.2 percent, significantly less than the global average of 40
percent.6 In terms sanitation (MDG7c), 42 percent of Bhutan‘s population lacked proper sanitation
facilities in 2012.
While the overall official unemployment rate of 2.1 percent remains low by any standard, concern
has been growing among policy makers and the public alike with regard to youth employment.
The rate of unemployment among the youth (ages 15-24 years) is considerably higher than the
overall rate of unemployment; among male youth, unemployment stands at 9.5 percent, and
among female youth, at 11.6 percent. These rates are much more pronounced among youth in
urban areas compared to rural areas, rising sharply to 20.2 percent and 29.5 percent for male and
female youth respectively. Therefore, creating gainful employment for urban youth, with a focus
1 Gross National Happiness Commission, RGOB. Eleventh Five Year Plan (1 July 2013-30 June 2018).Thimphu,2013. 2 Ibid. 3 World Development Indicators. 2013. 4 Ministry of Health, RGOB.Annual Health Report2011.Thimphu, 2011. 5 This is slightly above the official national poverty rate of– 12 percent. The explanation for this deviation lies in the fact that
poverty is based on consumption expenditure, which is also financed through informal transfer payments and borrowings
from relatives and members of community. 6 United Nations. Secretary-General’s Global MDG Report 2013. New York, 2013.
7
on quality of employment, has become a key priority for the Royal Government of Bhutan (RGOB),
as reflected in planning and strategy documents including the Eleventh Five Year Plan (2013-
2018). In the 11th Plan, reducing youth unemployment from its current level to 2.5 percent is one
of 16 key results.
Given this evidence, youth employment as a whole has gained prominence over the years as a
central development issue facing Bhutan. MDG progress reports issued in 2005 and 2008 both
highlighted youth unemployment as an emerging issue requiring Government attention. More
recently, in early 2012, the UN Country Team (UNCT) carried out the Common Country Assessment
(CCA) as part of the United Nations Development Assistance Framework (UNDAF) formulation
process, in which sustainable livelihood and unemployment was highlighted as a key development
challenge. Considering the importance attached to employment, particularly youth employment,
the UNCT and the RGOB agreed to adopt the MDG Acceleration Framework (MAF) as a means to
accelerate progress on MDG1, target 2a: Achieve full and productive employment and decent work
for all, including women and young people, and MDG8, target 16: In cooperation with developing
countries, develop and implement strategies for decent and productive work for youth. In the case
of Bhutan, MDG 8, target 16 was deemed most applicable.
1. 1. The MDG Acceleration Framework
The MAF helps countries to analyze why they are lagging on specific MDGs, prioritize the
bottlenecks and constraints impeding progress, and identify collaborative solutions involving
government and all relevant development stakeholders. In the case of Bhutan‘s unemployment
issue, the critical target group is the youth, especially the female youth.
In addition, the MAF can help to address new challenges related to meeting the MDGs in a
particular country context. It can integrate new evidence such as the strategic importance of
technology and the centrality of gender equality and women‘s empowerment, in relation to
specific MDG targets and indicators, as well as to innovations in national and sub-national efforts
to accelerate and sustain progress toward the Goals. As a result of the MAF, a focused, agreed-
upon Action Plan addressing specific MDGs that rallies the efforts of government and partners,
including civil society and the private sector, is expected.
The UNCT, in close collaboration with the Government and other partners, applied the MAF to MDG-
1, target 2a, and MDG8, target 16. In particular, a collective effort on the part of Government, the
private sector, youth groups, and development partners was put into studying the impediments
causing persistent youth unemployment, especially in urban areas, and paying particular attention
to cross-sectoral and crosscutting issues.
In addition, a workshop led by the RGOB and supported by the UNCT, involving stakeholders
and partners (UN specialized Agencies, the private sector, and non-Government organizations
including those representing youth and women), was organized in May 2012 in Paro. Subsequently,
several meetings were held with Government counterparts and relevant stakeholders to refine
and validate both bottlenecks and solutions. In November 2012, the country‘s first National
Employment Forum, with a focus on youth unemployment, was held in Thimphu. This national
forum brought together several Government Ministries, youth representatives, the private sector
and development partners to ensure a diverse set of views were reflected when tackling this issue.
To ensure that the MAF is in line with the vision on youth employment espoused by the new
8
Government elected in July 2013, the process of MAF completion was delayed. Thus, a final
consultation and validation workshop was held in November 2013 to achieve consensus on
solutions to be implemented as part of an MAF Action Plan that was developed. Critically, the
Action Plan, built on existing knowledge and experience as well as in-country policy and planning
processes, is tailored to Bhutan‘s unique context.
The following report summarizes the work of the UNCT and Government using the MAF
methodology. The first chapter updates the status and trends regarding unemployment in Bhutan,
paying particular attention to youth employment. Following this, the second chapter analyzes
policy documents and Government development plans as they pertain to strategic interventions
toward boosting youth employment. Chapter 3 discusses the bottlenecks and constraints faced in
boosting youth unemployment; these were identified through a consultative process led by the
Ministry of Labour and Human Resources (MoLHR), while also relying on expert judgment. The
fourth chapter presents proposed solutions to the prioritized bottlenecks; these also emerged
through a consultative process led by MoLHR and involving relevant stakeholders. Finally, Chapter
5 puts forth the Country Action Plan for Bhutan, with the aim of boosting youth employment
during the period of the Eleventh Five Year Plan (2013-18). As such, the MAF complements and
builds on current and proposed policies and activities pertaining to youth employment, including
those in the 11thPlan.
9
U
(%
)
CHAPTER 2:
Unemployment in Bhutan7
2. 1. Status and Trends: Unemployment Among Youth Is a Critical
Concern
nemployment rates have fallen overall in Bhutan in recent years, but disaggregation by age
and sex highlight areas of concern (Figure 2.1). The RGOB Labour Force Survey (LFS) 2012 8
estimates Bhutan‘s population at 734,851, of which 552,367 are age 15 years and older. The labour force comprises a large share of the population (45.8 percent, or 336,391 persons);of these,
97.9 per cent (329,487 persons) are employed and 2.1 per cent (6,904 persons) unemployed.9
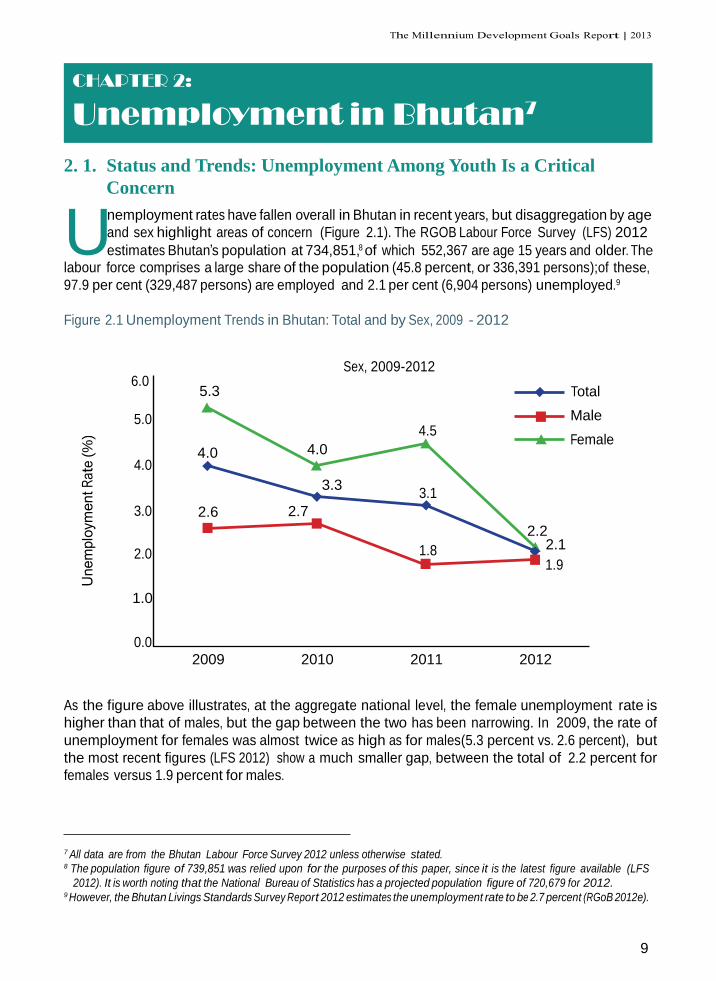
Figure 2.1 Unemployment Trends in Bhutan: Total and by Sex, 2009 - 2012
6.0
5.0
4.0
3.0
2.0
5.3
4.0 2.6 2.7
4.0
3.3
Sex, 2009-2012
4.5
3.1
1.8
2.2
2.1
Total
Male
Female
1.9
1.0
0.0 2009 2010 2011 2012
As the figure above illustrates, at the aggregate national level, the female unemployment rate is
higher than that of males, but the gap between the two has been narrowing. In 2009, the rate of
unemployment for females was almost twice as high as for males(5.3 percent vs. 2.6 percent), but
the most recent figures (LFS 2012) show a much smaller gap, between the total of 2.2 percent for
females versus 1.9 percent for males.
7 All data are from the Bhutan Labour Force Survey 2012 unless otherwise stated. 8 The population figure of 739,851 was relied upon for the purposes of this paper, since it is the latest figure available (LFS
2012). It is worth noting that the National Bureau of Statistics has a projected population figure of 720,679 for 2012. 9 However, the Bhutan Livings Standards Survey Report 2012 estimates the unemployment rate to be 2.7 percent (RGoB 2012e).
10
5.3
9.4
7.9
6.6
3.9
2.8
0.8
1.3
0.7
1.1
0.4
0.8
0.4
0.4
1.2
0.8
0.6
0
0 0.1
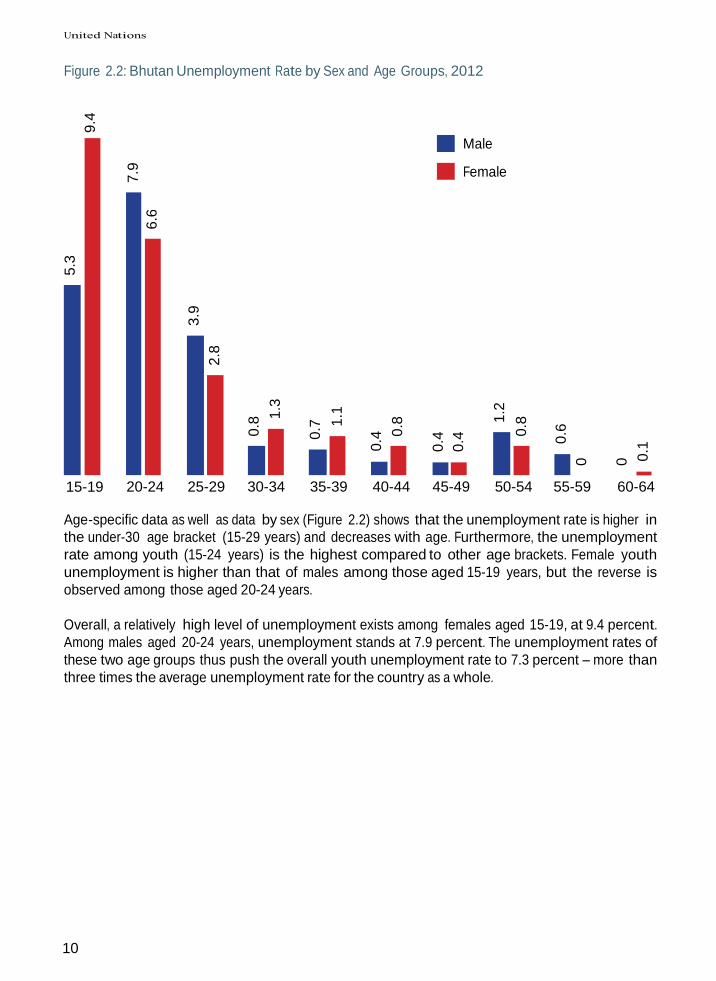
Figure 2.2: Bhutan Unemployment Rate by Sex and Age Groups, 2012
Male
Female
15-19 20-24 25-29 30-34 35-39 40-44 45-49 50-54 55-59 60-64
Age-specific data as well as data by sex (Figure 2.2) shows that the unemployment rate is higher in
the under-30 age bracket (15-29 years) and decreases with age. Furthermore, the unemployment
rate among youth (15-24 years) is the highest compared to other age brackets. Female youth
unemployment is higher than that of males among those aged 15-19 years, but the reverse is
observed among those aged 20-24 years.
Overall, a relatively high level of unemployment exists among females aged 15-19, at 9.4 percent.
Among males aged 20-24 years, unemployment stands at 7.9 percent. The unemployment rates of
these two age groups thus push the overall youth unemployment rate to 7.3 percent – more than
three times the average unemployment rate for the country as a whole.
11
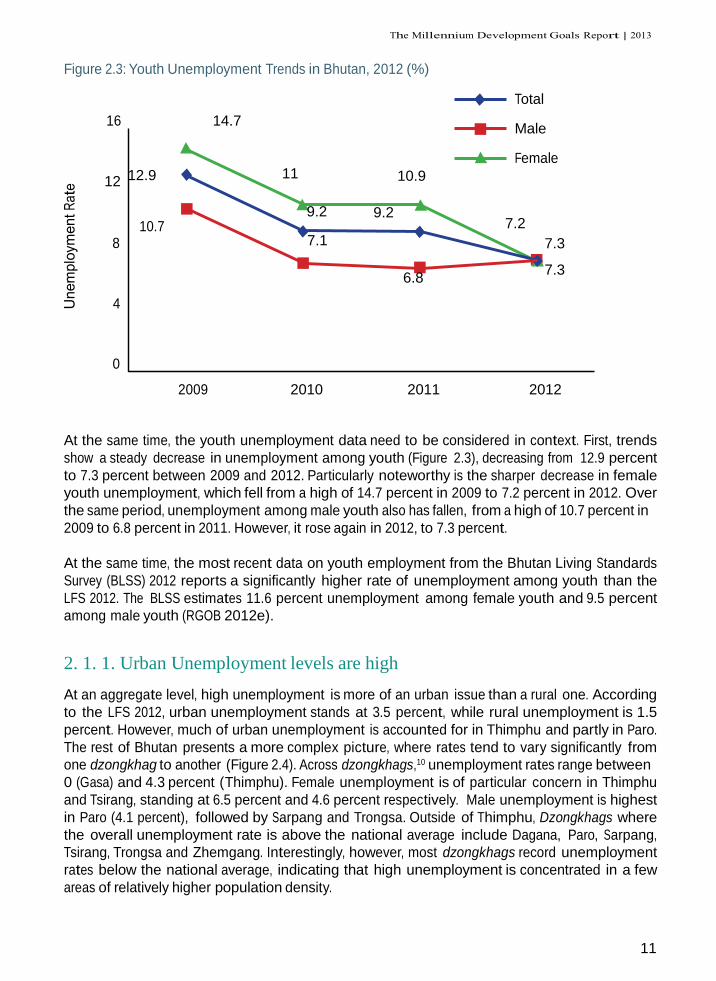
Figure 2.3: Youth Unemployment Trends in Bhutan, 2012 (%)
16
12 12.9
10.7 8
4
14.7
11
9.2
7.1
9.2
10.9
6.8
Total
Male
Female
7.2
7.3
7.3
0
2009
2010 2011
2012
At the same time, the youth unemployment data need to be considered in context. First, trends
show a steady decrease in unemployment among youth (Figure 2.3), decreasing from 12.9 percent
to 7.3 percent between 2009 and 2012. Particularly noteworthy is the sharper decrease in female
youth unemployment, which fell from a high of 14.7 percent in 2009 to 7.2 percent in 2012. Over
the same period, unemployment among male youth also has fallen, from a high of 10.7 percent in
2009 to 6.8 percent in 2011. However, it rose again in 2012, to 7.3 percent.
At the same time, the most recent data on youth employment from the Bhutan Living Standards
Survey (BLSS) 2012 reports a significantly higher rate of unemployment among youth than the
LFS 2012. The BLSS estimates 11.6 percent unemployment among female youth and 9.5 percent
among male youth (RGOB 2012e).
2. 1. 1. Urban Unemployment levels are high
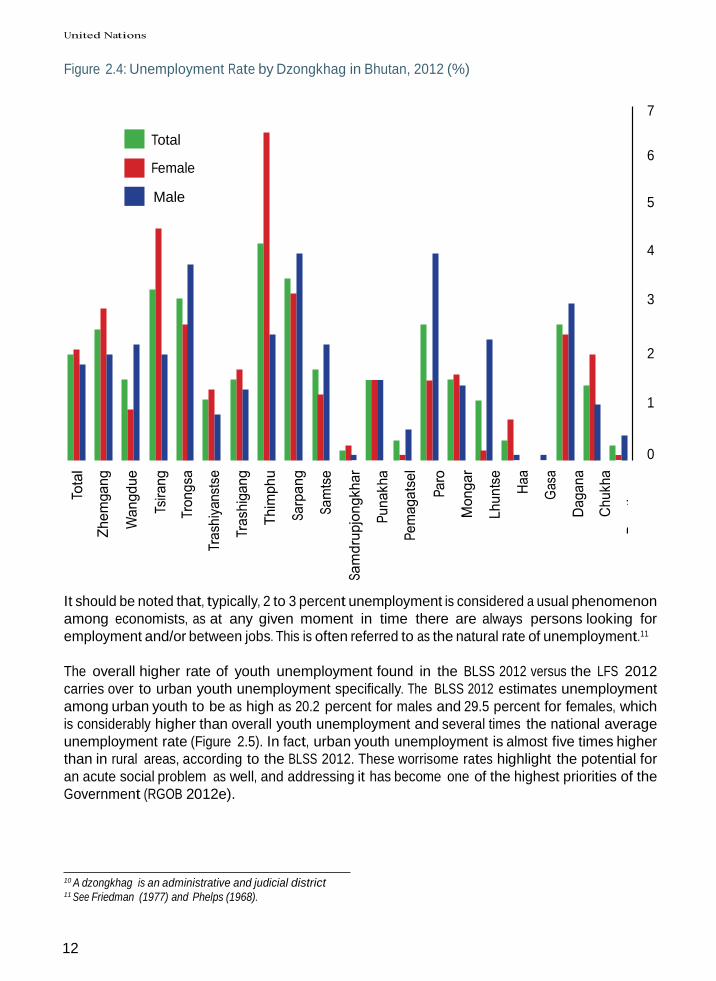
At an aggregate level, high unemployment is more of an urban issue than a rural one. According
to the LFS 2012, urban unemployment stands at 3.5 percent, while rural unemployment is 1.5
percent. However, much of urban unemployment is accounted for in Thimphu and partly in Paro.
The rest of Bhutan presents a more complex picture, where rates tend to vary significantly from
one dzongkhag to another (Figure 2.4). Across dzongkhags,10 unemployment rates range between
0 (Gasa) and 4.3 percent (Thimphu). Female unemployment is of particular concern in Thimphu
and Tsirang, standing at 6.5 percent and 4.6 percent respectively. Male unemployment is highest
in Paro (4.1 percent), followed by Sarpang and Trongsa. Outside of Thimphu, Dzongkhags where
the overall unemployment rate is above the national average include Dagana, Paro, Sarpang,
Tsirang, Trongsa and Zhemgang. Interestingly, however, most dzongkhags record unemployment
rates below the national average, indicating that high unemployment is concentrated in a few
areas of relatively higher population density.
12
Figure 2.4: Unemployment Rate by Dzongkhag in Bhutan, 2012 (%)
7
Total 6
Female
Male 5
4
3
2
1
0
It should be noted that, typically, 2 to 3 percent unemployment is considered a usual phenomenon
among economists, as at any given moment in time there are always persons looking for
employment and/or between jobs. This is often referred to as the natural rate of unemployment.11
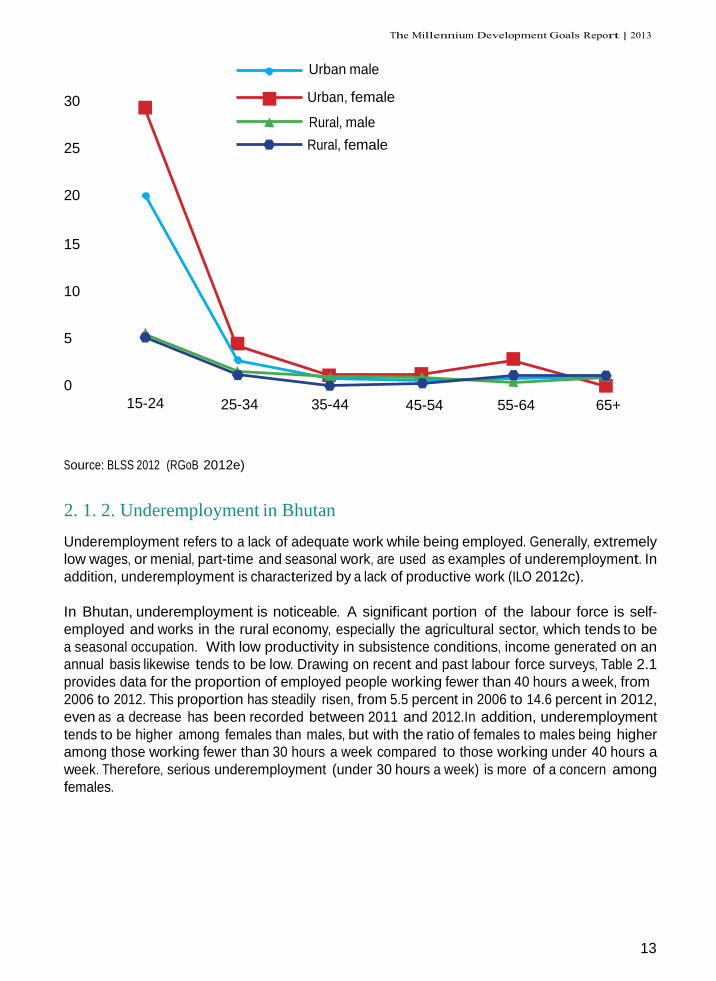
The overall higher rate of youth unemployment found in the BLSS 2012 versus the LFS 2012
carries over to urban youth unemployment specifically. The BLSS 2012 estimates unemployment
among urban youth to be as high as 20.2 percent for males and 29.5 percent for females, which
is considerably higher than overall youth unemployment and several times the national average
unemployment rate (Figure 2.5). In fact, urban youth unemployment is almost five times higher
than in rural areas, according to the BLSS 2012. These worrisome rates highlight the potential for
an acute social problem as well, and addressing it has become one of the highest priorities of the
Government (RGOB 2012e).
10 A dzongkhag is an administrative and judicial district 11 See Friedman (1977) and Phelps (1968).
13
Urban male
30 Urban, female
Rural, male
25 Rural, female
20
15
10
5
0
15-24 25-34 35-44 45-54 55-64 65+
Source: BLSS 2012 (RGoB 2012e)
2. 1. 2. Underemployment in Bhutan
Underemployment refers to a lack of adequate work while being employed. Generally, extremely
low wages, or menial, part-time and seasonal work, are used as examples of underemployment. In
addition, underemployment is characterized by a lack of productive work (ILO 2012c).
In Bhutan, underemployment is noticeable. A significant portion of the labour force is self-
employed and works in the rural economy, especially the agricultural sector, which tends to be
a seasonal occupation. With low productivity in subsistence conditions, income generated on an
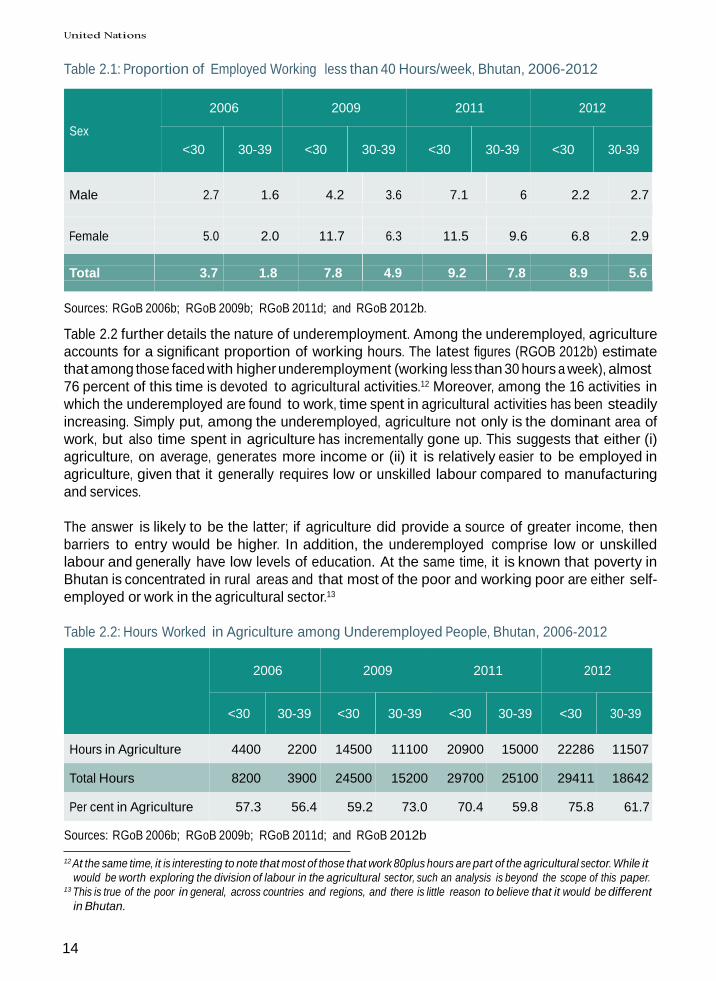
annual basis likewise tends to be low. Drawing on recent and past labour force surveys, Table 2.1
provides data for the proportion of employed people working fewer than 40 hours a week, from
2006 to 2012. This proportion has steadily risen, from 5.5 percent in 2006 to 14.6 percent in 2012,
even as a decrease has been recorded between 2011 and 2012.In addition, underemployment
tends to be higher among females than males, but with the ratio of females to males being higher
among those working fewer than 30 hours a week compared to those working under 40 hours a
week. Therefore, serious underemployment (under 30 hours a week) is more of a concern among
females.
14
Table 2.1: Proportion of Employed Working less than 40 Hours/week, Bhutan, 2006-2012
Sex
2006 2009 2011 2012 <30 30-39 <30 30-39 <30 30-39 <30 30-39
Male
2.7
1.6
4.2
3.6
7.1
6
2.2
2.7
Female
5.0
2.0
11.7
6.3
11.5
9.6
6.8
2.9
Total
3.7
1.8
7.8
4.9
9.2
7.8
8.9
5.6
Sources: RGoB 2006b; RGoB 2009b; RGoB 2011d; and RGoB 2012b.
Table 2.2 further details the nature of underemployment. Among the underemployed, agriculture
accounts for a significant proportion of working hours. The latest figures (RGOB 2012b) estimate
that among those faced with higher underemployment (working less than 30 hours a week), almost
76 percent of this time is devoted to agricultural activities.12 Moreover, among the 16 activities in
which the underemployed are found to work, time spent in agricultural activities has been steadily
increasing. Simply put, among the underemployed, agriculture not only is the dominant area of
work, but also time spent in agriculture has incrementally gone up. This suggests that either (i)
agriculture, on average, generates more income or (ii) it is relatively easier to be employed in
agriculture, given that it generally requires low or unskilled labour compared to manufacturing
and services.
The answer is likely to be the latter; if agriculture did provide a source of greater income, then
barriers to entry would be higher. In addition, the underemployed comprise low or unskilled
labour and generally have low levels of education. At the same time, it is known that poverty in
Bhutan is concentrated in rural areas and that most of the poor and working poor are either self-
employed or work in the agricultural sector.13
Table 2.2: Hours Worked in Agriculture among Underemployed People, Bhutan, 2006-2012
2006 2009 2011 2012
<30 30-39 <30 30-39 <30 30-39 <30 30-39
Hours in Agriculture 4400 2200 14500 11100 20900 15000 22286 11507
Total Hours 8200 3900 24500 15200 29700 25100 29411 18642
Per cent in Agriculture 57.3 56.4 59.2 73.0 70.4 59.8 75.8 61.7
Sources: RGoB 2006b; RGoB 2009b; RGoB 2011d; and RGoB 2012b
12 At the same time, it is interesting to note that most of those that work 80plus hours are part of the agricultural sector. While it
would be worth exploring the division of labour in the agricultural sector, such an analysis is beyond the scope of this paper. 13 This is true of the poor in general, across countries and regions, and there is little reason to believe that it would be different
in Bhutan.
15
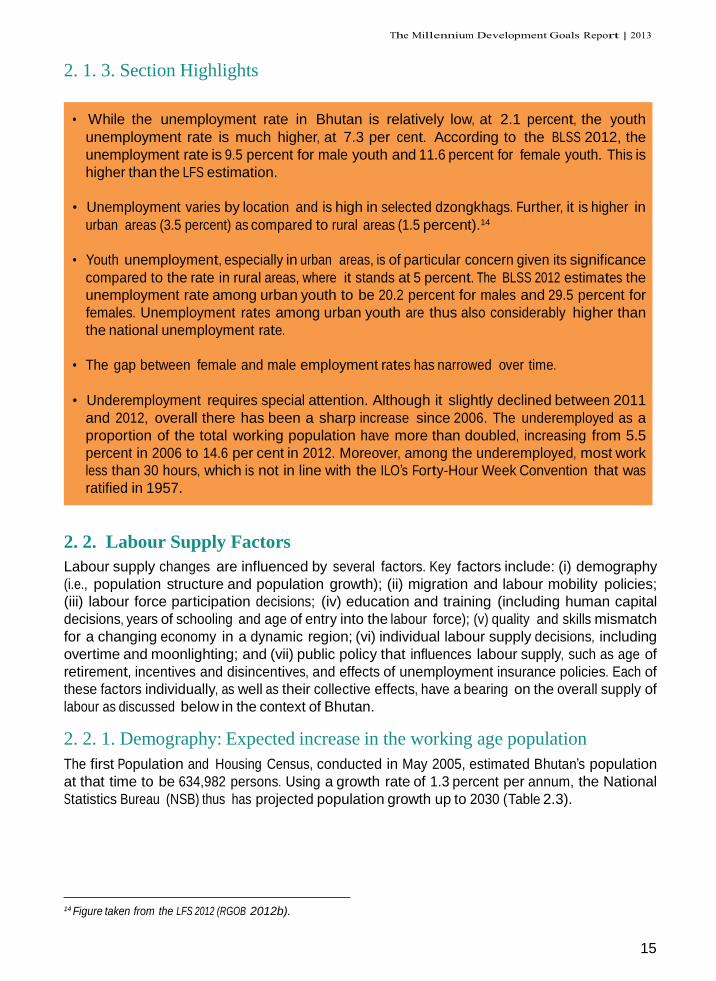
2. 1. 3. Section Highlights
• While the unemployment rate in Bhutan is relatively low, at 2.1 percent, the youth
unemployment rate is much higher, at 7.3 per cent. According to the BLSS 2012, the
unemployment rate is 9.5 percent for male youth and 11.6 percent for female youth. This is
higher than the LFS estimation.
• Unemployment varies by location and is high in selected dzongkhags. Further, it is higher in
urban areas (3.5 percent) as compared to rural areas (1.5 percent).14
• Youth unemployment, especially in urban areas, is of particular concern given its significance
compared to the rate in rural areas, where it stands at 5 percent. The BLSS 2012 estimates the
unemployment rate among urban youth to be 20.2 percent for males and 29.5 percent for
females. Unemployment rates among urban youth are thus also considerably higher than
the national unemployment rate.
• The gap between female and male employment rates has narrowed over time.
• Underemployment requires special attention. Although it slightly declined between 2011
and 2012, overall there has been a sharp increase since 2006. The underemployed as a
proportion of the total working population have more than doubled, increasing from 5.5
percent in 2006 to 14.6 per cent in 2012. Moreover, among the underemployed, most work
less than 30 hours, which is not in line with the ILO‘s Forty-Hour Week Convention that was
ratified in 1957.
2. 2. Labour Supply Factors
Labour supply changes are influenced by several factors. Key factors include: (i) demography
(i.e., population structure and population growth); (ii) migration and labour mobility policies;
(iii) labour force participation decisions; (iv) education and training (including human capital
decisions, years of schooling and age of entry into the labour force); (v) quality and skills mismatch
for a changing economy in a dynamic region; (vi) individual labour supply decisions, including
overtime and moonlighting; and (vii) public policy that influences labour supply, such as age of
retirement, incentives and disincentives, and effects of unemployment insurance policies. Each of
these factors individually, as well as their collective effects, have a bearing on the overall supply of
labour as discussed below in the context of Bhutan.
2. 2. 1. Demography: Expected increase in the working age population
The first Population and Housing Census, conducted in May 2005, estimated Bhutan‘s population
at that time to be 634,982 persons. Using a growth rate of 1.3 percent per annum, the National
Statistics Bureau (NSB) thus has projected population growth up to 2030 (Table 2.3).
14 Figure taken from the LFS 2012 (RGOB 2012b).
16
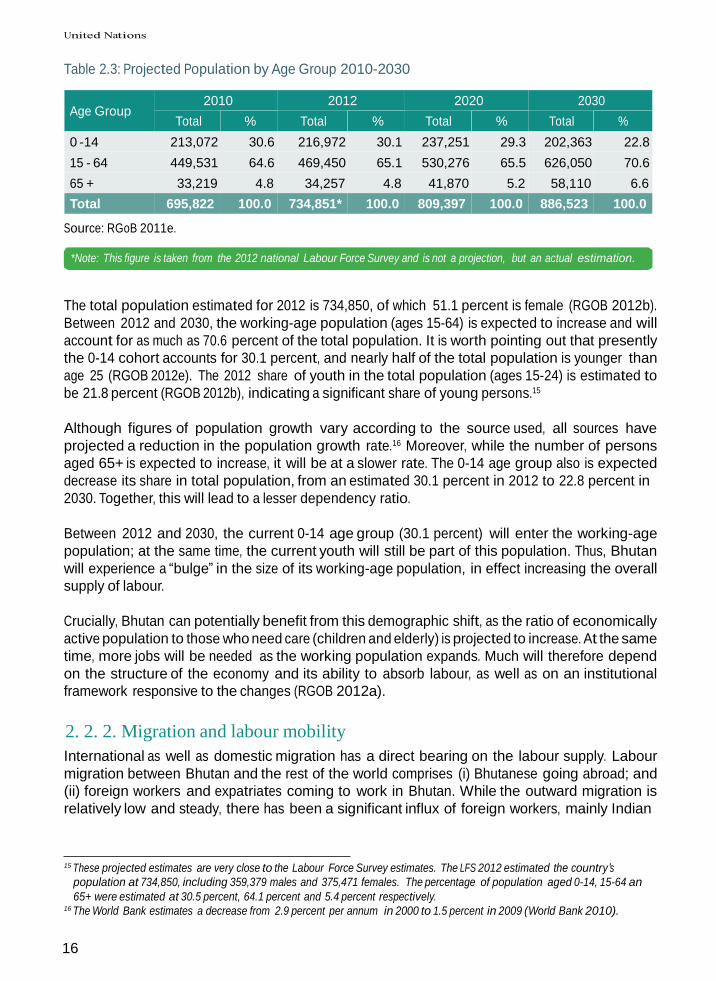
Table 2.3: Projected Population by Age Group 2010-2030
Age Group 2010 2012 2020 2030
Total % Total % Total % Total %
0 -14 213,072 30.6 216,972 30.1 237,251 29.3 202,363 22.8
15 - 64 449,531 64.6 469,450 65.1 530,276 65.5 626,050 70.6
65 + 33,219 4.8 34,257 4.8 41,870 5.2 58,110 6.6
Total 695,822 100.0 734,851* 100.0 809,397 100.0 886,523 100.0
Source: RGoB 2011e.
*Note: This figure is taken from the 2012 national Labour Force Survey and is not a projection, but an actual estimation.
The total population estimated for 2012 is 734,850, of which 51.1 percent is female (RGOB 2012b).
Between 2012 and 2030, the working-age population (ages 15-64) is expected to increase and will
account for as much as 70.6 percent of the total population. It is worth pointing out that presently
the 0-14 cohort accounts for 30.1 percent, and nearly half of the total population is younger than
age 25 (RGOB 2012e). The 2012 share of youth in the total population (ages 15-24) is estimated to
be 21.8 percent (RGOB 2012b), indicating a significant share of young persons.15
Although figures of population growth vary according to the source used, all sources have
projected a reduction in the population growth rate.16 Moreover, while the number of persons
aged 65+ is expected to increase, it will be at a slower rate. The 0-14 age group also is expected
decrease its share in total population, from an estimated 30.1 percent in 2012 to 22.8 percent in
2030. Together, this will lead to a lesser dependency ratio.
Between 2012 and 2030, the current 0-14 age group (30.1 percent) will enter the working-age
population; at the same time, the current youth will still be part of this population. Thus, Bhutan
will experience a ―bulge‖ in the size of its working-age population, in effect increasing the overall
supply of labour.
Crucially, Bhutan can potentially benefit from this demographic shift, as the ratio of economically
active population to those who need care (children and elderly) is projected to increase. At the same
time, more jobs will be needed as the working population expands. Much will therefore depend
on the structure of the economy and its ability to absorb labour, as well as on an institutional
framework responsive to the changes (RGOB 2012a).
2. 2. 2. Migration and labour mobility
International as well as domestic migration has a direct bearing on the labour supply. Labour
migration between Bhutan and the rest of the world comprises (i) Bhutanese going abroad; and
(ii) foreign workers and expatriates coming to work in Bhutan. While the outward migration is
relatively low and steady, there has been a significant influx of foreign workers, mainly Indian
15 These projected estimates are very close to the Labour Force Survey estimates. The LFS 2012 estimated the country’s
population at 734,850, including 359,379 males and 375,471 females. The percentage of population aged 0-14, 15-64 an
65+ were estimated at 30.5 percent, 64.1 percent and 5.4 percent respectively. 16 The World Bank estimates a decrease from 2.9 percent per annum in 2000 to 1.5 percent in 2009 (World Bank 2010).
17
migrants engaged in construction. This inflow of foreign workers tends to fluctuate year to year;
estimates vary between 18,220 foreign workers in 2006 (RGOB 2007a) to 51,616 in early 2012
(RGOB 2012d).
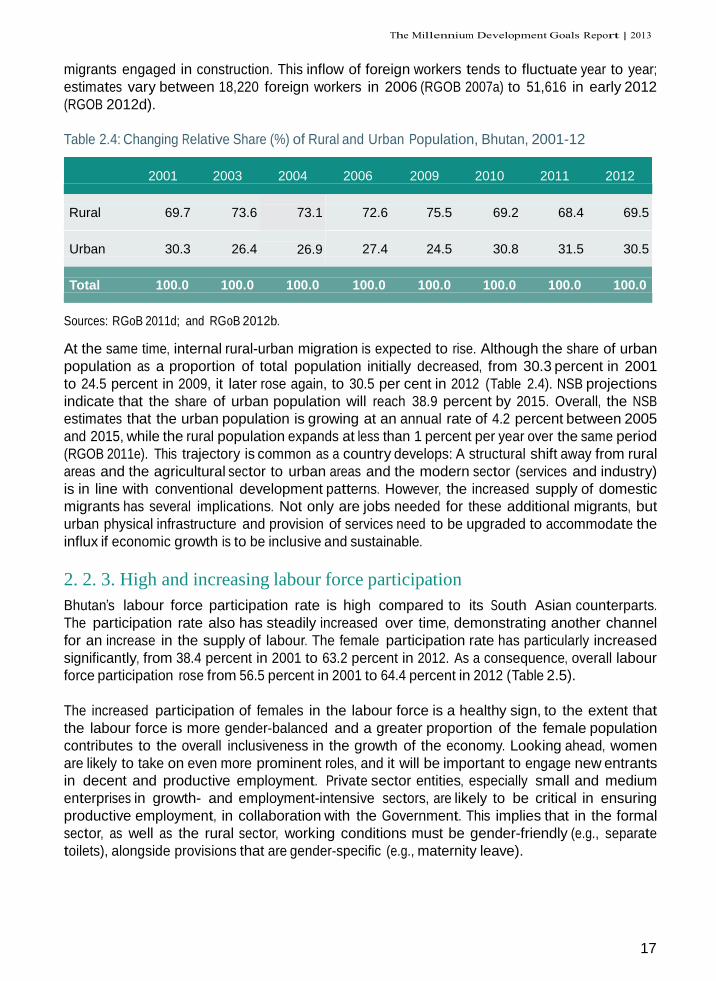
Table 2.4: Changing Relative Share (%) of Rural and Urban Population, Bhutan, 2001-12
2001 2003 2004 2006 2009 2010 2011 2012
Rural 69.7 73.6
73.1
72.6 75.5 69.2 68.4 69.5
Urban 30.3 26.4
26.9
27.4 24.5 30.8 31.5 30.5
Total 100.0 100.0 100.0 100.0 100.0 100.0 100.0 100.0
Sources: RGoB 2011d; and RGoB 2012b.
At the same time, internal rural-urban migration is expected to rise. Although the share of urban
population as a proportion of total population initially decreased, from 30.3 percent in 2001
to 24.5 percent in 2009, it later rose again, to 30.5 per cent in 2012 (Table 2.4). NSB projections
indicate that the share of urban population will reach 38.9 percent by 2015. Overall, the NSB
estimates that the urban population is growing at an annual rate of 4.2 percent between 2005
and 2015, while the rural population expands at less than 1 percent per year over the same period
(RGOB 2011e). This trajectory is common as a country develops: A structural shift away from rural
areas and the agricultural sector to urban areas and the modern sector (services and industry)
is in line with conventional development patterns. However, the increased supply of domestic
migrants has several implications. Not only are jobs needed for these additional migrants, but
urban physical infrastructure and provision of services need to be upgraded to accommodate the
influx if economic growth is to be inclusive and sustainable.
2. 2. 3. High and increasing labour force participation
Bhutan‘s labour force participation rate is high compared to its South Asian counterparts.
The participation rate also has steadily increased over time, demonstrating another channel
for an increase in the supply of labour. The female participation rate has particularly increased
significantly, from 38.4 percent in 2001 to 63.2 percent in 2012. As a consequence, overall labour
force participation rose from 56.5 percent in 2001 to 64.4 percent in 2012 (Table 2.5).
The increased participation of females in the labour force is a healthy sign, to the extent that
the labour force is more gender-balanced and a greater proportion of the female population
contributes to the overall inclusiveness in the growth of the economy. Looking ahead, women
are likely to take on even more prominent roles, and it will be important to engage new entrants
in decent and productive employment. Private sector entities, especially small and medium
enterprises in growth- and employment-intensive sectors, are likely to be critical in ensuring
productive employment, in collaboration with the Government. This implies that in the formal
sector, as well as the rural sector, working conditions must be gender-friendly (e.g., separate
toilets), alongside provisions that are gender-specific (e.g., maternity leave).
18
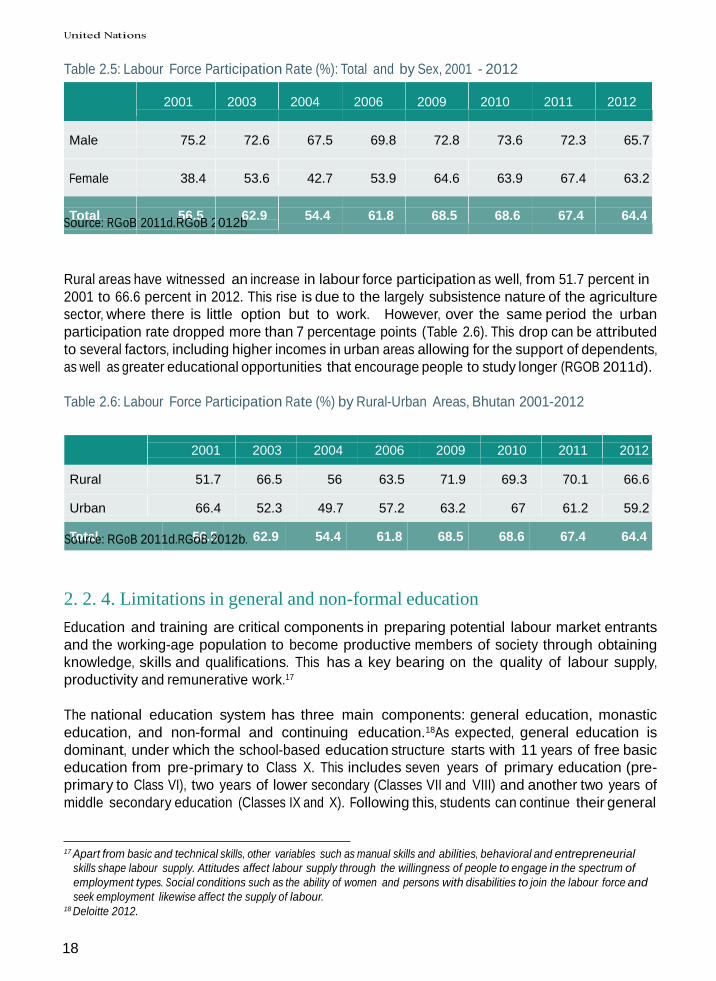
Table 2.5: Labour Force Participation Rate (%): Total and by Sex, 2001 - 2012
2001
2003
2004
2006
2009
2010
2011
2012
Male
75.2
72.6
67.5
69.8
72.8
73.6
72.3
65.7
Female
38.4
53.6
42.7
53.9
64.6
63.9
67.4
63.2
Total Source: RGoB
56.5 2011d.RGoB 2
62.9 012b
54.4
61.8
68.5
68.6
67.4
64.4
Rural areas have witnessed an increase in labour force participation as well, from 51.7 percent in
2001 to 66.6 percent in 2012. This rise is due to the largely subsistence nature of the agriculture
sector, where there is little option but to work. However, over the same period the urban
participation rate dropped more than 7 percentage points (Table 2.6). This drop can be attributed
to several factors, including higher incomes in urban areas allowing for the support of dependents,
as well as greater educational opportunities that encourage people to study longer (RGOB 2011d).
Table 2.6: Labour Force Participation Rate (%) by Rural-Urban Areas, Bhutan 2001-2012
2001
2003
2004
2006
2009
2010
2011
2012
Rural
51.7
66.5
56
63.5
71.9
69.3
70.1
66.6
Urban 66.4 52.3 49.7 57.2 63.2 67 61.2 59.2
STooutracle: RGoB 2011d.RG5o6B.52012b. 62.9 54.4 61.8 68.5 68.6 67.4 64.4
2. 2. 4. Limitations in general and non-formal education
Education and training are critical components in preparing potential labour market entrants
and the working-age population to become productive members of society through obtaining
knowledge, skills and qualifications. This has a key bearing on the quality of labour supply,
productivity and remunerative work.17
The national education system has three main components: general education, monastic
education, and non-formal and continuing education.18As expected, general education is
dominant, under which the school-based education structure starts with 11 years of free basic
education from pre-primary to Class X. This includes seven years of primary education (pre-
primary to Class VI), two years of lower secondary (Classes VII and VIII) and another two years of
middle secondary education (Classes IX and X). Following this, students can continue their general
17 Apart from basic and technical skills, other variables such as manual skills and abilities, behavioral and entrepreneurial
skills shape labour supply. Attitudes affect labour supply through the willingness of people to engage in the spectrum of
employment types. Social conditions such as the ability of women and persons with disabilities to join the labour force and
seek employment likewise affect the supply of labour. 18 Deloitte 2012.
19
education in Classes XI and XII in higher secondary schools, join technical/vocational training
institutes, or enter the labour market, based on their performance in national board examinations
(Bhutan Certificate for Secondary Education) at the end of Class X. Alternatively, students who
do not qualify for Government-funded education can attend private higher secondary schools in
Bhutan or abroad and vocational courses organized by private training institutes.
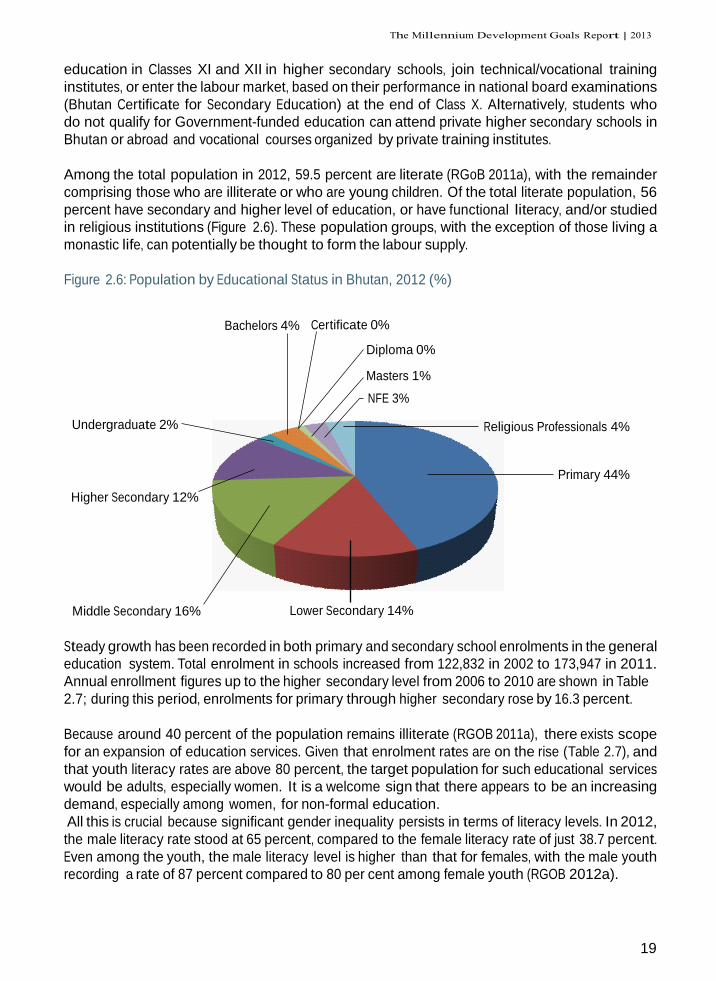
Among the total population in 2012, 59.5 percent are literate (RGoB 2011a), with the remainder
comprising those who are illiterate or who are young children. Of the total literate population, 56
percent have secondary and higher level of education, or have functional literacy, and/or studied
in religious institutions (Figure 2.6). These population groups, with the exception of those living a
monastic life, can potentially be thought to form the labour supply.
Figure 2.6: Population by Educational Status in Bhutan, 2012 (%)
Undergraduate 2%
Higher Secondary 12%
Bachelors 4% Certificate 0%
Diploma 0%
Masters 1%
NFE 3%
Religious Professionals 4%
Primary 44%
Middle Secondary 16% Lower Secondary 14%
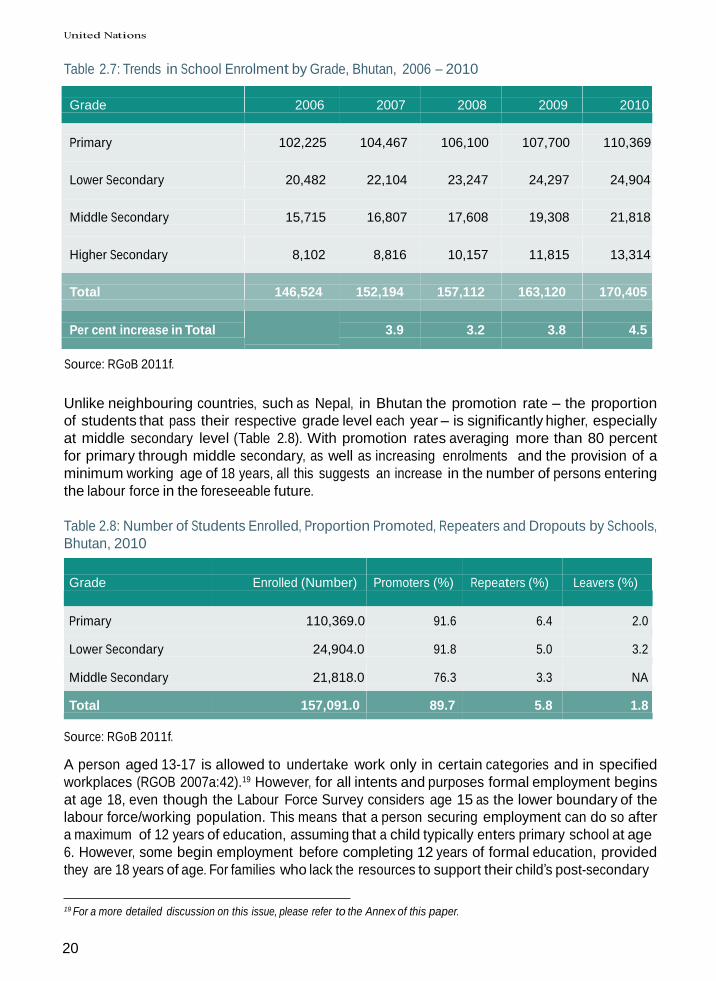
Steady growth has been recorded in both primary and secondary school enrolments in the general
education system. Total enrolment in schools increased from 122,832 in 2002 to 173,947 in 2011.
Annual enrollment figures up to the higher secondary level from 2006 to 2010 are shown in Table
2.7; during this period, enrolments for primary through higher secondary rose by 16.3 percent.
Because around 40 percent of the population remains illiterate (RGOB 2011a), there exists scope
for an expansion of education services. Given that enrolment rates are on the rise (Table 2.7), and
that youth literacy rates are above 80 percent, the target population for such educational services
would be adults, especially women. It is a welcome sign that there appears to be an increasing
demand, especially among women, for non-formal education.
All this is crucial because significant gender inequality persists in terms of literacy levels. In 2012,
the male literacy rate stood at 65 percent, compared to the female literacy rate of just 38.7 percent.
Even among the youth, the male literacy level is higher than that for females, with the male youth
recording a rate of 87 percent compared to 80 per cent among female youth (RGOB 2012a).
20
Table 2.7: Trends in School Enrolment by Grade, Bhutan, 2006 – 2010
Grade
2006
2007
2008
2009
2010
Primary
102,225
104,467
106,100
107,700
110,369
Lower Secondary
20,482
22,104
23,247
24,297
24,904
Middle Secondary
15,715
16,807
17,608
19,308
21,818
Higher Secondary
8,102
8,816
10,157
11,815
13,314
Total
146,524
152,194
157,112
163,120
170,405
Per cent increase in Total
3.9
3.2
3.8
4.5
Source: RGoB 2011f.
Unlike neighbouring countries, such as Nepal, in Bhutan the promotion rate – the proportion
of students that pass their respective grade level each year – is significantly higher, especially
at middle secondary level (Table 2.8). With promotion rates averaging more than 80 percent
for primary through middle secondary, as well as increasing enrolments and the provision of a
minimum working age of 18 years, all this suggests an increase in the number of persons entering
the labour force in the foreseeable future.
Table 2.8: Number of Students Enrolled, Proportion Promoted, Repeaters and Dropouts by Schools,
Bhutan, 2010
Grade
Enrolled (Number)
Promoters (%)
Repeaters (%)
Leavers (%)
Primary 110,369.0 91.6 6.4 2.0
Lower Secondary 24,904.0 91.8 5.0 3.2
Middle Secondary 21,818.0 76.3 3.3 NA
Total 157,091.0 89.7 5.8 1.8
Source: RGoB 2011f.
A person aged 13-17 is allowed to undertake work only in certain categories and in specified
workplaces (RGOB 2007a:42).19 However, for all intents and purposes formal employment begins
at age 18, even though the Labour Force Survey considers age 15 as the lower boundary of the
labour force/working population. This means that a person securing employment can do so after
a maximum of 12 years of education, assuming that a child typically enters primary school at age
6. However, some begin employment before completing 12 years of formal education, provided
they are 18 years of age. For families who lack the resources to support their child‘s post-secondary
19 For a more detailed discussion on this issue, please refer to the Annex of this paper.
21
education, options remain limited. The choice is either to enter the job market or pursue vocational
training, but without pre-job training, even with 12 years of schooling, it is difficult to perform well
in the formal sector.
The quality of education particularly matters in securing and retaining employment (Box 1). This
has been recognized by the RGOB and is something Bhutan is increasingly addressing, having
already achieved the MDG targets for primary completion and gender equality in education. The
perception among many employers appears to be that the education system could do much
more in developing norms, values, and life/coping skills (in addition to technical skills) that are
critical for the job market. Moreover, employers in the service sector require specific skills, such as
competence with computers and proficiency in English. There exists scope to further mainstream
these skills as part of the school curriculum.
BOX 1
The Korean Experience: Overcoming a Skills Mismatch Through Education Policy
The Republic of Korea well illustrates how deliberate planning on the part of a government
can transform the labour force to meet the demands of a rapidly modernizing economy. In
1961, the Republic of Korea was one of the poorest countries in Asia – yet by the late 1990s,
it achieved a per-capita income of more than US$10,000. Education played a central role in
this transformation. It is important to see how educational policies were aligned with other
economic and social agendas.
Four policy tracks that underpinned the Korean experience are:
1. A strong human capital approach, which stressed the centrality of education and skills in
all aspects of development
2. A close relationship between planning targets for education and those for job creation
3. The recognition of education as a key mechanism for economic and social mobility
4. The acknowledged role of education in creating a strong national identity, cementing
national determination to succeed and legitimizing the State.
Institutional Development for Policy Coherence: An emphasis on education and skills
formation was underlined by how education was built into the planning activities of
important Government research and policy institutes. Several specialized institutes were set
up in the area of education, training and skills formation and in related areas of science and
technology. One of the key functions of such planning and coordination organizations was to
ensure that when new jobs were created, there were sufficient numbers of workers with the
right level and mix of skills and that schools and universities did not produce large numbers
of graduates in fields in which employment was limited. Thus, a concerted attempt was made
to match supply and demand, to ensure the optimal sequencing of economic development
and skills formation and to avoid a large pool of qualified but unemployed graduates.
Right Mix of Policy and Programme Interventions: Toward this end, budgets, course sizes,
22
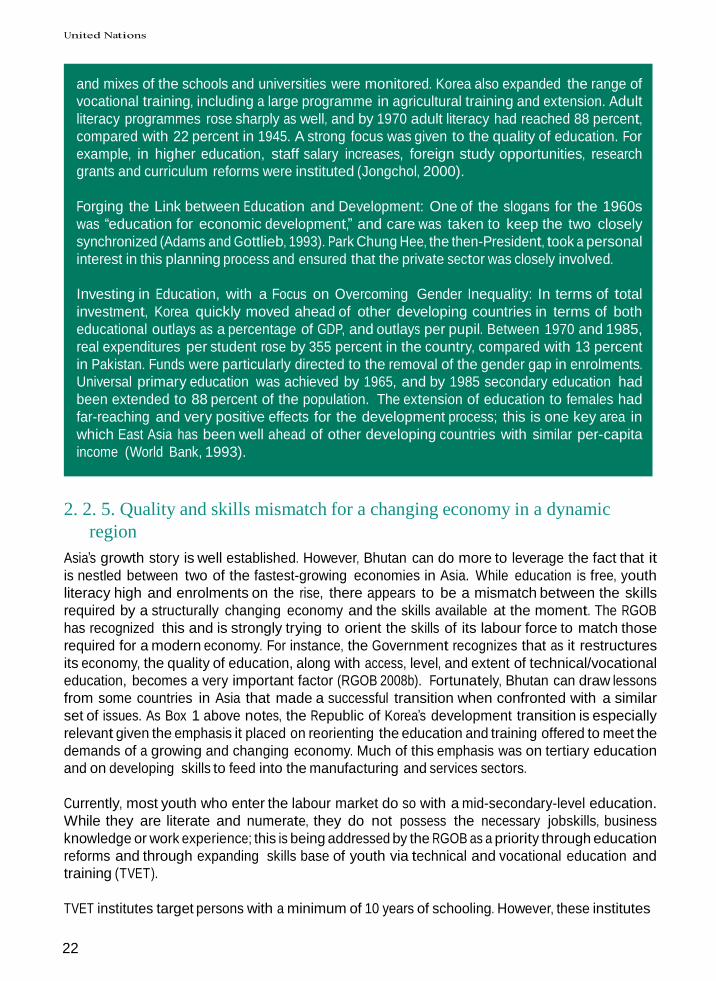
and mixes of the schools and universities were monitored. Korea also expanded the range of
vocational training, including a large programme in agricultural training and extension. Adult
literacy programmes rose sharply as well, and by 1970 adult literacy had reached 88 percent,
compared with 22 percent in 1945. A strong focus was given to the quality of education. For
example, in higher education, staff salary increases, foreign study opportunities, research
grants and curriculum reforms were instituted (Jongchol, 2000).
Forging the Link between Education and Development: One of the slogans for the 1960s
was ―education for economic development,‖ and care was taken to keep the two closely
synchronized (Adams and Gottlieb, 1993). Park Chung Hee, the then-President, took a personal
interest in this planning process and ensured that the private sector was closely involved.
Investing in Education, with a Focus on Overcoming Gender Inequality: In terms of total
investment, Korea quickly moved ahead of other developing countries in terms of both
educational outlays as a percentage of GDP, and outlays per pupil. Between 1970 and 1985,
real expenditures per student rose by 355 percent in the country, compared with 13 percent
in Pakistan. Funds were particularly directed to the removal of the gender gap in enrolments.
Universal primary education was achieved by 1965, and by 1985 secondary education had
been extended to 88 percent of the population. The extension of education to females had
far-reaching and very positive effects for the development process; this is one key area in
which East Asia has been well ahead of other developing countries with similar per-capita
income (World Bank, 1993).
2. 2. 5. Quality and skills mismatch for a changing economy in a dynamic
region
Asia‘s growth story is well established. However, Bhutan can do more to leverage the fact that it
is nestled between two of the fastest-growing economies in Asia. While education is free, youth
literacy high and enrolments on the rise, there appears to be a mismatch between the skills
required by a structurally changing economy and the skills available at the moment. The RGOB
has recognized this and is strongly trying to orient the skills of its labour force to match those
required for a modern economy. For instance, the Government recognizes that as it restructures
its economy, the quality of education, along with access, level, and extent of technical/vocational
education, becomes a very important factor (RGOB 2008b). Fortunately, Bhutan can draw lessons
from some countries in Asia that made a successful transition when confronted with a similar
set of issues. As Box 1 above notes, the Republic of Korea‘s development transition is especially
relevant given the emphasis it placed on reorienting the education and training offered to meet the
demands of a growing and changing economy. Much of this emphasis was on tertiary education
and on developing skills to feed into the manufacturing and services sectors.
Currently, most youth who enter the labour market do so with a mid-secondary-level education.
While they are literate and numerate, they do not possess the necessary jobskills, business
knowledge or work experience; this is being addressed by the RGOB as a priority through education
reforms and through expanding skills base of youth via technical and vocational education and
training (TVET).
TVET institutes target persons with a minimum of 10 years of schooling. However, these institutes
23
are not operating at full capacity due to a shortfall in enrolments -- even though the programme
is free of charge. Students enrolling in vocational institutes are often those who do not qualify for
higher secondary education (RGOB 2009a). Among the eight vocational and technical training
institutes in the country, the total enrolment for academic 2011-2012 stood at 1,238 out of 1,504
slots (i.e., 266 places were vacant). Gender differences also exist in enrolment: In 2010, out of 804
students enrolled in vocational training institutes, 543 were boys (UNESCO 2011). The reasons
given by many youth for their limited interest in enrolling in vocational training relate to the
bleak employment prospects in the public and corporate sectors, along with perceived negative
social status attached to blue-collar work and relatively low wages. Nonetheless, the demand for
vocational/entrepreneurship training is increasing gradually. Between 2009 and 2010, 440 people
completed vocational training provided by MoLHR, and 94 of them started their own businesses.20
The RGOB aims for 6,000 trainees per year.
2. 2. 6. Public policy effects on labour supply
The Government‘s efforts to offer free education and health services are commendable given the
South Asian context, where progress on health and education MDGs leaves much to be desired. At
the same time, while civil servants, military personnel, and corporate and private sector employees
are covered by some form of benefits, the country lacks a formal comprehensive social protection
system outside of formal employment. Consequently, most Bhutanese rely on traditional systems
of inter-household transfers (cash and kind), family support, migration and borrowing (Köhler et
al. 2009).
Overall, labour supply is sensitive to public policy and policy decisions. Setting norms and standards,
including labour laws, codes and provisions, can shape the structure of the labour force. As such,
employment policy, along with rules and provisions regarding employment for public and private
sector jobs, has a direct bearing on the labour supply. The Government has given considerable
effort into preparing a new employment policy. According to Labour Act of Bhutan (RGOB 2007a),
the labour market entry threshold of age 18 is applied to Government jobs, while the private
sector has some flexibility in terms of employing persons younger than 18. Nonetheless, given the
prominence and the extent to which the Government is an employer, options available to persons
aged 15-17 are relatively constrained.
Critically, the private sector in Bhutan, although growing, is yet to fully develop. While a regulatory
framework in place, Bhutan would benefit from the experience of countries such as India, Thailand,
the Republic of Korea and Japan, all of which have more experience in regulatory issues vis-à-vis the
private sector. Government jobs and the well-defined benefits that accompany them (including
job security) continue to be perceived as prized employment compared to private sector jobs.
20 Although the success rate of those starting their own business is low, this differs little from outcomes in other countries.
24
2. 2. 7. Section Highlights
• The labour supply is on the rise.
• Population growth has contributed to a high proportion of working-age population
in Bhutan. With the fertility rate projected to reach replacement levels by 2030, the
proportion of young people will continue to grow for the next couple of decades.
• Labour force participation has increased due to an increased number of youth and female
entrants in the labour market, as well as to rural-urban migration.
• An expansion in school enrolment is enabling large numbers of young people to enter
the labour force.
• Some of the employed are working for longer hours, both adding to labour supply and
potentially limiting opportunities for other labour market entrants. Longer working hours
could be due to low wages, implying possible deficits in remunerative work.
• There exists a strong preference for working in the public sector or Government offices
rather than in technical or vocational occupations requiring physical labour.
• The supply of labour needs to be reoriented so that it is equipped with skills suitable for
the private sector.
2. 3. Labour Demand Factors
Demand for labour is influenced principally by (i) the extent and nature of economic growth; (ii)
the changing structure of Bhutan‘s economy; (iii) the relatively capital-intensive nature of growth;
(iv) changing skill requirements in times of economic transition; (v) small domestic markets and
limited external engagement; (vi) attention to opportunities in agriculture; (vii) leveraging of
employment potential in travel and tourism; (viii) local employment in the energy sector; and (ix)
labour demand in the private sector.
2. 3. 1. High but fluctuating economic growth influences labour demand
Labor demand is driven by growth and the structure of the economy and influenced by the
development of the private sector. While Bhutan has experienced a sustained and high level
of growth that has, on average, hovered around 8 percent, this rate also has fluctuated quite
significantly in recent years. In 2007, for example, it was as high as 17.9 percent, plunging to 4.7
percent in 2008, picking up again to 11.8 percent in 2010, and then falling again in 2011, to 5.4
percent (RGOB 2011b and RGOB 2010a). Such wide fluctuations in economic growth from year
to year reflect the precarious nature of growth; this uncertainty invariably filters into the labour
demand market as well.
Over the past several years, the main driver of growth has been the hydropower sector, recorded
officially under ―electricity and water‖ (Table 2.9). The share of ―electricity and water‖ in overall GDP
has increased from 12.4 percent in 2006 to close to 20 percent in 2009-2010. At the same time,
agriculture‘s share in total GDP has declined from around 24 percent in 2006 to 19 percent in
25
2010. The contribution of the services sector to GDP has oscillated, but generally stayed around
35 percent. Within services, the tourism sector has experienced significant growth in the last few
years; this area of the economy warrants closer inspection, since it is a key driver of labour demand
(RGOB 2010c).
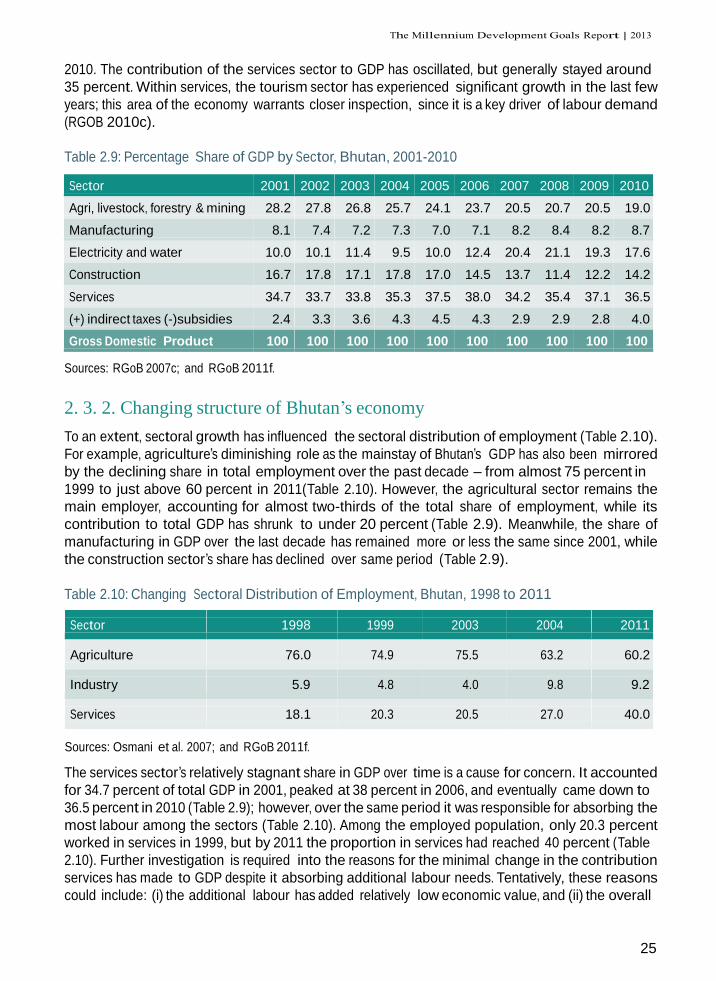
Table 2.9: Percentage Share of GDP by Sector, Bhutan, 2001-2010
Sector 2001 2002 2003 2004 2005 2006 2007 2008 2009 2010
Agri, livestock, forestry & mining 28.2 27.8 26.8 25.7 24.1 23.7 20.5 20.7 20.5 19.0
Manufacturing 8.1 7.4 7.2 7.3 7.0 7.1 8.2 8.4 8.2 8.7
Electricity and water 10.0 10.1 11.4 9.5 10.0 12.4 20.4 21.1 19.3 17.6
Construction 16.7 17.8 17.1 17.8 17.0 14.5 13.7 11.4 12.2 14.2
Services 34.7 33.7 33.8 35.3 37.5 38.0 34.2 35.4 37.1 36.5
(+) indirect taxes (-)subsidies 2.4 3.3 3.6 4.3 4.5 4.3 2.9 2.9 2.8 4.0
Gross Domestic Product 100 100 100 100 100 100 100 100 100 100
Sources: RGoB 2007c; and RGoB 2011f.
2. 3. 2. Changing structure of Bhutan’s economy
To an extent, sectoral growth has influenced the sectoral distribution of employment (Table 2.10).
For example, agriculture‘s diminishing role as the mainstay of Bhutan‘s GDP has also been mirrored
by the declining share in total employment over the past decade – from almost 75 percent in
1999 to just above 60 percent in 2011(Table 2.10). However, the agricultural sector remains the
main employer, accounting for almost two-thirds of the total share of employment, while its
contribution to total GDP has shrunk to under 20 percent (Table 2.9). Meanwhile, the share of
manufacturing in GDP over the last decade has remained more or less the same since 2001, while
the construction sector‘s share has declined over same period (Table 2.9).
Table 2.10: Changing Sectoral Distribution of Employment, Bhutan, 1998 to 2011
Sector
1998
1999
2003
2004
2011
Agriculture
76.0
74.9
75.5
63.2
60.2
Industry
5.9
4.8
4.0
9.8
9.2
Services
18.1
20.3
20.5
27.0
40.0
Sources: Osmani et al. 2007; and RGoB 2011f.
The services sector‘s relatively stagnant share in GDP over time is a cause for concern. It accounted
for 34.7 percent of total GDP in 2001, peaked at 38 percent in 2006, and eventually came down to
36.5 percent in 2010 (Table 2.9); however, over the same period it was responsible for absorbing the
most labour among the sectors (Table 2.10). Among the employed population, only 20.3 percent
worked in services in 1999, but by 2011 the proportion in services had reached 40 percent (Table
2.10). Further investigation is required into the reasons for the minimal change in the contribution
services has made to GDP despite it absorbing additional labour needs. Tentatively, these reasons
could include: (i) the additional labour has added relatively low economic value, and (ii) the overall
26
productivity and competitiveness of the services sector has decreased.
In addition, as noted above, agrarian skills are not easily transferable across sectors; farmers
cannot simply switch from agriculture to the services sector if relative labour demand increases
for services, unless they have the opportunities to equip themselves with new marketskills. So
while the demand for labour may have increased in the services sector, the figures reflect that the
additional labour may have contributed little in way of economic value over time – suggesting
that the labour absorbed lacked the skills to expand growth in services. This underscores the
much-discussed mismatch between the skills required by a modernizing economy and the skills
currently on offer in the labour market.
On balance, Bhutan seems to be following the standard development trajectory, barring the
above mentioned anomaly vis-à-vis the services sector. As the country develops, the importance
of the secondary and tertiary sectors (industry and services) is expected to increase, while that of
agriculture is likely to diminish further.
2. 3. 3. The relatively capital-intensive nature of growth
Bhutan‘s high economic growth rate of close to 8 percent on average during the past couple
of decades should typically be enough to absorb the increased labour force. However, with the
changing structure of the economy, growth has been relatively capital-intensive rather than
labour-absorbing. That is, for each percentage-point increase in the growth rate, the relative
increase in employment (or reduction in unemployment) is less when growth is capital-intensive
as compared with growth that is labour-intensive. At the same time, construction, infrastructure
building and hydropower projects have tended to rely on foreign labour rather than local labour.
In addition, agriculture, which is traditionally seen as labour-intensive, has witnessed both reduced
growth and an overall decline in its share of total GDP. Thus, it has not absorbed labour to the
extent one would have expected.
2. 3. 4. Changing skills requirements in times of economic transition
There are a few issues to be wary of during the transition phase – from relying on the primary
sector of the economy to being more dependent on the secondary and tertiary sectors – that
have direct implications for labour demand. It is important to note again that skills are generally
non-transferable across sectors. This has implications in the context of Bhutan: With the change in
the structure of the economy, there is a commensurate shift in the type of labour demanded, from
relatively unskilled to skilled.
Given the development experience of East Asian economies, it generally takes the labour market
longer to adjust to meet the specific demands of the changing economy; that is, on most occasions
the labour market takes time to adjust unless it anticipates the pace and sequence of the changing
structure of the economy to plan accordingly. Therefore, while agriculture remains an important
sector and a major employer, it is important that there is a continued effort and focus on skills
development to meet the demand of the changing economy (see Box 1 for the example of the
Korean case). This seems to be the path pursued by the RGOB as laid out in its New Economic
Development Policy (2010); however, to make the transition smoother, more extensive planning,
prioritization and coordination will be useful.
27
2. 3. 5. Exploring opportunities despite a narrow economic base Limited employment choices also arise due to the small size of the economy. Given Bhutan‘s narrow
economic base, small land area and geographical constraints of being landlocked, and the small
domestic market, opportunities for profitable enterprises are limited. So, on the one hand, Bhutan
remains relatively isolated, with few foreign embassies/offices in Thimphu; few flights occur in and
out of the country, and all trade passes through India.
Having said this, it is worth noting the positive steps the RGoB has taken in recent years to
try to position the economy as attractive to foreign investment. As highlighted in an UNCTAD
investment guide to Bhutan, ―The legal framework was completely revised in 2010, and the
Government continues to push for economic diversification, regulatory reform and administrative
simplification.‖21 Steps to liberalize include (i) full foreign ownership in certain sectors; and (ii)
private investment and public-private partnerships in a range of sectors, including infrastructure,
tourism, information and communications technology (ICT), education, and agriculture.
Foreign Direct Investment (FDI) levels in the country have been quite low historically. However,
they have risen sharply in the past few years. In 2000, FDI stocks stood at just US$4 million but
had soared to US$160 million in 2010. FDI inflows averaged about US$1 million per year between
1995 and 2004; by 2009, they had reached US$15 million. FDI is not only increasing in quantity, but
also, more notably, in diversity: More investors are pursing interests in manufacturing, industrial
processing and non-tourism services (UNCTAD 2012).
Given that many of these changes are ongoing, the true impact on the broader economy is likely to
be felt only in the medium term. There is scope for Bhutan to align its domestic economy to pursue
trade opportunities within the sub-region through SAARC‘s South Asia Free Trade Agreement
(SAFTA), under which most products should be traded with zero customs duties by the end of
2016. Bhutan can only benefit from greater external engagement, given again that the size of the
domestic market is quite small. In addition, beyond trade in goods and electricity, Bhutan should
position itself to tap into job opportunities beyond its borders, especially among its fast-growing
neighbours.
2. 3. 6. Little attention to opportunities in agriculture
In the more developed economies, agriculture tends to become more productive over time.
However, in Bhutan public expenditure on agricultural development as a percentage of total
expenditures has been gradually in decline from the Fifth Plan (1981-86) onward. This figure stood
at 9 percent of total expenditures in the Fifth Plan, and had decreased to 3.1 percent during the
Eighth Plan (1997–2002). The share increased to 6.5 percent in the Ninth Plan (2002-2007), but
experienced a slight decrease, to 5.5 percent, in the 10th Plan (2008-2013). Agricultural growth has
fallen almost continuously since 2001, from 5 percent, reaching 0.4 percent in 2007 (Kakra and
Bhattacharjee 2009: 75).
A need exists for smart investments in agriculture to make the sector a more productive enterprise.
Both the Government and the private sector could play a role in this endeavour, including through
adopting new technologies. At the same time, scope exists for improved marketing, including
branding of a wider spectrum of produce for export. This will require an organized effort, including
21 UNCTAD 2012, p. 2.
28
the reassessment of entire value chains.
Currently, agriculture is marked by limited cultivable area, fragmented land,22 low infrastructure,
low market accessibility, negative trade balance, and low productivity due to various external
factors.23 The 10th Plan has made headway in overcoming some of these constraints, and the
11th Plan will continue to pursue these efforts. Although Bhutan has the potential to leverage its
geographical advantage to produce off-season vegetables for the Indian market, the inefficiency
across the value chain makes agriculture a low-yielding business for the farmer (Kakra and
Bhattacharjee 2009: 75).
An important policy objective for the RGOB is food self-sufficiency through increased focus on
high-value products for export; at the same time, it expects to import low-value cereals from
neighbouring countries (i.e., India). While this policy may seem ideal in principle, it loses on equity
grounds by failing to provide adequate food security to the poor and vulnerable groups across
Bhutan.
2. 3. 7. Limited leveraging of employment potential in travel and tourism
Tourism and travel-related services can be a growing source of employment. In 2010, a conservative
estimate by Tourism Council of Bhutan (TCB) for total sector revenues was US$89.69 million. With
annual real GDP of US$1.483 billion that year, tourism therefore represents a large proportion
of total GDP.24 Nearly 90 percent of tourists are cultural tourists, visiting mainly the western part
of the country, which is more accessible. Tourism has historically been seasonal, although recent
efforts by the Government indicate a push to pursue year-round tourism. The sector tends to be
employment-rich and has considerable scope for expansion.
According to the TCB, the country received 65,746 ―high-end‖ tourists in 2011, its highest-ever
number, representing a year-on-year increase of about 57 percent. Bhutan also welcomed 35,077
other tourists who travelled by land into the country and stayed in relatively less expensive tourist
accommodations. Visitors from European countries no longer dominate Bhutanese tourism; during
2011, visitors from the Asia-Pacific region were the leading group, comprising 40.4 percent of
arrivals, followed by visitors from Europe (37.1 percent) and North America (20.3 percent).
The record inflows of tourists in 2011 also came despite the fact that the Government raised
tourism tariffs during the year. The daily tariff was raised from US$200 to US$250 for the peak
season in January 2012, while in July 2011 the daily rate for the rest of the year had already been
raised from US$165 to US$200. The TCB hopes to raise the number of high-end tourists visiting
Bhutan in 2012 still further, to 100,000.
To increase the sector‘s contribution not only to GDP (US$215 million in 2012) but also to
employment potential, the RGOB may wish to consider other options like diversified services and
increase in the length of stay of tourists (EIU 2011). In addition, apart from the sector‘s contribution
22 The Inheritance Act allows this fragmentation, which is seen as a main cause of the inability to develop farmland
productively. 23 A major problem in almost all 20 dzongkhags arises from crop damage by wildlife. 24 However, the DTIS (2012) report states that calculating the real contribution of tourism to GDP is complex and challenging
in any country. The TCB is looking into improving this calculation method by capturing both total income from the sector
and benefits to the wider economy (RGOB 2012a).
29
to GDP, policies for the sector should be encouraged to aim to maximize linkages with other
sectors for spread effects for employment. Further developing the tourism sector to absorb unmet
tourism demand, as well as exploring and expanding to other parts of the country with proper
capital investment, will improve the scope for employment. For example, entrepreneurship and
private enterprise can be encouraged for high-value-added niche services with strong direct and
indirect employment and self-employment effects.
2. 3. 8. Local employment low in the energy sector
While the contribution of ―electricity and water‖ to GDP has increased from 10 percent in 2001 to
17.6 percent in 2010 (Table 2.10), this sector accounted for just 2 percent of total employment in
2011/2012, suggesting that sectoral growth has mainly been driven either by (i) hiring of foreign
labour or (ii) by being relatively capital- intensive compared to other sectors. The lack of local
employment demand in the sector also could be due to a mix of these two main drivers25.The
Government‘s objective of developing new hydropower projects to increase capacity sevenfold by
the year 2020 could also be viewed as an opportunity to increase local labour demand in the sector
by ensuring that local workers develop the skills and knowledge to manage and operate projects.
Moreover, there exists considerable scope to pursue both backward and forward linkages with the
hydropower sector, including in transportation. In addition, electricity is a resource necessary for
manufacturing, and also for certain forms of agricultural production. Therefore, the Government
may wish to further explore positive spinoffs vis-à-vis local economic activity.
Overall, as noted above, there are a significant number of foreign workers in Bhutan. According
to a 2007 RGOB report (2007b) 18,220 foreign workers were employed in the country that year;
by2009, this increased further to 26,082 (RGOB 2009c). Even more recently, in February 2012,
the Task Force Report on Balance of Payments with India and the Rupee Shortage noted 51,616
Indian workers in Bhutan, out of which 30,249 worked in hydropower projects; others were mainly
construction workers (RGOB 2012d). These figures far exceed the current number of unemployed
in the country, which is given as 6,904 (RGOB 2012b).
25 While most high-skilled jobs in the country are not ordinarily open to foreign workers, there is a considerable presence of
workers from India in the construction and hydropower and electricity sectors.
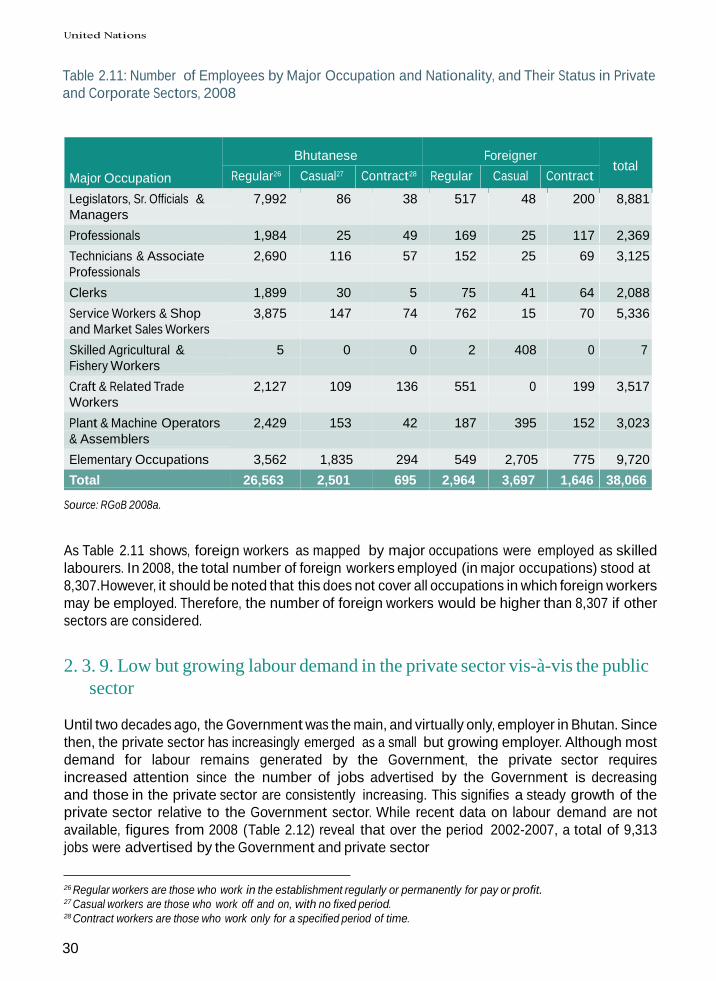
30
Table 2.11: Number of Employees by Major Occupation and Nationality, and Their Status in Private
and Corporate Sectors, 2008
Major Occupation
Bhutanese Foreigner
Regular26 Casual27 Contract28 Regular Casual Contract
total
Legislators, Sr. Officials &
Managers
7,992 86 38 517 48 200 8,881
Professionals 1,984 25 49 169 25 117 2,369
Technicians & Associate
Professionals
2,690 116 57 152 25 69 3,125
Clerks 1,899 30 5 75 41 64 2,088
Service Workers & Shop
and Market Sales Workers
3,875 147 74 762 15 70 5,336
Skilled Agricultural &
Fishery Workers
5 0 0 2 408 0 7
Craft & Related Trade
Workers
2,127 109 136 551 0 199 3,517
Plant & Machine Operators
& Assemblers
2,429 153 42 187 395 152 3,023
Elementary Occupations 3,562 1,835 294 549 2,705 775 9,720
Total 26,563 2,501 695 2,964 3,697 1,646 38,066
Source: RGoB 2008a.
As Table 2.11 shows, foreign workers as mapped by major occupations were employed as skilled
labourers. In 2008, the total number of foreign workers employed (in major occupations) stood at
8,307.However, it should be noted that this does not cover all occupations in which foreign workers
may be employed. Therefore, the number of foreign workers would be higher than 8,307 if other
sectors are considered.
2. 3. 9. Low but growing labour demand in the private sector vis-à-vis the public
sector
Until two decades ago, the Government was the main, and virtually only, employer in Bhutan. Since
then, the private sector has increasingly emerged as a small but growing employer. Although most
demand for labour remains generated by the Government, the private sector requires
increased attention since the number of jobs advertised by the Government is decreasing
and those in the private sector are consistently increasing. This signifies a steady growth of the
private sector relative to the Government sector. While recent data on labour demand are not
available, figures from 2008 (Table 2.12) reveal that over the period 2002-2007, a total of 9,313
jobs were advertised by the Government and private sector
26 Regular workers are those who work in the establishment regularly or permanently for pay or profit. 27 Casual workers are those who work off and on, with no fixed period. 28 Contract workers are those who work only for a specified period of time.
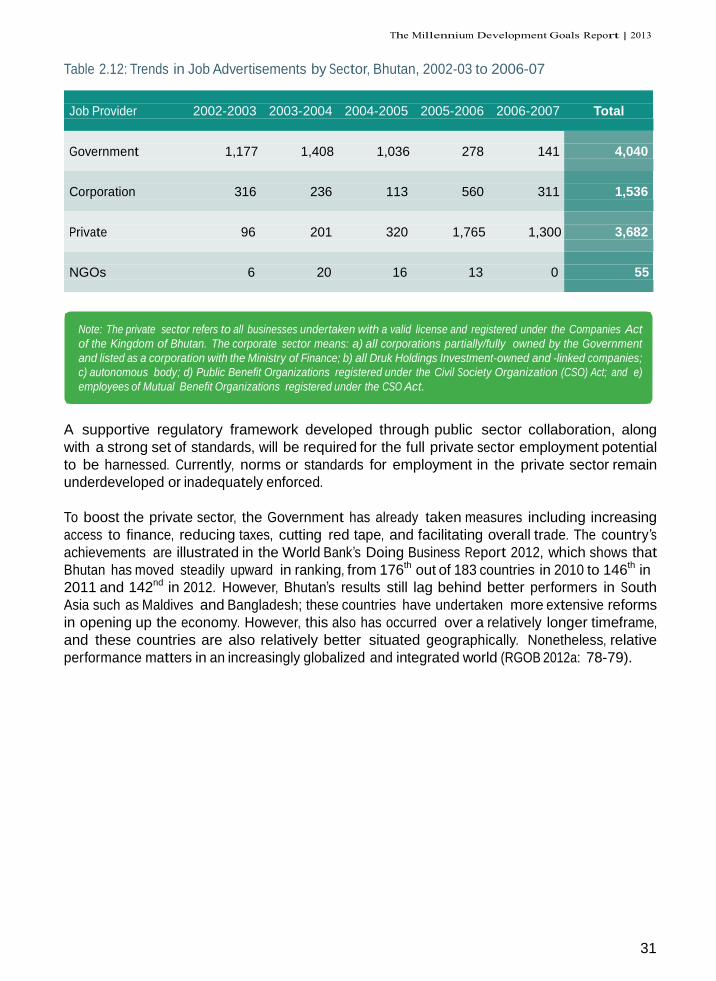
31
Table 2.12: Trends in Job Advertisements by Sector, Bhutan, 2002-03 to 2006-07
Job Provider 2002-2003 2003-2004 2004-2005 2005-2006 2006-2007 Total
Government 1,177 1,408 1,036 278 141
4,040
Corporation 316 236 113 560 311
1,536
Private 96 201 320 1,765 1,300
3,682
NGOs 6 20 16 13 0
55
Note: The private sector refers to all businesses undertaken with a valid license and registered under the Companies Act
of the Kingdom of Bhutan. The corporate sector means: a) all corporations partially/fully owned by the Government
and listed as a corporation with the Ministry of Finance; b) all Druk Holdings Investment-owned and -linked companies;
c) autonomous body; d) Public Benefit Organizations registered under the Civil Society Organization (CSO) Act; and e)
employees of Mutual Benefit Organizations registered under the CSO Act.
A supportive regulatory framework developed through public sector collaboration, along
with a strong set of standards, will be required for the full private sector employment potential
to be harnessed. Currently, norms or standards for employment in the private sector remain
underdeveloped or inadequately enforced.
To boost the private sector, the Government has already taken measures including increasing
access to finance, reducing taxes, cutting red tape, and facilitating overall trade. The country‘s
achievements are illustrated in the World Bank‘s Doing Business Report 2012, which shows that
Bhutan has moved steadily upward in ranking, from 176th out of 183 countries in 2010 to 146th in
2011 and 142nd in 2012. However, Bhutan‘s results still lag behind better performers in South
Asia such as Maldives and Bangladesh; these countries have undertaken more extensive reforms
in opening up the economy. However, this also has occurred over a relatively longer timeframe,
and these countries are also relatively better situated geographically. Nonetheless, relative
performance matters in an increasingly globalized and integrated world (RGOB 2012a: 78-79).
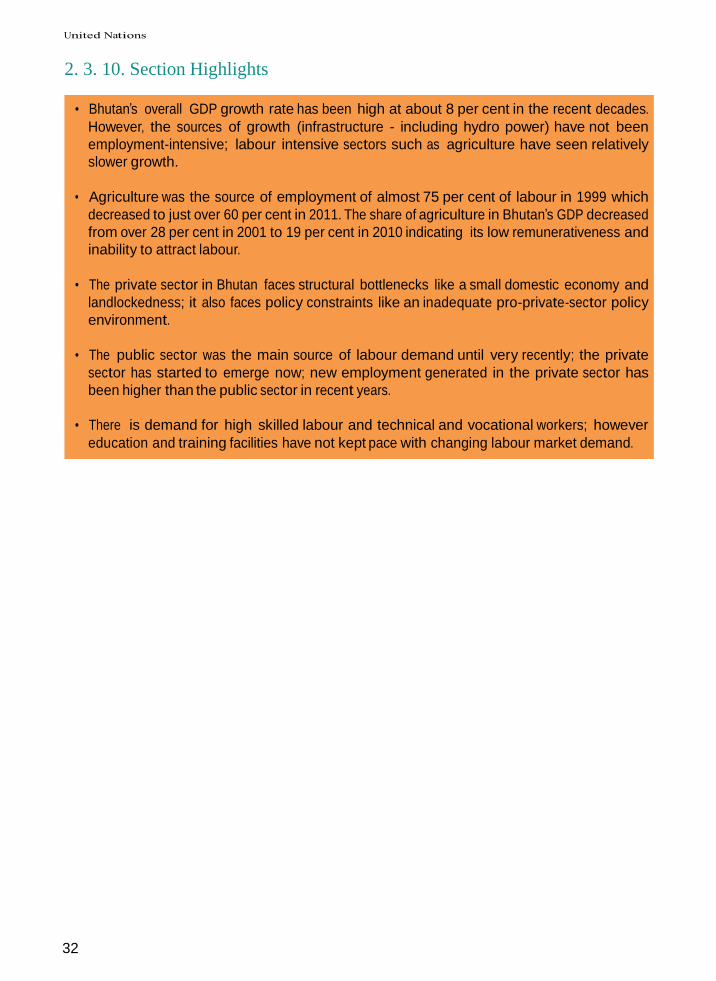
32
2. 3. 10. Section Highlights
• Bhutan‘s overall GDP growth rate has been high at about 8 per cent in the recent decades.
However, the sources of growth (infrastructure - including hydro power) have not been
employment-intensive; labour intensive sectors such as agriculture have seen relatively
slower growth.
• Agriculture was the source of employment of almost 75 per cent of labour in 1999 which
decreased to just over 60 per cent in 2011. The share of agriculture in Bhutan‘s GDP decreased
from over 28 per cent in 2001 to 19 per cent in 2010 indicating its low remunerativeness and
inability to attract labour.
• The private sector in Bhutan faces structural bottlenecks like a small domestic economy and
landlockedness; it also faces policy constraints like an inadequate pro-private-sector policy
environment.
• The public sector was the main source of labour demand until very recently; the private
sector has started to emerge now; new employment generated in the private sector has
been higher than the public sector in recent years.
• There is demand for high skilled labour and technical and vocational workers; however
education and training facilities have not kept pace with changing labour market demand.
33
CHAPTER 3:
Strategic Interventions29
3. 1. Intervention 1:
Enhance the education and training system in a way that is cognizant
of demands in the job market
As highlighted in various Government documents, the quality of schooling and TVET remains a
cause of concern in Bhutan,30 both with regard to labour supply as well as to labour demand. This
affects both the employability of youth in the labour market and the quality of life as a whole, as
individuals fail to find decent employment in the job market.
While several policies and activities are in place to improve the quality of education and training
programmes, implementation of these activities requires further strengthening. The National
Youth Policy (Department of Youth and Sports, Ministry of Education, RGOB 2010) outlined several
areas of concern, including youth employment, and as such proposed interventions under 24
strategic objectives, several of which were directed at increasing youth employment through
improving the education and training system. These include:
• Integrate vocational education into the school curriculum from Class IX onward
• Offer non-formal education at flexible times to accommodate out-of-school young people
• Provide young people with accurate information about possible choices, needs and constraints
that they may face when making choices in life and in the workplace
• Strengthen and expand a work experience/shadowing programme for all students in Class X
• Develop internship programmes for students in tertiary education
The National Youth Policy also included specific objectives on improving the quality and relevance
of the educational experience (RGOB 2010e). Policies recommended toward this end were:
• Revisit the existing curriculum to improve the overall quality of education
• Attract high-performing tertiary and Class XII graduates into the teaching profession
• Provide ongoing teacher professional development
• Through non-formal education initiatives, increase the access of all young people not in
formal education to further education
The Tertiary Education Policy, meanwhile, seeks to produce graduates with core life skills, including
leadership abilities, underpinned by the values espoused by the development philosophy of Gross
National Happiness (GNH). It also aims to provide a more uniform approach to school performance
management and self-assessment (RGOB, 2010d). Some of these strategies are coherent with those
recommended by the National Youth Policy. Others, however, seemed to have been developed
independently. Interventions deemed relevant toward ―enhancing the education and training
system in a way that is cognizant of demands in the job market‖ were:
29 Interventions in bold indicate the interventions selected through a consultative process. 30 Education without compromise: Education Sector Review Commission Report 2008, RGoB.
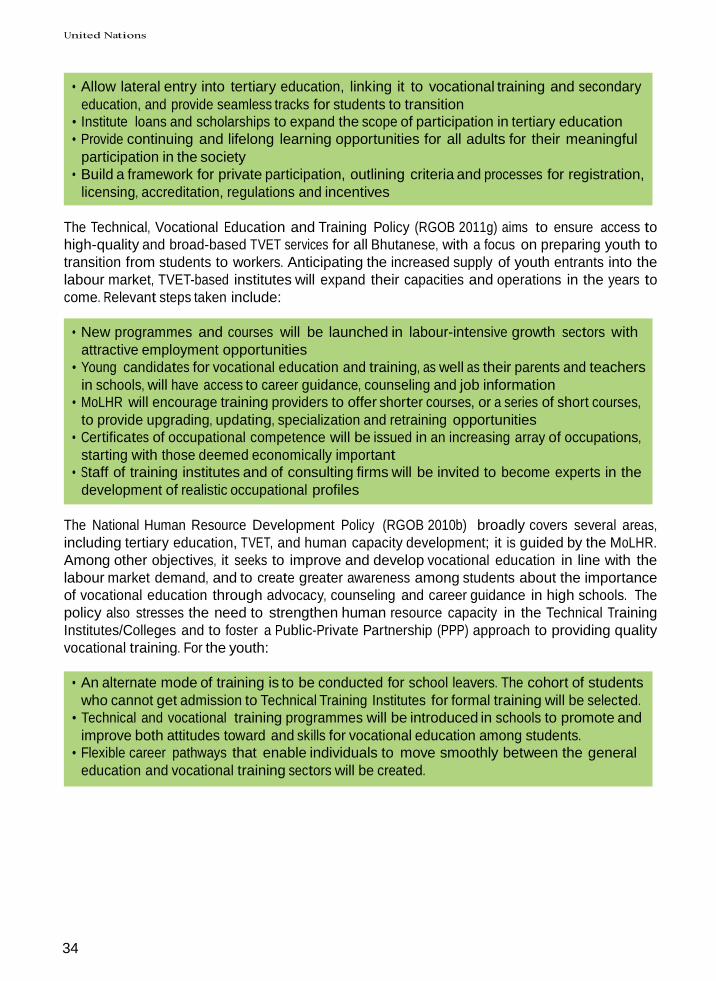
34
• Allow lateral entry into tertiary education, linking it to vocational training and secondary
education, and provide seamless tracks for students to transition
• Institute loans and scholarships to expand the scope of participation in tertiary education
• Provide continuing and lifelong learning opportunities for all adults for their meaningful
participation in the society
• Build a framework for private participation, outlining criteria and processes for registration,
licensing, accreditation, regulations and incentives
The Technical, Vocational Education and Training Policy (RGOB 2011g) aims to ensure access to
high-quality and broad-based TVET services for all Bhutanese, with a focus on preparing youth to
transition from students to workers. Anticipating the increased supply of youth entrants into the
labour market, TVET-based institutes will expand their capacities and operations in the years to
come. Relevant steps taken include:
• New programmes and courses will be launched in labour-intensive growth sectors with
attractive employment opportunities
• Young candidates for vocational education and training, as well as their parents and teachers
in schools, will have access to career guidance, counseling and job information
• MoLHR will encourage training providers to offer shorter courses, or a series of short courses,
to provide upgrading, updating, specialization and retraining opportunities
• Certificates of occupational competence will be issued in an increasing array of occupations,
starting with those deemed economically important
• Staff of training institutes and of consulting firms will be invited to become experts in the
development of realistic occupational profiles
The National Human Resource Development Policy (RGOB 2010b) broadly covers several areas,
including tertiary education, TVET, and human capacity development; it is guided by the MoLHR.
Among other objectives, it seeks to improve and develop vocational education in line with the
labour market demand, and to create greater awareness among students about the importance
of vocational education through advocacy, counseling and career guidance in high schools. The
policy also stresses the need to strengthen human resource capacity in the Technical Training
Institutes/Colleges and to foster a Public-Private Partnership (PPP) approach to providing quality
vocational training. For the youth:
• An alternate mode of training is to be conducted for school leavers. The cohort of students
who cannot get admission to Technical Training Institutes for formal training will be selected.
• Technical and vocational training programmes will be introduced in schools to promote and
improve both attitudes toward and skills for vocational education among students.
• Flexible career pathways that enable individuals to move smoothly between the general
education and vocational training sectors will be created.
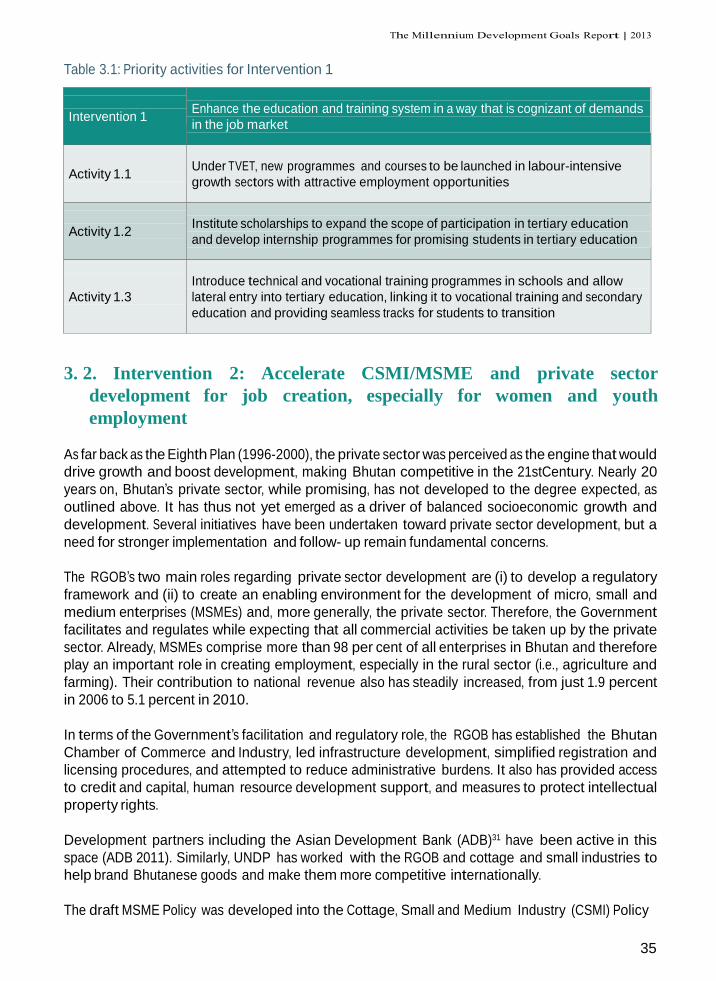
35
Table 3.1: Priority activities for Intervention 1
Intervention 1
Enhance the education and training system in a way that is cognizant of demands
in the job market
Activity 1.1
Under TVET, new programmes and courses to be launched in labour-intensive
growth sectors with attractive employment opportunities
Activity 1.2
Institute scholarships to expand the scope of participation in tertiary education
and develop internship programmes for promising students in tertiary education
Activity 1.3
Introduce technical and vocational training programmes in schools and allow
lateral entry into tertiary education, linking it to vocational training and secondary
education and providing seamless tracks for students to transition
3. 2. Intervention 2: Accelerate CSMI/MSME and private sector
development for job creation, especially for women and youth
employment
As far back as the Eighth Plan (1996-2000), the private sector was perceived as the engine that would
drive growth and boost development, making Bhutan competitive in the 21stCentury. Nearly 20
years on, Bhutan‘s private sector, while promising, has not developed to the degree expected, as
outlined above. It has thus not yet emerged as a driver of balanced socioeconomic growth and
development. Several initiatives have been undertaken toward private sector development, but a
need for stronger implementation and follow- up remain fundamental concerns.
The RGOB‘s two main roles regarding private sector development are (i) to develop a regulatory
framework and (ii) to create an enabling environment for the development of micro, small and
medium enterprises (MSMEs) and, more generally, the private sector. Therefore, the Government
facilitates and regulates while expecting that all commercial activities be taken up by the private
sector. Already, MSMEs comprise more than 98 per cent of all enterprises in Bhutan and therefore
play an important role in creating employment, especially in the rural sector (i.e., agriculture and
farming). Their contribution to national revenue also has steadily increased, from just 1.9 percent
in 2006 to 5.1 percent in 2010.
In terms of the Government‘s facilitation and regulatory role, the RGOB has established the Bhutan
Chamber of Commerce and Industry, led infrastructure development, simplified registration and
licensing procedures, and attempted to reduce administrative burdens. It also has provided access
to credit and capital, human resource development support, and measures to protect intellectual
property rights.
Development partners including the Asian Development Bank (ADB)31 have been active in this
space (ADB 2011). Similarly, UNDP has worked with the RGOB and cottage and small industries to
help brand Bhutanese goods and make them more competitive internationally.
The draft MSME Policy was developed into the Cottage, Small and Medium Industry (CSMI) Policy
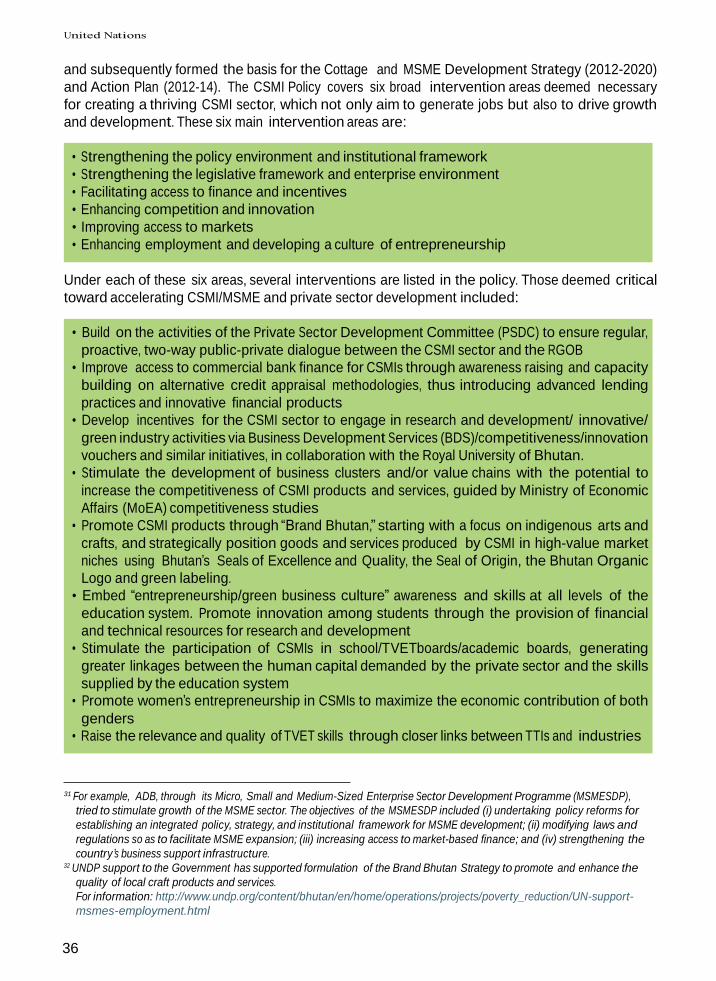
36
and subsequently formed the basis for the Cottage and MSME Development Strategy (2012-2020)
and Action Plan (2012-14). The CSMI Policy covers six broad intervention areas deemed necessary
for creating a thriving CSMI sector, which not only aim to generate jobs but also to drive growth
and development. These six main intervention areas are:
• Strengthening the policy environment and institutional framework
• Strengthening the legislative framework and enterprise environment
• Facilitating access to finance and incentives
• Enhancing competition and innovation
• Improving access to markets
• Enhancing employment and developing a culture of entrepreneurship
Under each of these six areas, several interventions are listed in the policy. Those deemed critical
toward accelerating CSMI/MSME and private sector development included:
• Build on the activities of the Private Sector Development Committee (PSDC) to ensure regular,
proactive, two-way public-private dialogue between the CSMI sector and the RGOB
• Improve access to commercial bank finance for CSMIs through awareness raising and capacity
building on alternative credit appraisal methodologies, thus introducing advanced lending
practices and innovative financial products
• Develop incentives for the CSMI sector to engage in research and development/ innovative/
green industry activities via Business Development Services (BDS)/competitiveness/innovation
vouchers and similar initiatives, in collaboration with the Royal University of Bhutan.
• Stimulate the development of business clusters and/or value chains with the potential to
increase the competitiveness of CSMI products and services, guided by Ministry of Economic
Affairs (MoEA) competitiveness studies
• Promote CSMI products through ―Brand Bhutan,‖ starting with a focus on indigenous arts and
crafts, and strategically position goods and services produced by CSMI in high-value market
niches using Bhutan‘s Seals of Excellence and Quality, the Seal of Origin, the Bhutan Organic
Logo and green labeling.
• Embed ―entrepreneurship/green business culture‖ awareness and skills at all levels of the
education system. Promote innovation among students through the provision of financial
and technical resources for research and development
• Stimulate the participation of CSMIs in school/TVETboards/academic boards, generating
greater linkages between the human capital demanded by the private sector and the skills
supplied by the education system
• Promote women‘s entrepreneurship in CSMIs to maximize the economic contribution of both
genders
• Raise the relevance and quality of TVET skills through closer links between TTIs and industries
31 For example, ADB, through its Micro, Small and Medium-Sized Enterprise Sector Development Programme (MSMESDP),
tried to stimulate growth of the MSME sector. The objectives of the MSMESDP included (i) undertaking policy reforms for
establishing an integrated policy, strategy, and institutional framework for MSME development; (ii) modifying laws and
regulations so as to facilitate MSME expansion; (iii) increasing access to market-based finance; and (iv) strengthening the
country’s business support infrastructure. 32 UNDP support to the Government has supported formulation of the Brand Bhutan Strategy to promote and enhance the
quality of local craft products and services.
For information: http://www.undp.org/content/bhutan/en/home/operations/projects/poverty_reduction/UN-support-
msmes-employment.html
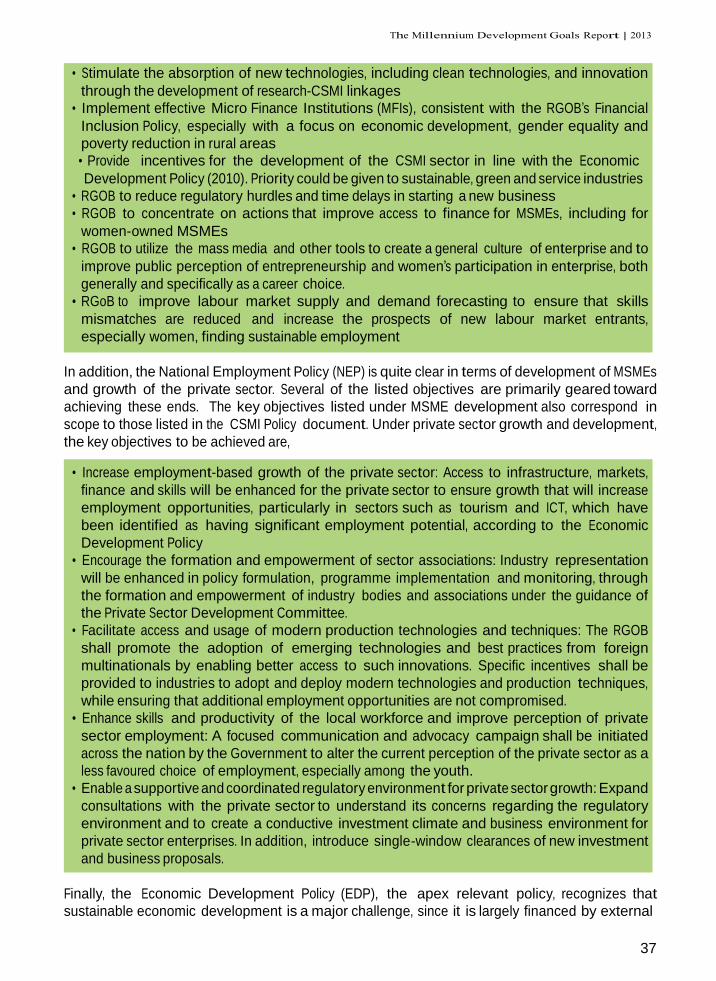
37
• Stimulate the absorption of new technologies, including clean technologies, and innovation
through the development of research-CSMI linkages
• Implement effective Micro Finance Institutions (MFIs), consistent with the RGOB‘s Financial
Inclusion Policy, especially with a focus on economic development, gender equality and
poverty reduction in rural areas
• Provide incentives for the development of the CSMI sector in line with the Economic
Development Policy (2010). Priority could be given to sustainable, green and service industries
• RGOB to reduce regulatory hurdles and time delays in starting a new business
• RGOB to concentrate on actions that improve access to finance for MSMEs, including for
women-owned MSMEs
• RGOB to utilize the mass media and other tools to create a general culture of enterprise and to
improve public perception of entrepreneurship and women‘s participation in enterprise, both
generally and specifically as a career choice.
• RGoB to improve labour market supply and demand forecasting to ensure that skills
mismatches are reduced and increase the prospects of new labour market entrants,
especially women, finding sustainable employment
In addition, the National Employment Policy (NEP) is quite clear in terms of development of MSMEs
and growth of the private sector. Several of the listed objectives are primarily geared toward
achieving these ends. The key objectives listed under MSME development also correspond in
scope to those listed in the CSMI Policy document. Under private sector growth and development,
the key objectives to be achieved are,
• Increase employment-based growth of the private sector: Access to infrastructure, markets,
finance and skills will be enhanced for the private sector to ensure growth that will increase
employment opportunities, particularly in sectors such as tourism and ICT, which have
been identified as having significant employment potential, according to the Economic
Development Policy
• Encourage the formation and empowerment of sector associations: Industry representation
will be enhanced in policy formulation, programme implementation and monitoring, through
the formation and empowerment of industry bodies and associations under the guidance of
the Private Sector Development Committee.
• Facilitate access and usage of modern production technologies and techniques: The RGOB
shall promote the adoption of emerging technologies and best practices from foreign
multinationals by enabling better access to such innovations. Specific incentives shall be
provided to industries to adopt and deploy modern technologies and production techniques,
while ensuring that additional employment opportunities are not compromised.
• Enhance skills and productivity of the local workforce and improve perception of private
sector employment: A focused communication and advocacy campaign shall be initiated
across the nation by the Government to alter the current perception of the private sector as a
less favoured choice of employment, especially among the youth.
• Enable a supportive and coordinated regulatory environment for private sector growth: Expand
consultations with the private sector to understand its concerns regarding the regulatory
environment and to create a conductive investment climate and business environment for
private sector enterprises. In addition, introduce single-window clearances of new investment
and business proposals.
Finally, the Economic Development Policy (EDP), the apex relevant policy, recognizes that
sustainable economic development is a major challenge, since it is largely financed by external
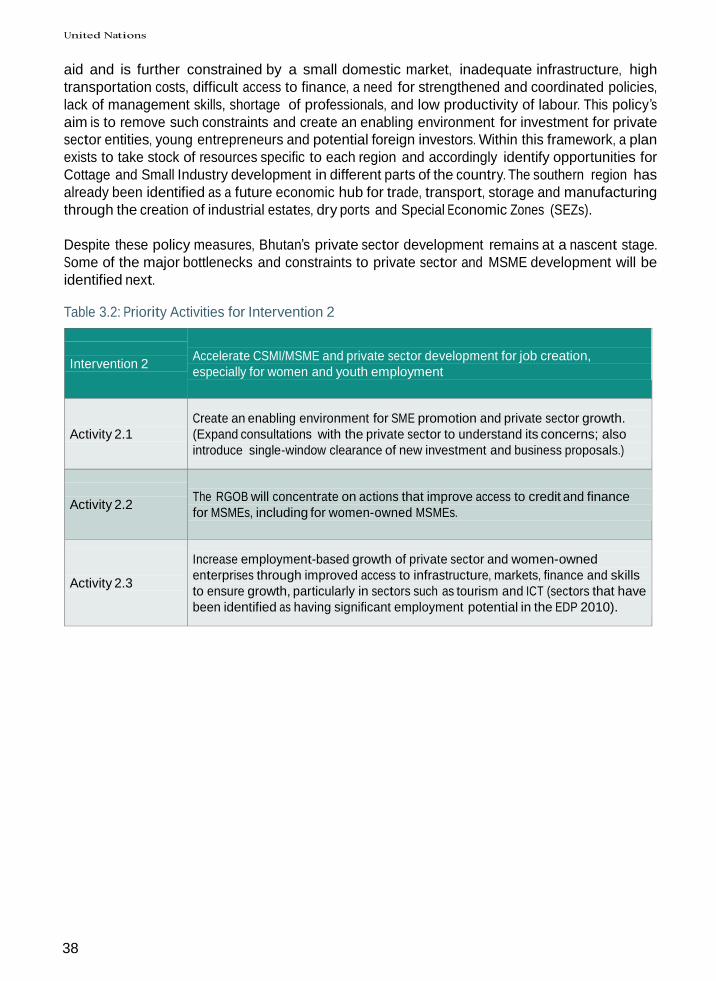
38
aid and is further constrained by a small domestic market, inadequate infrastructure, high
transportation costs, difficult access to finance, a need for strengthened and coordinated policies,
lack of management skills, shortage of professionals, and low productivity of labour. This policy‘s
aim is to remove such constraints and create an enabling environment for investment for private
sector entities, young entrepreneurs and potential foreign investors. Within this framework, a plan
exists to take stock of resources specific to each region and accordingly identify opportunities for
Cottage and Small Industry development in different parts of the country. The southern region has
already been identified as a future economic hub for trade, transport, storage and manufacturing
through the creation of industrial estates, dry ports and Special Economic Zones (SEZs).
Despite these policy measures, Bhutan‘s private sector development remains at a nascent stage.
Some of the major bottlenecks and constraints to private sector and MSME development will be
identified next.
Table 3.2: Priority Activities for Intervention 2
Intervention 2
Accelerate CSMI/MSME and private sector development for job creation,
especially for women and youth employment
Activity 2.1
Create an enabling environment for SME promotion and private sector growth.
(Expand consultations with the private sector to understand its concerns; also
introduce single-window clearance of new investment and business proposals.)
Activity 2.2
The RGOB will concentrate on actions that improve access to credit and finance
for MSMEs, including for women-owned MSMEs.
Activity 2.3
Increase employment-based growth of private sector and women-owned
enterprises through improved access to infrastructure, markets, finance and skills
to ensure growth, particularly in sectors such as tourism and ICT (sectors that have
been identified as having significant employment potential in the EDP 2010).
39
33
CHAPTER 4:
Bottleneck Analysis
he identification and prioritization of interventions and associated activities as well as the
bottlenecks that impede the successful implementation of these interventions and activities
was initially carried out at a bottleneck analysis workshop in Paro on 23-24 May 2012.
Subsequent meetings and consultations with the Government, experts and relevant stakeholders
further helped narrow the scope of prioritized interventions, associated activities, and bottlenecks
such that it cleared the way to develop specific solutions that were most likely to be effective in
addressing urban youth unemployment in the short term.
Following the MAF methodology, bottlenecks that impede the implementation of interventions
and associated activities were first identified. This was done in consultation with Government
personnel responsible for implementing policies, experts, development partners and relevant
stakeholders, including youth groups, entrepreneurs and the private sector. By observing the
various steps required to properly implement a specific intervention/activity, existing and potential
bottlenecks thus were pinpointed.
Based on wide consultations over time, and using good practices and evaluation documents, the
list of bottlenecks was further refined. Bottlenecks were kept on the list on the basis of whether
they were (i) feasible to be overcome (a solution exists in the short term) and whether doing so
(ii) would have a positive impact (contribute toward youth employment during the course of the
11thPlan). Both the degree of feasibility in overcoming the bottleneck in the short term, along
with the degree of impact it would have if the particular bottleneck were overcome, assisted
in prioritizing the bottlenecks.
Given that the elections of July 2013 ushered in a new government, it was crucial that the
previously agreed bottlenecks be put up for further discussion and validation. This exercise helped
refine most bottlenecks, including revision or replacement if needed. The rationale for revising a
bottleneck was either (i) the particular bottleneck was no longer valid, since it had been resolved,
or that (ii) there were current interventions/policies underway that aimed to tackle it. Therefore,
such bottlenecks were dropped by consensus.
In addition, evidence from policy and good-practices documents, as well as expert judgment, were
used in the prioritization of bottlenecks. For prioritized Interventions 1 and 2 and their associated
activities, the identified and prioritized bottlenecks appear in Tables 4.1 and 4.2.
33 The list of participants can be found in the Annex.
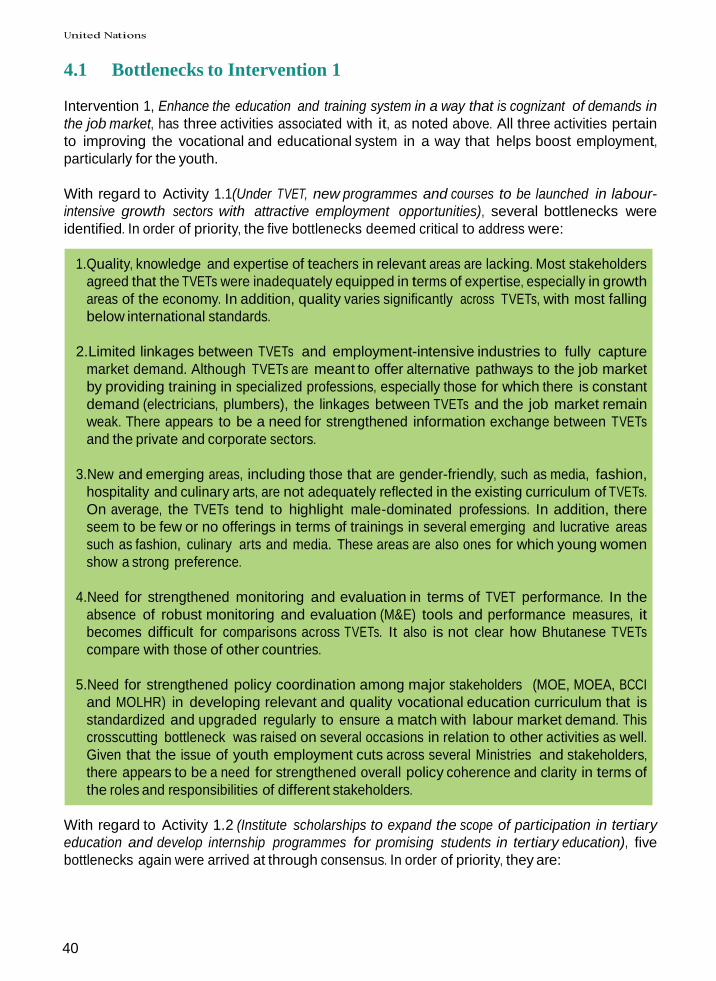
40
4.1 Bottlenecks to Intervention 1
Intervention 1, Enhance the education and training system in a way that is cognizant of demands in
the job market, has three activities associated with it, as noted above. All three activities pertain
to improving the vocational and educational system in a way that helps boost employment,
particularly for the youth.
With regard to Activity 1.1(Under TVET, new programmes and courses to be launched in labour-
intensive growth sectors with attractive employment opportunities), several bottlenecks were
identified. In order of priority, the five bottlenecks deemed critical to address were:
1.Quality, knowledge and expertise of teachers in relevant areas are lacking. Most stakeholders
agreed that the TVETs were inadequately equipped in terms of expertise, especially in growth
areas of the economy. In addition, quality varies significantly across TVETs, with most falling
below international standards.
2.Limited linkages between TVETs and employment-intensive industries to fully capture
market demand. Although TVETs are meant to offer alternative pathways to the job market
by providing training in specialized professions, especially those for which there is constant
demand (electricians, plumbers), the linkages between TVETs and the job market remain
weak. There appears to be a need for strengthened information exchange between TVETs
and the private and corporate sectors.
3.New and emerging areas, including those that are gender-friendly, such as media, fashion,
hospitality and culinary arts, are not adequately reflected in the existing curriculum of TVETs.
On average, the TVETs tend to highlight male-dominated professions. In addition, there
seem to be few or no offerings in terms of trainings in several emerging and lucrative areas
such as fashion, culinary arts and media. These areas are also ones for which young women
show a strong preference.
4.Need for strengthened monitoring and evaluation in terms of TVET performance. In the
absence of robust monitoring and evaluation (M&E) tools and performance measures, it
becomes difficult for comparisons across TVETs. It also is not clear how Bhutanese TVETs
compare with those of other countries.
5.Need for strengthened policy coordination among major stakeholders (MOE, MOEA, BCCI
and MOLHR) in developing relevant and quality vocational education curriculum that is
standardized and upgraded regularly to ensure a match with labour market demand. This
crosscutting bottleneck was raised on several occasions in relation to other activities as well.
Given that the issue of youth employment cuts across several Ministries and stakeholders,
there appears to be a need for strengthened overall policy coherence and clarity in terms of
the roles and responsibilities of different stakeholders.
With regard to Activity 1.2 (Institute scholarships to expand the scope of participation in tertiary
education and develop internship programmes for promising students in tertiary education), five
bottlenecks again were arrived at through consensus. In order of priority, they are:
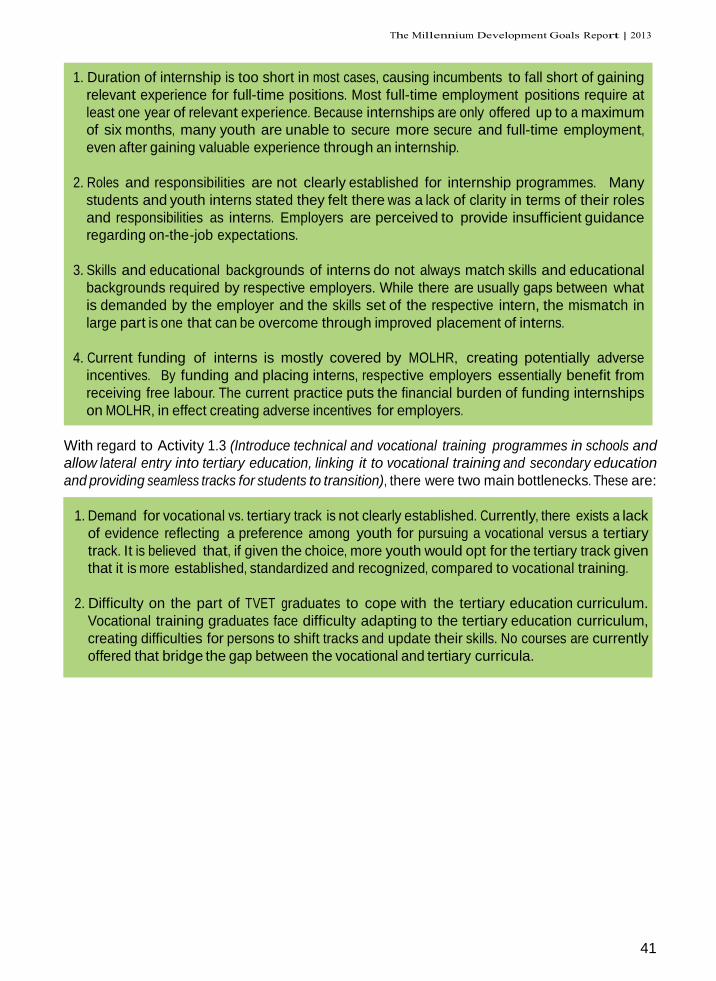
41
1. Duration of internship is too short in most cases, causing incumbents to fall short of gaining
relevant experience for full-time positions. Most full-time employment positions require at
least one year of relevant experience. Because internships are only offered up to a maximum
of six months, many youth are unable to secure more secure and full-time employment,
even after gaining valuable experience through an internship.
2. Roles and responsibilities are not clearly established for internship programmes. Many
students and youth interns stated they felt there was a lack of clarity in terms of their roles
and responsibilities as interns. Employers are perceived to provide insufficient guidance
regarding on-the-job expectations.
3. Skills and educational backgrounds of interns do not always match skills and educational
backgrounds required by respective employers. While there are usually gaps between what
is demanded by the employer and the skills set of the respective intern, the mismatch in
large part is one that can be overcome through improved placement of interns.
4. Current funding of interns is mostly covered by MOLHR, creating potentially adverse
incentives. By funding and placing interns, respective employers essentially benefit from
receiving free labour. The current practice puts the financial burden of funding internships
on MOLHR, in effect creating adverse incentives for employers.
With regard to Activity 1.3 (Introduce technical and vocational training programmes in schools and
allow lateral entry into tertiary education, linking it to vocational training and secondary education
and providing seamless tracks for students to transition), there were two main bottlenecks. These are:
1. Demand for vocational vs. tertiary track is not clearly established. Currently, there exists a lack
of evidence reflecting a preference among youth for pursuing a vocational versus a tertiary
track. It is believed that, if given the choice, more youth would opt for the tertiary track given
that it is more established, standardized and recognized, compared to vocational training.
2. Difficulty on the part of TVET graduates to cope with the tertiary education curriculum.
Vocational training graduates face difficulty adapting to the tertiary education curriculum,
creating difficulties for persons to shift tracks and update their skills. No courses are currently
offered that bridge the gap between the vocational and tertiary curricula.
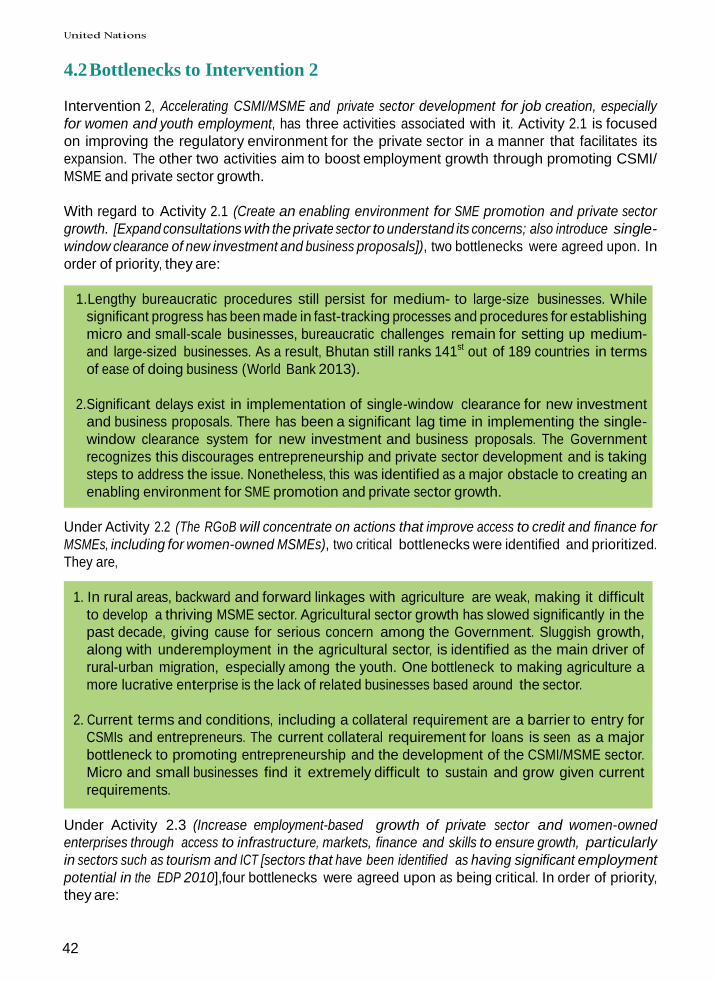
42
4.2 Bottlenecks to Intervention 2
Intervention 2, Accelerating CSMI/MSME and private sector development for job creation, especially
for women and youth employment, has three activities associated with it. Activity 2.1 is focused
on improving the regulatory environment for the private sector in a manner that facilitates its
expansion. The other two activities aim to boost employment growth through promoting CSMI/
MSME and private sector growth.
With regard to Activity 2.1 (Create an enabling environment for SME promotion and private sector
growth. [Expand consultations with the private sector to understand its concerns; also introduce single-
window clearance of new investment and business proposals]), two bottlenecks were agreed upon. In
order of priority, they are:
1.Lengthy bureaucratic procedures still persist for medium- to large-size businesses. While
significant progress has been made in fast-tracking processes and procedures for establishing
micro and small-scale businesses, bureaucratic challenges remain for setting up medium-
and large-sized businesses. As a result, Bhutan still ranks 141st out of 189 countries in terms
of ease of doing business (World Bank 2013).
2.Significant delays exist in implementation of single-window clearance for new investment
and business proposals. There has been a significant lag time in implementing the single-
window clearance system for new investment and business proposals. The Government
recognizes this discourages entrepreneurship and private sector development and is taking
steps to address the issue. Nonetheless, this was identified as a major obstacle to creating an
enabling environment for SME promotion and private sector growth.
Under Activity 2.2 (The RGoB will concentrate on actions that improve access to credit and finance for
MSMEs, including for women-owned MSMEs), two critical bottlenecks were identified and prioritized.
They are,
1. In rural areas, backward and forward linkages with agriculture are weak, making it difficult
to develop a thriving MSME sector. Agricultural sector growth has slowed significantly in the
past decade, giving cause for serious concern among the Government. Sluggish growth,
along with underemployment in the agricultural sector, is identified as the main driver of
rural-urban migration, especially among the youth. One bottleneck to making agriculture a
more lucrative enterprise is the lack of related businesses based around the sector.
2. Current terms and conditions, including a collateral requirement are a barrier to entry for
CSMIs and entrepreneurs. The current collateral requirement for loans is seen as a major
bottleneck to promoting entrepreneurship and the development of the CSMI/MSME sector.
Micro and small businesses find it extremely difficult to sustain and grow given current
requirements.
Under Activity 2.3 (Increase employment-based growth of private sector and women-owned
enterprises through access to infrastructure, markets, finance and skills to ensure growth, particularly
in sectors such as tourism and ICT [sectors that have been identified as having significant employment
potential in the EDP 2010],four bottlenecks were agreed upon as being critical. In order of priority,
they are:
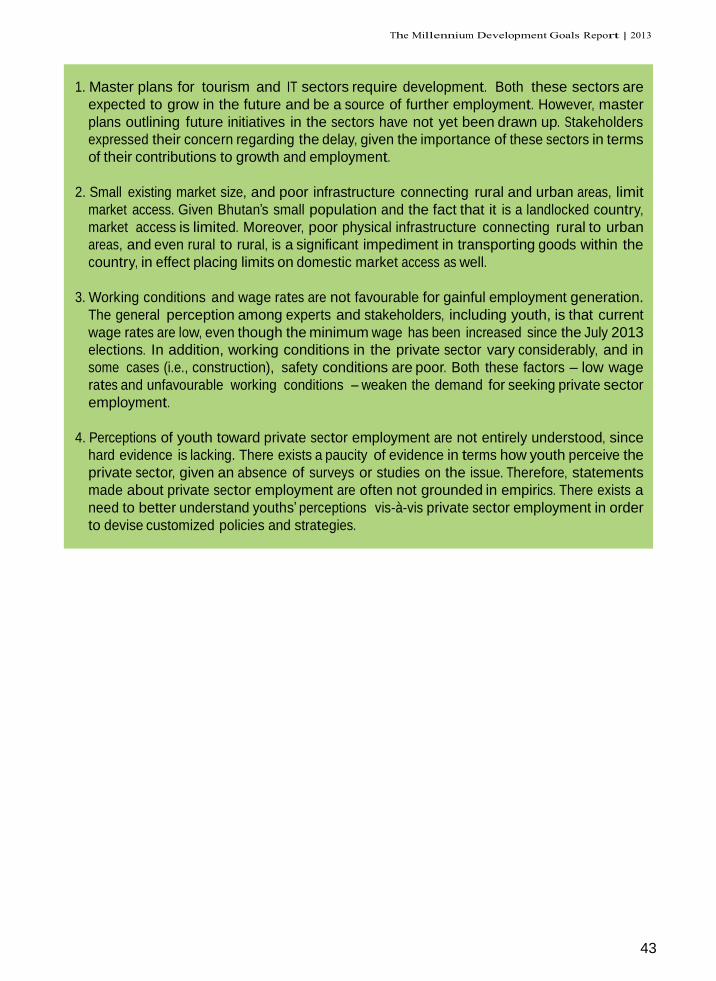
43
1. Master plans for tourism and IT sectors require development. Both these sectors are
expected to grow in the future and be a source of further employment. However, master
plans outlining future initiatives in the sectors have not yet been drawn up. Stakeholders
expressed their concern regarding the delay, given the importance of these sectors in terms
of their contributions to growth and employment.
2. Small existing market size, and poor infrastructure connecting rural and urban areas, limit
market access. Given Bhutan‘s small population and the fact that it is a landlocked country,
market access is limited. Moreover, poor physical infrastructure connecting rural to urban
areas, and even rural to rural, is a significant impediment in transporting goods within the
country, in effect placing limits on domestic market access as well.
3. Working conditions and wage rates are not favourable for gainful employment generation.
The general perception among experts and stakeholders, including youth, is that current
wage rates are low, even though the minimum wage has been increased since the July 2013
elections. In addition, working conditions in the private sector vary considerably, and in
some cases (i.e., construction), safety conditions are poor. Both these factors – low wage
rates and unfavourable working conditions – weaken the demand for seeking private sector
employment.
4. Perceptions of youth toward private sector employment are not entirely understood, since
hard evidence is lacking. There exists a paucity of evidence in terms how youth perceive the
private sector, given an absence of surveys or studies on the issue. Therefore, statements
made about private sector employment are often not grounded in empirics. There exists a
need to better understand youths‘ perceptions vis-à-vis private sector employment in order
to devise customized policies and strategies.
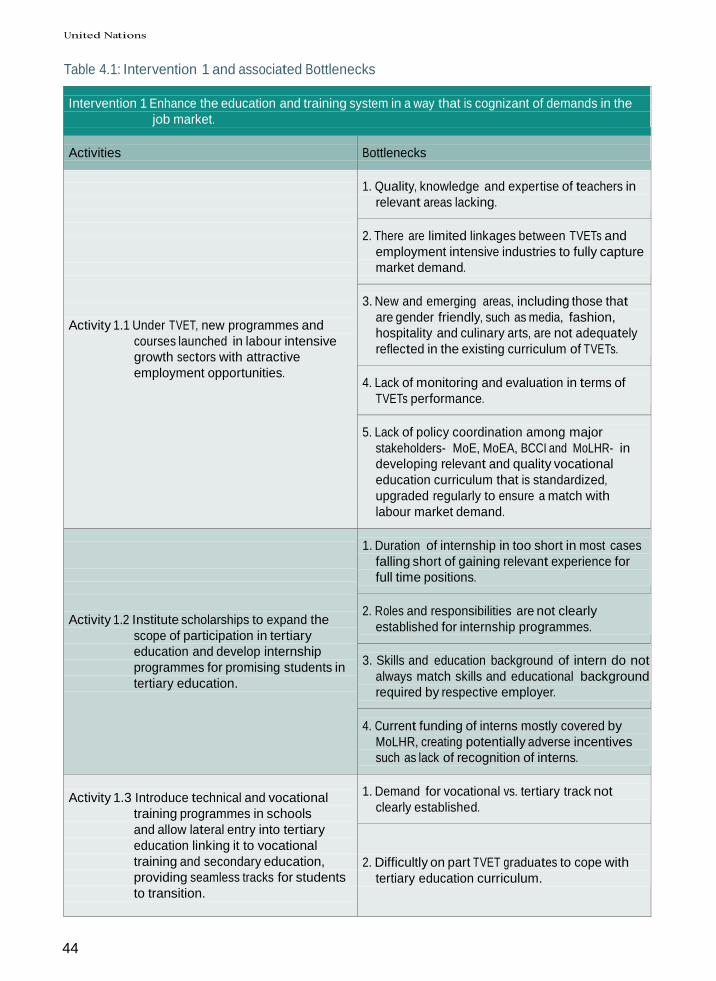
44
Table 4.1: Intervention 1 and associated Bottlenecks
Intervention 1 Enhance the education and training system in a way that is cognizant of demands in the
job market.
Activities
Bottlenecks
Activity 1.1 Under TVET, new programmes and
courses launched in labour intensive
growth sectors with attractive
employment opportunities.
1. Quality, knowledge and expertise of teachers in
relevant areas lacking.
2. There are limited linkages between TVETs and
employment intensive industries to fully capture
market demand.
3. New and emerging areas, including those that
are gender friendly, such as media, fashion,
hospitality and culinary arts, are not adequately
reflected in the existing curriculum of TVETs.
4. Lack of monitoring and evaluation in terms of
TVETs performance.
5. Lack of policy coordination among major
stakeholders- MoE, MoEA, BCCI and MoLHR- in
developing relevant and quality vocational
education curriculum that is standardized,
upgraded regularly to ensure a match with
labour market demand.
Activity 1.2 Institute scholarships to expand the
scope of participation in tertiary
education and develop internship
programmes for promising students in
tertiary education.
1. Duration of internship in too short in most cases
falling short of gaining relevant experience for
full time positions.
2. Roles and responsibilities are not clearly
established for internship programmes.
3. Skills and education background of intern do not
always match skills and educational background
required by respective employer.
4. Current funding of interns mostly covered by
MoLHR, creating potentially adverse incentives
such as lack of recognition of interns.
Activity 1.3 Introduce technical and vocational
training programmes in schools
and allow lateral entry into tertiary
education linking it to vocational
training and secondary education,
providing seamless tracks for students
to transition.
1. Demand for vocational vs. tertiary track not
clearly established.
2. Difficultly on part TVET graduates to cope with
tertiary education curriculum.
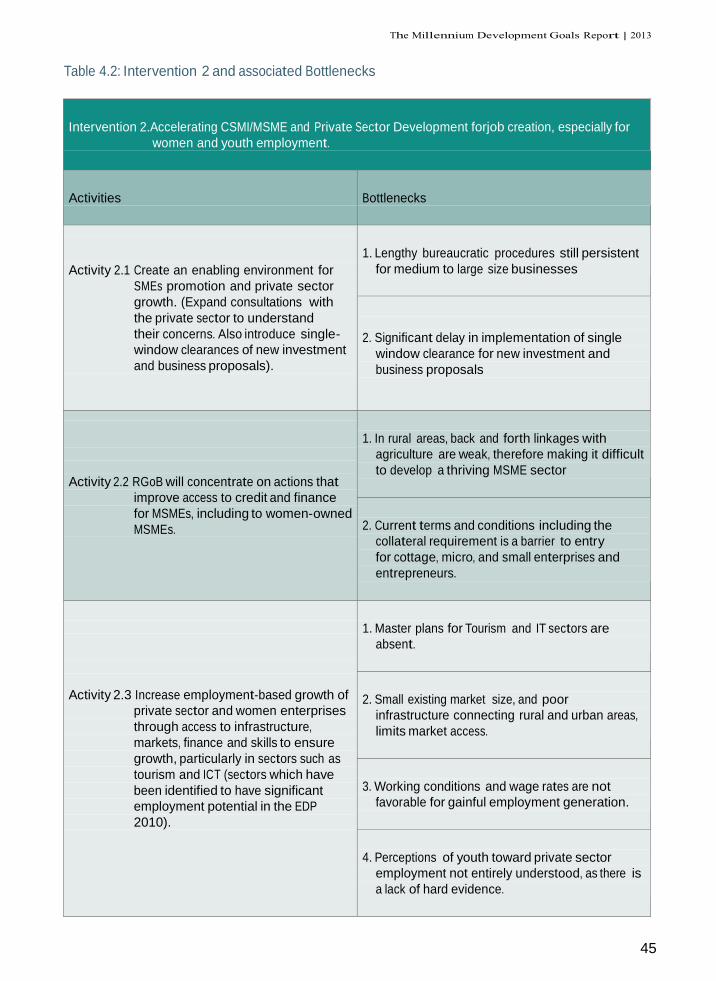
45
Table 4.2: Intervention 2 and associated Bottlenecks
Intervention 2.Accelerating CSMI/MSME and Private Sector Development forjob creation, especially for
women and youth employment.
Activities
Bottlenecks
Activity 2.1 Create an enabling environment for
SMEs promotion and private sector
growth. (Expand consultations with
the private sector to understand
their concerns. Also introduce single-
window clearances of new investment
and business proposals).
1. Lengthy bureaucratic procedures still persistent
for medium to large size businesses
2. Significant delay in implementation of single
window clearance for new investment and
business proposals
Activity 2.2 RGoB will concentrate on actions that
improve access to credit and finance
for MSMEs, including to women-owned
MSMEs.
1. In rural areas, back and forth linkages with
agriculture are weak, therefore making it difficult
to develop a thriving MSME sector
2. Current terms and conditions including the
collateral requirement is a barrier to entry
for cottage, micro, and small enterprises and
entrepreneurs.
Activity 2.3 Increase employment-based growth of
private sector and women enterprises
through access to infrastructure,
markets, finance and skills to ensure
growth, particularly in sectors such as
tourism and ICT (sectors which have
been identified to have significant
employment potential in the EDP
2010).
1. Master plans for Tourism and IT sectors are
absent.
2. Small existing market size, and poor
infrastructure connecting rural and urban areas,
limits market access.
3. Working conditions and wage rates are not
favorable for gainful employment generation.
4. Perceptions of youth toward private sector
employment not entirely understood, as there is
a lack of hard evidence.
46
CHAPTER 5:
Accelerating MDG progress:
Identifying Solutions
olutions to prioritized bottlenecks were arrived at through a consultative process and
proposed on the basis of their feasibility (sustainability, financing, and capacity to
implement the solution), as well as their potential impact in the short term.For the purposes
of the MAF for Bhutan, the timeframe over which a solution‘s impact is to be realized is bound
by the Government‘s 11thPlan. In addition, certain other factors were considered in identifying
solutions, including whether the solutions are sustainable from an environmental standpoint and
to what extent existing and new technologies can be employed in their implementation.
The consultative process also led to a consensus that the solutions should be viewed in aggregate
terms – how they complement one another and make a potentially greater contribution when
taken as a whole. In other words, the solutions proposed for each bottlenecks to particular
activities under an intervention area were viewed in terms of their aggregate impact/contribution
toward the achievement of the corresponding intervention. Thus conceived, a solution‘s value to
overcoming a particular bottleneck was also judged on the basis of its potentially indirect positive
contribution to facilitating the achievement of other solutions. Discussions therefore also touched
upon the sequencing of solutions as well.
5.1 Solutions to bottlenecks to Intervention 1
Each of the 13 solutions proposed to overcoming 11 identified bottlenecks are very specific and
geared toward ensuring that the education and training system works to align with the needs
of the economy. At the same time, stakeholders realized that it is not enough that the education
and training system just be responsive to economic needs; it should also shape and guide these
needs. In concrete terms, what is expected is that the education and training system not only
place graduates in jobs, but also create demand for new types of jobs.
As such, solutions were proposed that emphasized the need for better, higher-quality training at
TVETs by offering monetary and non-monetary incentives to attract a higher calibre of trainers/
teachers, both from within and outside the country. In addition, because in some cases the private
sector is able to perform certain tasks more efficiently than the Government, innovative public-
private partnerships (PPPs) were encouraged to execute certain TVET functions. To obtain a better
grasp of the needs of the labour market, more open and regular consultations among key players
(BCCI, MoLHR, MoE) was proposed.
New and emerging areas that have latent potential for growth and job creation were recommended
as part of the TVET curriculum. For example, programmes in industries such and fashion, media
and culinary arts should be developed and closely integrated with the respective industry.
Consensus was widespread that TVETs be subject to standardized performance indicators that are
47
internationally recognized. This would not only allow for Bhutan‘s TVETs to be compared to TVETs
in other countries, but also for tracking of progress domestically.
A point made repeatedly during this discussion – and one that applies more broadly as a
bottleneck – was with regard to the need for strengthened coordination and policy
coherence across Government Ministries and other stakeholders. In the case of TVET curriculum
development, not only greater coordination within Government was deemed necessary, but
also between Government and the private sector, youth groups and civil society organizations
(CSOs). The aim is to ensure that the TVET curriculum not only addresses the diverse demands of
the labour market, but also anticipates growth areas and sectors in the economy.
Several bottlenecks were identified to the implementation of scholarships and internships for
youth. A solution that intended to address several of these bottlenecks was to develop and
legislate an Internship Act that clearly states the terms and conditions of internship programmes.
The expected duration of the Act would be for two years; however, in its absence there remain no
clear rules and regulations pertaining to internships.
Because most internships are paid for and financed by MOLHR, a fully funded Government internship
placement programme seems to have created adverse incentives by supplying labour ―free of cost‖
to employers. In turn, many employers are believed to have shown neglect toward interns and do
not provide clear terms of reference for the work to be undertaken. Therefore, it was proposed that
internships be co-financed in most instances, especially if a company accepting an intern is able
to finance part of the salary.
Lastly, successfully integrating vocational training into the secondary-level education curriculum
and providing students with a dual track post-secondary (vocational and tertiary) faced two main
bottlenecks. The first was that the demand for vocational training among secondary-level students
is not clear; it appeared most students, if given the choice, would opt for the core curriculum
followed by tertiary education. Therefore, it was proposed and agreed that a quick assessment to
determine the demand of vocational vs. tertiary education be undertaken. Such an assessment
also would help to assess the capacity needed to ensure quality programmes along both tracks.
The second bottleneck highlighted the fact that students pursuing vocational training are generally
ill-equipped for tertiary-level education. The agreed solution was to offer bridging courses that
ensure a smoother transition; it was determined that the Bhutan Qualification Framework which is
being developed will address this issue.
48
5.2 Solutions to bottlenecks to Interventions 2
Boosting private sector development with a focus on the CSMI/MSME sector has been high on the
national agenda for some time. The private sector is seen both as a potential engine of employment
generation and economic growth. However, for various reasons it has not been able to deliver on
its promised role. The bottlenecks to the activities under Intervention 2, although specific, span
a wide range, and as such, the solutions also address various aspects of private sector and CSMI/
MSME development.
Agricultural growth in general is seen as a longer-term solution to addressing rural-urban
migration – and thus youth employment in urban areas – and some solutions aimed to strengthen
linkages with the agricultural sector. The CSMI sector in particular has a key role to play in terms
of facilitating and supporting agribusiness. Therefore, the solution proposed to strengthen
backward and forward linkages with agriculture is to forge a stronger link between national-level
policies on MSMEs and local development plans. At the same time, it was proposed that post-
harvest/agricultural activities (i.e. processing, quality control, packaging and branding) be actively
supported and promoted. The Government is also carrying out a value-chain analysis of agro-
products to identify how best to support the industry in making it internationally competitive.
The main bottleneck to private sector growth, also discussed in Chapter 4, is the current regulatory/
facilitating environment. Given Bhutan‘s comparatively low ranking in terms of ease of doing
business, despite improvements, points to a need to actively relax current requirements for
investing and setting up businesses. Protecting or preserving the environment came up as a key
reason for the high level of scrutiny that medium- to large-sized business may face. Nonetheless,
the Government is keen to facilitate private sector development and growth, and a high-level
committee chaired by MoEA/PSDC has been set up specifically to address current constraints or
bottlenecks to ease of doing business.
Bottlenecks to access to finance for MSMEs, including the need for high collateral for loans, are to
be addressed through several measures. First, the Department of Cottage and Small Industriesis
to introduce a new innovative voucher scheme. Second, the Government will work closely with
financial institutions to promote factoring and financial leasing services and to introduce other
forms of collateral, including future assets. The paucity of MFIs in Bhutan was perceived as a
general weakness. Given the mixed review of MFIs globally, it was proposed that creation of MFIs
to support micro and small enterprises be carried out based on international best practices. Finally,
it also was agreed that the Government would incentivize priority sector lending through lending
institutions (i.e., 20 percent of all loans will go to MSMEs).
The tourism and IT sectors are increasingly seen as relevant for Bhutan‘s current and future
development. Their attractiveness also stems from the fact that they are growth sectors, with
potential for significant employment generation. While the tourism industry in Bhutan has
matured over time, now focusing on ―high-end‖ tourists, the IT industry is relatively small and still
in its infancy. In tourism, a need exists for other parts of the economy to form better linkages with
the hospitality industry, which is a particular area of growth.
Regarding IT, India‘s IT boom provides an example of how a specific sector can make a sizable
contribution to national GDP and also to job creation over a short period of time. In Bhutan,
both mobile phone and Internet penetration have increased exponentially in the past decade.
49
According to the World Bank, Internet users have increased from 0.4 per 100 people in 2000 to 21
per 100 people in 2010, while mobile phone users per 100 people has risen sharply from 0 to 66
over the same period.
However, the Government recognizes that better planning is needed to steer both these
sectors toward further growth. As such, it is committed to work closely with the IT and tourism
industries to develop their respective sectoral master plans, with a focus on facilitating their
expansion and growth.
The belief is prevalent that the Bhutanese private sector is not the preferred employer among
the youth. During the consultations, several factors were brought up as to why this may be the
case, including poor working conditions, unfavourable contractual conditions, and low wages.
Most evidence presented was anecdotal or based on hearsay, however, and not on surveys or
a comprehensive sector assessment. Therefore, it was recommended that a survey targeted at
the urban youth be conducted to better understand their perceptions toward private sector
employment.
In turn, such an approach would help in better understanding specific concerns of the youth,
and therefore allow the Government and private sector to work together to overcome these
concerns and capitalize on potential opportunities. At the same time, consultations between the
Government and private sector have become more frequent, thus creating a platform to address
issues such as working conditions, contractual agreements and worker safety concerns.
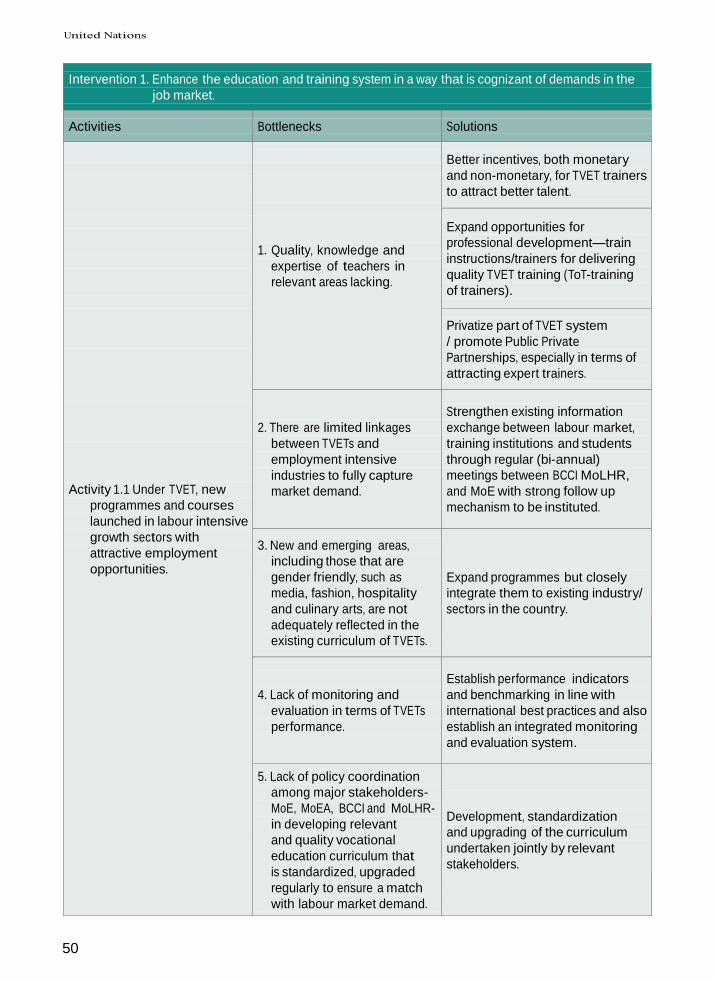
50
Intervention 1. Enhance the education and training system in a way that is cognizant of demands in the
job market.
Activities
Bottlenecks
Solutions
Activity 1.1 Under TVET, new
programmes and courses
launched in labour intensive
growth sectors with
attractive employment
opportunities.
1. Quality, knowledge and
expertise of teachers in
relevant areas lacking.
Better incentives, both monetary
and non-monetary, for TVET trainers
to attract better talent.
Expand opportunities for
professional development—train
instructions/trainers for delivering
quality TVET training (ToT-training
of trainers).
Privatize part of TVET system
/ promote Public Private
Partnerships, especially in terms of
attracting expert trainers.
2. There are limited linkages
between TVETs and
employment intensive
industries to fully capture
market demand.
Strengthen existing information
exchange between labour market,
training institutions and students
through regular (bi-annual)
meetings between BCCI MoLHR,
and MoE with strong follow up
mechanism to be instituted.
3. New and emerging areas,
including those that are
gender friendly, such as
media, fashion, hospitality
and culinary arts, are not
adequately reflected in the
existing curriculum of TVETs.
Expand programmes but closely
integrate them to existing industry/
sectors in the country.
4. Lack of monitoring and
evaluation in terms of TVETs
performance.
Establish performance indicators
and benchmarking in line with
international best practices and also
establish an integrated monitoring
and evaluation system.
5. Lack of policy coordination
among major stakeholders-
MoE, MoEA, BCCI and MoLHR-
in developing relevant
and quality vocational
education curriculum that
is standardized, upgraded
regularly to ensure a match
with labour market demand.
Development, standardization
and upgrading of the curriculum
undertaken jointly by relevant
stakeholders.
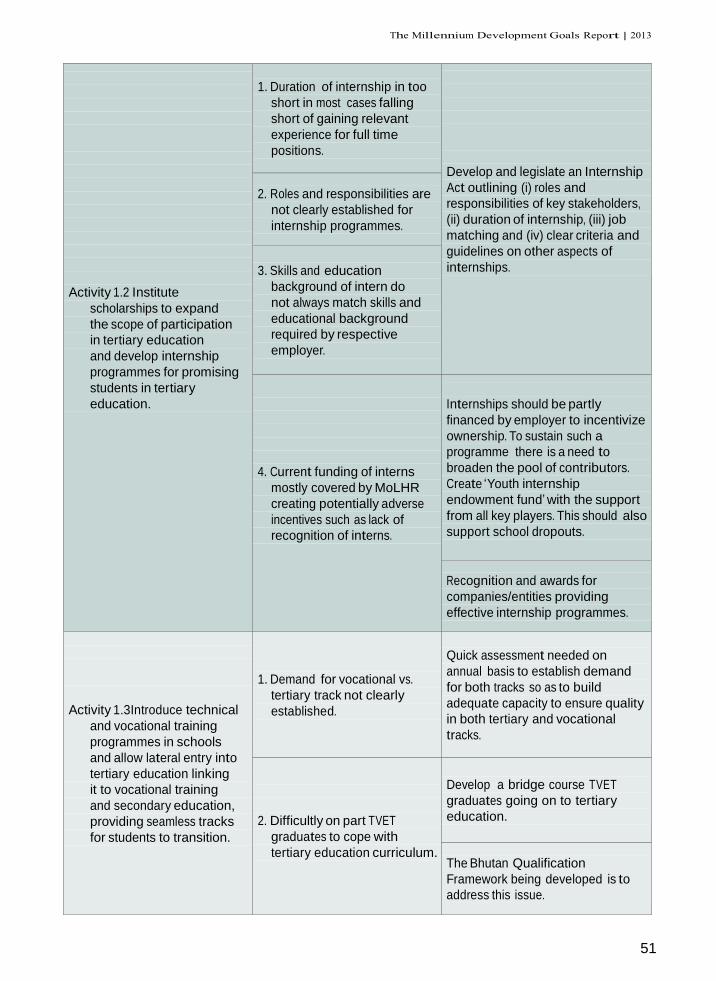
51
Activity 1.2 Institute
scholarships to expand
the scope of participation
in tertiary education
and develop internship
programmes for promising
students in tertiary
education.
1. Duration of internship in too
short in most cases falling
short of gaining relevant
experience for full time
positions.
Develop and legislate an Internship
Act outlining (i) roles and
responsibilities of key stakeholders,
(ii) duration of internship, (iii) job
matching and (iv) clear criteria and
guidelines on other aspects of
internships.
2. Roles and responsibilities are
not clearly established for
internship programmes.
3. Skills and education
background of intern do
not always match skills and
educational background
required by respective
employer.
4. Current funding of interns
mostly covered by MoLHR
creating potentially adverse
incentives such as lack of
recognition of interns.
Internships should be partly
financed by employer to incentivize
ownership. To sustain such a
programme there is a need to
broaden the pool of contributors.
Create ‗Youth internship
endowment fund‘ with the support
from all key players. This should also
support school dropouts.
Recognition and awards for
companies/entities providing
effective internship programmes.
Activity 1.3Introduce technical
and vocational training
programmes in schools
and allow lateral entry into
tertiary education linking
it to vocational training
and secondary education,
providing seamless tracks
for students to transition.
1. Demand for vocational vs.
tertiary track not clearly
established.
Quick assessment needed on
annual basis to establish demand
for both tracks so as to build
adequate capacity to ensure quality
in both tertiary and vocational
tracks.
2. Difficultly on part TVET
graduates to cope with
tertiary education curriculum.
Develop a bridge course TVET
graduates going on to tertiary
education.
The Bhutan Qualification
Framework being developed is to
address this issue.
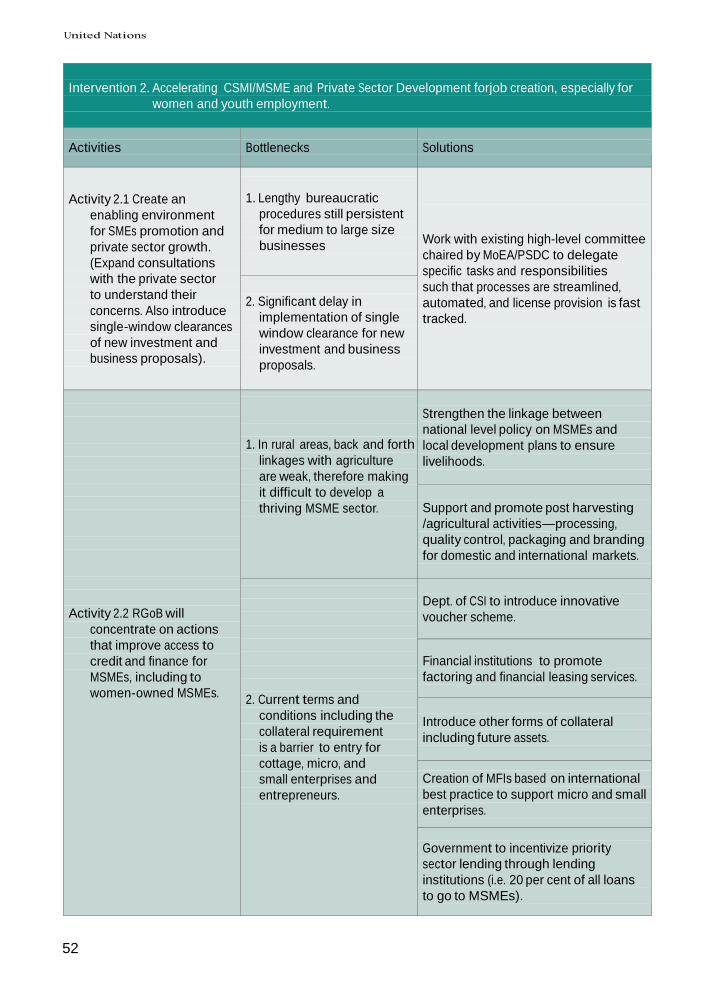
52
Intervention 2. Accelerating CSMI/MSME and Private Sector Development forjob creation, especially for
women and youth employment.
Activities
Bottlenecks
Solutions
Activity 2.1 Create an
enabling environment
for SMEs promotion and
private sector growth.
(Expand consultations
with the private sector
to understand their
concerns. Also introduce
single-window clearances
of new investment and
business proposals).
1. Lengthy bureaucratic
procedures still persistent
for medium to large size
businesses
Work with existing high-level committee
chaired by MoEA/PSDC to delegate
specific tasks and responsibilities
such that processes are streamlined,
automated, and license provision is fast
tracked.
2. Significant delay in
implementation of single
window clearance for new
investment and business
proposals.
Activity 2.2 RGoB will
concentrate on actions
that improve access to
credit and finance for
MSMEs, including to
women-owned MSMEs.
1. In rural areas, back and forth
linkages with agriculture
are weak, therefore making
it difficult to develop a
thriving MSME sector.
Strengthen the linkage between
national level policy on MSMEs and
local development plans to ensure
livelihoods.
Support and promote post harvesting
/agricultural activities—processing,
quality control, packaging and branding
for domestic and international markets.
2. Current terms and
conditions including the
collateral requirement
is a barrier to entry for
cottage, micro, and
small enterprises and
entrepreneurs.
Dept. of CSI to introduce innovative
voucher scheme.
Financial institutions to promote
factoring and financial leasing services.
Introduce other forms of collateral
including future assets.
Creation of MFIs based on international
best practice to support micro and small
enterprises.
Government to incentivize priority
sector lending through lending
institutions (i.e. 20 per cent of all loans
to go to MSMEs).
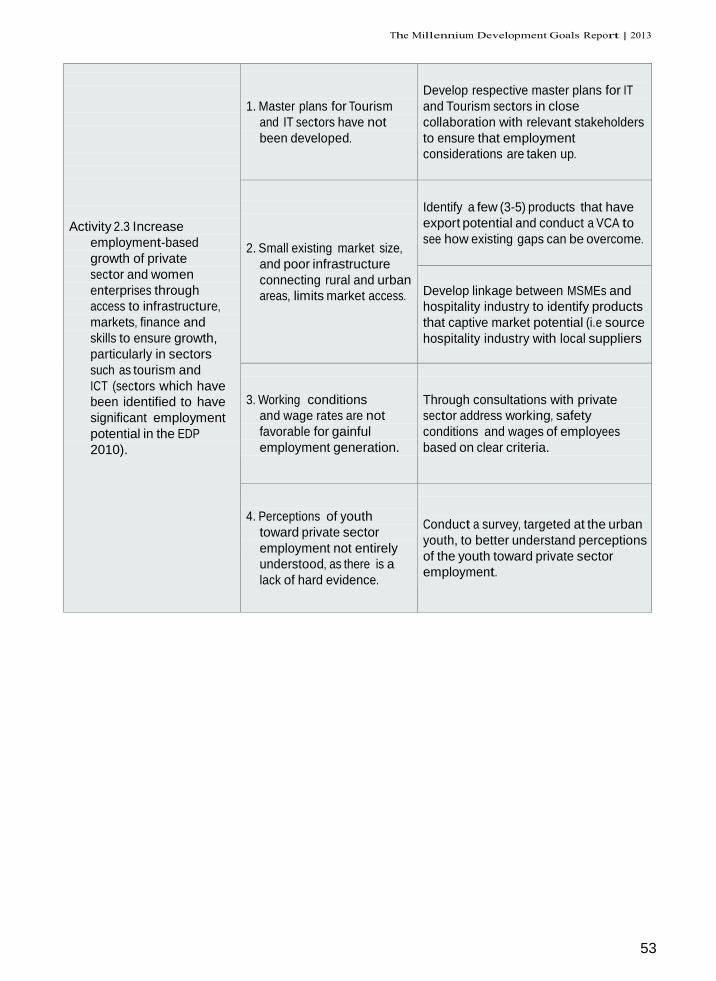
53
Activity 2.3 Increase
employment-based
growth of private
sector and women
enterprises through
access to infrastructure,
markets, finance and
skills to ensure growth,
particularly in sectors
such as tourism and
ICT (sectors which have
been identified to have
significant employment
potential in the EDP
2010).
1. Master plans for Tourism
and IT sectors have not
been developed.
Develop respective master plans for IT
and Tourism sectors in close
collaboration with relevant stakeholders
to ensure that employment
considerations are taken up.
2. Small existing market size,
and poor infrastructure
connecting rural and urban
areas, limits market access.
Identify a few (3-5) products that have
export potential and conduct a VCA to
see how existing gaps can be overcome.
Develop linkage between MSMEs and
hospitality industry to identify products
that captive market potential (i.e source
hospitality industry with local suppliers
3. Working conditions
and wage rates are not
favorable for gainful
employment generation.
Through consultations with private
sector address working, safety
conditions and wages of employees
based on clear criteria.
4. Perceptions of youth
toward private sector
employment not entirely
understood, as there is a
lack of hard evidence.
Conduct a survey, targeted at the urban
youth, to better understand perceptions
of the youth toward private sector
employment.
54
CHAPTER 6:
MDG acceleration
plan: Building a
compact
The tables that follow present the Country Action Plan (CAP) to addressing MDG 8, Target 16 (In
cooperation with developing countries, develop and implement strategies for decent and productive
work for youth).These are the culmination of a Government-led consultative process involving all
relevant stakeholders. Because employment in general, and youth employment in particular, is a
cross-sectoral issue, the emerging solutions clearly reflect the need for strengthened coordination
and collaboration within Government and between Government, relevant stakeholders and
development partners. The period over which the CAP is to be implemented is consistent with the
Government‘s 11th Five Year Plan (2013-2018).
While indicators for monitoring progress have been listed, alongside relevant stakeholders,
funding sources are not included, nor have solutions been costed. The intention is to present a
blueprint as part of this document, and subsequently develop a detailed Implementation Plan
that lays out specific roles and responsibilities of each partner/stakeholder, along with the specific
funding sources for each solution. The Implementation Plan will be completed by third quarter
of 2014.
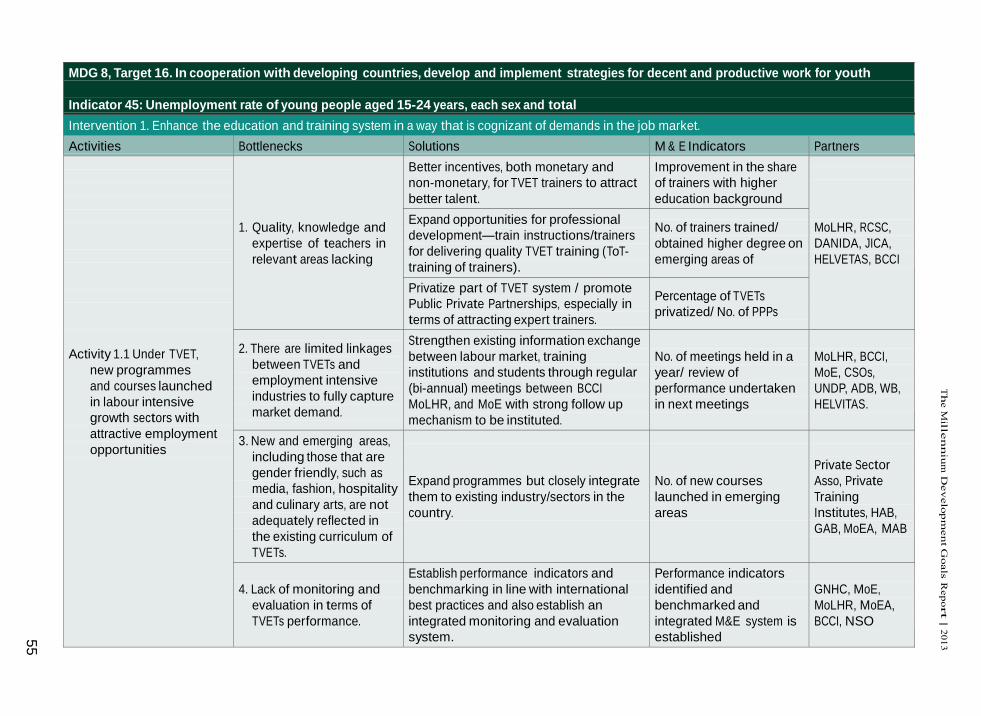
55
MDG 8, Target 16. In cooperation with developing countries, develop and implement strategies for decent and productive work for youth
Indicator 45: Unemployment rate of young people aged 15-24 years, each sex and total
Intervention 1. Enhance the education and training system in a way that is cognizant of demands in the job market.
Activities Bottlenecks Solutions M & E Indicators Partners
Activity 1.1 Under TVET,
new programmes
and courses launched
in labour intensive
growth sectors with
attractive employment
opportunities
1. Quality, knowledge and
expertise of teachers in
relevant areas lacking
Better incentives, both monetary and
non-monetary, for TVET trainers to attract
better talent.
Improvement in the share
of trainers with higher
education background
MoLHR, RCSC,
DANIDA, JICA,
HELVETAS, BCCI
Expand opportunities for professional
development—train instructions/trainers
for delivering quality TVET training (ToT-
training of trainers).
No. of trainers trained/
obtained higher degree on
emerging areas of
Privatize part of TVET system / promote
Public Private Partnerships, especially in
terms of attracting expert trainers.
Percentage of TVETs
privatized/ No. of PPPs
2. There are limited linkages
between TVETs and
employment intensive
industries to fully capture
market demand.
Strengthen existing information exchange
between labour market, training
institutions and students through regular
(bi-annual) meetings between BCCI
MoLHR, and MoE with strong follow up
mechanism to be instituted.
No. of meetings held in a
year/ review of
performance undertaken
in next meetings
MoLHR, BCCI,
MoE, CSOs,
UNDP, ADB, WB,
HELVITAS.
3. New and emerging areas,
including those that are
gender friendly, such as
media, fashion, hospitality
and culinary arts, are not
adequately reflected in
the existing curriculum of
TVETs.
Expand programmes but closely integrate
them to existing industry/sectors in the
country.
No. of new courses
launched in emerging
areas
Private Sector
Asso, Private
Training
Institutes, HAB,
GAB, MoEA, MAB
4. Lack of monitoring and
evaluation in terms of
TVETs performance.
Establish performance indicators and
benchmarking in line with international
best practices and also establish an
integrated monitoring and evaluation
system.
Performance indicators
identified and
benchmarked and
integrated M&E system is
established
GNHC, MoE,
MoLHR, MoEA,
BCCI, NSO
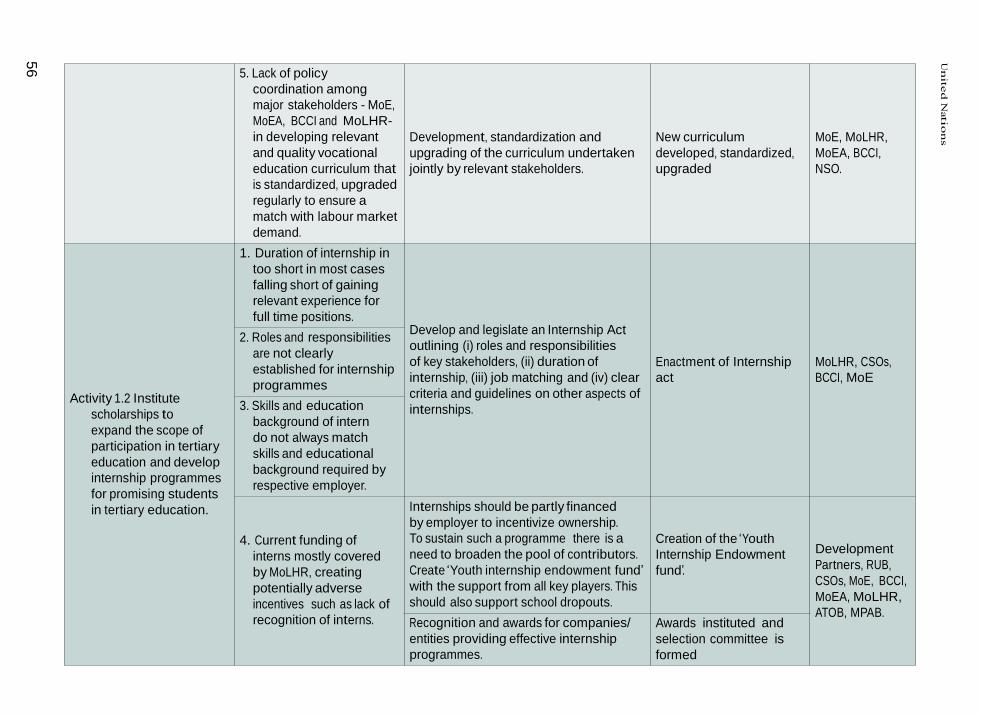
56
Activity 1.2 Institute
scholarships to
expand the scope of
participation in tertiary
education and develop
internship programmes
for promising students
in tertiary education.
5. Lack of policy
coordination among
major stakeholders - MoE,
MoEA, BCCI and MoLHR-
in developing relevant
and quality vocational
education curriculum that
is standardized, upgraded
regularly to ensure a
match with labour market
demand.
1. Duration of internship in
too short in most cases
falling short of gaining
relevant experience for
full time positions.
2. Roles and responsibilities
are not clearly
established for internship
programmes
3. Skills and education
background of intern
do not always match
skills and educational
background required by
respective employer. 4. Current funding of
interns mostly covered
by MoLHR, creating
potentially adverse
incentives such as lack of
recognition of interns.
Development, standardization and
upgrading of the curriculum undertaken
jointly by relevant stakeholders. Develop and legislate an Internship Act
outlining (i) roles and responsibilities
of key stakeholders, (ii) duration of
internship, (iii) job matching and (iv) clear
criteria and guidelines on other aspects of
internships. Internships should be partly financed
by employer to incentivize ownership.
To sustain such a programme there is a
need to broaden the pool of contributors.
Create ‗Youth internship endowment fund‘
with the support from all key players. This
should also support school dropouts.
Recognition and awards for companies/
entities providing effective internship
programmes.
New curriculum
developed, standardized,
upgraded Enactment of Internship
act Creation of the ‗Youth
Internship Endowment
fund‘.
Awards instituted and
selection committee is
formed
MoE, MoLHR,
MoEA, BCCI,
NSO. MoLHR, CSOs,
BCCI, MoE
Development
Partners, RUB,
CSOs, MoE, BCCI,
MoEA, MoLHR,
ATOB, MPAB.
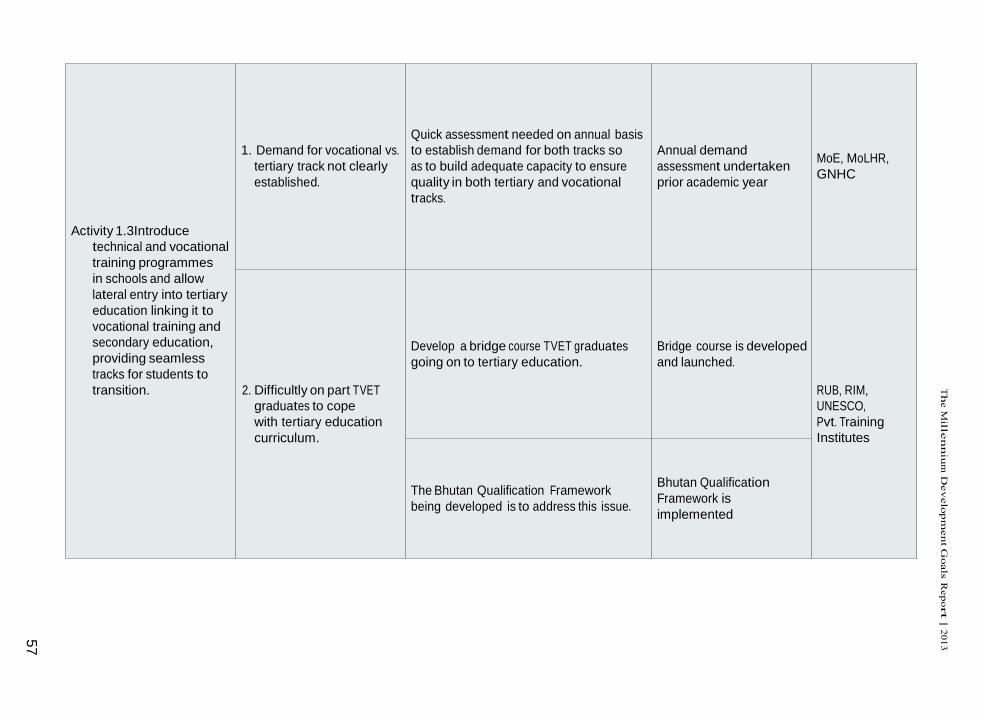
57
1. Demand for vocational vs.
tertiary track not clearly
established.
Quick assessment needed on annual basis
to establish demand for both tracks so
as to build adequate capacity to ensure
quality in both tertiary and vocational
tracks.
Annual demand
assessment undertaken
prior academic year
MoE, MoLHR,
GNHC
Activity 1.3Introduce
technical and vocational
training programmes
in schools and allow
lateral entry into tertiary
education linking it to
vocational training and
secondary education,
providing seamless
tracks for students to
transition.
2. Difficultly on part TVET
graduates to cope
with tertiary education
curriculum.
Develop a bridge course TVET graduates
going on to tertiary education.
Bridge course is developed
and launched.
RUB, RIM,
UNESCO,
Pvt. Training
Institutes
The Bhutan Qualification Framework
being developed is to address this issue.
Bhutan Qualification
Framework is
implemented
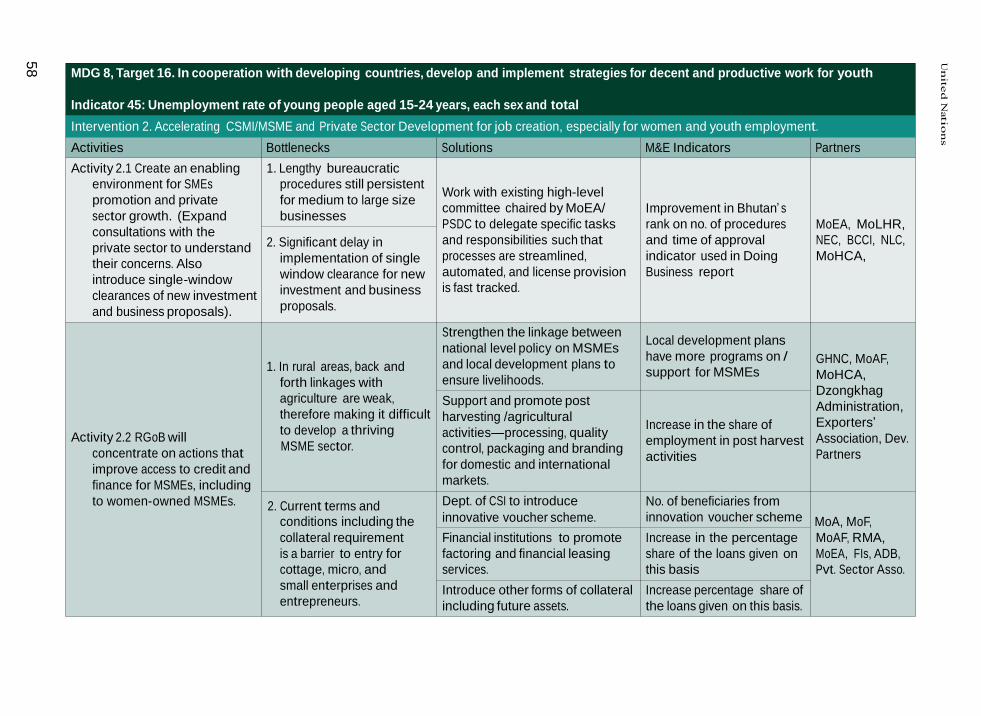
58
MDG 8, Target 16. In cooperation with developing countries, develop and implement strategies for decent and productive work for youth
Indicator 45: Unemployment rate of young people aged 15-24 years, each sex and total
Intervention 2. Accelerating CSMI/MSME and Private Sector Development for job creation, especially for women and youth employment.
Activities Bottlenecks Solutions M&E Indicators Partners
Activity 2.1 Create an enabling
environment for SMEs
promotion and private
sector growth. (Expand
consultations with the
private sector to understand
their concerns. Also
introduce single-window
clearances of new investment
and business proposals). Activity 2.2 RGoB will
concentrate on actions that
improve access to credit and
finance for MSMEs, including
to women-owned MSMEs.
1. Lengthy bureaucratic
procedures still persistent
for medium to large size
businesses
2. Significant delay in
implementation of single
window clearance for new
investment and business
proposals.
1. In rural areas, back and
forth linkages with
agriculture are weak,
therefore making it difficult
to develop a thriving
MSME sector.
2. Current terms and
Work with existing high-level
committee chaired by MoEA/
PSDC to delegate specific tasks
and responsibilities such that
processes are streamlined,
automated, and license provision
is fast tracked. Strengthen the linkage between
national level policy on MSMEs
and local development plans to
ensure livelihoods.
Support and promote post
harvesting /agricultural
activities—processing, quality
control, packaging and branding
for domestic and international
markets.
Dept. of CSI to introduce
Improvement in Bhutan‘ s
rank on no. of procedures
and time of approval
indicator used in Doing
Business report Local development plans
have more programs on /
support for MSMEs
Increase in the share of
employment in post harvest
activities No. of beneficiaries from
MoEA, MoLHR,
NEC, BCCI, NLC,
MoHCA,
GHNC, MoAF,
MoHCA,
Dzongkhag
Administration,
Exporters‘
Association, Dev.
Partners
conditions including the innovative voucher scheme. innovation voucher scheme MoA, MoF,
collateral requirement
is a barrier to entry for
cottage, micro, and
small enterprises and
entrepreneurs.
Financial institutions to promote
factoring and financial leasing
services.
Introduce other forms of collateral
including future assets.
Increase in the percentage
share of the loans given on
this basis
Increase percentage share of
the loans given on this basis.
MoAF, RMA,
MoEA, FIs, ADB,
Pvt. Sector Asso.
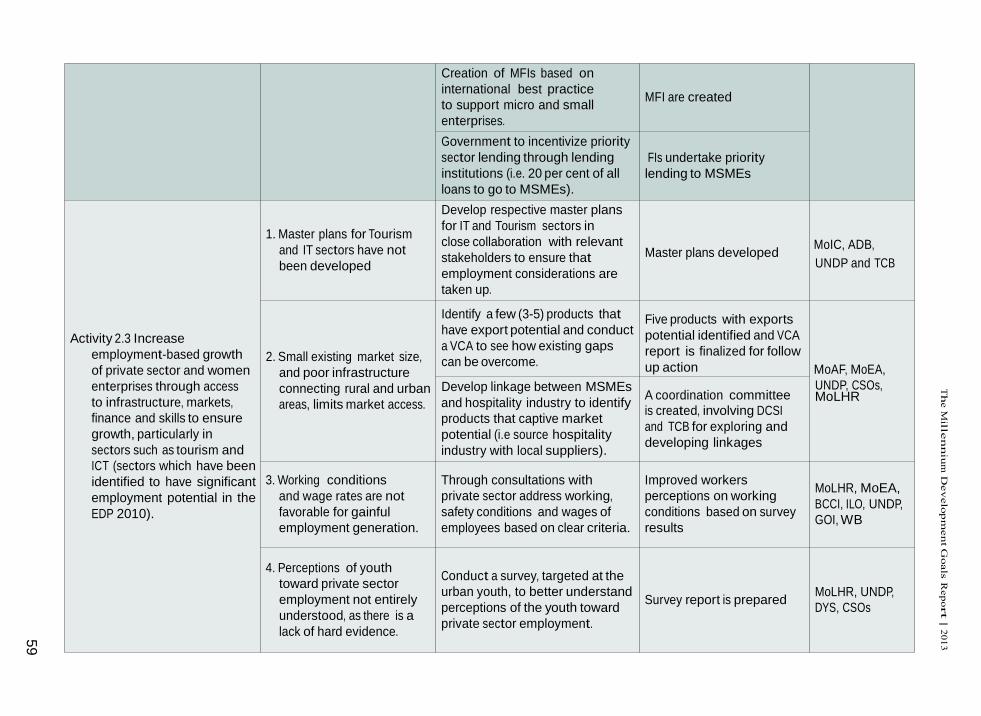
59
Activity 2.3 Increase
employment-based growth
of private sector and women
enterprises through access
1. Master plans for Tourism
and IT sectors have not
been developed
2. Small existing market size,
and poor infrastructure
connecting rural and urban
Creation of MFIs based on
international best practice
to support micro and small
enterprises.
Government to incentivize priority
sector lending through lending
institutions (i.e. 20 per cent of all
loans to go to MSMEs).
Develop respective master plans
for IT and Tourism sectors in
close collaboration with relevant
stakeholders to ensure that
employment considerations are
taken up.
Identify a few (3-5) products that
have export potential and conduct
a VCA to see how existing gaps
can be overcome.
Develop linkage between MSMEs
MFI are created
FIs undertake priority
lending to MSMEs
Master plans developed
MoIC, ADB,
UNDP and TCB Five products with exports
potential identified and VCA
report is finalized for follow
up action MoAF, MoEA,
UNDP, CSOs,
to infrastructure, markets,
finance and skills to ensure
growth, particularly in
sectors such as tourism and
ICT (sectors which have been
identified to have significant
employment potential in the
EDP 2010).
areas, limits market access.
3. Working conditions
and wage rates are not
favorable for gainful
employment generation.
and hospitality industry to identify
products that captive market
potential (i.e source hospitality
industry with local suppliers). Through consultations with
private sector address working,
safety conditions and wages of
employees based on clear criteria.
A coordination committee is created, involving DCSI
and TCB for exploring and
developing linkages
Improved workers
perceptions on working
conditions based on survey
results
MoLHR
MoLHR, MoEA,
BCCI, ILO, UNDP,
GOI, WB
4. Perceptions of youth
toward private sector
employment not entirely
understood, as there is a
lack of hard evidence.
Conduct a survey, targeted at the
urban youth, to better understand
perceptions of the youth toward
private sector employment.
Survey report is prepared
MoLHR, UNDP,
DYS, CSOs
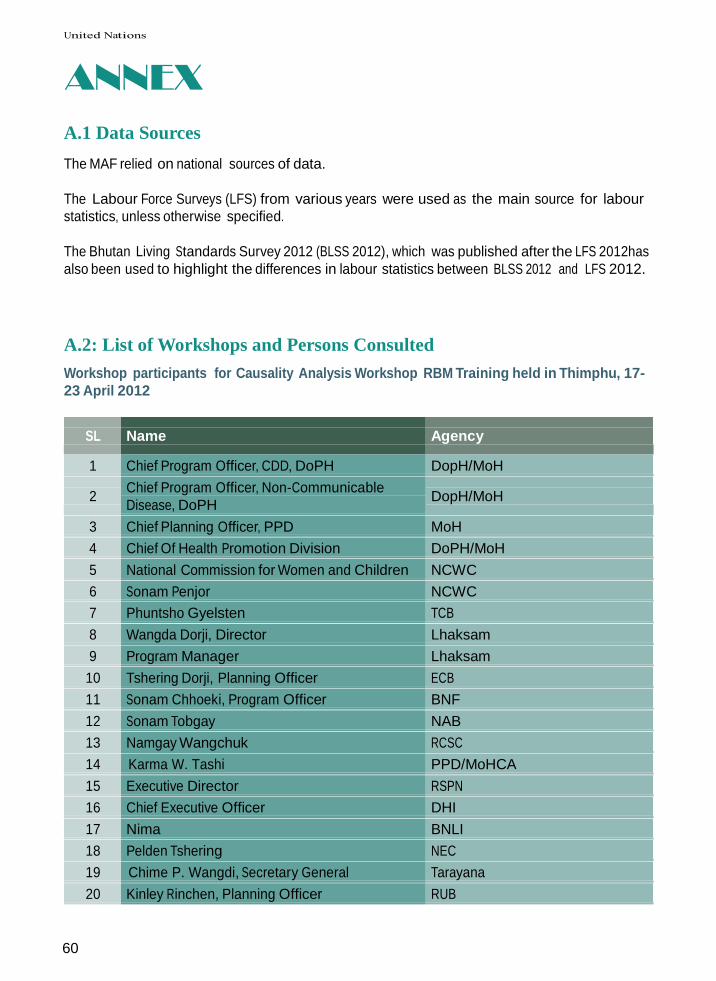
60
ANNEX
A.1 Data Sources
The MAF relied on national sources of data.
The Labour Force Surveys (LFS) from various years were used as the main source for labour
statistics, unless otherwise specified.
The Bhutan Living Standards Survey 2012 (BLSS 2012), which was published after the LFS 2012has
also been used to highlight the differences in labour statistics between BLSS 2012 and LFS 2012.
A.2: List of Workshops and Persons Consulted
Workshop participants for Causality Analysis Workshop RBM Training held in Thimphu, 17-
23 April 2012
SL
Name
Agency
1 Chief Program Officer, CDD, DoPH DopH/MoH
2 Chief Program Officer, Non-Communicable
Disease, DoPH
DopH/MoH
3 Chief Planning Officer, PPD MoH
4 Chief Of Health Promotion Division DoPH/MoH
5 National Commission for Women and Children NCWC
6 Sonam Penjor NCWC
7 Phuntsho Gyelsten TCB
8 Wangda Dorji, Director Lhaksam
9 Program Manager Lhaksam
10 Tshering Dorji, Planning Officer ECB
11 Sonam Chhoeki, Program Officer BNF
12 Sonam Tobgay NAB
13 Namgay Wangchuk RCSC
14 Karma W. Tashi PPD/MoHCA
15 Executive Director RSPN
16 Chief Executive Officer DHI
17 Nima BNLI
18 Pelden Tshering NEC
19 Chime P. Wangdi, Secretary General Tarayana
20 Kinley Rinchen, Planning Officer RUB
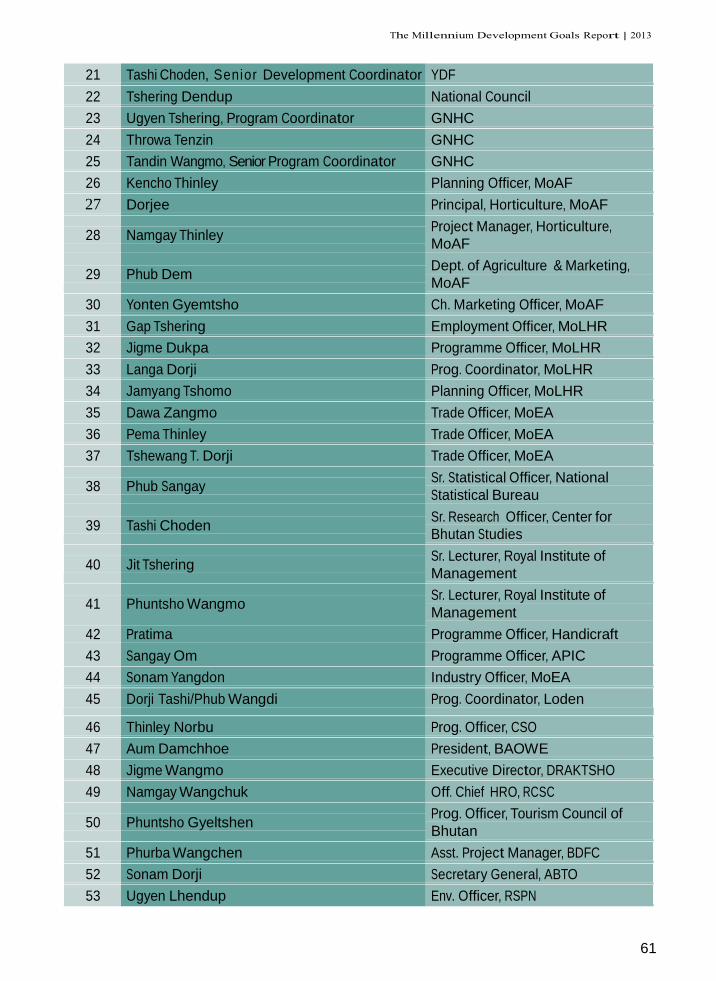
61
21 Tashi Choden, Senior Development Coordinator YDF
22 Tshering Dendup National Council
23 Ugyen Tshering, Program Coordinator GNHC
24 Throwa Tenzin GNHC
25 Tandin Wangmo, Senior Program Coordinator GNHC
26 Kencho Thinley Planning Officer, MoAF
27 Dorjee Principal, Horticulture, MoAF
28
29
Namgay Thinley
Phub Dem
Project Manager, Horticulture,
MoAF
Dept. of Agriculture & Marketing,
MoAF
30 Yonten Gyemtsho Ch. Marketing Officer, MoAF
31 Gap Tshering Employment Officer, MoLHR
32 Jigme Dukpa Programme Officer, MoLHR
33 Langa Dorji Prog. Coordinator, MoLHR
34 Jamyang Tshomo Planning Officer, MoLHR
35 Dawa Zangmo Trade Officer, MoEA
36 Pema Thinley Trade Officer, MoEA
37 Tshewang T. Dorji Trade Officer, MoEA
38
39
Phub Sangay
Tashi Choden
Sr. Statistical Officer, National
Statistical Bureau
Sr. Research Officer, Center for
Bhutan Studies
40
Jit Tshering Sr. Lecturer, Royal Institute of
Management
41
42
43
Phuntsho Wangmo Pratima
Sangay Om
Sr. Lecturer, Royal Institute of
Management
Programme Officer, Handicraft
Programme Officer, APIC
44 Sonam Yangdon Industry Officer, MoEA
45 Dorji Tashi/Phub Wangdi Prog. Coordinator, Loden
46 Thinley Norbu Prog. Officer, CSO
47 Aum Damchhoe President, BAOWE
48 Jigme Wangmo Executive Director, DRAKTSHO
49 Namgay Wangchuk Off. Chief HRO, RCSC
50
Phuntsho Gyeltshen Prog. Officer, Tourism Council of
Bhutan
51 Phurba Wangchen Asst. Project Manager, BDFC
52 Sonam Dorji Secretary General, ABTO
53 Ugyen Lhendup Env. Officer, RSPN
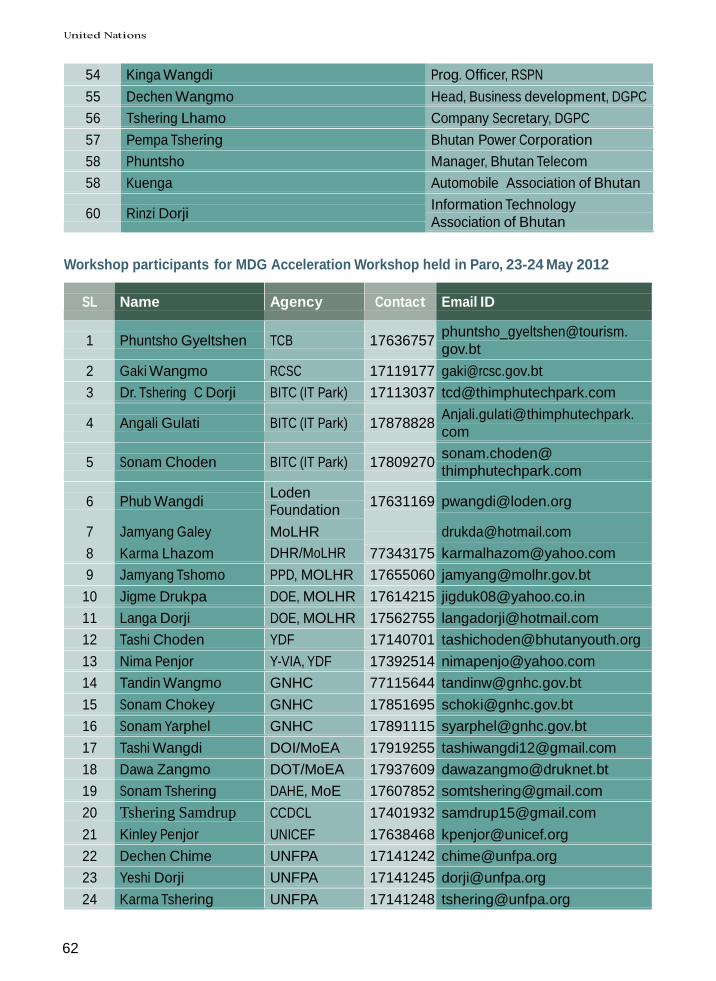
62
54 Kinga Wangdi Prog. Officer, RSPN
55 Dechen Wangmo Head, Business development, DGPC
56 Tshering Lhamo Company Secretary, DGPC
57 Pempa Tshering Bhutan Power Corporation
58 Phuntsho Manager, Bhutan Telecom
58 Kuenga Automobile Association of Bhutan
60
Rinzi Dorji Information Technology
Association of Bhutan
Workshop participants for MDG Acceleration Workshop held in Paro, 23-24 May 2012
SL
Name
Agency
Contact
Email ID
1
Phuntsho Gyeltshen
TCB
17636757 phuntsho_gyeltshen@tourism.
gov.bt
2 Gaki Wangmo RCSC 17119177 [email protected]
3 Dr. Tshering C Dorji BITC (IT Park) 17113037 [email protected]
4
Angali Gulati
BITC (IT Park)
17878828 Anjali.gulati@thimphutechpark.
com
5
Sonam Choden
BITC (IT Park)
17809270 sonam.choden@
thimphutechpark.com
6
7
8
Phub Wangdi Jamyang Galey
Karma Lhazom
Loden
Foundation
MoLHR
DHR/MoLHR
17631169
77343175
9 Jamyang Tshomo PPD, MOLHR 17655060 [email protected]
10 Jigme Drukpa DOE, MOLHR 17614215 [email protected]
11 Langa Dorji DOE, MOLHR 17562755 [email protected]
12 Tashi Choden YDF 17140701 [email protected]
13 Nima Penjor Y-VIA, YDF 17392514 [email protected]
14 Tandin Wangmo GNHC 77115644 [email protected]
15 Sonam Chokey GNHC 17851695 [email protected]
16 Sonam Yarphel GNHC 17891115 [email protected]
17 Tashi Wangdi DOI/MoEA 17919255 [email protected]
18 Dawa Zangmo DOT/MoEA 17937609 [email protected]
19 Sonam Tshering DAHE, MoE 17607852 [email protected]
20
21
Tshering Samdrup
Kinley Penjor
CCDCL
UNICEF
17401932
17638468
22 Dechen Chime UNFPA 17141242 [email protected]
23 Yeshi Dorji UNFPA 17141245 [email protected]
24 Karma Tshering UNFPA 17141248 [email protected]
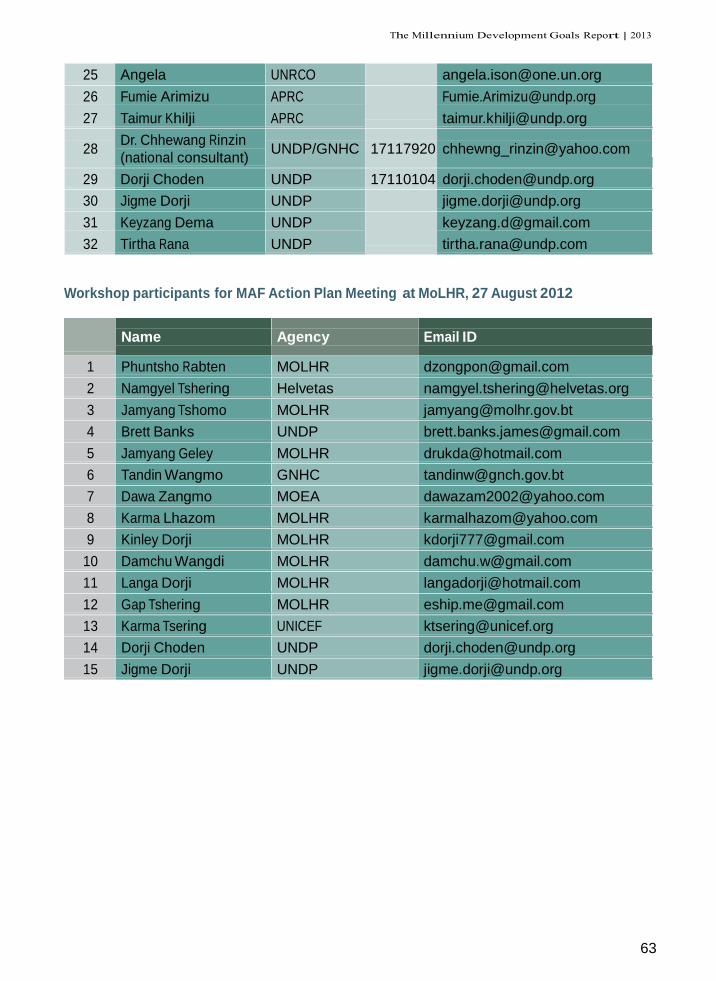
63
25 Angela UNRCO [email protected]
26
27
Fumie Arimizu
Taimur Khilji
APRC
APRC
28 Dr. Chhewang Rinzin
(national consultant)
UNDP/GNHC
17117920
29 Dorji Choden UNDP 17110104 [email protected]
30 Jigme Dorji UNDP [email protected]
31
32
Keyzang Dema
Tirtha Rana
UNDP
UNDP
[email protected] Workshop participants for MAF Action Plan Meeting at MoLHR, 27 August 2012
Name
Agency
Email ID
1 Phuntsho Rabten MOLHR [email protected]
2 Namgyel Tshering Helvetas [email protected]
3 Jamyang Tshomo MOLHR [email protected]
4 Brett Banks UNDP [email protected]
5 Jamyang Geley MOLHR [email protected]
6 Tandin Wangmo GNHC [email protected]
7 Dawa Zangmo MOEA [email protected]
8 Karma Lhazom MOLHR [email protected]
9 Kinley Dorji MOLHR [email protected]
10 Damchu Wangdi MOLHR [email protected]
11 Langa Dorji MOLHR [email protected]
12 Gap Tshering MOLHR [email protected]
13 Karma Tsering UNICEF [email protected]
14 Dorji Choden UNDP [email protected]
15 Jigme Dorji UNDP [email protected]
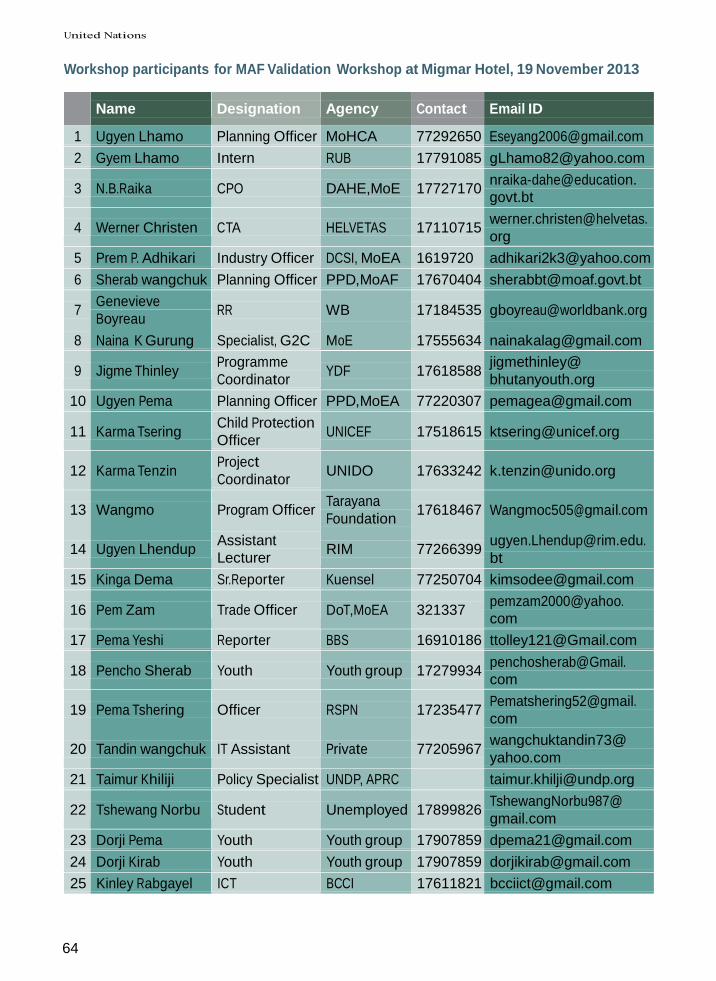
64
Workshop participants for MAF Validation Workshop at Migmar Hotel, 19 November 2013
Name
Designation
Agency
Contact
Email ID
1 Ugyen Lhamo Planning Officer MoHCA 77292650 [email protected]
2 Gyem Lhamo Intern RUB 17791085 [email protected]
3
N.B.Raika
CPO
DAHE,MoE
17727170 nraika-dahe@education.
govt.bt
4
Werner Christen
CTA
HELVETAS
17110715 werner.christen@helvetas.
org
5 Prem P. Adhikari Industry Officer DCSI, MoEA 1619720 [email protected]
6 Sherab wangchuk Planning Officer PPD,MoAF 17670404 [email protected]
7
8
Genevieve
Boyreau
Naina K Gurung
RR Specialist, G2C
WB
MoE
17184535 17555634
9
Jigme Thinley Programme
Coordinator
YDF
17618588 jigmethinley@
bhutanyouth.org
10 Ugyen Pema Planning Officer PPD,MoEA 77220307 [email protected]
11
Karma Tsering Child Protection
Officer
UNICEF
17518615
12
Karma Tenzin Project
Coordinator
UNIDO
17633242
13
14
Wangmo
Ugyen Lhendup
Program Officer Assistant
Lecturer
Tarayana
Foundation RIM
17618467
77266399
bt
15 Kinga Dema Sr.Reporter Kuensel 77250704 [email protected]
16
Pem Zam
Trade Officer
DoT,MoEA
321337 pemzam2000@yahoo.
com
17 Pema Yeshi Reporter BBS 16910186 [email protected]
18
Pencho Sherab
Youth
Youth group
17279934 penchosherab@Gmail.
com
19
20
Pema Tshering
Tandin wangchuk
Officer
IT Assistant
RSPN
Private
17235477
77205967
Pematshering52@gmail.
com
wangchuktandin73@
yahoo.com
21 Taimur Khiliji Policy Specialist UNDP, APRC [email protected]
22
Tshewang Norbu
Student
Unemployed
17899826 TshewangNorbu987@
gmail.com
23 Dorji Pema Youth Youth group 17907859 [email protected]
24 Dorji Kirab Youth Youth group 17907859 [email protected]
25 Kinley Rabgayel ICT BCCI 17611821 [email protected]
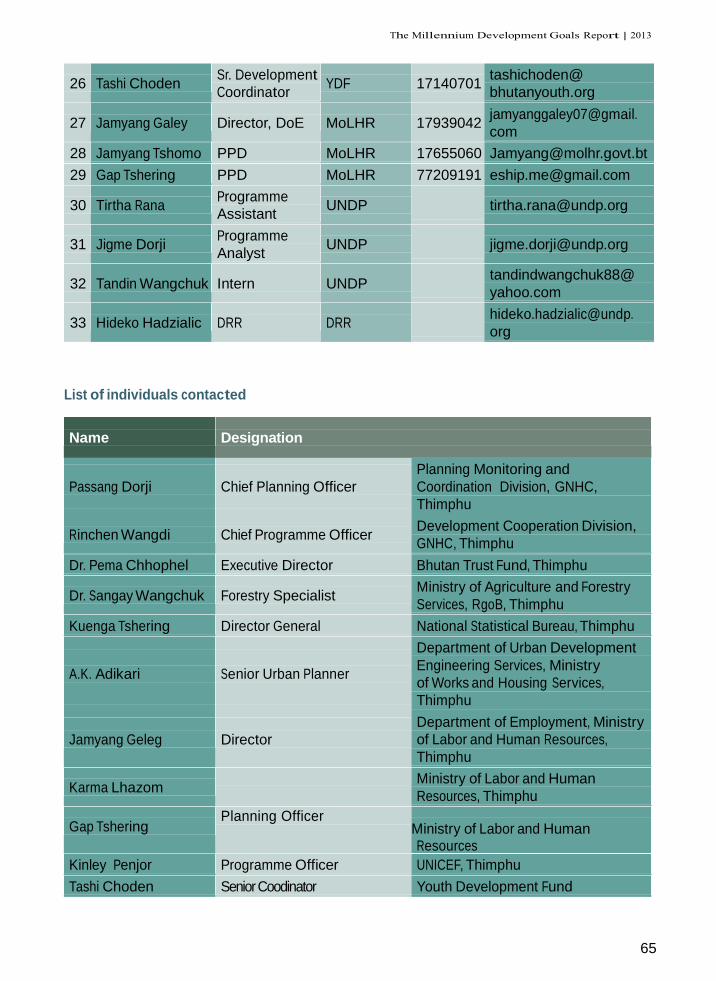
65
26
Tashi Choden Sr. Development
Coordinator
YDF
17140701 tashichoden@
bhutanyouth.org
27
Jamyang Galey
Director, DoE
MoLHR
17939042 jamyanggaley07@gmail.
com
28 Jamyang Tshomo PPD MoLHR 17655060 [email protected]
29 Gap Tshering PPD MoLHR 77209191 [email protected]
30
Tirtha Rana Programme
Assistant
UNDP
31
Jigme Dorji Programme
Analyst
UNDP
32
Tandin Wangchuk
Intern
UNDP tandindwangchuk88@
yahoo.com
33
Hideko Hadzialic
DRR
DRR hideko.hadzialic@undp.
org List of individuals contacted
Name
Designation
Passang Dorji
Rinchen Wangdi
Chief Planning Officer
Chief Programme Officer
Planning Monitoring and
Coordination Division, GNHC,
Thimphu
Development Cooperation Division,
GNHC, Thimphu
Dr. Pema Chhophel Executive Director Bhutan Trust Fund, Thimphu
Dr. Sangay Wangchuk
Forestry Specialist Ministry of Agriculture and Forestry
Services, RgoB, Thimphu
Kuenga Tshering Director General National Statistical Bureau, Thimphu A.K. Adikari
Jamyang Geleg
Senior Urban Planner
Director
Department of Urban Development
Engineering Services, Ministry
of Works and Housing Services,
Thimphu
Department of Employment, Ministry
of Labor and Human Resources,
Thimphu
Karma Lhazom Ministry of Labor and Human
Resources, Thimphu
Gap Tshering Planning Officer
Ministry of Labor and Human Resources
Kinley Penjor Programme Officer UNICEF, Thimphu
Tashi Choden Senior Coodinator Youth Development Fund
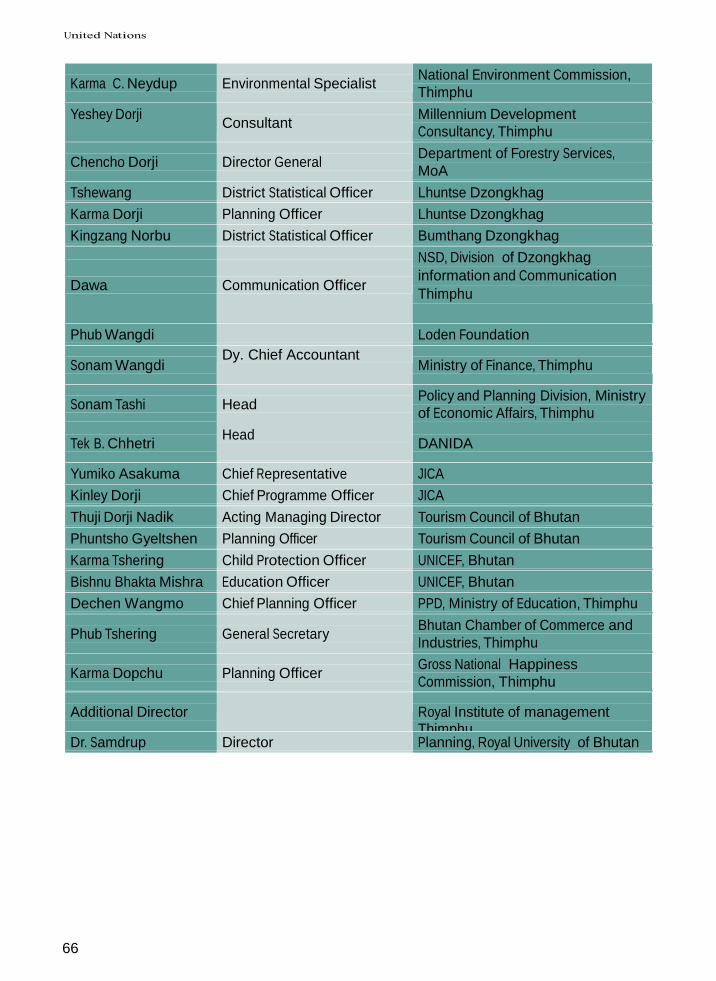
66
Karma C. Neydup
Environmental Specialist National Environment Commission,
Thimphu
Yeshey Dorji
Consultant Millennium Development
Consultancy, Thimphu
Chencho Dorji
Director General Department of Forestry Services,
MoA
Tshewang District Statistical Officer Lhuntse Dzongkhag
Karma Dorji Planning Officer Lhuntse Dzongkhag
Kingzang Norbu District Statistical Officer Bumthang Dzongkhag Dawa
Communication Officer
NSD, Division of Dzongkhag
information and Communication
Thimphu
Phub Wangdi Loden Foundation
Sonam Wangdi Dy. Chief Accountant
Ministry of Finance, Thimphu
Sonam Tashi
Tek B. Chhetri
Head Head
Policy and Planning Division, Ministry
of Economic Affairs, Thimphu
DANIDA
Yumiko Asakuma Chief Representative JICA
Kinley Dorji Chief Programme Officer JICA
Thuji Dorji Nadik Acting Managing Director Tourism Council of Bhutan
Phuntsho Gyeltshen Planning Officer Tourism Council of Bhutan
Karma Tshering Child Protection Officer UNICEF, Bhutan
Bishnu Bhakta Mishra Education Officer UNICEF, Bhutan
Dechen Wangmo Chief Planning Officer PPD, Ministry of Education, Thimphu
Phub Tshering
General Secretary Bhutan Chamber of Commerce and
Industries, Thimphu
Karma Dopchu
Planning Officer
Gross National Happiness
Commission, Thimphu
Additional Director
Royal Institute of management Thimphu
Dr. Samdrup Director Planning, Royal University of Bhutan
67
References 1. Adams, D. and E. Gottlieb. 1993. Education and Social Change in Korea. New York: Garland
Publishing.
2. ADB. 2011. Gender Equality Results, Case Studies: Bhutan, Asian Development Bank, 2011
3. Bisht, Medha. 2011. ‗India-Bhutan Power Cooperation: Between Policy Overtures and Local
Debates‘. IDSA Issue Brief. New Delhi: Institute for Defense Studies and Analyses.
4. EIU (Economist Intelligence Unit). Country Report Bhutan 4th Quarter 2011.
5. [http://www.marketresearch.com/Economist-Intelligence-Unit-v458/Country-Bhutan-
Quarter-6687492/]. Last accessed on 14 November 2012.
6. Deloitte. 2012. ‗Formulation of National Employment Policy for Bhutan: Assessment Report‘.
Report summited to the Ministry of Labour and Human Resources, Royal Government of
Bhutan. January 2012.
7. Franz, Jutta and SonamJatso. 2012. ‗Technical Review of Vocational Education and Training‘.
Social Sector Programme Support. Final Report. 5 – 20 March 2012.
8. Friedman, M. 1977. ‗Inflation and unemployment‘. Journal of Political Economy 85, 451-72.
9. ILO (International Labour Organization). 2012a. Global Employment Trends for Youths 2012.
Geneva: International Labour Office.
10. ILO. 2012b. ‗Importance and Applications‘. [http://www.ilo.org/global/statistics-and-
databases/statistics-overview-and-topics/underemployment/importance-and-applications/
lang--en/index.htm]. Last accessed on 9 October 2012.
11. ILO. (2012c). Underemployment Statistics. Retrieved November 19, 2012, from International
Labour Organization c: http://www.ilo.org/global/statistics-and-databases/statistics-
overview-and-topics/underemployment/lang--en/index.htm
12. RGOB. (2013). Eleventh Five Year Plan (1 July 2013 to 30 June 2018). Gross National Happiness
Commission, RGOB. RGOB.
13. ILO (International Labour Office). 2011.Key Indicators of the Labour Market. 7th Edition. CD-
ROM version. ISBN 978-92-2-020137-4.
14. ILO. n.d. ―The Youth Employment Network‖. [http://www.ilo.org/public/english/employment/
yen/index.htm] accessed on 12 October 2012.
15. Jongchol, Kim. 2000. ‗Historical development‘. In: Weidman, J. and Park Namgi (eds). Higher
Education in Korea: Tradition and Adaptation, New York: Falmer Press, 7-54.
68
16. Kakra, Ajay and NirvanjyotiBhattacharjee. 2009. The Impact of the Global Economic and
Financial Crisis in Least Developed Countries‘ Manufacturing Industry: The Case of the Fruits
& Vegetables Sector in Bhutan & Nepal. Least Developed Countries Ministerial Conference.
Vienna: United Nation Industrial Development Organization.
17. Köhler, Gabriele, Marta Cali and Mariana Stirbu. 2009. Social Protection in South Asia: A Review.
Kathmandu: UNICEF ROSA.
18. National Commission for Women and Children. 2006. 7th CEDAW Periodic Report, Thimpu,
Bhutan.
19. National Statistics Bureau. 2011. Bhutan Multiple Indicator Survey 2010. Thimphu: National
Statistics Bureau. [http://www.nsb.gov.bt/pub/surveys/bmis/BMIS-Report-2010.pdf ]. Last
accessed on 14 November 2012.
20. Osmani, S.R., B.B. Bajracharya, Sonam Tenzing, and Tashi Wangyal. 2007. Macroeconomics
of Poverty Reduction: The Case Study of Bhutan. 2nd Edition. The Asia-Pacific Regional
Programme on Macroeconomics of Poverty Reduction. Colombo: UNDP Regional Centre.
21. Phelps, Edmund S. 1968. ―Money-Wage Dynamics and Labor-Market Equilibrium‖. Journal of
Political Economy 76: 678–711.
22. RGoB (Royal Government of Bhutan). 2012a. ‗Diagnostic Trade Integration Study‘. Thimpu. 19
January 2012. Unpublished.
23. RGoB 2012b. ‗Labour Force Survey Report 2012‘. Thimphu. Unpublished.
24. RGoB. 2012c. ‗MDG Acceleration Framework: Youth Unemployment in Bhutan‘. Thimphu.
Unpublished.
25. RGoB. 2012d. ‗Task Force Report on Balance of Payments with India and the Rupee Shortage‘.
Thimphu: Royal Government of Bhutan. 2012.
26. RGoB 2012e. ‗Bhutan Living Standards Survey 2012 Report‘, National Statistics Bureau, Bhutan
and Asian Development Bank, 2012
27. RGoB 2012f. Cottage, Small & Medium Industry Development Strategy (2012-2020) & Action
Plan (2012-14), Ministry of Economic Affairs, RGoB 2012
28. RGoB. 2011a. Annual Education Statistics 2011. Ministry of Education. Thimphu: Royal
Government of Bhutan.
29. RGoB. 2011b. Bhutan at a Glance. Royal Government of Bhutan. [http://www.nsb.gov.bt/pub/
baag/BAAG%202011.pdf ].
30. RGoB. 2011c. Bhutan Multiple Indicator Survey, May 2011. Thimphu, Bhutan: National Statistics
Bureau.
31. RGoB. 2011d. Labour Force Survey Report 2011. Thimphu: Royal Government of Bhutan.
69
32. RGoB. 2011e. Population Projections Bhutan, 2005-2030. National Statistical Bureau. Thimphu:
Royal Government of Bhutan.
33. RGoB. 2011f. Statistical Year Book of Bhutan 2011. Thimphu: Royal Government of Bhutan.
34. RGoB 2011g. The Technical, Vocational Education and Training Policy, MoLHR, RGoB, 2011
35. RGoB. 2010a. Bhutan at a Glance. Royal Government of Bhutan. [http://www.nsb.gov.bt/pub/
baag/BAAG%202010.pdf ].
36. RGoB. 2010b. National Human Resource Development Policy of the Kingdom of Bhutan, 2010.
Ministry of Labour and Human Resources. Thimphu: Royal Government of Bhutan.
37. RGoB 2010c. New Economic Development Policy, 2010, Royal Government of Bhutan.
38. RGoB 2010d. Tertiary Education Policy of the Kingdom of Bhutan, 2010, Ministry of Education,
RGoB 2010
39. RGoB 2010e. National Youth Policy, 2010, Department of Youth and Sports Ministry of
Education, RGoB 2010
40. RGoB 2010f. The proposed Policy Framework for MSME Development, MSME Division,
Department of Industry, Ministry of Economic Affairs, RGoB 2010.
41. RGoB 2009a. A Country Report: Higher Education in the Kingdom of Bhutan, Cherishing
Dreams and Confronting Challenges. Ministry of Education. Thimphu: Royal Government
of Bhutan.
42. RGoB. 2009b. Labour Force Survey Report 2009.Thimpu: Royal Government of Bhutan.
43. RGoB 2009c. Labour Market Information Bulletin, 2007. Royal Government of Bhutan.
44. [http://www.yweo.bt/labour/employment/lmibulleton2009.pdf ].
45. RGoB 2008a. Establishment Census Report, 2008. Royal Government of Bhutan. [http://www.
molhr.gov.bt/publication/establishment.pdf ].
46. RGoB. 2008b. Education without Compromise: Education Sector Review Commission Report
2008. Thimpu: Royal Government of Bhutan.
47. RGoB 2007a. Labour Market Information Bulletin, 2007. Royal Government of Bhutan. [http://
www.gnhc.gov.bt/wp-content/uploads/2011/RGOBReports/LMI.pdf ].
48. RGoB. 2007b. Statistical Year Book of Bhutan 2011. Thimphu: Royal Government of Bhutan.
49. RGoB. 2006a. Bhutan National Human Development Report 2005: The Challenge of Youth
Employment. Thimpu: Royal Government of Bhutan.
50. RGoB. 2006b. Labour Force Survey Report 2006. Thimphu: Royal Government of Bhutan.
70
51. UNCTAD (United Nations Commission on Trade and Development). 2012, Investment Guide to
Bhutan, Geneva, Switzerland, 2012
52. UNDESA (United Nations Department of Economic and Social Affairs). 2011. World Population
Prospects: The 2010 Revision. CD-ROM version.
53. UNDP (United Nations Development Programme). 2012. One Planet to Share: – Sustaining
Human Progress in a Changing Climate. Asia-Pacific Human Development Report 2012. New
Delhi: Routledge.
54. UNDP. 2010. The Real Wealth of Nations: Pathways to Human Development. Human
Development Report 2010. New York: Palgrave Macmillan.
55. UNESCO (United Nations Educational, Scientific and Cultural Organization). 2011. World Data
on Education 2010/11.
56. Wangchuk, Jigme. 2011. ‗National Employment Policy under Discussion‘. Bhutan Observer. 16
December. [http://www.bhutanobserver.bt/national-employment-policy-discussion/]. Last
accessed on 15 October 2012.
57. World Bank. 2013. Doing Business 2014: Comparing Business Regulations for Domestic Firms
across 189 Countries, 11th Edition, 2013
58. World Bank. 2012. World Development Indicators Online. Last updated on 27 September.
Washington, DC: World Bank. [http://databank.worldbank.org/ddp/home.do]. Last accessed
on 9 October 2012.
59. World Bank. 2011a. ‗PovcalNet‘. Last updated on 1 November. [http://iresearch.worldbank.org/
PovcalNet/ povDuplic.html]. Last accessed on 14 October 2012.
60. World Bank. 2011b. World Development Indicators Online. Washington, DC: World Bank.
[http://databank.worldbank.org/ddp/home.do]. Last accessed on 9 October 2012.
61. World Bank. 2010a. World Development Indicators Database. Washington, DC: World Bank.
62. World Bank. 1993. The East Asian Economic Miracle: Economic Growth and Public Policy.
Washington, DC: World Bank.


72