milk and dairy markets in idaho
TRANSCRIPT

Milk and Dairy Markets in
Idaho
Intermountain IFT Meeting
March 15, 2012
Russ De Kruyf
Director Milk Procurement
Glanbia Foods, Inc.
Overview
What is milk?
Idaho Dairy industry
Milk Buyers and Processors
What Dairy means to Idaho
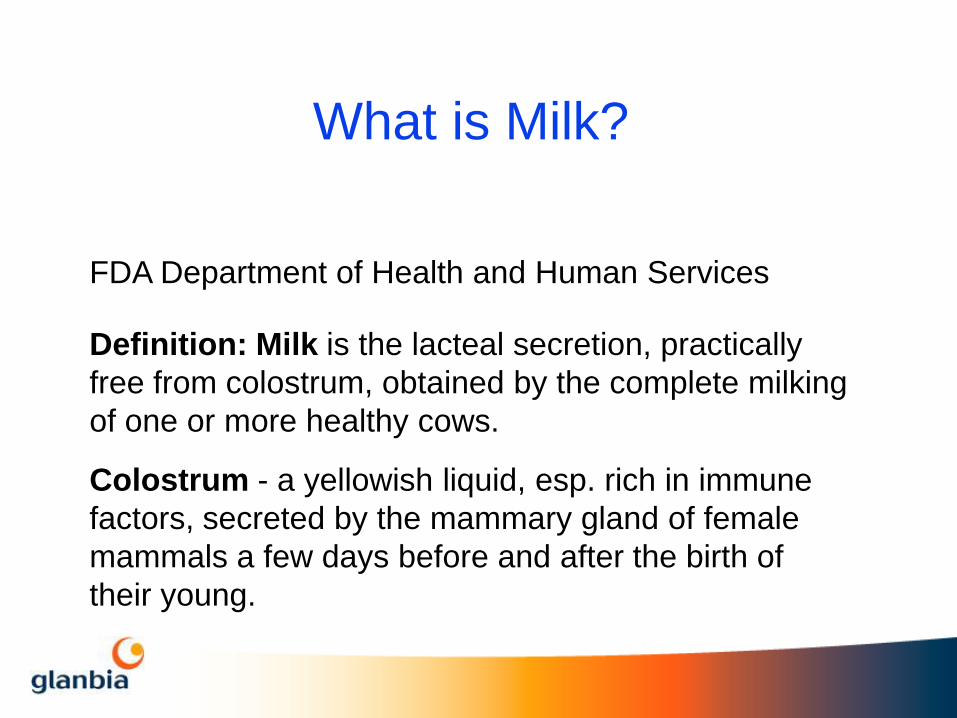
What is Milk?
FDA Department of Health and Human Services
Definition: Milk is the lacteal secretion, practically
free from colostrum, obtained by the complete milking
of one or more healthy cows.
Colostrum - a yellowish liquid, esp. rich in immune
factors, secreted by the mammary gland of female
mammals a few days before and after the birth of
their young.

Milk
Total Solids 12.2%
Nonfat Solids 8.7% Milkfat 3.5%
Ash 0.7% Lactose 4.8% Non Protein N 0.21% True Protein 2.99%
Whey Protein 0.6% Casein 2.39%
Water 87.8%
Components of Milk
Other Solids 5.5% Crude Protein 3.2%

Idaho Dairy Industry
• 578 dairies
• 574,000 cows
• Average size: 993 cows/dairy
• Ranked 2nd in the western United States
• Ranked 3rd in the nation

Each cow in Idaho produces
22,658 lb milk/lactation
74 lb milk/day
Idaho Milk Production

Treasure
Valley 110 Dairies 19.3%
120,699 cows 21.9%
Ave: 1097 cows/dairy
Magic Valley
317 Dairies 55.7%
397,822 Cows 72.2%
Ave: 1255 cows/dairy
Eastern Idaho 142 Dairies 24.9%
32,479 Cows 5.9%
Ave: 229 cows/dairy
Idaho Dairy Industry

Idaho Dairy Operations by Size
Size categories Dairies Percentage of total
< 200 cows 221 37.7%
201-500 cows 97 16.6%
501-1000 cows 101 17.2%
1001-2000 cows 83 14.2%
> 2000 cows 84 14.3%
ISDA, June 2010


Top 10 Milk Production States –
Jan 11 1) California 117M/day
2) Wisconsin 73M/day
3) Idaho 36M/day
4) New York 35M/day
5) Pennsylvania 29M/day
6) Texas 27M/day
7) Minnesota 25M/day
8) Michigan 24M/day
9) New Mexico 22M/day
10) Washington 17M/day


Net exporters of milk and
dairy products (above 600 lbs)
Net importers of dairy products
(at or below 600 lbs)
Deficient even for fluid and soft
products (below 300 lbs)
Idaho produces
more milk per
person than any
other state Idaho #1 Milk Per Capita

How Much Milk Does Idaho
Produce Jan 2012 Milk Volumes:
Idaho- 1,116,000,000 pounds/month
36,000,000 pounds/day
4,186,046 gallons/day
514 truck loads of milk (70K loads)
If we line up one gallon jugs of milk side by side it would be a line
396 miles long – EVERY DAY

Treasure Valley
Sorrento Lactalis, Nampa
Darigold, Caldwell Darigold, Boise MeadowGold, Boise Marathon Cheese, Mountain Home
Magic Valley
Glanbia Foods, Richfield
Glanbia Foods, Gooding
Glanbia Foods, Twin Falls
Jerome Cheese, Jerome
Darigold, Jerome
Idaho Milk Products, Jerome
Cloverleaf Creamery, Buhl
Chobani, Twin Falls 2012
Eastern Idaho Nelson Ricks, Rexburg
Reed’s Dairy, Idaho Falls
Sartori , Blackfoot
Idaho Processors
Magic Valley
Gossner Foods, Heyburn
High Desert Milk, Burley
Brewster Cheese, Rupert
Stoker Wholesale, Burley
Commercial Creamery, Jerome
Ballard Cheese, Gooding
Cache Valley Gossner Foods, Logan
Schreiber, Smithfield
Grasslands, Hyrum

Idaho Processor Capacities Processor Capacities (Daily) 2012
Glanbia 12,000,000
Jerome Cheese 6,500,000
Darigold 5,400,000
Sorrento 5,000,000
Idaho Milk Products 3,200,000
High Desert 2,500,000
Brewster 1,700,000
Gossner (Heyburn) 1,200,000
Meadowgold (Boise) 700,000
Sartori Cheese 430,000
Nelson-Ricks 300,000
Chobani ???

Idaho Milk Buyers and Processors Milk Buyers Milk Processors
Glanbia 25.4% Glanbia 31.3%
Jerome Cheese 17.2% Jerome Cheese 17.1%
Darigold 11.3% Darigold 13.3%
DFA 10.7% Sorento 11.0%
Sorrento 9.0% Idaho Milk Products 8.5%
Idaho Milk Products 8.5% High Desert 6.2%
MVQMP 6.1% Brewster 2.5%
High Desert 5.9% Smithfield/SFI, UT 2.5%
Independent Milk Producers 1.4% Gossner 1.9%
Gossner 1.3% Other out of state 1.6%
Inovative Food Solutions 1.1% Fluid out of state 1.6%
Whitewave/HO 0.9% Meadow Gold (Boise) 1.3%
Snake River Dairymen 0.8% Sartori Cheese 1.2%
Organic Valley 0.2% Nelson Ricks 0.2%
Nelson-Ricks 0.2%
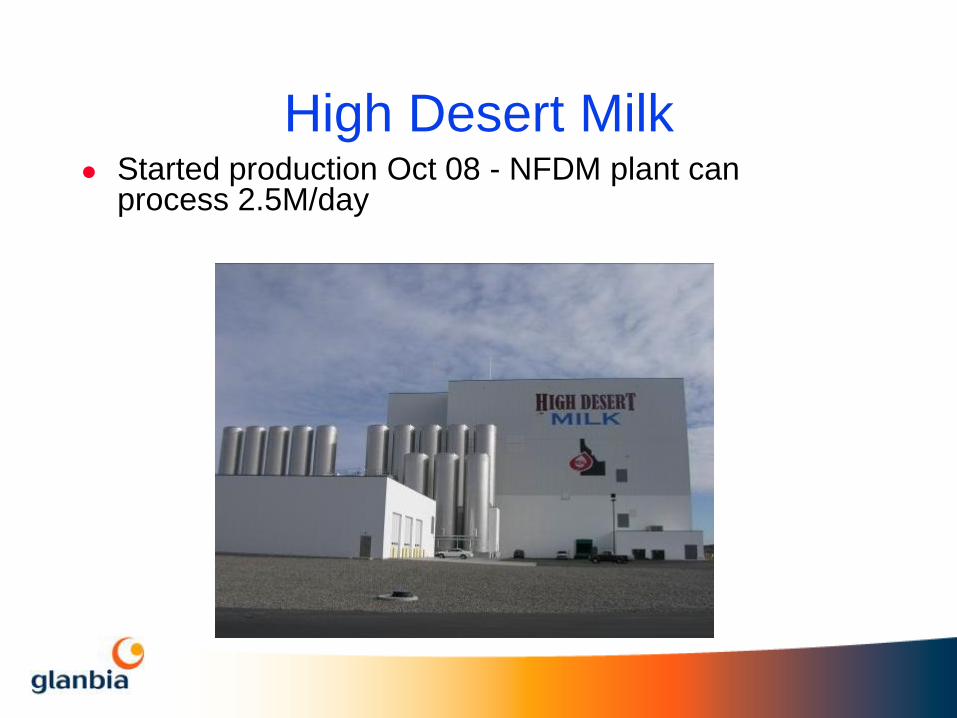
High Desert Milk Started production Oct 08 - NFDM plant can
process 2.5M/day

Idaho Milk Products
Started production Feb/March 09 - MPC plant can process 3.2M/day
Chobani
New Idaho Greek Yogurt Plant in Twin Falls
Startup: Summer 2012
Size: 2M/day
Employees: 400+
More value added dairy products from Idaho
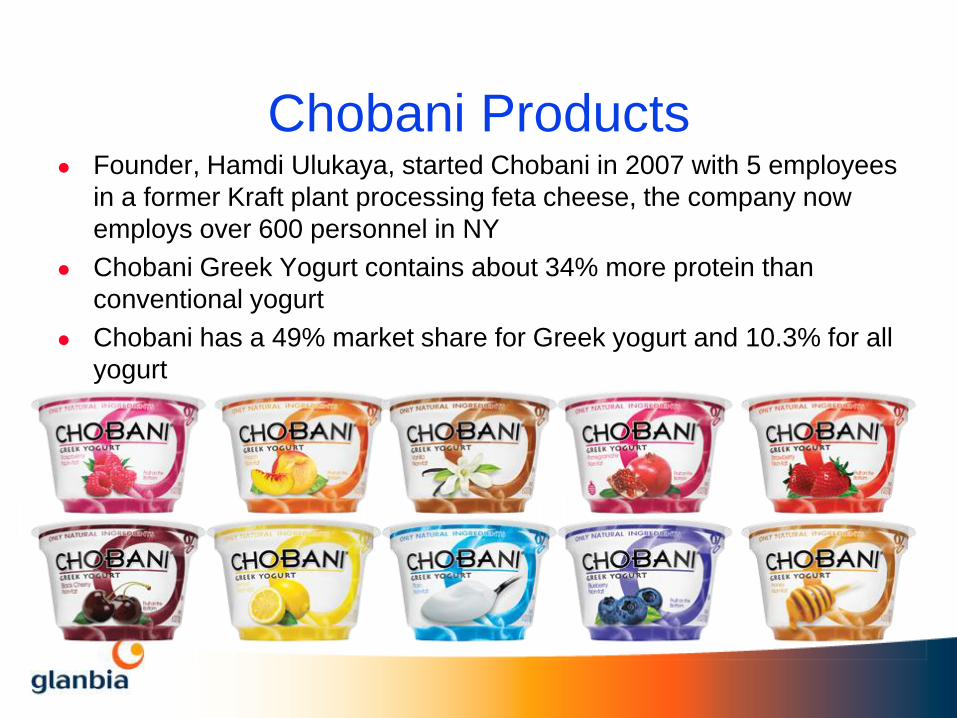
Chobani Products Founder, Hamdi Ulukaya, started Chobani in 2007 with 5 employees
in a former Kraft plant processing feta cheese, the company now
employs over 600 personnel in NY
Chobani Greek Yogurt contains about 34% more protein than
conventional yogurt
Chobani has a 49% market share for Greek yogurt and 10.3% for all
yogurt

Idaho Jobs Created by Dairy
Dairy Farms 8,300
Manufacturing 2,371
Secondary and Induced 22,406
Employment
TOTAL 33,077
Holly & Church, 2008, BSU

Idaho Cash Receipts, 2010
2010 $5.8 billion
12% above 2009
Livestock up 27%, $3.2 billion
Crops down 2%, $2.6 billion
$5.8 billion, 2010
$5.2 billion, 2009
Milk, $1,951, 34%
Beef & Other Livestock,
$1,235, 21%
Nursery & Other Crops,
$403, 7%
Potatoes, $690, 12%
Hay, $374, 6%
Sugarbeets, Onions, Beans
$387 7%
Grain, $744, 13%

Crop acreage, South Central Idaho

Milk Price in Idaho Class I (fluid)
Fluid milk - most value and most perishable. Class II (soft)
fresh products such as yogurt, sour cream, ice cream and frozen dessert products.
Class III (hard) cheese.
Class IV butter and powder – Least value and least perishable.
EPP (AKA Cheese Yield) End Product Pricing
Idaho product mix 69% Cheese 25% Powder 6% Fluid or Soft

Idaho Avg. Milk Price
8.00
10.00
12.00
14.00
16.00
18.00
20.00
Ja
n-9
5
Ma
y-9
5
Se
p-9
5
Ja
n-9
6
Ma
y-9
6
Se
p-9
6
Ja
n-9
7
Ma
y-9
7
Se
p-9
7
Ja
n-9
8
Ma
y-9
8
Se
p-9
8
Ja
n-9
9
Ma
y-9
9
Se
p-9
9
Ja
n-0
0
Ma
y-0
0
Se
p-0
0
Ja
n-0
1
Ma
y-0
1
Se
p-0
1
Ja
n-0
2
Ma
y-0
2
Se
p-0
2
Ja
n-0
3
Ma
y-0
3
Se
p-0
3
Ja
n-0
4
Ma
y-0
4
Se
p-0
4
Ja
n-0
5
Ma
y-0
5
Se
p-0
5
Ja
n-0
6
Ma
y-0
6
Se
p-0
6
Ja
n-0
7
Ma
y-0
7
Se
p-0
7
Ja
n-0
8
Ma
y-0
8
Se
p-0
8
Ja
n-0
9
Ma
y-0
9
Se
p-0
9
Ja
n-1
0
Ma
y-1
0
Se
p-1
0
Ja
n-1
1
Ma
y-1
1
Se
p-1
1


Idaho’s Dairy Industry: Challenges
Feed costs/milk price
Globalization
Immigration
Water availability
Nutrient management
Odor management
Public perception
Price volatility

Thank You