milikapiti remote towns jobs profile · web viewthe areas of vet activity with the most unit...
TRANSCRIPT

Remote towns Jobs profile 2017
MILIKAPITI
JOBS PROFILE MILIKAPITI1

© Northern Territory of Australia 2018
Preferred Reference: Department of Trade, Business and Innovation, 2017 Remote Towns Jobs Profiles, Northern Territory Government, June 2018, Darwin.
Disclaimer
The data in this publication were predominantly collected by conducting a face-to-face survey of businesses within town boundaries during mid-2017. The collection methodology was created in accordance with Australian Bureau of Statistics data quality framework principles. Data in this publication are only reflective of those businesses reported on as operating in the town at the time of data collection (see table at the end of publication for list of businesses reported on).
To comply with privacy legislation or where appropriate, some data in this publication may have been adjusted and will not reflect the actual data reported by businesses. As a result of this, combined with certain data not being reported by some businesses, some components may not add to totals. Changes over time may also reflect business' change in propensity to report on certain data items rather than actual changes over time. Total figures have generally not been adjusted.
Notes for each table and chart are alphabetically ordered and listed at the end of the publication.
Any use of this report for commercial purposes is not endorsed by the Department of Trade, Business and Innovation.
JOBS PROFILE MILIKAPITI2

Contents
Milikapiti......................................................................................................................... 4Introduction.................................................................................................................... 5Summary........................................................................................................................ 6Jobs Overview................................................................................................................. 7Jobs by Aboriginal Status................................................................................................8Jobs by Sector: Private and Public................................................................................10Job Status: Permanent and Temporary.........................................................................13Job Vacancies............................................................................................................... 15Jobs by Industry............................................................................................................16Jobs by Occupation.......................................................................................................19Jobs by Industry by Occupation....................................................................................21Jobs by Gender.............................................................................................................22Jobs by Age...................................................................................................................25Vocational Education and Training...............................................................................28Population..................................................................................................................... 30Community Development Programme.........................................................................32Businesses....................................................................................................................33Notes............................................................................................................................ 34Abbreviations and Acronyms........................................................................................35
JOBS PROFILE MILIKAPITI3

MilikapitiMilikapiti is located on Melville Island which is approximately 100 kilometres north of Darwin, with a population of 458 residents.
Source: Department of Trade, Business and Innovation
JOBS PROFILE MILIKAPITI4

IntroductionThis jobs profile provides a snapshot of jobs and the characteristics of job holders in Milikapiti as at July 2017.This job profile is one of 28 profiles developed for remote towns in the Northern Territory. It is anticipated these and subsequent profiles will contribute to a robust evidence base to inform decision making in and relating to these remote Territory towns. This profile contains information collected by the Northern Territory Department of Trade, Business and Innovation from businesses operating within the town and is supplemented by other administrative data sets and information.Each profile provides up-to-date information that is intended to inform the planning and design of current and future government programs and as an evidence base to inform decision making relating to workforce development, enterprise and job opportunities.The data collection methodology and corresponding questionnaire were created in partnership with the Australian Bureau of Statistics (ABS) and in accordance with ABS data quality framework and survey principles.The surveys were predominantly conducted by the Department’s Small Business Champions and Workforce Training Coordinators, on a face-to-face basis with business representatives.The information collected and reported on represents a significant goodwill investment by those businesses and organisations that participated. Each business is listed at the end of this publication.
JOBS PROFILE MILIKAPITI5

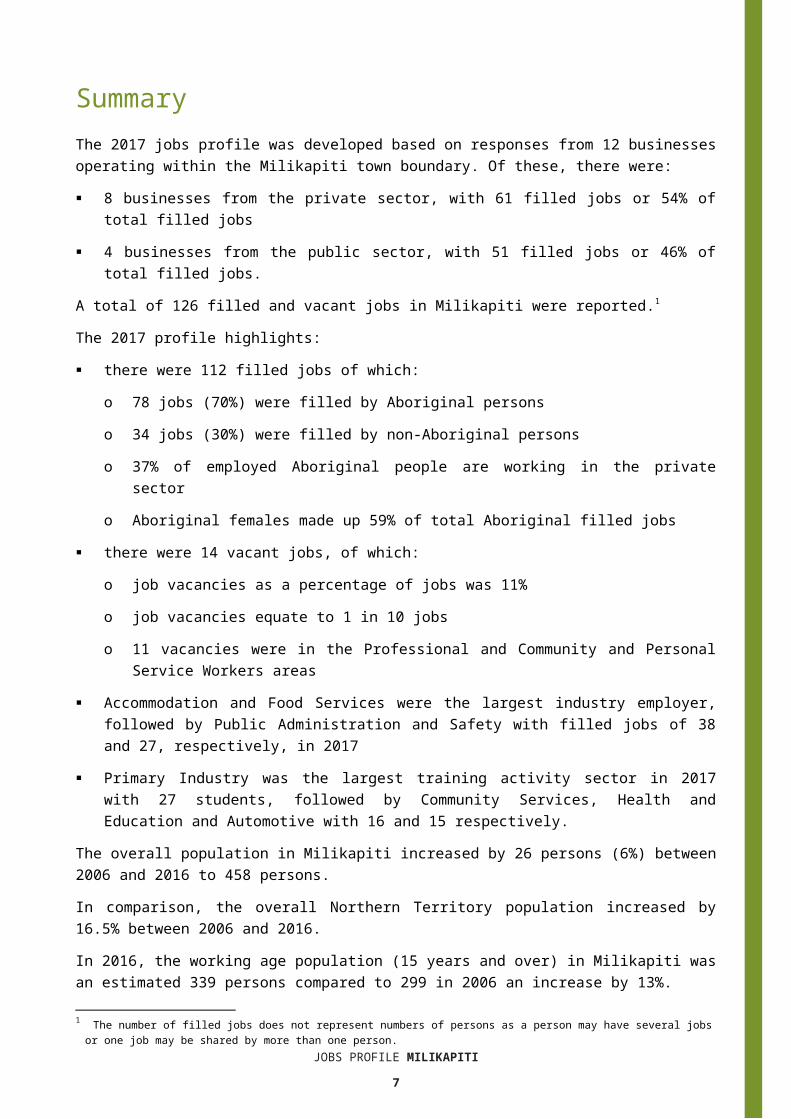
SummaryThe 2017 jobs profile was developed based on responses from 12 businesses operating within the Milikapiti town boundary. Of these, there were: 8 businesses from the private sector, with 61 filled jobs or 54% of total filled jobs 4 businesses from the public sector, with 51 filled jobs or 46% of total filled jobs.A total of 126 filled and vacant jobs in Milikapiti were reported.1 The 2017 profile highlights: there were 112 filled jobs of which:
o 78 jobs (70%) were filled by Aboriginal personso 34 jobs (30%) were filled by non-Aboriginal personso 37% of employed Aboriginal people are working in the private sectoro Aboriginal females made up 59% of total Aboriginal filled jobs
there were 14 vacant jobs, of which:o job vacancies as a percentage of jobs was 11%o job vacancies equate to 1 in 10 jobso 11 vacancies were in the Professional and Community and Personal Service
Workers areas Accommodation and Food Services were the largest industry employer, followed
by Public Administration and Safety with filled jobs of 38 and 27, respectively, in 2017
Primary Industry was the largest training activity sector in 2017 with 27 students, followed by Community Services, Health and Education and Automotive with 16 and 15 respectively.
The overall population in Milikapiti increased by 26 persons (6%) between 2006 and 2016 to 458 persons.In comparison, the overall Northern Territory population increased by 16.5% between 2006 and 2016.In 2016, the working age population (15 years and over) in Milikapiti was an estimated 339 persons compared to 299 in 2006 an increase by 13%.There were 0.4 jobs in Milikapiti per working age person compared to 0.4 jobs per working age person across the 28 remote towns in the Northern Territory.
1 The number of filled jobs does not represent numbers of persons as a person may have several jobs or one job may be shared by more than one person.
JOBS PROFILE MILIKAPITI6
Jobs OverviewTable 1: Count of filled jobs and vacancies, 2017 (a)(b)
2017Total All Jobs 126Vacancies 14Vacancies as % of Total All Jobs 11.1%Filled Jobs 112Full-time 63Part-time 49
Source: Department of Trade, Business and Innovation
Chart 1: Count of vacant jobs and filled jobs by full-time/part-time status, 2017 (a)(b)
Source: Department of Trade, Business and Innovation
In 2017 in Milikapiti: of the 112 filled jobs, there were:
o 63 were full-time jobso 49 were part-time jobs
there were 14 total job vacancies.
JOBS PROFILE MILIKAPITI7

Jobs by Aboriginal StatusChart 2: Count of filled jobs by Aboriginal status, 2017 (a)(c)
Source: Department of Trade, Business and Innovation
In 2017 in Milikapiti: of the 112 filled jobs:
o 78 jobs were filled by Aboriginal personso 34 jobs were filled by non-Aboriginal persons
Aboriginal persons accounted for 70% of job holders.
Table 2: Count of filled jobs by full-time/part-time status and Aboriginal status of person in job, 2017 (a)(b)(c)
Indicator2017
Aboriginal Non-Aboriginal Total
Full-time 31 32 63Part-time 47 2 49Total 78 34 112
Source: Department of Trade, Business and Innovation
JOBS PROFILE MILIKAPITI8

Chart 3: Count of filled jobs by full-time/part-time status and Aboriginal status of person in job, 2017 (a)(b)(c)
Source: Department of Trade, Business and Innovation
In 2017 in Milikapiti: of the 112 filled jobs:
o 31 were full-time jobs filled by Aboriginal personso 47 were part-time jobs filled by Aboriginal personso 32 were full-time jobs filled by non-Aboriginal personso 2 were part-time jobs filled by non-Aboriginal persons.
JOBS PROFILE MILIKAPITI9

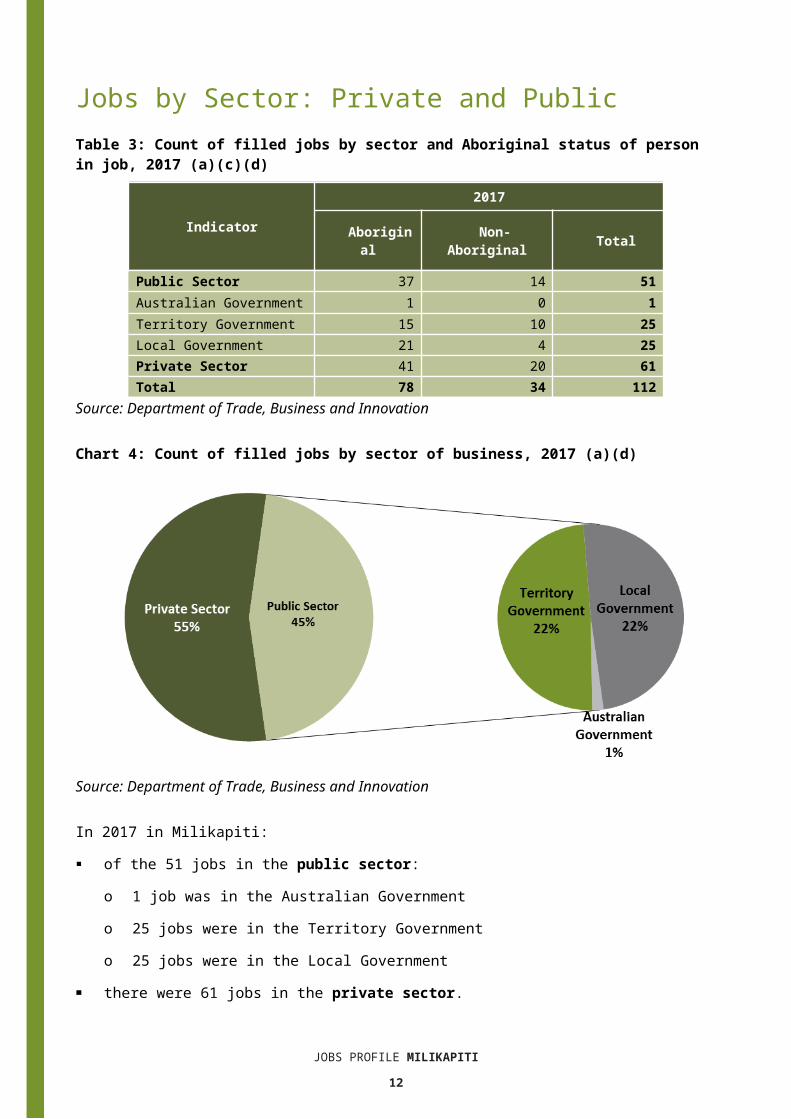
Jobs by Sector: Private and PublicTable 3: Count of filled jobs by sector and Aboriginal status of person in job, 2017 (a)(c)(d)
Indicator
2017
Aboriginal Non-Aboriginal Total
Public Sector 37 14 51Australian Government 1 0 1Territory Government 15 10 25Local Government 21 4 25Private Sector 41 20 61Total 78 34 112
Source: Department of Trade, Business and Innovation
Chart 4: Count of filled jobs by sector of business, 2017 (a)(d)
Source: Department of Trade, Business and Innovation
In 2017 in Milikapiti: of the 51 jobs in the public sector:
o 1 job was in the Australian Government o 25 jobs were in the Territory Governmento 25 jobs were in the Local Government
there were 61 jobs in the private sector.
JOBS PROFILE MILIKAPITI10

Chart 5: Count of filled jobs by sector and Aboriginal status of person in job, 2017 (a)(c)(d)
Source: Department of Trade, Business and Innovation
In 2017 in Milikapiti: of the 51 jobs in the public sector:
o 37 jobs were filled by Aboriginal personso 14 jobs were filled by non-Aboriginal persons
of the 61 jobs in the private sector:o 41 jobs were filled by Aboriginal personso 20 jobs were filled by non-Aboriginal persons.
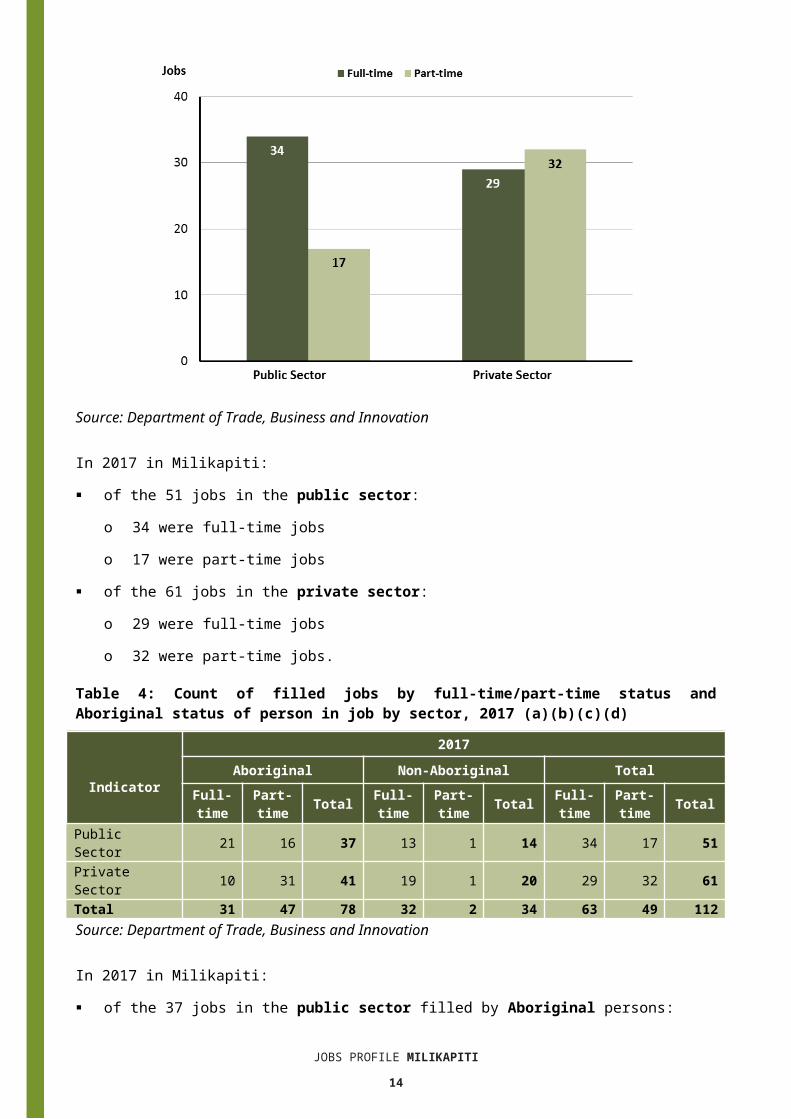
Chart 6: Count of filled jobs by sector and full-time/part-time status of person in job, 2017 (a)(b)(d)
JOBS PROFILE MILIKAPITI11
Source: Department of Trade, Business and Innovation
In 2017 in Milikapiti: of the 51 jobs in the public sector:
o 34 were full-time jobs o 17 were part-time jobs
of the 61 jobs in the private sector:o 29 were full-time jobs o 32 were part-time jobs.
Table 4: Count of filled jobs by full-time/part-time status and Aboriginal status of person in job by sector, 2017 (a)(b)(c)(d)
Indicator
2017Aboriginal Non-Aboriginal Total
Full-time
Part-time Total Full-
timePart-time Total Full-
timePart-time Total
Public Sector 21 16 37 13 1 14 34 17 51Private Sector 10 31 41 19 1 20 29 32 61Total 31 47 78 32 2 34 63 49 112Source: Department of Trade, Business and Innovation
In 2017 in Milikapiti: of the 37 jobs in the public sector filled by Aboriginal persons:
o 21 were full-time jobs o 16 were part-time jobs
of the 41 jobs in the private sector filled by Aboriginal persons:
JOBS PROFILE MILIKAPITI12

o 10 were full-time jobso 31 were part-time jobs
of the 14 jobs in the public sector filled by non-Aboriginal persons:o 13 were full-time jobs o 1 was a part-time job
of the 20 jobs in the private sector filled by non-Aboriginal persons:o 19 were full-time jobs o 1 was a part-time job.
JOBS PROFILE MILIKAPITI13
Job Status: Permanent and TemporaryTable 5: Count of filled jobs by employment status and Aboriginal status of person in job, 2017 (a)(c)(e)
Indicator
2017 Aborigin
al Non-
Aboriginal Total
Permanent 34 16 50Temporary 44 18 62Total 78 34 112
Source: Department of Trade, Business and Innovation
Chart 7: Count of filled jobs by employment status and Aboriginal status of person in job, 2017(a)(c)(e)
Source: Department of Trade, Business and Innovation
In 2017 in Milikapiti: there were 50 permanent jobs, of which:
o 34 jobs were filled by Aboriginal personso 16 jobs were filled by non-Aboriginal persons
there were 62 temporary jobs, of which:o 44 jobs were filled by Aboriginal personso 18 jobs were filled by non-Aboriginal persons.
JOBS PROFILE MILIKAPITI14

Table 6: Count of filled jobs by sector, Aboriginal status and employment status of person in job, 2017 (a)(c)(d)(e)
Indicator
2017
Aboriginal Non-Aboriginal Total
Perm Temp Total Perm Temp Total Perm Temp Total
Public Sector 28 9 37 6 8 14 34 17 51Private Sector 6 35 41 10 10 20 16 45 61Total 34 44 78 16 18 34 50 62 112Source: Department of Trade, Business and Innovation
In 2017 in Milikapiti: of the 51 jobs in the public sector:
o 34 jobs were permanent, of which: 28 jobs were filled by Aboriginal persons 6 jobs were filled by non-Aboriginal persons
o 17 jobs were temporary, of which: 9 jobs were filled by Aboriginal persons 8 jobs were filled by non-Aboriginal persons
of the 61 jobs in the private sector:o 16 jobs were permanent, of which:
6 jobs were filled by Aboriginal persons 10 jobs were filled by non-Aboriginal persons
45 jobs were temporary, of which:o 35 jobs were filled by Aboriginal personso 10 jobs were filled by non-Aboriginal persons.
JOBS PROFILE MILIKAPITI15

Job VacanciesTable 7: Job vacancies, 2017
Indicator 2017Job vacancies 14
Source: Department of Trade, Business and Innovation
Table 8: Job vacancies by occupation, 2017 (f)(g)
Occupation (ANZSCO major group) 2017Professionals 6Clerical and Administrative Workers 1Community and Personal Service Workers 5Labourers 1Technicians and Trades Workers 1Total 14
Source: Department of Trade, Business and Innovation
Table 9: Job vacancies by job title, July 2017 (f)
Job Vacancy No.Carpenter 1Community Worker 3Family Support Worker 1General Clerk 1Handyperson 1Primary School Teacher 3Recreation Officer 2Secondary School Teacher 1Teachers' Aide 1 Total 14
Source: Department of Trade, Business and Innovation
In 2017 in Milikapiti: there were 14 vacancies reported of the 14 reported vacancies, the largest requirements were for:
o 6 Professionals, the majority of which is in the following job: Primary School Teacher
o 5 Community and Personal Service Workers, the majority of which is in the following job: Community Worker.
JOBS PROFILE MILIKAPITI16

Jobs by IndustryTable 10: Count of filled jobs by industry of business, 2017 (a)(h)
Industry (ANZSIC Division)2017
Total % of Total
Accommodation and Food Services 38 33.9%Arts and Recreation Services 8 7.1%Education and Training 14 12.5%Health Care and Social Assistance 14 12.5%Public Administration and Safety 27 24.1%Retail Trade 9 8.0%Transport, Postal and Warehousing 2 1.8%Total 112 100.0
%Source: Department of Trade, Business and Innovation
In 2017 in Milikapiti: the Accommodation and Food Services industry was the largest industry
employer, with 38 filled jobs or 33.9% of filled jobs other significant industry employers were:
o Public Administration and Safety with 27 jobs (or 24.1% of filled jobs)o Education and Training with 14 jobs (or 12.5% of filled jobs)o Health Care and Social Assistance with 14 jobs (or 12.5% of filled jobs).
Table 11: Count of filled jobs by industry of business and Aboriginal status of person in job, 2017 (a)(c)(h)
Industry (ANZSIC division)
2017
Aboriginal
Non-Aboriginal Total
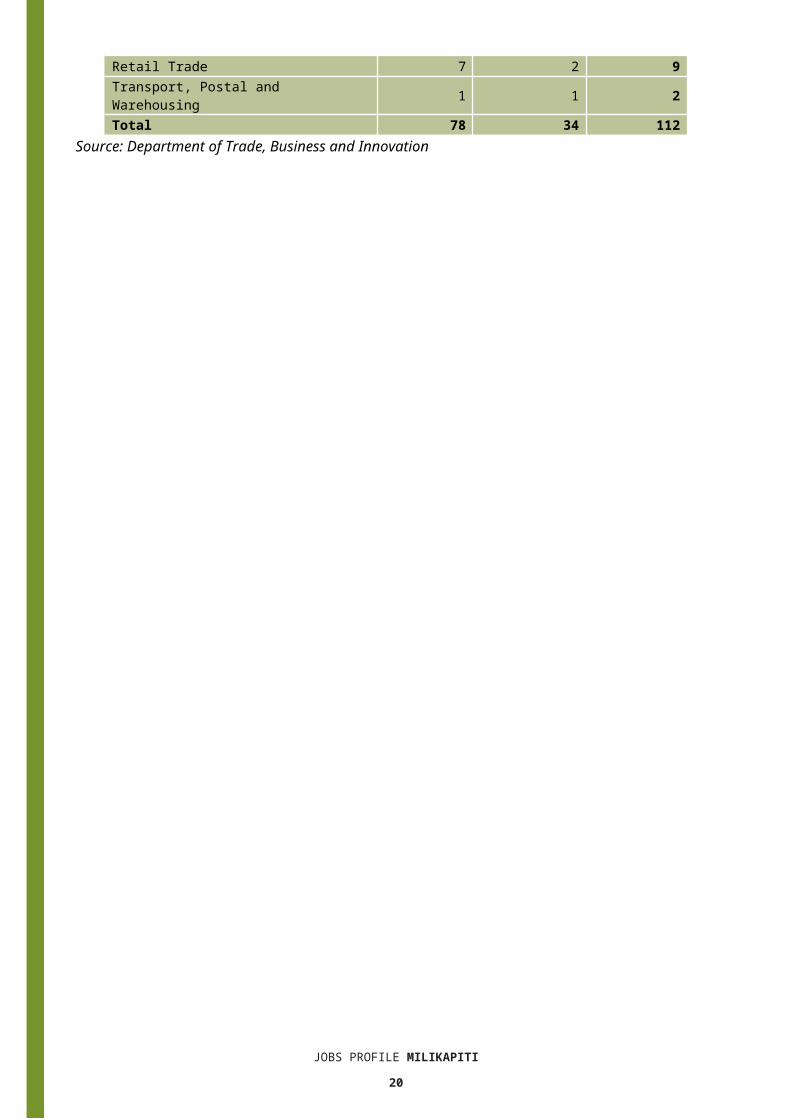
Accommodation and Food Services 23 15 38Arts and Recreation Services 6 2 8Education and Training 9 5 14Health Care and Social Assistance 9 5 14Public Administration and Safety 23 4 27Retail Trade 7 2 9Transport, Postal and Warehousing 1 1 2Total 78 34 112
Source: Department of Trade, Business and Innovation
JOBS PROFILE MILIKAPITI17

Chart 8: Count of filled jobs by top 5 industries of business and Aboriginal status of person in job, 2017 (a)(c)(h)
Source: Department of Trade, Business and Innovation
In 2017 in Milikapiti: of the 78 jobs filled by Aboriginal persons, there were:
o 23 jobs in Accommodation and Food Serviceso 23 jobs in Public Administration and Safetyo 9 jobs in Education and Training
of the 34 jobs filled by non-Aboriginal persons, there were:o 15 jobs in Accommodation and Food Serviceso 4 jobs in Public Administration and Safetyo 5 jobs in Education and Training.
JOBS PROFILE MILIKAPITI18

Table 12: Count of filled jobs by industry, employment status and Aboriginal status of person in job, 2017 (a)(c)(e)(h)
Industry (ANZSIC division)
2017
Aboriginal Non-Aboriginal TotalPerm
Temp
Total
Perm
Temp
Total
Perm
Temp
Total
Accommodation and Food Services 1 22 23 8 7 15 9 29 38
Arts and Recreation Services 0 6 6 2 0 2 2 6 8Education and Training 2 7 9 3 2 5 5 9 14Health Care and Social Assistance 4 5 9 0 5 5 4 10 14Public Administration and Safety 23 0 23 3 1 4 26 1 27
Retail Trade 4 3 7 0 2 2 4 5 9Transport, Postal and Warehousing 0 1 1 0 1 1 0 2 2
Total 34 44 78 16 18 34 50 62 112
Source: Department of Trade, Business and Innovation
In 2017 in Milikapiti: of the 50 permanent jobs, there were:
o 26 jobs in Public Administration and Safety, including: 23 jobs filled by Aboriginal persons 3 jobs filled by non-Aboriginal persons
o 9 jobs in Accommodation and Food Services, including: 1 job was filled by an Aboriginal person 8 jobs filled by non-Aboriginal persons
o 5 jobs in Education and Training, including: 2 jobs filled by Aboriginal persons 3 jobs filled by non-Aboriginal persons
of the 62 temporary jobs, there were:o 29 jobs in Accommodation and Food Services, including:
22 jobs filled by Aboriginal persons 7 jobs filled by non-Aboriginal persons
o 10 jobs in Health Care and Social Assistance, including: 5 jobs filled by Aboriginal persons 5 jobs filled by non-Aboriginal persons
o 9 jobs in Education and Training, including: 7 jobs filled by Aboriginal persons
JOBS PROFILE MILIKAPITI19
2 jobs filled by non-Aboriginal persons.
JOBS PROFILE MILIKAPITI20

Jobs by OccupationTable 13: Count of filled jobs by occupation, 2017 (a)(f)(g)
Occupation (ANZSCO major group)2017
Total % of TotalClerical and Administrative Workers 9 8.0%Community and Personal Service Workers 35 31.3%Labourers 23 20.5%Machinery Operators and Drivers 2 1.8%Managers 14 12.5%Professionals 15 13.4%Sales Workers 7 6.3%Technicians and Trades Workers 7 6.3%Total 112 100.0
%Source: Department of Trade, Business and Innovation
Chart 9: Count of filled jobs by occupation, 2017 (a)(f)(g)
Source: Department of Trade, Business and Innovation
In 2017 in Milikapiti: Community and Personal Service Workers was the largest occupation
classification in terms of filled jobs, accounting for 35 jobs (31.3% of total filled jobs)o other significant occupation classifications were:o Labourers (23 jobs or 20.5%) o Professionals (15 jobs or 13.4%) o Managers (14 jobs or 12.5%).
JOBS PROFILE MILIKAPITI21

Table 14: Count of filled jobs by ANZSCO occupation by Aboriginal status of person employed in job, 2017 (a)(c)(f)(g)
Occupation (ANZSCO major group)
2017
Aboriginal
Non-Aboriginal Total
Clerical and Administrative Workers 9 0 9Community and Personal Service Workers 27 8 35
Labourers 19 4 23Machinery Operators and Drivers 1 1 2Managers 2 12 14Professionals 10 5 15Sales Workers 7 0 7Technicians and Trades Workers 3 4 7Total 78 34 112
Source: Department of Trade, Business and Innovation
In 2017 in Milikapiti: of the 78 jobs filled by Aboriginal persons, there were:
o 27 Community and Personal Service Workerso 19 Labourerso 10 Professionalso 9 Clerical and Administrative Workerso 7 Sales Worker
of the 34 jobs filled by non-Aboriginal persons, there were:o 12 Managerso 8 Community and Personal Service Workerso 5 Professionalso 4 Technicians and Trades Workerso 5 Labourers.
JOBS PROFILE MILIKAPITI22
Jobs by Industry by OccupationTable 15: Count of filled jobs by occupation and by industry, 2017 (a)(f)(g)(h).
2017
Industry (ANZSIC Division)
Occupation (ANZSCO major group)
Cl
eric
al a
nd
Adm
inis
trat
ive
Co
mm
unit
y an
d Pe
rson
al S
ervi
ce
La
bour
ers
M
achi
nery
O
pera
tors
and
Dri
vers
M
anag
ers
Pr
ofes
sion
als
Sa
les
Wor
kers
Te
chni
cian
s an
d Tr
ades
Wor
kers
O
ther
occ
upat
ions
To
tal
Accommodation and Food Services 1 15 9 0 6 2 0 5 0 38Arts and Recreation Services 0 0 1 0 2 5 0 0 0 8Education and Training 1 6 1 0 1 5 0 0 0 14Health Care and Social Assistance 2 7 3 0 1 1 0 0 0 14Public Administration and Safety 5 7 9 0 2 2 0 2 0 27Retail Trade 0 0 0 0 2 0 7 0 0 9Transport, Postal and Warehousing 0 0 0 2 0 0 0 0 0 2
Total 9 35
23 2 1
415 7 7 0 11
2Source: Department of Trade, Business and Innovation
In 2017 in Milikapiti: the majority of Community and Personal Service Workers (35) filled jobs (the
largest occupation group) were shared across Accommodation and Food Services, Health Care and Social Assistance and Public Administration and Safety industries
Accommodation and Food Services provides the most filled jobs within an industry group.
JOBS PROFILE MILIKAPITI23

Jobs by GenderTable 16: Count of filled jobs by gender and Aboriginal status of person employed in job, 2017 (a)(c)(i)
Indicator2017
Aboriginal Non-Aboriginal Total
Male 32 22 54Female 46 12 58Total 78 34 112
Source: Department of Trade, Business and Innovation
Chart 10: Count of filled jobs by gender and Aboriginal status of person in job, 2017 (a)(c)(i)
Source: Department of Trade, Business and Innovation
In 2017 in Milikapiti: of the 54 jobs filled by males there were:
o 32 were Aboriginal
o 22 were non-Aboriginal
of the 58 jobs filled by females there were:o 46 were Aboriginal
o 12 were non-Aboriginal.
JOBS PROFILE MILIKAPITI24

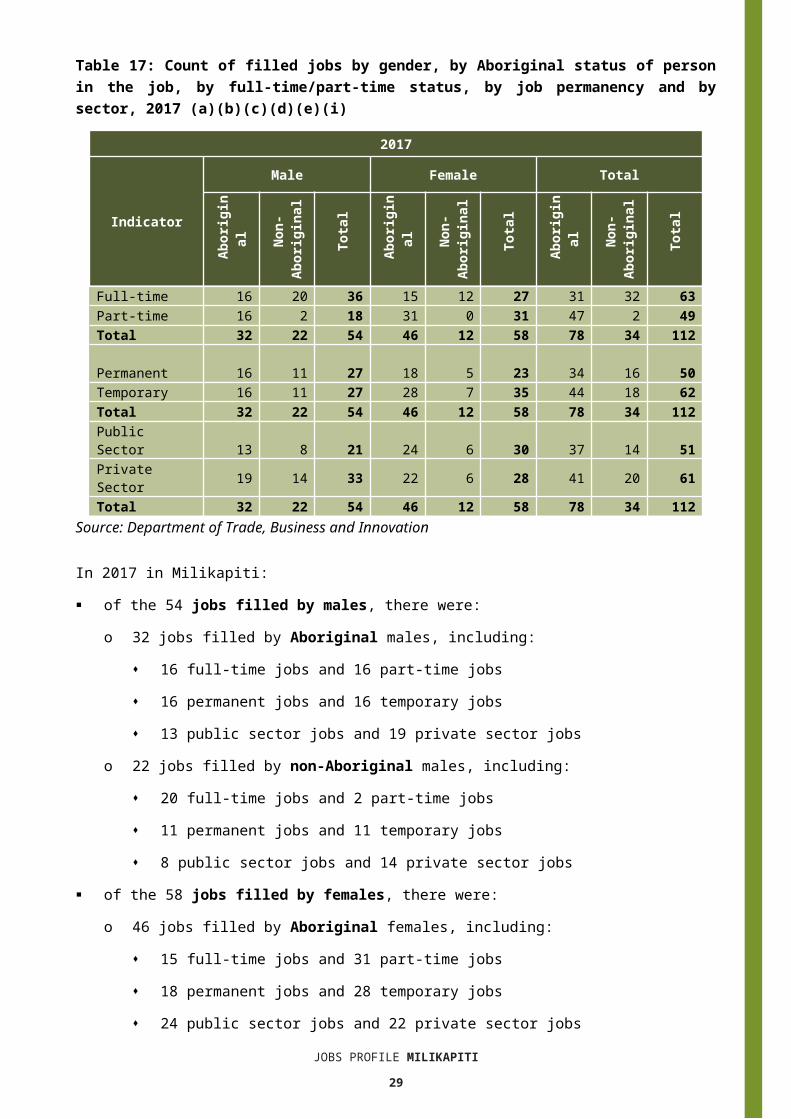
Table 17: Count of filled jobs by gender, by Aboriginal status of person in the job, by full-time/part-time status, by job permanency and by sector, 2017 (a)(b)(c)(d)(e)(i)
2017
Indicator
Male Female Total
Ab
orig
inal
Non
-Ab
orig
inal
Tot
al
Ab
orig
inal
Non
-Ab
orig
inal
Tot
al
Ab
orig
inal
Non
-Ab
orig
inal
Tot
al
Full-time 16 20 36 15 12 27 31 32 63Part-time 16 2 18 31 0 31 47 2 49Total 32 22 54 46 12 58 78 34 112
Permanent 16 11 27 18 5 23 34 16 50Temporary 16 11 27 28 7 35 44 18 62Total 32 22 54 46 12 58 78 34 112
Public Sector 13 8 21 24 6 30 37 14 51Private Sector 19 14 33 22 6 28 41 20 61Total 32 22 54 46 12 58 78 34 112
Source: Department of Trade, Business and Innovation
In 2017 in Milikapiti: of the 54 jobs filled by males, there were:
o 32 jobs filled by Aboriginal males, including: 16 full-time jobs and 16 part-time jobs 16 permanent jobs and 16 temporary jobs 13 public sector jobs and 19 private sector jobs
o 22 jobs filled by non-Aboriginal males, including: 20 full-time jobs and 2 part-time jobs 11 permanent jobs and 11 temporary jobs 8 public sector jobs and 14 private sector jobs
of the 58 jobs filled by females, there were:o 46 jobs filled by Aboriginal females, including:
15 full-time jobs and 31 part-time jobs 18 permanent jobs and 28 temporary jobs 24 public sector jobs and 22 private sector jobs
JOBS PROFILE MILIKAPITI25

o 12 jobs filled by non-Aboriginal females, including: 12 full-time jobs and 0 part-time jobs 5 permanent jobs and 7 temporary jobs 6 public sector jobs and 6 private sector jobs.
JOBS PROFILE MILIKAPITI26

Jobs by AgeTable 18: Count of filled jobs by age and Aboriginal status of person employed in job, 2017 (a)(c)(j)
Indicator
2017
Aboriginal Non-Aboriginal Total
15-24 years 15 1 1625-44 years 39 15 5445+ years 24 18 42Total 78 34 112
Source: Department of Trade, Business and Innovation
Chart 11: Count of filled jobs by age and Aboriginal status of person in job, 2017 (a)(c)(j)
Source: Department of Trade, Business and Innovation
In 2017 in Milikapiti: of the 16 jobs filled by persons aged 15-24 years, there were:
o 15 jobs were filled by Aboriginal personso 1 job was filled by a non-Aboriginal person
of the 54 jobs filled by persons aged 25-44 years, there were:o 39 jobs were filled by Aboriginal personso 15 jobs were filled by non-Aboriginal persons
of the 42 jobs filled by persons aged 45+ years, there were:o 24 jobs were filled by Aboriginal personso 18 jobs were filled by non-Aboriginal persons.
JOBS PROFILE MILIKAPITI27

Table 19: Count of filled jobs by age, by Aboriginal status of person in the job, by full-time/part-time status, by job permanency and by sector, July 2017 (a)(b)(c)(d)(e)(i)
2017
Indicator
15-24 years 25-44 years 45+ years Total
Ab
orig
inal
Non
-Ab
orig
inal
Tot
al
Ab
orig
inal
Non
-Ab
orig
inal
Tot
al
Ab
orig
inal
Non
-Ab
orig
inal
Tot
al
Ab
orig
inal
Non
-Ab
orig
inal
Tot
al
Full-time 6 1 7 13 14 27 12 17 29 31 32 63Part-time 9 0 9 26 1 27 12 1 13 47 2 49Total 15 1 16 39 15 54 24 18 42 78 34 11
2
Permanent 8 0 8 10 11 21 16 5 21 34 16 50Temporary 7 1 8 29 4 33 8 13 21 44 18 62Total 15 1 16 39 15 54 24 18 42 78 34 11
2
Public Sector 9 1 10 16 4 20 12 9 21 37 14 51Private Sector 6 0 6 23 11 34 12 9 21 41 20 61
Total 15 1 16 39 15 54 24 18 42 78 34 112
Source: Department of Trade, Business and Innovation
In 2017 in Milikapiti: of the 16 jobs filled by persons aged 15-24 years, there were:
o 15 jobs filled by Aboriginal persons, of which: 6 were full-time jobs and 9 were part-time jobs 8 were permanent jobs and 7 were temporary jobs 9 were public sector jobs and 6 were private sector jobs
o 1 job was filled by a non-Aboriginal person, of which: 1 was a full-time job and none were part-time jobs none were permanent jobs and 1 was a temporary job 1 was a public sector job and none were private sector jobs
of the 54 jobs filled by persons aged 25-44 years, there were:o 39 jobs filled by Aboriginal persons, of which:
13 were full-time jobs and 26 were part-time jobs 10 were permanent jobs and 29 were temporary jobs 16 were public sector jobs and 23 were private sector jobs
JOBS PROFILE MILIKAPITI28
o 15 jobs filled by non-Aboriginal persons, of which: 14 were full-time jobs and 1 was a part-time job 11 were permanent jobs and 4 were temporary jobs 4 were public sector jobs and 11 were private sector jobs
of the 42 jobs filled by persons aged 45+ years, there were:o 24 jobs filled by Aboriginal persons, of which:
12 were full-time jobs and 12 were part-time jobs 16 were permanent jobs and 8 were temporary jobs 12 were public sector jobs and 12 were private sector jobs
o 18 jobs filled by non-Aboriginal persons, of which: 17 were full-time jobs and 1 was a part-time job 5 were permanent jobs and 13 were temporary jobs 9 were public sector jobs and 9 were private sector jobs.
JOBS PROFILE MILIKAPITI29

Vocational Education and TrainingTable 20: Northern Territory Vocational Education and Training (VET) students 2016 (k)
VET Funding Group2016
No. % of Total
Automotive 15 23Building and Construction 3 5Community Services, Health and Education 16 24Primary Industry 27 41Tourism and Hospitality 5 8Total 6
6 100Source: Department of Trade, Business and Innovation
In Milikapiti in 2016: there were 66 VET students the areas of VET activity with the most students were Primary Industry (27),
Community Services, Health and Education (16), and Automotive (15).
Table 21: Northern Territory Vocational Education and Training (VET) unit enrolments 2016 (l),
VET Funding Group2016
No. % of Total
Automotive 167 61
Community Services, Health and Education 14 5Primary Industry 61 22Tourism and Hospitality 30 11Total 27
3 100Source: Department of Trade, Business and Innovation
In Milikapiti in 2016: there were 273 VET unit enrolments the areas of VET activity with the most unit enrolments were Automotive (167),
Primary Industry (61), and Tourism and Hospitality (30).
JOBS PROFILE MILIKAPITI30

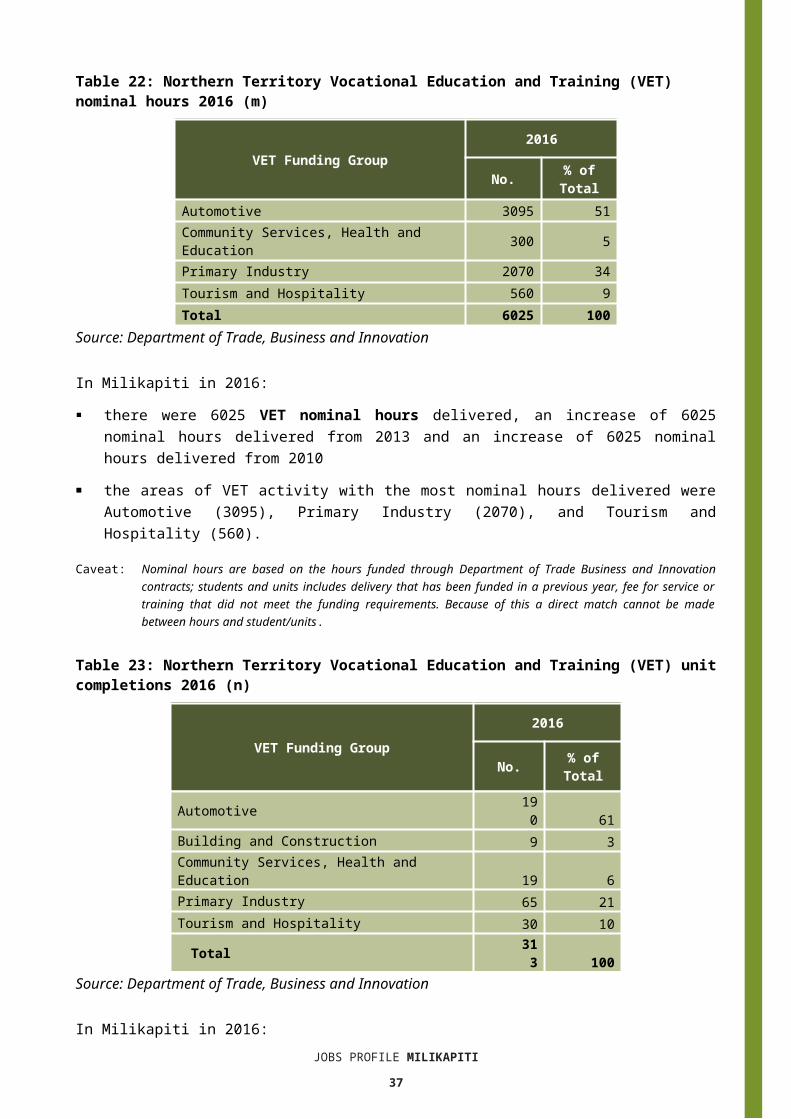
Table 22: Northern Territory Vocational Education and Training (VET) nominal hours 2016 (m)
VET Funding Group2016
No. % of Total
Automotive 3095 51Community Services, Health and Education 300 5Primary Industry 2070 34Tourism and Hospitality 560 9Total 6025 100
Source: Department of Trade, Business and Innovation
In Milikapiti in 2016: there were 6025 VET nominal hours delivered, an increase of 6025 nominal
hours delivered from 2013 and an increase of 6025 nominal hours delivered from 2010
the areas of VET activity with the most nominal hours delivered were Automotive (3095), Primary Industry (2070), and Tourism and Hospitality (560).
Caveat: Nominal hours are based on the hours funded through Department of Trade Business and Innovation contracts; students and units includes delivery that has been funded in a previous year, fee for service or training that did not meet the funding requirements. Because of this a direct match cannot be made between hours and student/units.
Table 23: Northern Territory Vocational Education and Training (VET) unit completions 2016 (n)
VET Funding Group2016
No. % of Total
Automotive 190 61Building and Construction 9 3Community Services, Health and Education 19 6Primary Industry 65 21Tourism and Hospitality 30 10
Total 313 100
Source: Department of Trade, Business and Innovation
In Milikapiti in 2016: there were 313 VET unit completions the areas of VET activity with the most unit completions were Automotive (190),
Primary Industry (65), and Tourism and Hospitality (30).
JOBS PROFILE MILIKAPITI31

PopulationTable 24: Population distribution by gender and age (p)(r)
Indicator2006 2016 Change
Male Female Total Male Femal
e Total Male Female Total
0-4 years 19 24 43 13 20 33 -6 -4 -105-14 years 48 42 90 39 47 86 -9 5 -415-24 years 49 36 85 59 55 114 10 19 2925-44 years 60 70 130 73 43 116 13 -27 -1445-64 years 42 29 71 44 54 98 2 25 2765+ years 7 6 13 1 10 11 -6 4 -2TOTAL 225 207 432 229 229 458 4 22 26Source: Department of Trade, Business and Innovation
In 2016 in Milikapiti: there were an estimated 458 persons, of which:
o 229 (50%) were maleo 229 (50%) were female
between 2006 and 2016, the overall population in Milikapiti increased by 26 persons from 2006, or an average of 0.6% per year compared to 0.7% across the 28 remote towns and 1.5% Territory wide
the male population increased by 4 persons from 2006 the female population increased by 22 persons from 2006 in 2016, the working age population (15 years and over) in Milikapiti was an
estimated 339 persons (74% of the total population) compared with 299 persons (69.2% of the total population) in 2006. Of these:o 114 (24.9%) were between 15 and 24 years of ageo 116 (25.3%) were between 25 and 44 years of ageo 98 (21.4%) were between 45 and 64 years of ageo 11 (2.4%) were over 65 years of age
of the 339 persons of working age:o 177 (52.2%) were maleo 162 (47.8%) were female.
There were 0.4 jobs in Milikapiti per working age person compared to 0.4 jobs per working age person across the 28 remote towns in the Northern Territory.
JOBS PROFILE MILIKAPITI32

Chart 12: Population by Aboriginal status, 28 remote towns and the NT (p)(q)
94.1% 94.2% 89.2% 89.4% 30.4% 28.3%
5.9% 5.8% 10.8% 10.6%
69.6% 71.7%
0%
20%
40%
60%
80%
100%
2006 2016 2006 2016 2006 2016Milikapiti 28 Remote Towns NT Overall Population
Aboriginal Non-Aboriginal
Source: Department of Trade, Business and Innovation
In 2016 in Milikapiti: 94.2% of the population in Milikapiti were Aboriginal, compared to 94.1% in 2006 89.4% of the population across all 28 remote towns were Aboriginal 28.3% of the Northern Territory population were Aboriginal.
Table 25: Unemployment and participation rates by Aboriginal status compared to the NT (q)
Milikapiti Northern Territory
Aboriginal
Non-Aborigin
alTotal Aboriginal
Non-Aborigin
alTotal
Unemployment rate 14.6% 0.0% 12.2% 26.7% 3.8% 7.0%Participation rate 31.2% 72.2% 33.9% 41.0% 79.9% 70.6%Source: Department of Trade, Business and Innovation
In 2016 in Milikapiti the: total unemployment rate was 12.2% compared to 7% for the total Northern
Territory Aboriginal unemployment rate was 14.6% compared to 26.7% for the total
Northern Territory non-Aboriginal unemployment rate was 0% compared to 3.8% for the total
Northern Territory total participation rate was 33.9% compared to 70.6% for the total Northern
Territory Aboriginal participation rate was 31.2% compared to 41% for the total
Northern TerritoryJOBS PROFILE MILIKAPITI
33
non-Aboriginal participation rate was 72.2% compared to 79.9% for the total Northern Territory.
JOBS PROFILE MILIKAPITI34

Community Development ProgrammeTable 26: Community Development Programme Aboriginal Job Seekers, 30 April 2018 (o)
Indicator AboriginalNo. %
Total Aboriginal Job Seekers 121 N/AAge (years)
15-24 28 23.125-44 49 40.545+ 44 36.4
Total 121 100.0Gender
Male 69 57.0Female 52 43.0
Total 121 100.0Employment Outcome - 1 July 2015 to 30 April 2018
13 Weeks < 20 N/A26 Weeks < 20 N/A
Currently in Activities 76 Source: Department of Prime Minister and Cabinet
Chart 13: Community Development Programme Aboriginal Job Seekers by Gender and Age Group, 30 April 2018 (o)
6957.0%
5243.0%
Gender
Male Female
2823.1%
4940.5%
4436.4%
Age (years)
15-24 25-44 45+
Source: Department of Prime Minister and Cabinet
As at 30 April 2018, in Milikapiti, there were 121 CDP Aboriginal job seekers, of these: 69 (57%) were male and 52 (43%) were female 28 (23.1%) were aged 15-24 years, 49 (40.5%) were aged 25-44 years, and 44
(36.4%) were aged 45+ years between 1 July 2015 and 30 April 2018, less than 20 had reached the 13 week
reporting milestone and less than 20 had reached the 26 week reporting milestone 76 were currently in activities.
JOBS PROFILE MILIKAPITI35

JOBS PROFILE MILIKAPITI36
BusinessesTable 27: Businesses by sector (d)(s)
Business Name
PUBLIC SECTORDepartment of EducationDepartment of HealthDepartment of the Prime Minister and CabinetTiwi Islands Regional CouncilPRIVATE SECTORCatholic Care NTHardy Aviation (NT) Pty Limited - Fly TiwiJilamara Arts and Crafts AssociationMilikapiti Community Indigenous CorporationMilikapiti Sports and Social ClubThe Trustee for Tiwi Islands Adventures Charitable TrustTiwi Enterprises Pty LtdTiwi Land Council Inc
Source: Department of Trade, Business and Innovation
Note: Business names captured have been identified by the current 2017 Business ABN name listed.
In 2017 in Milikapiti: there were 12 businesses reported on, of which:
o 4 businesses were from the public sector (33%)o 8 businesses were from the private sector (67%).
JOBS PROFILE MILIKAPITI37

Notes(a) These counts represent numbers of filled jobs and not numbers of persons. As such the
totals represent the total number of filled jobs, not the total number of employees. This count is not directly comparable to the total number of employed persons as a person may have several jobs or one job may be shared by more than one person.
(b) Full-time is defined as a job usually requiring 35 hours or more per week or that required 35 hours or more work during the reference week. Part-time is defined as a job usually requiring less than 35 hours per week or that required less than 35 hours work during the reference week. The reference week refers to the period that respondents were asked to provide information about. In most instances it would be the week prior to the week the questionnaire was completed. Questionnaires were predominantly conducted in June and July.
(c) Care needs to be taken when analysing the counts of filled jobs by the Aboriginal status of persons in the jobs. The Aboriginal status of the person employed in a job was reported by the business representative completing the questionnaire.
(d) Sector was classified using the Standard Economic Sector of Classifications of Australia (SESCA), 2008.
(e) Job permanency is classified according to what the business believes the level of job permanency is based on guidelines provided by data collectors. Those guidelines state a permanent job has paid annual and/or sick leave entitlements while a temporary job includes casual and fixed-term contract jobs.
(f) Classified according to the Australian and New Zealand Standard Classification of Occupations (ANZSCO), 2006, major occupation level.
(g) Other occupations include jobs where occupation was not stated, not known or inadequately described.
(h) Classified using the Australian and New Zealand Standard Industrial Classification (ANZSIC), 2006, division level.
(i) Care needs to be taken when analysing the counts of filled jobs by the gender of persons in the jobs. The gender of the person employed in a job is reported by the business representative completing the questionnaire.
(j) Care needs to be taken when analysing the counts of filled jobs by the age of persons in the jobs. The age of the person employed in a job is reported by the business representative completing the questionnaire.
(k) Students represent the number of individual clients that enrolled in a Vocational Education and Training unit during the calendar year.
(l) Unit enrolments represent the count of individual units that students enrolled in during the calendar year.
(m)Nominal hours delivered is the sum of the nominal hours of the units commenced during the calendar year regardless of when the course enrolment commenced.
(n) Unit completions are the count of all successfully completed units reported in the calendar year regardless of the year of commencement of the units.
(o) The Community Development Programme (CDP) supports job seekers in remote Australia to build skills, address barriers and contribute to their communities through a range of flexible activities. Under the CDP, job seekers with activity requirements are expected to do up to 25 hours per week of work-like activities that benefit their community. It should be noted that some CDP participants may be reported on within the profile if they are attached to a filled position with an employer captured in the survey. Due to confidentiality issues, data below 20 people is not published.
(p) Population estimates for both 2006 and 2016 are taken from the estimated resident population (ERP) data produced by the Australian Bureau of Statistics (ABS) and based on Australian Statistical Geography Standard (ASGS) Statistical Area Level 1 (SA1) regions. ERP are official estimates of the Australian population, which link people to a place of usual residence with Australia. All ERP data sources, including the Census of Population and Housing (Census), are subject to error (including inaccuracies in collection, recording and processing data) and should be used with caution.
(q) Indigenous population proportions, unemployment and workforce participation rates are based on ABS Census counts at ASGS Indigenous Locations (ILOCs) for each remote town.
(r) Working-age population includes all residents aged 15 years and over (commonly referred to as the civilian population) and consists of persons that are employed, unemployed or not in the labour force.
JOBS PROFILE MILIKAPITI38

(s) A ‘business’ has been defined as any organisation that has undertaken productive activities in the last year, including companies, non-profit organisations, government departments and enterprises operating within the designated remote geography (town), and has one or more employees in paid employment and an Australian Business Number (ABN).
JOBS PROFILE MILIKAPITI39

Abbreviations and AcronymsABN Australian Business NumberABS Australian Bureau of StatisticsANZSCO Australian and New Zealand Standard Classification of OccupationsANZSIC Australian and New Zealand Standard Industrial ClassificationASGS Australian Statistical Geography StandardCDP Community Development ProgrammeERP Estimated Resident PopulationILOC Indigenous Locations nec Bit Elsewhere ClassifiedNo. NumberPerm Permanentppt Percentage pointRJCP Remote Jobs and Communities ProgramTemp TemporarySA1 Statistical Area Level 1VET Vocational Education and Training
JOBS PROFILE MILIKAPITI40